1780 J Med Assoc Thai Vol. 90 No. 9 2007 Correspondence to : Sukkaew L, Sirindhorn International Institute of Technology, Thammasat University, Pathumthani 12000, Thailand. Automatic Extraction of the Structure of the Retinal Blood Vessel Network of Premature Infants Lassada Sukkaew MSc*, Bunyarit Uyyanonvara PhD*, Sarah Barman PhD**, Alistair Fielder MD***, Ken Cocker MD*** * Sirindhorn International Institute of Technology, Thammasat University, Thailand ** Kingston University, United Kingdom *** City University, United Kingdom Objective: Automatically detect the structure of blood vessels in ROP infants to allow ophthalmologist to analyze and detect the symptom early. Material and Method: This study presents a set of methods for detection of the skeletonized structure of premature infant’s low-contrast retinal blood vessel network. Steps has been optimized for this study, namely statistically optimized LOG edge detection filter, Otsu thresholding, Medial Axis transform skeletonization, pruning, and edge thinning. Results: A set of 100 test images are grouped together into five testing groups based on their similar charac- teristics and clinicians suggestions. The authors applied the series of methods proposed on all the 100 images. The result from the algorithm was compared with ophthalmologists’ hand-drawn ground truth and it can detect the blood vessel with a high specificity of 0.9879 and sensitivity of 0.8935. Conclusion: The authors’ algorithm can detect blood vessels effectively even though the image quality may not be good, have high noise, and low contrast. The algorithm can also detect the blood vessel at important locations such as the edge of the retina. Keywords: Retinal vessel extraction, ROP, Infant retinal image Retinopathy of Prematurity (ROP) is an ab- normal retinal vascularization in premature infants. In those infants, the growth of retinal vessels does not reach the periphery of the retina. Generally, the development of retinal vessel network begins to grow at approximately 15 weeks of gestation from the optic disk into the retina and becomes complete around full term at 9 months. Preterm birth carries many complica- tions because this vessel is not fully vascularized. The early indicator of ROP is a whitish gray demarcation line between the normal retina and the anteriorly un- developed vascularized retina. Next, there will be ridge that obstructs vascular growth and causes congestion of capillaries around the periphery of retina. As the condition progresses, extraretinal fibrovascular pro- liferations develops. If left untreated, it may cause retinal traction and the loss of vision. The important risk factors for ROP are low birth weight and low ges- tational age. To prevent permanent loss of vision, infants at risk with less than 1,500 gram birth weight or less than 32 week gestational ages should be screened for ROP to receive appropriate treatment (UK guidelines - there are differences between countries) (1) . Several researchers have attempted to establish techniques for initial diagnosis of vascular abnormalities. They developed an automatic vascular inspection system to analyze physical characteristics and abnormalities of vessels by measuring size, shape, and length or net- work characteristics of the retina. This development of algorithms to automatically provide classification of vessels usually gives a satisfactory result in a high quality image with low noise. However, due to the lack of clarity of the eye media and the technical difficulty J Med Assoc Thai 2007; 90 (9): 1780-92 Full text. e-Journal: http://www.medassocthai.org/journal

Welcome message from author
This document is posted to help you gain knowledge. Please leave a comment to let me know what you think about it! Share it to your friends and learn new things together.
Transcript

1780 J Med Assoc Thai Vol. 90 No. 9 2007
Correspondence to : Sukkaew L, Sirindhorn InternationalInstitute of Technology, Thammasat University, Pathumthani12000, Thailand.
Automatic Extraction of the Structure of the RetinalBlood Vessel Network of Premature Infants
Lassada Sukkaew MSc*,Bunyarit Uyyanonvara PhD*, Sarah Barman PhD**,
Alistair Fielder MD***, Ken Cocker MD***
* Sirindhorn International Institute of Technology, Thammasat University, Thailand** Kingston University, United Kingdom
*** City University, United Kingdom
Objective: Automatically detect the structure of blood vessels in ROP infants to allow ophthalmologist toanalyze and detect the symptom early.Material and Method: This study presents a set of methods for detection of the skeletonized structure ofpremature infant’s low-contrast retinal blood vessel network. Steps has been optimized for this study, namelystatistically optimized LOG edge detection filter, Otsu thresholding, Medial Axis transform skeletonization,pruning, and edge thinning.Results: A set of 100 test images are grouped together into five testing groups based on their similar charac-teristics and clinicians suggestions. The authors applied the series of methods proposed on all the 100 images.The result from the algorithm was compared with ophthalmologists’ hand-drawn ground truth and it candetect the blood vessel with a high specificity of 0.9879 and sensitivity of 0.8935.Conclusion: The authors’ algorithm can detect blood vessels effectively even though the image quality maynot be good, have high noise, and low contrast. The algorithm can also detect the blood vessel at importantlocations such as the edge of the retina.
Keywords: Retinal vessel extraction, ROP, Infant retinal image
Retinopathy of Prematurity (ROP) is an ab-normal retinal vascularization in premature infants.In those infants, the growth of retinal vessels doesnot reach the periphery of the retina. Generally, thedevelopment of retinal vessel network begins to growat approximately 15 weeks of gestation from the opticdisk into the retina and becomes complete around fullterm at 9 months. Preterm birth carries many complica-tions because this vessel is not fully vascularized. Theearly indicator of ROP is a whitish gray demarcationline between the normal retina and the anteriorly un-developed vascularized retina. Next, there will be ridgethat obstructs vascular growth and causes congestionof capillaries around the periphery of retina. As thecondition progresses, extraretinal fibrovascular pro-
liferations develops. If left untreated, it may causeretinal traction and the loss of vision. The importantrisk factors for ROP are low birth weight and low ges-tational age. To prevent permanent loss of vision,infants at risk with less than 1,500 gram birth weight orless than 32 week gestational ages should be screenedfor ROP to receive appropriate treatment (UK guidelines- there are differences between countries)(1). Severalresearchers have attempted to establish techniquesfor initial diagnosis of vascular abnormalities. Theydeveloped an automatic vascular inspection system toanalyze physical characteristics and abnormalities ofvessels by measuring size, shape, and length or net-work characteristics of the retina. This development ofalgorithms to automatically provide classification ofvessels usually gives a satisfactory result in a highquality image with low noise. However, due to the lackof clarity of the eye media and the technical difficulty
J Med Assoc Thai 2007; 90 (9): 1780-92Full text. e-Journal: http://www.medassocthai.org/journal
J Med Assoc Thai Vol. 90 No. 9 2007 1781
of obtaining images from a preterm baby, images takenfrom a baby’s eye are low-contrast, noisy, and some-times blurred. These cause problems and are an ob-stacle to the classification of vessels. Algorithms thathave been successfully applied for adult retinal imagesmight not work effectively enough within these limita-tions. A challenging problem to investigate diseaseand symptoms of ROP is the requirement to detect thevascular network in the retina. This information canthen be used for the measurement of tortuosity andengorgement parameters.
Many works have been proposed to detectROP signs effectively by visual inspection of retinalblood vessels. The main vessel properties indicatingROP are an increase in vessel width and tortuosity(2-5).Regular inspection produces a large number of retinalphotographs for ophthalmologists and experts to review.This might be cut down by the use of digital imagingtechnology that provides means for non-ophthalmo-logists to automate the preliminary diagnosis of thedisease(6). Many papers such as Martinex-Perez et al(7)
reported a semi-automatic method to measure andquantify the geometrical and topological propertiesof retinal blood vessel from fundus retinal images.Chanwimaluang and Fan(8) and Gao et al(9) introducedefficient methods for automatic detection and extrac-tion of blood vessels. Canny experimented with analgorithm of matched filters(10) for vessel detection.Chaudhuri(11) used a Gaussian vessel cross-sectionalprofile and assumed Gaussian imaging noise for vesseldetection using matched filters. A method of registra-tion of retinal images based on feature detection wasreported by Byrne et al(12). Line finding algorithmsalong with a probabilistic relaxation scheme has beenproposed to extract and describe the blood vessel pat-tern in retinal images by Akita(13-15). These segmentswere later connected to a vessel network and labeledas arteries or veins according to their chromatic infor-mation. Tolias and Panas(16) developed a fuzzy C-means(FCM) clustering algorithm that uses linguistic descrip-tions like “vessel” and “nonvessel” to track fundusvessels in retinal angiogram images. Quek(17), Hoover(18),Chutatape(19) and Zhou(20), proposed similar methodsbased on a matched filter to extract vasculature fromtwo dimensional medical images. Gang et al(21) showedthe Gaussian curve is suitable for modeling the inten-sity profile of the cross section of retinal vessels in colorfundus images. Aylward(22) extracted blood vessels fromtwo-dimensional images using a scale space techniquewith sub-voxel accuracy while Wood(23) equalized imagevariability as a preprocessing step in their method to
segment retinal vessels. Neural network applicationis proposed by Sinthanayothin et al(24). It employedintensity edge detection and principal componentanalysis of input images as inputs to multilayer per-ceptron neural networks to identify blood vessels.Nekovei and Sun(25) detected blood vessels in XRAimages using a back-propagation network. Leandro etal(26) used a continuous wavelet transform combinedwith morphological operators to segment blood vesselswithin the retina. Staal(27) presented a method to detectvessels by proposing a more natural representation forelongated structures, such as vessels. Parvin et al(28),Huang and Stockman(29), and Aylward et al(30) describedsimilar algorithms that used generalized cylindersto extract tubular structures in 2D intensity images.Mahadevan et al(31) presented a set of algorithms forrobust detection of vasculature in noisy retinal videoimages. Gao et al(32) presented an automatic quantifica-tion of blood vessel topography in retinal images. Thissystem utilized digital image processing techniques toprovide more reliable and comprehensive informationfor the retinal vascular network. Vermeer et al(33) pro-posed a method for blood vessel detection in retinalimages based on a Laplace and threshold segmenta-tion. Ayala et al(34) presented a main idea to define theaverages of a given fuzzy set by using different defini-tions of the mean of a random compact set of retinalvessel detection.
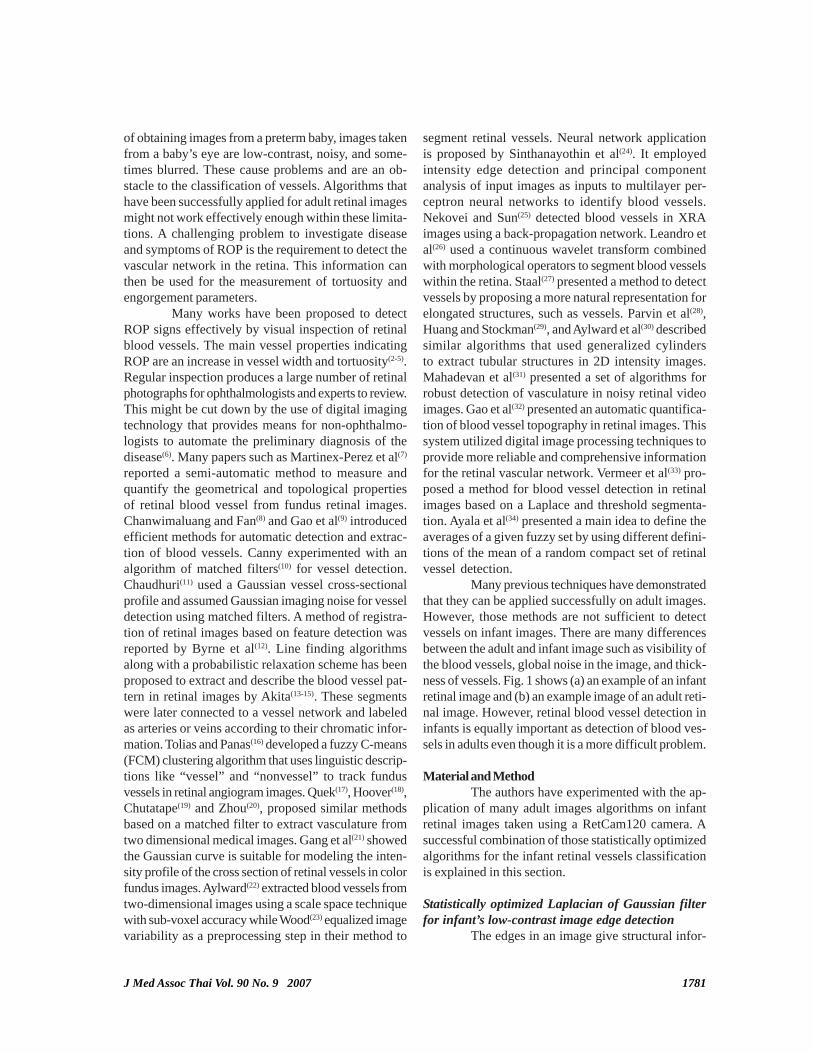
Many previous techniques have demonstratedthat they can be applied successfully on adult images.However, those methods are not sufficient to detectvessels on infant images. There are many differencesbetween the adult and infant image such as visibility ofthe blood vessels, global noise in the image, and thick-ness of vessels. Fig. 1 shows (a) an example of an infantretinal image and (b) an example image of an adult reti-nal image. However, retinal blood vessel detection ininfants is equally important as detection of blood ves-sels in adults even though it is a more difficult problem.
Material and MethodThe authors have experimented with the ap-
plication of many adult images algorithms on infantretinal images taken using a RetCam120 camera. Asuccessful combination of those statistically optimizedalgorithms for the infant retinal vessels classificationis explained in this section.
Statistically optimized Laplacian of Gaussian filterfor infant’s low-contrast image edge detection
The edges in an image give structural infor-
1782 J Med Assoc Thai Vol. 90 No. 9 2007
mation about its boundaries. To detect blood vessels,edge information is significantly important becausethe vessels are clearly visible in an edge image. Theauthors’ first step was to extract edge informationfrom the original infant retinal image. After qualitativecomparison of the performances between many publicdomain edge operators with the set of infant images,the authors found that Laplacian of Gaussian (LOG)detected blood vessel from most of the data set verywell. The LOG operator is described by equation (1)(40).
................(1)
where (x,y) is the size of optimal kernel filterand the scale parameter σ is estimated adaptivelybetween 1.0-1.6.
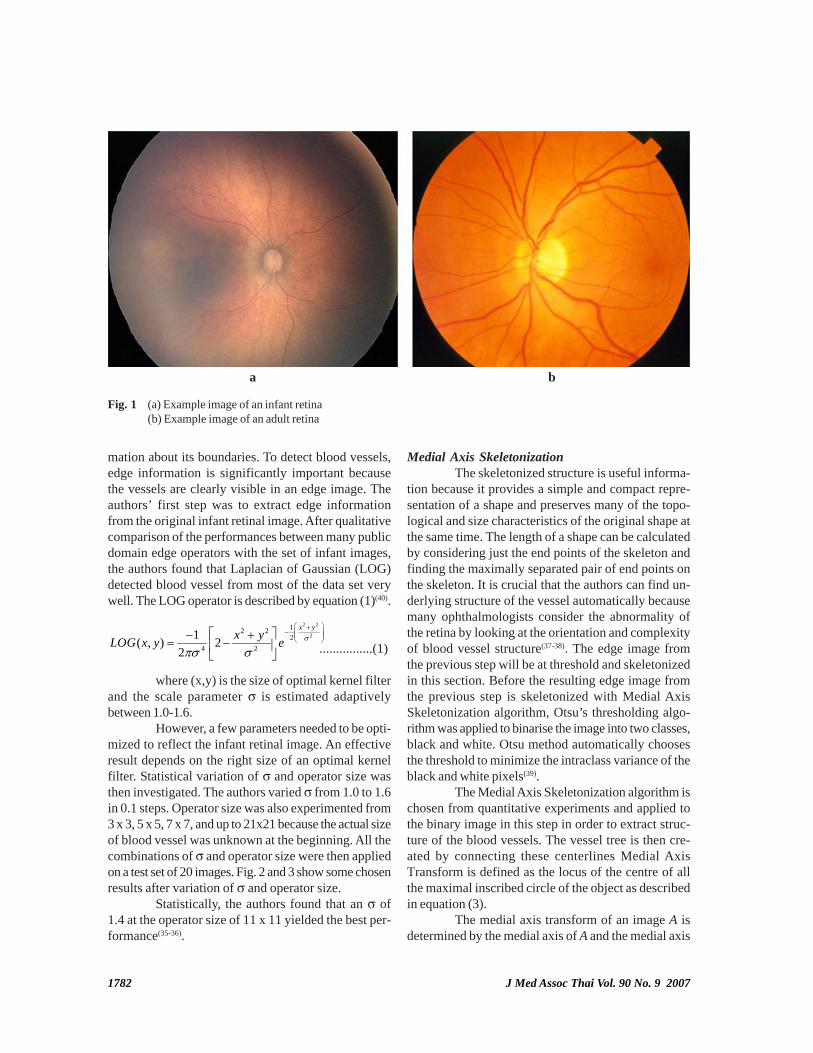
However, a few parameters needed to be opti-mized to reflect the infant retinal image. An effectiveresult depends on the right size of an optimal kernelfilter. Statistical variation of σ and operator size wasthen investigated. The authors varied σ from 1.0 to 1.6in 0.1 steps. Operator size was also experimented from3 x 3, 5 x 5, 7 x 7, and up to 21x21 because the actual sizeof blood vessel was unknown at the beginning. All thecombinations of σ and operator size were then appliedon a test set of 20 images. Fig. 2 and 3 show some chosenresults after variation of σ and operator size.
Statistically, the authors found that an σ of1.4 at the operator size of 11 x 11 yielded the best per-formance(35-36).
Medial Axis SkeletonizationThe skeletonized structure is useful informa-
tion because it provides a simple and compact repre-sentation of a shape and preserves many of the topo-logical and size characteristics of the original shape atthe same time. The length of a shape can be calculatedby considering just the end points of the skeleton andfinding the maximally separated pair of end points onthe skeleton. It is crucial that the authors can find un-derlying structure of the vessel automatically becausemany ophthalmologists consider the abnormality ofthe retina by looking at the orientation and complexityof blood vessel structure(37-38). The edge image fromthe previous step will be at threshold and skeletonizedin this section. Before the resulting edge image fromthe previous step is skeletonized with Medial AxisSkeletonization algorithm, Otsu’s thresholding algo-rithm was applied to binarise the image into two classes,black and white. Otsu method automatically choosesthe threshold to minimize the intraclass variance of theblack and white pixels(39).
The Medial Axis Skeletonization algorithm ischosen from quantitative experiments and applied tothe binary image in this step in order to extract struc-ture of the blood vessels. The vessel tree is then cre-ated by connecting these centerlines Medial AxisTransform is defined as the locus of the centre of allthe maximal inscribed circle of the object as describedin equation (3).
The medial axis transform of an image A isdetermined by the medial axis of A and the medial axis
Fig. 1 (a) Example image of an infant retina(b) Example image of an adult retina
a b
2 2
212 22
4 2
1( , ) 22
x yx yLOG x y e σ
πσ σ
⎛ ⎞+− ⎜ ⎟⎜ ⎟
⎝ ⎠⎡ ⎤− += −⎢ ⎥
⎣ ⎦
J Med Assoc Thai Vol. 90 No. 9 2007 1783
Fig. 3 (a) original image and (b), (c), (d), (e), (f) are resulting images after application of fixed σ and varied operator size of5 x 5, 9 x 9, 11 x 11, 13 x 13 and 15 x 15 respectively
a b c
d e f
Fig. 2 (a) original image and (b), (c), (d), (e), (f) are resulting images after application of fixed operator size 11 x 11 and σ isvaried 1.2, 1.3, 1.4, 1.5 and 1.6 respectively
a b c
d e f

1784 J Med Assoc Thai Vol. 90 No. 9 2007
distance function f defined on the medial axis of A. Themedial axis function is directly related to the generalizeddistance. For the following definition of the morpho-logical skeleton of an image A with respect to a struc-turing element K by the sets {S0,..,SN}(40) where,
...(2)
The skeleton of an image A is then given by
.......................................................(3)
( denotes erosion operator with n iterations and is an opening operator)
After the algorithm is applied, the bloodvessels (including other artifacts) are thinner and canbe visibly observed. In fact, it is only one pixel widethroughout the image except on the intersectionpoints. The resulting skeleton is located at the centralline of the original image. This result shows that theskeletonized image can clearly maintain the bloodvessel topology and the blood vessel network as illus-trated in Fig. 4. This valuable information is importantwhen the authors later calculate other properties, liketortuosity of the blood vessel.
Image PruningThe authors used of a series of morphologi-
cal operations to reduce the size of the noise thatis smaller than a specific size. One set of the series,known as image pruning, is used in this step. The re-sulting image from the previous step is processed withimage pruning as defined by steps from equation (4) toequation (7).
........................................................(4)
..........................................(5)
............................................(6)
.......................................................(7)
where X4 is the result of pruning set A with structuringelement B (41). X1, X2, and X3 are resulting images ofthe intermediate process. ⊗ denotes a morphologicalthinning operator while ⊕ is a dilation operator. de-notes hit or miss transform. Three examples of resultsfrom this step are demonstrated in Fig. 5. Originalimages 5(a), 5(c), and 5(e) are processed and Fig. 5(b),5(d), and 5(f) are their results respectively.
0( ) and n
n nS A K A K K A K A= − =o
0( )
N
nnS A U S
==
o
⊗
a c e
Fig. 4 Images on the right hand side (b), (d) and (f) are results of skeletonized process of images on the left hand side (a),(c) and (e) respectively
b d f
{ }1X A B= ⊗
2 11( )
nk
kX U X B
== #
3 2( )X X H A= ⊕ ∩
⊗
4 1 3X X X= ∪
J Med Assoc Thai Vol. 90 No. 9 2007 1785
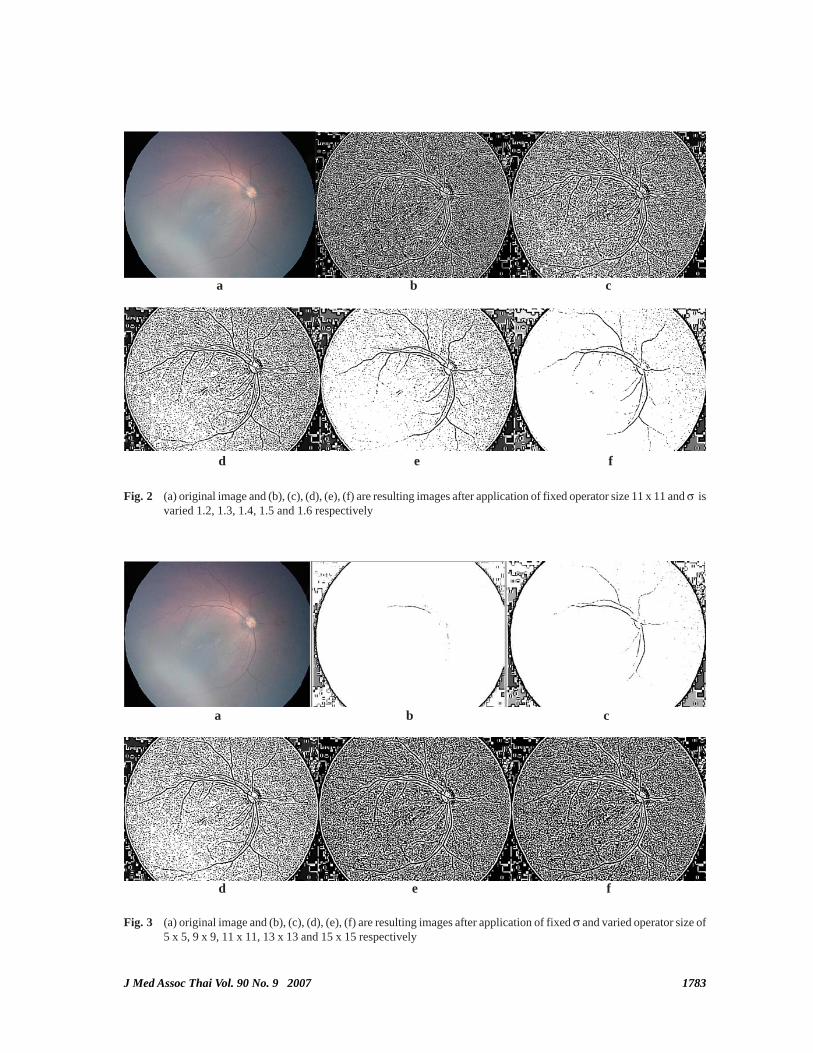
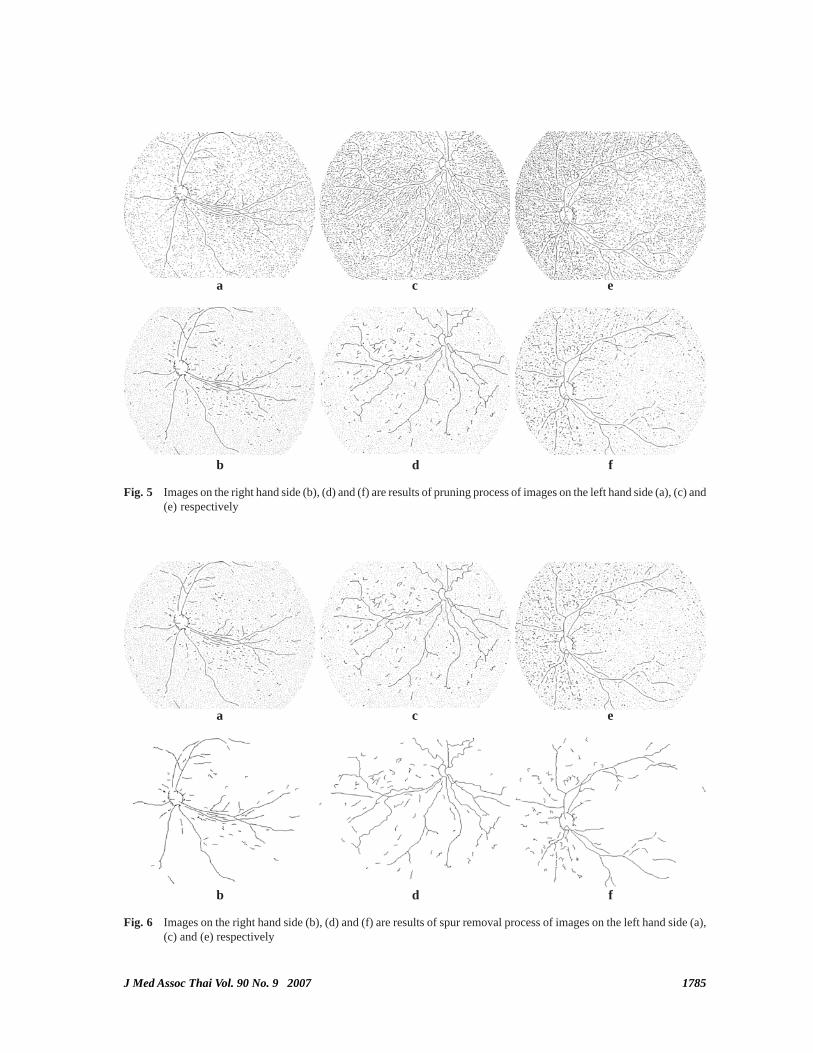
Fig. 5 Images on the right hand side (b), (d) and (f) are results of pruning process of images on the left hand side (a), (c) and(e) respectively
a c e
b d f
Fig. 6 Images on the right hand side (b), (d) and (f) are results of spur removal process of images on the left hand side (a),(c) and (e) respectively
a c e
b d f
1786 J Med Assoc Thai Vol. 90 No. 9 2007
Spur Removal by morphological OpeningThe authors’ last step in the process is to
remove isolated noise, or spurs, a cluster of pixels thathas a size less than 15 pixels. Morphological openingis chosen to use in this step because it is robust, fastand easy to implement. This island removal algorithmutilizes Erosion (θ) and Dilation (⊕) (erosion followedby dilation) as in the following equation.
............................(8)
where S is the result after spur removal. Fig. 6 illustratesresults from this step.
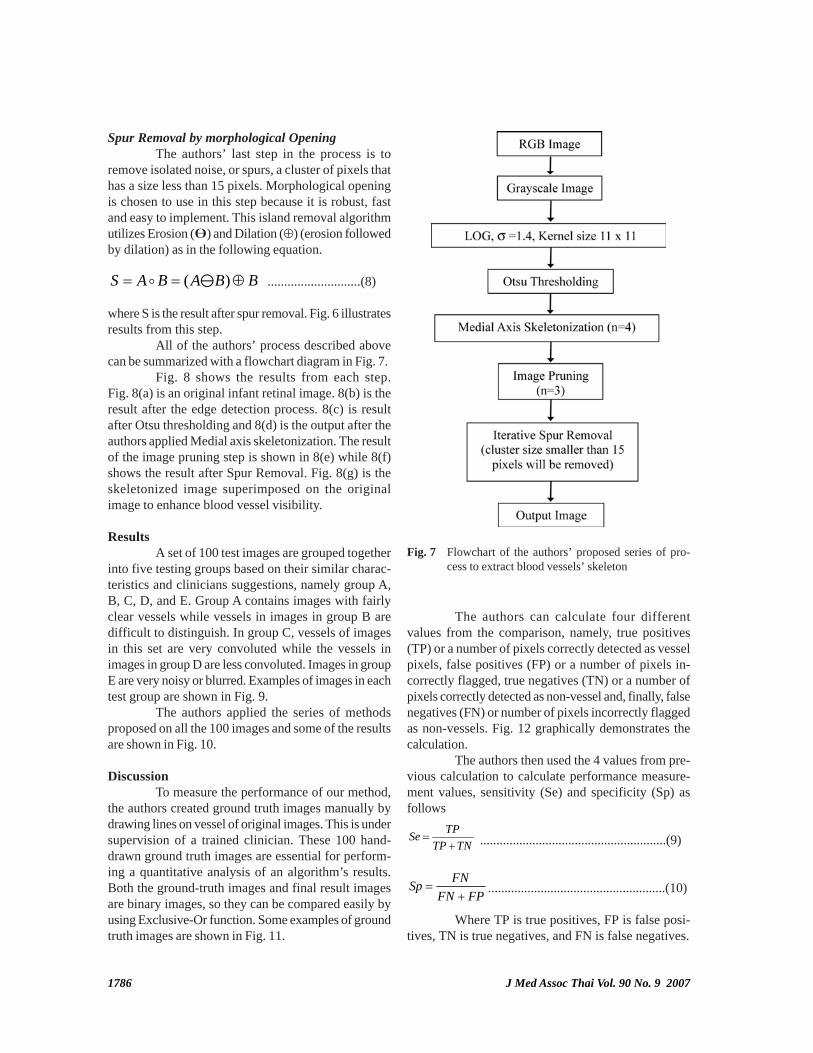
All of the authors’ process described abovecan be summarized with a flowchart diagram in Fig. 7.
Fig. 8 shows the results from each step.Fig. 8(a) is an original infant retinal image. 8(b) is theresult after the edge detection process. 8(c) is resultafter Otsu thresholding and 8(d) is the output after theauthors applied Medial axis skeletonization. The resultof the image pruning step is shown in 8(e) while 8(f)shows the result after Spur Removal. Fig. 8(g) is theskeletonized image superimposed on the originalimage to enhance blood vessel visibility.
ResultsA set of 100 test images are grouped together
into five testing groups based on their similar charac-teristics and clinicians suggestions, namely group A,B, C, D, and E. Group A contains images with fairlyclear vessels while vessels in images in group B aredifficult to distinguish. In group C, vessels of imagesin this set are very convoluted while the vessels inimages in group D are less convoluted. Images in groupE are very noisy or blurred. Examples of images in eachtest group are shown in Fig. 9.
The authors applied the series of methodsproposed on all the 100 images and some of the resultsare shown in Fig. 10.
DiscussionTo measure the performance of our method,
the authors created ground truth images manually bydrawing lines on vessel of original images. This is undersupervision of a trained clinician. These 100 hand-drawn ground truth images are essential for perform-ing a quantitative analysis of an algorithm’s results.Both the ground-truth images and final result imagesare binary images, so they can be compared easily byusing Exclusive-Or function. Some examples of groundtruth images are shown in Fig. 11.
( )S A B A B B= = ⊕o
The authors can calculate four differentvalues from the comparison, namely, true positives(TP) or a number of pixels correctly detected as vesselpixels, false positives (FP) or a number of pixels in-correctly flagged, true negatives (TN) or a number ofpixels correctly detected as non-vessel and, finally, falsenegatives (FN) or number of pixels incorrectly flaggedas non-vessels. Fig. 12 graphically demonstrates thecalculation.
The authors then used the 4 values from pre-vious calculation to calculate performance measure-ment values, sensitivity (Se) and specificity (Sp) asfollows
.........................................................(9)
......................................................(10)
Where TP is true positives, FP is false posi-tives, TN is true negatives, and FN is false negatives.
TPSeTP TN
=+
FNSpFN FP
=+
Fig. 7 Flowchart of the authors’ proposed series of pro-cess to extract blood vessels’ skeleton

J Med Assoc Thai Vol. 90 No. 9 2007 1787
The algorithm has been tested on 100 pre-mature infant’s images with the image size of 480*640pixels. All the results are shown in Table 1. Fig. 13 and14 show the plot of sensitivity and specificity respec-tively. Fig. 15 is a plot of relationship of sensitivity andspecificity for all 100 images.
Experimental results show that the proposedmethod performs well in extracting blood vessels.
ConclusionIn the presented paper, the authors have in-
troduced an efficient combination of algorithms forautomated blood vessel detection in infant retinal im-ages. The proposed method retains the computationalsimplicity while it can achieve accurate results in casesof normal infant retinal images and images with ob-scured blood vessel appearance. Efficiency of the
Fig. 8 (a) An original infant retinal images(b) edge detection result(c) after Otsu thresholding(d) after Medial axis skeletonization(e) after image Pruning(f) spur removal(g) skeletonized image super-imposed on the original
a cb
d fe
g

1788 J Med Assoc Thai Vol. 90 No. 9 2007
Fig. 9 Shows examples of images in each test group
Fig. 11 (a), (b), (c) Skeletonized hand labeled ground-truth images
a cb
Fig. 10 After the series of step are applied to (a), (b) and (c), resulting images (d), (e) and (f) are obtained respectively
a cb
d fe

J Med Assoc Thai Vol. 90 No. 9 2007 1789
Fig. 12 Graphical demonstration of the calculation when(a) is an extraction of a ground-truth image(b) is a resulting image overlaying the ground-truth(dash line) and resulting values
Images Group A Group B Group C Group D Group E
Fairly Clear Vessel Difficult to Distinguish Very Convoluted Less Convoluted Very Noisy
Se Sp Se Sp Se Sp Se Sp Se Sp
1 0.860 0.988 0.881 0.989 0.936 0.978 0.923 0.980 0.830 0.994 2 0.973 0.980 0.883 0.994 0.918 0.988 0.894 0.988 0.918 0.992 3 0.898 0.990 0.863 0.996 0.842 0.976 0.912 0.988 0.898 0.996 4 0.945 0.986 0.968 0.973 0.948 0.986 0.928 0.977 0.810 0.989 5 0.971 0.973 0.942 0.981 0.955 0.973 0.935 0.989 0.850 0.997 6 0.867 0.977 0.917 0.984 0.949 0.982 0.821 0.987 0.866 0.995 7 0.916 0.979 0.900 0.972 0.993 0.982 0.882 0.986 0.647 0.997 8 0.956 0.976 0.856 0.991 0.920 0.981 0.811 0.991 0.834 0.996 9 0.950 0.972 0.895 0.990 0.935 0.986 0.909 0.988 0.728 0.99610 0.964 0.987 0.902 0.984 0.919 0.979 0.839 0.994 0.935 0.99811 0.944 0.983 0.842 0.983 0.895 0.973 0.879 0.996 0.835 0.98412 0.964 0.977 0.949 0.985 0.926 0.979 0.853 0.997 0.898 0.97813 0.977 0.985 0.944 0.980 0.919 0.977 0.943 0.979 0.743 0.99014 0.880 0.987 0.793 0.982 0.972 0.961 0.847 0.986 0.908 0.97515 0.912 0.987 0.929 0.986 0.939 0.984 0.910 0.986 0.884 0.99316 0.923 0.990 0.825 0.984 0.987 0.963 0.957 0.982 0.872 0.98717 0.837 0.990 0.915 0.992 0.940 0.967 0.957 0.982 0.805 0.98918 0.893 0.979 0.832 0.980 0.950 0.976 0.957 0.982 0.876 0.98819 0.902 0.977 0.815 0.998 0.920 0.983 0.964 0.985 0.948 0.98120 0.953 0.979 0.884 0.981 0.940 0.976 0.967 0.979 0.902 0.991Average 0.924 0.982 0.887 0.985 0.935 0.977 0.904 0.986 0.849 0.990
Se = sensitivitySp = specficity
Table 1. Sensitivity and specificity result of 100 images
method is measured and resulted in a high specificityof 0.9879 and sensitivity of 0.8935. The next step in thisproject is to employ this approach to support tortu-ous-based classification of ROP disease.
References1. Retinopathy of prematurity: guidelines for screen-
ing and treatment. The report of a Joint WorkingParty of The Royal College of Ophthalmologistsand the British Association of Perinatal Medicine.Early Hum Dev 1996; 46: 239-58.
2. Heneghan C, Flynn J, O’Keefe M, Cahill M. Char-acterization of changes in blood vessel width andtortuosity in retinopathy of prematurity using im-age analysis. Med Image Anal 2002; 6: 407-29.
3. Swanson C, Cocker KD, Parker KH, Moseley MJ,Fielder AR. Semiautomated computer analysis ofvessel growth in preterm infants without and withROP. Br J Ophthalmol 2003; 87: 1474-7.
4. Wallace DK, Kylstra JA, Chesnutt DA. Prognos-tic significance of vascular dilation and tortuosityinsufficient for plus disease in retinopathy of pre-maturity. J AAPOS 2000; 4: 224-9.
5. Kylstra JA, Freedman SF, Capowsky JJ, Hall JG.Measurement of retinal vessel tortuousity as a

1790 J Med Assoc Thai Vol. 90 No. 9 2007
Fig. 13 A plot of sensitivity from 100 test images
Fig. 14 A plot of specificity from 100 test images
Fig. 15 The sensitivity and specificity of segmentation (100 images)

J Med Assoc Thai Vol. 90 No. 9 2007 1791
means of diagnosis plus disease in ROP [abstract].Invest Ophthalmol Vis Sci 1995; 36: 77.
6. Mary Ann Lang. Retinopathy of prematurity: aglobal problem. EnVision vol. 7, issue 1, 2002.
7. Martinez-Perez ME, Hughes AD, Stanton AV,Thom SA, Chapman N, Bharath AA, et al. Retinalvascular tree morphology: a semi-automatic quan-tification. IEEE Trans Biomed Eng 2002; 49: 912-7.
8. Chanwimaluang T, Fan G. An efficient algorithmfor extraction of anatomical structures in retinalimages. Image Processing, In Proceedings. 2003International Conference. Barcelona, Spain; 14-17Sept, 2003.
9. Gao XW, Bharath A, Stanton A, Hughes A,Chapman N, Thom S. Quantification and charac-terisation of arteries in retinal images. ComputMethods Programs Biomed 2000; 63: 133-46.
10. Canny J. A computational approach to edge detec-tion. IEEE Trans Pattern Anal Mach Intell 1986; 8:679-98.
11. Chaudhuri S, Chatterjee S, Katz N, Nelson M,Goldbaum M. Detection of blood vessels in retinalimages using two dimensional matched filters.IEEE Trans Med Imaging 1989; 8: 263-9.
12. Byrne JPC, Ross PGB, Undrill PE, Philips RP.Feature based retinal image registration usingtransporter. Appl Transputer 1991; 3: 687-92.
13. Akita K, Kuga H. A computer method of under-standing ocular fundus images. Pattern Recogni-tion 1982; 15: 431-43.
14. Akita K, Kuga H. Digital processing of color ocularfundus images. in MEDINFO’ 80. Amsterdam, TheNetherlands: North-Holland; 1980: 80-4.
15. Akita K, Kuga H. Pattern recognition of bloodvessel networks in ocular fundus images. in IEEEInt. Workshop Phys. And Eng. In Med. Imaging,Mar 15-18, 1982: 436-41.
16. Tolias YA, Panas SM. A fuzzy vessel tracking algo-rithm for retinal images based on fuzzy clustering.IEEE Trans Med Imaging 1998; 17: 263-73.
17. Quek FKS, Kirbas C, Gong X. Simulated wavepropagation and traceback in vascular extraction.Accepted, Medical Imaging and AugmentedReality 2001 Conference, Also as VISLab Report:VISLa-01-05.
18. Hoover A, Kouznetsova V, Goldbaum M. Locatingblood vessels in retinal images by piece-wisethreshold probing of a matched filter response.Proc AMIA Symp 1998; 931-5.
19. Chutatape O, Zheng L, Krishnan SM. Retinalblood vessel detection and tracking by matched
Gaussian and Kalman Filters. Proceeding of the20th Annual International Conference of the IEEEEngineering in Medicine and Biology Society. 1998.
20. Zhou L, Rzeszotarski MS, Singerman LJ, ChokreffJM. The detection and quantification of retinopa-thy using digital angiograms. IEEE Trans on MedImg 1994; 13: 619-26.
21. Gang L, Chutatape O, Krishnan SM. Detection andmeasurement of retinal vessels in fundus imageusing amplitude modified second-order Gaussianfilter. IEEE Transaction on Viomedical Engineer-ing, Vol. 49, No. 2, February 2002.
22. Aylward S, Bullitt E. Initialization, noise, singulari-ties, and scale in height-ridge traversal for tubularobject centerline extraction. IEEE Transactions onMedical Imaging 2002: 61-75.
23. Wood SL, Qu G, Roloff LW. Detection and labelingof retinal vessels for longitidunal studies. In IEEEint Conf on Image Processing 1995; 3: 164-7.
24. Sinthanayothin C, Boyce JF, Cook HL, WilliamsonTH. Automated localisation of the optic disc,fovea, and retinal blood vessels from digital colourfundus images. Br J Ophthalmol 1999; 83: 902-10.
25. Nekovei R, Sun Y. Back-propagation network andits configuration for blood vessel detection inangiograms. IEEE Trans. on Neural Nets 1995; 6:64-72.
26. Leandro JJG, Cesar RM Jr, Jeline HF. Blood vesselssegmentation in retina. Preliminary Assessmentof the Mathematical Morphology and of the Wave-let Transform Technique SIBGRAPI 2001, XIVBrazilian Symposium on Computer Graphics andImage processing, 15-18 October 2001, Florianpolis,Brazil.
27. Staal JJ, Kalitzin SN, Abramoff MD, BerendschotT, van Ginneken B, Viergever MA. Classifyingconvex sets for vessel detection in retinal images.Proceedings of the IEEE International Symposiumon Biomedical Imaging. 2002: 269-72.
28. Parvin BA, Penf C, Johnston W, Maestre FM. Track-ing of tubular objects for scientific applications. inProc of the IEEE Conf on CVPR. 1994: 297-301.
29. Huang Q, Stockman GC. Generalized tube model:recognizing 3d elongated objects from 2d inten-sity images. in Proc of the IEEE Conf on CVPR.1993: 104-9.
30. Aylward S, Pizer S, Bullitt E, Eberl D. Intensity ridgeand widths for tabular object segmentation andregistration. in Wksp on Math Methods in BiomedImage Analysis. 1996: 131-8.
31. Mahadevan V, Narasimha-Iyer H, Roysam B,
1792 J Med Assoc Thai Vol. 90 No. 9 2007
เทคนคการตรวจหาตำแหนงโครงสรางเสนเลอดอตโนมตในดวงตาทารกทคลอดกอนกำหนด
ลสดา สขแกว, บญญฤทธ อยยานนวาระ, ซารา บารแมน, เอลสแตร ฟลเดอร, เคน คอกเกอร
วตถประสงค: เพอพฒนาอลกอรทมในการตรวจหาโครงสรางเสนเลอดอตโนมต บนจอประสาทตาในดวงตาทารกทคลอดกอนกำหนด เพอนำมาชวยวเคราะหปรมาณโครงขายการเจรญเตบโตและความผดปกตของเสนเลอดในดวงตาทารก retinopathy of prematurity (ROP)วสดและวธการ: บทความฉบบนนำเสนอวธการในการตรวจหาโครงสรางของเสนเลอดในดวงตาทารก ซงปกตจะเปนภาพทมคณภาพตำ มสญญาณรบกวนสง เนองจากจะตองถายรปภายใตปรมาณความเขมแสงทตำ ระบบจะทำการวเคราะหทางสถตและเทคนคการประมวลผลภาพ เพอหาคาความเหมาะสมในการตรวจหาเสนเลอดทมขนาดเลกและบางในดวงตาทารก ซงประกอบไปดวยเทคนคการหาขอบภาพ ดวยตวดำเนนการลาปาเซยนออฟเกาสเชยนฟลเตอร, การแปลงภาพใหมคาความเขมสองระดบโดยกำหนดคาเทรสโฮลดจากฮสโตรแกรมของรปภาพ, กระบวนการลดความกวางของเสนเลอดใหบางดวยวธการคำนวณหาแกนกลางเสนเลอด, การกำจดสญญาณรบกวนทเปนกลมกอนขนาดเลกดวยเทคนคการทำพรนนงผลการศกษา: อลกอรทมทไดสามารถตรวจหาโครงสรางเสนเลอดบนภาพทมคณภาพตำ สญญาณรบกวนสงและมความชดเจนนอยไดด โดยเฉพาะตำแหนงสำคญทใชในการวเคราะหโรค ROP ซงอยในบรเวณขอบดานขางของเรตนาสรป: ในการทดลองไดเปรยบเทยบผลการตรวจหาโครงสรางเสนเลอดทผานอลกอรทม กบภาพวาดดวยมอจากจกษแพทยผเชยวชาญพบวา ผลทไดใหคาความถกตองอยในระดบสง โดยใหคา specificity ท 0.9879 และคา sen-sitivity ท 0.8935
Tanenbaum HL. Robust model-based vasculaturedetection in noisy biomedical images. IEEE TransInf Technol Biomed 2004; 8: 360-76.
32. Gao XW, Bharath A, Stanton A, Hughes A,Chapman N, Thom S. Quantification and charac-terisation of arteries in retinal images. ComputMethods Programs Biomed 2000; 63: 133-46.
33. Vermeer KA, Vos FM, Lemij HG, Vossepoel AM.A model based method for retinal blood vesseldetection. Comput Biol Med 2004; 34: 209-19.
34. Ayala G, Leon T, Zapater V. Different averages ofa fuzzy set with an application to vessel segmen-tation. IEEE Transactions of Fuzzy Systems, Vol.13, No. 3, June 2005.
35. Sukkaew L, Uyyanonvara B, Barman SA, JareanjitJ. Automated vessels detection on infant retinalimages. accepted by 2004 International Conferenceon Control, Automation and Systems (ICCAS2004),August 25-27, Bangkok, Thailand: 321-5.
36. Sukkaew L, Uyyanonvara B, Barman S. Com-
parison of edge detection techniques on vesseldetection of infant’s retinal image. Proceeding ofICIM2005, October 29-30 2005, ABAC University,Bangkok, Thailand: 6.1-6.5.
37. Wallace DK, Kylstra JA, Chesnutt DA. Prognos-tic significance of vascular dilation and tortuosityinsufficient for plus disease in retinopathy of pre-maturity. J AAPOS 2000; 4: 224-9.
38. Otsu N. A Threshold Selection Method from Gray-Level Histograms IEEE Transaction on Systems,Man and Cybernetics 1979;9 (1): 62-6.
39. Otsu N. A threshold selection method from gray-level histograms. IEEE Transactions on Systems,Man and Cybernetics 1979; 9: 62-6.
40. Haralick RM, Shapiro LG. Computer and robotvision. Vol. I. New York: Addison-Wesley Publish-ing;1992: 233, 348-49.
41. Gonzalez RC, Woods RE. Digital image process-ing. New York: Addison-Wesley Publishing; 1993:540-3.
Related Documents