SPWLA 37th Annual Logging Symposium, June 16-19,1996 Automatic Extraction and Characterisation of Geological Features and Textures from Borehole Images and Core Photographs bY Jonathan Hall, Marco Ponzi, Mauro Gonfalini and Giorgio Maletti Agip S.p.A. 20097, San Donato (Milanese), Milan, Italy ABSTRACT A methodology is proposed for complementing the skills of reservoir characterisation professionals engaged in the interpretation of wireline images and core photographs.This, largely automatic, methodology recognises strengths and weaknesses of human cognition in the context of analysing images to extract sedimentological, structural. petrophysical and reservoir description information. Certain challenges must be overcomeif automation of feature recognition (planes. lenses etc.) and texture segmentation from images is to be realised. These arise from the consequences of divers and extreme borehole environments, registration problems and limitations in logging tool design and instrumentation. Some shortfalls are commented upon and their relative impacts assessed. Most borehole image and core photograph interpretation packagesavailable today consist mainly of utilities for image display of small intervals of data. interactive picking of planar events, computation of plane orientations and the presentation of summary statistics. These capabilities appear relatively immature when compared with advances made in S.E.M.. satellite remote sensing and medical imaging. Using techniques established in image processing, such as edge detection and mathematical morphology and partitioning alforded by co-occurrence matrices and art{jicial neural networks, the extent to which human acquired experience and inherited skills can be ameliorated by automatic procedures is explored. The particular applicability of Hough transform for characterising certain geometrical shapes expressing geological features is examined. A comparison is made of an automatic image analysis method and the dipmeter correlation method of planar eventspicking. An alternative and largely innovative approach is offered employing a consistent and automatic reduction of voluminous borehole image and core photograph data to pertinent image texture attributes. These may be compared to analytical models of particular geological structures, prior to human interpretation. Optimisation techniques such as simulated annealing are used to implement optimal parameter search routines in three dimensional problems, offering improvement in computational 1 performance. Limitations to the automatic procedures testedare identified. Recognition of expressions of geological processes at all scales requires human mental abstraction to some known model. The proposedproceduresshould ensure that this will be more successfully, more consistently and more cost-effectively real&d. INTRODUCTION For many oil companies the acquisition of borehole image data demands a high commitment in costs of acquisition, rig time, processing and often extensive interpretation time. Interpretation can tie up a highly experienced geologist or log analyst for a considerable period Many of the activities which are loosely referred to as interpretation (picking of bed boundaries, fractures etc.) are not strictly interpret- ation activities per se, but represent essential pre- interpretation processing. Nevertheless, recognising features and textures from amongst data artefacts and noise may itself be a task for which the human eye and brain are particularly well adaptedand therefore, one we might consider “interpretation”. Borehole imaging tools were originally developed more than 30 years ago (Mullins, 1966) in order to provide a detailed and continuous profile of the geological characteristics of a subsurface formation penetrated by a well. Technological improvements have allowed for registration and telemetry of larger, digitally recorded data sets using near total circumference contact electrical and circumferential scanning acoustic measurements. Images obtained are still used mainly for manual recognition and description of sedimentological context, fracture character&&ion and qualitative evaluation of porosity developmentin tight formations. Notwithstanding this limited outlook the information content obtainable from images is enormous and we may significantly under-utilise their information potential when making the observations listed above. Textural analysis processing of borehole image data is as yet unrefined and textural information derived has usually been qualitative, subjective, inconsistent and not easily integrated with other petrophysical and geological information. The current challenge, then, is to construct procedures which use these complex data ccc

Welcome message from author
This document is posted to help you gain knowledge. Please leave a comment to let me know what you think about it! Share it to your friends and learn new things together.
Transcript
SPWLA 37th Annual Logging Symposium, June 16-19,1996
Automatic Extraction and Characterisation of Geological Features and Textures from Borehole Images and Core Photographs
bY Jonathan Hall, Marco Ponzi, Mauro Gonfalini and Giorgio Maletti
Agip S.p.A. 20097, San Donato (Milanese), Milan, Italy
ABSTRACT A methodology is proposed for complementing
the skills of reservoir characterisation professionals engaged in the interpretation of wireline images and core photographs. This, largely automatic, methodology recognises strengths and weaknesses of human cognition in the context of analysing images to extract sedimentological, structural. petrophysical and reservoir description information.
Certain challenges must be overcome if automation of feature recognition (planes. lenses etc.) and texture segmentation from images is to be realised. These arise from the consequences of divers and extreme borehole environments, registration problems and limitations in logging tool design and instrumentation. Some shortfalls are commented upon and their relative impacts assessed.
Most borehole image and core photograph interpretation packages available today consist mainly of utilities for image display of small intervals of data. interactive picking of planar events, computation of plane orientations and the presentation of summary statistics. These capabilities appear relatively immature when compared with advances made in S.E.M.. satellite remote sensing and medical imaging.
Using techniques established in image processing, such as edge detection and mathematical morphology and partitioning alforded by co-occurrence matrices and art{jicial neural networks, the extent to which human acquired experience and inherited skills can be ameliorated by automatic procedures is explored.
The particular applicability of Hough transform for characterising certain geometrical shapes expressing geological features is examined. A comparison is made of an automatic image analysis method and the dipmeter correlation method of planar events picking.
An alternative and largely innovative approach is offered employing a consistent and automatic reduction of voluminous borehole image and core photograph data to pertinent image texture attributes. These may be compared to analytical models of particular geological structures, prior to human interpretation. Optimisation techniques such as simulated annealing are used to implement optimal parameter search routines in three dimensional problems, offering improvement in computational
1
performance. Limitations to the automatic procedures tested are identified. Recognition of expressions of geological processes at all scales requires human mental abstraction to some known model. The proposed procedures should ensure that this will be more successfully, more consistently and more cost-effectively real&d.
INTRODUCTION For many oil companies the acquisition of
borehole image data demands a high commitment in costs of acquisition, rig time, processing and often extensive interpretation time. Interpretation can tie up a highly experienced geologist or log analyst for a considerable period Many of the activities which are loosely referred to as interpretation (picking of bed boundaries, fractures etc.) are not strictly interpret- ation activities per se, but represent essential pre- interpretation processing. Nevertheless, recognising features and textures from amongst data artefacts and noise may itself be a task for which the human eye and brain are particularly well adapted and therefore, one we might consider “interpretation”.
Borehole imaging tools were originally developed more than 30 years ago (Mullins, 1966) in order to provide a detailed and continuous profile of the geological characteristics of a subsurface formation penetrated by a well. Technological improvements have allowed for registration and telemetry of larger, digitally recorded data sets using near total circumference contact electrical and circumferential scanning acoustic measurements. Images obtained are still used mainly for manual recognition and description of sedimentological context, fracture character&&ion and qualitative evaluation of porosity development in tight formations.
Notwithstanding this limited outlook the information content obtainable from images is enormous and we may significantly under-utilise their information potential when making the observations listed above. Textural analysis processing of borehole image data is as yet unrefined and textural information derived has usually been qualitative, subjective, inconsistent and not easily integrated with other petrophysical and geological information. The current challenge, then, is to construct procedures which use these complex data
ccc
SPWLA 37th Annual Logging Symposium, June 16-19,1996
structures and their yet more complex information content to enhance reservoir description.
The Technical Objectives of Image Analysis are: l recognition and classification of known geometric
structures and textures, l abstraction of these to controlling geological
processes, at local scale, l numerical description and statistical manipulation
of identified structures and textures, l abstraction to larger scales, observations about
possible sedimentological context, reservoir geometry and impact on reservoir performance.
Human Virtues and Human Failings. In examining human inherited and learned skills we observe that we are well able to:
recognise features and textures from noisy data, use knowledge to build an interpretation and adapt by learning new knowledge, formalise models to explain observations and interpretations, merge and abstract from many data types and sources to build knowledge, and reason between scales of data representation.
Conversely, however, humans: l tend to be inconsistent in application of both
knowledge and interpretation. 0 cannot precisely quantity observations, l memorise only limited or summary numerical data, l sometimes cannot adapt, l are subject to making hasty interpretations, l may be subjective, prejudicial or biased l and have difliculty manipulating complex forms or
relationships.
Machine Virtues. Machines in contrast do have some redeeming features; though not always. They can: l work untiringly, = they never get ill, never have a bad day. l are able to apply formal&d models, l apply formalised models consistently, l can load and process large volumes of data, 0 can provide formalised statistical summaries, l and can provide formal&d measures of evaluation
uncertainty.
‘Traditional’ Image Software Functionality. The functionalities of most interactive image analysis programs integrated into larger log analysis packages probably represent what would have been computationally speaking leading edge five years ago, yet functionality has not kept pace with technology.
Traditional presentation conforms to and confirms an anthropocentric view of the data, in an area of successful human activity, previously considered difficult to automate. Computational constraints have forced users, to date. to contend with software presenting image data with a false colour mapping (brown to white is common) of say 7 bit (128) grey scale values which serves in some way to remind us of rock held in hand specimen.
Even after image data ‘normalisation’, the human brain does not distinguish well between adjacent shades of more than a handful of grey scale classes, although it does slightly better with colour representations. Consequently, visual resolution from even the best registration could be reduced if small high contrast regions lie within a relatively homogeneous background within the normalisation window.
The Need for Automation. Within Agip the acquisition and interpretation of images have been principally directed until recently, towards the location of fractured zones and the characterisation of their spatial organisation as sites for structural control on secondary porosity development and potential zones of production (Gonfalini et a1.,1990). Recently, the discovery of bio-clastic carbonate reservoirs in Italy has resulted in the emphasis being shifted somewhat. In these reservoirs, the primaiy porosity strongly controls production capacity (Schlumberger, 1985) and may be seen to be associated with visible rock texture. This is confirmed from production tests, core permeability, and analogy outcrop studies. Experimental codes from logging companies offer only a partial success for the use of rock texture and a great deal of manual intervention is still required to describe textural setting from a proliferation of statistical indices. With a growing interest in the use of borehole images as an adjunct to traditional eiectrofacies approaches to facies segmentation, a potential processing bottleneck was recognised. Also, recognised were operational drawbacks associated with changing stalT during a project lifetime, leading to inconsistencies in identification and description of textural and structural information.
The practical limitations to automatic extraction, character&ion of borehole images and core photographs, as with other remote sensing data, are the extent to which imperfect registration can be recognised and overcome. As electrical imaging tools do not fully cover borehole circumference, any technique developed must be relatively insensitive to these gaps in image information.
2
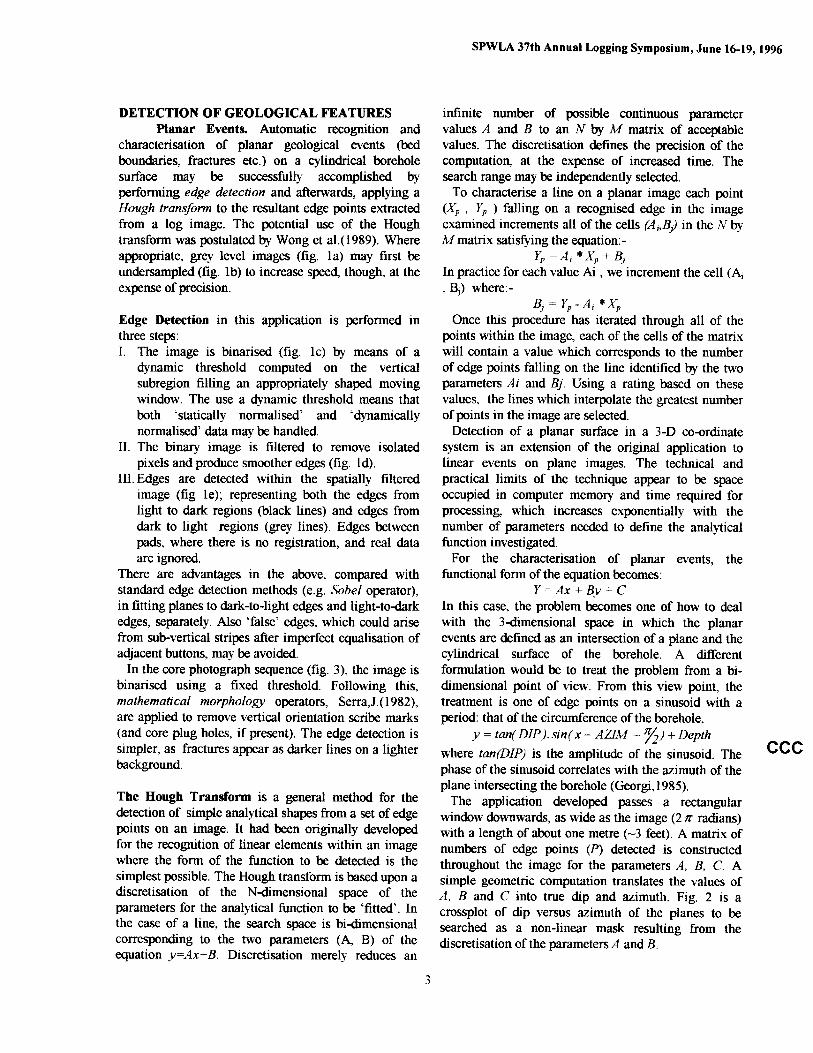
DETECTION OF GEOLOGICAL FEATURES Planar Events. Automatic recognition and
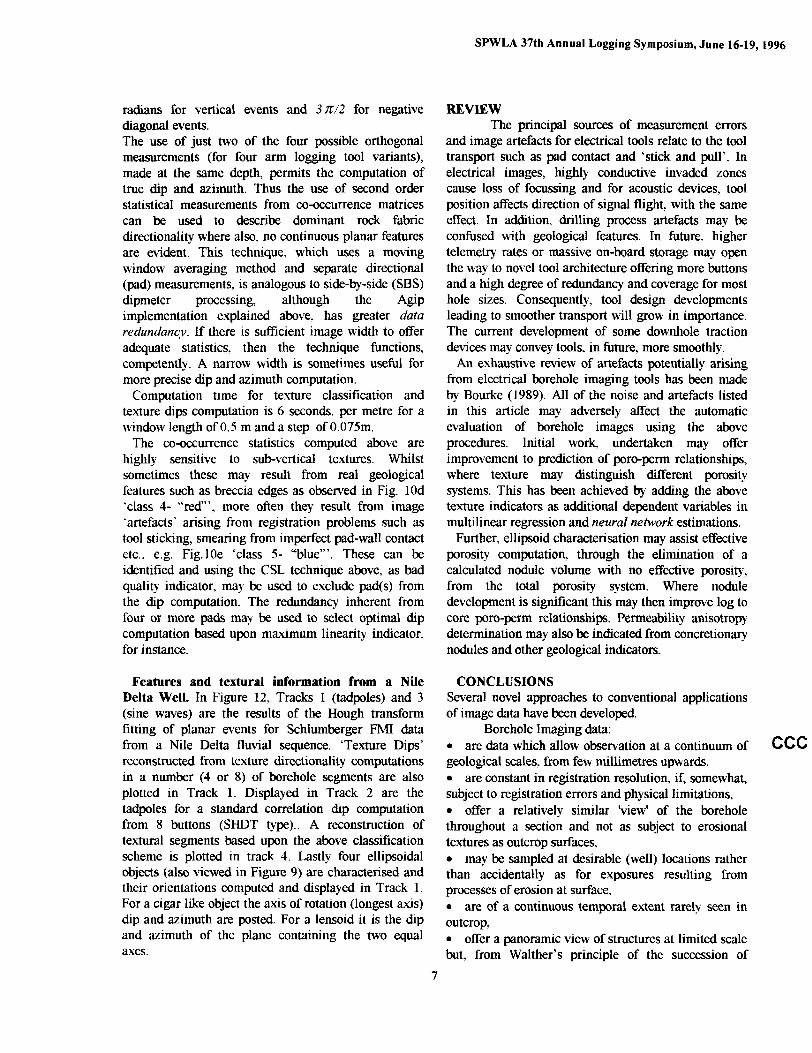
character&ion of planar geological events (bed boundaries, fracmres etc.) on a cylindrical borehole surface may be successfully accomplished by performing edge detection and afterwards, applying a Hough transform to the resultant edge points extracted from a log image. The potential use of the Hot@ transform was postulated by Wong et al.( 1989). Where appropriate, grey level images (fig. la) may first be undersampled (fig. lb) to increase speed though, at the expense of precision.
Edge Detection in this application is performed in three steps: I. The image is binarised (fig. lc) by means of a
dynamic threshold computed on the vertical subregion filling an appropriately shaped moving window. The use a dynamic threshold means that both ‘statically normalised’ and ‘dynamically normalised’ data may be handled.
II. The binary image is filtered to remove isolated pixels and produce smoother edges (fig. Id).
III. Edges are detected within the spatially filtered image (fig le); representing both the edges from light to dark regions (black lines) and edges from dark to light regions (grey lines). Edges between pads, where there is no registration, and real data are ignored.
There are advantages in the above, compared with standard edge detection methods (e.g. Sobei operator), in fitting planes to dark-to-light edges and light-to-dark edges, separately. Also ‘false’ edges, which could arise from sub-vertical stripes after imperfect equalisation of adjacent buttons. may be avoided.
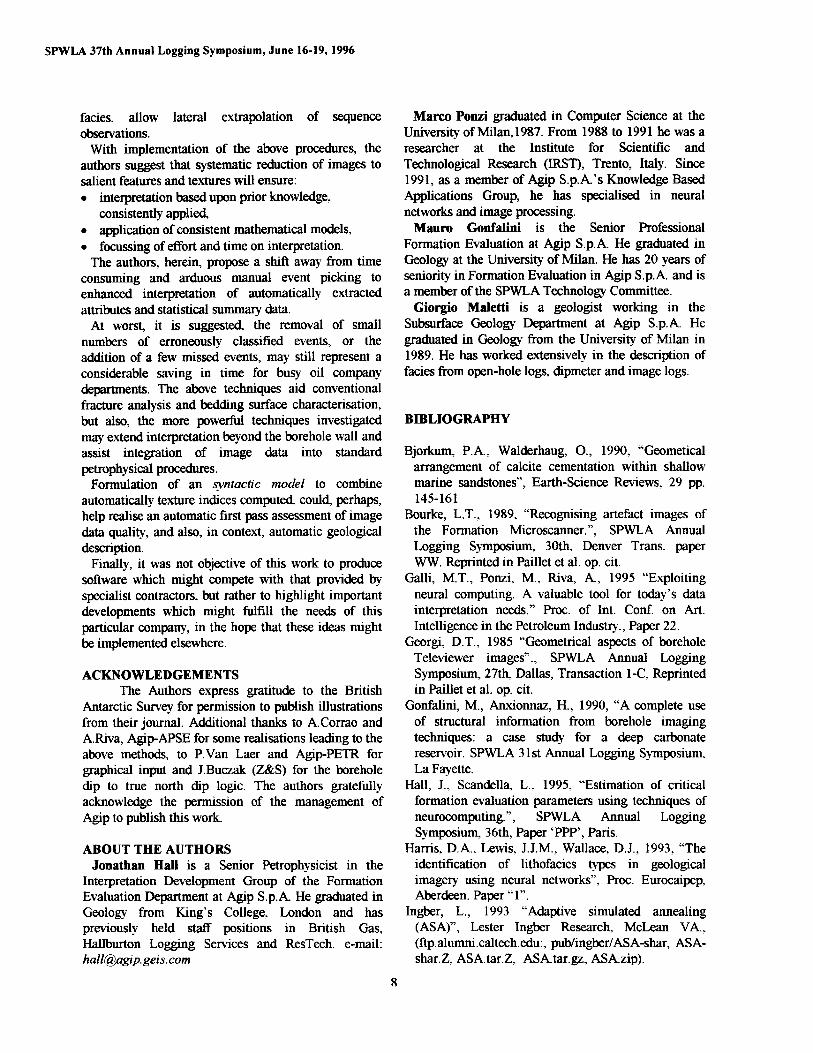
In the core photograph sequence (fig. 3) the image is binarised using a fixed threshold. Following this, mathematical morphology operators, Serra,J.(1982), are applied to remove vertical orientation scribe marks (and core plug holes, if present). The edge detection is simpler, as fractures appear as darker lines on a lighter background.
The Hough Transform is a general method for the detection of simple analytical shapes from a set of edge points on an image. It had been originally developed for the recognition of linear elements within an image where the form of the function to be detected is the simplest possible. The Hough transform is based upon a discretisation of the N-dimensional space of the parameters for the analytical function to be ‘fitted’. In the case of a line, the search space is bidimensional corresponding to the two parameters (A, B) of the equation y=14x+B. Discretisation merely reduces an
SPWLA 37th Annual Logging Symposium, June 1619,199tj
infinite number of possible continuous parameter values A and B to an N by A4 matrix of acceptable values. The discretisation defines the precision of the computation, at the expense of increased time. The search range may be independently selected.
To character& a line on a planar image each point (X, , Y, ) falling on a recognised edge in the image examined increments all of the cells CA,,& in the N by M matrix satisfying the equation:-
Yp = A, *X, + B, In practice for each value Ai , we increment the cell (Ai > B,) where: -
Bj = Yp-Ai *X, Once this procedure has iterated through all of the
points within the image, each of the cells of the matrix will contain a value which corresponds to the number of edge points falling on the line identified by the two parameters Ai and Bj. Using a rating based on these values, the lines which interpolate the greatest number of points in the image are selected.
Detection of a planar surface in a 3-D co-ordinate system is an extension of the original application to linear events on plane images. The technical and practical limits of the technique appear to be space occupied in computer memory and time required for processing, which increases exponentially with the number of parameters needed to define the analytical function investigated.
For the character&&ion of planar events, the functional form of the equation becomes:
Y=Ax+By+C In this case, the problem becomes one of how to deal with the 3dimensional space in which the planar events are defined as an intersection of a plane and the cylindrical surface of the borehole. A different formulation would be to treat the problem from a bi- dimensional point of view. From this view point, the treatment is one of edge points on a sinusoid with a period: that of the circumference of the borehole,
y = tan(DIP).sin(x- AZiM - y,) + Depth
where tan(DIP) is the amplitude of the sinusoid. The phase of the sinusoid correlates with the azimuth of the plane intersecting the borehole (Georgi, 1985).
The application developed passes a rectangular window downwards, as wide as the image (2 z radians) with a length of about one metre (-3 feet). A matrix of numbers of edge points (P) detected is constructed throughout the image for the parameters A, B, C. A simple geometric computation translates the values of A, B and C into true dip and azimuth. Fig. 2 is a crossplot of dip versus azimuth of the planes to be searched as a non-linear mask resulting from the discretisation of the parameters A and B.
ccc
3
SPWLA 37th Annual Logging Symposium, June 16-19,1996
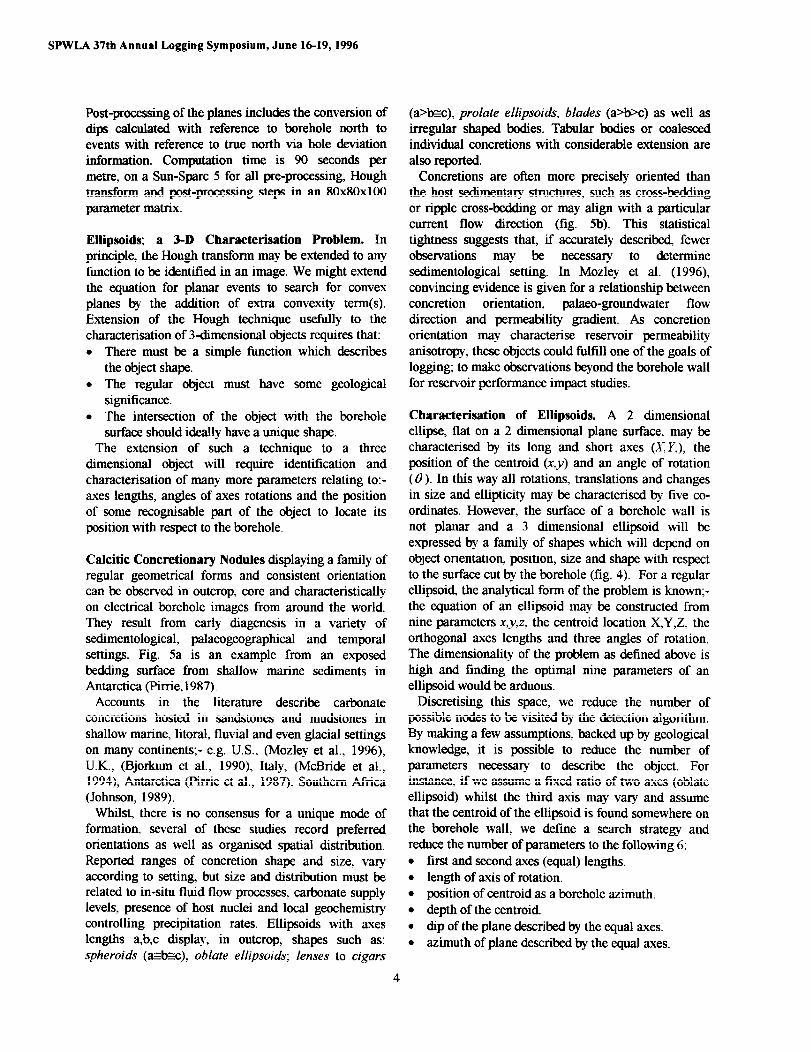
Post-processing of the planes includes the conversion of dips calculated with reference to borehole north to events with reference to true north via hole deviation information. Computation time is 90 seconds per metre, on a Sun-Spare 5 for all pre-processing, Hot@ transform and post-processing steps in an 80x80~100 parameter matrix.
Ellipsoids; a 3-D Characterisation Problem. In principle, the Hough transform may be extended to any function to be identified in an image. We might extend the equation for planar events to search for convex planes by the addition of extra convexity term(s). Extension of the Hough technique usefully to the characterisation of 3dimensional objects requires that: l There must be a simple function which describes
the object shape. l The regular object must have some geological
significance. l The intersection of the object with the borehole
surface should ideally have a unique shape. The extension of such a technique to a three
dimensional object will require identification and character&ion of many more parameters relating to:- axes lengths, angles of axes rotations and the position of some recognisable part of the object to locate its position with respect to the borehole.
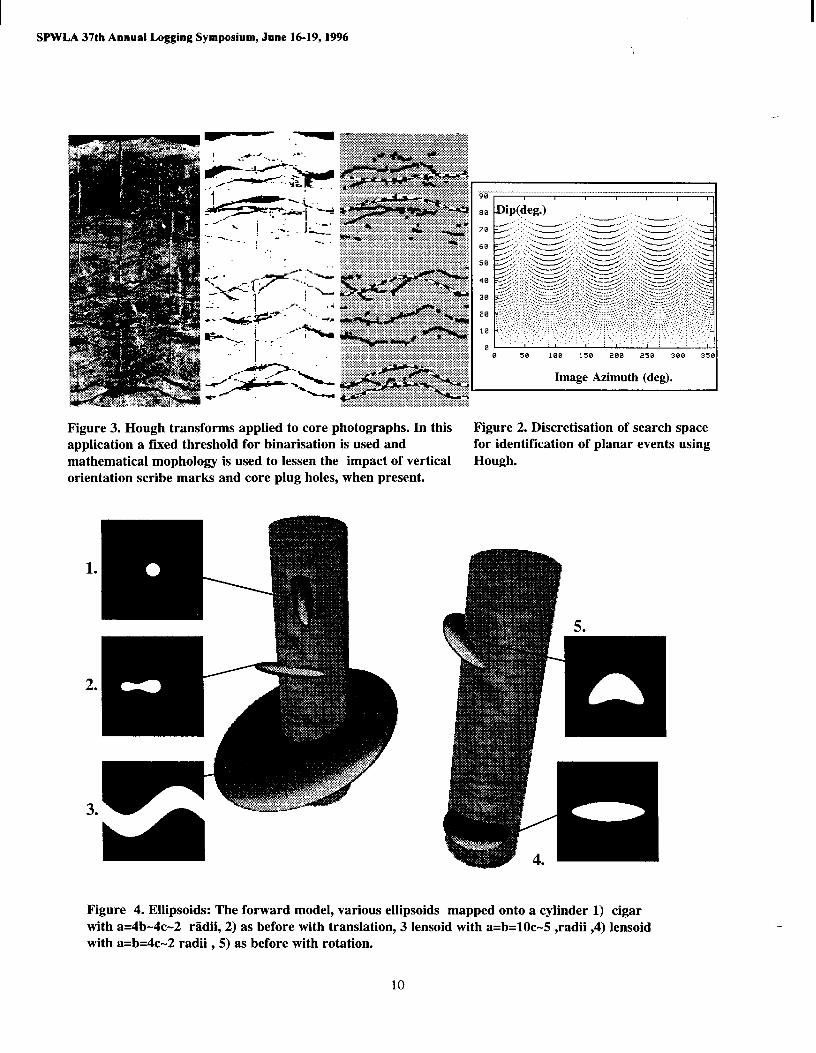
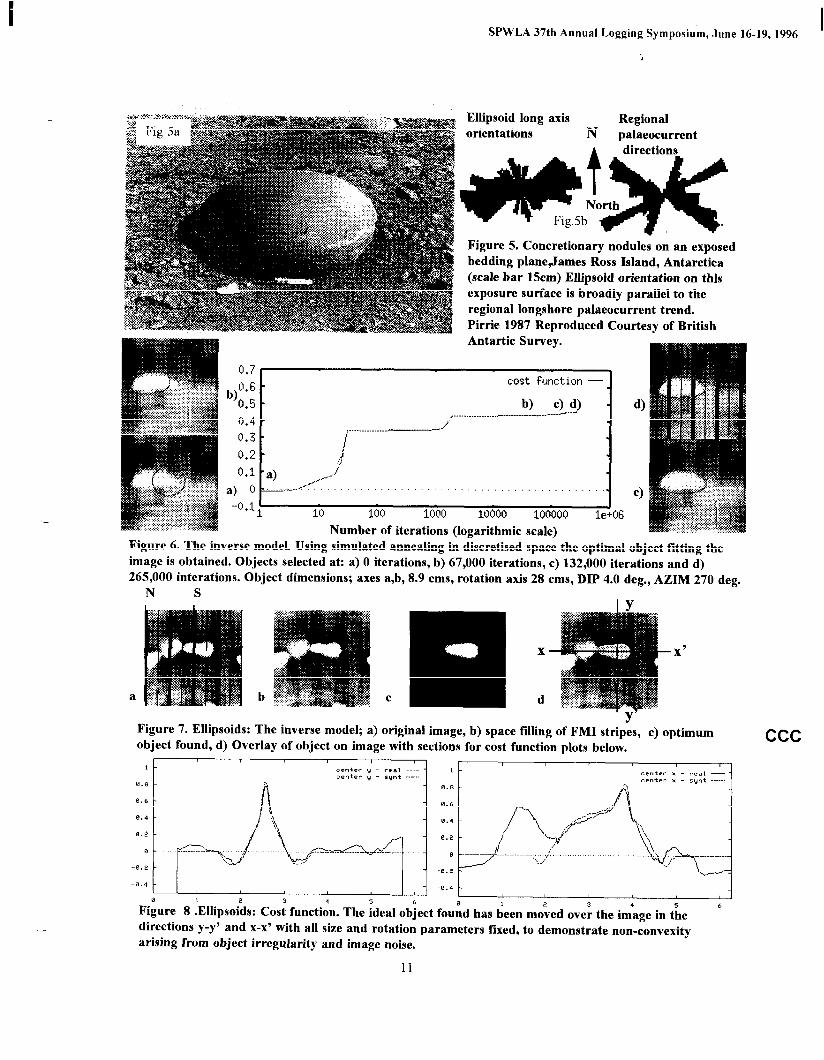
Cakitic Concretionary Nodules displaying a family of regular geometrical forms and consistent orientation can be observed in outcrop, core and characteristically on electrical borehole images from around the world. They result from early diagenesis in a variety of sedimentological, palaeogeographical and temporal settings. Fig. 5a is an example from an exposed bedding surface from shallow marine sediments in Antarctica (Pirrie, 1987).
Accounts in the literature describe carbonate concretions hosted in sandstones and mudstones in shallow marine. litoral, fluvial and even glacial settings on many continents;- e.g. U.S., (Mozley et al., 1996) U.K., (Bjorkum et al., 1990). Italy, (McBride et al., 1994) Antarctica (Pirrie et al., 1987) Southern Africa (Johnson, 1989).
Whilst, there is no consensus for a unique mode of formation, several of these studies record preferred orientations as well as organ&d spatial distribution. Reported ranges of concretion shape and size, vary according to setting, but size and distribution must be related to in-situ fluid flow processes. carbonate supply levels, presence of host nuclei and local geochemisuy controlling precipitation rates. Ellipsoids with axes lengths a,b,c display, in outcrop, shapes such as: spheroids (~&SC), oblate ellipsoids; lenses to cigars
(a>&), prolate ellipsoids, blades (a%%) as well as irregular shaped bodies. Tabular bodies or coalesced individual concretions with considerable extension are also repoltd
Concretions are often more precisely oriented than the host sedimentary structures, such as cross-bedding or ripple cross-bedding or may align with a particular current flow direction (fig. 5b). This statistical tightness suggests that, if accurately described fewer observations may be necessary to determine sedimentological setting. In Mozley et al. (1996) convincing evidence is given for a relationship between concretion orientation, palaeo-grotmdwater flow direction and permeability gradient. As concretion orientation may character& reservoir permeability anisotropy, these objects could fulfill one of the goals of logging; to make observations beyond the borehole wall for reservoir performance impact studies.
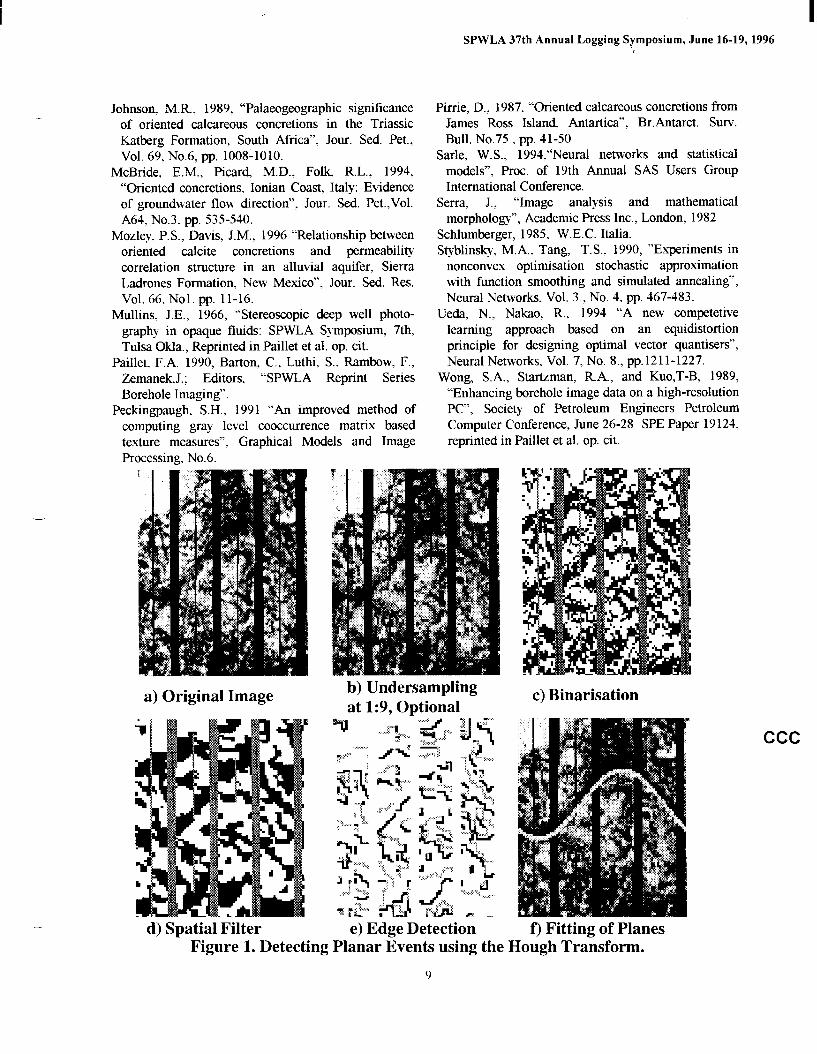
Characterisation of Ellipsoids. A 2 dimensional ellipse, flat on a 2 dimensional plane surface, may be character&d by its long and short axes (XY,), the position of the centroid (x,y) and an angle of rotation (8). In this way all rotations, translations and changes in size and elliptic@ may be character&d by five co- ordinates. However. the surface of a borehole wall is not planar and a 3 dimensional ellipsoid will bc expressed by a family of shapes which will depend on object orientation, position, size and shape with respect to the surface cut by the borehole (fig. 4). For a regular ellipsoid the analytical form of the problem is known;- the equation of an ellipsoid may be constructed from nine parameters x,y,z, the centroid location X,Y,Z, the orthogonal axes lengths and three angles of rotation. The dimensionality of the problem as defined above is high and finding the optimal nine parameters of an ellipsoid would be arduous.
Discretising this space, we reduce the number of possible nodes to be visited by the detection algorithm. By making a few assumptions, backed up by geological knowledge, it is possible to reduce the number of parameters necessary to describe the object. For instance, if we assume a fixed ratio of two axes (oblate ellipsoid) whilst the third axis may vary and assume that the centroid of the ellipsoid is found somewhere on the borehole wall, we define a search strategy and reduce the number of parameters to the following 6: l first and second axes (equal) lengths. l length of axis of rotation. l position of centroid as a borehole azimuth. l depth of the centroid. l dip of the plane described by the equal axes. l azimuth of plane described by the equal axes.
4
SPWLA 37th Annual Logging Symposium, June 16-19,1996
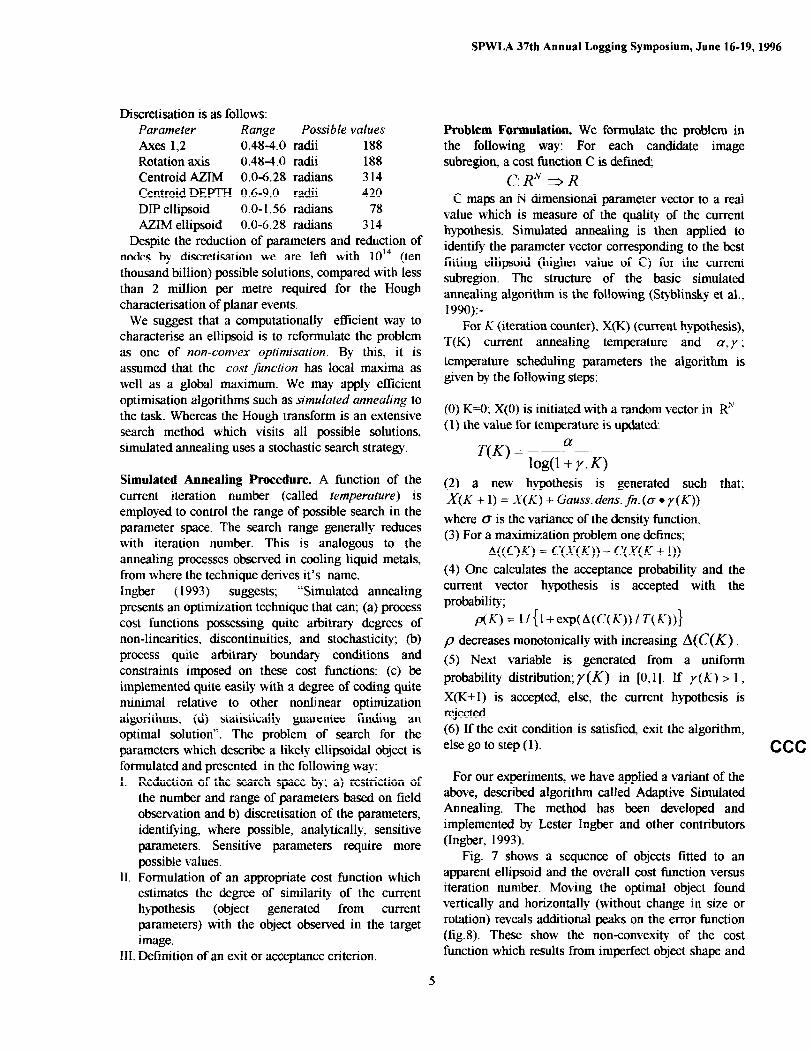
Discretisation is as follows: Parameter Range Axes 1,2 0.48-4.0 Rotation axis 0.48-4.0 Centroid AZlM 0.0-6.28 Centroid DEPTH 0.6-9.0 DIP ellipsoid 0.0-1.56 AZlM ellipsoid 0.0-6.28
Possible values radii 188 radii 188 radians 314 radii 420 radians 78 radians 314
Despite the reduction of parameters and reduction of nodes by discretisation we are left with lOI (ten thousand billion) possible solutions, compared with less than 2 million per metre required for the Hot@ characterisation of planar events.
We suggest that a computationally efficient way to character& an ellipsoid is to reformulate the problem as one of non-convex optimisation. By this, it is assumed that the cost function has local maxima as well as a global maximum. We may apply efficient optimisation algorithms such as simulated annealing to the task. Whereas the Hough transform is an extensive search method which visits all possible solutions, simulated annealing uses a stochastic search strategy.
Simulated Annealing Procedure. A function of the current iteration number (called temperature) is employed to control the range of possible search in the parameter space. The search range generally reduces with iteration number. This is analogous to the annealing processes observed in cooling liquid metals, from where the technique derives it’s name. Ingber ( 1993) suggests; “Simulated annealing presents an optimization technique that can; (a) process cost functions possessing quite arbitrary degrees of non-linearities, discontinuities, and stochastic&y; (b) process quite arbitrary boundary conditions and constraints imposed on these cost functions; (c) be implemented quite easily with a degree of ceding quite minimal relative to other nonlinear optimization algorithms; (d) statistically guarentee finding an optimal solution”. The problem of search for the parameters which describe a likely ellipsoidal object is formulated and presented in the following way: I.
II.
Reduction of the search space by; a) restriction of the number and range of parameters based on field observation and b) discretisation of the parameters. identifying, where possible, analytically, sensitive parameters. Sensitive parameters require more possible values. Formulation of an appropriate cost function which estimates the degree of similarity of the current hypothesis (object generated from current parameters) with the object observed in the target image.
III. Definition of an exit or acceptance criterion.
Problem Formulation. We formulate the problem in the following way: For each candidate image subregion, a cost function C is delined;
C:RN =R C maps an N dimensional parameter vector to a real
value which is measure of the quality of the current hypothesis. Simulated annealing is then applied to identify the parameter vector corresponding to the best fitting ellipsoid (higher value of C) for the current subregion. The structure of the basic simulated annealing algorithm is the following (Stybline et al., 1990):-
For k’ (iteration counter), X(K) (current hypothesis), T(K) current annealing temperature and a, y ; temperature scheduling parameters the algorithm is given by the following steps:
(0) K=O; X(0) is initiated with a random vector in RN (1) the value for temperature is updated:
T(K)= a -- log(1 + y. K)
(2) a new hypothesis is generated such that; X(K + 1) = X(K) + Gauss. dens. fn. (CT l y(K))
where 0 is the variance of the density function. (3) For a maximization problem one defines;
U(C)0 = CWW)) - CWW + 1)) (4) One calculates the acceptance probability and the current vector hypothesis is accepted with the probability;
p(K)= I/{l+exp(A(C(K))/T(K))} p decreases monotonically with increasing A(C(K) (5) Next variable is generated from a uniform probability distribution; y(K) in [O,l]. If y(K) > 1) X(K+l) is accepted else, the current hypothesis is rejected. (6) lf the exit condition is satisfied, exit the algorithm, else go to step (1). ccc
For our experiments, we have applied a variant of the above, described algorithm called Adaptive Simulated Annealing. The method has been developed and implemented by Lester Ingber and other contributors (Ingber, 1993).
Fig. 7 shows a sequence of objects fitted to an apparent ellipsoid and the overall cost function versus iteration number. Moving the optimal object found vertically and horizontally (without change in size or rotation) reveals additional peaks on the error function (fig.8). These show the non-convexity of the cost function which results from imperfect object shape and
5
SPWLA 37th Annual Logging Symposium, June 16-19,1996
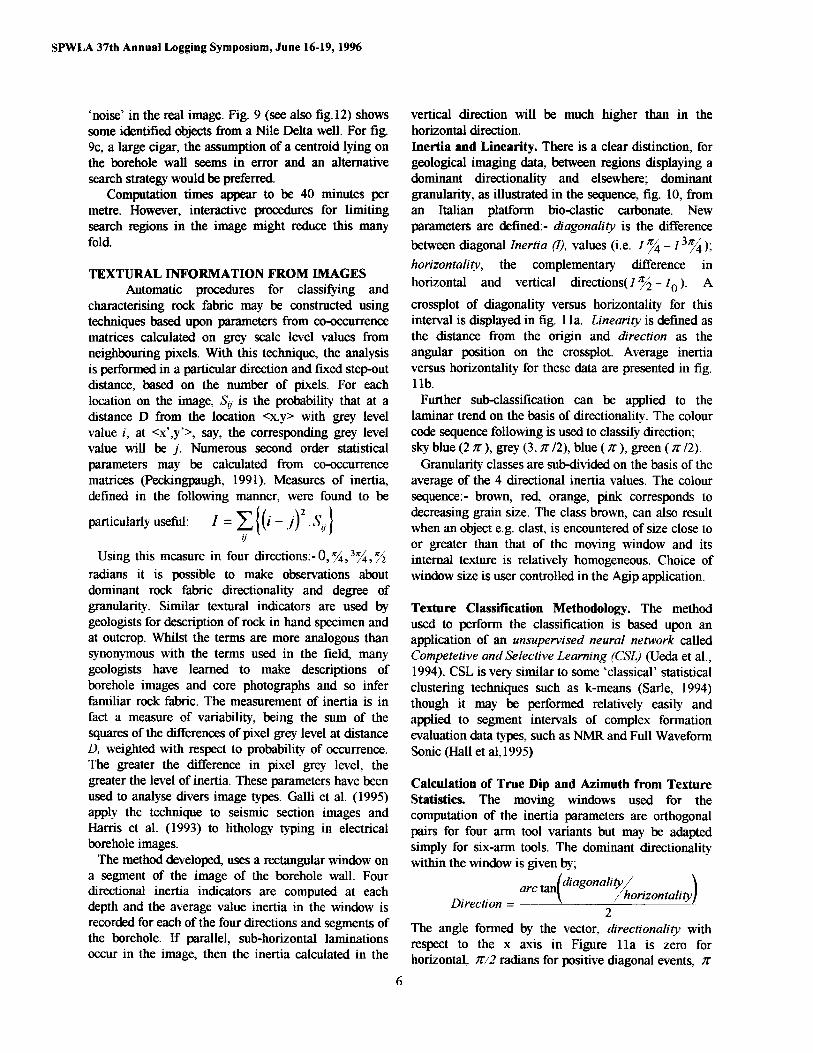
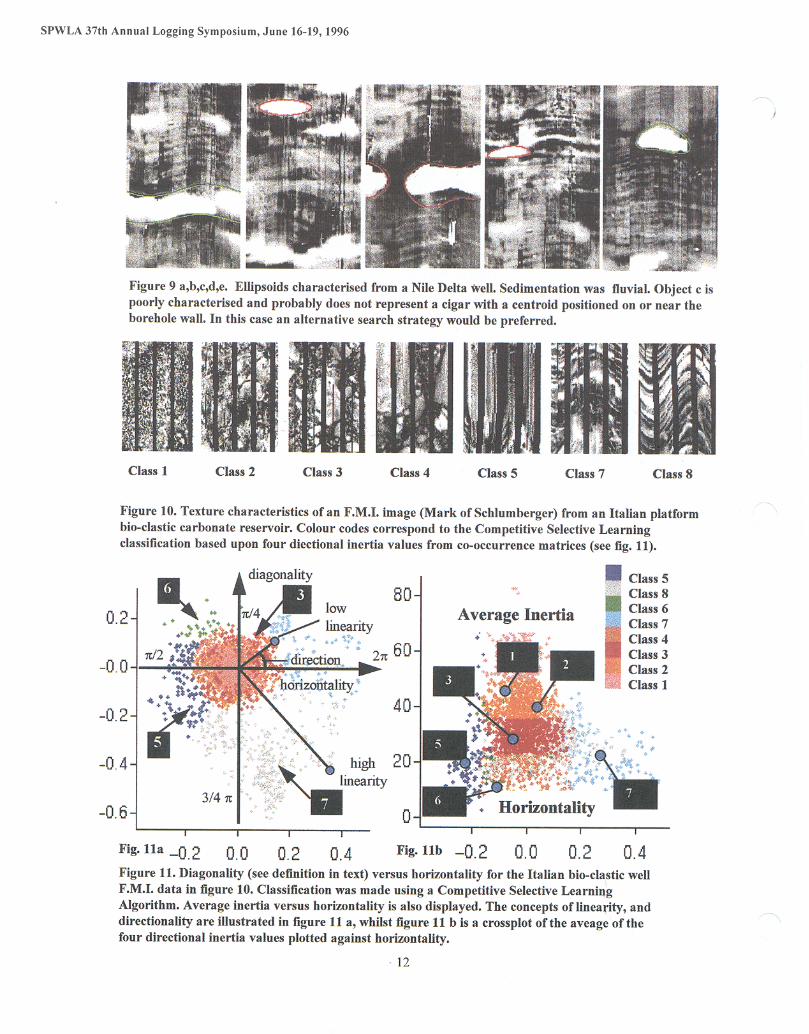
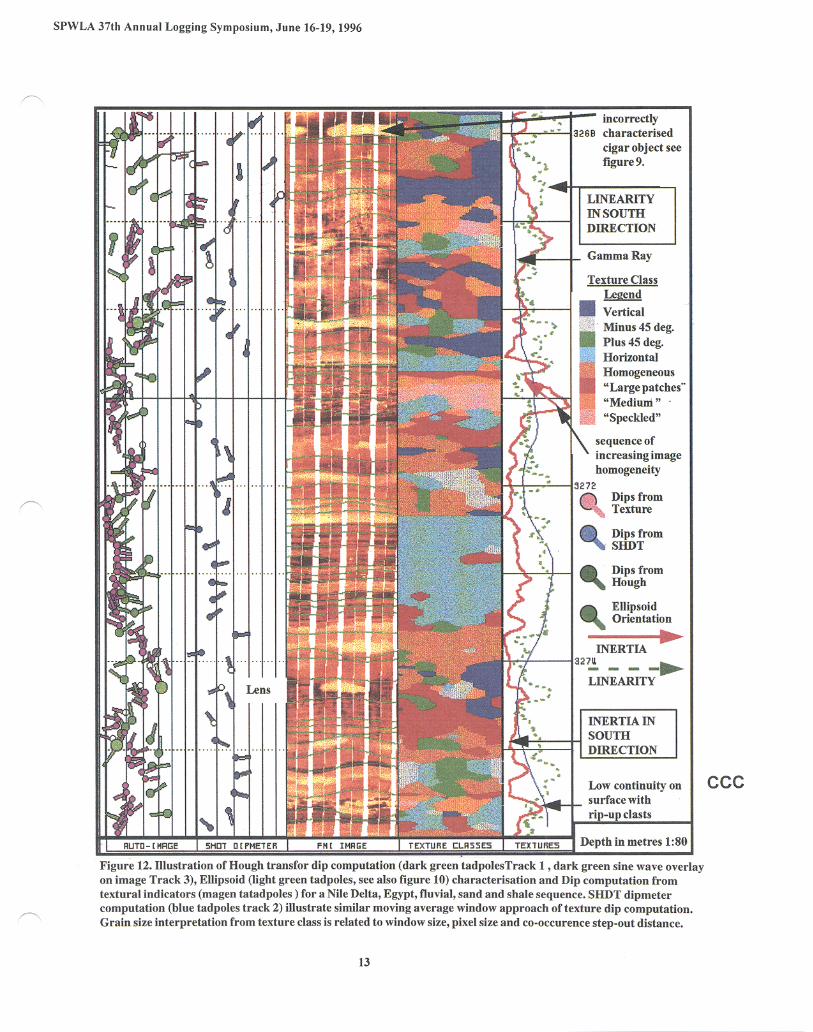
‘noise’ in the real image. Fig. 9 (see also fig.12) shows some identified objects from a Nile Delta well. For fig. 9c, a large cigar, the assumption of a centroid lying on the borehole wall seems in error and an alternative search strategy would be preferred
Computation times appear to be 40 minutes per metre. However, interactive procedures for limiting search regions in the image might reduce this many fold.
TEXTURAL INFORMATION FROM IMAGES Automatic procedures for classifying and
characterising rock fabric may be constructed using techniques hased upon parameters from co+ccurrence matrices calculated on grey scale level values from neighbouring pixels. With this technique, the analysis is performed in a particular direction and fixed step-out distance, based on the number of pixels. For each location on the image, S, is the probability that at a distance D from the location <x,y> with grey level value i, at <x’,y’>, say, the corresponding grey level value will be i. Numerous second order statistical parameters may be calculated from co-occurrence matrices (Peckingpaugh, 1991). Measures of inertia, defined in the following manner, were found to be
particularly useful: I=X((i-j)‘.&) u
Using this measure in four directions:- 0, %, 3”/4, :/2 radians it is possible to make observations about dominant rock fabric directionality and degree of granularity. Similar textural indicators are used by geologists for description of rock in hand specimen and at outcrop. Whilst the terms are more analogous than synonymous with the terms used in the field many geologists have learned to make descriptions of borehole images and core photographs and so infer familiar rock fabric. The measurement of inertia is in fact a measure of variability, being the sum of the squares of the differences of pixel grey level at distance D, weighted with respect to probability of occurrence. The greater the difference in pixel grey level, the greater the level of inertia. These parameters have been used to analyse divers image types. Galli et al. (1995) apply the technique to seismic section images and Harris et al. (1993) to lithology typing in electrical borehole images.
The method developed, uses a rectangular window on a segment of the image of the borehole wall. Four directional inertia indicators are computed at each depth and the average value inertia in the window is recorded for each of the four directions and segments of the borehole. If parallel, sub-horizontal laminations occur in the image, then the inertia calculated in the
vertical direction will be much higher than in the horizontal direction. Inertia and Linearity. There is a clear distinction, for geological imaging data, between regions displaying a dominant directionality and elsewhere; dominant granularity, as illustrated in the sequence, fig. 10, from an Italian platform bioclastic carbonate. New parameters are defined:- diagonality is the difference between diagonal Inertia (I), values (i.e. I “/4 - I 3’f;/4); horizontality, the complementary difference in horizontal and vertical directions( Z “/2 - Zo). A
crossplot of diagonality versus horizontality for this interval is displayed in fig. 1 la. Lineatity is defined as the distance from the origin and direction as the angular position on the crossplot. Average inertia versus horizontality for these data are presented in fig. 1 lb.
Further sub-classification can be applied to the laminar trend on the basis of directionality. The colour code sequence following is used to classify direction; sky blue (2 z ), grey (3. ?r 12) blue ( z ), green ( z /2).
Granularity classes are subdivided on the basis of the average of the 4 directional inertia values. The colour sequence : - brown, red, orange, pink corresponds to decreasing grain size. The class brown, can also result when an object e.g. clast, is encountered of size close to or greater than that of the moving window and its internal texture is relatively homogeneous. Choice of window size is user controlled in the Agip application.
Texture Classification Methodology. The method used to perform the classification is based upon an application of an unsupervised neural network called Competetive and Selective Learning (CSL) (Ueda et al., 1994). CSL is very similar to some ‘classical’ statistical clustering techniques such as k-means (Sarle, 1994) though it may be performed relatively easily and applied to segment intervals of complex formation evaluation data types, such as NMR and Full Waveform Sonic (Hall et al, 1995)
Calculation of True Dip and Azimuth from Texture Statistics. The moving windows used for the computation of the inertia parameters are orthogonal pairs for four arm tool variants but may be adapted simply for six-arm tools. The dominant directionality within the window is given by;
arc Direction =
diagona1i~40rizontalityj 2
The angle formed by the vector, directionality with respect to the x axis in Figure lla is zero for horizontal, ~12 radians for positive diagonal events, z
6
SPWLA 37th Annual Logging Symposium, June 16-19,1996
radians for vertical events and 3 n/2 for negative diagonal events. The use of just two of the four possible orthogonal measurements (for four arm logging tool variants), made at the same depth, permits the computation of true dip and azimuth. Thus the use of second order statistical measurements from co-occurrence matrices can be used to describe dominant rock fabric directionality where also, no continuous planar features are evident. This technique. which uses a moving window averaging method and separate directional (pad) measurements, is analogous to side-by-side (SBS) dipmeter processing, although the Agip implementation explained above, has greater data redundancy. If there is sufficient image width to offer adequate statistics, then the technique functions, competently. A narrow width is sometimes useful for more precise dip and azimuth computation.
Computation time for texture classification and texture dips computation is 6 seconds. per metre for a window length of 0.5 m and a step of 0.075m.
The co-occurrence statistics computed above are highly sensitive to sub-vertical textures. Whilst sometimes these may result from real geological features such as breccia edges as observed in Fig. 10d ‘class 4- “red”‘, more often they result from image ‘artefacts’ arising from registration problems such as tool sticking, smearing from imperfect pad-wall contact etc.. e.g. Fig.lOe ‘class 5- “blue”‘. These can be identifkd and using the CSL technique above, as bad quality indicator, may be used to exclude pad(s) from the dip computation. The redundancy inherent from four or more pads may be used to select optimal dip computation based upon maximum linearity indicator, for instance.
Features and textural information from a Nile Delta Well. In Figure 12. Tracks 1 (tadpoles) and 3 (sine waves) are the results of the Hough transform fitting of planar events for Schlumberger FMI data from a Nile Delta fluvial sequence. ‘Texture Dips’ reconstructed from texture directionality computations in a number (4 or 8) of borehole segments are also plotted in Track 1. Displayed in Track 2 are the tadpoles for a standard correlation dip computation from 8 buttons (SHDT type). . A reconstruction of textural segments based upon the above classification scheme is plotted in track 4. Lastly four ellipsoidal objects (also viewed in Figure 9) are characteriscd and their orientations computed and displayed in Track 1. For a cigar like object the axis of rotation (longest axis) dip and azimuth are posted. For a lensoid it is the dip and azimuth of the plane containing the two equal axes.
REVIEW The principal sources of measurement errors
and image artefacts for electrical tools relate to the tool transport such as pad contact and ‘stick and pull’. In electrical images, highly conductive invaded zones cause loss of focussing and for acoustic devices, tool position affects direction of signal flight, with the same effect. In addition, drilling process artefacts may be confused with geological features. In future, higher telemetry rates or massive on-board storage may open the way to novel tool architecture offering more buttons and a high degree of redundancy and coverage for most hole sizes. Consequently, tool design developments leading to smoother transport will grow in importance. The current development of some downhole traction devices may convey tools, in future, more smoothly.
An exhaustive review of artefacts potentially arising from electrical borehole imaging tools has been made by Bourke (1989). All of the noise and artefacts listed in this article may adversely affect the automatic evaluation of borehole images using the above procedures. Initial work undertaken may offer improvement to prediction of poro-pemi relationships, where texture may distinguish different porosity systems. This has been achieved by adding the above texture indicators as additional dependent variables in multilinear regression and neural network estimations.
Further, ellipsoid characterisation may assist effective porosity computation, through the elimination of a calculated nodule volume with no effective porosity, from the total porosity system. Where nodule development is significant this may then improve log to core pore-perm relationships. Permeability anisotropy determination may also be indicated from concretionary nodules and other geological indicators.
CONCLUSIONS Several novel approaches to conventional applications of image data have been developed.
Borehole Imaging data: l are data which allow observation at a continuum of geological scales, from few millimetres upwards. l are constant in registration resolution, if, somewhat, subject to registration errors and physical limitations, l offer a relatively similar ‘view’ of the borehole throughout a section and not as subject to erosional textures as outcrop surfaces, l may be sampled at desirable (well) locations rather than accidentally as for exposures resulting from processes of erosion at surface, l are of a continuous temporal extent rarely seen in outcrop, l offer a panoramic view of structures at limited scale but, from Walther’s principle of the succession of
cc :C
7
SPWLA 37th Annual Logging Symposium, June 16-19,1996
facies, allow lateral extrapolation of sequence observations.
With implementation of the above procedures, the authors suggest that systematic reduction of images to salient features and textures will ensure: 0 interpretation based upon prior knowledge,
consistently applied 0 application of consistent mathematical models, l focussing of effort and time on interpretation.
The authors, herein, propose a shift away from time consuming and arduous manual event picking to enhanced interpretation of automatically extracted attributes and statistical stmunary data.
At worst, it is suggest@ the removal of small munbers of erroneously classified events, or the addition of a few missed events, may still represent a considerable saving in time for busy oil company departments. The above techniques aid conventional fracture analysis and bedding surface characterisation, but also, the more powerful techniques investigated may extend interpretation beyond the borehole wall and assist integration of image data into standard petrophysical procedures.
Formulation of an syntactic model to combine automatically texture indices computed could perhaps, help realise an automatic first pass assessment of image data quality, and also, in context, automatic geological description.
Finally, it was not objective of this work to produce software which might compete with that provided by specialist contractors, but rather to highlight important developments which might fulfill the needs of this particular company, in the hope that these ideas might be implemented elsewhere.
ACKNOWLEDGEMENTS The Authors express gratitude to the British
Antarctic Survey for permission to publish illustrations from their journal. Additional thanks to A.Corrao and ARiva, Agip-APSE for some realisations leading to the above methods, to P.Van Laer and Agip-PETR for graphical input and J.Bunak (Z&S) for the borehole dip to true north dip logic. The authors gratefully acknowledge the permission of the management of Agip to publish this work.
ABOUT THE AUTHORS Jonathan Hall is a Senior Petrophysicist in the
Interpretation Development Group of the Formation Evaluation Department at Agip S.p. A He graduated in Geology from Ring’s College, London and has previously held stafI positions in British Gas, Hallburton Logging Services and ResTech. e-mail: [email protected]
Marco Ponzi graduated in Computer Science at the University of Milan, 1987. From 1988 to 1991 he was a researcher at the Institute for Scientific and Technological Research (IRST), Trento, Italy. Since 1991, as a member of Agip S.p.A’s Knowledge Based Applications Group, he has specialised in neural networks and image processing.
Mauro Gonfalini is the Senior Professional Formation Evaluation at Agip S.p.A. He graduated in Geology at the University of Milan. He has 20 years of seniority in Formation Evaluation in Agip S.p.A. and is a member of the SPWLA Technology Committee.
Giorgio Maletti is a geologist working in the Subsurface Geology Department at Agip S.p.A. He graduated in Geology from the University of Milan in 1989. He has worked extensively in the description of facies from open-hole logs, dipmeter and image logs.
BIBLIOGRAPHY
Bjorktmt, P.A., Walderhaug, O., 1990, “Geometical arrangement of calcite cementation within shallow marine sandstones”, Earth-Science Reviews, 29 pp. 145-161
Bourke, L.T., 1989, “Recognising artefact images of the Formation Microscanner.“, SPWLA Annual Logging Symposium, 30& Denver Trans. paper WW. Reprinted in Paillet et al. op. cit.
Galli, M.T., Ponzi, M., Riva, A, 1995 “Exploiting neural computing. A valuable tool for today’s data interpretation needs.” Proc. of hit. Conf. on Art. Intelligence in the Petroleum Industry., Paper 22.
Georgi, D.T., 1985 “Geometrical aspects of borehole Televiewer images”., SPWLA Annual Logging Symposium, 27th, Dallas, Transaction l-C, Reprinted in Paillet et al. op. cit.
Gonfalini, M., Anxiomtaz, H., 1990, “A complete use of structural information from borehole imaging techniques: a case study for a deep carbonate reservoir. SPWLA 3 1st Annual Logging Symposium, La Fayette.
Hall, J., Scandella, L., 1995, “Estimation of critical formation evaluation parameters using techniques of neurocomputing.“, SPWLA Annual Logging Symposium, 36th, Paper ‘PPP’. Paris.
Harris, D.A., Lewis, J.J.M., Wallace, D. J., 1993, “The identification of lithofacies types in geological imagery using neural networks”, Proc. Eurocaipep, Aberdeen. Paper “ 1”.
Ingber, L., 1993 “Adaptive simulated annealing (AS A)“, Lester Ingber Research, McLean VA.. (ftp.alumni.caltech.edu:, pub/ingber/ASA-shar, ASA- shar.2, ASA.tar.Z, ASA.tar.gz, ASA.zip).
8
SPWLA 37th Annual Logging Symposium, June 16-19,1996
- Johnson. M.R., 1989, “Palaeogeographic significance of oriented calcareous concretions in the Triassic Katberg Formation, South Africa”. Jour. Sed. Pet., Vol. 69, No.6, pp. 1008-1010.
McBride. E.M., Picard, M.D., Folk, R.L., 1994, “Oriented concretions, Ionian Coast, Italy: Evidence of groundwater flow direction”. Jour. Sed. Pet.,Vol. A64, No.3, pp. 535-540.
Mozley, P.S., Davis. J.M., 1996 “Relationship between oriented calcite concretions and permeability correlation structure in an alluvial aquifer, Sierra Ladrones Formation, New Mexico”, Jour. Sed. Res. Vol. 66. Nol. pp. 11-16.
Mullins, J.E., 1966, “Stereoscopic deep well photo- graphy in opaque fluids: SPWLA Symposium, 7th, Tulsa Okla., Reprinted in Paillet et al. op. cit.
Paillet. F.A. 1990, Barton, C., Luthi, S., Rambow, F., Zemanek,J.: Editors, “SPWLA Reprint Series Borehole Imaging”.
Peckingpaugh. S.H., 1991 “An improved method of computing gray level cooccurrence matrix based texture measures”, Graphical Models and Image Processing, No.6.
a) Original Image
d) Spatial Filter e) Edge Detection
Pirrie, D., 1987, “Oriented calcareous concretions from James Ross Island Antartica”. BrAntarct. Surv. Bull. No.75 . pp. 41-50
Sarle, W.S.. 1994,“Neural networks and statistical models”, Proc. of 19th Ammal SAS Users Group International Conference.
Serra, J., “Image analysis and mathematical morphology”, Academic Press Inc., London. 1982
Schlumberger, 1985, W.E.C. Italia. Styblinsky, M.A., Tang, T.S.. 1990, “Experiments in
nonconvex optimisation stochastic approximation with function smoothing and simulated annealing”, Neural Networks. Vol. 3.. No. 4, pp. 467-483.
Ueda, N., Nakao, R., 1994 “A new competetive learning approach based on an equidistortion principle for designing optimal vector quantisers”, Neural Networks, Vol. 7, No. 8., pp.1211-1227.
Won& S. A., Startzman, R. A., and Kuo,T-B, 1989, “Enhancing borehole image data on a high-resolution PC”, Society of Petroleum Engineers Petroleum Computer Conference, June 26-28 SPE Paper 19124, reprinted in Paillet et al. op. cit.
b) Undersampling at 1:9, Optional
c) Binarisation
ccc
Figure 1. Detecting Planar Events using the Hough Transform.
9
SPWLA 37th Annual Logging Symposium, June M-19,1996
Image Azimuth (deg).
Figure 3. Hough transforms applied to core photographs. In this Figure 2. Discretisation of search space application a fixed threshold for binarisation is used and for identification of planar events using mathematical mophology is used to lessen the impact of vertical Hough. orientation scribe marks and core plug holes, when present.
Figure 4. Ellipsoids: The forward model, various ellipsoids mapped onto a cylinder 1) cigar with a=4b-4c-2 rfidii, 2) as before with translation, 3 lensoid with a=b=lOc-5 ,radii ,4) lensoid with a=b=4c-2 radii ,5) as before with rotation.
10
SPWLA 37th Annual Logging Symposium, June 16-19,1996 I
-
0.7
b);*; l
0+4
0+3
02
061
a) 0 -0,l
Ellipsoid long axis orientations
Regional N palaeocurrent
Figure 5. Concretionary nodules on an exposed bedding plane,James Ross Island, Antarctica (scale bar 15cm) Ellipsoid orientation on this exposure surface is broadly parallel to the regional longshore palaeocurrent trend. Pirrie 1987 Reproduced Courtesy of British Antartic Survey.
cost function -
b) cl d) ______a-- ,.....____________ . . . . ..______..._~- /'
i
4 d
. . /---' ..__.?c . . . . . . . . . . . . . . ..__.................. _.. ___
1 IO ,
100 1000 10000 100000 le+06 Number of iterations (logarithmic scale)
Figure 6. The inverse model. Using simulated annealing in discretised space the optimal object fitting the image is obtained. Objects selected at: a) 0 iterations, b) 67,000 iterations, c) 132,000 iterations and d) 265,000 interations. Object dimensions; axes a,b, 8.9 ems, rotation axis 28 ems, DIP 4.0 deg., AZIM 270 deg.
N S
a b d
Figure 7. Ellipsoids: The inverse model; a) original image, b) space filling of FM1 stripis, c) optimum object found, d) Overlay of object on image with sections for cost function plots below. ccc
-8.4 - - -8.4 -
Fiiure 8 ~Ellipsoids: Cos; fun&n. The ideal obiect fouid has been moied ovei the im\ge in the 6
directions y-y’ and x-x’ with all size and rotation parameters fixed, to demonstrate non-convexity arising from object irregularity and image noise.
11
Related Documents