■ ■ The default decisions made by plan sponsors under automatic enrollment have a powerful influence on participant saving and investment behavior. Among new hires, participation rates more than double to 91% under automatic enrollment compared with 42% under voluntary enrollment. Over time, 8 in 10 participants increase contribution rates, either automatically or on their own, while 7 in 10 participants remain exclusively invested in the default investment fund. ■ ■ Sponsors can use the inertia inherent in participant retirement savings decisions to improve retirement outcomes in defined contribution (DC) plans. Strategies include increasing minimum default contribution rates, including an automatic increase feature with a cap of at least 10%, and “sweeping” eligible nonparticipants into the default design periodically. Jeffrey W. Clark, Stephen P. Utkus, Jean A. Young Vanguard Research January 2015 Automatic enrollment: The power of the default

Welcome message from author
This document is posted to help you gain knowledge. Please leave a comment to let me know what you think about it! Share it to your friends and learn new things together.
Transcript

■■ The default decisions made by plan sponsors under automatic enrollment have a powerful influence on participant saving and investment behavior. Among new hires, participation rates more than double to 91% under automatic enrollment compared with 42% under voluntary enrollment. Over time, 8 in 10 participants increase contribution rates, either automatically or on their own, while 7 in 10 participants remain exclusively invested in the default investment fund.
■■ Sponsors can use the inertia inherent in participant retirement savings decisions to improve retirement outcomes in defined contribution (DC) plans. Strategies include increasing minimum default contribution rates, including an automatic increase feature with a cap of at least 10%, and “sweeping” eligible nonparticipants into the default design periodically.
Jeffrey W. Clark, Stephen P. Utkus, Jean A. Young
The buck stops here: Vanguard money market funds
Vanguard Research January 2015
Automatic enrollment: The power of the default

1 We are examining a subset of the 3.4 million participants on our platform in plans for which we have completed compliance testing in 2010, 2011, and 2012. In addition, we limit our sample to those plans where we also provide payroll deferral rate tracking.
2
Introduction
Automatic enrollment is now a well-known strategy by which eligible employees are automatically enrolled in a DC plan at a given contribution rate, with the right to opt out of the arrangement at any time. Automatic enrollment is emerging as a pivotal strategy to improve retirement outcomes in DC plans in the United States and around the world.
In this report, we provide updated statistics drawn from Vanguard recordkeeping data of the effects of automatic enrollment on participants’ saving and investing behaviors. Our study is based on more than 500,000 eligible newly hired employees in 460 plans (Figure 1). Our data sample consists of newly eligible employees who were hired between January 1, 2010, and December 31, 2012, and who were still employed by the plan sponsor as of June 30, 2013.1 The maximum time period of our analysis thus spans 42 months or 3½ years.
We examine the effects of automatic enrollment on new hires because it is the most common way that the feature is first introduced into DC plans. Participants in the sample are younger, have shorter tenure (an average of about one year), and have median account balances of generally less than $4,000. Our sample includes automatic enrollment plans with no annual increase feature and those with such a feature. The automatic enrollment plans with an annual increase feature have participants with generally lower wages and account balances than the participants in voluntary enrollment plans or in automatic enrollment plans with no increase feature.
Among all plans with an automatic enrollment feature in our sample, 8 in 10 plans specifically have implemented automatic enrollment with annual increases and 2 in 10 plans have no automatic increases (Figure 2). However, three-quarters of these latter plans permit participants to voluntarily sign up for annual increases. All of the plans in our sample selected a balanced investment strategy as the default investment, with 97% choosing target-date funds.
Figure 1. Study sample As of June 30, 2013
Automatic enrollment plans
Voluntary enrollment plans
With an annual increase
With no annual increase
All
Total
Number of plans 201 204 55 259 460
Number of eligible employees hired between January 1, 2010, and December 31, 2012
284,390
182,700
46,963
229,663
514,053
Number of eligible employees hired between January 1, 2010, and December 31, 2012, and active as of June 30, 2013
176,683
110,582
29,285
139,867
316,550
Participation rate 42% 92% 87% 91% 63%
Participant demographic characteristics
Median participant account balance $3,792 $2,226 $4,133 $2,500 $2,866
Median employee income $41,449 $42,288 $57,470 $45,202 $43,269
Median employee age 33.2 34.9 36.0 35.2 34.0
Median employee tenure 1.1 1.0 1.0 1.0 1.0
Percentage male 65% 66% 64% 66% 65%
Source: Vanguard, 2014.

3
Figure 2. Automatic enrollment plan features As of December 31, 2012
Automatic enrollment plans
With an annual increase
With no annual increase
All
Number of plans 204 55 259
Default percentage for automatic enrollment
1 percent 0% 7% 2%
2 percent 9 9 9
3 percent 62 35 56
4 percent 12 5 11
5 percent 7 11 7
6 percent 10 31 15
7 percent 0 2 0
Total 100% 100% 100%
Default for automatic increases
1 percent 99%
2 percent 1
Voluntary election 76%
Feature not available 24
Total 100% 100%
Default fund
Target-date fund 96% 100% 97%
Other balanced fund 4 0 3
Total 100% 100% 100%
Automatic enrollment plan implementation
New hires only 50% 58% 51%
Swept all nonparticipants 50 42 49
Total 100% 100% 100%
Eligibility for elective employee contributions
Immediate 77% 78% 77%
1 month 7 7 7
2–3 months 11 13 11
4–6 months 3 2 3
1 year 2 0 2
Total 100% 100% 100%
Eligibility for employer match Number of plans with employer match
185
51
236
Immediate 64% 61% 63%
1 month 5 6 6
2–3 months 11 10 11
4–6 months 6 4 5
1 year 14 19 15
Total 100% 100% 100%
Source: Vanguard, 2014.
4
Percentage of plans Percentage of participants
1% 1% 1% 1% 2% 1% 2% 1% 1% 2% 2%
20%
3%
42%
10%
<0.5% <0.5% 1% 1% 1% <0.5%
16%
4%
60%
5% 5% 8% 8%
0%
70%
4% 5% 6% 7% 8% 9% 10% 12% 15% 18% 20% 25% 100% No cap
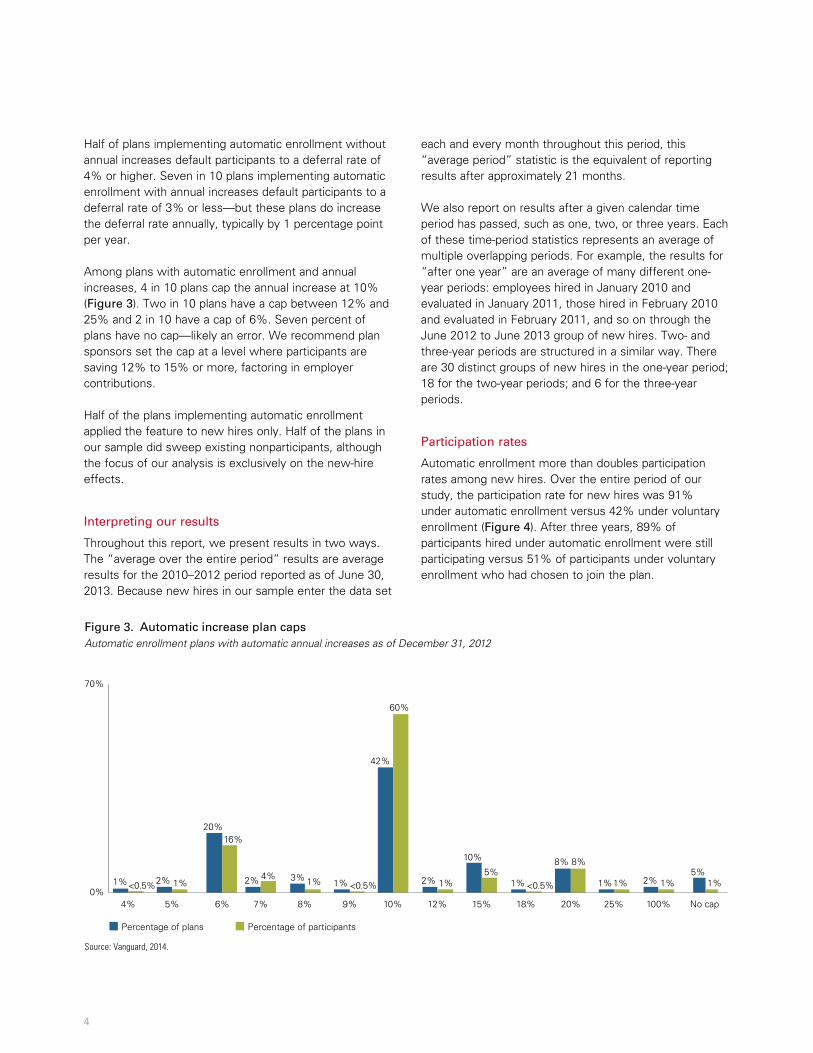
Figure 3. Automatic increase plan capsAutomatic enrollment plans with automatic annual increases as of December 31, 2012
Source: Vanguard, 2014.
Half of plans implementing automatic enrollment without annual increases default participants to a deferral rate of 4% or higher. Seven in 10 plans implementing automatic enrollment with annual increases default participants to a deferral rate of 3% or less—but these plans do increase the deferral rate annually, typically by 1 percentage point per year.
Among plans with automatic enrollment and annual increases, 4 in 10 plans cap the annual increase at 10% (Figure 3). Two in 10 plans have a cap between 12% and 25% and 2 in 10 have a cap of 6%. Seven percent of plans have no cap—likely an error. We recommend plan sponsors set the cap at a level where participants are saving 12% to 15% or more, factoring in employer contributions.
Half of the plans implementing automatic enrollment applied the feature to new hires only. Half of the plans in our sample did sweep existing nonparticipants, although the focus of our analysis is exclusively on the new-hire effects.
Interpreting our results
Throughout this report, we present results in two ways. The “average over the entire period” results are average results for the 2010–2012 period reported as of June 30, 2013. Because new hires in our sample enter the data set
each and every month throughout this period, this “average period” statistic is the equivalent of reporting results after approximately 21 months.
We also report on results after a given calendar time period has passed, such as one, two, or three years. Each of these time-period statistics represents an average of multiple overlapping periods. For example, the results for “after one year” are an average of many different one-year periods: employees hired in January 2010 and evaluated in January 2011, those hired in February 2010 and evaluated in February 2011, and so on through the June 2012 to June 2013 group of new hires. Two- and three-year periods are structured in a similar way. There are 30 distinct groups of new hires in the one-year period; 18 for the two-year periods; and 6 for the three-year periods.
Participation rates
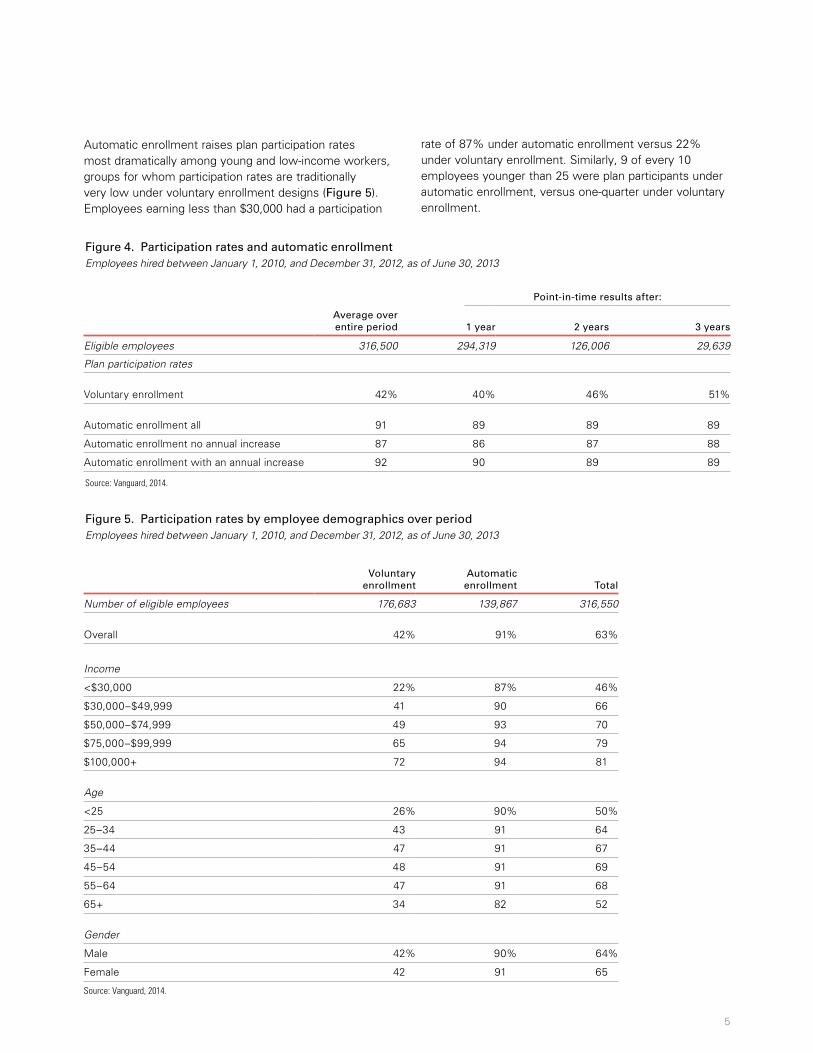
Automatic enrollment more than doubles participation rates among new hires. Over the entire period of our study, the participation rate for new hires was 91% under automatic enrollment versus 42% under voluntary enrollment (Figure 4). After three years, 89% of participants hired under automatic enrollment were still participating versus 51% of participants under voluntary enrollment who had chosen to join the plan.
5
Automatic enrollment raises plan participation rates most dramatically among young and low-income workers, groups for whom participation rates are traditionally very low under voluntary enrollment designs (Figure 5). Employees earning less than $30,000 had a participation
rate of 87% under automatic enrollment versus 22% under voluntary enrollment. Similarly, 9 of every 10 employees younger than 25 were plan participants under automatic enrollment, versus one-quarter under voluntary enrollment.
Figure 5. Participation rates by employee demographics over period Employees hired between January 1, 2010, and December 31, 2012, as of June 30, 2013
Voluntary
enrollment
Automatic
enrollment
Total
Number of eligible employees 176,683 139,867 316,550
Overall 42% 91% 63%
Income
<$30,000 22% 87% 46%
$30,000–$49,999 41 90 66
$50,000–$74,999 49 93 70
$75,000–$99,999 65 94 79
$100,000+ 72 94 81
Age
<25 26% 90% 50%
25–34 43 91 64
35–44 47 91 67
45–54 48 91 69
55–64 47 91 68
65+ 34 82 52
Gender
Male 42% 90% 64%
Female 42 91 65
Source: Vanguard, 2014.
Figure 4. Participation rates and automatic enrollment Employees hired between January 1, 2010, and December 31, 2012, as of June 30, 2013
Point-in-time results after:
Average over entire period
1 year
2 years
3 years
Eligible employees 316,500 294,319 126,006 29,639
Plan participation rates
Voluntary enrollment 42% 40% 46% 51%
Automatic enrollment all 91 89 89 89
Automatic enrollment no annual increase 87 86 87 88
Automatic enrollment with an annual increase 92 90 89 89
Source: Vanguard, 2014.
6
Although the effects are strongest for these demographic groups, even the affluent benefit from automatic enrollment. Among those earning more than $100,000 a year, new-hire participation rates are also higher under automatic enrollment than voluntary enrollment.
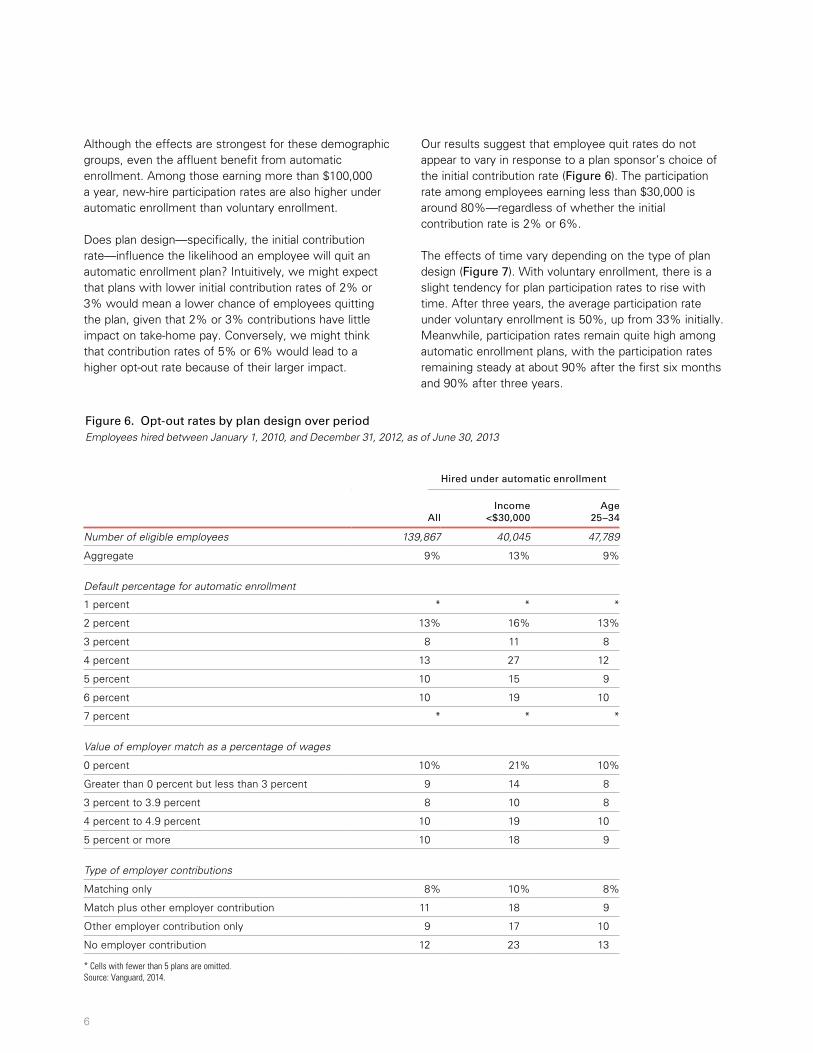
Does plan design—specifically, the initial contribution rate—influence the likelihood an employee will quit an automatic enrollment plan? Intuitively, we might expect that plans with lower initial contribution rates of 2% or 3% would mean a lower chance of employees quitting the plan, given that 2% or 3% contributions have little impact on take-home pay. Conversely, we might think that contribution rates of 5% or 6% would lead to a higher opt-out rate because of their larger impact.
Our results suggest that employee quit rates do not appear to vary in response to a plan sponsor’s choice of the initial contribution rate (Figure 6). The participation rate among employees earning less than $30,000 is around 80%—regardless of whether the initial contribution rate is 2% or 6%.
The effects of time vary depending on the type of plan design (Figure 7). With voluntary enrollment, there is a slight tendency for plan participation rates to rise with time. After three years, the average participation rate under voluntary enrollment is 50%, up from 33% initially. Meanwhile, participation rates remain quite high among automatic enrollment plans, with the participation rates remaining steady at about 90% after the first six months and 90% after three years.
Figure 6. Opt-out rates by plan design over period Employees hired between January 1, 2010, and December 31, 2012, as of June 30, 2013
Hired under automatic enrollment
All
Income
<$30,000
Age
25–34
Number of eligible employees 139,867 40,045 47,789
Aggregate 9% 13% 9%
Default percentage for automatic enrollment
1 percent * * *
2 percent 13% 16% 13%
3 percent 8 11 8
4 percent 13 27 12
5 percent 10 15 9
6 percent 10 19 10
7 percent * * *
Value of employer match as a percentage of wages
0 percent 10% 21% 10%
Greater than 0 percent but less than 3 percent 9 14 8
3 percent to 3.9 percent 8 10 8
4 percent to 4.9 percent 10 19 10
5 percent or more 10 18 9
Type of employer contributions
Matching only 8% 10% 8%
Match plus other employer contribution 11 18 9
Other employer contribution only 9 17 10
No employer contribution 12 23 13
* Cells with fewer than 5 plans are omitted. Source: Vanguard, 2014.

7
Figure 7. Participation rates over timeEmployees hired between January 1, 2010, and December 31, 2012, as of June 30, 2013
A. Voluntary enrollment
B. Automatic enrollment all
33%42% 40% 40%45% 43%
50%
67%58% 60% 55% 57%
50%60%
Perc
enta
ge o
f em
ploy
ees
Perc
enta
ge o
f em
ploy
ees
0%
100%
7–12 monthsn=51,029
13–18 monthsn=37,550
19–24 monthsn=36,909
25–30 monthsn=24,935
31–36 monthsn=20,955
37–42 monthsn=15,025
Totaln=186,403
Number of months from hire or eligibility date
Participating Not participating
Participating Opting out
91% 91% 91% 91%90% 90% 90%
9% 9% 9% 9% 10% 10% 10%
0%
100%
7–12 monthsn=39,730
13–18 monthsn=41,327
19–24 monthsn=40,466
25–30 monthsn=39,122
31–36 monthsn=37,844
37–42 monthsn=31,171
Totaln=284,390
Number of months from hire or eligibility date
Source: Vanguard, 2014.
8
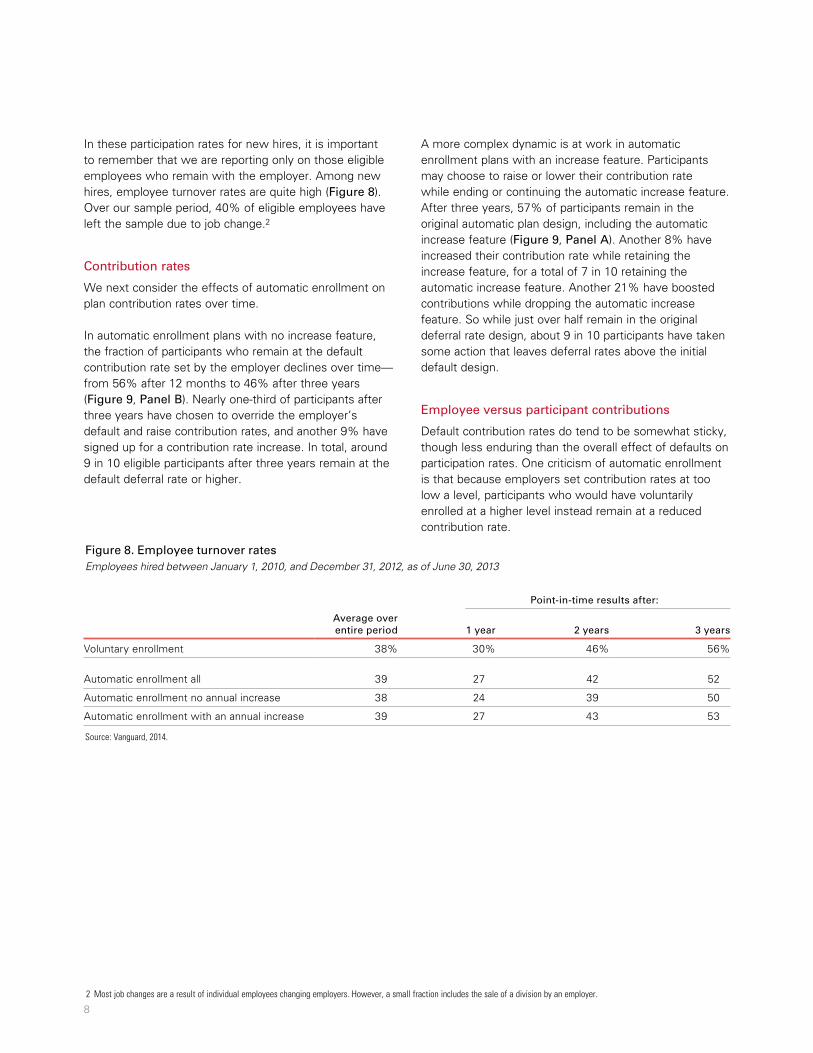
In these participation rates for new hires, it is important to remember that we are reporting only on those eligible employees who remain with the employer. Among new hires, employee turnover rates are quite high (Figure 8). Over our sample period, 40% of eligible employees have left the sample due to job change.2
Contribution rates
We next consider the effects of automatic enrollment on plan contribution rates over time.
In automatic enrollment plans with no increase feature, the fraction of participants who remain at the default contribution rate set by the employer declines over time—from 56% after 12 months to 46% after three years (Figure 9, Panel B). Nearly one-third of participants after three years have chosen to override the employer’s default and raise contribution rates, and another 9% have signed up for a contribution rate increase. In total, around 9 in 10 eligible participants after three years remain at the default deferral rate or higher.
A more complex dynamic is at work in automatic enrollment plans with an increase feature. Participants may choose to raise or lower their contribution rate while ending or continuing the automatic increase feature. After three years, 57% of participants remain in the original automatic plan design, including the automatic increase feature (Figure 9, Panel A). Another 8% have increased their contribution rate while retaining the increase feature, for a total of 7 in 10 retaining the automatic increase feature. Another 21% have boosted contributions while dropping the automatic increase feature. So while just over half remain in the original deferral rate design, about 9 in 10 participants have taken some action that leaves deferral rates above the initial default design.
Employee versus participant contributions
Default contribution rates do tend to be somewhat sticky, though less enduring than the overall effect of defaults on participation rates. One criticism of automatic enrollment is that because employers set contribution rates at too low a level, participants who would have voluntarily enrolled at a higher level instead remain at a reduced contribution rate.
2 Most job changes are a result of individual employees changing employers. However, a small fraction includes the sale of a division by an employer.
Figure 8. Employee turnover rates Employees hired between January 1, 2010, and December 31, 2012, as of June 30, 2013
Point-in-time results after:
Average over entire period
1 year
2 years
3 years
Voluntary enrollment 38% 30% 46% 56%
Automatic enrollment all 39 27 42 52
Automatic enrollment no annual increase 38 24 39 50
Automatic enrollment with an annual increase 39 27 43 53
Source: Vanguard, 2014.

9
Figure 9. Participant contribution rates under automatic enrollment over timeParticipants hired between January 1, 2010, and December 31, 2012, as of June 30, 2013
Panel A. Automatic enrollment with an annual increasen=101,448
Panel B. Automatic enrollment with no annual increasen=25,527
Perc
enta
ge o
f pa
rtic
ipan
ts
Number of months from hire date
69% 66% 64% 62% 59% 57%
10% 10% 11% 10% 10% 8%
12% 15% 15% 18% 19% 21%
3% 3% 3% 4% 6% 7% 6% 6% 7% 7% 6% 7%
0%
100%
7–12 monthsn=25,739
13–18 monthsn=22,447
19–24 monthsn=19,356
25–30 monthsn=16,628
31–36 monthsn=14,750
37–42 monthsn=11,662
Remained at default saving rate with annual increase
Increased saving rate and retained annual increase
Increased saving rate and dropped annual increase
Remained at default saving rate and dropped annual increase
Lowered saving rate and dropped annual increase
Perc
enta
ge o
f pa
rtic
ipan
ts
Number of months from hire date
Remained at default saving rate Increased saving rate and elected annual increase
Increased saving rate Lowered saving rate
60% 56% 52%45% 47% 46%
5% 7%8%
8% 7% 9%
24% 26% 29%34% 31% 32%
11%11% 11% 12% 15% 13%
0%
100%
7–12 monthsn=5,747
13–18 monthsn=5,570
19–24 monthsn=5,710
25–30 monthsn=5,585
31–36 monthsn=3,952
37–42 monthsn=2,721
Source: Vanguard, 2014.

10
While this may be true for individual participants, in the aggregate, automatic enrollment still raises total contribution levels. In our sample, it is true that the average participant contribution rate for new hires in voluntary plans is higher, at 6.3%, than the 5.4% rate for those in automatic enrollment plans (Figure 10). However, we also calculate contribution rates for the eligible employee population—which includes both the contributing participants as well as the nonparticipants contributing at 0%. When these zero-contributing employees are included, voluntary enrollment yields
much lower contribution rates than automatic enrollment—2.6% versus 5.0% over the three- year period.
Over time, contribution rates rise among voluntary enrollment participants and participants automatically enrolled with an automatic increase (Figure 11). The same is true of the entire employee population, including zero-contributors. Most notable is the fact that among all eligible employees, automatic enrollment plus an automatic increase feature leads to higher employee contributions over time.
Figure 10. Contribution rates and automatic enrollment Employees hired between January 1, 2010, and December 31, 2012, as of June 30, 2013
Point-in-time results after:
Average over entire period
1 year
2 years
3 years
Annual increase feature
n= 105,508 97,369 43,711 10,690
Remained in annual increase feature with no changes
62%
68%
62%
57%
Remained in annual increase feature with an increase in deferral rate
12
12
12
12
Remained in annual increase feature with a decrease in deferral rate
3
4
4
3
Opted out with an increase in contribution rate 15 12 16 19
Opted out with no contribution rate changes 5 2 3 5
Opted out with a decrease in contribution rate 3 2 3 4
Average participant contribution rates
n= 200,602 185,876 84,964 20,662
Voluntary enrollment 6.3% 6.2% 6.7% 7.0%
Automatic enrollment all 5.4 4.9 5.7 6.3
Automatic enrollment no increase 5.4 5.2 5.5 5.5
Automatic enrollment with an increase 5.4 4.9 5.8 6.5
Average employee contribution rates
n= 316,550 294,290 126,010 29,640
Voluntary enrollment 2.6% 2.5% 3.1% 3.6%
Automatic enrollment all 5.0 4.4 5.1 5.6
Automatic enrollment no increase 4.8 4.4 4.8 4.9
Automatic enrollment with an increase 5.1 4.3 5.1 5.8
Source: Vanguard, 2014.

11
Figure 11. Employee average contribution rates over timeEmployees hired between January 1, 2010, and December 31, 2012, as of June 30, 2013
Panel A. Plan participants
Voluntary enrollment plan design (n=73,587)
Automatic enrollment with an annual increase (n=101,488)
Automatic enrollment with no annual increase (n=25,527)
5.7% 5.9%6.3% 6.5% 6.8% 6.9%
6.3%
4.7%5.1%
5.9%5.9% 6.0%6.4%
5.4%5.4%5.0%
5.4% 5.4%5.5% 5.3% 5.5%
0.0%
10.0%
7–12 months 13–18 months 19–24 months 25–30 months 31–36 months 37–42 months Total
Ave
rage
par
ticip
ant
defe
rral
rat
e
Number of months from hire date
Panel B. Eligible employees
Voluntary enrollment plan design (n=176,683)
Automatic enrollment with an annual increase (n=110,579)
Automatic enrollment with no annual increase (n=29,288)
7–12 months 13–18 months 19–24 months 25–30 months 31–36 months 37–42 months Total
Number of months from hire date
1.9%2.5% 2.6% 2.6%
3.1% 3.1%3.7%
4.3% 4.3%4.8% 5.0%
5.5% 5.5% 5.9%5.1%4.7% 4.7% 4.6%
5.3%4.9% 4.8%
0.0%
10.0%
Ave
rage
em
ploy
ee d
efer
ral r
ate
Source: Vanguard, 2014.

12
Default investment fund
We turn finally to the impact of automatic enrollment on investment behavior. Averaged over our entire study period, participants in automatic enrollment plans are up to three times more likely to remain in the default investment option designated by the employer—78% of participants under automatic enrollment remain 100% invested in the default option versus 27% of participants under voluntary enrollment who happen to have chosen to invest their entire account in the designated default (Figure 12).
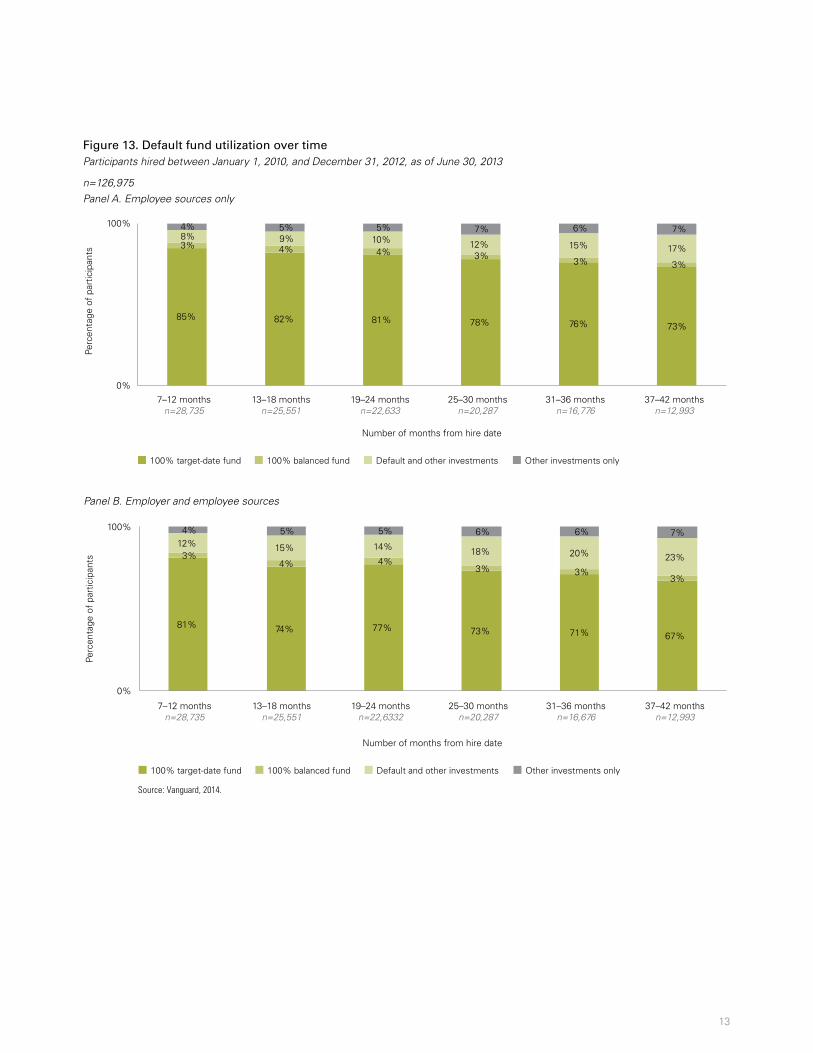
The effects are sticky over time. After three years, about 8 in 10 participants are still directing 100% of their contributions to the default investment option and another 15% are using the default investment in combination with other plan investment options (Figure 13, Panel A).
Figure 12. Default fund option and automatic enrollment Employees hired between January 1, 2010, and December 31, 2012, as of June 30, 2013
Employee elective sources only
Point-in-time results after:
Average over entire period
1 year
2 years
3 years
n = 200,602 185,876 84,964 20,662
Voluntary enrollment
100% in default option 26% 23% 25% 27%
Automatic enrollment
100% in default option 84% 86% 82% 78%
Partial investment in default option 11 9 12 15
100% opt out of default option 5 5 6 7
Source: Vanguard, 2014.
13
Figure 13. Default fund utilization over timeParticipants hired between January 1, 2010, and December 31, 2012, as of June 30, 2013
n=126,975Panel A. Employee sources only
Number of months from hire date
7–12 monthsn=28,735
13–18 monthsn=25,551
19–24 monthsn=22,633
25–30 monthsn=20,287
31–36 monthsn=16,776
37–42 monthsn=12,993
100% target-date fund 100% balanced fund Default and other investments Other investments only
85% 82% 81% 78% 76% 73%
3%3% 3% 3%
4% 4%
8% 9% 10% 12% 15% 17%
4% 5% 5% 7% 6% 7%
0%
100%
Perc
enta
ge o
f pa
rtic
ipan
ts
Panel B. Employer and employee sources
Number of months from hire date
7–12 monthsn=28,735
13–18 monthsn=25,551
19–24 monthsn=22,6332
25–30 monthsn=20,287
31–36 monthsn=16,676
37–42 monthsn=12,993
100% target-date fund 100% balanced fund Default and other investments Other investments only
81% 74% 77% 73% 71% 67%
3%4% 4%
3% 3%3%
12% 15% 14% 18% 20% 23%
4% 5% 5% 6% 6% 7%
0%
100%
Perc
enta
ge o
f pa
rtic
ipan
ts
Source: Vanguard, 2014.

14
Implications
Automatic enrollment has emerged as a pivotal strategy to improve plan participation and employee saving rates in 401(k) and other DC retirement plans. Our analysis suggests that the default effect on participation rates is the strongest, with 9 in 10 automatically enrolled new hires remaining in their employer plan after three years. The default effect on portfolio choice is not quite as strong, with 8 in 10 participants contributing exclusively to the default option after three years and another 15% contributing to the default and other plan investment options. The default effect for an automatic increase feature (in plans offering the feature) is somewhat weaker as well. After three years, about 7 in 10 eligible participants remain in the automatic escalation default, although a sizable minority has raised contribution rates while ending the automatic increase feature.
Automatic enrollment raises the minimum or “floor” contribution rate in a DC plan, by replacing zero-contributors with participants saving generally at 3% or higher. Sponsors can seek to improve retirement outcomes through automatic enrollment combined with higher initial contribution rates, an automatic increase feature, and a total participant contribution cap of at least 10%.
Another important way to improve outcomes is to extend the automatic enrollment design from new hires only to all eligible nonparticipants. About half of the plans in our sample already “sweep” eligible nonparticipants today.
This analysis underscores the importance of plan design defaults, the role of inertia in retirement savings decisions, and the impact of employer plan design decisions on retirement adequacy among DC plan participants. All things being equal, stronger default designs will contribute to improved retirement outcomes because of the effect of inertia. Sponsors should seek to take advantage of this behavioral bias when designing their DC retirement programs.

15
Blank page

© 2015 The Vanguard Group, Inc. All rights reserved. Vanguard Marketing Corporation, Distributor.
CRRATEP 012015
Vanguard Research
P.O. Box 2900 Valley Forge, PA 19482-2900
Connect with Vanguard® > institutional.vanguard.com
Vanguard research > Vanguard Center for Retirement Research Vanguard Investment Strategy Group
For more information about Vanguard funds, visit institutional.vanguard.com or call 800-523-1036 to obtain a prospectus. Investment objectives, risks, charges, expenses, and other important information about a fund are contained in the prospectus; read and consider it carefully before investing.
Investments in target-date funds are subject to the risks of their underlying funds. The year in the fund name refers to the approximate year (the target date) when an investor in the fund would retire and leave the workforce. The fund will gradually shift its emphasis from more aggressive investments to more conservative ones based on its target date. An investment in the target-date fund is not guaranteed at any time, including on or after the target date.
All investing is subject to risk, including the possible loss of the money you invest.
Related Documents