Automatic Classification of hybrid Power Quality Disturbances using Wavelet Norm Entropy and Neural Network S. KHOKHAR, a,b, *, A.A. MOHD ZIN a , A. S. MOKHTAR a , a Faculty of Electrical Engineering, Universiti Teknologi Malaysis, Malaysia b Department of Electrical Engineering, QUEST, Nawabshah Sindh Pakistan *[email protected], +60167904014 1. Introduction The power quality analysis has recently become a serious concern for both electric power utilities and their customers. In electrical power system, the PQ disturbances are produced due to a number of causes such as non-linear loads, switching devices, lightning strokes and electromagnetic transients. The disturbances can cause harmful effects to customers’ equipment and utilities as well. Hence, it is important to detect and classify the disturbance automatically in an efficient way. The line faults in the transmission and distribution systems, increasing number of non-linear loads, solid-state switching devices and electronic data processing equipment are the major consequences of the PQ disturbances in electrical power network [1]. The PQ disturbances are the deviations in the voltage and current waveforms from the ideal sinusoidal waveform such as short and long duration disturbances, steady-state waveform distortions and transient disturbances. These disturbances can cause variation in utility service voltage or current, such as voltage sag, voltage swell, interruption, harmonics, flicker and transients, which can result in malfunction of sophisticated electronic equipment [2]. In order to take appropriate mitigating action against PQ disturbances, their sources and causes must be identified accurately. Since due to the lack of research in the fields of signal processing and artificial intelligence techniques, the monitoring systems were usually based on manual detection of PQ disturbances waveforms which may involve high cost, time consumption and manpower [3]. The utility engineers may not be able to inspect a huge data. Hence to overcome this problem many researchers proposed that PQ disturbances must be detected and classified in automatic and systematic way. In the technical literature, various signal processing techniques such as time-frequency transformation are used for analyzing PQ disturbances. The most commonly used signal processing methods for feature extraction of PQ disturbances are discrete Fourier transform (DFT), short-time Fourier transform (STFT), Stockwell transform (ST), wavelet transform (WT), Hilbert- Huang transform. Conventionally, The DFT [4] has been initiated the most efficient technique for steady-state WSEAS TRANSACTIONS on POWER SYSTEMS S. Khokhar, A. A. Mohd Zin, A. S. Mokhtar E-ISSN: 2224-350X 163 Volume 13, 2018 Keywords: Power Quality Disturbances, Wavelet Norm Entropy, multiresolution analysis, Feature Extraction, Artificial Neural Network Abstract:- The classification of single and multiple power quality (PQ) disturbances is a very important task for the detection and monitoring of various faults and events in electrical power network.This paper presents an automatic classification algorithm for PQ disturbances based on wavelet norm entropy (WNE) features & probabilistic neural network (PNN) as an effective pattern classifier. The discrete wavelet transform (DWT) based multiresolution analysis (MRA) technique is proposed to extract the most important and constructive features of power quality disturbances at various resolution levels. The distinctive norm entropy features of the PQ disturbances are extracted and are employed as inputs to the PNN. Various other architectures of neu- ral networks such as multilayer perceptron (MLP) and radial basis function (RBF) are also employed for com-parison. The PNN is found the most suitable classification tool for the classification of the PQ disturbances. The simulation results obtained show that the proposed approach can detect and classify the disturbances effectively and can be applied successfully in real-time electrical power distribution networks. , PAKISTAN MALAYSIA

Welcome message from author
This document is posted to help you gain knowledge. Please leave a comment to let me know what you think about it! Share it to your friends and learn new things together.
Transcript

Automatic Classification of hybrid Power Quality Disturbances using
Wavelet Norm Entropy and Neural Network
S. KHOKHAR,a,b,*, A.A. MOHD ZINa, A. S. MOKHTARa,
a Faculty of Electrical Engineering, Universiti Teknologi Malaysis, Malaysia b Department of Electrical Engineering, QUEST, Nawabshah Sindh Pakistan
*[email protected], +60167904014
Abstract:- The classification of single and multiple power quality (PQ) disturbances is a very important task for the detection and monitoring of various faults and events in electrical power network. This paper presents an automatic classification algorithm for PQ disturbances based on wavelet norm entropy (WNE) features and probabilistic neural network (PNN) as an effective pattern classifier. The discrete wavelet transform (DWT) based multiresolution analysis (MRA) technique is proposed to extract the most important and constructive features of power quality disturbances at various resolution levels. The distinctive norm entropy features of the PQ disturbances are extracted and are employed as inputs to the PNN. Various other architectures of neural networks such as multilayer perceptron (MLP) and radial basis function (RBF) are also employed for comparison. The PNN is found the most suitable classification tool for the classification of the PQ disturbances. The simulation results obtained show that the proposed approach can detect and classify the disturbances effectively and can be applied successfully in real-time electrical power distribution networks.
Keywords: Power Quality Disturbances, Wavelet Norm Entropy, multiresolution analysis, Feature Extraction, Artificial Neural Network
1. Introduction The power quality analysis has recently
become a serious concern for both electric power utilities and their customers. In electrical power system, the PQ disturbances are produced due to a number of causes such as non-linear loads, switching devices, lightning strokes and electromagnetic transients. The disturbances can cause harmful effects to customers’ equipment and utilities as well.
Hence, it is important to detect and classify the disturbance automatically in an efficient way. The line faults in the transmission and distribution systems, increasing number of non-linear loads, solid-state switching devices and electronic data processing equipment are the major consequences of the PQ disturbances in electrical power network [1]. The PQ disturbances are the deviations in the voltage and current waveforms from the ideal sinusoidal waveform such as short and long duration disturbances, steady-state waveform distortions and transient disturbances. These disturbances can cause variation in utility service voltage or current, such as voltage sag, voltage swell, interruption, harmonics, flicker and transients, which can result in malfunction
of sophisticated electronic equipment [2]. In order to take appropriate mitigating action against PQ disturbances, their sources and causes must be identified accurately. Since due to the lack of research in the fields of signal processing and artificial intelligence techniques, the monitoring systems were usually based on manual detection of PQ disturbances waveforms which may involve high cost, time consumption and manpower [3]. The utility engineers may not be able to inspect a huge data. Hence to overcome this problem many researchers proposed that PQ disturbances must be detected and classified in automatic and systematic way. In the technical literature, various signal processing techniques such as time-frequency transformation are used for analyzing PQ disturbances. The most commonly used signal processing methods for feature extraction of PQ disturbances are discrete Fourier transform (DFT), short-time Fourier transform (STFT), Stockwell transform (ST), wavelet transform (WT), Hilbert-Huang transform.
Conventionally, The DFT [4] has been initiated the most efficient technique for steady-state
WSEAS TRANSACTIONS on POWER SYSTEMS S. Khokhar, A. A. Mohd Zin, A. S. Mokhtar
E-ISSN: 2224-350X 163 Volume 13, 2018
Abstract:- The classification of single and multiple power quality (PQ) disturbances vis a veryimportant task for the detection and monitoring of various faults and events in electrical powernetwork. This paper presents an automatic classification algorithm for PQ disturbances based onwavelet norm entropy (WNE) features and probabilistic neural network (PNN) as an effectivepattern classifier. The discrete wavelet transform (DWT) based multiresolution analysis (MRA)technique is proposed to extract the most important and constructive features of power qualitydisturbances at various resolution levels. The distinctive norm entropy features of the PQdisturbances are extracted and are employed as inputs to the PNN. Various other architecturesof neural networks such as multilayer perceptron (MLP) and radial basis function (RBF) are alsoemployed for comparison. The PNN is found the most suitable classification tool for theclassification of the PQ disturbances. The simulation results obtained show that the proposedapproach can detect and classify the disturbances effectively and can be applied successfully inreal-time electrical power distribution networks.
Keywords: Power Quality Disturbances, Wavelet Norm Entropy, multiresolution analysis, FeatureExtraction, Artificial Neural Network
Abstract:- The classification of single and multiple power quality (PQ) disturbances is a very important task for the detection and monitoring of various faults and events in electrical power network.This paper presents an automatic classification algorithm for PQ disturbances based on wavelet norm entropy (WNE) features & probabilistic neural network (PNN) as an effective pattern classifier. The discrete wavelet transform (DWT) based multiresolution analysis (MRA) technique is proposed to extract the most important and constructive features of power quality disturbances at various resolution levels. The distinctive norm entropy features of the PQ disturbances are extracted and are employed as inputs to the PNN. Various other architectures of neu-ral networks such as multilayer perceptron (MLP) and radial basis function (RBF) are also employed for com-parison. The PNN is found the most suitable classification tool for the classification of the PQ disturbances. The simulation results obtained show that the proposed approach can detect and classify the disturbances effectively and can be applied successfully in real-time electrical power distribution networks.
, PAKISTAN
MALAYSIA
analysis of PQ disturbances signals and was found more suitable for stationary and periodic types of PQ signals only. However, the drawback of the DFT method is that, it does not provide time-domain information for nonstationary PQ signals. In actual practice most of the PQ disturbances are non-stationary and transient which require a technique that would provide information of frequency contents as well as capture the time of occurrence of the disturbances simultaneously. The STFT [5] provides time and frequency information for a certain length of window. Since each type of PQ disturbances requires window of different length that could create problem in selecting the best suitable window. Thus the STFT is also found inappropriate for the analysis of non-stationary and non-periodic PQ disturbances due to its constant window length. The WT approach has overcome the fixed resolution problems for analyzing non-stationary PQ disturbances.
A brief literature review related to WT is discussed here for further awareness of the proposed technique. Many researchers [6-10] applied WT as a powerful tool for detection, localization and classification of synthetic and actual PQ disturbances. The unique feature extraction methods of various types of PQ disturbances have lead to an automatic classification. Daubechies [6] proposed that WT can handle frequencies in logarithmic rather than linear way, and became more suitable for the analysis of the visual signals than the windowed DFT. Initially, Santoso, et al. [7] proposed WT as a new tool for the automatic classification of PQ events. Poisson, et al. [8] proposed continuous WT (CWT) for the detection and analysis of PQ disturbances. A time-frequency plane of these disturbances was developed by using a recursive algorithm. Gaouda, et al. [11] proposed WT based multiresolution analysis technique to detect and classify various types of PQ disturbances by using standard deviation as a feature extraction technique. Borras, et al. [12] proposed the DWT as the feature extraction technique and combined with learning vector quantization (LVQ) type of ANN. The difference between high-energy components of the disturbance signal and those of the normal signal was used as an input feature vector to train the LVQ neural network. Gaing [13] proposed a WT based PNN classifier for the classification of PQ disturbances. The energy distribution features of the signals at different resolution levels were extracted by using wavelet transform based MRA. The Parseval’s theorem was employed for energy features used as inputs to the PNN classifier for PQ disturbances classification automatically.
In the previous research studies, a lot of work has been carried out on the automatic classification of single and few multiple PQ disturbances. The automatic classification for multiple PQ disturbances is still a challenging task. Most of the authors have considered single PQ disturbances for the classification and only few authors have considered multiple PQ disturbances. Present automatic classification techniques for multiple PQ disturbances need much improvement in terms of their high recognition rate, flexibility and consistency [14]. In [15] authors classified eleven types of PQ disturbances with two types of multiple disturbances with the help of fully informed particle swarm (FIPS) based feature selection from S-transform matrix and classified them by probabilistic neural network. In this paper, fourteen types of PQ disturbances are considered with four types of multiple PQ disturbances. An automatic classification algorithm is proposed for recognizing the single and multiple PQ disturbances based on norm entropy feature extraction by using discrete wavelet transform. The MRA based DWT technique has been employed for the analysis and feature extraction of PQ disturbances. The difference between the norm entropy of the detailed and approximation disturbance signal and that of the pure sinusoidal signals is used as a feature vector for training the PNN classifier. Other architectures of ANN such as multilayer perceptron and radial basis function neural networks have also been used as classifier tools for comparison.
The remaining parts of the paper are organised as follows: Section 2 presents a proposed classification approach. Wavelet transform and multiresolution analysis are discussed in section 3. Feature extraction stage is discussed in section 4. In section 5, introduction of the artificial neural network is presented. Simulation results are discussed in section 6. Finally, conclusions are discussed in section 7.
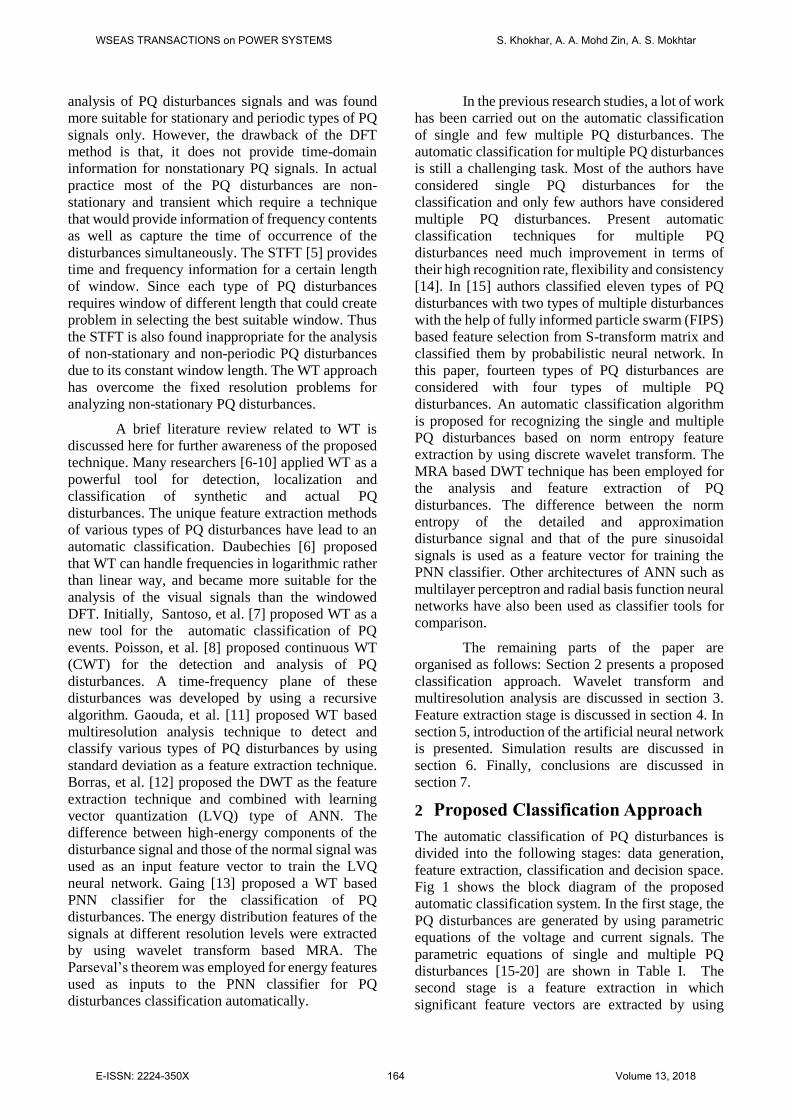
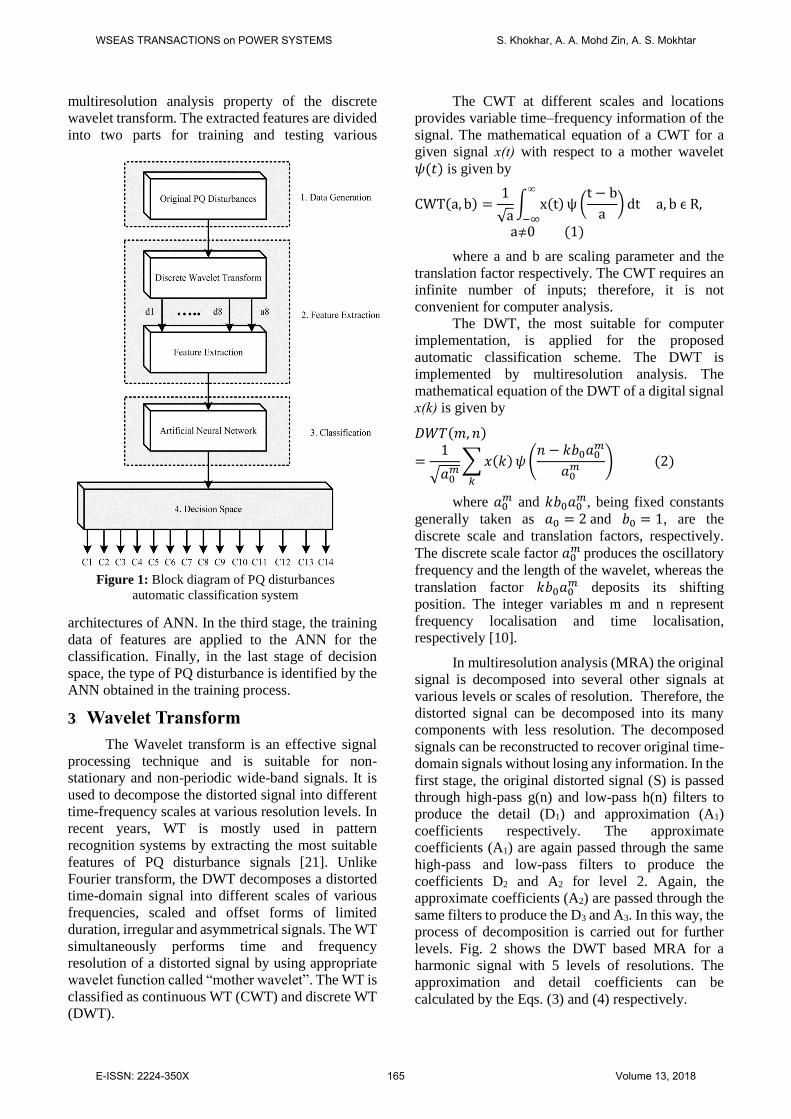
2. Proposed Classification Approach The automatic classification of PQ disturbances is divided into the following stages: data generation, feature extraction, classification and decision space. Fig 1 shows the block diagram of the proposed automatic classification system. In the first stage, the PQ disturbances are generated by using parametric equations of the voltage and current signals. The parametric equations of single and multiple PQ disturbances [15-20] are shown in Table I. The second stage is a feature extraction in which significant feature vectors are extracted by using
WSEAS TRANSACTIONS on POWER SYSTEMS S. Khokhar, A. A. Mohd Zin, A. S. Mokhtar
E-ISSN: 2224-350X 164 Volume 13, 2018
multiresolution analysis property of the discrete wavelet transform. The extracted features are divided into two parts for training and testing various
architectures of ANN. In the third stage, the training data of features are applied to the ANN for the classification. Finally, in the last stage of decision space, the type of PQ disturbance is identified by the ANN obtained in the training process.
3. Wavelet Transform The Wavelet transform is an effective signal
processing technique and is suitable for non-stationary and non-periodic wide-band signals. It is used to decompose the distorted signal into different time-frequency scales at various resolution levels. In recent years, WT is mostly used in pattern recognition systems by extracting the most suitable features of PQ disturbance signals [21]. Unlike Fourier transform, the DWT decomposes a distorted time-domain signal into different scales of various frequencies, scaled and offset forms of limited duration, irregular and asymmetrical signals. The WT simultaneously performs time and frequency resolution of a distorted signal by using appropriate wavelet function called “mother wavelet”. The WT is classified as continuous WT (CWT) and discrete WT (DWT).
The CWT at different scales and locations provides variable time–frequency information of the signal. The mathematical equation of a CWT for a given signal x(t) with respect to a mother wavelet 𝜓(𝑡) is given by
CWT(a, b) =1
√a∫ x(t)
∞
−∞
ψ (t − b
a) dt a, b ϵ R,
a0 (1)
where a and b are scaling parameter and the translation factor respectively. The CWT requires an infinite number of inputs; therefore, it is not convenient for computer analysis.
The DWT, the most suitable for computer implementation, is applied for the proposed automatic classification scheme. The DWT is implemented by multiresolution analysis. The mathematical equation of the DWT of a digital signal x(k) is given by
𝐷𝑊𝑇(𝑚, 𝑛)
=1
√𝑎0𝑚
∑ 𝑥(𝑘)
𝑘
𝜓 (𝑛 − 𝑘𝑏0𝑎0
𝑚
𝑎0𝑚 ) (2)
where 𝑎0𝑚 and 𝑘𝑏0𝑎0
𝑚, being fixed constants generally taken as 𝑎0 = 2 and 𝑏0 = 1, are the discrete scale and translation factors, respectively. The discrete scale factor 𝑎0
𝑚 produces the oscillatory
frequency and the length of the wavelet, whereas the translation factor 𝑘𝑏0𝑎0
𝑚 deposits its shifting position. The integer variables m and n represent frequency localisation and time localisation, respectively [10].
In multiresolution analysis (MRA) the original signal is decomposed into several other signals at various levels or scales of resolution. Therefore, the distorted signal can be decomposed into its many components with less resolution. The decomposed signals can be reconstructed to recover original time-domain signals without losing any information. In the first stage, the original distorted signal (S) is passed through high-pass g(n) and low-pass h(n) filters to produce the detail (D1) and approximation (A1) coefficients respectively. The approximate coefficients (A1) are again passed through the same high-pass and low-pass filters to produce the coefficients D2 and A2 for level 2. Again, the approximate coefficients (A2) are passed through the same filters to produce the D3 and A3. In this way, the process of decomposition is carried out for further levels. Fig. 2 shows the DWT based MRA for a harmonic signal with 5 levels of resolutions. The approximation and detail coefficients can be calculated by the Eqs. (3) and (4) respectively.
Figure 1: Block diagram of PQ disturbances automatic classification system
WSEAS TRANSACTIONS on POWER SYSTEMS S. Khokhar, A. A. Mohd Zin, A. S. Mokhtar
E-ISSN: 2224-350X 165 Volume 13, 2018

𝐴𝑗+1(𝑛) = ∑ ℎ(𝑘 − 2𝑛)
𝑘
𝐴𝑗(𝑘) (3)
𝐷𝑗+1(𝑛) = ∑ 𝑔(𝑘 − 2𝑛)
𝑘
𝐴𝑗(𝑘) (4)
The low-pass filter g(n) is obtained from the scaling function and high-pass filter is obtained from both the wavelet and scaling functions. The wavelet and scaling functions are, respectively, given as
𝜓(𝑛) = √2 ∑ 𝑔(𝑛)𝜙(2𝑛 − 𝑘) (5)
𝑘
𝜙(𝑛) = √2 ∑ ℎ(𝑛)𝜙(2𝑛 − 𝑘) (6)
𝑘
A given signal f(n) is expanded in terms of its orthogonal basis of scaling and wavelet functions. It can be represented by one set of scaling coefficients, and one or more sets of wavelet coefficients, 𝑓(𝑛) = ∑ 𝐴1(𝑘)𝜙(𝑛 − 𝑘)
𝑘
+ ∑ ∑ 𝐷𝑗(𝑛)
𝑗=1𝑘
2−𝑗2𝜓(2𝑗𝑛 − 𝑘) (7)
4. Norm Entropy Features The feature extraction is the key aspect in the classification of the PQ disturbances. The PQ
disturbances data is much larger for training the classifiers. The feature extraction has a significant role in data reduction. Thus, the PQ signals are transformed into a reduced form of wavelet norm entropy features. The detailed and approximation coefficients obtained by MRA of DWT contain effective features of distorted signals. For recognizing the PQ disturbances accurately, it is necessary to choose the most useful features from those coefficients. The entropy is mostly used in many fields such as thermodynamics, mathematics, and information science. It is generally defined as a measure of disorderly states of imbalance and uncertainty. In PQ analysis studies, the entropy is found more suitable especially for the classification of non-stationary signals [22]. Suppose a PQ disturbance signal 𝑆 = {𝑠(𝑖), 𝑖 =1,2, … , 𝑁} The norm entropy (NE) of the ith point in the signal S is given by
𝑁𝐸𝑖 = |𝑠(𝑖)|𝑃 (8)
The norm entropy of the signal S is
𝑁𝐸 = ∑ |𝑠(𝑖)|𝑃
𝑁
𝑖=1
(9)
Figure 2: Decomposition of a signal by Wavelet Transform MRA technique
WSEAS TRANSACTIONS on POWER SYSTEMS S. Khokhar, A. A. Mohd Zin, A. S. Mokhtar
E-ISSN: 2224-350X 166 Volume 13, 2018

The NE for detail and approximation coefficients in each decomposition level is given by
𝑁𝐸𝑑𝑗 =1
𝑁∑|𝑑𝑗[𝑛]|
𝑃 𝑗 = 1,2, … , 𝑙
𝑛
(10)
𝑁𝐸𝑎𝑙 =1
𝑁∑|𝑎𝑙[𝑛]|𝑃 𝑙
𝑛
= 𝑁𝑜. 𝑜𝑓 𝑑𝑒𝑐𝑜𝑚𝑝𝑜𝑠𝑖𝑡𝑖𝑜𝑛 𝑙𝑒𝑣𝑒𝑙𝑠 (11)
P is the power such that 1 ≤ 𝑃 ≤ 2.
The NE for the overall decomposition is
𝑁𝐸𝑠𝑖𝑔 = [𝑁𝐸𝑎𝑙 , 𝑁𝐸𝑑1, 𝑁𝐸𝑑2, 𝑁𝐸𝑑3, … , 𝑁𝐸𝑑𝑙] (12)
The 𝑵𝑬𝒔𝒊𝒈 is a positive real number. The equations (10) and (11) can be normalized as
𝑁𝐸𝑛𝑑𝑗 = (𝑁𝐸𝑑𝑗)1/2 (13)
𝑁𝐸𝑛𝑎𝑙 = (𝑁𝐸𝑎𝑙)1/2 (14)
𝑁𝐸𝑛𝑠𝑖𝑔 = [𝑁𝐸𝑛𝑎𝑙 , 𝑁𝐸𝑛𝑑1, 𝑁𝐸𝑛𝑑2, … , 𝑁𝐸𝑛𝑑𝑙] (15)
The 𝑊𝑛𝑠𝑖𝑔 represents the normalized distorted signal feature vector. The extracted features must be different from each other. The NE is always positive value. In PQ disturbances, the NE is found similar in some cases. Therefore, a normal sinusoidal signal is considered as a reference signal to distinguish features from those of others. The features vector for pure sine wave can be extracted as
𝑁𝐸𝑛𝑝𝑢𝑟𝑒 = [𝑁𝐸𝑛𝑎𝑙 , 𝑁𝐸𝑛𝑑1, 𝑁𝐸𝑛𝑑2, … , 𝑁𝐸𝑛𝑑𝑙] (16)
The resultant feature vector can be obtained by subtracting
∆𝑁𝐸 = 𝑁𝐸𝑛𝑠𝑖𝑔 – 𝑁𝐸𝑛𝑝𝑢𝑟𝑒 (17)
∆𝑁𝐸𝑠𝑖𝑔 = [∆𝑁𝐸𝑎𝑙 , ∆𝑁𝐸𝑑1, ∆𝑁𝐸𝑑2, … , ∆𝑁𝐸𝑑𝑙] (18)
The feature vector obtained by (18) is used in the classification stage of the PQ disturbances.
5. Probabilistic Neural Network The artificial neural network is the
combination of simple processing elements called neurons which are operating in parallel [23]. A neural network typically constructed of three layers such as one input layer, hidden layer and one output layer. Each layer consists of many neurons. The input layer consists of input data from the system and sends to network. The input data is sent to the hidden layer with the help of associated connection weights. The weighted inputs arrived at the hidden layers compute the outputs with the help of their transfer functions. Finally, the output layer produces the results which represent the mapping from the given input data to the desired output.
The probabilistic neural network (PNN) is a supervised learning algorithm suitable for classification problems which is working on Bayesian classifier based probabilistic approach [24]. The important reasons of using PNN are due to its certain convergence to optimal solution provided that training data is enough, learning process is simple and fast, the initial weights of the network are set automatically. In pattern recognition applications, the features related to each class from the training data are classified according to their distribution values of probability density function (pdf) using Gaussian Kernels . The approximated pdfs are used in a Bayesian decision rule to perform classification objective. Fig. 3 illustrates the architecture of the PNN which consists of two layers, one is radial basis layer and the other is competitive layer [25]. A typical PNN is composed of an input layer, two computational layers (hidden layer and output layer) and one output unit. On the application of the input data, the first computational layer computes distances from the input vector to the training input vectors and gives a vector whose elements indicate the neighbourhood between the input and the training input. The second computational layer combines these contributions for all the inputs to produce as its net output a vector of probabilities. Finally, a compete transfer function on the output of the second layer picks the maximum of these probabilities, and provides a binary output signal (0,1) which shows the most probable class membership for an applied input vector.
Figure 3: Architecture of PNN
WSEAS TRANSACTIONS on POWER SYSTEMS S. Khokhar, A. A. Mohd Zin, A. S. Mokhtar
E-ISSN: 2224-350X 167 Volume 13, 2018
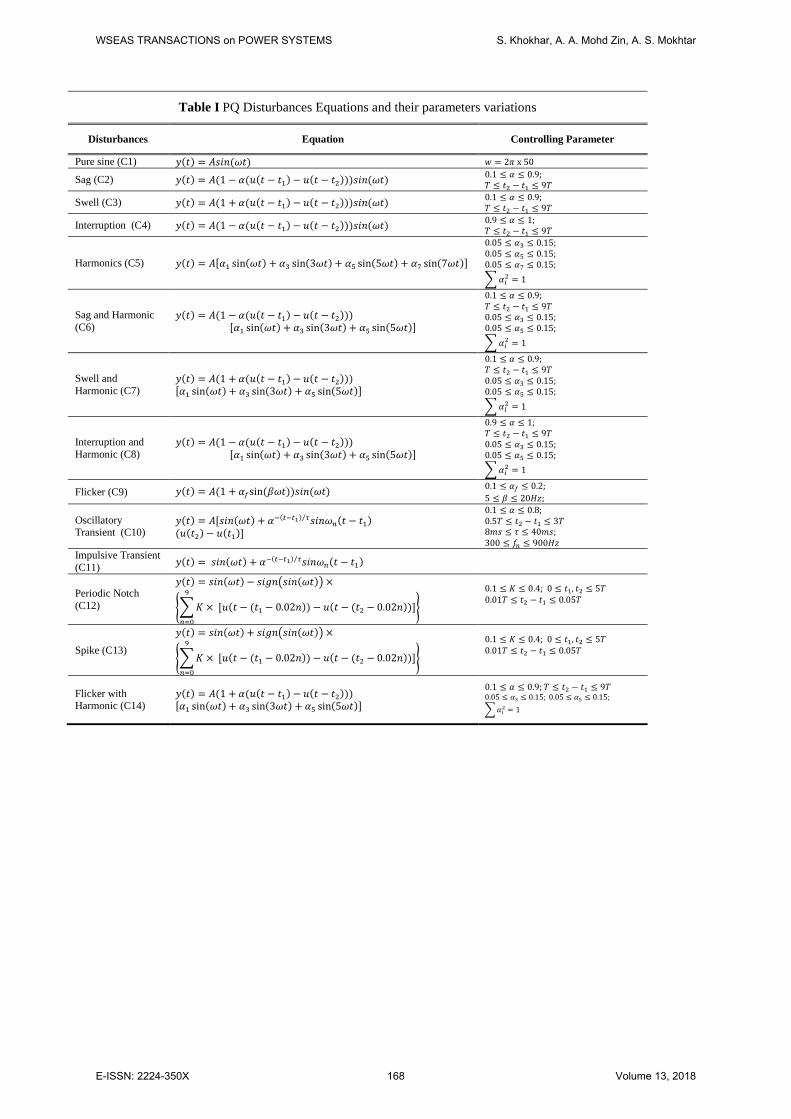
Table I PQ Disturbances Equations and their parameters variations
Disturbances Equation Controlling Parameter
Pure sine (C1) 𝑦(𝑡) = 𝐴𝑠𝑖𝑛(𝜔𝑡) 𝑤 = 2𝜋 x 50
Sag (C2) 𝑦(𝑡) = 𝐴(1 − 𝛼(𝑢(𝑡 − 𝑡1) − 𝑢(𝑡 − 𝑡2)))𝑠𝑖𝑛(𝜔𝑡) 0.1 ≤ 𝛼 ≤ 0.9; 𝑇 ≤ 𝑡2 − 𝑡1 ≤ 9𝑇
Swell (C3) 𝑦(𝑡) = 𝐴(1 + 𝛼(𝑢(𝑡 − 𝑡1) − 𝑢(𝑡 − 𝑡2)))𝑠𝑖𝑛(𝜔𝑡) 0.1 ≤ 𝛼 ≤ 0.9; 𝑇 ≤ 𝑡2 − 𝑡1 ≤ 9𝑇
Interruption (C4) 𝑦(𝑡) = 𝐴(1 − 𝛼(𝑢(𝑡 − 𝑡1) − 𝑢(𝑡 − 𝑡2)))𝑠𝑖𝑛(𝜔𝑡) 0.9 ≤ 𝛼 ≤ 1; 𝑇 ≤ 𝑡2 − 𝑡1 ≤ 9𝑇
Harmonics (C5) 𝑦(𝑡) = 𝐴[𝛼1 sin(𝜔𝑡) + 𝛼3 sin(3𝜔𝑡) + 𝛼5 sin(5𝜔𝑡) + 𝛼7 sin(7𝜔𝑡)]
0.05 ≤ 𝛼3 ≤ 0.15; 0.05 ≤ 𝛼5 ≤ 0.15; 0.05 ≤ 𝛼7 ≤ 0.15;
∑ 𝛼𝑖2 = 1
Sag and Harmonic (C6)
𝑦(𝑡) = 𝐴(1 − 𝛼(𝑢(𝑡 − 𝑡1) − 𝑢(𝑡 − 𝑡2))) [𝛼1 sin(𝜔𝑡) + 𝛼3 sin(3𝜔𝑡) + 𝛼5 sin(5𝜔𝑡)]
0.1 ≤ 𝛼 ≤ 0.9; 𝑇 ≤ 𝑡2 − 𝑡1 ≤ 9𝑇 0.05 ≤ 𝛼3 ≤ 0.15; 0.05 ≤ 𝛼5 ≤ 0.15;
∑ 𝛼𝑖2 = 1
Swell and Harmonic (C7)
𝑦(𝑡) = 𝐴(1 + 𝛼(𝑢(𝑡 − 𝑡1) − 𝑢(𝑡 − 𝑡2))) [𝛼1 sin(𝜔𝑡) + 𝛼3 sin(3𝜔𝑡) + 𝛼5 sin(5𝜔𝑡)]
0.1 ≤ 𝛼 ≤ 0.9; 𝑇 ≤ 𝑡2 − 𝑡1 ≤ 9𝑇 0.05 ≤ 𝛼3 ≤ 0.15; 0.05 ≤ 𝛼5 ≤ 0.15;
∑ 𝛼𝑖2 = 1
Interruption and Harmonic (C8)
𝑦(𝑡) = 𝐴(1 − 𝛼(𝑢(𝑡 − 𝑡1) − 𝑢(𝑡 − 𝑡2))) [𝛼1 sin(𝜔𝑡) + 𝛼3 sin(3𝜔𝑡) + 𝛼5 sin(5𝜔𝑡)]
0.9 ≤ 𝛼 ≤ 1; 𝑇 ≤ 𝑡2 − 𝑡1 ≤ 9𝑇 0.05 ≤ 𝛼3 ≤ 0.15; 0.05 ≤ 𝛼5 ≤ 0.15;
∑ 𝛼𝑖2 = 1
Flicker (C9) 𝑦(𝑡) = 𝐴(1 + 𝛼𝑓sin (𝛽𝜔𝑡))𝑠𝑖𝑛(𝜔𝑡) 0.1 ≤ 𝛼𝑓 ≤ 0.2; 5 ≤ 𝛽 ≤ 20𝐻𝑧;
Oscillatory Transient (C10)
𝑦(𝑡) = 𝐴[𝑠𝑖𝑛(𝜔𝑡) + 𝛼−(𝑡−𝑡1) 𝜏⁄ 𝑠𝑖𝑛𝜔𝑛(𝑡 − 𝑡1) (𝑢(𝑡2) − 𝑢(𝑡1)]
0.1 ≤ 𝛼 ≤ 0.8; 0.5𝑇 ≤ 𝑡2 − 𝑡1 ≤ 3𝑇 8𝑚𝑠 ≤ 𝜏 ≤ 40𝑚𝑠; 300 ≤ 𝑓𝑛 ≤ 900𝐻𝑧
Impulsive Transient (C11) 𝑦(𝑡) = 𝑠𝑖𝑛(𝜔𝑡) + 𝛼−(𝑡−𝑡1) 𝜏⁄ 𝑠𝑖𝑛𝜔𝑛(𝑡 − 𝑡1)
Periodic Notch (C12)
𝑦(𝑡) = 𝑠𝑖𝑛(𝜔𝑡) − 𝑠𝑖𝑔𝑛(𝑠𝑖𝑛(𝜔𝑡)) ×
{∑ 𝐾
9
𝑛=0
× [𝑢(𝑡 − (𝑡1 − 0.02𝑛)) − 𝑢(𝑡 − (𝑡2 − 0.02𝑛))]}
0.1 ≤ 𝐾 ≤ 0.4; 0 ≤ 𝑡1, 𝑡2 ≤ 5𝑇 0.01𝑇 ≤ 𝑡2 − 𝑡1 ≤ 0.05𝑇
Spike (C13)
𝑦(𝑡) = 𝑠𝑖𝑛(𝜔𝑡) + 𝑠𝑖𝑔𝑛(𝑠𝑖𝑛(𝜔𝑡)) ×
{∑ 𝐾
9
𝑛=0
× [𝑢(𝑡 − (𝑡1 − 0.02𝑛)) − 𝑢(𝑡 − (𝑡2 − 0.02𝑛))]}
0.1 ≤ 𝐾 ≤ 0.4; 0 ≤ 𝑡1, 𝑡2 ≤ 5𝑇 0.01𝑇 ≤ 𝑡2 − 𝑡1 ≤ 0.05𝑇
Flicker with Harmonic (C14)
𝑦(𝑡) = 𝐴(1 + 𝛼(𝑢(𝑡 − 𝑡1) − 𝑢(𝑡 − 𝑡2))) [𝛼1 sin(𝜔𝑡) + 𝛼3 sin(3𝜔𝑡) + 𝛼5 sin(5𝜔𝑡)]
0.1 ≤ 𝛼 ≤ 0.9; 𝑇 ≤ 𝑡2 − 𝑡1 ≤ 9𝑇 0.05 ≤ 𝛼3 ≤ 0.15; 0.05 ≤ 𝛼5 ≤ 0.15;
∑ 𝛼𝑖2 = 1
WSEAS TRANSACTIONS on POWER SYSTEMS S. Khokhar, A. A. Mohd Zin, A. S. Mokhtar
E-ISSN: 2224-350X 168 Volume 13, 2018
6. Simulation Results The classification of PQ disturbances is
divided into the three stages of data generation, feature extraction and classification. A number of distinctive features are extracted using DWT based MRA technique. The PQ signals are classified using feature vectors obtained from feature extraction stage. The proposed algorithm is validated with noise and without noise PQ disturbances.
6.1 Data Generation The different types of power quality
disturbances were generated by using parametric equations given in Table I. Overall 2800 samples were generated with 200 samples for the seven types of disturbance by using randomly distinctive disturbance magnitudes, time duration and different harmonics orders. The sampling frequency of the signals was set as 10 kHz i.e., 200 samples for each cycle and the normal power frequency was set as 50Hz. For each type of disturbance, 100 signals were used for training the ANN classifiers and the remaining 100 were used for the testing. 16 cycles of each category consisting of disturbances are used for the classification. The disturbances generated in this way by using MATLAB software, are similar to actual power system disturbances which are shown in Fig. 4. The total time for each type of disturbances is
taken as 0.32 seconds and the magnitude is assumed as 1 pu.
6.2 Feature Extraction The DWT is applied to each of the disturbance
for feature extraction. The db4 mother wavelet which is mostly used in power system transient analysis has been selected as the mother wavelet function. A decomposition level of 8 by MRA is applied to obtain a feature vector. All the coefficients of detail levels i.e., d1, d2, …, d8 and the last approximation level i.e., a8 are used for feature extraction. Then, a norm entropy (NE) feature in (13) is applied to the MRA coefficients for each class to obtain the wavelet norm entropy (WNE) feature vector.
6.3 Classification A feature set of 9 dimensions is constructed by
WT for training and testing the ANN classifier. The total size of the training and testing data set is 9 x 2800, where 9 is size of feature set and 2800 is the number of PQ disturbances with 200 of each class. From 200 features of each disturbance, 100 features are used for training and 100 for testing the PNN classifier. The feature vector of 9 x 1400 is applied for training the PNN structure. The target vector of
Figure 4 Power quality disturbances
WSEAS TRANSACTIONS on POWER SYSTEMS S. Khokhar, A. A. Mohd Zin, A. S. Mokhtar
E-ISSN: 2224-350X 169 Volume 13, 2018
the PNN classifier is selected as 14 x 1400. Thus the output of the classifier is obtained as 14 x 1400 confusion matrix as shown in Table II. The PQ disturbances accurately classified are shown in diagonal elements and the misclassified are shown in off-diagonal elements.
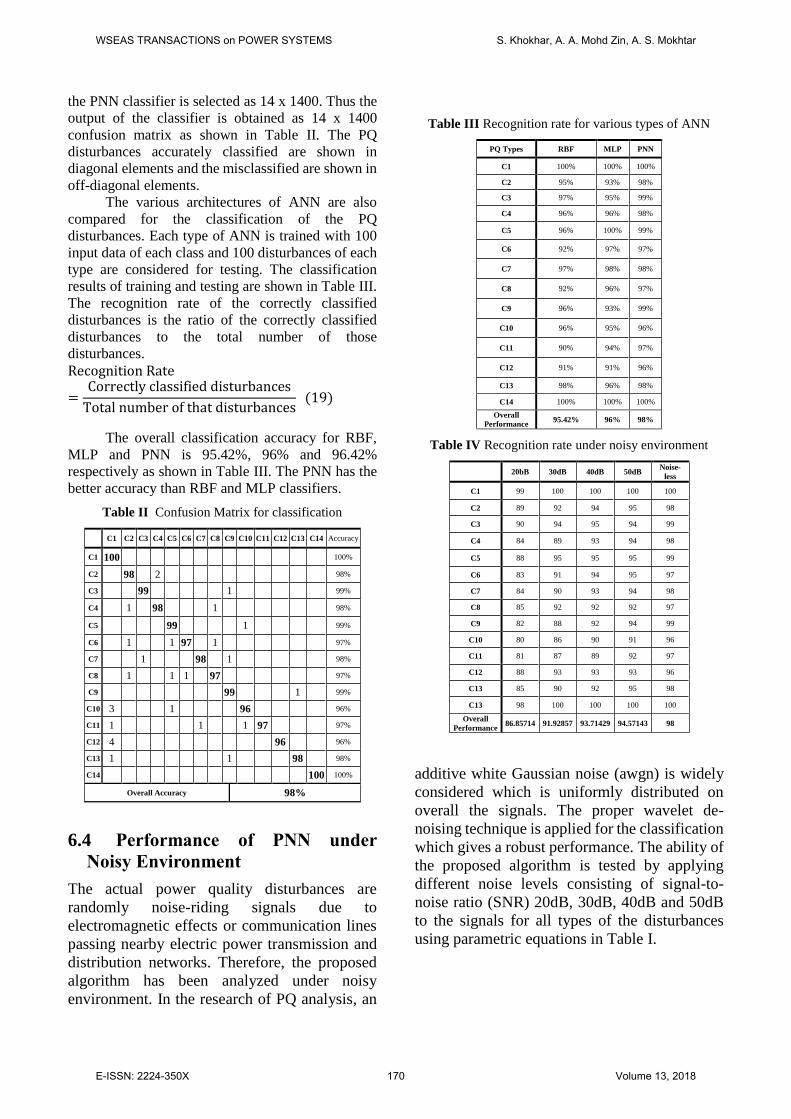
The various architectures of ANN are also compared for the classification of the PQ disturbances. Each type of ANN is trained with 100 input data of each class and 100 disturbances of each type are considered for testing. The classification results of training and testing are shown in Table III. The recognition rate of the correctly classified disturbances is the ratio of the correctly classified disturbances to the total number of those disturbances. Recognition Rate
=Correctly classified disturbances
Total number of that disturbances (19)
The overall classification accuracy for RBF,
MLP and PNN is 95.42%, 96% and 96.42% respectively as shown in Table III. The PNN has the better accuracy than RBF and MLP classifiers.
Table II Confusion Matrix for classification
Table III Recognition rate for various types of ANN
PQ Types RBF MLP PNN
C1 100% 100% 100%
C2 95% 93% 98%
C3 97% 95% 99%
C4 96% 96% 98%
C5 96% 100% 99%
C6 92% 97% 97%
C7 97% 98% 98%
C8 92% 96% 97%
C9 96% 93% 99%
C10 96% 95% 96%
C11 90% 94% 97%
C12 91% 91% 96%
C13 98% 96% 98%
C14 100% 100% 100%
Overall Performance
95.42% 96% 98%
Table IV Recognition rate under noisy environment
20bB 30dB 40dB 50dB Noise-
less
C1 99 100 100 100 100
C2 89 92 94 95 98
C3 90 94 95 94 99
C4 84 89 93 94 98
C5 88 95 95 95 99
C6 83 91 94 95 97
C7 84 90 93 94 98
C8 85 92 92 92 97
C9 82 88 92 94 99
C10 80 86 90 91 96
C11 81 87 89 92 97
C12 88 93 93 93 96
C13 85 90 92 95 98
C13 98 100 100 100 100
Overall Performance
86.85714 91.92857 93.71429 94.57143 98
6.4 Performance of PNN under
Noisy Environment
The actual power quality disturbances are randomly noise-riding signals due to electromagnetic effects or communication lines passing nearby electric power transmission and distribution networks. Therefore, the proposed algorithm has been analyzed under noisy environment. In the research of PQ analysis, an
additive white Gaussian noise (awgn) is widely considered which is uniformly distributed on overall the signals. The proper wavelet de-noising technique is applied for the classification which gives a robust performance. The ability of the proposed algorithm is tested by applying different noise levels consisting of signal-to-noise ratio (SNR) 20dB, 30dB, 40dB and 50dB to the signals for all types of the disturbances using parametric equations in Table I.
C1 C2 C3 C4 C5 C6 C7 C8 C9 C10 C11 C12 C13 C14 Accuracy
C1 100 100%
C2 98 2 98%
C3 99 1 99%
C4 1 98 1 98%
C5 99 1 99%
C6 1 1 97 1 97%
C7 1 98 1 98%
C8 1 1 1 97 97%
C9 99 1 99%
C10 3 1 96 96%
C11 1 1 1 97 97%
C12 4 96 96%
C13 1 1 98 98%
C14 100 100%
Overall Accuracy 98%
WSEAS TRANSACTIONS on POWER SYSTEMS S. Khokhar, A. A. Mohd Zin, A. S. Mokhtar
E-ISSN: 2224-350X 170 Volume 13, 2018
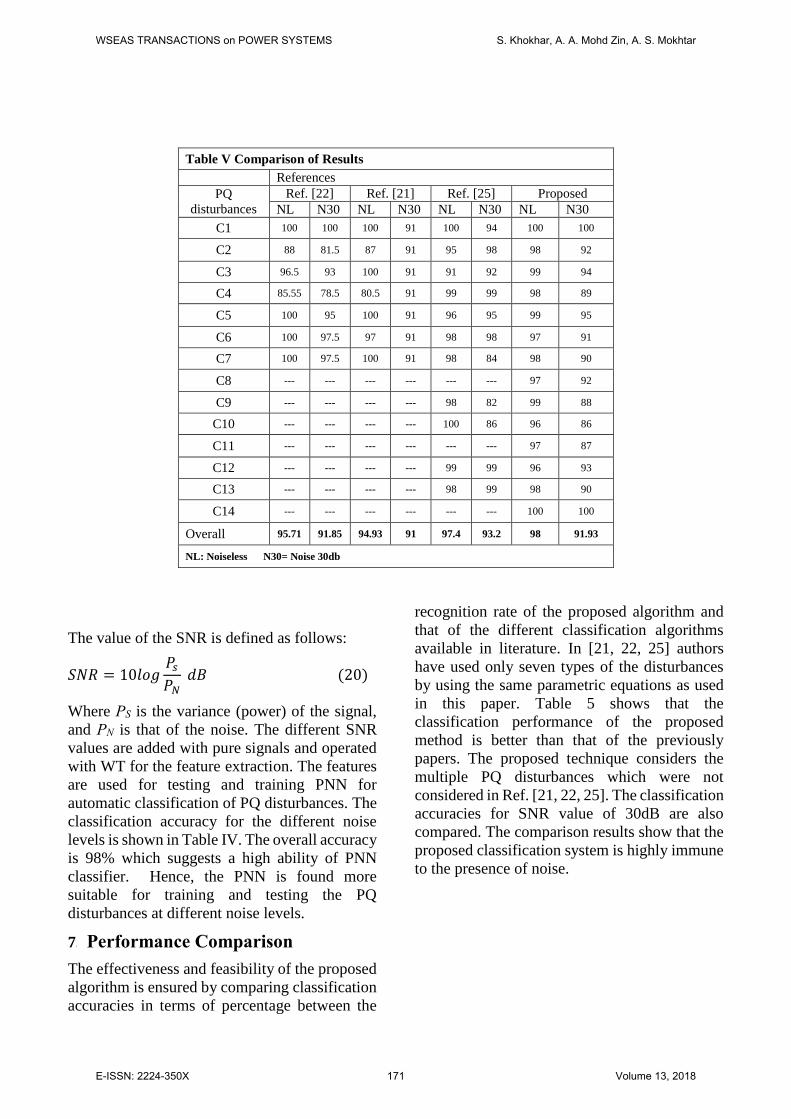
Table V Comparison of Results
References PQ
disturbances Ref. [22] Ref. [21] Ref. [25] Proposed
NL N30 NL N30 NL N30 NL N30
C1 100 100 100 91 100 94 100 100
C2 88 81.5 87 91 95 98 98 92
C3 96.5 93 100 91 91 92 99 94
C4 85.55 78.5 80.5 91 99 99 98 89
C5 100 95 100 91 96 95 99 95
C6 100 97.5 97 91 98 98 97 91
C7 100 97.5 100 91 98 84 98 90
C8 --- --- --- --- --- --- 97 92
C9 --- --- --- --- 98 82 99 88
C10 --- --- --- --- 100 86 96 86
C11 --- --- --- --- --- --- 97 87
C12 --- --- --- --- 99 99 96 93
C13 --- --- --- --- 98 99 98 90
C14 --- --- --- --- --- --- 100 100
Overall 95.71 91.85 94.93 91 97.4 93.2 98 91.93
NL: Noiseless N30= Noise 30db
The value of the SNR is defined as follows:
𝑆𝑁𝑅 = 10𝑙𝑜𝑔𝑃𝑠
𝑃𝑁 𝑑𝐵 (20)
Where PS is the variance (power) of the signal, and PN is that of the noise. The different SNR values are added with pure signals and operated with WT for the feature extraction. The features are used for testing and training PNN for automatic classification of PQ disturbances. The classification accuracy for the different noise levels is shown in Table IV. The overall accuracy is 98% which suggests a high ability of PNN classifier. Hence, the PNN is found more suitable for training and testing the PQ disturbances at different noise levels.
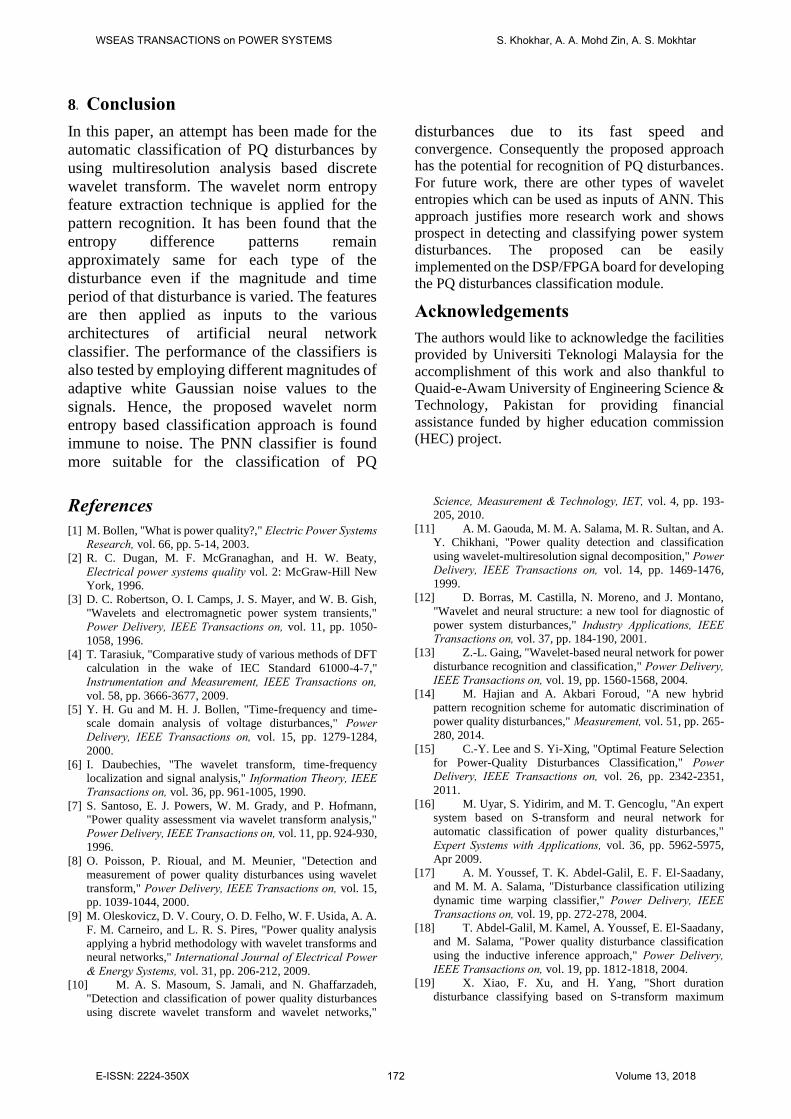
7. Performance Comparison
The effectiveness and feasibility of the proposed algorithm is ensured by comparing classification accuracies in terms of percentage between the
recognition rate of the proposed algorithm and that of the different classification algorithms available in literature. In [21, 22, 25] authors have used only seven types of the disturbances by using the same parametric equations as used in this paper. Table 5 shows that the classification performance of the proposed method is better than that of the previously papers. The proposed technique considers the multiple PQ disturbances which were not considered in Ref. [21, 22, 25]. The classification accuracies for SNR value of 30dB are also compared. The comparison results show that the proposed classification system is highly immune to the presence of noise.
WSEAS TRANSACTIONS on POWER SYSTEMS S. Khokhar, A. A. Mohd Zin, A. S. Mokhtar
E-ISSN: 2224-350X 171 Volume 13, 2018
8. Conclusion
In this paper, an attempt has been made for the automatic classification of PQ disturbances by using multiresolution analysis based discrete wavelet transform. The wavelet norm entropy feature extraction technique is applied for the pattern recognition. It has been found that the entropy difference patterns remain approximately same for each type of the disturbance even if the magnitude and time period of that disturbance is varied. The features are then applied as inputs to the various architectures of artificial neural network classifier. The performance of the classifiers is also tested by employing different magnitudes of adaptive white Gaussian noise values to the signals. Hence, the proposed wavelet norm entropy based classification approach is found immune to noise. The PNN classifier is found more suitable for the classification of PQ
disturbances due to its fast speed and convergence. Consequently the proposed approach has the potential for recognition of PQ disturbances. For future work, there are other types of wavelet entropies which can be used as inputs of ANN. This approach justifies more research work and shows prospect in detecting and classifying power system disturbances. The proposed can be easily implemented on the DSP/FPGA board for developing the PQ disturbances classification module.
Acknowledgements The authors would like to acknowledge the facilities provided by Universiti Teknologi Malaysia for the accomplishment of this work and also thankful to Quaid-e-Awam University of Engineering Science & Technology, Pakistan for providing financial assistance funded by higher education commission (HEC) project.
References [1] M. Bollen, "What is power quality?," Electric Power Systems
Research, vol. 66, pp. 5-14, 2003. [2] R. C. Dugan, M. F. McGranaghan, and H. W. Beaty,
Electrical power systems quality vol. 2: McGraw-Hill New York, 1996.
[3] D. C. Robertson, O. I. Camps, J. S. Mayer, and W. B. Gish, "Wavelets and electromagnetic power system transients," Power Delivery, IEEE Transactions on, vol. 11, pp. 1050-1058, 1996.
[4] T. Tarasiuk, "Comparative study of various methods of DFT calculation in the wake of IEC Standard 61000-4-7," Instrumentation and Measurement, IEEE Transactions on, vol. 58, pp. 3666-3677, 2009.
[5] Y. H. Gu and M. H. J. Bollen, "Time-frequency and time-scale domain analysis of voltage disturbances," Power Delivery, IEEE Transactions on, vol. 15, pp. 1279-1284, 2000.
[6] I. Daubechies, "The wavelet transform, time-frequency localization and signal analysis," Information Theory, IEEE Transactions on, vol. 36, pp. 961-1005, 1990.
[7] S. Santoso, E. J. Powers, W. M. Grady, and P. Hofmann, "Power quality assessment via wavelet transform analysis," Power Delivery, IEEE Transactions on, vol. 11, pp. 924-930, 1996.
[8] O. Poisson, P. Rioual, and M. Meunier, "Detection and measurement of power quality disturbances using wavelet transform," Power Delivery, IEEE Transactions on, vol. 15, pp. 1039-1044, 2000.
[9] M. Oleskovicz, D. V. Coury, O. D. Felho, W. F. Usida, A. A. F. M. Carneiro, and L. R. S. Pires, "Power quality analysis applying a hybrid methodology with wavelet transforms and neural networks," International Journal of Electrical Power & Energy Systems, vol. 31, pp. 206-212, 2009.
[10] M. A. S. Masoum, S. Jamali, and N. Ghaffarzadeh, "Detection and classification of power quality disturbances using discrete wavelet transform and wavelet networks,"
Science, Measurement & Technology, IET, vol. 4, pp. 193-205, 2010.
[11] A. M. Gaouda, M. M. A. Salama, M. R. Sultan, and A. Y. Chikhani, "Power quality detection and classification using wavelet-multiresolution signal decomposition," Power Delivery, IEEE Transactions on, vol. 14, pp. 1469-1476, 1999.
[12] D. Borras, M. Castilla, N. Moreno, and J. Montano, "Wavelet and neural structure: a new tool for diagnostic of power system disturbances," Industry Applications, IEEE Transactions on, vol. 37, pp. 184-190, 2001.
[13] Z.-L. Gaing, "Wavelet-based neural network for power disturbance recognition and classification," Power Delivery, IEEE Transactions on, vol. 19, pp. 1560-1568, 2004.
[14] M. Hajian and A. Akbari Foroud, "A new hybrid pattern recognition scheme for automatic discrimination of power quality disturbances," Measurement, vol. 51, pp. 265-280, 2014.
[15] C.-Y. Lee and S. Yi-Xing, "Optimal Feature Selection for Power-Quality Disturbances Classification," Power Delivery, IEEE Transactions on, vol. 26, pp. 2342-2351, 2011.
[16] M. Uyar, S. Yidirim, and M. T. Gencoglu, "An expert system based on S-transform and neural network for automatic classification of power quality disturbances," Expert Systems with Applications, vol. 36, pp. 5962-5975, Apr 2009.
[17] A. M. Youssef, T. K. Abdel-Galil, E. F. El-Saadany, and M. M. A. Salama, "Disturbance classification utilizing dynamic time warping classifier," Power Delivery, IEEE Transactions on, vol. 19, pp. 272-278, 2004.
[18] T. Abdel-Galil, M. Kamel, A. Youssef, E. El-Saadany, and M. Salama, "Power quality disturbance classification using the inductive inference approach," Power Delivery, IEEE Transactions on, vol. 19, pp. 1812-1818, 2004.
[19] X. Xiao, F. Xu, and H. Yang, "Short duration disturbance classifying based on S-transform maximum
WSEAS TRANSACTIONS on POWER SYSTEMS S. Khokhar, A. A. Mohd Zin, A. S. Mokhtar
E-ISSN: 2224-350X 172 Volume 13, 2018
similarity," International Journal of Electrical Power & Energy Systems, vol. 31, pp. 374-378, 2009.
[20] H. Eristi, A. Ucar, and Y. Demir, "Wavelet-based feature extraction and selection for classification of power system disturbances using support vector machines," Electric Power Systems Research, vol. 80, pp. 743-752, Jul 2010.
[21] H. Haibo and J. A. Starzyk, "A self-organizing learning array system for power quality classification based on wavelet transform," Power Delivery, IEEE Transactions on, vol. 21, pp. 286-295, 2006.
[22] M. Uyar, S. Yildirim, and M. T. Gencoglu, "An effective wavelet-based feature extraction method for classification of power quality disturbance signals," Electric Power Systems Research, vol. 78, pp. 1747-1755, 2008.
[23] J. Upendar, C. P. Gupta, and G. K. Singh, "Statistical decision-tree based fault classification scheme for protection of power transmission lines," International Journal of Electrical Power & Energy Systems, vol. 36, pp. 1-12, 2012.
[24] D. F. Specht, "Probabilistic neural networks," Neural networks, vol. 3, pp. 109-118, 1990.
[25] S. Mishra, C. N. Bhende, and K. B. Panigrahi, "Detection and Classification of Power Quality Disturbances Using S-Transform and Probabilistic Neural Network," Power Delivery, IEEE Transactions on, vol. 23, pp. 280-287, 2008.
WSEAS TRANSACTIONS on POWER SYSTEMS S. Khokhar, A. A. Mohd Zin, A. S. Mokhtar
E-ISSN: 2224-350X 173 Volume 13, 2018
Related Documents


![SCISCITATOR 2015 · [1]. Riverine communities experience two main types of disturbances: natural disturbances and anthropogenic disturbances. Natural disturbances in riverine ecosystems](https://static.cupdf.com/doc/110x72/5f27dd3959f0c41da22eeec5/sciscitator-1-riverine-communities-experience-two-main-types-of-disturbances.jpg)