Automatic Approach for Emulsions Stability Assessment in Microscope Images Yurney V´ azquez, Antonio Bravo and Juan Mantilla Grupo de Bioingenier´ ıa Decanato de Investigaci´ on Universidad Nacional Experimental del T´ achira San Crist´ obal 5001, Venezuela [email protected] Mario Alay´ on Unidad Multidiciplinaria de Investigaci´ on en Ciencias B´ asicas e Ingenier´ ıa Decanato de Investigaci´ on Universidad Nacional Experimental del T´ achira San Crist´ obal 5001, Venezuela Abstract The problem of emulsions stability evaluations from im- ages acquired in microscopy is considered. The proposed approach consists of four consecutive steps: 1) images enhancement; 2) segmentation based on Watershed algo- rithm; 3) drops identification using a template matching procedure; 4) stability evaluation. Finally, an analysis of results is performed by comparing the estimated results with respect to results obtained manually by the expert. 1. Introduction An emulsion is a two phases immiscible system where one of the phases is dispersed as droplets in the other. Emul- sions also contain a third component called emulsifier agent. The principal function of this agent is to stabilize the dis- persed phase [9]. Emulsions properties as stability, rheol- ogy, appearance, chemical reactivity and physical proper- ties depend on the size and size distribution of the drops [11]. Emulsion stability is not a concept with a well agreed definition. Generally, the stability is related either to the persistence or to the decay of the dispersed system under certain circumstances. An emulsion is stable when its as- pect does not change in determinate period of time [6], by simple observation of the emulsion aspect evolution during certain time period is easy to determine its stability. How- ever, the quantification of the stability concept, which is re- quired to carry out comparison is not an easy task [1]. A method to measure emulsions stability is to analyze emulsions samples sequences. The objective is to determine whether the drop size average and / or distribution change. An important factor that determines the emulsions stability is the drops size distribution. For smaller drops sizes the emulsion is more stable [8]. The drop size can be measured by several techniques like turbidity or reflectance, electro- zone sensing, laser light scattering and microscopy [6]. Mi- croscopy technique allows direct droplets examination and it is the cheaper technique. Taking samples in different times and using software which can analyze microscope im- ages is possible to quantify the drops size distribution and with this information the emulsions stability can be evalu- ated in an easy and fast way. 2. Method Figure 1 shows a flow diagram of the implementation of the proposed method. The approach starts with pre- processing stage which enhances the image data by means of the diffusion filters based method. In the second stage, a segmentation approach based on Watershed technique is used for classifying the candidates to drops and background regions. This classification is optimized using a template matching procedure. An automatic procedure is used to de- termine the diameter of the emulsion drops. This informa- tion is used to characterize the emulsion by means of the drops average diameter. The process is applied to the emul- sions image sequence. Finally, the variability of the average diameter with a time function is used to determine the emul- sion stability.

Welcome message from author
This document is posted to help you gain knowledge. Please leave a comment to let me know what you think about it! Share it to your friends and learn new things together.
Transcript
Automatic Approach for Emulsions Stability Assessment in Microscope Images
Yurney Vazquez, Antonio Bravo and Juan MantillaGrupo de Bioingenierıa
Decanato de InvestigacionUniversidad Nacional Experimental del Tachira
San Cristobal 5001, [email protected]
Mario AlayonUnidad Multidiciplinaria de Investigacion en Ciencias Basicas e Ingenierıa
Decanato de InvestigacionUniversidad Nacional Experimental del Tachira
San Cristobal 5001, Venezuela
Abstract
The problem of emulsions stability evaluations from im-ages acquired in microscopy is considered. The proposedapproach consists of four consecutive steps: 1) imagesenhancement; 2) segmentation based on Watershed algo-rithm; 3) drops identification using a template matchingprocedure; 4) stability evaluation. Finally, an analysis ofresults is performed by comparing the estimated results withrespect to results obtained manually by the expert.
1. Introduction
An emulsion is a two phases immiscible system whereone of the phases is dispersed as droplets in the other. Emul-sions also contain a third component called emulsifier agent.The principal function of this agent is to stabilize the dis-persed phase [9]. Emulsions properties as stability, rheol-ogy, appearance, chemical reactivity and physical proper-ties depend on the size and size distribution of the drops[11]. Emulsion stability is not a concept with a well agreeddefinition. Generally, the stability is related either to thepersistence or to the decay of the dispersed system undercertain circumstances. An emulsion is stable when its as-pect does not change in determinate period of time [6], bysimple observation of the emulsion aspect evolution duringcertain time period is easy to determine its stability. How-ever, the quantification of the stability concept, which is re-quired to carry out comparison is not an easy task [1].
A method to measure emulsions stability is to analyze
emulsions samples sequences. The objective is to determinewhether the drop size average and / or distribution change.An important factor that determines the emulsions stabilityis the drops size distribution. For smaller drops sizes theemulsion is more stable [8]. The drop size can be measuredby several techniques like turbidity or reflectance, electro-zone sensing, laser light scattering and microscopy [6]. Mi-croscopy technique allows direct droplets examination andit is the cheaper technique. Taking samples in differenttimes and using software which can analyze microscope im-ages is possible to quantify the drops size distribution andwith this information the emulsions stability can be evalu-ated in an easy and fast way.
2. Method
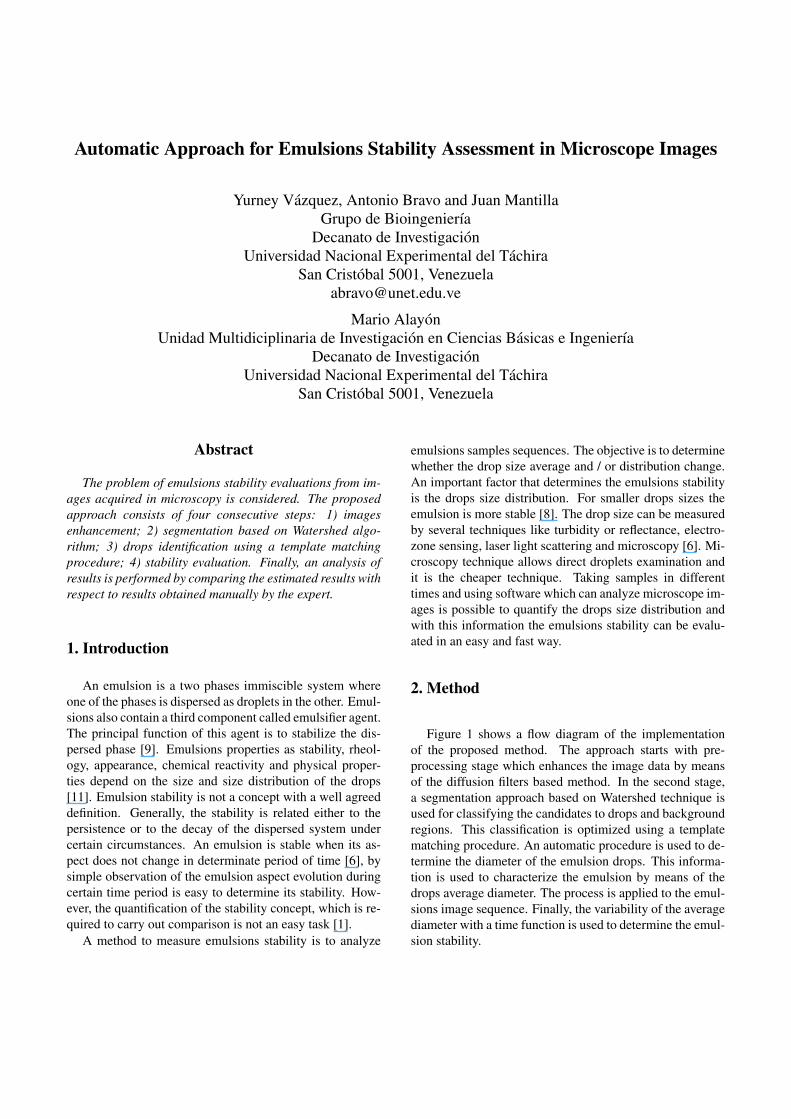
Figure 1 shows a flow diagram of the implementationof the proposed method. The approach starts with pre-processing stage which enhances the image data by meansof the diffusion filters based method. In the second stage,a segmentation approach based on Watershed technique isused for classifying the candidates to drops and backgroundregions. This classification is optimized using a templatematching procedure. An automatic procedure is used to de-termine the diameter of the emulsion drops. This informa-tion is used to characterize the emulsion by means of thedrops average diameter. The process is applied to the emul-sions image sequence. Finally, the variability of the averagediameter with a time function is used to determine the emul-sion stability.
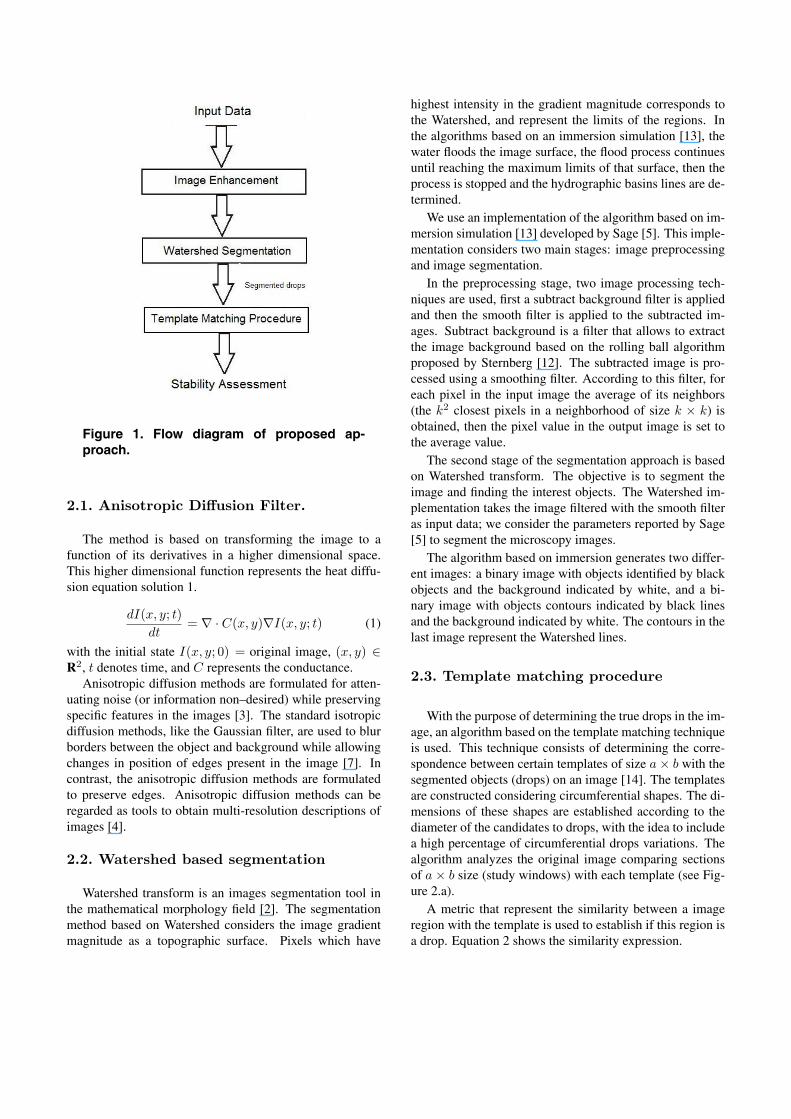
Figure 1. Flow diagram of proposed ap-proach.
2.1. Anisotropic Diffusion Filter.
The method is based on transforming the image to afunction of its derivatives in a higher dimensional space.This higher dimensional function represents the heat diffu-sion equation solution 1.
dI(x, y; t)dt
= ∇ · C(x, y)∇I(x, y; t) (1)
with the initial state I(x, y; 0) = original image, (x, y) ∈R2, t denotes time, and C represents the conductance.
Anisotropic diffusion methods are formulated for atten-uating noise (or information non–desired) while preservingspecific features in the images [3]. The standard isotropicdiffusion methods, like the Gaussian filter, are used to blurborders between the object and background while allowingchanges in position of edges present in the image [7]. Incontrast, the anisotropic diffusion methods are formulatedto preserve edges. Anisotropic diffusion methods can beregarded as tools to obtain multi-resolution descriptions ofimages [4].
2.2. Watershed based segmentation
Watershed transform is an images segmentation tool inthe mathematical morphology field [2]. The segmentationmethod based on Watershed considers the image gradientmagnitude as a topographic surface. Pixels which have
highest intensity in the gradient magnitude corresponds tothe Watershed, and represent the limits of the regions. Inthe algorithms based on an immersion simulation [13], thewater floods the image surface, the flood process continuesuntil reaching the maximum limits of that surface, then theprocess is stopped and the hydrographic basins lines are de-termined.
We use an implementation of the algorithm based on im-mersion simulation [13] developed by Sage [5]. This imple-mentation considers two main stages: image preprocessingand image segmentation.
In the preprocessing stage, two image processing tech-niques are used, first a subtract background filter is appliedand then the smooth filter is applied to the subtracted im-ages. Subtract background is a filter that allows to extractthe image background based on the rolling ball algorithmproposed by Sternberg [12]. The subtracted image is pro-cessed using a smoothing filter. According to this filter, foreach pixel in the input image the average of its neighbors(the k2 closest pixels in a neighborhood of size k × k) isobtained, then the pixel value in the output image is set tothe average value.
The second stage of the segmentation approach is basedon Watershed transform. The objective is to segment theimage and finding the interest objects. The Watershed im-plementation takes the image filtered with the smooth filteras input data; we consider the parameters reported by Sage[5] to segment the microscopy images.
The algorithm based on immersion generates two differ-ent images: a binary image with objects identified by blackobjects and the background indicated by white, and a bi-nary image with objects contours indicated by black linesand the background indicated by white. The contours in thelast image represent the Watershed lines.
2.3. Template matching procedure
With the purpose of determining the true drops in the im-age, an algorithm based on the template matching techniqueis used. This technique consists of determining the corre-spondence between certain templates of size a × b with thesegmented objects (drops) on an image [14]. The templatesare constructed considering circumferential shapes. The di-mensions of these shapes are established according to thediameter of the candidates to drops, with the idea to includea high percentage of circumferential drops variations. Thealgorithm analyzes the original image comparing sectionsof a × b size (study windows) with each template (see Fig-ure 2.a).
A metric that represent the similarity between a imageregion with the template is used to establish if this region isa drop. Equation 2 shows the similarity expression.
(a) (b)
(c)
Figure 2. Template matching procedure. This Figure illustrates the process using a 5 × 3 template.
S(i, j) =k=i+a/2,x=a∑
k=i−a/2,x=0
l=j+b,y=b∑
l=j−b,y=0
f(k, l)g(x, y) (2)
where S is the similarity for the pixel (i, j), a and b are tem-plate dimensions, f is the original image, and g is the tem-plate. An image region is accepted like drop, if the similar-ity value S is greater than the matching threshold (εmatch).A counter is considered to quantify the identified drop.
The template matching procedure analyzes the image byrows. In the Figure 2, the matching process by rows isdescribed for a template the size 5 × 3. If the similarityvalue fulfills the acceptance condition, the study window ismoved to the following submatrix in the original image, thatis to say, b columns to the right (Figure 2.b). If the similarityvalue does not fulfill the acceptance condition the windowis moved a single column to the right (see Figure 2.c). Theidentified drop are labeled in the original image. This labelprevents that the region be analyzed by the algorithm again.
2.4. Drop size quantification
In this step, our quantification approach considers as in-put data the image with the identified drops and the amountof drops registered by the counter described in the previoussection.
The drop size is determined as the diameter in pixels ofits circumferential pattern. When the size of each drop hasbeen calculated it is possible to obtain the drops averagesize in the microscopy image.
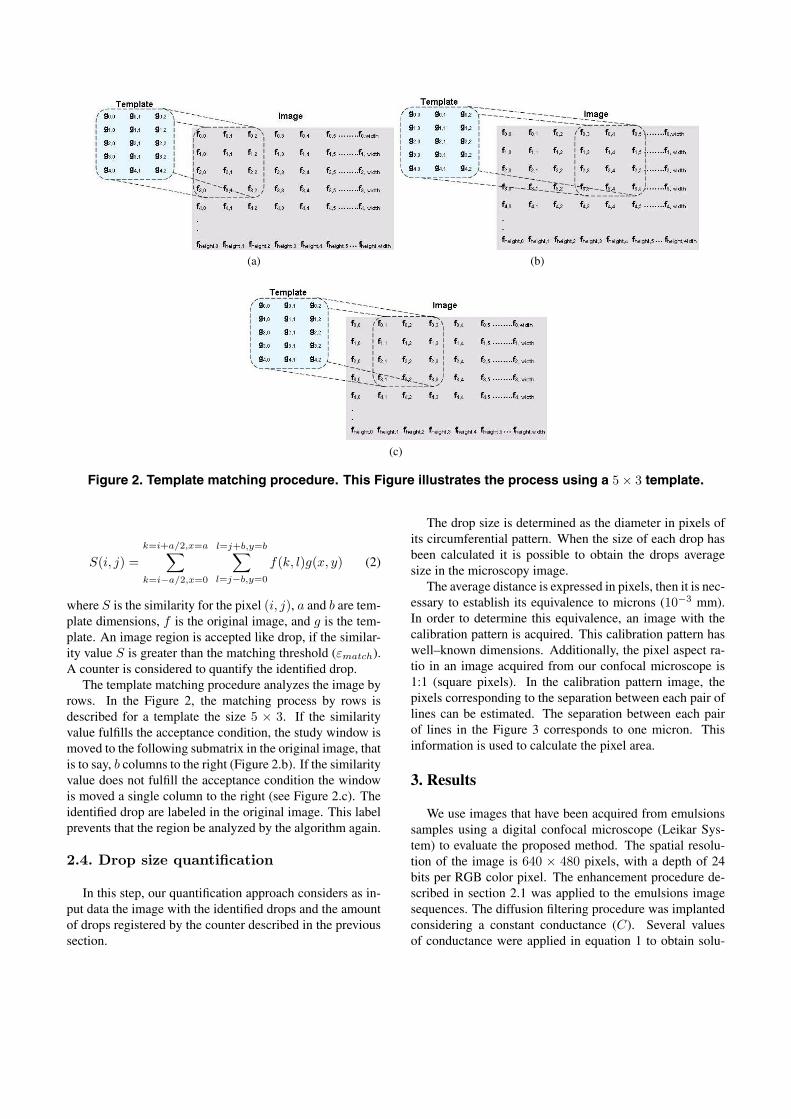
The average distance is expressed in pixels, then it is nec-essary to establish its equivalence to microns (10−3 mm).In order to determine this equivalence, an image with thecalibration pattern is acquired. This calibration pattern haswell–known dimensions. Additionally, the pixel aspect ra-tio in an image acquired from our confocal microscope is1:1 (square pixels). In the calibration pattern image, thepixels corresponding to the separation between each pair oflines can be estimated. The separation between each pairof lines in the Figure 3 corresponds to one micron. Thisinformation is used to calculate the pixel area.
3. Results
We use images that have been acquired from emulsionssamples using a digital confocal microscope (Leikar Sys-tem) to evaluate the proposed method. The spatial resolu-tion of the image is 640 × 480 pixels, with a depth of 24bits per RGB color pixel. The enhancement procedure de-scribed in section 2.1 was applied to the emulsions imagesequences. The diffusion filtering procedure was implantedconsidering a constant conductance (C). Several valuesof conductance were applied in equation 1 to obtain solu-
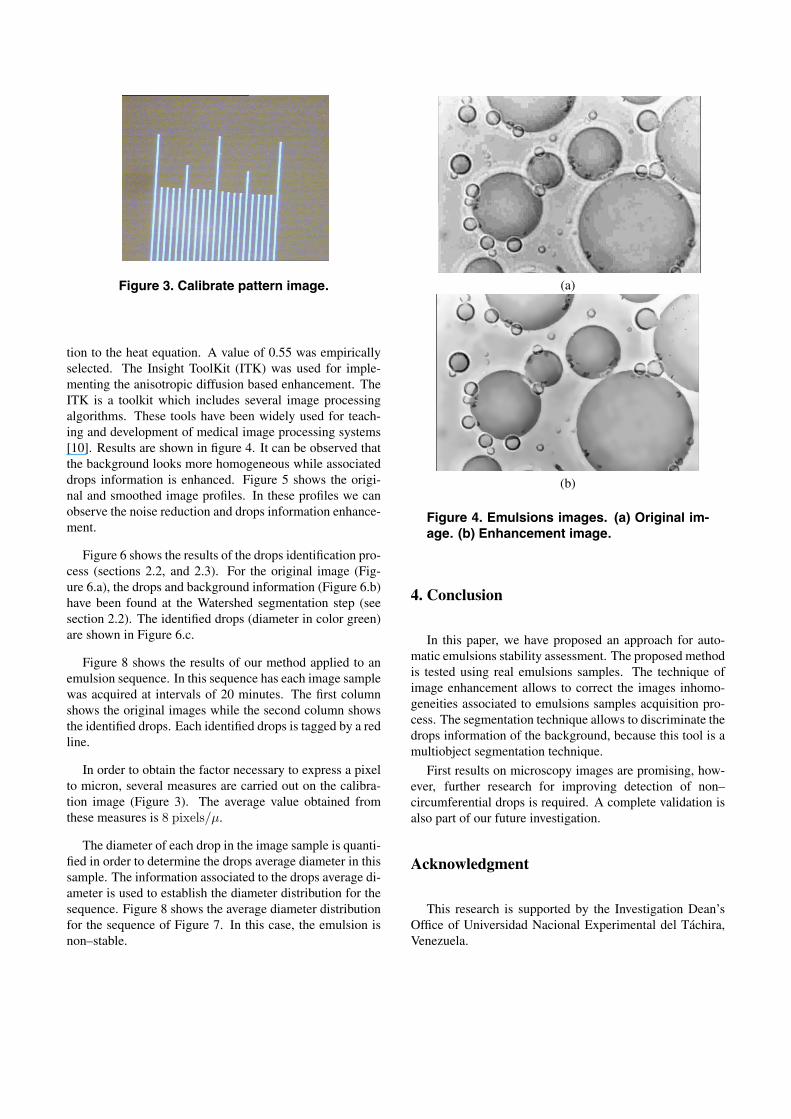
Figure 3. Calibrate pattern image.
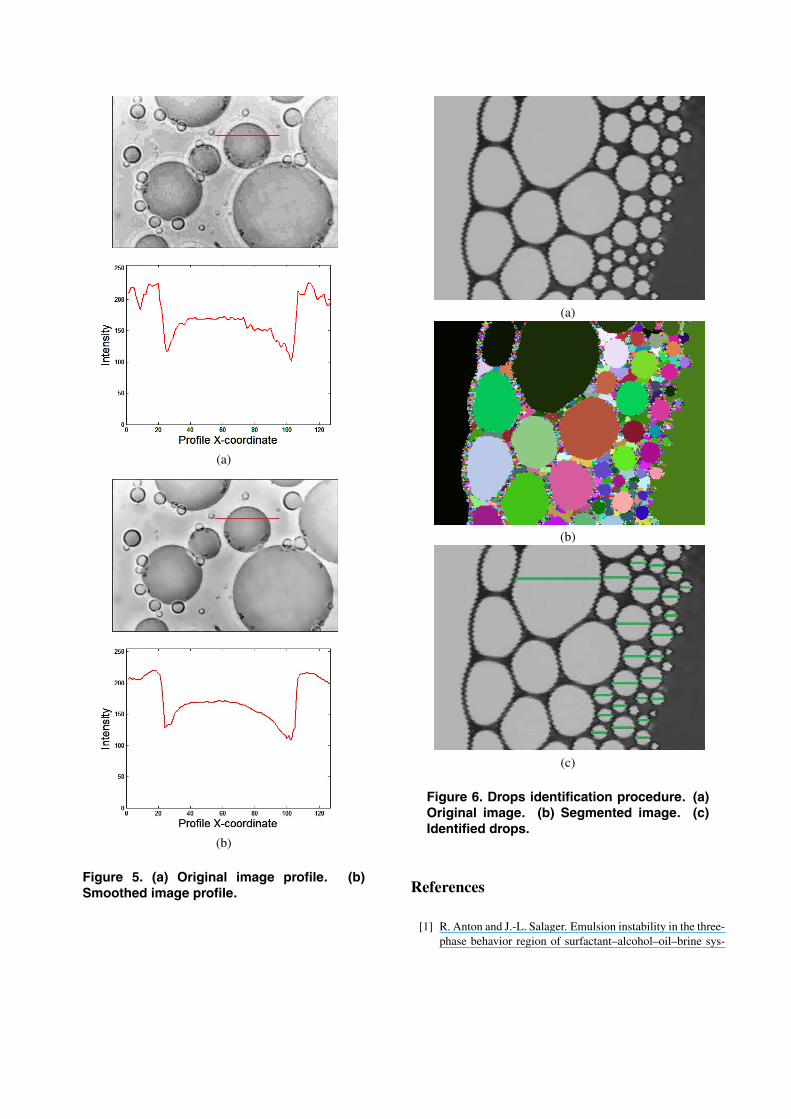
tion to the heat equation. A value of 0.55 was empiricallyselected. The Insight ToolKit (ITK) was used for imple-menting the anisotropic diffusion based enhancement. TheITK is a toolkit which includes several image processingalgorithms. These tools have been widely used for teach-ing and development of medical image processing systems[10]. Results are shown in figure 4. It can be observed thatthe background looks more homogeneous while associateddrops information is enhanced. Figure 5 shows the origi-nal and smoothed image profiles. In these profiles we canobserve the noise reduction and drops information enhance-ment.
Figure 6 shows the results of the drops identification pro-cess (sections 2.2, and 2.3). For the original image (Fig-ure 6.a), the drops and background information (Figure 6.b)have been found at the Watershed segmentation step (seesection 2.2). The identified drops (diameter in color green)are shown in Figure 6.c.
Figure 8 shows the results of our method applied to anemulsion sequence. In this sequence has each image samplewas acquired at intervals of 20 minutes. The first columnshows the original images while the second column showsthe identified drops. Each identified drops is tagged by a redline.
In order to obtain the factor necessary to express a pixelto micron, several measures are carried out on the calibra-tion image (Figure 3). The average value obtained fromthese measures is 8 pixels/μ.
The diameter of each drop in the image sample is quanti-fied in order to determine the drops average diameter in thissample. The information associated to the drops average di-ameter is used to establish the diameter distribution for thesequence. Figure 8 shows the average diameter distributionfor the sequence of Figure 7. In this case, the emulsion isnon–stable.
(a)
(b)
Figure 4. Emulsions images. (a) Original im-age. (b) Enhancement image.
4. Conclusion
In this paper, we have proposed an approach for auto-matic emulsions stability assessment. The proposed methodis tested using real emulsions samples. The technique ofimage enhancement allows to correct the images inhomo-geneities associated to emulsions samples acquisition pro-cess. The segmentation technique allows to discriminate thedrops information of the background, because this tool is amultiobject segmentation technique.
First results on microscopy images are promising, how-ever, further research for improving detection of non–circumferential drops is required. A complete validation isalso part of our future investigation.
Acknowledgment
This research is supported by the Investigation Dean’sOffice of Universidad Nacional Experimental del Tachira,Venezuela.
(a)
(b)
Figure 5. (a) Original image profile. (b)Smoothed image profile.
(a)
(b)
(c)
Figure 6. Drops identification procedure. (a)Original image. (b) Segmented image. (c)Identified drops.
References
[1] R. Anton and J.-L. Salager. Emulsion instability in the three-phase behavior region of surfactant–alcohol–oil–brine sys-
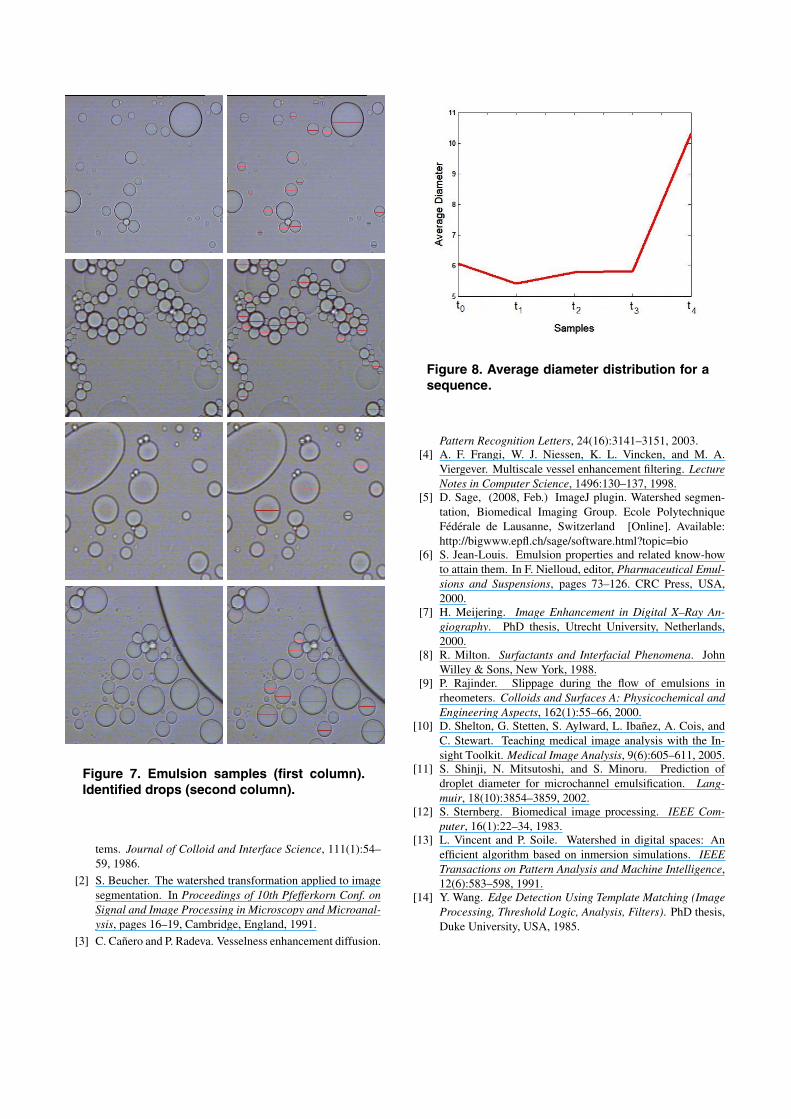
Figure 7. Emulsion samples (first column).Identified drops (second column).
tems. Journal of Colloid and Interface Science, 111(1):54–59, 1986.
[2] S. Beucher. The watershed transformation applied to imagesegmentation. In Proceedings of 10th Pfefferkorn Conf. onSignal and Image Processing in Microscopy and Microanal-ysis, pages 16–19, Cambridge, England, 1991.
[3] C. Canero and P. Radeva. Vesselness enhancement diffusion.
Figure 8. Average diameter distribution for asequence.
Pattern Recognition Letters, 24(16):3141–3151, 2003.[4] A. F. Frangi, W. J. Niessen, K. L. Vincken, and M. A.
Viergever. Multiscale vessel enhancement filtering. LectureNotes in Computer Science, 1496:130–137, 1998.
[5] D. Sage, (2008, Feb.) ImageJ plugin. Watershed segmen-tation, Biomedical Imaging Group. Ecole PolytechniqueFederale de Lausanne, Switzerland [Online]. Available:http://bigwww.epfl.ch/sage/software.html?topic=bio
[6] S. Jean-Louis. Emulsion properties and related know-howto attain them. In F. Nielloud, editor, Pharmaceutical Emul-sions and Suspensions, pages 73–126. CRC Press, USA,2000.
[7] H. Meijering. Image Enhancement in Digital X–Ray An-giography. PhD thesis, Utrecht University, Netherlands,2000.
[8] R. Milton. Surfactants and Interfacial Phenomena. JohnWilley & Sons, New York, 1988.
[9] P. Rajinder. Slippage during the flow of emulsions inrheometers. Colloids and Surfaces A: Physicochemical andEngineering Aspects, 162(1):55–66, 2000.
[10] D. Shelton, G. Stetten, S. Aylward, L. Ibanez, A. Cois, andC. Stewart. Teaching medical image analysis with the In-sight Toolkit. Medical Image Analysis, 9(6):605–611, 2005.
[11] S. Shinji, N. Mitsutoshi, and S. Minoru. Prediction ofdroplet diameter for microchannel emulsification. Lang-muir, 18(10):3854–3859, 2002.
[12] S. Sternberg. Biomedical image processing. IEEE Com-puter, 16(1):22–34, 1983.
[13] L. Vincent and P. Soile. Watershed in digital spaces: Anefficient algorithm based on inmersion simulations. IEEETransactions on Pattern Analysis and Machine Intelligence,12(6):583–598, 1991.
[14] Y. Wang. Edge Detection Using Template Matching (ImageProcessing, Threshold Logic, Analysis, Filters). PhD thesis,Duke University, USA, 1985.
Related Documents