The International Journal of Indian Psychology | ISSN 2348-5396 Volume 2, Issue 1, Paper ID: B00273V2I12014 http://www.ijip.in | Oct to Dec 2014 © 2014, A Panda; licensee IJIP. This is an Open Access Research distributed under the terms of the Creative Commons Attribution License (http://creativecommons.org/licenses/by/2.0), which permits unrestricted use, distribution, and reproduction in any Medium, provided the original work is properly cited. Automated Warning Reduces Error of Commission in Vigilance: A Study on Indian Adults Dr. Amrita Panda* ABSTRACT: The spotlight regarding the concept of vigilance somehow was limited to the national security for decades. With technological advancement the concept of vigilance has attained importance in industrial set up. But vigilance as a cognitive aspect in regular life was somehow neglected throughout these years. An automated warning system is a sensory stimulation meant to reduce errors in highly loaded cognitive tasks. Previous research findings suggest that performance efficiency is uninfluenced by warning (Helton et. al., 2008) or a higher error of omission reported in the presence of warning signals (Helton et. al., 2011). But how it affects cognitive process like vigilance is rarely been explored. The present study attempts to reveal the effect of warning on vigilance. Participants were 95 adults chosen from metropolitan areas of Kolkata, India. Participant’s Intelligence, processing speed and accuracy along with their psychiatric morbidity was controlled statistically. Finally, the participants were given a visual vigilance task using a software program (Panda & Banerjee, 2011). Whenever the participants made two consecutive errors, an automated warning signal appeared. Results indicate a significant effect of automated warning on the false alarm scores. The means reflect a lower false alarm score when automated warning was given. The effect size indicates 35.3% of the change in false alarm score can be attributed by automated warning. The findings of the present study proposes if we can incorporate warning signals to provide feedback to the participants during performance of a visual vigilance task the performance accuracy can be increased. The finding of the study can be used in defense services, industrial set up as well as during performing day to day cognitive tasks that demand sustained attention or vigilance. Keywords: Vigilance, Automated Warning, Error of Commission, Performance *Project Fellow, Centre for the Study of Developmental Disability, Special Assistance Programme (DRS I), University Grants Commission, Department of Psychology, University of Calcutta, 92 Acharya Prafulla Chandra Road, Kolkata – 700009, West Bengal, India. ) *Editorial member of IJIP

Welcome message from author
This document is posted to help you gain knowledge. Please leave a comment to let me know what you think about it! Share it to your friends and learn new things together.
Transcript
The International Journal of Indian Psychology | ISSN 2348-5396 Volume 2, Issue 1, Paper ID: B00273V2I12014 http://www.ijip.in | Oct to Dec 2014
© 2014, A Panda; licensee IJIP. This is an Open Access Research distributed under the terms of the Creative Commons Attribution License (http://creativecommons.org/licenses/by/2.0), which permits unrestricted use, distribution, and reproduction in any Medium, provided the original work is properly cited.
Automated Warning Reduces Error of Commission in Vigilance:
A Study on Indian Adults
Dr. Amrita Panda*
ABSTRACT:
The spotlight regarding the concept of vigilance somehow was limited to the national security for
decades. With technological advancement the concept of vigilance has attained importance in
industrial set up. But vigilance as a cognitive aspect in regular life was somehow neglected
throughout these years. An automated warning system is a sensory stimulation meant to reduce
errors in highly loaded cognitive tasks. Previous research findings suggest that performance
efficiency is uninfluenced by warning (Helton et. al., 2008) or a higher error of omission
reported in the presence of warning signals (Helton et. al., 2011). But how it affects cognitive
process like vigilance is rarely been explored. The present study attempts to reveal the effect of
warning on vigilance. Participants were 95 adults chosen from metropolitan areas of Kolkata,
India. Participant’s Intelligence, processing speed and accuracy along with their psychiatric
morbidity was controlled statistically. Finally, the participants were given a visual vigilance task
using a software program (Panda & Banerjee, 2011). Whenever the participants made two
consecutive errors, an automated warning signal appeared. Results indicate a significant effect of
automated warning on the false alarm scores. The means reflect a lower false alarm score when
automated warning was given. The effect size indicates 35.3% of the change in false alarm score
can be attributed by automated warning. The findings of the present study proposes if we can
incorporate warning signals to provide feedback to the participants during performance of a
visual vigilance task the performance accuracy can be increased. The finding of the study can be
used in defense services, industrial set up as well as during performing day to day cognitive tasks
that demand sustained attention or vigilance.
Keywords: Vigilance, Automated Warning, Error of Commission, Performance
*Project Fellow, Centre for the Study of Developmental Disability, Special Assistance
Programme (DRS I), University Grants Commission, Department of Psychology, University of
Calcutta, 92 Acharya Prafulla Chandra Road, Kolkata – 700009, West Bengal, India. )
*Editorial member of IJIP
Automated Warning Reduces Error of Commission in Vigilance: A Study on Indian Adults
© The International Journal of Indian Psychology | 127
INTRODUCTION
Vigilance, or sustained attention, refers to the ability to monitor displays for stimulus events over
prolonged periods of time. Sustained attention requires the ability to detect unpredictable and
rare events over an extended period of time (Robbins, 1998), and includes vigilance, the state of
alertness for infrequent and irregular events (Parasuraman et. al., 1998; Davies & Parasuraman,
1982). The term ‘vigilance’ as applied to human behavior was coined by Sir Henry Head (1923),
who referred to it as a state of maximum physiological and psychological readiness to react.
However, the origin of modern vigilance research, as in many other areas of human factors, was
in the Second World War.
Systematic research on vigilance began with Mackworth’s (1948) pioneering research that
suggested of a decline in performance efficiency over the period of watch, known as the
vigilance decrement or the decrement function. It has been replicated in many studies and is the
most commonly observed effect in vigilance or sustained attention research (Davies &
Parasuraman, 1982; Matthews et. al., 2000; Warm, 1993; Warm et. al., 2008). Vigilance tasks
are useful for understanding the control of attention and the nature of attentional deficits
(Broadbent, 1971; Manly et. al., 1999).
The traditional tasks used in studies of sustained attention are long detection tasks of scarcely
occurring signals (Mackworth, 1948; Botella et al, 2001; Grier et. al., 2003). In many studies a
vigilance decrement is found, indexed as a decline in the detection rate over time, showing its
full strength after 20 to 35 min. However, in other studies, using more complex tasks, no such
decline of performance has been found (Warm, 1984). Several hypotheses have been described
to account for the vigilance decrement. Some investigators (Stuss, 1995; Robertson et al, 1997)
state that the vigilance decrement is a consequence of attentional withdrawal of the supervisory
attentional system, due to underarousal caused by the insufficient workload inherent to typical
vigilance tasks. Others (Temple et al, 2000; Grier et al, 2003) view the decrement as the result of
a decrease of attentional capacity and thus as the impossibility to sustain the effort due to the
mental workload.
Vigilance as a cognitive aspect has interested researchers for decades. But the spotlight regarding
the concept of vigilance somehow was limited to the defense services and national security. With
technological advancement the concept of vigilance has attained importance in industrial set up.
But vigilance as a cognitive aspect in regular life is not explored too vividly and somehow was
neglected till recent years. With the increased complexities of human life styles, exposure to
numerous stimuli at any given point of time, it seems that successful accomplishment of
cognitive tasks on regular basis demand individuals to be more vigilant than ever. Thus, the
concept that was monopolized by the national securities or industrial settings to some extent is
now viewed as a global necessity of every single individual to ensure success in all aspects of
daily life. Starting from crossing a busy road to attend a complex classroom lecture, to
understand an individual’s exact personality pattern amongst his/her apparent behavioral
complexities, to be successful in a debate competition, individuals not only require sustained
Automated Warning Reduces Error of Commission in Vigilance: A Study on Indian Adults
© The International Journal of Indian Psychology | 128
attention but they are required to be extremely vigilant to successfully accomplish the cognitive
processes. The present study thus aims to explore vigilance as a cognitive aspect of day to day
life and highlight if automated warning affect vigilance performance or not.
The importance of vigilance has vaulted to the forefront of current social concerns regarding
detection of terrorist activities (Hancock & Hart, 2002). Such tasks characterize many human-
machine interactions in automated systems (Howell, 1993; Nickerson, 1992). Sustained attention
also plays a critical role in many applied settings, such as process and quality control, medical
monitoring, and baggage inspection (Hancock & Hart, 2002; Wickens & Hollands, 2000).Yet
until recently, psychologists and human factors researchers typically viewed vigilance tasks by
virtue of their repetitiveness and simplicity as tedious and cognitively undemanding (Heilman,
1995). However, studies using the NASA-Task Load Index (NASA-TLX; Hart & Staveland,
1988) have shown that the mental workload of vigilance tasks is substantial (Deaton &
Parasuraman, 1993; Warm et. al., 1996).
An automated warning system is a sensory stimulation meant to reduce errors in highly loaded
cognitive tasks. An automated warning system is supposed to give an alert when an individual is
about to meet a danger. There is significant interest among traffic management personnel in the
use of automated warning systems to provide drivers with real-time information on hazardous
conditions related to traffic, limited visibility, or roadway obstructions. However, the
effectiveness of such systems in safety improvements has not yet been well quantified. With the
increase in automation, the concept of automated warning had been increasingly used in
industrial setup. But how it affects vigilance as a cognitive process is not yet explored
extensively. The present study attempts to throw light on the interrelationship of vigilance and
automated warning and aims to reveal if warning actually reduces performance decrement, or
decreases performance accuracy inducing anxiety or reduces performance decrement initially,
but heightens anxiety that result in performance decrement in long run. So that it can be used
more widely during vigilance tasks or suggestions can be made regarding more cautious use of
automated warning during vigilance task.
Previous research findings suggest that performance efficiency is uninfluenced by warning
(Helton et. al., 2008) or introduction of warning signals reduced RT (Ponsford & KInsella, 1992;
Van Zomeren et. al., 1984). Previous research shows that with the introduction of knowledge of
result (KR) performance in vigilance task was more stable over time in the KR condition,
performance declined in the no-KR condition (Shaw et. al. 2009). Helton et. al. (2011) claims
that with the use of warning response times were faster, errors of commission lower, but errors of
omission higher in the reliable-warning task in comparison with the no-warning . In another
intriguing study of knowledge of results, Loeb and Schmidt (1960) found suggestive
evidence that false knowledge of results also improves subject’s performance on auditory
vigilance tasks. Again, Szalma et. al. (2006) investigated the impact of knowledge of results
(KR) format on the performance and stress associated with a vigilance task and revealed that
there is a trade-off in the effectiveness of KR in reducing false alarms and misses.
Automated Warning Reduces Error of Commission in Vigilance: A Study on Indian Adults
© The International Journal of Indian Psychology | 129
On the backdrop of these research findings that present study aims to explore the effect of
automated warning on vigilance in clinically normal participants.
METHOD
Participants
The participants were selected using random sampling technique. Participants were 95 clinically
normal individuals (Mean age=22.62, SD=6.51) chosen from higher secondary schools or
colleges or from professional institutions of metropolitan areas of Kolkata, India. Participants
were instructed adequately and were briefed about the nature of the study. Written permission
was taken from the institutions they belonged to, at the same time participant’s individual
consent was also taken. The samples were assessed according to their socio-economic status,
intelligence capacity, general health and clerical speed and accuracy scores. Measures on all
these variables were controlled statistically.
Selection Criteria
Inclusion Criteria
1. Age between 18-35 years
2. Belong to middle or upper-middle socioeconomic status
3. Motivation (as per verbal report) and available time to participate in experimental
sessions.
Exclusion Criteria
1. Presence of any past psychiatric illness or organic disorder or chronic illness.
2. Presence of any mental disability.
3. Presence of any physical disability.
4. Lack of motivation for the treatment or lack of time availability to attend the sessions.
Tools Used
Information Schedule: An information schedule is used to collect personal and familial
information about the subject. The schedule was prepared by the present investigator as
per the requirements of the present study.
GHQ: A Bengali adaptation (Basu and Dasgupta, 1996) of the 30-item General Health
Questionnaire (GHQ) of Goldberg (1972) was used as a unidimensional measure for
Automated Warning Reduces Error of Commission in Vigilance: A Study on Indian Adults
© The International Journal of Indian Psychology | 130
screening functional psychiatric illness to detect non-psychotic psychiatric disturbances
in a variety of settings
Standard Progressive Matrices: Standard Progressive Matrices by J. C. Raven (1938)
was used to measure the intellectual functioning of the participants.
DAT- Speed and Accuracy Test: The Clerical Speed and Accuracy subtest of Differential
Aptitude Test (DAT) developed by G. K. Bennett, H. G. Seashore and A. G. Wesman
(1947) was used to measure individual's speed and accuracy in cognitive tasks in normal
participants.
A software program: The participants were given a visual vigilance task using a
software program (Panda et. al., 2011). They were asked to detect a target stimulus, that
is, a small pink rounded rectangle or small yellow rounded rectangle in respective trials
among randomly occurring buffer stimuli of different color, size and shape. The target
stimulus was discriminable from the non-target stimuli. Participants were asked to press a
particular key on computer whenever they see a target stimulus to occur on computer
screen. Whenever participants made two consecutive errors in target stimulus detection, a
warning signal occurred. The warning was visual in nature and appeared as a big red
colored star in the middle of the screen. The response of the participants were measured
in terms of successful detection of target stimuli (hit), failure in detection of a target
stimuli (miss) and response given to a buffer stimuli in lieu of target stimuli (false alarm).
Procedure
First, the samples, following the selection criteria was randomly chosen for the
study. All the participants were explained about the present study and were assured
about confidentiality of their responses and identity.
The participants were given the information schedule, GHQ, SPM, DAT Speed and
Accuracy. DAT Speed and Accuracy was administered as the stimulus was a
software program and response involved computer application. It was assumed that
processing speed accuracy would be a variable to control to observe only the effect
of warning.
Then the vigilance task was given to each of the samples using the software
program.
For the vigilance task there was a Control Condition (CC) and an Experimental
Conditions (EC1). In the Control Condition only the visual vigilance task was given
to the samples.
In EC1 along with the vigilance task, whenever the subject made two consecutive
errors an automated warning was given to warn them about their response errors in
the assigned task and to suggest that they need to be more cautious about their
subsequent response choices.
The response of the participants from both the conditions was taken into account in
terms of hit scores and false alarm scores.
Data Computation and Statistical Analyses
Automated Warning Reduces Error of Commission in Vigilance: A Study on Indian Adults
© The International Journal of Indian Psychology | 131
At first, the data were tabulated following the scoring key of each checklist and for each
individual separately. The entire data was then analyzed using SPSS 21.
RESULT
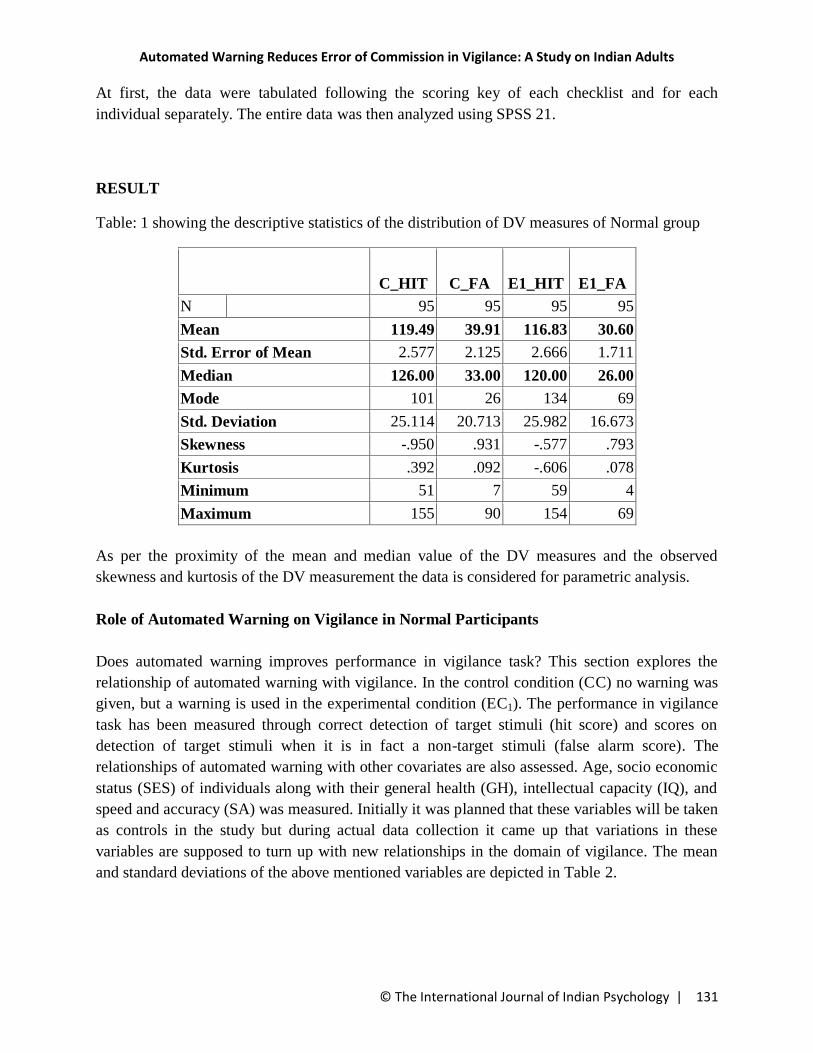
Table: 1 showing the descriptive statistics of the distribution of DV measures of Normal group
C_HIT C_FA E1_HIT E1_FA
N 95 95 95 95
Mean 119.49 39.91 116.83 30.60
Std. Error of Mean 2.577 2.125 2.666 1.711
Median 126.00 33.00 120.00 26.00
Mode 101 26 134 69
Std. Deviation 25.114 20.713 25.982 16.673
Skewness -.950 .931 -.577 .793
Kurtosis .392 .092 -.606 .078
Minimum 51 7 59 4
Maximum 155 90 154 69
As per the proximity of the mean and median value of the DV measures and the observed
skewness and kurtosis of the DV measurement the data is considered for parametric analysis.
Role of Automated Warning on Vigilance in Normal Participants
Does automated warning improves performance in vigilance task? This section explores the
relationship of automated warning with vigilance. In the control condition (CC) no warning was
given, but a warning is used in the experimental condition (EC1). The performance in vigilance
task has been measured through correct detection of target stimuli (hit score) and scores on
detection of target stimuli when it is in fact a non-target stimuli (false alarm score). The
relationships of automated warning with other covariates are also assessed. Age, socio economic
status (SES) of individuals along with their general health (GH), intellectual capacity (IQ), and
speed and accuracy (SA) was measured. Initially it was planned that these variables will be taken
as controls in the study but during actual data collection it came up that variations in these
variables are supposed to turn up with new relationships in the domain of vigilance. The mean
and standard deviations of the above mentioned variables are depicted in Table 2.
Automated Warning Reduces Error of Commission in Vigilance: A Study on Indian Adults
© The International Journal of Indian Psychology | 132
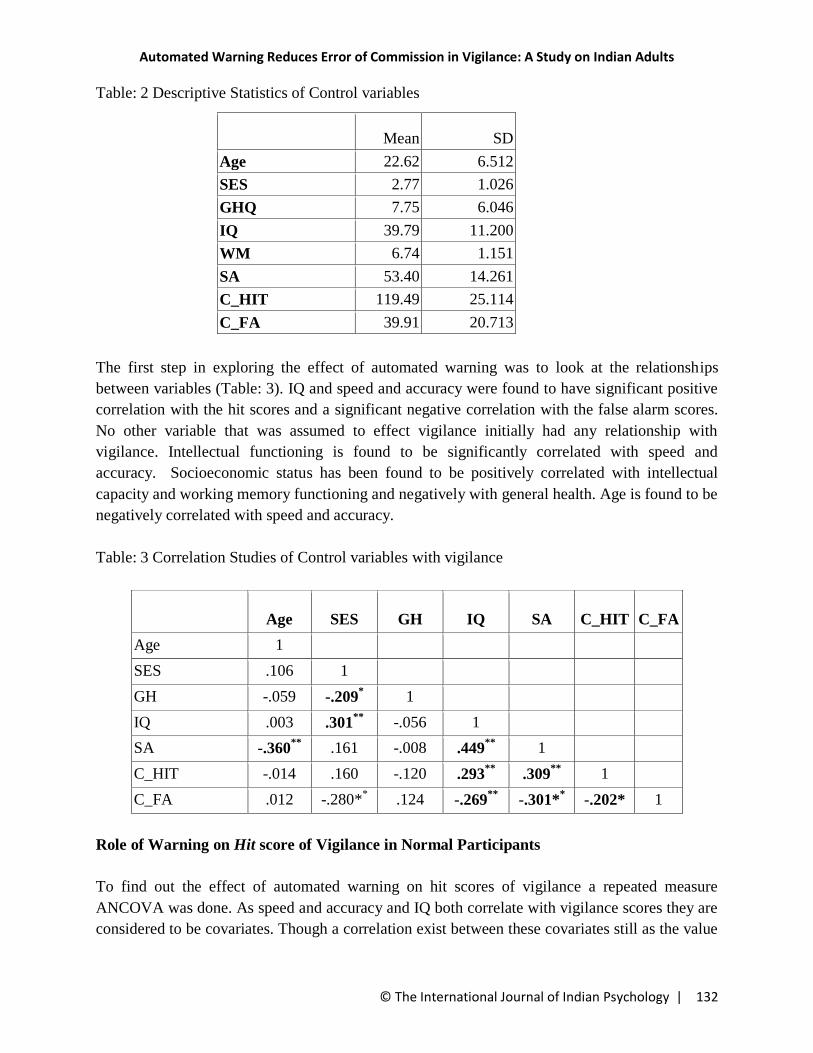
Table: 2 Descriptive Statistics of Control variables
The first step in exploring the effect of automated warning was to look at the relationships
between variables (Table: 3). IQ and speed and accuracy were found to have significant positive
correlation with the hit scores and a significant negative correlation with the false alarm scores.
No other variable that was assumed to effect vigilance initially had any relationship with
vigilance. Intellectual functioning is found to be significantly correlated with speed and
accuracy. Socioeconomic status has been found to be positively correlated with intellectual
capacity and working memory functioning and negatively with general health. Age is found to be
negatively correlated with speed and accuracy.
Table: 3 Correlation Studies of Control variables with vigilance
Age SES GH IQ SA C_HIT C_FA
Age 1
SES .106 1
GH -.059 -.209* 1
IQ .003 .301**
-.056 1
SA -.360**
.161 -.008 .449**
1
C_HIT -.014 .160 -.120 .293**
.309**
1
C_FA .012 -.280** .124 -.269
** -.301*
* -.202* 1
Role of Warning on Hit score of Vigilance in Normal Participants
To find out the effect of automated warning on hit scores of vigilance a repeated measure
ANCOVA was done. As speed and accuracy and IQ both correlate with vigilance scores they are
considered to be covariates. Though a correlation exist between these covariates still as the value
Mean SD
Age 22.62 6.512
SES 2.77 1.026
GHQ 7.75 6.046
IQ 39.79 11.200
WM 6.74 1.151
SA 53.40 14.261
C_HIT 119.49 25.114
C_FA 39.91 20.713
Automated Warning Reduces Error of Commission in Vigilance: A Study on Indian Adults
© The International Journal of Indian Psychology | 133
of correlation is less than .5 it’s considered as low correlation and hence they fulfill the criteria of
being covariates in a repeated measure ANCOVA design.
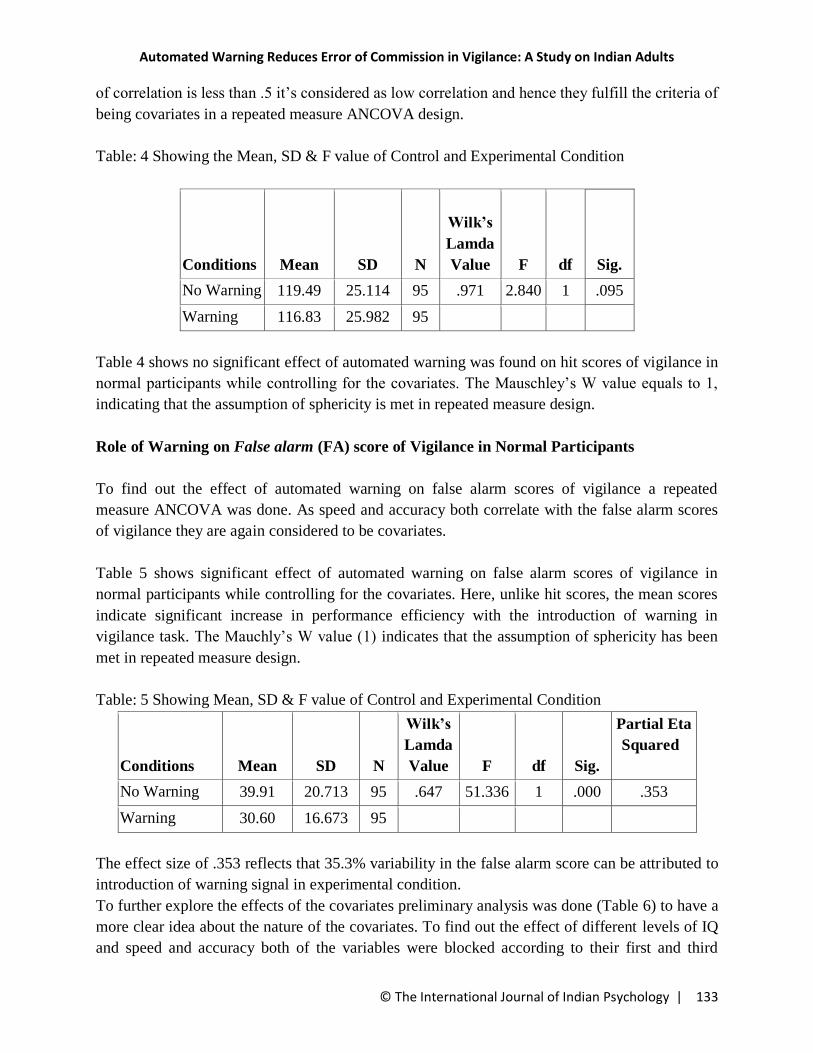
Table: 4 Showing the Mean, SD & F value of Control and Experimental Condition
Conditions Mean SD N
Wilk’s
Lamda
Value F df Sig.
No Warning 119.49 25.114 95 .971 2.840 1 .095
Warning 116.83 25.982 95
Table 4 shows no significant effect of automated warning was found on hit scores of vigilance in
normal participants while controlling for the covariates. The Mauschley’s W value equals to 1,
indicating that the assumption of sphericity is met in repeated measure design.
Role of Warning on False alarm (FA) score of Vigilance in Normal Participants
To find out the effect of automated warning on false alarm scores of vigilance a repeated
measure ANCOVA was done. As speed and accuracy both correlate with the false alarm scores
of vigilance they are again considered to be covariates.
Table 5 shows significant effect of automated warning on false alarm scores of vigilance in
normal participants while controlling for the covariates. Here, unlike hit scores, the mean scores
indicate significant increase in performance efficiency with the introduction of warning in
vigilance task. The Mauchly’s W value (1) indicates that the assumption of sphericity has been
met in repeated measure design.
Table: 5 Showing Mean, SD & F value of Control and Experimental Condition
Conditions Mean SD N
Wilk’s
Lamda
Value F df Sig.
Partial Eta
Squared
No Warning 39.91 20.713 95 .647 51.336 1 .000 .353
Warning 30.60 16.673 95
The effect size of .353 reflects that 35.3% variability in the false alarm score can be attributed to
introduction of warning signal in experimental condition.
To further explore the effects of the covariates preliminary analysis was done (Table 6) to have a
more clear idea about the nature of the covariates. To find out the effect of different levels of IQ
and speed and accuracy both of the variables were blocked according to their first and third
Automated Warning Reduces Error of Commission in Vigilance: A Study on Indian Adults
© The International Journal of Indian Psychology | 134
quartile. Hence the blocking resulted in two IQ groups – high and low and two speed and
accuracy groups – high and low.
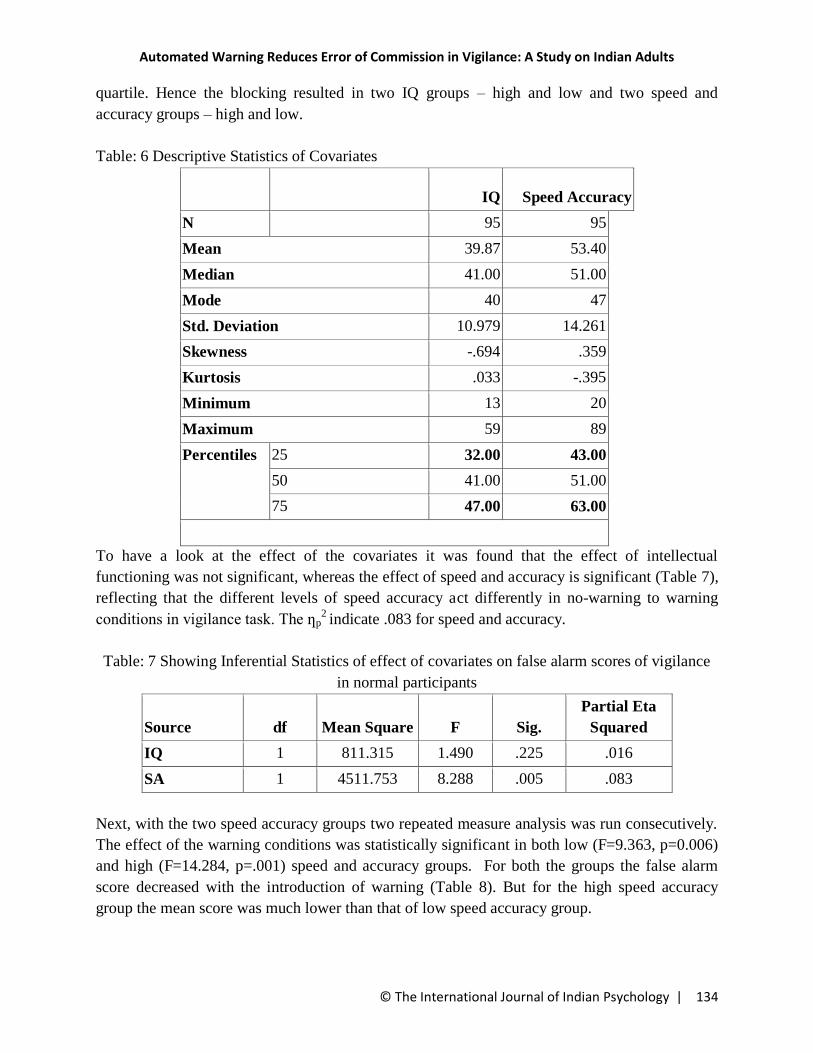
Table: 6 Descriptive Statistics of Covariates
IQ Speed Accuracy
N 95 95
Mean 39.87 53.40
Median 41.00 51.00
Mode 40 47
Std. Deviation 10.979 14.261
Skewness -.694 .359
Kurtosis .033 -.395
Minimum 13 20
Maximum 59 89
Percentiles 25 32.00 43.00
50 41.00 51.00
75 47.00 63.00
To have a look at the effect of the covariates it was found that the effect of intellectual
functioning was not significant, whereas the effect of speed and accuracy is significant (Table 7),
reflecting that the different levels of speed accuracy act differently in no-warning to warning
conditions in vigilance task. The ƞp2 indicate .083 for speed and accuracy.
Table: 7 Showing Inferential Statistics of effect of covariates on false alarm scores of vigilance
in normal participants
Source df Mean Square F Sig.
Partial Eta
Squared
IQ 1 811.315 1.490 .225 .016
SA 1 4511.753 8.288 .005 .083
Next, with the two speed accuracy groups two repeated measure analysis was run consecutively.
The effect of the warning conditions was statistically significant in both low (F=9.363, p=0.006)
and high (F=14.284, p=.001) speed and accuracy groups. For both the groups the false alarm
score decreased with the introduction of warning (Table 8). But for the high speed accuracy
group the mean score was much lower than that of low speed accuracy group.
Automated Warning Reduces Error of Commission in Vigilance: A Study on Indian Adults
© The International Journal of Indian Psychology | 135
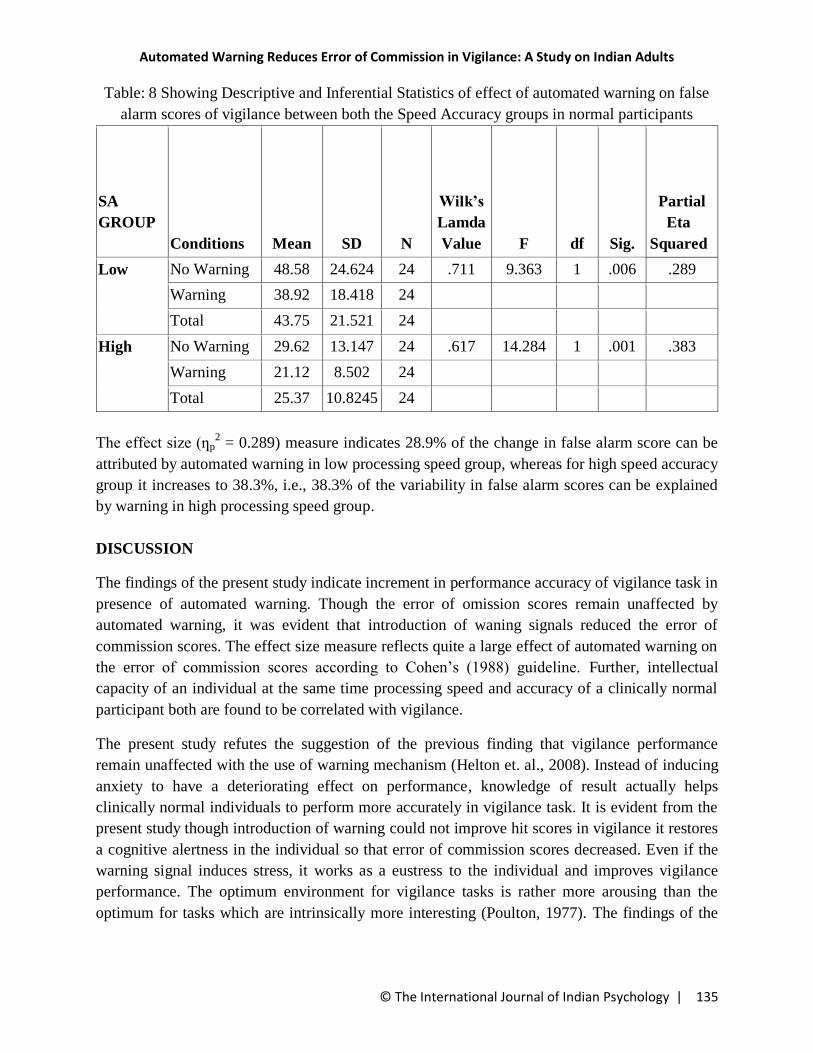
Table: 8 Showing Descriptive and Inferential Statistics of effect of automated warning on false
alarm scores of vigilance between both the Speed Accuracy groups in normal participants
SA
GROUP
Conditions Mean SD N
Wilk’s
Lamda
Value F df Sig.
Partial
Eta
Squared
Low
No Warning 48.58 24.624 24 .711 9.363 1 .006 .289
Warning 38.92 18.418 24
Total 43.75 21.521 24
High No Warning 29.62 13.147 24 .617 14.284 1 .001 .383
Warning 21.12 8.502 24
Total 25.37 10.8245 24
The effect size (ƞp2 = 0.289) measure indicates 28.9% of the change in false alarm score can be
attributed by automated warning in low processing speed group, whereas for high speed accuracy
group it increases to 38.3%, i.e., 38.3% of the variability in false alarm scores can be explained
by warning in high processing speed group.
DISCUSSION
The findings of the present study indicate increment in performance accuracy of vigilance task in
presence of automated warning. Though the error of omission scores remain unaffected by
automated warning, it was evident that introduction of waning signals reduced the error of
commission scores. The effect size measure reflects quite a large effect of automated warning on
the error of commission scores according to Cohen’s (1988) guideline. Further, intellectual
capacity of an individual at the same time processing speed and accuracy of a clinically normal
participant both are found to be correlated with vigilance.
The present study refutes the suggestion of the previous finding that vigilance performance
remain unaffected with the use of warning mechanism (Helton et. al., 2008). Instead of inducing
anxiety to have a deteriorating effect on performance, knowledge of result actually helps
clinically normal individuals to perform more accurately in vigilance task. It is evident from the
present study though introduction of warning could not improve hit scores in vigilance it restores
a cognitive alertness in the individual so that error of commission scores decreased. Even if the
warning signal induces stress, it works as a eustress to the individual and improves vigilance
performance. The optimum environment for vigilance tasks is rather more arousing than the
optimum for tasks which are intrinsically more interesting (Poulton, 1977). The findings of the
Automated Warning Reduces Error of Commission in Vigilance: A Study on Indian Adults
© The International Journal of Indian Psychology | 136
present study support the suggestions of previous findings (Shaw et. al. 2009; Helton et. al.,
2011) that warning improves vigilance.
Vigilance had traditionally been associated with low cognitive demand and vigilance decrement
with a decline in arousal pursuant to the low cognitive demand (Frankmann & Adams, 1962) but
these views are no longer widely held. More recent studies indicate that vigilance is hard work,
requiring the allocation of significant cognitive resources, and inducing significant levels
of stress (Parasuraman & Davies, 1977). Reductions in arousal generally correspond to
reductions in vigilance. Arousal is a component of vigilance, though not, as once believed, the
sole source of the main effect of the vigilance decrement (Moruzzi & Magoun, 1949) As
such, subcortical brain regions associated with arousal play a critical role in the performance of
vigilance tasks. Because the amygdala plays an important role in the recognition of emotional
stimuli, it appears to be an important brain structure in the regulation of vigilance (Sternberg,
2009).
Further, the present study reveals a probable relationship between vigilance and both intellectual
capacity and processing speed accuracy, suggesting that increase in intellectual capacity and
processing speed improves vigilance. It could be noticed that individuals with high processing
speed got more benefited by warning as compared to their counterparts. Research indicate that
measures of intelligence are significantly correlated with mental speed and that for some
measures this relationship shows a trend toward strengthening as the complexity of the speeded
tasks increase (Leah & Vernon, 2008). Further, individuals with faster perceptual speed tend to
also have faster processing in general on mundane tasks that require them to identify a basic
stimulus and respond. Vernon argued that processing information faster neurologically may
permit for one to learn more. However, although research is hinting towards a connection
between neurological processing speed and intelligence, there are no definitive answers as to
why of yet. Many leading researchers believe that it is a result of overall more efficient cognitive
processing. Hence, the participants who were high in processing speed are more efficient to
receive the warning signals and make the most use of it. Thus the study emphasizes the role of
processing speed and accuracy in successful accomplishment of vigilance task.
Overall the study indicates if we can incorporate warning signals to provide feedback to the
participants during performance of a visual vigilance task the performance accuracy can be
increased. The finding of the study can be used in defense services, industrial set up as well as
during performing day to day cognitive tasks that demand sustained attention or vigilance.
KEY POINTS
Vigilance as a cognitive aspect in day to day life has not been explored too vividly in the
history of vigilance research.
The present study aims to explore the effect of automated warning on vigilance.
Automated Warning Reduces Error of Commission in Vigilance: A Study on Indian Adults
© The International Journal of Indian Psychology | 137
Results reflect no significant effect of warning on error of omission scores but error of
commission scores were significantly reduced with the introduction of warning in
vigilance task.
The study suggests if auto-suggestions or warning systems can be incorporated in regular
cognitive tasks that require vigilance, performance accuracy of normal adults can be
improved.
REFERENCE
1. Basu, S. & Dasgupta, S. K. (1996). Adaptation of GHQ-28 into Bengali. Department of
Applied Psychology. Kolkata: University of Calcutta.
2. Bennett, G. K., Seashore, H. G., & Wesman, A. G. (1947). Differential Aptitude Tests,
Form A. New York: Psychology Corporation.
3. Botella J., Contreras M.J., Shih P.C., & Rubio V. (2001). Two short tests fail to detect
vigilance decrements. European Journal of Psychological Assessment, 17, 48-55.
4. Broadbent, D. E. (1971). Decision and stress. New York: Academic Press.
5. Cohen, J. (1988). Statistical Power Analysis for the Behavioral Sciences (2nd ed.), New
Jersey: Lawrence Erlbaum Associates.
6. Davies, D. R., & Parasuraman, R. (1982). The Psychology of Vigilance. London:
Academic.
7. Deaton, J. E., & Parasuraman, R. (1993). Sensory and cognitive vigilance: Effects of age
on performance and mental workload. Human Performance, 6, 71–97.
8. Frankmann, J.P. & Adams, J.A. (1962). Theories of Vigilance. Psychological Bulletin,
59, 257-272.
9. Goldberg, D. P. (1972). The detection of psychiatric illness by questionnaire. London,
Oxford University Press.
10. Grier, R. A., Warm, J. S., Dember, W. N., Matthews, G., Galinsky, T. L., Szalma, J. L. et
al. (2003). The vigilance decrement reflects limitations in effortful attention, not
mindlessness. Human Factors, 45, 349-359
11. Hancock, P. A., & Hart, S. G. (2002). Defeating terrorism: What can human
factors/ergonomics offer? Ergonomics in Design, 10(1), 6–16.
12. Hart, S., & Staveland, L. (1988). Development of the NASA-TLX (Task Load Index):
Results of empirical and theoretical research. In P. A. Hancock & N. Meshkati (Eds.),
Human mental workload (pp. 139–183). Amsterdsam: North-Holland.
13. Head, H. (1923). The conception of nervous and mental energy: II. Vigilance: A
physiological state of the nervous system. British Journal of Psychology, 14, 126–147.
14. Helton, S. W.; Shaw, T.; Warm, J. S.; Matthews, G. & Hancock, P. (2008). Effects of
warned and unwarned demand transitions on vigilance performance and stress. Anxiety,
Stress, & Coping, 21(2): 173 - 184.
15. Helton, W.S., Head, J. & Russell, P.N. (2011). Reliable- and unreliable-warning cues in
the sustained attention to response task. Experimental Brain Research, 209, pp. 401–407.
Automated Warning Reduces Error of Commission in Vigilance: A Study on Indian Adults
© The International Journal of Indian Psychology | 138
16. Heilman, K. M. (1995). Attentional asymmetries. In R. J. Davidson & K. Hugdahl (Eds.),
Brain asymmetry (pp. 217–234). Cambridge: MIT Press.
17. Howell, W. C. (1993). Engineering psychology in a changing world. Annual Review of
Psychology, 44, 231–263.
18. Loeb, M., & Schmidt, E. A. (1960). Influence of time on task and false information on
efficiency of responding to pure tones. AMRL 42 6.. Aerospace Medical Research
Laboratories, Wright-Patterson AFB, Ohio.
19. Mackworth, N. H. (1948). The breakdown of vigilance during prolonged visual search.
Quarterly Journal of Experimental Psychology, 1, 6–21.
20. Manly, T., Robertson, I. H., Galloway, M., & Hawkins, K. (1999). The absent mind:
Further investigations of sustained attention to response. Neuropsychologia, 37,
661–670.
21. Matthews, G., Davies, D. R., Westerman, S. J., & Stammers, R. B. (2000). Human
performance: Cognition, stress and individual differences. East Sussex, UK:Psychology
Press.
22. Moruzzi, G. and Magoun, H.W. (1949) Brain stem reticular formation and activation of
the EEG. Clinical Neurophysiology I: 455-473
23. Nickerson, R. S. (1992). Looking ahead: Human factors challenge in a changing world.
Mahwah, NJ: Erlbaum.
24. Panda, A.; Bhattacharya, C. & Banerjee, M. (2011). Does absence of hearing ability
enhance visual vigilance? It depends on task complexity. Psychological Studies, 56, 3,
266-270.
25. Parasuraman, R. & Davies, D.R. (1977). A taxonomic analysis of vigilance. In R.R.
Mackie, (ed.) Vigilance: Theory, operational performance and physiological correlates,
(pp 559–574) New York: Plenum.
26. Parasuraman, R., Warm, J. S., & See, J. E. (1998). Brain systems of vigilance. In R.
Parasuraman (Ed.), The attentive brain (pp. 221–256). Cambridge, MA: MIT Press.
27. Ponsford, J. & Kinsella, G. (1992). Attentional deficits following closed head injury.
Journal of Clinical Experimental Neuropsychology, 14:822–838.
28. Poulton, E. C. (1977). Arousing Stresses Increase Vigilance. NATO Conference
Series, Volume 3, pp 423-459
29. Raven, J. C. (1938). Progressive matrices: A perceptual test of intelligence. London:
H.K. Lewis & Co. Ltd.
30. Robbins T. W. (1998) Arousal and attention: psychopharmacological and
neuropsychological studies in experimental animals. In: The Attentive Brain (ed. R.
Parasuraman), pp. 189–220. The MIT Press, Cambridge, MA.
31. Shaw, T. H., Warm, J. S., Finomore, V. S., Tripp, L., Matthews, G., Weiler, E., &
Parasuraman, R. (2009). Effects of sensory modality on cerebral blood flow velocity
during vigilance. Neuroscience Letters, 461, 207-211.
Automated Warning Reduces Error of Commission in Vigilance: A Study on Indian Adults
© The International Journal of Indian Psychology | 139
32. Sheppard, L. D. & Vernon, P. A. (2008). Intelligence and speed of information-
processing: A review of 50 years of research. Personality and Individual Differences.
Volume 44, Issue 3, Pages 535–551.
33. Sternberg, R. (2009). Cognitive Psychology. Belmont, CA: Wadsworth, Cengage
Learning. p. 145.
34. Stuss, D. T. (1995). A Sensible Approach to Mild Traumatic Brain Injury. Neurology, 45,
1251-1252.
35. Szalma, J. L., Hancock, P. A., Warm, J. S., Dember, W. N., & Parsons, K. S. (2006).
Training for vigilance: Using predictive power to evaluate feedback effectiveness.
Human Factors, 48, 682-692.
36. Temple, J. G., Warm, J. S., Dember, W. N., Jones, K. T. S., LaGrange, C. M., &
Matthews, G. (2000). The effects of signal salience and caffeine on performance,
workload, and stress in an abbreviated vigilance task. Human Factors, 42, 183-194.
37. Van Zomeren, A. H., Brouwer, W. H., & Deelman, B. G. (1984) Attentional deficits: the
riddles of selectivity, speed, and alertness. In: Brooks N (ed) Closed head injury:
psychological, social, and family consequences. Oxford University Press, New York, pp
74–107
38. Warm, J. S. (1993). Vigilance and target detection. In B. M. Huey & C. D. Wickens
(Eds.), Workload transition: Implications for individual and team performance (pp. 139 -
170). Washington, DC: National Academy Press.
39. Warm, J. S., Matthews, G., & Finomore, V. S. (2008). Workload, stress, and vigilance. In
P. A. Hancock & J. L. Szalma (Eds.), Performance under stress (pp. 115–141).
Brookfield, VT: Ashgate.
40. Warm, J. S., Parasuraman, R., & Matthews, G. (2008). Vigilance Requires Hard Mental
Work and Is Stressful. Human Factors, Vol. 50, No. 3, June 2008, pp. 433–44.
41. Warm, J. S., Dember, W. N., & Hancock, P. A. (1996). Vigilance and workload in
automated systems. In R. Parasuraman & M. Mouloua (Eds.), Automation and human
performance: Theory and applications (pp. 183–200) Mahwah, NJ: Erlbaum.
42. Wickens, C. D., & Hollands, J. G. (2000). Engineering psychology and human
performance (3rd
ed.). Upper Saddle River, NJ: Prentice Hall.
Related Documents