Estimating Visitor Use at Attraction Sites and Trailheads Using Automated Visitor Counters David Pettebone, Ph.D. Social Scientist Yosemite National Park PO Box 700-W El Portal, CA 95318 Peter Newman, Ph.D. Associate Dean of Academic Affairs Colorado State University 233 Forestry Building Fort Collins, CO 80523 Steve Lawson, Ph.D. Senior Project Consultant Resources Systems Group 55 Railroad Row White River Junction, VT 05001

Welcome message from author
This document is posted to help you gain knowledge. Please leave a comment to let me know what you think about it! Share it to your friends and learn new things together.
Transcript

Estimating Visitor Use at Attraction Sites and Trailheads Using Automated Visitor Counters
David Pettebone, Ph.D. Social Scientist
Yosemite National Park PO Box 700-W
El Portal, CA 95318
Peter Newman, Ph.D. Associate Dean of Academic Affairs
Colorado State University 233 Forestry Building
Fort Collins, CO 80523
Steve Lawson, Ph.D. Senior Project Consultant Resources Systems Group
55 Railroad Row White River Junction, VT 05001

1
1 Introduction
Baseline data on visitor use is essential for informed planning and management of
national park units, as such information provides an empirical basis to: 1) assess visitor impacts
to the resource; 2) estimate the quality of the visitor experience; and 3) guide visitor facilities
planning (Loomis, 2000). Further, in a survey of state and federal land managers in the United
States of America (U.S.A.), respondents identified visitor use data as being necessary to inform
trail planning projects, justify funding, and support day-to-day trail management (Lynch, Vogt,
Cindrity, & Nelson, 2002). However, visitor use data are not always available and can be
difficult to collect. While all national park units are required to track overall visitor use levels
(i.e, parkwide visitation), more spatially precise information about the amount of visitor use
(e.g., visitation to key venues within a national park unit) is much less commonly recorded
because of the costs and challenges of doing so. In fact, lack of funding and personnel time,
logistical problems, and lack of training about available methods to collect and analyze visitation
data have been identified as primary reasons why visitor use has not been measured more
systematically in national parks and related protected natural areas (Watson, Cole, Turner, &
Reynolds, 2000).
Recently, automated visitor counters have gained recognition as a potentially cost
efficient and relatively easy way for land managers to estimate recreational visitation. Park
managers and researchers have applied visitor use data to a variety of efforts to inform park
planning efforts. Applications of visitor use data to park planning and management include
quantifying visitor use at trailheads (Lindsey & Ngyuen, 2004; Pettebone, Newman, Beaton,
Gibson, & Stack, 2008), developing statistical models of visitor use (Chen, Bloomsfield, & Fu,
2003; Lawson, Newman, Choi, Pettebone, & Meldrum, 2008; Lindsey, Han, Wilson, & Yang,

2
2006a; Lindsey & Lindsey, 2004; Lindsey, Wilson, Rubchinskaya, Yang, & Han, 2006b), and
informing computer simulation modeling of visitor use (Lawson, 2006). Information derived
from these analytical efforts provides important baseline data from which to understand the
timing and location of visitor use throughout a protected area. Knowledge of current use
conditions is critical to developing effective visitor management strategies to ensure natural
resources and the quality of the visitor experience are protected (Loomis, 2000; Manning, 2008).
As a tool for collecting visitor use data, automated visitor monitors have the advantages
of requiring little maintenance, being able to operate continuously for periods of weeks or
months, and causing minimal or no disturbance to visitors (Watson et al. 2000). A survey of land
managers in the U.S.A. including 169 state land managers and 175 federal land managers found
55.2% of state land managers and 73.3% of federal land managers use mechanical/electronic
counting devices to gauge visitor use on trails. Furthermore, about 75% of these land managers
cited using these data for future planning and capital projects (Lynch et al. 2002).
Despite relatively widespread reliance on automated visitor monitors to estimate
recreation visitation, previous research suggests that land managers consider the devices to be
ineffective because of the difficulties associated with installation of the units and calibration of
the recorded data (Lynch et al. 2002). Several other studies have documented, empirically, the
fact that there is some amount of error associated with all visitation data collected via automated
visitor monitors (Bates, Wallace, & Vaske, 2007; Gracia-Longares, 2005; Lindsey et al. 2006;
Muhar, Arnberger, & Brandenburg 2002). Factors that contribute to data error include the
physical aspects of the monitoring locations (e.g., trail slope and width). For example, on a wide
trail, people walking side by side in groups increases the chances of not all visitors being
detected by a mechanical counter. In contrast, narrow trails force people to walk single file and

3
pass a counter one at a time, increasing the chances that all passing visitors will be detected by
the monitor. Likewise, monitors placed in areas where visitors tend to pause, such as overlooks
and trail junctions, will count an individual multiple times if they pause within the counter’s
range of detection. Automated visitor monitors are also subject to error resulting from climatic
conditions such as heavy snow, blowing vegetation, visitor tampering, and/or direct sunlight
striking the monitor’s “receiving eye” at sunrise or dusk (Vaske, Shelby, & Donnelly, 2008).
Thus, raw data from automated counters cannot be treated as reliable and accurate measures of
visitor use. Rather, automated visitor counters must be calibrated to estimate data error and
convert raw counter data to reliable estimates of visitation.
Despite the prevalence of studies involving the use of automated visitor monitors and the
inherent error in visitor use counts recorded with these devices, few studies have documented
specific calibration methods to convert raw data to reliable visitation estimates. Of those studies
that do document calibration methods, Watson et al. (2000) provide the most thorough
description, including discussion of sampling methods to calibrate monitors and basic statistical
analyses to estimate visitor use from automated counter data. The authors describe observer-
based counting techniques to correct automated monitor counting errors but do not suggest
observation lengths for each observation sampling period (e.g., 30 minutes vs. one hour).
Likewise, Bates et al. (2006) used infrared monitors to estimate visitor use in Rocky Mountain
National Park (NP), U.S.A. and conducted observation-based calibration counts over three days
during the 2004 summer season. However, the authors do not describe the methods by which
they selected the number of observation sampling days and duration of observation sampling
periods. Both studies (Watson et al., 2000; Bates et al., 2006) conclude that it is necessary to
calibrate automated visitor counters through direct observations in order to calculate accurate

4
estimates of visitor use. However, neither study provides sufficient detail about calibration
methods to allow for their procedures to be replicated.
Based on the studies previously described, automated visitor counters are typically
calibrated through human observation. However, certain precautions need to be accounted for in
the data collection protocol to ensure that counts are accurate. Specifically, previous research
suggests the number of variables collected by an observer effects data accuracy. For example,
Arnberger, Haider, and Brandenburg (2005) collected various data about visitor use including: 1)
number of visitors; 2) type of user group; 3) group size; 4) direction of travel; 5) number of dogs
off leash; and 6) and time of visit. These data were collected by human observers and video
recording devices simultaneously in order to test the accuracy of counts collected by humans
observers versus electronic video observation. Results from this study indicate that at high levels
of overall use (>120 pph) field observers reported 20% less visitors compared to video
interpreters. In a similar study, Greene-Roesel, Diogenes, Ragland, and Lindau (2008) collected
pedestrian counts through direct human observation and electronic video observation to calibrate
automated pedestrian counters. Observers only collected overall visitor use counts (i.e. no
distinctions were made to identify direction of travel). Results indicated little difference between
human observations and video observations (-0.9% to 1.4%) even during periods of high visitor
use (e.g. 654 people per hour). These studies suggest that data collection protocols need to
minimize the number of variables collected by an observer to ensure reliable counts derived
through human observation.
Several studies have examined correlations between observed counts and those recorded
via automated visitor monitors, and those studies have generally reported strong correlations. For
example, Muhar et al. (2002) present results that show a very strong correlation between monitor

5
counts and observed counts (R²=0.94), but no details of observation methods to correct monitor
counting errors are provided. Lindsey et al. (2006) used automated visitor monitors to estimate
visitor use on urban trails in Indianapolis, Indiana U.S.A over a four year period. Within the
study, infrared monitors were installed at 28 locations to conduct automated counts of visitor use.
In addition, a total of 442 hours of direct observation counts were conducted at the 28 locations
where infrared monitors were operating. The observation and automated monitor data were
aggregated for the 28 locations, and regression analyses were conducted to estimate a correction
factor to apply to data recorded by all 28 automated monitors. While the estimated correlation
between observation and automated monitor data was very high (R²=0.99), the standard error
associated with the correction factor was not estimated.
Gracia-Longares (2005) used automated visitor monitors to estimate visitor use in
Yellowstone NP, U.S.A. and examined the effects of the duration of observation-based
calibration counting periods on the precision of corresponding estimated correction factors. In
particular, correlation coefficients were estimated based on 4-hour, 1-hour, 30 minute, and 15
minute observation-based calibration counting periods (each totaling four hours of observation –
i.e., a single 4-hour period, four 1-hour periods, eight 30-minute periods, and 16 15-minute
periods). Correlation coefficients were highest for the data collected via 4-hour sampling periods
and decreased as the duration of the observation period decreased. The largest decrease in the
correlation between observed counts and those recorded with the automated visitor monitors
occurred between the 1-hour observations and the 30 minute observations. Moreover, while data
from all observation lengths resulted in similar correction factors, the precision of correlation
estimates improved with data based on longer observation periods. These results suggest that
sampling periods for observation-based calibration counts should be at least one hour in duration.

6
However, all of the study sites were relatively low use areas (< 75 people / day) and the
conclusions regarding sampling period duration may not apply in higher use areas.
In some cases, errors contained within automated visitor monitor data are sufficiently
excessive that they can be relatively easy to detect from visual inspection and should be excluded
from the dataset prior to analyses. For example, automated visitor monitors have been reported to
malfunction, causing the devices to record an inordinately large number of pass-by events; in
other case, devices malfunction and record no pass-by events during periods of time and in
locations where substantive levels of visitation are expected. One method for treating data errors
of this nature is to estimate counts for missing or otherwise obviously erroneous data from
known automated visitor monitor counts with similar characteristics. For example, missing data
from a given Tuesday can be estimated from the previous and following Tuesday counts
(Lindsey & Nguyen, 2004; Vaske et al. 2008). This method of substitution simplifies
calculations of population parameters because all data from the population are accounted for and
assumes no errors in parameter estimates. However, this method may not be appropriate for
datasets containing more than a few occurrences of missing or otherwise obviously erroneous
data because population parameter estimates may result in misleading estimates of statistical
precision (Scheaffer, Mendanhall III, & Ott, 2006).
In summary, the use of automated visitor monitors for estimating recreational visitation
in protected natural areas is relatively common, yet data from such devices are subject to several
sources of error. Consequently, raw data from automated visitor monitors universally require
some form of calibration to generate valid and reliable estimates of visitor use. However, few
published studies have comprehensively documented methodological procedures and/or
empirical results for calibrating recreational visitation data recorded with automated visitor

7
monitors. Consequently, standardized methods to calibrate automated visitor monitors are yet to
be established. The purpose of this paper is to document systematic sampling and analysis
methods for collecting and calibrating visitor use data recorded via automated visitor monitoring
devices. Specifically, this paper describes the collection and calibration of automated counter
data to estimate current visitor use levels at popular attraction areas within the Merced Wild and
Scenic River watershed in Yosemite NP, U.S.A.
2 Sampling Methods
2.1 Study Location
Yosemite NP is centrally located in the Sierra Nevada mountain range in California,
U.S.A. and protects 285,151 hectares of rugged mountain terrain. Yosemite NP has some of the
most spectacular scenery in the National Park Service (NPS) and views of glacier carved valleys
can be seen from many locations throughout the park. People from around the world come to
experience Yosemite NP and visitation reached 3.5 million visitors in 2007 (NPS, 2008).
Yosemite Valley is the most popular destination area in the park, offering iconic views of
glacial features, including El Capitan and Half Dome. The Merced River bisects the north and
south sides of Yosemite Valley and is designated a Wild and Scenic River in order to protect its
free-flowing condition and unique values (NPS, 2005). Vehicle access is along a one-way road
that enters from the west end of Yosemite Valley and follows the south side of the Merced River.
About 90% of visitors to Yosemite NP arrive by automobile and 87% of visitors cite “taking a
scenic drive” as their favorite activity in the park (White & Aquino, 2008).
The design and layout of roads, parking, and facilities within Yosemite Valley were
never meant to accommodate the intensive amount of vehicle traffic they receive today.
Consequently, traffic congestion in Yosemite Valley is common during periods of peak

8
visitation. For example, on a typical day between May and September, up to 1,900 day use
vehicles at a time are in Yosemite Valley competing for approximately 1,200 designated day-use
parking spaces. During the summer, the main day-use visitor parking area fills to capacity
between 11:00 am and 1:00 pm. As a result, visitor use at attraction sites during peak hours is
very high, posing potential threats to the integrity of park resources and the quality of visitors’
experiences. Consequently, the NPS requires precise information about visitation to key venues
within Yosemite Valley to inform decisions about how to manage visitor use in a manner that is
consistent with resource protection and visitor experience objectives.
2.2 Automated Visitor Monitor Equipment
TrailMaster TM1550 active infrared monitors were deployed to estimate visitor use at
selected attraction sites and trailheads in Yosemite Valley. These devices are designed to monitor
and study wildlife, but have also been successfully applied to recreation use monitoring in
protected natural areas (Bates et al., 2006; Gracia-Longares, 2005; Vaske & Donnelly, 2007).
The TrailMaster TM1550 monitor system is comprised of a transmitter and a receiver placed on
opposite sides of a trail. Infrared energy is emitted from the transmitter in short pulses and is
detected by the receiver. The receiver registers a count when the infrared beam is interrupted by
the presence of a physical object, such as a hiker. The TM1550 model used in this study stores
up to 16,000 pass-by events, with each recorded event containing a date and time stamp accurate
to the minute. A pass-by event is defined here as any event (i.e., a hiker that passes between the
monitor transmitter and receiver regardless of the direction of travel) that triggers a count on the
infrared monitoring device. The study monitors stop registering time stamped events when their
memory reaches capacity (i.e., when 16,000 counter events are registered on a single unit). A
TrailMaster DataCollector is used to download data from the monitors in the field and to upload

9
data to a personal computer in an office environment. With each data download, the counter’s
memory is cleared by deleting the existing data and reset to its maximum storage capacity (i.e.,
16,000 counter events) for the next monitoring period. Within this study, the time interval
between data downloads was scheduled individually for each counter based on the relative
intensity of use at each counter location (i.e., the expected number of days by which the memory
capacity would be reached).
2.3 Automated Visitor Monitor Locations
Because of the paucity of information about calibration techniques within existing
literature, a pilot study was conducted to estimate the number of sampling hours that would be
required to collect the necessary amount of observation data needed to calibrate data from the
automated visitor monitors with a sufficient level of precision. We anticipated that the accuracy
and associated calibration sampling effort required for the automated visitor monitors would vary
as a function of the level of visitor use at each monitoring location. In particular, we expected
monitor counts to be less accurate in locations with higher levels of use, where it is common for
multiple visitors to pass-by the monitoring device simultaneously. Thus, we conducted the pilot
study on the Yosemite Falls trail because visitor use changes dramatically throughout the day
and we consequently expected the location would provide a comprehensive evaluation of data
requirements for calibration under a range of visitor use levels. The site was also selected for the
pilot study because it contains trail segments of varying widths, thus providing an empirical basis
to assess calibration sampling effort requirements for a range of trail widths. Therefore, data
collection for the pilot study involved placing an automated visitor monitor proximate to each of
the two access points to Lower Yosemite Falls.

10
Implementation of the full study involved purposively placing automated visitor monitors
at popular attraction sites and trailheads in Yosemite Valley, selected by researchers in
consultation with Yosemite NP staff (Figure 1 and Table 1). Several factors were considered in
the process of selecting specific locations at which to install the monitors. In particular, narrow
trail sections were selected, as they are places where visitors are most likely to walk single file.
Locations were also selected where there was a straight and clear line of sight between
transmitter and receiver to ensure a strong signal between the components. Selected monitoring
locations also provided some form of cover where the automated visitor monitors could be
hidden from trail users so as not to degrade the visitor experience and/or increase the likelihood
of vandalism to the monitors. Finally, monitors were installed in locations away from trail
junctions or areas of interest, as these are locations where visitors tend to pause and could
consequently be counted multiple times by the monitoring devices.
Table 1 Locations of study sites where automated visitor monitors were installed Monitor Number Location Use Level
Date Placed in Field
1 Yosemite Falls (West) High May 19, 2007
2 Yosemite Falls (East) High May 19, 2007
3 Vernal Fall Trailhead High May 23, 2007
4 Bridalveil Fall High May 24, 2007
5 Glacier Point (Main Trail) High June 2, 2007
6 Glacier Point (Handicap Accessible Trail) Low June 25, 2007
11
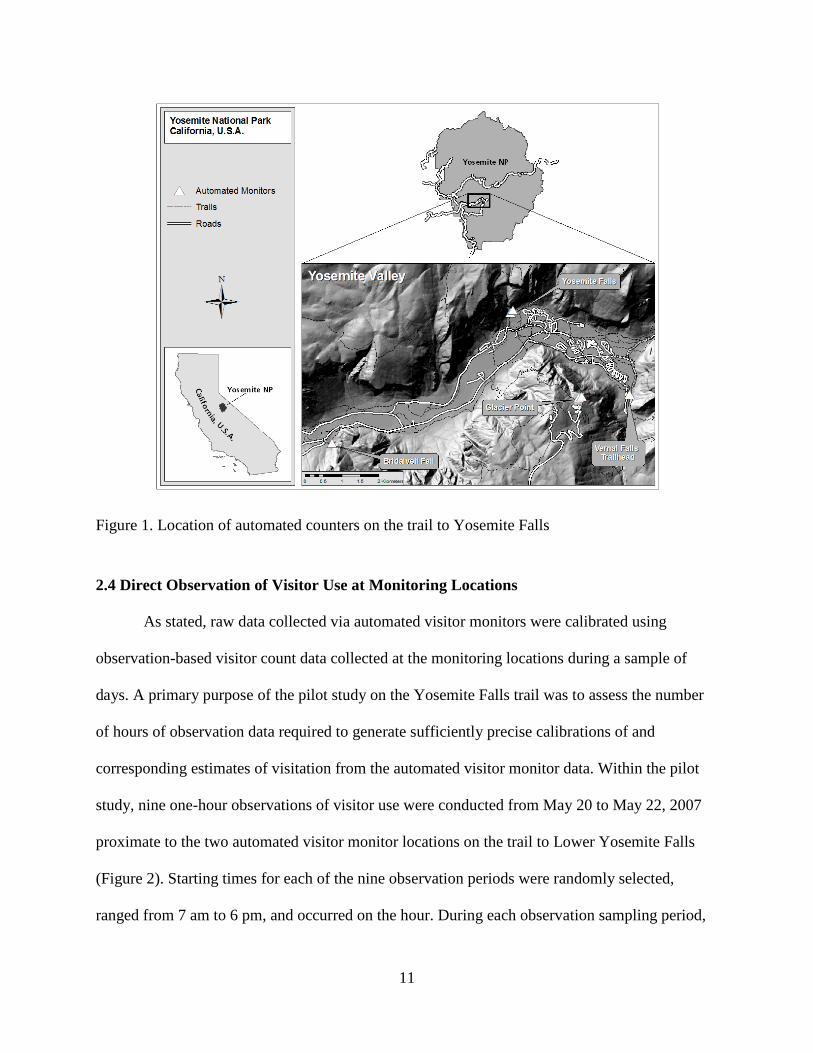
Figure 1. Location of automated counters on the trail to Yosemite Falls
2.4 Direct Observation of Visitor Use at Monitoring Locations
As stated, raw data collected via automated visitor monitors were calibrated using
observation-based visitor count data collected at the monitoring locations during a sample of
days. A primary purpose of the pilot study on the Yosemite Falls trail was to assess the number
of hours of observation data required to generate sufficiently precise calibrations of and
corresponding estimates of visitation from the automated visitor monitor data. Within the pilot
study, nine one-hour observations of visitor use were conducted from May 20 to May 22, 2007
proximate to the two automated visitor monitor locations on the trail to Lower Yosemite Falls
(Figure 2). Starting times for each of the nine observation periods were randomly selected,
ranged from 7 am to 6 pm, and occurred on the hour. During each observation sampling period,

12
Figure 2. Locations of Yosemite Valley visitor monitors
one observer was stationed proximate to each of the two automated monitors to assess each
device’s performance and collect calibration data (i.e., direct observation of the number of visitor
pass-bys and visitors’ direction of travel). Data collection was limited to 2 variables (i.e. visitor
arrivals and departures) to ensure the data accuracy. In addition, observers were provided with
thumb counters (one for arrivals and one for departures) to ensure that observers could visually
focus on visitors as they passed the automated monitor. The observers recorded data in 15-
minute intervals on a standardized form that included entries for: 1) observed visitor arrival and
departure counts; and 2) automated visitor monitor counts recorded at the beginning and end of
each observation period (i.e., the number of pass-bys recorded by the monitor during the hour of
observation-based counting).

13
The observation data were used in a two-step process to calibrate visitor pass-by data
recorded by the automated visitor monitors. First, the observation data were used to correct for
error in the devices’ detection of pass-by events, as described in the following section entitled
“Analytical Methods”. Second, the observation data were used to scale the calibrated pass-by
events, which include events for arriving and departing visitors, to estimates of the number of
calibrated pass-by events associated with arriving visitors (i.e., site visitation). The scaling
procedure takes into account changes in the proportions of arriving and departing visitors, by
time of day. For example, at some study sites there is a greater proportion of arriving than
departing visitors during the morning hours, and a greater proportion of departing than arriving
visitors later in the day.
3 Analytical Methods
Several analytical steps were conducted to convert raw data recorded via automated
visitor monitors to precise estimates of visitor use at the study sites in Yosemite Valley. In
particular, the pilot study data from the Yosemite Falls trail were analyzed to estimate the direct
observation sampling effort required to provide sufficiently precise calibrations of the automated
visitor monitor data collected at the study sites. Second, bootstrap techniques were used to
account for missing automated monitor data and estimate mean pass-by events per hour, day,
month, and season for each monitoring device. Third, regression analyses were performed to
estimate calibration or correction factors for the automated visitor monitor data from each site,
based on the visitor use count data (i.e., calibration data) collected via direct observation. Fourth,
correction factors were applied to the bootstrap-estimated mean pass-by events per hour, day,
month, and season. Fifth, the calibrated mean pass-by results were scaled to arrivals based on the

14
proportion of arrivals versus departures, by time of day, recorded via direct observation. The
following sections of the paper describe these analytical methods in detail.
3.1 Estimation of Direct Observation Sampling Effort Required for Precise Calibration
As stated, a primary purpose of the pilot study on the Yosemite Falls trail was to estimate
the number of hours of calibration data needed to produce sufficiently precise estimates of
visitation for the study sites. Results of the pilot study were used in equation 1 to estimate
required calibration sample size (i.e., hours of observation data required) to achieve sufficiently
precise calibrations of the automated visitor monitor data (Scheaffer et al. 2006).
2
2
σσ+
=ND
Nn (1)
Where: n = required sample size (number of hourly observation periods) N = total number of hourly observation periods during study
2σ = variance (estimated from the pilot study) B = error of average hourly visitor use estimation D = B² / 4
From these equations, the number of hours required to achieve 1%, 2%, 3%, 4% and 5%
error were estimated (Table 2). Due to the limitations of scheduling and travel time between
study sites 24 hours of direct observations were chosen to be conducted at each study site.
Twenty-four hours of direct observations were estimated to yield an error of approximately 3.5%
at unit 2 and 4.5% at unit 3 and were used as a baseline for all study sites. For each study site, six
direct observation sampling days were randomly selected between June 1 – August 31 and four
one-hour periods within each selected sampling day between 7 am – 6 pm during which to
conduct direct observations were randomly selected. Of note, only 16 hours of observations were
conducted at unit 6 because this site was not considered a priority and due to equipment

15
availability an automated visitor monitor was not installed at this site. However, an automated
visitor monitor became available in late June and was installed at this time. The sampling
schedule for this was coordinated with unit 5 and resulted in 16 hours of direct observations.
Table 2 Estimated Number of Sampling Hours Required at Yosemite Falls
Monitor Location Percent Error Number of Sampling Hours
2 5% 10
2 4% 15
2 3% 26
2 2% 59
2 1% 205
3 5% 20
3 4% 31
3 3% 54
3 2% 117
3 1% 393
3.2 Bootstrap Analysis to Account for Missing Automated Visitor Monitor Data
Following sampling at all study locations, data from the automated visitor monitors were
uploaded to a personal computer using TrailMaster Stat Pack software. Data were collected from
the mechanical counters between June 1 and September 30, 2007. The data were imported into
the database program Microsoft Access and queried using structured query language (SQL) to
aggregate the time-stamped data from the automated visitor monitors into: 1) total pass-by events
recorded during the sampling season (June 1-September 30); 2) pass-by events per month; 3)

16
pass-by events per day, by day of the week and month; and 4) pass-by events per hour. However,
some counter data were lost during the season due to operating issues (e.g., a counter’s memory
reached capacity before research technicians were able to conduct a data download), thus total
and mean pass-by events computed based on the raw data are biased due to missing data.
Examination of the raw data from the automated visitor monitors revealed most of the data to be
positively skewed, thus, classic statistical methods were not appropriate to estimate population
parameters. Therefore, we used bootstrapping methods to estimate mean pass-by events, by
period of time (i.e., hour, day, month, season), to account for the fact that all of the monitors had
some instances of missing data.
Bootstrapping is a resampling method to make statistical inferences from a distribution
that approximates the distribution of a population (Crawley, 2005; Scheaffer et al. 2006). In this
case, the approximating distributions are the incomplete datasets of monitor counts and the
population distributions are the corresponding complete sets of monitor counts that would have
resulted without device operating issues and other sources of missing data. The approximating
distribution is randomly sampled with replacement at sample size n from the original sample of
size n many times (i.e., 1,000+ times) to estimate statistical parameters for the population
distribution (mean hourly, daily, and seasonal pass-bys in this case). A distribution of means is
obtained from the 1,000+ samples and the mean of this distribution is the estimated mean for the
population.
We created a script using the ‘R’ statistical program to resample the raw data for each
monitor 10,000 times to estimate mean hourly, daily, monthly, and summer season pass-bys for
each monitor. For study sites with multiple monitors, however, data from each monitor at the

17
study site were summed and bootstrapping was performed on the combined data to estimate
mean hourly, daily, monthly, and summer season pass-by events, in total, at the study site.
3.3 Calculating Correction Factors
Mean hourly pass-bys recorded by the automated monitors during calibration sampling
were paired with corresponding mean hourly pass-bys counted through direct observation to
estimate correction factors for each automated monitor. The specific methods used to estimate
correction factors for monitors at study sites with a single monitoring location differed from
those used at study sites with multiple monitoring locations, as described in the following
sections.
3.4 Study Sites with a Single Monitoring Location
Two of the study sites, Vernal Fall and Bridalveil Fall, each required just one monitoring
location from which to record visitor pass-bys as a basis to estimate site visitation. For each of
these two study sites with a single monitoring location, linear regression modeling was used to
estimate a correction factor (r) for the automated visitor monitor to convert bootstrap-estimated
mean hourly, daily, monthly, and summer season pass-bys to calibrated estimates of mean
hourly, daily, monthly, and summer season pass-bys. Each linear regression model (i.e., one for
each automated visitor monitor) was specified with the hourly visitor pass-bys recorded by the
automated visitor monitor during calibration sampling hours entered as the independent variable
and the corresponding observation-based counts of hourly visitor pass-bys specified as the
dependent variable. Thus, for monitors 1-5, there were 24 pairs of automated monitor and direct
observation counts entered into the regression model, and 16 pairs of counts entered into the
regression model for monitor 6. Further, in keeping with ratio estimation techniques, each
regression model was specified with no constant term, to force the regression line through the

18
origin. Within each regression model, the estimated regression coefficient for the independent
variable serves as the correction factor (r) for converting bootstrap-estimated mean hourly, daily,
monthly, and summer season pass-bys from the corresponding automated visitor monitor to
calibrated estimates of mean hourly, daily, monthly, and summer season pass-bys.
3.5 Study Sites with Multiple Monitoring Locations
Two of the study sites, Yosemite Falls and Glacier Point, each required more than one
monitoring location from which to record visitor pass-bys as a basis to estimate site visitation.
For several reasons, the methods for estimating correction factors for automated visitor monitors
at single-monitor sites are not sufficient to estimate correction factors at multiple-monitor sites.
In particular, each automated visitor monitor, whether it be at a single-monitor or multiple-
monitor site, has a unique correction factor (r) and standard error of r (SEr) value. Moreover, the
relative amount of use varies at each access point within the two multiple-monitor sites;
consequently, visitor pass-by counts from each monitor have differently weighted contributions
to estimates of mean and total site visitation. For these reasons, it was necessary to adapt single-
monitor site regression modeling methods, as described in the following paragraph, to estimate
weighted values of r and SEr for each automated monitor within each multiple-monitor site,
based on the relative number of pass-by events recorded by each monitor.
For each of the two study sites with multiple monitoring locations, regression models
were estimated separately for each automated visitor monitor. Each linear regression model (i.e.,
one for each automated visitor monitor) was specified with the hourly visitor pass-bys recorded
by the automated visitor monitor during calibration sampling hours entered as the independent
variable and the corresponding observation-based counts of hourly visitor pass-bys specified as
the dependent variable. Further, in keeping with ratio estimation techniques, each regression

19
model was specified with no constant term, to force the regression line through the origin.
Within each regression model, the estimated regression coefficient for the independent variable
serves as the correction factor (r) for the corresponding automated visitor monitor. In the case of
the multiple-monitor sites, the estimated correction factor for each automated visitor monitor was
entered into a pair of equations to compute a composite correction factor and standard error,
based on weighting regression results from each monitor. Study data from Yosemite Falls are
used in the following equations 2-3 to demonstrate the procedures used to estimate weighted
calibration factors for automated visitor monitors within multiple-monitor study sites.
( ) ( ) ( ) ( ) 77003.1520,367
689,13866902.1831,22883125.1ˆ
ˆˆ 2211 =⋅+⋅
=⋅+⋅
=combined
unitunitunitunitcombined
rrr
τττ (2)
( ) ( ) ( ) ( ) 01769.520,367
689,13801704.831,22801808.ˆ
ˆˆ 2)2(1)1()( =
⋅+⋅=
⋅+⋅=
combined
unitunitrunitunitrcombinedr
SESESE
τττ
(3)
3.6 Calculating Visitor Use from Monitor and Calibrations
Correction factors estimated via regression analyses and bootstrap estimates of mean
hourly, daily, monthly, and summer season pass-bys for each study site were used in the
following formulae to estimate calibrated mean hourly, daily, monthly, and summer season pass-
bys at each study site (equations 4-8). In the case of multiple monitor sites (i.e., Yosemite Falls
and Glacier Point), the composite correction factor and standard error are used in the equations to
estimate the calibrated mean number of pass-bys at the study site, by period of time.

20
( ) ( )xrX ˆˆ ⋅= (4)
Var ( ) [ ]2)(rSEr = (5)
Var( X̂ ) = ( x̂ )² ( )rVar⋅ (6)
( ) ( )XVarXB ˆ2ˆ ⋅= (7)
( ) BXXCI ±= ˆˆ (8)
Where:
X̂ = calibrated mean (hourly, daily, monthly, or summer season) pass-bys r = correction factor (composite value in the case of multiple monitor sites)
x̂ = bootstrap-estimated mean (hourly, daily, monthly, or summer season) pass-bys Var = variance of the correction factor SE = standard error of the correction factor (composite value in the case of multiple monitor sites) B = bounds of estimation CI = confidence interval
Finally, data concerning visitors’ direction of travel recorded in a companion study
conducted in Yosemite Valley (Lawson et al. 2008) were used to convert calibrated mean hourly,
daily, monthly, and summer season pass-bys to estimates of hourly, daily, monthly, and summer
season visitation. In particular, estimates from the companion study of the proportion of pass-bys
constituting visitor arrivals (rather than departures), by hour of the day, were applied to the
calibrated mean hourly pass-bys to estimate mean hourly visitation to each study site. To
estimate daily, monthly, and summer season visitation, the corresponding calibrated mean
number of pass-bys was multiplied by 0.5, because all study sites are day use sites and
consequently all arriving visitors are assumed to depart at some time during the day.
4 Results
4.1 Monitor Calibration
At all study sites, monitor counts were highly correlated with observed counts.
Scatterplots of observed counts and monitor counts at Bridalveil Fall (Unit 4) and Glacier Point

21
(Unit 5) demonstrate this strong relationship (Figure 3). The same strong relationship between
observed and monitor counts was found at all of the other study sites.
Observed vs. Monitor Counts at Bridalveil Fall
0
200
400
600
800
1000
1200
1400
1600
0 100 200 300 400 500 600 700 800
Monitor Count
Obs
erve
r Cou
nt
Observed vs. Monitor Counts on Glacier Point Main Trail
0
100
200
300
400
500
600
700
0 50 100 150 200 250 300 350 400 450
Monitor Count
Obs
erve
r Cou
nt
Figure 3. Scatterplots of observed versus monitor counts for the Bridalveil Fall trail and Glacier
Point main trail
The scatterplots of observed counts versus monitor counts confirmed our choice to use
ratio estimation techniques to calibrate monitor data. For example, direct observation-based and
automated visitor monitor counts of visitor pass-bys plotted in Figure 3 shows these variables to
be highly correlated at all levels of use, pass through the origin, and are slightly more variable at
higher levels of use (Scheaffer et al., 2006). Thus, simple linear regression models with the
regression line forced through the origin were estimated and produced very strong model fits
(Table 3).

22
Table 3 Regression analysis results with regression line forced through origin for all automated monitors
Unit β* SE R² df F p
1 1.83125 .01808 .9977 1,23 10,025 <.001
2 1.66902 .01704 .9976 1,23 9,588 <.001
3 1.70400 .01900 .9973 1,22 8,036 <.001
4 1.82560 .03570 .9917 1,22 2,615 <.001
5 1.72431 .02707 .9944 1,23 4,057 <.001
6 1.56545 .08539 .9600 1,15 336 <.001
* The regression coefficient (β ) constitutes the correction factor (r) for the corresponding monitor.
4.2 Estimated Use
This section of the paper presents estimates of seasonal visitation for each study site.
Data from units 1 and 2 were combined to estimate use at Yosemite Falls and data from units 5
and 6 were combined to estimate use at Glacier Point. Hourly visitation results for these two
study sites are presented in Figure 4. These estimates show that visitor use at Yosemite Falls
varies by month, day of week, and time of day.
23
Mean Daily Visitation at Yosemite Falls
0
1,000
2,000
3,000
4,000
5,000
6,000
7,000
Monday
Tuesd
ay
Wednes
day
Thursd
ayFrid
ay
Saturda
y
Sunda
y
Peop
le
June
July
August
September
Season
Mean Hourly Visitation at Yosemite Falls
0
50
100
150
200
250
300
350
400
450
500
7:00 A
M
8:00 A
M
9:00 A
M
10:00
AM
11:00
AM
12:00
PM
1:00 P
M
2:00 P
M
3:00 P
M
4:00 P
M
5:00 P
M
6:00 P
M
7:00 P
M
8:00 P
M
Hour
Visi
tatio
n WeekendSeasonWeekday
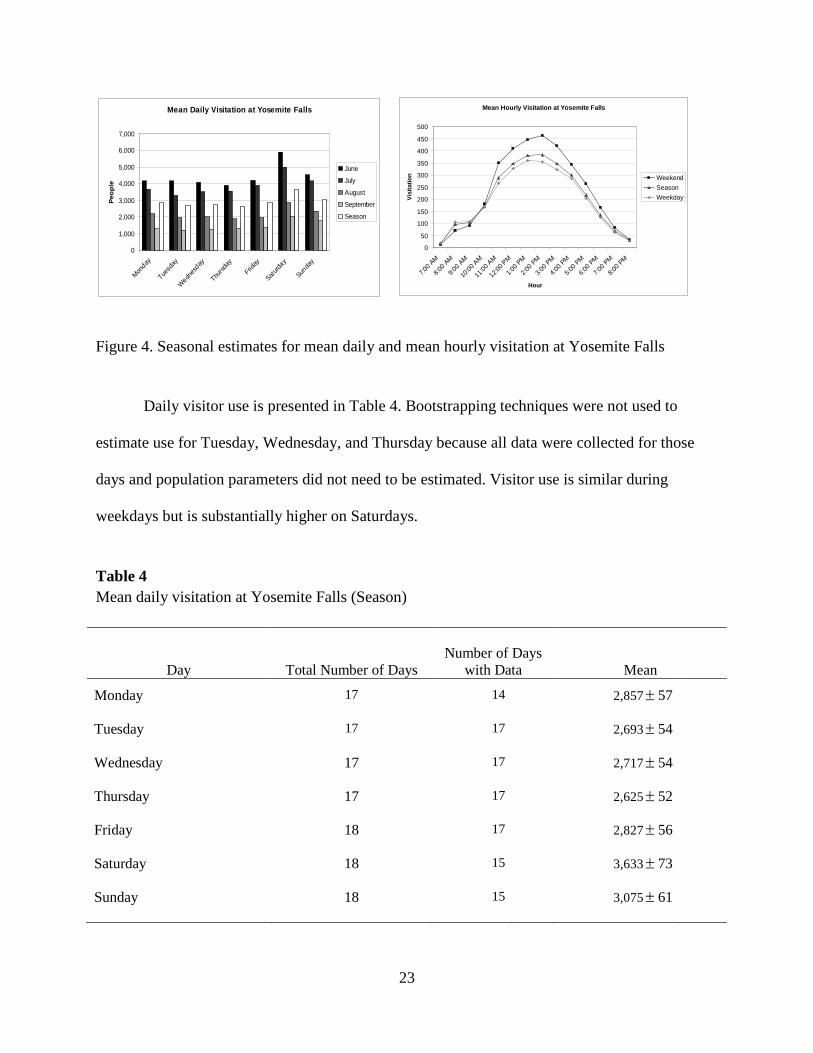
Figure 4. Seasonal estimates for mean daily and mean hourly visitation at Yosemite Falls
Daily visitor use is presented in Table 4. Bootstrapping techniques were not used to
estimate use for Tuesday, Wednesday, and Thursday because all data were collected for those
days and population parameters did not need to be estimated. Visitor use is similar during
weekdays but is substantially higher on Saturdays.
Table 4 Mean daily visitation at Yosemite Falls (Season)
Day Total Number of Days Number of Days
with Data Mean
Monday 17 14 2,857± 57
Tuesday 17 17 2,693± 54
Wednesday 17 17 2,717± 54
Thursday 17 17 2,625± 52
Friday 18 17 2,827± 56
Saturday 18 15 3,633± 73
Sunday 18 15 3,075± 61

24
Finally, calibrated seasonal visitor use totals estimated from bootstrapping are presented
in Table 5. Visitor use during the summer months in Yosemite is very high with over 300,000
people visiting Yosemite Falls and Glacier Point between June and September. In addition, note
the high level of precision of the estimates.
Table 5 Total Estimated Number of People at each Study Location (June 1-September 30)
Unit/ Location
Total Number of Days in Study Period
Number of Days with Data Total
1 122 118 233,335± 4,607
2 122 112 126,040± 2,574
3 122 92 246,606± 5,499
4 122 105 295,613± 11,561
5 122 99 331,862± 10,420
6 122 82 5,145± 561
Yosemite Falls 122 112 354,423± 7,083
Glacier Point 122 75 346,500± 11,273
5 Discussion
This study shows that automated visitor counters produce data from which reliable
estimates of visitor use can be calculated. These results provide important insights for
researchers and park managers using these devices to estimate visitor use in parks and protected
areas. Moreover, the methods described in this paper provide a comprehensive system to collect

25
observation data to calibrate automated visitor counters and produce accurate estimates of visitor
use.
5.1 Monitor Calibration
At all study sites, automated monitor counts were highly correlated to observation based
counts. Regression models calculated from these data produced R² values greater than 0.95 and
significant p-values indicate that all regression coefficients (r) were statistically significant.
These results show that automated raw monitor counts need to be corrected to obtain accurate
estimations of visitor use. Moreover, each automated visitor counter had a unique r and SEr value
suggesting that monitor error is related to how groups of hikers align themselves along the trail
based on local conditions such as slope, trail width, and trail condition and not related to the
overall quantity of use. For example, visitors may walk in a group formation on wide trail
sections while narrow trail sections dictate that groups walk side by side or in single file.
Consistent with Gracia-Longares (2005), we found our correction factors became less
variable as the observation period increased. Large amounts of visitor traffic were often under-
counted during short periods of time (15 minutes or less), however, these errors were generally
offset over the course of an hour by periods when individuals and small groups would be
accurately captured by the monitor. Similarly, people walking side by side during low use
periods only triggered a single count. Again, these errors tended to even out over the course of an
hour.
5.2 Treatment of Missing Data
Bootstrapping was found to be an effective method for treating missing data and offers
three advantages over replacing missing values with means. Bootstrapping does not require a set
of rules to determine how mean values are obtained. Typically, mean values to replace missing

26
data are calculated from the same day of the week from the previous and following weeks of a
missing count. However, there are potential shortcomings to replacing missing values with
means. For example, holidays can affect the results of these calculations or force the researcher
to modify the rules from which the mean is obtained (e.g., the Monday before or after Labor
Day). In addition, replacing missing data with mean values may not be possible for datasets with
more than a few missing points because days from which means are calculated may be missing.
Furthermore, bootstrapping is robust to the amount of missing data because population
parameters can be estimated from datasets missing more than a few data points.
5.3 Other Automated Counting Systems
Since the time this study was conducted the authors have had the opportunity to use other
brands of automated visitor counting devices including EcoCounter (Lannion, France) and
TRAFx counters (Canmore, Canada) to collect visitor use data at other locations in Yosemite
NP. Similar to the TrailMaster counter used in this study, the EcoCounter and TRAFx counters
use active infrared technology, however, these counters offer some advantages over the
TrailMaster model. The EcoCounter is able to detect the direction of travel of a hiker (i.e. this
device distinguishes between arriving and departing hikers) and separate records are kept of
arriving, departing, and total hikers. In addition, the memory capacity of the EcoCounter is much
larger than the TrailMaster counter. The manufacturer does not provide a memory capacity but
based on the device’s screen counts its memory capacity appears to approach 1,000,000 counts.
EcoCounters can also be linked to a wireless network, and assuming connectivity to a wireless
telephone network is available, data can be downloaded directly to a computer in an office. The
TRAFx counters are very similar to TrailMaster counters but offer an option for a larger memory
capacity. TRAFx counters can be set to collect 14,000 time stamped data pass-by events or to

27
collect pass-by counts in 1-hour bins thereby increasing memory capacity to about 1.5 years of
available memory.
The methods described in this paper were used to calibrate and analyze data from the
EcoCounter and TRAFx counters. Results from these studies indicate that both of these devices
behave similarly to the TrailMaster model in terms of counting errors. In other words, the
EcoCounter and TRAFx counters systematically miscounted the number of people passing a
study area but accurate and precise correction factors were derived using the protocols described
in this paper. Furthermore, results indicate that EcoCounters miscounted arrivals and departures
at different rates. Thus, unique correction factors were estimated for arriving and departing
visitor counts to produce accurate estimates of visitor use. This finding is partially substantiated
by Greene-Roesel et al. (2008) that found EcoCounters to undercount pass-by events by -9% to -
19% and suggested that correction factors be developed via direct observation to derive accurate
estimates of pedestrian volumes.
5.4 Implications
These results show that automated visitor monitors can provide data to accurately
estimate visitor use in parks and protected areas. All of the monitors used in this study were
subject to counting errors and correction factors needed to be calculated from observed counts to
calculate accurate estimates of visitor use. These results suggest that researchers and managers
who choose to use automated monitors to estimate visitor use need to provide personnel to
collect direct visitor counts. The necessity of this step cannot be underestimated because counts
from automated monitors that are not calibrated cannot be considered a proxy for visitor use
estimates.

28
One hundred and thirty-five hours of direct observations were collected for the 6
monitors used in this study. Counts greater than zero were obtained during all observations
because all of the study sites were high use areas. However, direct observations to calibrate
automated monitors in low use areas may produce counts of zero during many observation
periods. While a zero count provides relevant and useful data towards estimating correction
factors, it is necessary to obtain a sufficient quantity of counts greater than zero in order to
estimate the variability of a correction factor. Five hours of direct observations with counts
greater than zero are suggested based on a post analysis of required sample size (as described in
equation 1) of calibration data from Unit 1. Results from this post analysis showed that 5 hours
of direct observations would produce an error of approximately 15%. In addition, it is important
to periodically monitor the condition and performance of automated visitor monitors in case of
tampering by visitors or malfunction due to changing environmental conditions. Estimations of
visitor use derived from automated visitor counters without estimating correction factors and
corresponding standard errors should be considered suspect measures of visitation.
Managers who choose to collect visitor use data using automated visitor counters need to
consider the costs of personnel training and field time as part of overall project expenditures.
Training to set up counters and collect calibration data is relatively basic and about a half-day of
training will cover the subject matter. The subsequent amount of time spent in the field by staff
to collect calibration data is relative to the required level of precision by park management. As
previously stated, we recommend at least 5 hours of direct observations, however, more
observations are likely to produce more precise estimates of visitor use. Park managers should
identify how these visitor use data will be used and the required level precision of estimates
before counters are installed at a study site.

29
The analytical process to derive correction factors and estimates of visitor use are not
trivial and the amount of training required will depend on the quantitative analytical abilities of
park staff. The calculations described in this paper can be accomplished using standard
spreadsheet software such as Microsoft Excel but the use of analytical statistical software such as
‘R’ can reduce the amount of time spent on data analysis. In addition, efficient management of
the large amounts of data produced from automated visitor counters is imperative. Standard
database programs such as Microsoft Access can be used to query and simplify large datasets.
Thus, it may be useful for park managers to include time for information technologies (IT) staff
as part of project costs to complete the more technical aspects of the analytical portions of this
process.
5.5 Limitations
While automated monitors are a useful tool to estimate visitor use these devices are not
without limitations. For example, automated visitor counters do not discriminate between
different types of users. Additional sampling via direct observation or video recording is
necessary to estimate the amounts and different types of users along a trail. In addition, visitor
counts from automated visitor counters installed in wilderness areas where visitor use is very low
may be skewed by wildlife passing through a monitor’s detection range. In these cases,
additional sampling may be required to understand typical visitor use patterns and their
correlations to automated visitor counters.
6 Conclusion
Baseline data on visitor use is essential to the planning and management of national park
units. Area administrators must be knowledgeable about the amount, types, locations, and
behaviors of visitor use. Such information is fundamental to address a variety of visitor-use

30
related issues, including visitor use capacity. Recently, automated visitor counters have become
an accepted method for estimating visitor use in parks and protected areas. However, few studies
provide thorough methodologies to correct raw monitor counts in order to calculate estimates of
visitor use. This paper provides methodologies to obtain direct observation counts and calculate
correction factors in order to estimate visitor use from automated visitor counters. Moreover, the
automated visitor monitors used in this study performed consistently well at all study sites and
during all time periods. The findings in this paper provide a methodological base for researchers
and park managers interested in using automated visitor counters to estimate visitor use in parks
and protected areas.
List of References
1. Arnberger, A., Haider, W., Brandenberg, C. (2005). Evaluating visitor-monitoring techniques: A comparison of counting and video observation data. Environmental Management, 36(2) 317-327. 2. Bates, M., Wallace, G., & Vaske, J. J. (2007). Estimating visitor use in Rocky Mountain National Park. (HDNRU Report No. 74). Report for Rocky Mountain National Park. Fort Collins: Colorado State University, Human Dimensions in Natural Resources Unit.
3. Chen, R.J.C., Bloomfield, P., & Fu, J. (2003). An evaluation of alternative forecasting methods to recreation site use. Journal Leisure Res, 35, 441 - 454.
4. Crawley, M.J., (2005). Statistics an introduction using R. West Sussex, England: John Wiley & Sons Ltd.
5. Dwyer, J.F., (1988). Predicting daily use of urban forest recreation sites. Landscape Urban Plan, 15, 127-138. 6. Gracia-Longares, M., (2005). Study of spatial patterns of visitors using mechanical counters, GPS, and GIS technology in the Slough Creek subregion of Yellowstone National Park. Unpublished Master’s thesis, University of Montana, Bozeman, Montana, United States. 7. Greene-Roesel, R., Diogenes, M.C., Ragland, D. R., & Lindau, L.A. (2008). Effectiveness of a commercially available automated pedestrian counting device in urban environments:

31
comparison with manual counts. Berkeley: University of California Berkeley, Safe Transportation Research & Education Center. Retrieved from: http://escholarship.org/uc/item/ 2n83w1q8 8. Lawson, S.R., (2006). Computer simulation as a tool for planning and management of visitor use in protected natural areas. Journal Sustain Tour, 14(6) 600-617. 9. Lawson, S.R., Kiser, B., Hockett, K., Reigner, N., Chamberlain, R., & Choi, J., (2008). Visitor use computer simulation modeling to address transportation planning and user capacity management in Yosemite Valley, Yosemite National Park. Final Report for Yosemite National Park. Blacksburg, VA: Virginia Polytechnic Institute and State University, Forestry Department. 10. Lawson, S., Newman, P., Choi, J., Pettebone, D., & Meldrum, B. (2009). Integrated transportation and user capacity research in Yosemite National Park, the numbers game. Transportation Research Board, 2119, 83-91. 11. Lindsey, P., & Lindsey, G. (2004). Using pedestrian models to estimate urban trail traffic. The Journal of Regional Analysis & Policy. 34(1), 51-68. 12. Lindsey, G. & Nguyen, D.B.L. (2004). Use of greenway trails in Indiana. J Urban Planning-ASCE, 130(4), 213-217. 13. Lindsey, G., Han, Y., Wilson, J., & Yang, J. (2006). Neighborhood correlates of urban trail use. Journal of Physical Activity and Health, 3(S1), 139-157. 14. Lindsey, G., Wilson, J., Rubchinskaya, E., Yang, J., & Han, Y., (2007). Estimating urban trail traffic: Methods for existing and proposed trails. Landscape Urban Plan, 81, 299-315. 15. Loomis, J.B. (2000). Counting on recreation use data: a call for long term monitoring. J Leisure Res, 32(1), 93-96. 16. Lynch, J., Vogt, C., Cindrity, S., & Nelson, C., (2002). Measuring and monitoring trail use: A nationwide survey of state and federal trail managers. Report for Michigan Department of Transportation (via the Pere Marquette Rail-Trail Research Project). Michigan State University, Department of Park, Recreation and Tourism Resources. 17. Manning, R.E., (2008). Parks and carrying capacity commons without tragedy. Corvalis, Oregon: Island Press. 18. Muhar, A., Arnberger, A., & Brandenburg, C., (2002). Methods for Visitor Monitoring in Recreational and Protected Areas: An Overview. Conference proceedings from Monitoring and Management of Visitor Flows in Recreational and Protected Areas. 19. National Park Service, (2008). NPS stats, National Park Service public use statistics office. Retrieved December 1, 2008 from http://www.nature.nps.gov/stats/

32
20. Pettebone, D., Newman, P., Beaton, C., Stack, D., & Gibson, A. (2008). Estimating visitor use in Yosemite National Park. Report for Yosemite National Park. Fort Collins: Colorado State University, Center for Protected Areas Management & Training. 21. Scheaffer, R.L., Mendenhall, W., & Ott, R.L., (2006). Elementary survey sampling (6th ed.). Belmont, CA: Duxbury.
22. Vaske, J. J. & Donnelly, M. P., (2007). Estimating visitor use at Boulder Open Space and Mountain Parks: Summer 2004-2006 Comparisons. (HDNRU Report No. 79). Report for Boulder Open Space and Mountain Parks. Fort Collins: Colorado State University, Human Dimensions in Natural Resources Unit.
23. Vaske, J.J., Shelby, L.B, & Donnelly, M.P., (2008). Estimating visitor use at Boulder Open Space and Mountain Parks. (HDNRU Report No. 80). Report for Boulder Open Space and Mountain Parks. Fort Collins: Colorado State University, Human Dimensions in Natural Resources Unit. 24. Watson, A.E., Cole, D.N., Turner, D.L., & Reynolds, P.S., (2000). Wilderness recreation use estimation: A handbook of methods and systems. USFS General Technical Report RMRS-GTR-56., USDA, Forest Service, Rocky Mountain Research Station. Ogden, UT. 25. White, D. D. & Aquino, J. F., (2008). Visitor perspectives toward transportation issues in Yosemite National Park. Report for Yosemite National Park. Phoenix, AZ: Arizona State University.
Related Documents


![Automated Detection of Performance Regressions Using ...shang/pubs/icpe64-shang.pdf · Malik et al:[23,24] propose approaches that cluster performance counters using Principal Component](https://static.cupdf.com/doc/110x72/60c21dc821d07211527fa637/automated-detection-of-performance-regressions-using-shangpubsicpe64-shangpdf.jpg)