Automated Synthesis and Visualization of a Chemotherapy Treatment Regimen Network Jeremy Warner M.D., M.S. Peter Yang M.D. Gil Alterovitz Ph.D. Harvard-MIT Division of Health Sciences & Technology

Automated Synthesis and Visualization of a Chemotherapy Treatment Regimen Network Jeremy Warner M.D., M.S. Peter Yang M.D. Gil Alterovitz Ph.D. Harvard-MIT.
Dec 17, 2015
Welcome message from author
This document is posted to help you gain knowledge. Please leave a comment to let me know what you think about it! Share it to your friends and learn new things together.
Transcript

Automated Synthesis and Visualization of a Chemotherapy Treatment Regimen Network
Jeremy Warner M.D., M.S. Peter Yang M.D.Gil Alterovitz Ph.D.
Harvard-MIT Division of Health Sciences & Technology

Background and Motivation
• Most cancer contexts have multiple treatment options.– E.g. 20+ NCCN® recommended regimens for
adjuvant treatment of breast cancer• Few direct comparisons.• Thus, guidelines are usually derived by expert
opinion.• Guidelines outdate rapidly.
NCCN: National Comprehensive Cancer Network

Network Meta-Analysis
• A variety of methods to quantitatively compare multiple treatment options
• Methodology is still evolving in this area• We proposed to investigate:– Visualization of chemotherapy regimens (vertices)
including summative efficacy– Visualization of relationships between regimens
(edges), including quality of comparisons– Automated network layout for readability
http://www.bmj.com/content/342/bmj.d1199

Leveraging Network Attributes• Layout• Vertex size, color• Edge color, width, duplication• Transparency
versus
Vertex Attributes
• Size: proportionate to N enrolled• Color: gradated tri-color schema– Inferior treatment regimen– Regimen of equivocal value– Superior treatment regimen
• Transparency: dynamic “aging” effect– Assigned initial alpha of 1.0 and decayed by
0.1/year to a minimum of 0.2– Refreshed to 1.0 if/when new RCT uses regimen
10 100

Vertex Coloration
– Calculated by a “contest” between regimens:• Win (E = 1): superiority, as defined by an improved
outcome with p-value ≤0.05• Lose (E = -1): inferiority, as defined by an inferior
outcome with p-value ≤0.05• Tie (E = 0): either an outcome with a non-significant p-
value or an equivalent outcome as defined by formal non-inferiority, with p-value ≤0.05
nG
m
y yy
n vNm
ERVv logˆ 1

Edge Attributes
• Width: proportionate to # patients compared• Duplication• Color– Weak surrogate measure (e.g. RR; RV = 1)– Strong surrogate measure (e.g. PFS; RV = 1.25)– Overall survival (RV = 1.5)
• Transparency: same as for vertices
PFS: Progression-free survivalRR: Response rateRV: Relative value

Vertex Coloration Example
• Hehlmann et al. (1993): Randomized comparison of busulfan and hydroxyurea in chronic myelogenous leukemia: prolongation of survival by hydroxyurea. The German CML Study Group.– Busulfan (BU, N=216) median survival: 45.4 months– Hydroxyurea (HU, N=225) median survival: 58.2 months
Vertex 1 Vertex 2 Ey RV log(NG[vn]) n
Busulfan Hydrea -1 (p=0.008) 1.5 2.64 -3.96
Hydrea Busulfan 1 (p=0.008) 1.5 2.64 3.96
HU BU

Node Layout
• Determined by the Kamada-Kawai force-based algorithm.
• Some manual modification to improve readability.
• Layout fixed by final state; historical graphs can be viewed as subsets.
Kamada T, Kawai S. Information Processing Letters. 1989:7-15.
http://en.wikipedia.org/wiki/File:Visualization_of_wiki_structure_using_prefuse_visualization_package.png
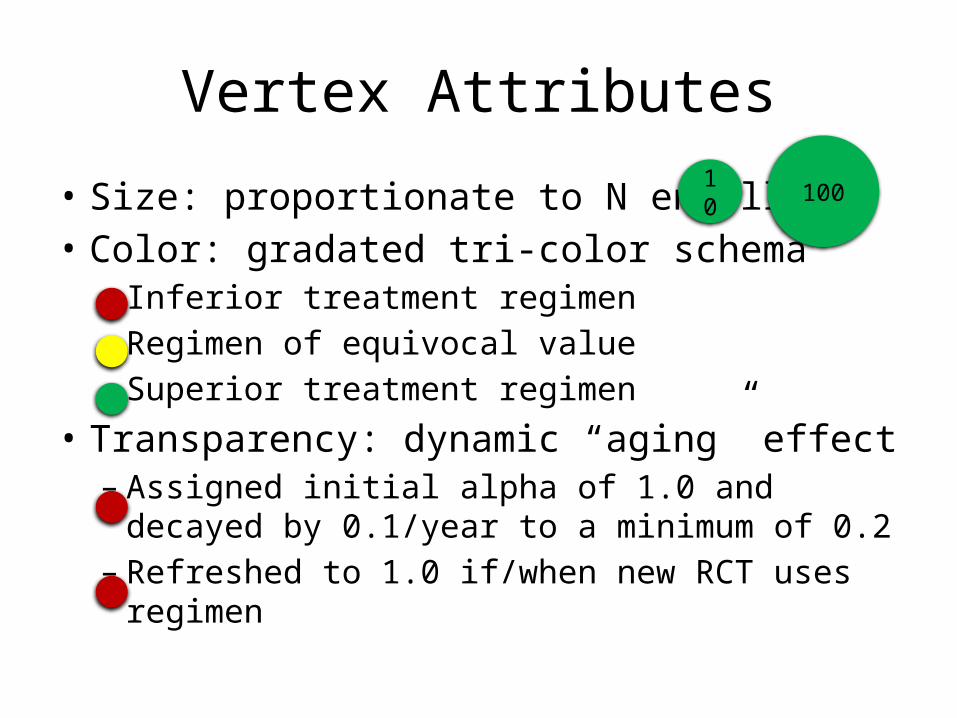
Proof-of-concept
• First-line treatment of chronic myelogenous leukemia (CML)
• Relatively few treatment options, but they have been rigorously tested.

Search Results
• 197 publications identified through PubMed– MeSH: Leukemia,
Myelogenous, Chronic, BCR-ABL Positive
– Publication Type: Randomized Controlled Trial
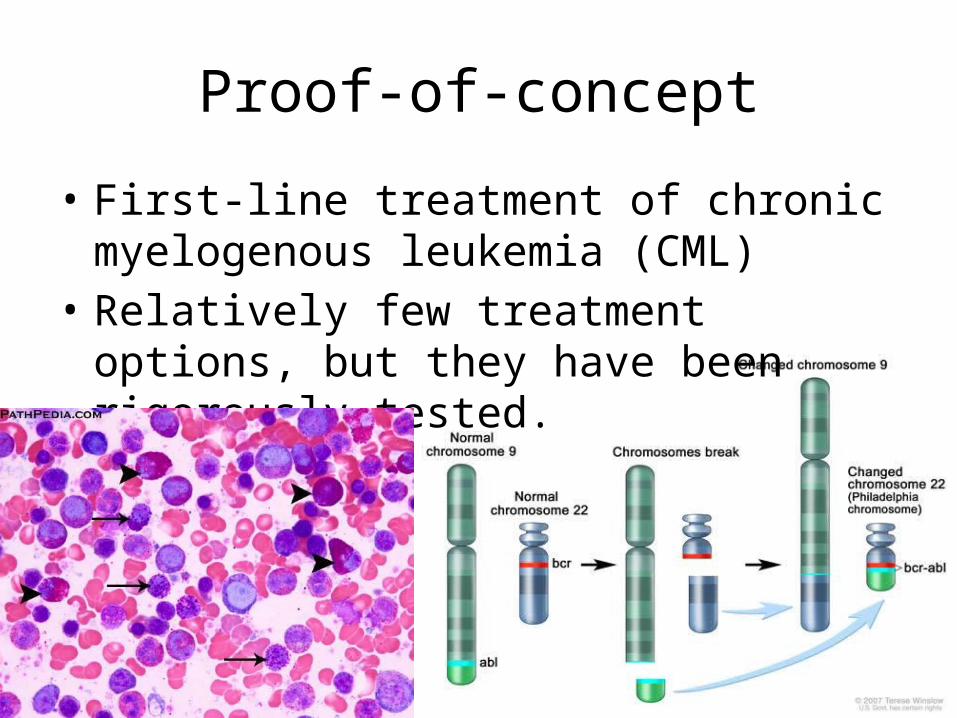
• 24 RCTs were identified between 1968-2012
• 17 unique regimens
Author (year) Regimen 1 Regimen 2Witts et al. (1968) Busulfan RadiationCanellos et al. (1975) Busulfan DBM Silver et al. (1987) Busulfan DBM Hehlmann et al. (1993) Busulfan Hydrea Tura et al. (1994) 1 Busulfan 2 Hydrea 3 IFNA
Hehlmann et al. (1994) 1 Busulfan 2 Hydrea 3 IFNA
Allan et al. (1995) 1 Busulfan 2 Hydrea3 Busulfan/IFNA 4 Hydrea/IFNA
Ohnishi et al. (1995) Busulfan IFNAGuilhot et al. (1997) IFNA IFNA/LoDAC
Baccarani et al. (2002) IFNA IFNA/LoDAC
Kuhr et al. (2003) Hydrea/IFNA IFNA/LoDAC
O’Brien et al. (2003) IFNA/LoDAC Imatinib
Ohnishi et al. (2004) IFNA MRD allo-SCT
Olsson et al. (2004) Busulfan HydreaDeenik et al. (2007) IFNA/HiDAC IFNA/LoDAC
Baccarani et al. (2009) Imatinib Imatinib-HDCortes et al. (2010) Imatinib Imatinib-HDKantarjian et al. (2010) Dasatinib ImatinibPreudhomme et al. (2010)
1 Imatinib 2 Imatinib-HD3 Imatinib/IFNA 4 Imatinib &
LoDACSaglio et al. (2010) Imatinib NilotinibHehlmann et al. (2011) 1 Imatinib 2 Imatinib
HD3 Imatinib/ IFNA
Simonsson et al. (2011) IFNA/Imatinib Imatinib
Cortes et al. (2012) Bosutinib ImatinibRadich et al. (2012) Dasatinib Imatinib
MeSH: Medical subject headingsRCT: Randomized controlled trial

Temporal Growth of Patients Enrolled, Vertices and Edges
Cumulative enrolled patients: 9700 Cumulative vertices: 17
Cumulative edges: 40

1987

2002

2003
2012

Conclusions
• Network meta-analysis demonstrates the dynamic evolution of treatment regimen evidence for untreated CML.
• Over time, the quality of RCT evidence degrades as surrogate outcomes are substituted.
• Older regimens, e.g. IFNA-LoDAC, may retain usefulness.
• These findings are in close parallel to the NCCN Guidelines ®.

Limitations and Future Directions
• Some manual curation remains necessary• Non-randomized information is omitted– Phase I, I/II, and II studies– Single arm and CER analyses
• Toxicity and cost information missing– Toxicity: can sometimes trump efficacy with
chemotherapy regimens– Monetary Cost: newer regimens often costs a great
deal more for various reasons.– Non-monetary cost: e.g. infusion room time
CER: Comparative effectiveness research
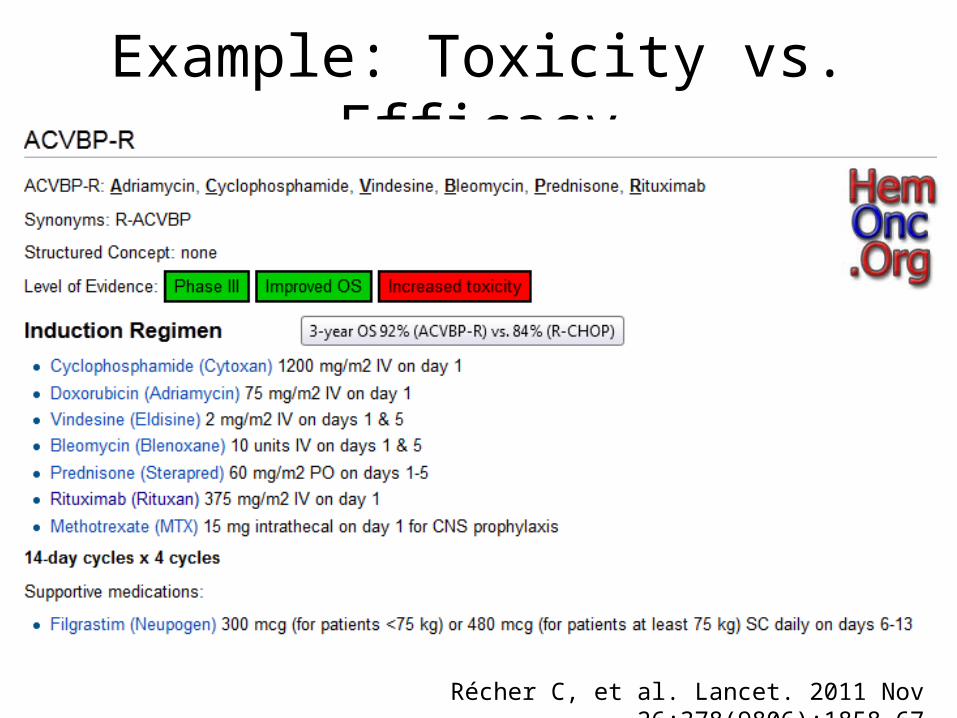
Example: Toxicity vs. Efficacy
Récher C, et al. Lancet. 2011 Nov 26;378(9806):1858-67

Example: Toxicity vs. Efficacy
“Grade 3–4 haematological toxic effects were more common in the R-ACVBP group, with a higher proportion of patients experiencing a febrile neutropenic episode (38% [75 of 196] vs 9% [16 of 183])”
Récher C, et al. Lancet. 2011 Nov 26;378(9806):1858-67
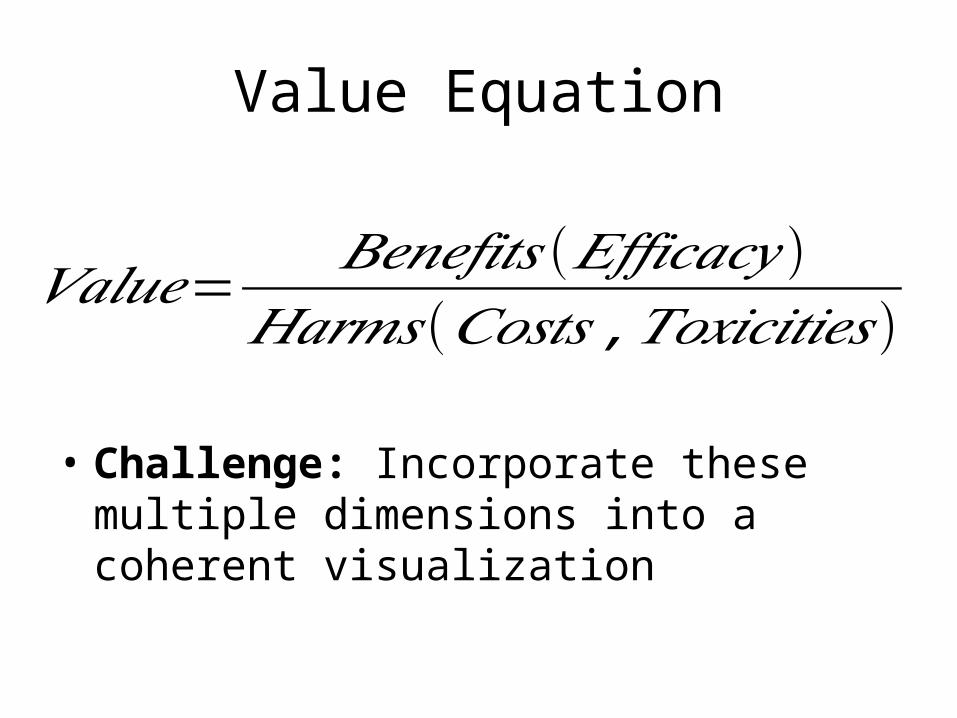
Value Equation
• Challenge: Incorporate these multiple dimensions into a coherent visualization
𝑉𝑎𝑙𝑢𝑒=𝐵𝑒𝑛𝑒𝑓𝑖𝑡𝑠(𝐸𝑓𝑓𝑖𝑐𝑎𝑐𝑦 )
𝐻𝑎𝑟𝑚𝑠(𝐶𝑜𝑠𝑡𝑠 ,𝑇𝑜𝑥𝑖𝑐𝑖𝑡𝑖𝑒𝑠)

QUESTIONS?
Related Documents