Journal of Clinical Virology 54 (2012) 30–35 Contents lists available at SciVerse ScienceDirect Journal of Clinical Virology jo u r n al hom epage: www.elsevier.com/locate/jcv Automated sequence analysis and editing software for HIV drug resistance testing Daniel Struck a,f , Carole L. Wallis b,f , Gennady Denisov e,f , Christine Lambert a,f , Jean-Yves Servais a,f , Raquel V. Viana b,f , Esrom Letsoalo b,f , Michelle Bronze b,f , Sue C. Aitken b,c,f , Rob Schuurman c,f , Wendy Stevens b,f , Jean Claude Schmit a,f , Tobias Rinke de Wit d,f , Danielle Perez Bercoff a,∗,f a Laboratory of Retrovirology, CRP-Santé, Luxembourg b University of the Witwatersrand, Johannesburg, South Africa c Department of Virology, University Medical Centre Utrecht, The Netherlands d PharmAccess Foundation, Department of Global Health, Academic Medical Center, University of Amsterdam, Amsterdam Institute for Global Health and Development, Amsterdam, The Netherlands e J. Craig Venter Institute, 9704 Medical Center Drive, Rockville, MD 20850, USA a r t i c l e i n f o Article history: Received 22 August 2011 Received in revised form 20 January 2012 Accepted 23 January 2012 Keywords: Automated-sequence-analysis Software HIV genotyping HIV resistance a b s t r a c t Background: Access to antiretroviral treatment in resource-limited-settings is inevitably paralleled by the emergence of HIV drug resistance. Monitoring treatment efficacy and HIV drugs resistance testing are therefore of increasing importance in resource-limited settings. Yet low-cost technologies and procedures suited to the particular context and constraints of such settings are still lacking. The ART-A (Affordable Resistance Testing for Africa) consortium brought together public and private partners to address this issue. Objectives: To develop an automated sequence analysis and editing software to support high throughput automated sequencing. Study design: The ART-A Software was designed to automatically process and edit ABI chromatograms or FASTA files from HIV-1 isolates. Results: The ART-A Software performs the basecalling, assigns quality values, aligns query sequences against a set reference, infers a consensus sequence, identifies the HIV type and subtype, translates the nucleotide sequence to amino acids and reports insertions/deletions, premature stop codons, ambigui- ties and mixed calls. The results can be automatically exported to Excel to identify mutations. Automated analysis was compared to manual analysis using a panel of 1624 PR–RT sequences generated in 3 dif- ferent laboratories. Discrepancies between manual and automated sequence analysis were 0.69% at the nucleotide level and 0.57% at the amino acid level (668,047 AA analyzed), and discordances at major resistance mutations were recorded in 62 cases (4.83% of differences, 0.04% of all AA) for PR and 171 (6.18% of differences, 0.03% of all AA) cases for RT. Conclusions: The ART-A Software is a time-sparing tool for pre-analyzing HIV and viral quasispecies sequences in high throughput laboratories and highlighting positions requiring attention. © 2012 Elsevier B.V. All rights reserved. 1. Introduction The vast majority of HIV infections occur in resource-limited- settings (RLS). Access to antiretroviral treatment (ART) programs in these settings has been widely improved following WHO recommendations and international funding efforts. As a conse- quence, high throughput diagnostic techniques such as viral load ∗ Corresponding author at: Laboratory of Retrovirology, CRP-Santé 84, Val Fleuri, L-1521 Luxembourg, Luxembourg. Tel.: +352 26 970 318; fax: +352 26 970 221. E-mail address: [email protected] (D. Perez Bercoff). f on behalf of the ART-A consortium (see Appendix A). monitoring and automated sequencing are gradually gaining importance in RLS. First-line treatment regimens in Sub-Saharan Africa are mainly based on combinations of 3 reverse transcriptase (RT) inhibitors, 1 and second-line ART is becoming more accessi- ble. As a consequence, the emergence of HIV drug resistance is becoming an increasing concern. Regular viral load monitoring and resistance testing in the case of virological failure are rec- ommended in Western countries 2,3 and are being implemented in clinical practice to complete and replace inaccurate patient follow- up based on CD4 counts and clinical staging. 4–6 In Africa, direct patient testing for HIV drug resistance is (financially and techni- cally) an option generally restricted to few reference laboratories; however population-based HIV drug resistance monitoring is feasi- ble and targeted HIV drug resistance testing on patients failing 1st 1386-6532/$ – see front matter © 2012 Elsevier B.V. All rights reserved. doi:10.1016/j.jcv.2012.01.018

Welcome message from author
This document is posted to help you gain knowledge. Please leave a comment to let me know what you think about it! Share it to your friends and learn new things together.
Transcript
A
DRWa
b
c
d
Te
a
ARRA
KASHH
1
sirq
L
1d
Journal of Clinical Virology 54 (2012) 30– 35
Contents lists available at SciVerse ScienceDirect
Journal of Clinical Virology
jo u r n al hom epage: www.elsev ier .com/ locate / j cv
utomated sequence analysis and editing software for HIV drug resistance testing
aniel Strucka,f, Carole L. Wallisb,f, Gennady Denisove,f, Christine Lamberta,f, Jean-Yves Servaisa,f,aquel V. Vianab,f, Esrom Letsoalob,f, Michelle Bronzeb,f, Sue C. Aitkenb,c,f, Rob Schuurmanc,f,endy Stevensb,f, Jean Claude Schmita,f, Tobias Rinke de Witd,f, Danielle Perez Bercoff a,∗,f
Laboratory of Retrovirology, CRP-Santé, LuxembourgUniversity of the Witwatersrand, Johannesburg, South AfricaDepartment of Virology, University Medical Centre Utrecht, The NetherlandsPharmAccess Foundation, Department of Global Health, Academic Medical Center, University of Amsterdam, Amsterdam Institute for Global Health and Development, Amsterdam,he NetherlandsJ. Craig Venter Institute, 9704 Medical Center Drive, Rockville, MD 20850, USA
r t i c l e i n f o
rticle history:eceived 22 August 2011eceived in revised form 20 January 2012ccepted 23 January 2012
eywords:utomated-sequence-analysisoftwareIV genotypingIV resistance
a b s t r a c t
Background: Access to antiretroviral treatment in resource-limited-settings is inevitably paralleled by theemergence of HIV drug resistance. Monitoring treatment efficacy and HIV drugs resistance testing aretherefore of increasing importance in resource-limited settings. Yet low-cost technologies and proceduressuited to the particular context and constraints of such settings are still lacking. The ART-A (AffordableResistance Testing for Africa) consortium brought together public and private partners to address thisissue.Objectives: To develop an automated sequence analysis and editing software to support high throughputautomated sequencing.Study design: The ART-A Software was designed to automatically process and edit ABI chromatograms orFASTA files from HIV-1 isolates.Results: The ART-A Software performs the basecalling, assigns quality values, aligns query sequencesagainst a set reference, infers a consensus sequence, identifies the HIV type and subtype, translates thenucleotide sequence to amino acids and reports insertions/deletions, premature stop codons, ambigui-ties and mixed calls. The results can be automatically exported to Excel to identify mutations. Automatedanalysis was compared to manual analysis using a panel of 1624 PR–RT sequences generated in 3 dif-
ferent laboratories. Discrepancies between manual and automated sequence analysis were 0.69% at thenucleotide level and 0.57% at the amino acid level (668,047 AA analyzed), and discordances at majorresistance mutations were recorded in 62 cases (4.83% of differences, 0.04% of all AA) for PR and 171(6.18% of differences, 0.03% of all AA) cases for RT.Conclusions: The ART-A Software is a time-sparing tool for pre-analyzing HIV and viral quasispeciessequences in high throughput laboratories and highlighting positions requiring attention.. Introduction
The vast majority of HIV infections occur in resource-limited-
ettings (RLS). Access to antiretroviral treatment (ART) programsn these settings has been widely improved following WHOecommendations and international funding efforts. As a conse-uence, high throughput diagnostic techniques such as viral load∗ Corresponding author at: Laboratory of Retrovirology, CRP-Santé 84, Val Fleuri,-1521 Luxembourg, Luxembourg. Tel.: +352 26 970 318; fax: +352 26 970 221.
E-mail address: [email protected] (D. Perez Bercoff).f on behalf of the ART-A consortium (see Appendix A).
386-6532/$ – see front matter © 2012 Elsevier B.V. All rights reserved.oi:10.1016/j.jcv.2012.01.018
© 2012 Elsevier B.V. All rights reserved.
monitoring and automated sequencing are gradually gainingimportance in RLS. First-line treatment regimens in Sub-SaharanAfrica are mainly based on combinations of 3 reverse transcriptase(RT) inhibitors,1 and second-line ART is becoming more accessi-ble. As a consequence, the emergence of HIV drug resistance isbecoming an increasing concern. Regular viral load monitoringand resistance testing in the case of virological failure are rec-ommended in Western countries2,3 and are being implemented inclinical practice to complete and replace inaccurate patient follow-up based on CD4 counts and clinical staging.4–6 In Africa, direct
patient testing for HIV drug resistance is (financially and techni-cally) an option generally restricted to few reference laboratories;however population-based HIV drug resistance monitoring is feasi-ble and targeted HIV drug resistance testing on patients failing 1st
linical Virology 54 (2012) 30– 35 31
oo
aLaTslRsvatn
2
taaia
3
3
eAaisd
3
(et3
abqbs
3
ru(aa(mtwi(
Table 1Subtype representation and distribution of PR–RT sequences used for comparisonof manual versus automated sequence analysis using the ART-A Software. Subtypewas assessed using COMET v0.2.
Subtype CRP-Santé Wits UMCU Total
Pure subtypesA1 15 16 17 47B 383 1 437 820C 49 271 34 357D 7 5 3 15F1 11 – 3 23F2 1 – – 1G 44 – 3 47
Recombinant formsCRF01 AE 32 – 11 43CRF02 AG 61 – 36 97CRF03 AB – – 1 1CRF07 BC – – 1 1CRF42 BF 41 – – 41CRF46 BF 1106cpx 6 – 4 609cpx 2 – – 211cpx 1 – – 1
D. Struck et al. / Journal of C
r 2nd line treatment is becoming more widespread as therapeuticptions progressively become available.
In this setting, the ART-A consortium was established in 2008nd brought together public and private partners in South-Africa,uxembourg, the Netherlands and Belgium to develop and deployn affordable HIV resistance monitoring protocol for Africa (ART-A).he protocol includes patient sample collection using dried-blood-pots, semi-quantitative subtype-independent cost-effective viraload testing for assessing treatment efficacy, viral protease (PR) andT genotyping in cases where virological failure is observed andequence interpretation. In the majority of resource limited areas,iral load measurements, genotyping and sequence interpretationre centralized at the reference laboratory level and these labora-ories are faced with the burden of processing and resulting largeumbers of specimens.
. Objectives
One aspect of the ART-A protocol was to develop and evaluatehe use of an automated, easy-to-use sequence basecalling, analysisnd editing software. In this study we describe the ART-A Softwarend its features, as well as the validation for HIV-1 PR–RT genotyp-ng sequence analysis comparison between this automated methodnd ‘manual-analysis’.
. Methods
.1. ART-A Software set-up
Most parts of the analysis pipelines are multi-threaded to fullyxploit the parallel processing capacities of modern computers. TheRT-A Software is protected by a GNU/GPL license and is freelyvailable for non-commercial users. The software is implementedn the Java language to be deployed on Windows or Linux operatingystems. The code (size of 16 M) holds on a memory stick or can beownloaded via the internet (http://arta.retrovirology.lu).
.2. ART-A Software description and settings
The ART-A Software was developed to automatically processi.e. basecall, align, analyze and edit) chromatograms generated inither the ABI format or FASTA files, and therefore includes calibra-ion tables for the Applied Biosystems (ABI, Foster City, CA, USA)100, 3130, 3730, 3700pop6, 3700pop5 automated sequencers.
TraceTuner was chosen among the three potentially freelyvailable basecalling modules for its capacity to call mixed-ases, an absolute requirement for population sequencing of viraluasispecies. TraceTuner7 binaries were translated into Java forasecalling, assigning quality values (QV) and inferring a consensusequence.
.3. ART-A Software functions
The software allows to select the appropriate (here HIV)eference sequence as well as the name format of samples tondergo ‘automated-analysis’. Basecalls with poor quality valuesthreshold: QV < 20 within a window of 10 bases) at the extremitiesre automatically trimmed. Chromatograms from one specimenre automatically assembled, a consensus sequence is inferredTraceTuner module translated into Java). Local pairwise align-
ent against the selected reference sequence is performed by
he JAligner implementation of the Smith–Waterman algorithmith Gotoh’s improvement.8 The consensus nucleotide sequences then automatically analyzed and translated into an amino-acidAA) sequence. Differences relative to the reference sequence are
18cpx – – 2 2URF 90 6 19 121
identified and reported in a tabular overview which summarizessample identification, HIV type and subtype, gene (PR, RT, IN,Env), total number of traces, average QV, number of mixed-basesdetected, as well as problems requiring attention (frameshifts,STOP codons, insertions/deletions, contradictory basecalls). Fordetailed inspection, the user can visualize chromatograms througha Biojava library9 and directly “jump” to the highlighted regionsby clicking on the appropriate button in the sequence window,and make the required amendments and/or manually trim thesequence.
Sequence analysis results can be stored as a project in an internaldatabase (H2 database10).
Alternatively, FASTA files rather than chromatograms canbe imported directly, read, identified, analyzed (STOP codons,frameshifts, ambiguities, insertions/deletions) and stored.
From the overview page, the FASTA file or final consensussequence can either be exported in a comma-separated values(CSV) or Excel format listing mutations/polymorphisms for furtheranalysis, exploiting the Apache POI library,11 or be uploaded tosequence interpretation algorithms to retrieve a resistance report,as the ART-A software is not intended to provide a genotypic inter-pretation of resistance to ART or to predict treatment outcome, forwhich other algorithms have been developed by others12–16).
3.4. HIV-1 PR–RT sequence panel
Chromatograms from 1624 HIV-1 PR–RT sequences gener-ated in three independent laboratories (754 from CRP-Santé, 299from Wits and 571 from UMCU) using the ViroSeq kit (CRP-Santé and IMCU) or an in-house method (Wits)17 and a 3100 or3130 ABI sequencer were included. Major subtypes, determinedusing COMET v0.2 (http://comet.retrovirology.lu) were included(Table 1). Of note, full-length RT (AA 1-332) sequences were com-pared for the CRP and UMCU datasets, while Wits sequencescomprise RT positions 1–250 because of poor trace quality afterAA250. Sequences included forward and reverse traces.
Chromatograms were submitted to the ART-A Software andthe resulting FASTA files (referred to as ‘automated-analysis’)
were compared to ‘manual-analysis’ performed in each labora-tory using SeqScape.18 In ‘manual-analysis’, chromatograms fromeach sample were aligned against the HXB2 reference and correctpairwise alignment, sequence quality (chromatogram neatness),
3 linica
cw‘itdttfitp
3
w(cwtb
4
4
mAdtaomw
TCwA(w
bc
2 D. Struck et al. / Journal of C
onsideration of mixtures and manual trimming when necessaryere performed by the technician visualizing each sequence.
Automated-analysis’ was compared to ‘manual-analysis’ becauset is the standard and most widespread procedure in most labora-ories performing sequencing and genotyping, despite lack of stan-ardization and user-linked variability. To ensure maximum objec-ivity, chromatograms were submitted to the ART-A Software bywo researchers who had not seen the ‘manually analyzed’ FASTAle results until after completion of the ‘automated-analysis’. Fur-hermore, FASTA files edited by the ART-A Software were notrocessed further, even when problematic issues were reported.
.5. Statistical analyses
Differences between results obtained in different laboratoriesere compared using paired t-tests or one-way ANOVA tests
GraphPad Prim, version 5). Differences were considered statisti-ally significant if p < 0.01. The specificity of the ART-A Softwareas calculated by setting the manual basecall as “True”, using
he following formula: Correct basecall/(Correct-basecall + False-asecall).
. Results
.1. Comparison of ‘manual’ versus ‘automated’ sequence analysis
FASTA files generated by the ART-A Software without furtheranual amendments were compared at the nucleotide and at theA levels, examining partial and complete discrepancies (hammingistance). ‘Automated-’ and ‘manual-analysis’ differed by 0.69% athe nucleotide level (2,008,508 nucleotides analyzed) and by 0.57%
t the AA level (668,047 AA analyzed) (Table 2). The specificityf the ART-A Software was 0.9939 for pure bases and 0.8903 forixed calls (all disagreements with the manually called baseas considered false). Differences between laboratories were notable 2omparison of manual versus automated PR–RT sequence analysis using the ART-A Softwere compared at the nucleotide level and at the amino acid (AA) level, and percent agrA) analyzed is lower than 1/3 of the total number of nucleotides analyzed (2,008,508 n
therefore nucleotides upstream of pol were automatically excluded. Furthermore, since
ere also excluded.
PR–RT sequences CR
Number samples analyzed 75Time for automated analysis (sec) 14Nucleotides Total 97
Differences 3,8Percent differences 0.3Percent agreement 99
Detailed comparison Manual analysis ART-A SoftwareAgreement Purea Pure (same) 96
Mix Mix (same) 5,6
Partial agreement Pure Mix (inclusive) 64Mix Pure (inclusive) 2,8Mix Mix (overlap) 18
Disagreement Pure Pure (different) 12Pure Mix (exclusive) 27Mix Pure (exclusive) 0
Mix Mix (exclusive) 33Deletion No deletion 4
No deletion deletion 15
Amino Acids Total 32Total differences (including deletions) 1,3Percent agreement 99Percent differences 0.4
a Pure: only one base was read; mix: two or more bases were read; overlap: both manuut the other differs; inclusive: the pure base called is included in the mixture; exclusive: talled by the other method.
l Virology 54 (2012) 30– 35
statistically significant (p > 0.01). Differences between subtypescould not be assessed because of the reduced number of non-B,non-C subtype samples.
Discrepancies were distributed evenly throughout the PR–RTregion analyzed at both the nucleotide and at the AA level,without hotspots of discordance (data not shown). The num-ber of fully discordant basecalls was low (Table 2) and the vastmajority of discrepancies involved calling mixtures versus purebases: ‘manual-analysis’ detected mixtures while ‘automated-analysis’ detected a pure base in 11,675 cases; conversely, in 1154cases, ‘automated-analysis’ detected mixed-bases where ‘manual-analysis’ called a pure base, suggesting that the majority ofdifferences between ‘manual-’ and ‘automated-analysis’ are due tothe threshold set for the detection of mixtures, and that the ART-ASoftware might underestimate the presence of mixtures.
4.2. Characterization of discrepancies at resistance mutations
Given their potential clinical impact in patient management,differences at AA positions involved in resistance to proteaseinhibitors (PIs) and NRTIs/NNRTIs were further investigated.19 Ofthe 4008 AA differing between ‘manual-’ and ‘automated-analysis’,3291 involved polymorphisms that do not affect resistance and484 involved AA known as minor mutations within PR and RT19
(Table 3). Differences at major resistance positions19 were found in62 cases (4.83% of differences, 0.04% of all AA) for PR and 171 (6.18%of differences, 0.03% of all AA) cases for RT. In line with results atthe nucleotide level, one difference within PR and 6 within RT weredue to a different basecall, while all others involved detecting a pure
versus a mixture of AA (Table 3) and all but 2, one in RT, one in PR,were inclusive (data not shown). If we assume ‘manual-analysis’to be the standard, resistance at major positions was missed by‘automated-analysis’ (false negative) in the vast majority of casesare. Sequences analyzed manually or using the ART-A sequence analysis softwareeement and hamming distances were calculated. The total number of AA (668,047
ucleotides) because AA analysis by the software was limited to the PR–RT genesAA are coded by 3 bases, single or duplet nucleotides read at the end of the RT read
P-S Wits UMCU Total Mean
4 299 571 1,624 –4.44 74.48 253.33 472.25 –9,492 312,377 716,639 2,008,508 –29 1,559 8,399 13,787 –9% 0.50% 1.17% – 0.69%.61% 99.50% 98.83% – 99.31%
9,958 308,418 704,233 1,982,609 98.71%78 2,397 3,997 12,072 0.60%
6 340 168 1,154 0.06%24 990 7,861 11,675 0.58%
1 48 67 ∼0%
1 12 138 271 0.01% 6 16 49 ∼0%
1 7 8 ∼0% 32 16 81 ∼0%
177 16 197 0.01%6 0 129 285 0.01%
5,809 103,921 238,317 668,047 –47 355 2,306 4,008 –.59% 99.66% 99.03% – 99.36%1% 0.34% 0.97% – 0.57%
al and automated analysis detect a mix and one of the bases in the mix is the samehe pure base detected using one method differs from those detected in the mixture
D. Struck et al. / Journal of Clinical Virology 54 (2012) 30– 35 33
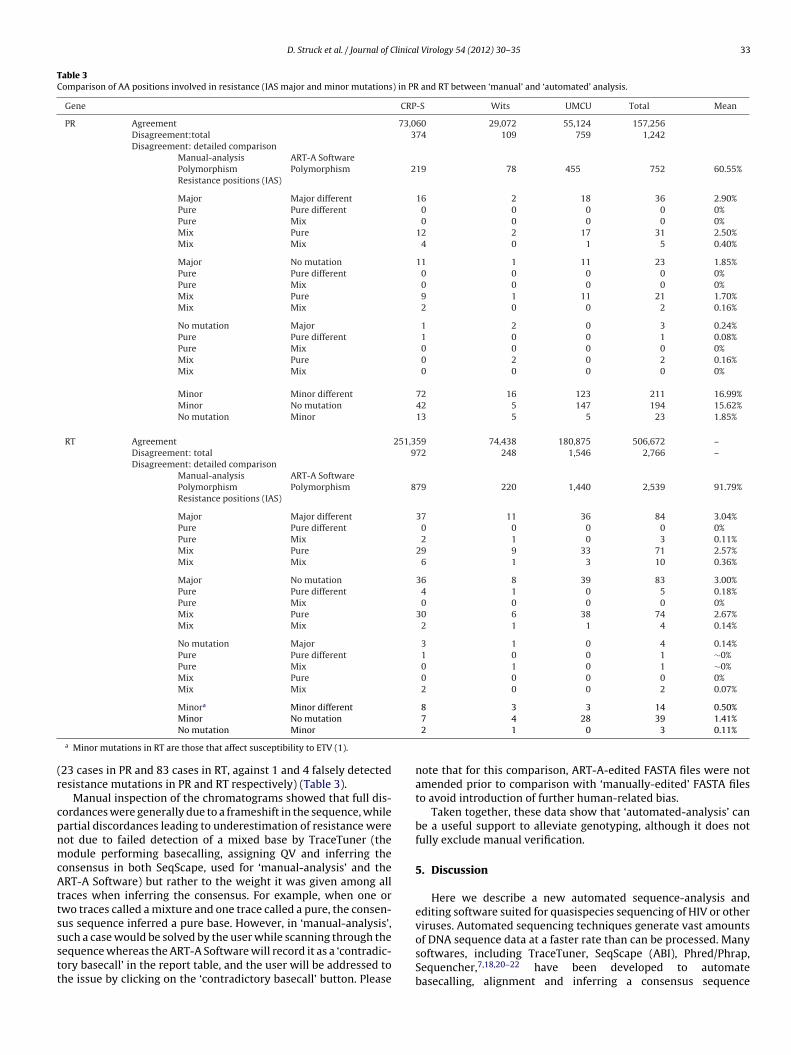
Table 3Comparison of AA positions involved in resistance (IAS major and minor mutations) in PR and RT between ‘manual’ and ‘automated’ analysis.
Gene CRP-S Wits UMCU Total Mean
PR Agreement 73,060 29,072 55,124 157,256Disagreement:total 374 109 759 1,242Disagreement: detailed comparison
Manual-analysis ART-A SoftwarePolymorphism Polymorphism 219 78 455 752 60.55%Resistance positions (IAS)
Major Major different 16 2 18 36 2.90%Pure Pure different 0 0 0 0 0%Pure Mix 0 0 0 0 0%Mix Pure 12 2 17 31 2.50%Mix Mix 4 0 1 5 0.40%
Major No mutation 11 1 11 23 1.85%Pure Pure different 0 0 0 0 0%Pure Mix 0 0 0 0 0%Mix Pure 9 1 11 21 1.70%Mix Mix 2 0 0 2 0.16%
No mutation Major 1 2 0 3 0.24%Pure Pure different 1 0 0 1 0.08%Pure Mix 0 0 0 0 0%Mix Pure 0 2 0 2 0.16%Mix Mix 0 0 0 0 0%
Minor Minor different 72 16 123 211 16.99%Minor No mutation 42 5 147 194 15.62%No mutation Minor 13 5 5 23 1.85%
RT Agreement 251,359 74,438 180,875 506,672 –Disagreement: total 972 248 1,546 2,766 –Disagreement: detailed comparison
Manual-analysis ART-A SoftwarePolymorphism Polymorphism 879 220 1,440 2,539 91.79%Resistance positions (IAS)
Major Major different 37 11 36 84 3.04%Pure Pure different 0 0 0 0 0%Pure Mix 2 1 0 3 0.11%Mix Pure 29 9 33 71 2.57%Mix Mix 6 1 3 10 0.36%
Major No mutation 36 8 39 83 3.00%Pure Pure different 4 1 0 5 0.18%Pure Mix 0 0 0 0 0%Mix Pure 30 6 38 74 2.67%Mix Mix 2 1 1 4 0.14%
No mutation Major 3 1 0 4 0.14%Pure Pure different 1 0 0 1 ∼0%Pure Mix 0 1 0 1 ∼0%Mix Pure 0 0 0 0 0%Mix Mix 2 0 0 2 0.07%
Minora Minor different 8 3 3 14 0.50%
(r
cpnmcAttssstt
Minor No mutation
No mutation Minor
a Minor mutations in RT are those that affect susceptibility to ETV (1).
23 cases in PR and 83 cases in RT, against 1 and 4 falsely detectedesistance mutations in PR and RT respectively) (Table 3).
Manual inspection of the chromatograms showed that full dis-ordances were generally due to a frameshift in the sequence, whileartial discordances leading to underestimation of resistance wereot due to failed detection of a mixed base by TraceTuner (theodule performing basecalling, assigning QV and inferring the
onsensus in both SeqScape, used for ‘manual-analysis’ and theRT-A Software) but rather to the weight it was given among all
races when inferring the consensus. For example, when one orwo traces called a mixture and one trace called a pure, the consen-us sequence inferred a pure base. However, in ‘manual-analysis’,
uch a case would be solved by the user while scanning through theequence whereas the ART-A Software will record it as a ‘contradic-ory basecall’ in the report table, and the user will be addressed tohe issue by clicking on the ‘contradictory basecall’ button. Please7 4 28 39 1.41%2 1 0 3 0.11%
note that for this comparison, ART-A-edited FASTA files were notamended prior to comparison with ‘manually-edited’ FASTA filesto avoid introduction of further human-related bias.
Taken together, these data show that ‘automated-analysis’ canbe a useful support to alleviate genotyping, although it does notfully exclude manual verification.
5. Discussion
Here we describe a new automated sequence-analysis andediting software suited for quasispecies sequencing of HIV or otherviruses. Automated sequencing techniques generate vast amounts
of DNA sequence data at a faster rate than can be processed. Manysoftwares, including TraceTuner, SeqScape (ABI), Phred/Phrap,Sequencher,7,18,20–22 have been developed to automatebasecalling, alignment and inferring a consensus sequence
3 linica
ffeaiSsTrmrodsst
‘bi(iri(icmttItctimirt“tc
ctsiPmaagiieSaomoba
ttf
4 D. Struck et al. / Journal of C
rom the electropherograms. The ART-A software performs thesesunctions based on an adapted version of TraceTuner, but alsodits and pre-analyzes the sequences, i.e. automatically detectsnd highlight dubious positions requesting attention and visualnterpretation (insertions/deletions, mixed-bases, frameshifts,TOP codons). These tasks are generally performed manually bycanning through the aligned chromatograms from each sample.he ART-A software cannot “decide” how to handle a problematicegion, but orients the user directly to it on the aligned chro-atograms to make amendments. This software is intended for
apid and automated sequence alignment and pre-editing for lab-ratories dealing with large batches of samples to test for routinerug resistance monitoring, or tropism, where such a tool allowsignificant time sparing. ‘Automated-analysis’ of the 1624 PR–RTequences was achieved in less than 8 min (Table 2), while a trainedechnician generally analyzes and edits 10–15 sequences in 2 h.
The vast majority of discrepancies between ‘manual-’ andautomated-analysis’ consisted of partial discrepancies, i.e. mixedasecall versus pure basecall, and more specifically mixed calls
nvolving one common base, rather than exclusive disagreementsTable 2). Overall, the ART-A software underestimated mixed-callsn comparison to ‘manual-analysis’. This observation held true atesistance positions. Tuning the TraceTuner thresholds for detect-ng mixed bases (min ratio) and calling a mixed-base over noisenoise fraction) to increase the ability of the software in call-ng mixed-bases, i.e. increasing aggressiveness of the software inalling a mixed-base, modified the balance between pure versusixed-calls but also increased the number of false positive mix-
ures at the nucleotide level, decreasing specificity and increasingype II errors in comparison to ‘manual-analysis’ (data not shown).n most cases, mixtures had been detected in at least one trace byhe ART-A Software, but inferring the consensus sequence from dis-ordant traces generally favored the pure over the mixed base inhe consensus. Such situations are frequent in population sequenc-ng of viral quasispecies, and are generally dealt with and solved by
anual inspection. Importantly, when mixed bases were detectedn each of the overlapping traces, the mixture was inferred cor-ectly in the consensus. The ART-A Software however highlightshose positions where different traces differ in the base called as acontradictory basecall” (e.g. A in one trace versus A+G in anotherrace at a given position), and the user would have seen the mixedall and amended the consensus sequence as needed.
The detection of mixtures and minority variants remains arucial issue in HIV genotyping, as it directly impacts resis-ance monitoring and is constrained by the ability of bulk Sangerequencing to detect minorities on one hand, and on sequencenterpretation on the other hand.23–25 Although resistance to mostIs and NRTIs involves the cumulative effect of more than oneutation, which is expected to dim the weight of such discrep-
ncies on resistance reports inferred by genotypic interpretationlgorithms,12–15 this issue becomes crucial for inhibitors with a lowenetic barrier, as lamivudine and efavirenz/nevirapine, which arencluded in all first-line regimens in RLS.1,3 Accordingly, genotypicnterpretation of the paired ‘manually-edited’ and ‘automatically-dited’ FASTA files, i.e. resistance reports generated using thetanford, the Rega and the ANRS algorithms12–15 did not always dis-gree where ‘manual-’ and ‘automated-analysis’ disagreed at onef the major or minor mutations involved in resistance. Further-ore, in most cases, discrepant sequences disagreed according to
ne algorithm, but not according to the other(s). For clarity, andecause it is the ‘worst-case’ scenario, discordances at IAS minornd major resistance positions were considered in this analysis.
Because the ART-A Software was developed as a component ofhe ART-A program and therefore initially intended to ease geno-yping of viral (HIV) populations in RLS, it was tested and validatedor HIV PR–RT sequence editing using three independent datasets,
l Virology 54 (2012) 30– 35
but it can readily be further widespread and adapted for other HIVgenes and for other viral quasispecies (HCV, HBV, FluA) by select-ing the appropriate reference sequence for alignment, as well as forpyrosequencing data.
In this study, ‘automated-analysis’ was compared to ‘manual-analysis’, despite the lack of standardization of such a reference,as it is the most commonly used procedure. Therefore, to estimatethe relevance of automating sequence editing, ‘manual-analysis’of a subset of chromatograms (Wits dataset) by different techni-cians in different laboratories was compared (data not shown):FASTA files disagreed partially in 1233/328,396 (0.38% against0.64% in ‘manual-’ versus ‘automated-analysis’) and fully disagreedin 43/328,396 (0.01%, as for ‘manual-’ versus ‘automated-analysis’)cases (hamming distance = 1461), highlighting that differencesbetween ‘automated-analysis’ and ‘manual-analysis’ were com-parable to interpersonal differences (p > 0.05, data not shown).Large-scale comparisons would be needed to gain further insightand a better estimate of the extent of variability in population-sequencing interpretation.
Funding
This work is supported by a grant of the Netherlands Organ-isation for Scientific Research/Science for Global Development(NWO/WOTRO), under the Netherlands-African Partnership forCapacity Development and Clinical Interventions against Povertyrelated Diseases (NACCAP) for the Affordable Resistance Test forAfrica (ART-A) project (grant: W.07.05.204.00). CRP-Santé PR–RTsequencing, sequence analysis and interpretation were supportedby the Fondation Recherche sur le SIDA, Luxembourg.
Competing interests
The authors declare that they have no competing interests.
Ethical approval
Not required.
Authors’ contributions
DS developed the ART-A automated sequence analysis andediting software and performed the validation. CW, SA and MBtested the software and contributed to software validation; TRdWdesigned and coordinated the ART-A algorithm; WS, RS and JCSprovided assistance and guidance in preparing the ART-A program;GD substantially councelled and assisted in adapting TraceTuner tothe ART-A Software requirement; DPB coordinated the softwaredevelopment, contributed to its validation and to data analysis. DSand DPB drafted the manuscript. All authors critically reviewed andapproved the final manuscript.
Acknowledgement
The authors are grateful to Stephen Senn for support with statis-tics.
Appendix A.
Collaborating centers: Contract Laboratory Services, Johan-nesburg, South Africa; Center for Poverty-related Communicable
Diseases, Academic Medical Center, University of Amsterdam,Amsterdam, The Netherlands; Centre de Recherche Public dela Santé, Luxemburg; PharmAccess Foundation, Amsterdam, TheNetherlands; University Medical Center Utrecht, Department
linica
oBs
A
t
R
111
111
1
1
1
1
2
2
22
2
D. Struck et al. / Journal of C
f Virology; Utrecht, The Netherlands; Virco BVBA, Mechelen,elgium; Wits Health Consortium, University of the Witwater-rand, Johannesburg, South Africa.
ppendix B. Supplementary data
Supplementary data associated with this article can be found, inhe online version, at doi:10.1016/j.jcv.2012.01.018.
eferences
1. WHO. Antiretroviral therapy for HIV infection in infants and children: towardsuniversal access; 2010 revision.
2. EACS. European Guidelines for the treatment of HIV infected adults in Europe; 2010.3. WHO. Antiretroviral Therapy for HIV Infection in Adults and Adolescents – recom-
mendations for a Public Health Approach – 2010 revision; 2010.4. Mee P, Fielding KL, Charalambous S, Churchyard GJ, Grant AD. Evaluation of the
WHO criteria for antiretroviral treatment failure among adults in South Africa.AIDS (London, England) 2008;22:1971–7, doi:10.1097/QAD.0b013e32830e4cd8,00002030-200810010-00009 [pii].
5. Moore DM, Awor A, Downing R, Kaplan J, Montaner JS, Hancock J, et al. CD4+T-cell count monitoring does not accurately identify HIV-infected adults withvirologic failure receiving antiretroviral therapy. J Acquir Immune Defic Syndr1999;49:477–84, doi:10.1097/QAI.0b013e318186eb18, 2008.
6. Reynolds SJ, Nakigozi G, Newell K, Ndyanabo A, Galiwongo R, Boaz I,et al. Failure of immunologic criteria to appropriately identify antiretrovi-ral treatment failure in Uganda. AIDS (London, England) 2009;23:697–700,doi:10.1097/QAD.0b013e3283262a78.
7. Denisov GA, Arehart AB, Curtin MD. A system and method for improving theaccuracy of DNA sequencing and error probability estimation through applica-tion of a mathematical model to the analysis of electropherograms. US Patent6,681,186; 2004.
8. Moustafa, A. JAligner: open source Java implementation of Smith-Waterman,2008.
9. Holland RC, Down TA, Pocock M, Prlic A, Huen D, James K, et al. BioJava:an open-source framework for bioinformatics. Bioinformatics 2008;24:2096–7,doi:10.1093/bioinformatics/btn397, btn397 [pii].
2
l Virology 54 (2012) 30– 35 35
0. http://www.h2database.com.1. http://poi.apache.org/.2. Van Laethem K, De Luca A, Antinori A, Cingolani A, Perna CF, Vandamme AM.
A genotypic drug resistance interpretation algorithm that significantly predictstherapy response in HIV-1-infected patients. Antivir Ther 2002;7:123–9.
3. Shafer RW. http://sierra2.stanford.edu/sierra/servlet/JSierra.4. http://www.hivfrenchresistance.org/.5. Altmann A, Daumer M, Beerenwinkel N, Peres Y, Schulter E, Buch J, et al.
Predicting the response to combination antiretroviral therapy: retrospec-tive validation of geno2pheno-THEO on a large clinical database. J Infect Dis2009;199:999–1006, doi:10.1086/597305.
6. Revell AD, Wang D, Boyd MA, Emery S, Pozniak AL, De Wolf F, et al. The develop-ment of an expert system to predict virological response to HIV therapy as partof an online treatment support tool. AIDS (London, England) 2011;25:1855–63,doi:10.1097/QAD.0b013e328349a9c2.
7. Wallis CL, Papathanasopoulos MA, Lakhi S, Karita E, Kamali A, Kaleebu P,et al. Affordable in-house antiretroviral drug resistance assay with goodperformance in non-subtype B HIV-1. J Virol Methods 2010;163:505–8,doi:10.1016/j.jviromet.2009.11.011. S0166-0934(09)00481-9 [pii].
8. Sorenson JM. System and method for consensus-calling with per-base qualityvalues for sample assemblies. US Patent 7,406,385; 2010.
9. Johnson VA, Brun-Vezinet F, Clotet B, Gunthard HF, Kuritzkes DR, Pillay D, et al.Update of the drug resistance mutations in HIV-1: December 2010. Top HIV Med2010;18:156–63.
0. Ewing B, Green P. Base-calling of automated sequencer traces using phred. II.Error probabilities. Genome Res 1998;8:186–94.
1. Ewing B, Hillier L, Wendl MC, Green P. Base-calling of automated sequencertraces using phred. I. Accuracy assessment. Genome Res 1998;8:175–85.
2. http://www.softpedia.com/get/Science-CAD/Sequencher.shtml.3. Shafer RW. Low-abundance drug-resistant HIV-1 variants: finding signifi-
cance in an era of abundant diagnostic and therapeutic options. J Infect Dis2009;199:610–2, doi:10.1086/596737, 10.1086/596737 [pii].
4. Jordan MR, Kearney M, Palmer S, Shao W, Maldarelli F, Coakley EP,et al. Comparison of standard PCR/cloning to single genome sequenc-ing for analysis of HIV-1 populations. J Virol Methods 2010;168:114–20,
doi:10.1016/j.jviromet.2010.04.030. S0166-0934(10)00166-7 [pii].5. Church JD, Huang W, Parkin N, Marlowe N, Guay LA, Omer SB, et al.Comparison of laboratory methods for analysis of non-nucleoside reverse tran-scriptase inhibitor resistance in Ugandan infants. AIDS Res Hum Retroviruses2009;25:657–63, doi:10.1089/aid.2008.0235.
Related Documents