ENGINEERING Automated, multiparametric monitoring of respiratory biomarkers and vital signs in clinical and home settings for COVID-19 patients Xiaoyue Ni a,b,1 , Wei Ouyang a,1 , Hyoyoung Jeong a,1 , Jin-Tae Kim a , Andreas Tzavelis a,c,d , Ali Mirzazadeh e , Changsheng Wu a , Jong Yoon Lee f , Matthew Keller g , Chaithanya K. Mummidisetty h , Manish Patel a,i , Nicholas Shawen h , Joy Huang j , Hope Chen j , Sowmya Ravi k , Jan-Kai Chang a,l , KunHyuck Lee a,m , Yixin Wu a,m , Ferrona Lie a , Youn J. Kang a , Jong Uk Kim n , Leonardo P. Chamorro o , Anthony R. Banks a , Ankit Bharat p , Arun Jayaraman h , Shuai Xu a,q,2 , and John A. Rogers a,c,m,r,s,t,u,2 a Querrey Simpson Institute for Bioelectronics, Northwestern University, Evanston, IL 60208; b Department of Mechanical Engineering and Materials Science, Duke University, Durham, NC 27708; c Department of Biomedical Engineering, Northwestern University, Evanston, IL 60208; d Medical Scientist Training Program, Feinberg School of Medicine, Northwestern University, Chicago, IL 60611; e College of Computing, Georgia Institute of Technology, Atlanta, GA 30332; f Sibel Inc., Niles, IL 60714; g Sonica Health, Niles, IL 60714; h Max Nader Lab for Rehabilitation Technologies and Outcomes Research, Center for Bionic Medicine, Shirley Ryan AbilityLab, Chicago, IL 60611; i College of Medicine, University of Illinois at Chicago, Chicago, IL 60612; j Feinberg School of Medicine, Northwestern University, Chicago, IL 60611; k Division of Thoracic Surgery, Feinberg School of Medicine, Northwestern University, Chicago, IL 60611; l Wearifi Inc., Evanston, IL 60201; m Department of Materials Science and Engineering, Northwestern University, Evanston, IL 60208; n School of Chemical Engineering, Sungkyunkwan University, Suwon, 16419, Republic of Korea; o Department of Mechanical Science and Engineering, University of Illinois at Urbana–Champaign, Champaign, IL 61801; p Department of Surgery, Feinberg School of Medicine, Northwestern University, Chicago, IL 60611; q Department of Dermatology, Feinberg School of Medicine, Northwestern University, Chicago, IL 60611; r Department of Mechanical Engineering, Northwestern University, Evanston, IL 60208; s Department of Chemistry, Northwestern University, Evanston, IL 60208; t Department of Electrical Engineering and Computer Science, Northwestern University, Evanston, IL 60208; and u Department of Neurological Surgery, Northwestern University, Evanston, IL 60208 Contributed by John A. Rogers, March 22, 2021 (sent for review January 11, 2021; reviewed by Metin Akay and Jun Chen) Capabilities in continuous monitoring of key physiological parame- ters of disease have never been more important than in the context of the global COVID-19 pandemic. Soft, skin-mounted electron- ics that incorporate high-bandwidth, miniaturized motion sensors enable digital, wireless measurements of mechanoacoustic (MA) signatures of both core vital signs (heart rate, respiratory rate, and temperature) and underexplored biomarkers (coughing count) with high fidelity and immunity to ambient noises. This paper sum- marizes an effort that integrates such MA sensors with a cloud data infrastructure and a set of analytics approaches based on dig- ital filtering and convolutional neural networks for monitoring of COVID-19 infections in sick and healthy individuals in the hospital and the home. Unique features are in quantitative measurements of coughing and other vocal events, as indicators of both disease and infectiousness. Systematic imaging studies demonstrate corre- lations between the time and intensity of coughing, speaking, and laughing and the total droplet production, as an approximate indi- cator of the probability for disease spread. The sensors, deployed on COVID-19 patients along with healthy controls in both inpatient and home settings, record coughing frequency and intensity con- tinuously, along with a collection of other biometrics. The results indicate a decaying trend of coughing frequency and intensity through the course of disease recovery, but with wide variations across patient populations. The methodology creates opportuni- ties to study patterns in biometrics across individuals and among different demographic groups. wearable electronics | digital health | biomarkers | respiratory disease | COVID-19 A s of December 26, The Centers for Disease Control and Prevention (CDC) tabulations indicate over 18 million recorded cases of COVID-19 and more than 329,592 in deaths in the United States (1). Accurate and widespread testing is a key component of the response to this pandemic (2). Although the capacity and availability of COVID-19 molecular diagnostics continues to increase, shortcomings follow from variabilities in the accuracy of the tests, constraints in materials and supplies, long turnaround times associated with certain tests, inadequate access to testing sites, and a lack of human resources (3). An additional challenge is in limited prognostic tools to assess the trajectory of infection and the eventual need for hospitalization or mechanical ventilation. The CDC confirms that COVID-19 can be contracted via airborne transmission along with contact and droplet transmission—features that underscore the need to improve capabilities in risk stratification of exposures via con- tact tracing and to ensure sufficient quarantining for recovering individuals. Significance Continuous measurements of health status can be used to guide the care of patients and to manage the spread of infectious diseases. Conventional monitoring systems cannot be deployed outside of hospital settings, and existing wear- ables cannot capture key respiratory biomarkers. This paper describes an automated wireless device and a data analysis approach that overcome these limitations, tailored for COVID- 19 patients, frontline health care workers, and others at high risk. Vital signs and respiratory activity such as cough can reveal early signs of infection and quantitate responses to therapeutics. Long-term trials on COVID-19 patients in clini- cal and home settings demonstrate the translational value of this technology. Author contributions: X.N., W.O., H.J., J.-T.K., L.P.C., A.R.B., A.B., A.J., S.X., and J.A.R. designed research; X.N., W.O., H.J., J.-T.K., A.T., A.M., C.W., J.Y.L., M.K., C.K.M., M.P., N.S., J.-K.C., K.L., J.U.K., A.R.B, A.B., A.J., S.X., and J.A.R. performed research; X.N., W.O., J.-T.K., A.T., A.M., C.W., J.H., H.C., S.R., Y.W., F.L., Y.J.K., and J.A.R. analyzed data; and X.N., W.O., H.J., J.-T.K., S.X., and J.A.R. wrote the paper.y Reviewers: M.A., University of Houston; and J.C., University of California, Los Angeles. y Competing interest statement: X.N., H.J., J.Y.L., K.L., A.J., S.X., and J.A.R. report inventor- ships and potential royalties in patents assigned to Northwestern University. M.K. and J.Y.L. are employees of a small private company with a commercial interest in the tech- nology. A.R.B., S.X., and J.A.R. report equity ownership in a small private company with a commercial interest in the technology.y This open access article is distributed under Creative Commons Attribution License 4.0 (CC BY).y 1 X.N., W.O., and H.J. contributed equally to this work.y 2 To whom correspondence may be addressed. Email: [email protected] or [email protected].y This article contains supporting information online at https://www.pnas.org/lookup/suppl/ doi:10.1073/pnas.2026610118/-/DCSupplemental.y Published April 23, 2021. PNAS 2021 Vol. 118 No. 19 e2026610118 https://doi.org/10.1073/pnas.2026610118 | 1 of 12 Downloaded by guest on February 8, 2022

Welcome message from author
This document is posted to help you gain knowledge. Please leave a comment to let me know what you think about it! Share it to your friends and learn new things together.
Transcript
ENG
INEE
RIN
G
Automated, multiparametric monitoring of respiratorybiomarkers and vital signs in clinical and homesettings for COVID-19 patientsXiaoyue Nia,b,1 , Wei Ouyanga,1, Hyoyoung Jeonga,1 , Jin-Tae Kima , Andreas Tzavelisa,c,d , Ali Mirzazadehe ,Changsheng Wua, Jong Yoon Leef , Matthew Kellerg, Chaithanya K. Mummidisettyh , Manish Patela,i ,Nicholas Shawenh, Joy Huangj, Hope Chenj, Sowmya Ravik , Jan-Kai Changa,l, KunHyuck Leea,m , Yixin Wua,m,Ferrona Liea, Youn J. Kanga , Jong Uk Kimn, Leonardo P. Chamorroo , Anthony R. Banksa , Ankit Bharatp,Arun Jayaramanh, Shuai Xua,q,2, and John A. Rogersa,c,m,r,s,t,u,2
aQuerrey Simpson Institute for Bioelectronics, Northwestern University, Evanston, IL 60208; bDepartment of Mechanical Engineering and Materials Science,Duke University, Durham, NC 27708; cDepartment of Biomedical Engineering, Northwestern University, Evanston, IL 60208; dMedical Scientist TrainingProgram, Feinberg School of Medicine, Northwestern University, Chicago, IL 60611; eCollege of Computing, Georgia Institute of Technology, Atlanta, GA30332; fSibel Inc., Niles, IL 60714; gSonica Health, Niles, IL 60714; hMax Nader Lab for Rehabilitation Technologies and Outcomes Research, Center for BionicMedicine, Shirley Ryan AbilityLab, Chicago, IL 60611; iCollege of Medicine, University of Illinois at Chicago, Chicago, IL 60612; jFeinberg School of Medicine,Northwestern University, Chicago, IL 60611; kDivision of Thoracic Surgery, Feinberg School of Medicine, Northwestern University, Chicago, IL 60611; lWearifiInc., Evanston, IL 60201; mDepartment of Materials Science and Engineering, Northwestern University, Evanston, IL 60208; nSchool of Chemical Engineering,Sungkyunkwan University, Suwon, 16419, Republic of Korea; oDepartment of Mechanical Science and Engineering, University of Illinois atUrbana–Champaign, Champaign, IL 61801; pDepartment of Surgery, Feinberg School of Medicine, Northwestern University, Chicago, IL 60611; qDepartmentof Dermatology, Feinberg School of Medicine, Northwestern University, Chicago, IL 60611; rDepartment of Mechanical Engineering, NorthwesternUniversity, Evanston, IL 60208; sDepartment of Chemistry, Northwestern University, Evanston, IL 60208; tDepartment of Electrical Engineering andComputer Science, Northwestern University, Evanston, IL 60208; and uDepartment of Neurological Surgery, Northwestern University, Evanston, IL 60208
Contributed by John A. Rogers, March 22, 2021 (sent for review January 11, 2021; reviewed by Metin Akay and Jun Chen)
Capabilities in continuous monitoring of key physiological parame-ters of disease have never been more important than in the contextof the global COVID-19 pandemic. Soft, skin-mounted electron-ics that incorporate high-bandwidth, miniaturized motion sensorsenable digital, wireless measurements of mechanoacoustic (MA)signatures of both core vital signs (heart rate, respiratory rate,and temperature) and underexplored biomarkers (coughing count)with high fidelity and immunity to ambient noises. This paper sum-marizes an effort that integrates such MA sensors with a clouddata infrastructure and a set of analytics approaches based on dig-ital filtering and convolutional neural networks for monitoring ofCOVID-19 infections in sick and healthy individuals in the hospitaland the home. Unique features are in quantitative measurementsof coughing and other vocal events, as indicators of both diseaseand infectiousness. Systematic imaging studies demonstrate corre-lations between the time and intensity of coughing, speaking, andlaughing and the total droplet production, as an approximate indi-cator of the probability for disease spread. The sensors, deployedon COVID-19 patients along with healthy controls in both inpatientand home settings, record coughing frequency and intensity con-tinuously, along with a collection of other biometrics. The resultsindicate a decaying trend of coughing frequency and intensitythrough the course of disease recovery, but with wide variationsacross patient populations. The methodology creates opportuni-ties to study patterns in biometrics across individuals and amongdifferent demographic groups.
wearable electronics | digital health | biomarkers |respiratory disease | COVID-19
As of December 26, The Centers for Disease Control andPrevention (CDC) tabulations indicate over 18 million
recorded cases of COVID-19 and more than 329,592 in deathsin the United States (1). Accurate and widespread testing is akey component of the response to this pandemic (2). Althoughthe capacity and availability of COVID-19 molecular diagnosticscontinues to increase, shortcomings follow from variabilities inthe accuracy of the tests, constraints in materials and supplies,long turnaround times associated with certain tests, inadequateaccess to testing sites, and a lack of human resources (3). Anadditional challenge is in limited prognostic tools to assess the
trajectory of infection and the eventual need for hospitalizationor mechanical ventilation. The CDC confirms that COVID-19can be contracted via airborne transmission along with contactand droplet transmission—features that underscore the need toimprove capabilities in risk stratification of exposures via con-tact tracing and to ensure sufficient quarantining for recoveringindividuals.
Significance
Continuous measurements of health status can be used toguide the care of patients and to manage the spread ofinfectious diseases. Conventional monitoring systems cannotbe deployed outside of hospital settings, and existing wear-ables cannot capture key respiratory biomarkers. This paperdescribes an automated wireless device and a data analysisapproach that overcome these limitations, tailored for COVID-19 patients, frontline health care workers, and others at highrisk. Vital signs and respiratory activity such as cough canreveal early signs of infection and quantitate responses totherapeutics. Long-term trials on COVID-19 patients in clini-cal and home settings demonstrate the translational value ofthis technology.
Author contributions: X.N., W.O., H.J., J.-T.K., L.P.C., A.R.B., A.B., A.J., S.X., and J.A.R.designed research; X.N., W.O., H.J., J.-T.K., A.T., A.M., C.W., J.Y.L., M.K., C.K.M., M.P.,N.S., J.-K.C., K.L., J.U.K., A.R.B, A.B., A.J., S.X., and J.A.R. performed research; X.N., W.O.,J.-T.K., A.T., A.M., C.W., J.H., H.C., S.R., Y.W., F.L., Y.J.K., and J.A.R. analyzed data; and X.N.,W.O., H.J., J.-T.K., S.X., and J.A.R. wrote the paper.y
Reviewers: M.A., University of Houston; and J.C., University of California, Los Angeles. y
Competing interest statement: X.N., H.J., J.Y.L., K.L., A.J., S.X., and J.A.R. report inventor-ships and potential royalties in patents assigned to Northwestern University. M.K. andJ.Y.L. are employees of a small private company with a commercial interest in the tech-nology. A.R.B., S.X., and J.A.R. report equity ownership in a small private company witha commercial interest in the technology.y
This open access article is distributed under Creative Commons Attribution License 4.0(CC BY).y1 X.N., W.O., and H.J. contributed equally to this work.y2 To whom correspondence may be addressed. Email: [email protected] [email protected]
This article contains supporting information online at https://www.pnas.org/lookup/suppl/doi:10.1073/pnas.2026610118/-/DCSupplemental.y
Published April 23, 2021.
PNAS 2021 Vol. 118 No. 19 e2026610118 https://doi.org/10.1073/pnas.2026610118 | 1 of 12
Dow
nloa
ded
by g
uest
on
Feb
ruar
y 8,
202
2

To address some of these needs, a range of digital health tools,from mobile applications for collecting self-reported symptomsto consumer wearable devices and clinical-grade medical sen-sors for tracking physiological status, are under development andin initial stages of deployment (4). Researchers at FitBit reportthe ability to identify infection with COVID-19 via four previ-ous days of data collected from their wrist-worn devices to yieldovernight heart rate, respiratory rate, and heart rate variability(5). Others claim similar detection capabilities with alternativewrist-based devices (6). Several ongoing large-scale trials aim toevaluate these wearables for early detection of COVID-19 infec-tion, from smart rings (Oura Ring) to skin-interfaced patches[VitalConnect (7), Philips (8), Sonica (9)], to other smart watches[e.g., Empatica (10)] with support from various federal agen-cies. Devices that mount on the finger or wrist can monitorsome subset of conventional vital signs (11–15), such as heartrate. Loose interfaces at these body locations, however, limitthe range of detectable physiological activities, particularly res-piratory signals (16, 17). The inability to capture complex healthinformation reduces the potential for precise and reliable anal-ysis (18). Development of robust metrics for early detectionand disease tracking requires multiparametric operation acrossdifferent digital biomarkers and unconventional metrics rele-vant to the disease of interest. Challenges remain in addressingthese requirements simultaneously while maintaining simplic-ity and ease of use of the sensing system, as is necessary forpractical deployment at scale in remote, continuous monitoringsettings (19).
As COVID-19 is a respiratory disease, cough and other soundsfrom the thoracic cavity, trachea, and esophagus are examples ofhighly relevant biometrics. Laboratory-scale studies demonstratecough-based diagnoses of diverse respiratory diseases throughmeasurements of frequency (20), intensity (21), persistency (22),and unique audio features (23). Investigations on audio record-ing data show differences between COVID-19 positive and neg-ative subjects’ vocalizing patterns including phonation of speech(24, 25), breathing, and coughing sounds (26–29). The resultsmay suggest possibilities for disease monitoring in asymptomaticpatients. Recent work applies voice profiling and computer audi-tion to track cough, speech, respiratory, and other sounds forrisk assessment and diagnosis of COVID-19 (30, 31). Monitor-ing cough and other vocal events (speaking, laughing, etc.) notonly provides a signature of disease but also has potential ingenerating metrics of infectiousness, as these mechanisms yieldaerosols/droplets that contribute to virus transmission (32–34).Previous studies show that the total volume of aerosols correlatewith the loudness and duration of vocal events. Measurementsof the timing and intensity of sounds may, therefore, serve asreliable means to quantify one aspect associated with risks ofspreading the disease (35).
Point-of-care or semicontinuous methods for quantifyingcoughing or other vocal activities rely on electromyography,respiratory inductive plethysmography, accelerometry, or audi-tory recordings captured with one or several sensors, sometimeswith other exploratory approaches (e.g., the nasal thermistor orthe electrocardiography) (36–41). Digital signal processing fol-lowed by machine learning algorithms often serves as the basisfor classification (42–53). Microphone-based methods prevaildue to their widespread availability and their alignment withlarge crowd-sourced datasets (e.g., COUGHVID, HealthMode,DetectNow, VoiceMed). A key challenge is that backgroundsounds and/or environmental noises frustrate robust and accu-rate measurements. Measurements of loudness can be unreliablebecause they depend on the separation between the device andthe subject. Most importantly, audio recordings raise privacy andlegal issues, thereby limiting the scale of application.
The results presented here bypass these disadvantages, toallow continuous assessments of respiratory biomarkers cor-
relative to health status and droplet/aerosol production, withadditional information on a range of traditional vital signs. Here,a simple, wireless monitoring device (54) combines with a cloudinterface and a data analytics approach to allow continuous mon-itoring of a breadth of conventional (e.g., heart rate, respiratoryrate, physical activity, body orientation, and temperature) andunconventional (e.g., coughing, speaking) physiological param-eters of direct relevance to COVID-19. The results serve as aquantitative basis for 1) detecting early signs of symptoms inhealth care workers and other high-risk populations, 2) mon-itoring symptomatic progression of infected individuals, and3) tracking responses to therapeutics in clinical settings. In addi-tion, systematic studies presented here indicate that coughing,speaking, and laughing events measured with these devices cor-relate to the total amount of droplet production. This link offersan opportunity to quantify the infectiousness of individuals, ascritical information in caring for patients and for improved riskstratification in the context of contact tracing and individualquarantines.
Pilot studies on COVID-19 patients at an academic medicalcenter (Northwestern Memorial Hospital) and a rehabilitationhospital (Shirley Ryan AbilityLab) include 3,111 h of data span-ning a total of 363 d from 37 patients (20 females, 17 males), inan overall implementation that supports automated operation,with minimal user burden. Long-term monitoring reveals trendsin various parameters, including coughing frequency, followingthe test-positive date for eight patients (four females, four males)over more than 7 d. Evaluations across 27 patients (15 females,12 males) with ages between 21 and 75 y reveal diverse cough-ing patterns across individuals and consistent trends during therecovery process.
ResultsSensor Designs, System Configurations, and Wireless, Cloud-EnabledModes of Operation. Fig. 1A presents a schematic illustration ofthe system. The circuit architecture represents an advanced ver-sion of the soft, skin-interfaced mechanoacoustic (MA) devicereported previously (54). Briefly, a flexible printed circuit board(fPCB; 25-µm-thick middle polyimide with double-sided 12-µm-thick rolled, annealed copper, AP7164R, DuPont) withserpentine conductive traces supports collections of chip-scalecomponents including a high-bandwidth, inertial measurementunit (IMU) with a triaxial accelerometer (LSMDSL, STMi-croelectronics) as the key sensing element, a Bluetooth LowEnergy (BLE) system-on-a-chip (SoC) for control and wire-less connectivity, an on-board memory module for data stor-age, and a wireless unit for recharging a compact battery. Athin, soft elastomer membrane (Ecoflex, 00-30, smooth on, 300µm) completely encapsulates the device as a compliant, non-irritating interface to the suprasternal notch (SN), supportedby a thin, double-sided biomedical adhesive. The design of thesystem for the studies reported here includes an automateduser interface that minimizes manual operations, where thewireless charging platform serves as a hub to switch modesfrom recording to data transfer. Specifically, the device remainsin data acquisition mode when not on the charger. Duringcharging, the device automatically stops recording and startstransmitting data to a BLE-enabled device such as a phoneor a tablet with internet connectivity to a Health InsurancePortability and Accountability Act (HIPPA) compliant cloudserver. Algorithms operating on the server deliver results toa graphical dashboard for feedback to health workers and/orpatients.
When interfaced to the SN, the device captures subtle vibra-tions of the skin as signatures of a wide range of physiologicalprocesses (54). Fig. 1B shows an example of three-axis accel-eration data recorded from an inpatient (female, age 53 y)wearing the device for 48 h. The sampling rate for motions
2 of 12 | PNAShttps://doi.org/10.1073/pnas.2026610118
Ni et al.Automated, multiparametric monitoring of respiratory biomarkers and vital signs in clinical and home
settings for COVID-19 patients
Dow
nloa
ded
by g
uest
on
Feb
ruar
y 8,
202
2

ENG
INEE
RIN
G
A
B
C
Fig. 1. The health monitoring system incorporating an MA sensor, Bluetooth and cloud-based data transmission, automated data processing platform, anda user interface with a minimum need for manual operation. (A) Schematic illustration of the operational flow of the system, which consists of a device,cloud, and data processing platforms. (B) Sample three-axis acceleration raw data acquired continuously over 48 h on a COVID-19 patient. Dashed linesindicate occurrences of various representative body processes of interest, shown in (C) zoomed-in 2-min windows.
perpendicular to the surface of the skin (z axis) is 1,666 Hz; therates for the x axis (perpendicular to the axis of the neck) andy axis (along the neck) are 416 Hz. Fig. 1C shows time series
representations of sample events in 2-min windows. Featuresassociated with coughing and speaking include high-frequencycomponents with significant amplitudes (∼ 10◦ g) along the z and
Ni et al.Automated, multiparametric monitoring of respiratory biomarkers and vital signs in clinical and homesettings for COVID-19 patients
PNAS | 3 of 12https://doi.org/10.1073/pnas.2026610118
Dow
nloa
ded
by g
uest
on
Feb
ruar
y 8,
202
2
y axis but small amplitudes (∼ 10−1 g) along the x axis. Physicalactivity induces comparatively large accelerations (∼ 10◦ g)along all axes. During the periods without such activities, subtlevital signals from respiratory and cardiac cycles are readily appar-ent. Recordings during sleep can also yield body orientations andsnoring events, including those that are scarcely audible.
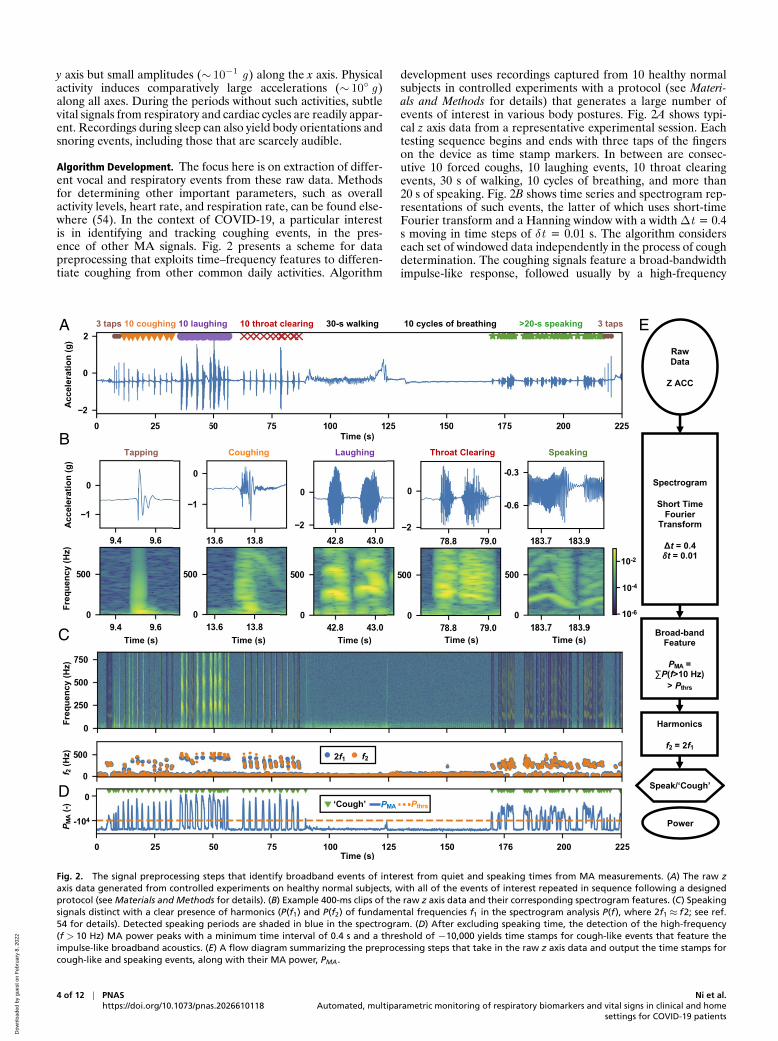
Algorithm Development. The focus here is on extraction of differ-ent vocal and respiratory events from these raw data. Methodsfor determining other important parameters, such as overallactivity levels, heart rate, and respiration rate, can be found else-where (54). In the context of COVID-19, a particular interestis in identifying and tracking coughing events, in the pres-ence of other MA signals. Fig. 2 presents a scheme for datapreprocessing that exploits time–frequency features to differen-tiate coughing from other common daily activities. Algorithm
development uses recordings captured from 10 healthy normalsubjects in controlled experiments with a protocol (see Materi-als and Methods for details) that generates a large number ofevents of interest in various body postures. Fig. 2A shows typi-cal z axis data from a representative experimental session. Eachtesting sequence begins and ends with three taps of the fingerson the device as time stamp markers. In between are consec-utive 10 forced coughs, 10 laughing events, 10 throat clearingevents, 30 s of walking, 10 cycles of breathing, and more than20 s of speaking. Fig. 2B shows time series and spectrogram rep-resentations of such events, the latter of which uses short-timeFourier transform and a Hanning window with a width ∆t = 0.4s moving in time steps of δt = 0.01 s. The algorithm considerseach set of windowed data independently in the process of coughdetermination. The coughing signals feature a broad-bandwidthimpulse-like response, followed usually by a high-frequency
A
B
C
D
E
Fig. 2. The signal preprocessing steps that identify broadband events of interest from quiet and speaking times from MA measurements. (A) The raw zaxis data generated from controlled experiments on healthy normal subjects, with all of the events of interest repeated in sequence following a designedprotocol (see Materials and Methods for details). (B) Example 400-ms clips of the raw z axis data and their corresponding spectrogram features. (C) Speakingsignals distinct with a clear presence of harmonics (P(f1) and P(f2) of fundamental frequencies f1 in the spectrogram analysis P(f), where 2f1≈ f2; see ref.54 for details). Detected speaking periods are shaded in blue in the spectrogram. (D) After excluding speaking time, the detection of the high-frequency(f > 10 Hz) MA power peaks with a minimum time interval of 0.4 s and a threshold of −10,000 yields time stamps for cough-like events that feature theimpulse-like broadband acoustics. (E) A flow diagram summarizing the preprocessing steps that take in the raw z axis data and output the time stamps forcough-like and speaking events, along with their MA power, PMA.
4 of 12 | PNAShttps://doi.org/10.1073/pnas.2026610118
Ni et al.Automated, multiparametric monitoring of respiratory biomarkers and vital signs in clinical and home
settings for COVID-19 patients
Dow
nloa
ded
by g
uest
on
Feb
ruar
y 8,
202
2

ENG
INEE
RIN
G
chirp (>200 Hz). Speaking signals also have high-frequencycomponents, but usually with distinct harmonic features. Analgorithm based on such harmonics can screen the data forprominent speaking periods (Fig. 2C). After excluding speakingevents, a minimum amplitude threshold Pthrs = −10,000 detectspeaks of the logarithm of spectral power integrated across thehigh-frequency band (>10 Hz) (PMA) and labels them as cough-like events, with a minimum time interval between peak events of0.4 s (Fig. 2D). Here, cough-like events include laughing, throatclearing, and also some speaking periods that exhibit unclear har-monics. Fig. 2E shows the data processing flow, which begins
with raw z axis data and returns the time stamps for speakingand cough-like events, as well as their associated integrated loga-rithm power. Such an analysis applied to the testing data detects26.4 s of speaking with clear harmonics features, and identifies10 coughing, 20 laughing, 12 throat clearing, 36 speaking, and 6tapping instances as cough-like (Fig. 2A).
Distinguishing actual coughs from the pool of cough-likeevents demands further classification by machine learning. Aconvolutional neural network (CNN) uses as inputs Morletwavelet transforms of 0.4-s raw z axis data (shaped by the Han-ning window) of these events (Fig. 3A). The wavelet transform
A
B
C
D E F
Fig. 3. The machine learning algorithm for the classification of cough-like events extracted by the preprocessing algorithm. (A) Steps of feature scalogramgeneration from raw data. (B) Representative scalograms of events of interest. (C) The architecture of a CNN that takes in a feature scalogram and outputsits probabilities of classes. (D) The averaged confusion matrix from the iterated 20 leave-one-out testings. (E) The overall testing accuracy on each left-outsubject using a model trained on the other 19 subjects. (F) The macroaveraged ROC curves of each left-out subject using a model trained on the other 19subjects and the corresponding AUC. a.u., arbitrary unit.
Ni et al.Automated, multiparametric monitoring of respiratory biomarkers and vital signs in clinical and homesettings for COVID-19 patients
PNAS | 5 of 12https://doi.org/10.1073/pnas.2026610118
Dow
nloa
ded
by g
uest
on
Feb
ruar
y 8,
202
2
offers advantages compared to the short-time Fourier transformbecause of its favorable resolution in characterizing nonstation-ary signals, which improves the accuracy of classification. Fig. 3Bshows scalograms of cough-like events, including tapping (onetype of motion artifact), coughing, laughing, throat clearing, andspeaking events. These scalograms, with shapes of 60× 666× 1,serve as inputs to the CNN model. As shown in Fig. 3C, the CNNstarts with a three-channel convolutional layer with a kernel sizeof 3× 3, followed by a standard 50-layer residual neural net-work (ResNet), a CNN architecture for image classification (55).The output of the ResNet flattens to a layer of 86,106 neurons,followed by two fully connected layers with rectified linear unitactivation and two dropout layers (p = 0.5) alternately. The finalfully connected layer of the CNN model has five neurons withSoftmax activation, which corresponds to probabilities associ-ated with the five types of events of interest: coughing, speaking,throat clearing, laughing, and motion artifact, where most of themotion artifacts are those events arising from physical contact onor around the device.
Data collected from 10 healthy volunteers yield labeled timewindows consisting of 1,379 coughing, 1,441 speaking, 1,313laughing, 1,423 throat clearing, and 2,890 motion artifact events.Because sample events generated in controlled experiments candiffer from those that occur naturally in uncontrolled settings,the training of the CNN model uses not only scalograms oflabeled events from 10 healthy volunteers (subjects 1 to 10)but also 10 COVID-19 patients during natural daily behav-iors (subjects 11 to 20). Determinations of ground truth fromthe patient data involve listening to soundtracks created fromthe accelerometer data and then manually labeling the data(see Materials and Methods for code availability). Most of theevents associated with coughing, speaking, and motion artifactscan be determined unambiguously in this manner. Difficultiesarise in distinguishing between laughing, throat clearing, andcertain periods of speaking, thereby leading to some level ofuncertainty. Such manual analysis of data collected from 10COVID-19 patients generates a total of 1,405 coughing, 1,449speaking, 193 laughing, 210 throat clearing, and 2,905 motionartifact events. SI Appendix, Table S1 includes detailed demo-graphic and data collection information for all of the trainingsubjects.
The generalization performance of the CNN model can bedetermined using a leave-one-out strategy, where one leaves asubject out of the training set (19 subjects for training) andthen tests the trained model on this subject. Iterations applythis approach to each of the 20 subjects. Each training set con-sists of a random collection of 80% of the labeled events fromthe 19 subjects, with the remaining 20% used for validation.The training uses an Adam optimization algorithm. Fig. 3Dshows the averaged confusion matrix of 20 leave-one-out test-ing cycles. The model achieves accuracies of 0.90± 0.08 forcoughing, 0.88± 0.1 for speaking, 0.79± 0.14 for throat clear-ing, 0.81± 0.14 for laughing, and 0.98± 0.02 for motion artifact.The classifications for throat clearing and laughing have compar-atively lower average accuracies and higher standard deviations,due to their similarity to certain speaking signals, as evidencedby the confusion matrix (Fig. 3D). Fig. 3E shows the over-all five-way classification accuracies on each subject using amodel trained on the other 19 subjects. The minimum over-all accuracy is 0.85 for all subjects. The receiver operationcharacteristic (ROC) curve characterizes the trade-off betweensensitivity and specificity in binary classification—varying thethreshold of the cutoff probability at the final output layergenerates ROC curves of each of the five types of events (cough-ing vs. noncoughing, speaking vs. nonspeaking, etc.). Fig. 3Fpresents the macroaveraged ROC curves for each subject. Thehigh area under the curve (AUC) of >0.97 for all subjectsindicates that the model achieves a good balance between sen-
sitivity and specificity (see SI Appendix, Table S2 for detailedinformation).
MA Sensing of Droplet Production. Given the transmissibility ofmany types of viruses through droplets and aerosols, MA mea-surements that correlate the timing and intensity of activitiesassociated with droplet production may yield reliable metrics ofthe risks of the population spread of COVID-19. Robust identi-fication of coughing events, along with their frequency, intensity,and, in the future, detailed time dynamics (i.e., effective sounds),has relevance in this context. Other forms of vocalization suchas speaking, singing, shouting, etc., are also important. Previ-ous studies show that different types and volumes of vocal orrespiratory-related events yield significantly different levels ofaerosol production (35), with direct relevance to evaluating therisks of viral transmission. Fig. 4A presents results that calibratethe high-frequency power PMA associated with the z axis accel-eration component of the MA signals to measurements with adecibel meter PdB in a quiet (background noise of<40 dB) envi-ronment for cases of coughing, speaking (repeating words “ter-minator”), and laughing from a healthy normal subject (male,Asian, age 30 y). The results show a linear correlation PMA =p1PdB + p2 for all three classes in the audible range of 55 dBto 85 dB, with p1 = 200± 20 dB−1, p2 =−12,000± 1,700 dB−1
for coughing; p1 = 105± 10 dB−1, p2 =−7,000± 700 dB−1 forspeaking; and p1 = 114± 30 dB−1, p2 =−5,800± 1,200 dB−1
for laughing (SI Appendix, Fig. S1).Fig. 4 B and C shows the experimental setup of quantita-
tive imaging studies (see Materials and Methods for details) thatexamine correlations between MA data and droplet produc-tion, with a focus on relationships between the total number ofdroplets and the intensities of coughing, speaking, and laughing.The measurements include droplet dynamics captured via par-ticle tracking velocimetry (PTV; see Materials and Methods fordetails), power levels from the MA data (PMA), and audio lev-els from a decibel meter (PdB ). Fig. 4 D–F shows a sequenceof results from the MA sensor and the PTV analysis for cough-ing, speaking, and laughing, respectively, where markers indicateevents correctly identified and classified by the automated algo-rithm. Fig. 4 G–I are images of coughing, talking, and laughingat the peak of corresponding marked boxes in Fig. 4 D–F. ThePTV method tracks individual particles in the Lagrangian frameof ref. 59. Fig. 4 J–L shows the detected particles, with sizes indi-cated by the diameters of the gray circular symbols. As expected,the findings indicate that a larger number of droplets (deter-mined across the investigation area of ∼ 34×∼ 17 cm2, andwith radius R > 50 µm in the detectable range) results fromcoughing (200 to 800 droplets) than from speaking or laugh-ing (10 to 200 droplets) at comparable decibel levels and timedurations. More than 60% of droplets are smaller than 150 µmin radius for all measured respiratory activities (SI Appendix,Fig. S2).
Interpolated horizontal velocity (u) contours from droplet tra-jectories indicate a large swirling motion for coughing, withpositive velocity near the mouth and negative velocity in thebottom of the investigated area (Fig. 4J). Droplets show ballis-tic behavior for speaking and dispersive behavior for laughing(Fig. 4 K and L). The ballistic behavior of droplets results fromenhanced jet-like transport of the expelled airflow induced byplosive sounds (56). Drastically different inertial particle dynam-ics occur depending on the size of droplets, even within the samecycle. Specifically, small droplets linger in the air and respondto ambient flows. Large droplets travel at high velocities andare minimally influenced by flows, within a range investigated.Statistical analyses of the total number of droplets (Nd ) of allmeasured respiratory activities at various audio levels appear inFig. 4 M and O. The number of droplets exhibits some correla-tion to the audio decibel level and the power intensity of the MA
6 of 12 | PNAShttps://doi.org/10.1073/pnas.2026610118
Ni et al.Automated, multiparametric monitoring of respiratory biomarkers and vital signs in clinical and home
settings for COVID-19 patients
Dow
nloa
ded
by g
uest
on
Feb
ruar
y 8,
202
2

ENG
INEE
RIN
G
BA C
FED
G H I
JK L
ONM
Fig. 4. MA sensing to quantify the transmission of droplets. (A) MA power vs. decibel meter measurement for coughing, speaking, and laughing. (B)Experimental setup for optical imaging of droplets. (C) Sample image of coughing. (D–F) Time series of MA z axis acceleration (ZACC) in sync with the analysisof MA power and the imaging detection of the number of the particles. (G–I) Instantaneous images of coughing, talking, and laughing at the peak ofcorresponding marked boxes in D–F. (J–L) Detected particles with sizes indicated by the diameters of the gray circular symbols, overlapped with velocitycontour fields at the corresponding instances in G–I; the color denotes stream-wise velocity in the horizontal (x axis) direction. (M–O) Box and whisker plotsshowing the number of particles with mean, median, and interquartile range (IQR) for all measured cycles of coughing, speaking, and laughing, respectively.See Materials and Methods for full description.
data, for all activities. SI Appendix, Fig. S3 and Movie S1 includeadditional results from the imaging analysis of droplet dynamics.
Multiparametric Monitoring from a Cohort of COVID-19 Patients.Scaled deployment of the MA device and the machinelearning algorithm on COVID-19 patients in a clinical set-
ting demonstrates practical utility and patient compliancewithout user or physician burden. The studies involve con-tinuous, long-term (>7 d) monitoring of parameters rele-vant to patient status, not only coughing dynamics but alsoother forms of vocalization, along with heart rate, respira-tion rate, body orientation, and overall activity. These pilot
Ni et al.Automated, multiparametric monitoring of respiratory biomarkers and vital signs in clinical and homesettings for COVID-19 patients
PNAS | 7 of 12https://doi.org/10.1073/pnas.2026610118
Dow
nloa
ded
by g
uest
on
Feb
ruar
y 8,
202
2
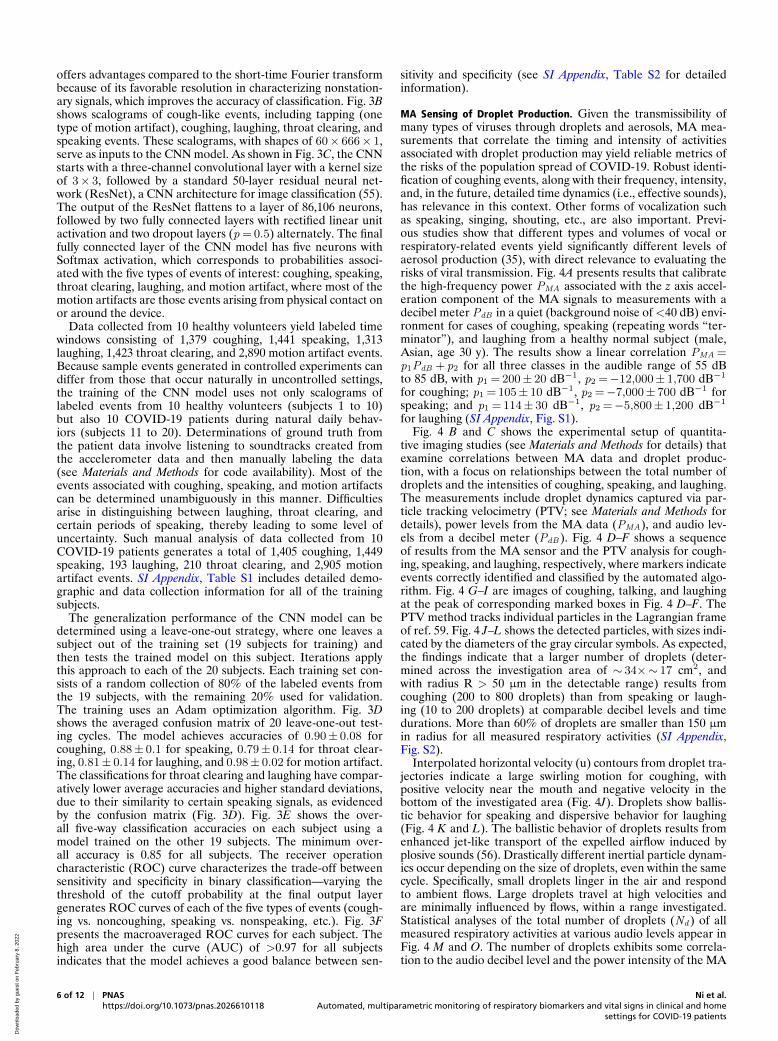
studies correspond to 3,111 h of data from 37 patients(20 females, 17 males; see SI Appendix for detailed demo-graphic information) with 27,651 detected coughs. Fig. 5A showsdata and analysis results for a representative 1-h session with afemale patient. The CNN model, trained using a process thatis blind to any of the patients described in this section, returnspredicted classes for each cough-like event detected by the pre-processing step. A manual labeling process based on audio files
provides reference labels for comparison. Statistical analysis, ona total of 10,258 randomly sampled events from 10 patients (6females, 4 males; patient IDs listed in SI Appendix, Table S1)with manual labels shows macroaveraged sensitivity (i.e. recall)of ≥ 0.87, specificity of ≥ 0.96, and ≥ 0.85 precision for cough-ing (N = 2,785) and artifacts detection (N = 2,768) (Fig. 5Band SI Appendix, Table S2). The sensitivity and precision forspeaking (N = 2,758), throat clearing (N = 1,212), and laughing
A B
C
D
E
F
G
Fig. 5. Deployment of MA devices on to the COVID-19 patients in clinical settings. (A) Representative z axis acceleration data measured from a femalepatient. The automated algorithm detects cough-like events and outputs five-way classification for the events to coughing (0), speaking (1), throat clearing(2), laughing (3), and motion artifacts (4). (B) The macroaveraged testing performance (sensitivity/recall, specificity, and precision) of each type of event onthe 10 patients with manual labels, which include 10,258 randomly sampled events in total. (C and D) Example results for the detected coughing and talkingfrequency and intensity (color-coded) in 5-min windows from continuous 48-h monitoring of the same patient (raw acceleration data are shown in Fig. 1B and C). (E–G) The vital signs information includes heart rate (HR) in a unit of beats per minute (BtPM) and respiration rate (RR) in a unit of breaths perminute (BrPM), and physical activity (PA), extracted from the same measurement, with their amplitude information color coded. a.u., arbitrary unit.
8 of 12 | PNAShttps://doi.org/10.1073/pnas.2026610118
Ni et al.Automated, multiparametric monitoring of respiratory biomarkers and vital signs in clinical and home
settings for COVID-19 patients
Dow
nloa
ded
by g
uest
on
Feb
ruar
y 8,
202
2
ENG
INEE
RIN
G
A
B
C
D
E
F G
H I
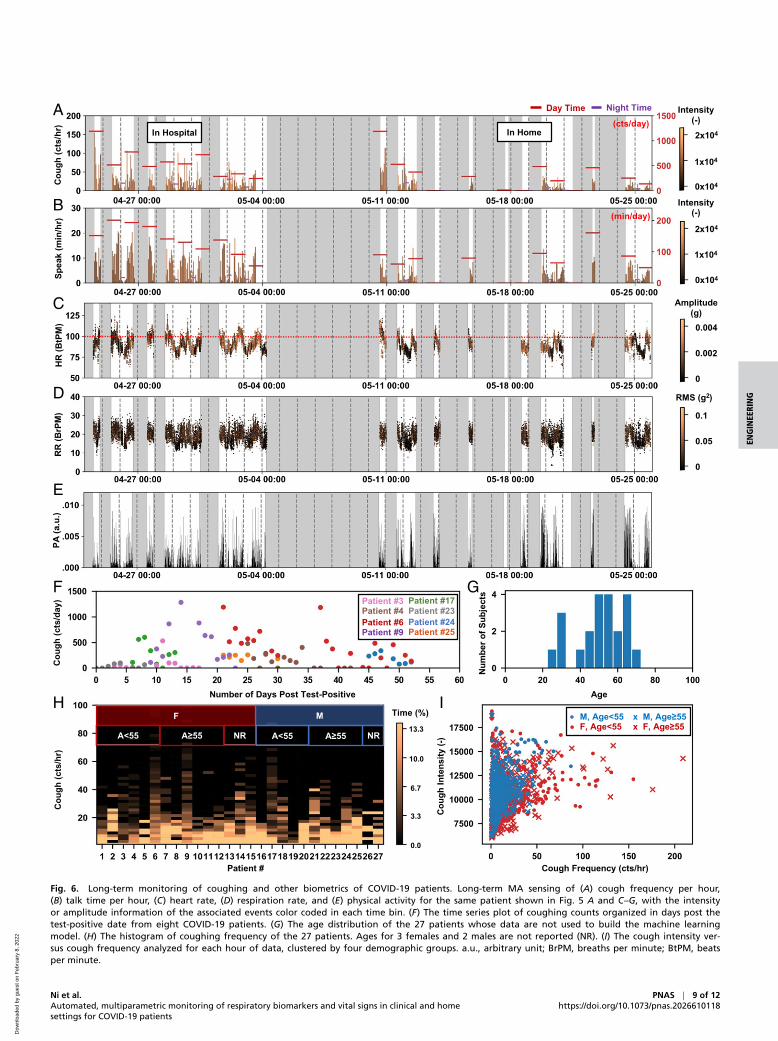
Fig. 6. Long-term monitoring of coughing and other biometrics of COVID-19 patients. Long-term MA sensing of (A) cough frequency per hour,(B) talk time per hour, (C) heart rate, (D) respiration rate, and (E) physical activity for the same patient shown in Fig. 5 A and C–G, with the intensityor amplitude information of the associated events color coded in each time bin. (F) The time series plot of coughing counts organized in days post thetest-positive date from eight COVID-19 patients. (G) The age distribution of the 27 patients whose data are not used to build the machine learningmodel. (H) The histogram of coughing frequency of the 27 patients. Ages for 3 females and 2 males are not reported (NR). (I) The cough intensity ver-sus cough frequency analyzed for each hour of data, clustered by four demographic groups. a.u., arbitrary unit; BrPM, breaths per minute; BtPM, beatsper minute.
Ni et al.Automated, multiparametric monitoring of respiratory biomarkers and vital signs in clinical and homesettings for COVID-19 patients
PNAS | 9 of 12https://doi.org/10.1073/pnas.2026610118
Dow
nloa
ded
by g
uest
on
Feb
ruar
y 8,
202
2

(N = 735) are as low as 0.58, likely due, in part, to the ambi-guities in ground truth labeling. SI Appendix, Table S2 includesadditional details on statistical analyses with subject-specificinformation. Fig. 5C presents results of coughing counts per 5min in bars and the associated coughing effort (i.e., PMA) incolor. In general, the coughing frequency and intensity peak inthe morning, and distribute evenly throughout the day. Fig. 5Dpresents a similar analysis of speaking, with uniformly distributedspeaking time and loudness (i.e., PMA) during daytime.
Previously reported algorithms applied to these same MA datastreams yield other important parameters (54). For example, Fig.5 E–G summarizes heart rate, respiration rate, and physical activ-ities, where the color-coded intensity values correspond to peakamplitudes of cardiac signals in the frequency band 20 Hz to55 Hz and root-mean-square values for low-passed respirationcycles in the band 0.1 Hz to 1 Hz. Fig. 6 A–E presents this col-lective information (coughing counts, speaking time, heart rate,respiration rate, and physical activity, and their associated inten-sity or amplitude) for the same patient over 1 mo. Gray shadedareas indicate periods when the patient is not wearing the device.The same analysis has been applied to a total of 27 patients (15females, 12 males) whose data are not used in building the CNNmodel. SI Appendix, Figs. S4–S20 shows the results for an addi-tional 17 patients (9 females, 8 males; patient IDs listed in SIAppendix, Table S1) with a minimum of 7 d of enrollment.
Fig. 6F presents a time series plot for eight patients (fourfemales, four males; patient IDs listed in SI Appendix, TableS1) with the date of a positive PCR test for COVID-19, wherethe event of interest is coughing count organized by days afterthe test. The results suggest a correlation between coughingfrequency and the gradual process of recovery, as might beexpected. The significant variation in decay rates, however, indi-cates individual-specific recovery and aerosolization potential.Fig. 6G summarizes the age distribution for the total of 27 testingpatients. Fig. 6H compares the histogram of coughing frequencyof these individuals, to reveal the diverse regularity of cough-ing across time. Fig. 6I shows the coughing frequency versusthe average coughing intensity for all hourly measurements, clus-tered into four demographic groups (males of age<55 y, males ofage ≥55 y, females of age<55 y, females of age ≥55 y). The avail-able results suggest that females tend to cough more than males.SI Appendix, Table S1 includes detailed demographic and datacollection information for all of the testing patients. The statisticsmay provide insights for creating guidelines for disease manage-ment and containment. Further studies on an expanded patientpopulation with detailed demographic information are, however,necessary to enable big-data–based studies of the demographicdependence and/or individual variance of relevant biometrics.
DiscussionThis paper introduces an automated hardware–software solutionfor sensing of diverse health information relevant to patient sta-tus, with a focus on underexplored respiratory biomarkers suchas cough and their changes with COVID-19 disease state. Scaledstudies indicate applicability to COVID-19 patients in both clin-ical and home settings. The approach relies on a soft, wirelesssensing device placed on the SN, to capture data that can beprocessed through a combination of digital filtering and machinelearning techniques to separate and quantify different body pro-cesses. In addition to patient status, these data show promisein tracking droplet/aerosol production and, therefore, diseasetransmission related to cough and other expiratory events. Theresults have implications for early detection, patient care, anddisease management, with specific relevance to COVID-19.
These systems allow for multiparametric monitoring with min-imal burden, through a range of conventional and unconven-tional signatures of health status. Cough is an example of apotentially important biomarker that can yield insights to com-
plement those from analysis of traditional vital signals. Exten-sions of the approaches reported here can be considered instrategies that extract additional information from specific formsof speech (e.g., plosive consonants), advanced assessments ofcoughing and respiratory sounds, and correlations between bodypositions and these activities, as well as coupled responses andtiming intervals between different events. MA sensing of dis-tinctive features in respiratory biomarkers and physiologicalcharacteristics between COVID-19 patients and healthy subjectssuggests a versatile platform for disease monitoring and manage-ment. The addition of optical sensors will enable measurementsof blood oxygenation, without affecting the ability to simultane-ously capture MA signals. The results offer many possibilitiesin data fusion for precision healthcare, including but not con-strained to COVID-19 (19, 57, 58). Scaled deployment will yieldlarge amounts of accessible biometric data, as the potential basisfor predictive disease models, cost-effective care of patients, andcontainment of disease transmission.
Materials and MethodsDevice Design and Components. The fPCB schematic diagram and boardlayout were designed using AUTODESK EAGLE (version 9.6.0) for astretchable and bendable MA device. Serpentine-shaped outlines con-nect three separated islands (main body, sensor, and charging coil).A summary of the bill of materials for the device includes 0201and 0402 inch footprint (imperial code) passive components (resistors,capacitors, and inductors), four turns of wireless charging coil pat-tern (resonance frequency: 13.56 MHz), full-bridge rectifier, power man-agement integrated circuits (IC) (Bq25120a, Texas Instruments), 3.0-Vstep-down power converter (TPS62740, Texas Instruments), 3.7-V lithiumpolymer battery (75 mAh), voltage and current protection IC for Li-Polymer battery (BQ2970, Texas Instruments), BLE SoC (nRF52840, NordicSemiconductor), flash memory (MT29F4G, Micron), and IMU (LSM6DSL,STMicroelectronics).
Device Fabrication and Encapsulation. Panels of fPCB were manufactured,and surface-mount device processes were performed by an Interna-tional Organization for Standardization 9001-compliant manufacturer. Cus-tomized firmware was downloaded by Segger Embedded Studio, followedby an fPCB folding and battery soldering process. Each aluminum mold fortop and bottom layers was prepared with a freeform prototyping machine(Roland MDX 540), and the devices were encapsulated using precured topand bottom layers (Silbione-4420, each 300 µm thick) after filling with sil-icone elastomer (Eco-Flex 0030, 1:1 ratio) in the cavity in which the devicewas positioned. After fixing and pressing top/bottom molds using clamps,the mold was placed into an oven that holds a temperature of 95 ◦Cfor 20 min to cure the silicone elastomer. The mold was then taken outof the oven and placed in a room temperature area for 20 min to cooldown. After cooling down, the clamps were removed, the encapsulateddevice was placed on a cutting surface, and excess enclosure material wasremoved using a prefabricated hand-held die cutter. A CO2 laser formedthe shape of the double-sided adhesives and yielded a smooth and cleancontour cut.
Data Collection. All of the participants provided written/verbal consentprior to their participation in this research study (see SI Appendix, TableS1 for demographic information of all individuals studied). Study proce-dures were approved by the Northwestern University Institutional ReviewBoard (STU00202449 and STU00212522) and were registered on Clinical-Trials.gov (NCT02865070 and NCT04393558). All study-related procedureswere carried out in accordance with the standards listed in the Declarationof Helsinki, 1964. During the study, participants wore an MA device at SN(Fig. 1A). In the case of patients, a clinician/research staff assisted in placingthe sensor.
Healthy controls were asked to perform 18 repetitions of the follow-ing sequence of activities with some variability in the intensity of each ofthe activities over a 2- to 4-h period: three taps on the sensor, 10 coughs,10 laughs, 10 throat clearings, 30 s of walking, 10 cycles of breathing(inhale and exhale), more than 20 s of speaking, and three taps on the sen-sor. Of these repetitions, sedentary activities in five sets were performedwhile sitting, five sets during standing, and eight sets while lying down(two in supine, two in prone, two in left recumbent, and two in rightrecumbent) positions. In the case of patients, a reduced set of activities
10 of 12 | PNAShttps://doi.org/10.1073/pnas.2026610118
Ni et al.Automated, multiparametric monitoring of respiratory biomarkers and vital signs in clinical and home
settings for COVID-19 patients
Dow
nloa
ded
by g
uest
on
Feb
ruar
y 8,
202
2

ENG
INEE
RIN
G
were used at the beginning of each test, which included three taps onthe sensor, five coughs, five cycles of deep breathing, and three taps onthe sensor.
Sterilization Process. After each use, the MA sensor was thoroughly disin-fected/cleaned with isopropyl alcohol (70% or above) or Oxivir TB wipes(0.5% hydrogen peroxide) and left to dry at room temperature, and thesame process was repeated twice.
Convolutional Neural Network. The CNN starts with a convolution with a ker-nel size of 3× 3 and three different kernels, followed by a standard 50-layerResNet as described in detail in ref. 55. At the output of the ResNet, a flat-tening layer of 86,106 neurons follows. Finally, three fully interconnectedlayers with 512, 128, and 5 neurons, respectively, and two dropout layerswith P = 0.5 follow alternately. The CNN uses an Adam optimizer for train-ing. The training process follows a leave-one-out strategy, where one leavesa subject out of the training set (19 remaining subjects for training) andthen tests the trained model on this subject. Each training set applies afivefold cross-validation procedure. This approach iterates through each ofthe 20 subjects. SI Appendix, Table S2 includes detailed information on thecross-validation results for each subject.
Data Analytics. All analysis used Python 3.0 with SciPy, PyWavelets, andTensorFlow packages.
Code Availability. The codes used for audio soundtrack conver-sion and manual labeling processes are available on GitHub athttps://github.com/nixiaoyue/MA-cough. The analysis codes used in thisstudy are available from the authors upon request.
Droplet Dynamics via PTV. Droplet dynamics of coughing, speaking, andlaughing were quantified by PTV. Coughing, speaking (the word “ter-minator” was used), and laughing were repeated 14, 26, and 15 times,respectively, at various decibel levels. More data samples for speaking werecollected to cover a wider range of decibels up to 100 dB. Each respira-tory activity was performed in the customized box made of acrylic glasswith an inner dimension of 45× 30× 30 cm3 (L×W×H). The investigationarea for tracking droplets was ∼ 34×∼ 17 cm2 illuminated by 16 arrays for
600 lumen LED light bars. PTV experiments were recorded by a 2,048 ×1,088 Emergent HT-2000M with 50-mm F1.4 manual focus Kowa lens atthe frame rate of 338 frames per second. To achieve continuous andsimultaneous measurements with MA sensor and audio meter (DecibelX, calibrated by SD-4023 sound level meter and R8090 Sound Level Cali-brator), approximately 10,000 frames were recorded for each respiratoryactivity. Preprocessing, calibration, tracking, and postprocessing are per-formed by a previously developed PTV code (59). Image sequences werepreprocessed by subtracting the background noise and enhancing thecontract. Droplets are detected at the subpixel level with the area esti-mation. The scattering cross-section of a detected droplet and refractiveindex of droplet as well as the surrounding medium, air, and wavelengthof the light source were used to calculate the actual radius of detecteddroplets based on the Mie scattering theory (60, 61). The minimum radiusof droplets measured in this work is ∼ 60 µm. Detected droplets weretracked using the Hungarian algorithm and linked by performing a five-frame gap closing to produce longer trajectories. Velocity and Lagrangianacceleration were filtered and computed using fourth-order B splines. Vec-tor contour fields were obtained by interpolating scattered Lagrangianflow particles at each frame based on the natural neighbor interpolationmethod.
Data Availability. All relevant data are included in the article and SIAppendix. Additional supporting data are available from the correspond-ing authors on request. All request for raw and analyzed data and materialswill be reviewed by the corresponding authors to verify whether the requestis subject to any intellectual property or confidentiality obligations. Patientrelated data not included in the paper were generated as part of clinicaltrials and may be subject to patient confidentiality.
ACKNOWLEDGMENTS. J.A.R. acknowledges support from the NSF Grantsfor Rapid Response Research (RAPID) program for development of the dataanalysis algorithms reported here. S.X. and J.A.R. recognize support fromContract 75A50119C00043 awarded by the Biomedical Advanced Researchand Development Authority, Contract R41AG062023 by the NIH, ContractR43AG060812 by the NIH, Contract R41AG062023-02S1 by the NIH, andGrant 17777 from the Michael J. Fox Foundation. The work was also sup-ported by the Querrey-Simpson Institute for Bioelectronics at NorthwesternUniversity.
1. Centers for Disease Control and Prevention, Coronavirus disease 2019 (COVID-19).Cases in the U.S. New cases by day. https://covid.cdc.gov/covid-data-tracker/. Accessed26 December 2020.
2. C. P. West, V. M. Montori, P. Sampathkumar, COVID-19 testing: The threat of false-negative results. Mayo Clinic Proc. 95, 1127–1129 (2020).
3. S. D. Pettit et al., ‘All in’: A pragmatic framework for COVID-19 testing and action ona global scale. EMBO Mol. Med. 12, e12634 (2020).
4. C. Menni et al., Real-time tracking of self-reported symptoms to predict potentialCOVID-19. Nat. Med. 26, 1037–1040 (2020).
5. A. Natarajan, H. W. Su, C. Heneghan, Assessment of physiological signs associ-ated with COVID-19 measured using wearable devices. NPJ Digit. Med. 3, 156(2020).
6. D. Miller et al., Analyzing changes in respiratory rate to predict the risk of COVID-19 infection. medRxiv [Preprint] (2020). https://doi.org/10.1101/2020.06.18.20131417(Accessed 26 December 2020).
7. US Department of Health and Human Services, BARDA and VitalConnect partner tomonitor nursing home and COVID-19 patients for early indication of patient dete-rioration. https://www.medicalcountermeasures.gov/newsroom/2020/vitalconnect/.Accessed 26 December 2020.
8. Philips, Philips launches next generation wearable biosensor for early patient dete-rioration detection, including clinical surveillance for COVID-19. https://www.philips.com/a-w/about/news/archive/standard/news/press/2020/20200526-philips-launches-next-generation-wearable-biosensor-for-early-patient-deterioration-detection-including-clinical-surveillance-for-covid-19.html. Accessed 26 December 2020.
9. US Department of Health and Human Services, BARDA and Sonica Health expandpartnership to develop wearable patch as an early monitoring platform for COVID-19 infection. https://www.medicalcountermeasures.gov/newsroom/2020/sonica/. Ac-cessed 26 December 2020.
10. US Department of Health and Human Services, BARDA and Empatica forge newpartnership to develop an early monitoring platform to identify COVID-19 infec-tion. https://www.medicalcountermeasures.gov/newsroom/2020/empatica/. Accessed26 December 2020.
11. T. Mishra et al., Early detection of COVID-19 using a smartwatch. medRxiv [Preprint](2020). https://doi.org/10.1101/2020.07.06.20147512 (Accessed 26 December 2020).
12. T. Greenhalgh, G. C. H. Koh, J. Car, COVID-19: A remote assessment in primary care.BMJ 368, m1182 (2020).
13. S. Hassantabar et al., CovidDeep: SARS-CoV-2/COVID-19 test based on wear-able medical sensors and efficient neural networks. arXiv [Preprint] (2020).https://arxiv.org/abs/2007.10497 (Accessed 26 December 2020).
14. N. M. Hemphill, M. T. Y. Kuan, K. C. Harris, Reduced physical activity during COVID-19pandemic in children with congenital heart disease. Can. J. Cardiol. 36, 1130–1134(2020).
15. K. Meng et al., A wireless textile-based sensor system for self-powered personalizedhealth care. Matter 2, 896–907 (2020).
16. H. Liu et al., Comparison of different modulations of photoplethysmography inextracting respiratory rate: From a physiological perspective. Physiol. Meas. 41, 41(2020).
17. W. Karlen, S. Raman, J. M. Ansermino, G. A. Dumont, Multiparameter respiratory rateestimation from the photoplethysmogram. IEEE Trans. Biomed. Eng. 60, 1946–1953(2013).
18. Hyoyoung. Jeong, John. A. Rogers, Shuai. Xu, Continuous on-body sensingfor the COVID-19 pandemic: Gaps and opportunities. Sci. Adv. 6, eabd4794(2020).
19. R. Gravina, P. Alinia, H. Ghasemzadeh, G. Fortino, Multi-sensor fusion in body sen-sor networks: State-of-the-art and research challenges. Inf. Fusion 35, 1339–1351(2017).
20. R. G. Loudon, L. C. Brown, Cough frequency in patients with respiratory disease. Am.Rev. Respir. Dis. 96, 1137–1143 (1967).
21. L. Pavesi, S. Subburaj, K. Porter-Shaw, Application and validation of a computerizedcough acquisition system for objective monitoring of acute cough: A meta-analysis.Chest 120, 1121–1128 (2001).
22. M. M. Cloutier, G. M. Loughlin, Chronic cough in children: A manifestation of airwayhyperreactivity. Pediatrics 67, 6–12 (1981).
23. C. Bales et al., “Can machine learning be used to recognize and diagnose coughs?” inInternational Conference on e-Health and Bioengineering (EHB, Iasi, Romania, 2020),pp. 1–4. 2020.
24. M. A. Ismail, S. Deshmukh, R. Singh. Detection of COVID-19 through the analy-sis of vocal fold oscillations. arXiv [Preprint] (2020). https://arxiv.org/abs/2010.10707(Accessed 5 March 2021).
25. S. Deshmukh, M. A. Ismail, R. Singh, Interpreting glottal flow dynamics for detect-ing COVID-19 from voice. arXiv [Preprint] (2020). https://arxiv.org/abs/2010.16318(Accessed 5 March 2021).
26. B. W. Schuller, H. Coppock, A. Gaskell, Detecting COVID-19 from breathingand coughing sounds using deep neural networks. arXiv [Preprint] (2020).https://arxiv.org/abs/2012.14553 (Accessed 5 March 2021).
27. Y. Huang et al., The respiratory sound features of COVID-19 patients fillgaps between clinical data and screening methods. medRxiv [Preprint] (2020).https://doi.org/10.1101/2020.04.07.20051060 (Accessed 5 March 2021).
Ni et al.Automated, multiparametric monitoring of respiratory biomarkers and vital signs in clinical and homesettings for COVID-19 patients
PNAS | 11 of 12https://doi.org/10.1073/pnas.2026610118
Dow
nloa
ded
by g
uest
on
Feb
ruar
y 8,
202
2
28. P. Bagad et al., Cough against COVID: Evidence of COVID-19 signature in coughsounds. arXiv [Preprint] (2020). https://arxiv.org/abs/2009.08790 (Accessed 5 March2021).
29. A. Pal, M. Sankarasubbu, Pay attention to the cough: Early diagnosis of COVID-19using interpretable symptoms embeddings with cough sound signal processing. arXiv[Preprint] (2020). https://arxiv.org/abs/2010.02417 (Accessed 5 March 2021).
30. S. Agrawal et al., BuildForCOVID19. https://buildforcovid19.io/detect-now/. Accessed26 December 2020.
31. C. Mascolo et al., COVID-19 sounds app (2020). https://www.covid-19-sounds.org/en/.Accessed 26 December 2020.
32. G. Zayas et al., Cough aerosol in healthy participants: Fundamental knowledge tooptimize droplet-spread infectious respiratory disease management. BMC Pulm. Med.12, 11 (2012).
33. R. Mittal, R. Ni, J. H. Seo, The flow physics of COVID-19. J. Fluid Mech. 894, F2(2020).
34. T. Dbouk, D. Drikakis, On coughing and airborne droplet transmission to humans.Phys. Fluids 32, 053310 (2020).
35. F. K. A. Gregson et al., Comparing the respirable aerosol concentrations and particlesize distributions generated by singing , speaking and breathing. ChemRxiv [Preprint](2020). 10.26434/chemrxiv.12789221.v1 (Accessed 26 December 2020).
36. G. A. Fontana, T. Pantaleo, F. Lavorini, V. Boddi, P. Panuccio, A noninvasive elec-tromyographic study on threshold and intensity of cough in humans. Eur. Respir. J.10, 983–989 (1997).
37. T. Drugman et al., “Audio and contact microphones for cough detection” in 13thAnnual Conference of the International Speech Communication Association 2012,INTERSPEECH 2012 (International Speech Communication Association, 2012), vol. 2,pp. 1302–1305.
38. T. Drugman et al., Objective study of sensor relevance for automatic cough detection.IEEE J. Biomed. Health Inform. 17, 699–707 (2013).
39. A. Jasmine, A. K. Jayanthy, Sensor-based system for automatic cough detection andclassification. Test Eng. Manag. 83, 13826–13834 (2020).
40. A. Bush, Diagnostic and therapeutic methods—A new device for ambulatory coughrecording. Heart Lung 186, 178–186 (1994).
41. T. Elfaramawy, C. L. Fall, M. Morissette, F. Lellouche, B. Gosselin, “Wireless respira-tory monitoring and coughing detection using a wearable patch sensor network”in Proceedings - 2017 IEEE 15th International New Circuits and Systems Conference,NEWCAS 2017 (Institute of Electrical and Electronics Engineers, 2017), pp. 197–200.
42. J. Amoh, K. Odame, Deep neural networks for identifying cough sounds. IEEE TransBiomed. Circ. Syst. 10, 1003–1011 (2016).
43. R. X. A. Pramono, S. A. Imtiaz, E. Rodriguez-Villegas, “Automatic cough detection inacoustic signal using spectral features” in Proceedings of the Annual InternationalConference of the IEEE Engineering in Medicine and Biology Society (Engineering inMedicine and Biology Society, 2019), pp. 7153–7156.
44. K. Kosasih, U. R. Abeyratne, V. Swarnkar, R. Triasih, Wavelet augmented cough analy-sis for rapid childhood pneumonia diagnosis. IEEE Trans. Biomed. Eng. 62, 1185–1194(2015).
45. L Di Perna et al., “An automated and unobtrusive system for cough detection” in2017 IEEE Life Sciences Conference, LSC 2017 (Institute of Electrical and ElectronicsEngineers, 2018), pp. 190–193.
46. I. D. S. Miranda, A. H. Diacon, T. R. Niesler, “A comparative study of features foracoustic cough detection using deep architectures” in Proceedings of the AnnualInternational Conference of the IEEE Engineering in Medicine and Biology Society(Engineering in Medicine and Biology Society, 2019), pp. 2601–2605.
47. H. H. Wang, J. M. Liu, M. You, G. Z. Li, “Audio signals encoding for cough classificationusing convolutional neural networks: A comparative study” in Proceedings - 2015 IEEEInternational Conference on Bioinformatics and Biomedicine, BIBM 2015 (Institute ofElectrical and Electronics Engineers, 2015), pp. 442–445.
48. Y. A. Amrulloh, U. R. Abeyratne, V. Swarnkar, R. Triasih, A. Setyati, Automatic coughsegmentation from non-contact sound recordings in pediatric wards. Biomed. SignalProcess Contr. 21, 126–136 (2015).
49. J. Monge-Alvarez, C. Hoyos-Barcelo, P. Lesso, P. Casaseca-De-La-Higuera, Robustdetection of audio-cough events using local Hu moments. IEEE J. Biomed. HealthInform. 23, 184–196 (2019).
50. C. Hoyos-Barcelo, J. Monge-Alvarez, M. Z. Shakir, J. M. Alcaraz-Calero,P. Casaseca-De-La-Higuera, Efficient k-NN implementation for real-time detec-tion of cough events in smartphones. IEEE J. Biomed. Health Inform. 22, 1662–1671(2018).
51. A. Teyhouee, N. D. Osgood, “Cough detection using hidden markov models” inInternational Conference on Social Computing, Behavioral-Cultural Modeling andPrediction and Behavior Representation in Modeling and Simulation (Springer, 2019),pp. 266–276.
52. E. C. Larson, T. J. Lee, S. Liu, M. Rosenfeld, S. N. Patel, “Accurate and privacy pre-serving cough sensing using a low-cost microphone” in UbiComp’11 - Proceedingsof the 2011 ACM Conference on Ubiquitous Computing (Association for ComputingMachinery, 2011), pp. 375–384.
53. Z. Zhou et al., Sign-to-speech translation using machine-learning-assisted stretchablesensor arrays. Nat. Electron. 3, 571–578 (2020).
54. K. H. Lee et al., Mechano-acoustic sensing of physiological processes and bodymotions via a soft wireless device placed at the suprasternal notch. Nat. Biomed. Eng.4, 148–158 (2020).
55. K. He, X. Zhang, S. Ren, J. Sun, “Deep residual learning for image recognition”in Proceedings of the IEEE Computer Society Conference on Computer Visionand Pattern Recognition (Institute of Electrical and Electronics Engineers, 2016),pp. 770–778.
56. M. Abkarian, S. Mendez, N. Xue, F. Yang, H. A. Stone, Speech can produce jet-liketransport relevant to asymptomatic spreading of virus. Proc. Natl. Acad. Sci. U.S.A.117, 25237–25245 (2020).
57. D. Lahat, T. Adali, C. Jutten, Multimodal data fusion: An overview of methods,challenges, and prospects. Proc. IEEE 103, 1449–1477 (2015).
58. P. Kumari, L. Mathew, P. Syal, Increasing trend of wearables and multimodal inter-face for human activity monitoring: A review. Biosens. Bioelectron. 90, 298–307(2017).
59. J. T. Kim, J. Nam, S. Shen, C. Lee, L. P. Chamorro, On the dynamics of air bubbles inRayleigh–Benard convection. J. Fluid Mech. 891, A7 (2020).
60. C. F. Bohren, Absorption and Scattering of Light by Small Particles (John Wiley, 1983).61. J. Schafer, S.-C. Lee, A. Kienle, Calculation of the near fields for the scattering of
electromagnetic waves by multiple infinite cylinders at perpendicular incidence. J.Quant. Spectrosc. Radiat. Transf. 11, 2113–2123 (2012).
12 of 12 | PNAShttps://doi.org/10.1073/pnas.2026610118
Ni et al.Automated, multiparametric monitoring of respiratory biomarkers and vital signs in clinical and home
settings for COVID-19 patients
Dow
nloa
ded
by g
uest
on
Feb
ruar
y 8,
202
2
Related Documents