Automated Model-Based Spreadsheet Debugging Dissertation zur Erlangung des Grades eines Doktors der Naturwissenschaften der Technischen Universität Dortmund an der Fakultät für Informatik von Thomas Schmitz Dortmund 2017

Welcome message from author
This document is posted to help you gain knowledge. Please leave a comment to let me know what you think about it! Share it to your friends and learn new things together.
Transcript

Automated Model-Based Spreadsheet Debugging
Dissertation
zur Erlangung des Grades eines
D o k t o r s d e r N a t u r w i s s e n s c h a f t e n
der Technischen Universität Dortmundan der Fakultät für Informatik
von
Thomas Schmitz
Dortmund
2017

Tag der mündlichen Prüfung: 24.08.2017
Dekan: Prof. Dr.-Ing. Gernot A. Fink
Gutachter:
Prof. Dr. Dietmar Jannach
Prof. Dr. Franz Wotawa

Abstract
Spreadsheets are interactive data organization and calculation programs that aredeveloped in spreadsheet environments like Microsoft Excel or LibreOffice Calc.They are probably the most successful example of end-user developed softwareand are utilized in almost all branches and at all levels of companies. Althoughspreadsheets often support important decision making processes, they are, like allsoftware, prone to error. In several cases, faults in spreadsheets have caused severelosses of money.
Spreadsheet developers are usually not educated in the practices of software devel-opment. As they are thus not familiar with quality control methods like systematictesting or debugging, they have to be supported by the spreadsheet environmentitself to search for faults in their calculations in order to ensure the correctness anda better overall quality of the developed spreadsheets.
This thesis by publication introduces several approaches to locate faults in spread-sheets. The presented approaches are based on the principles of Model-BasedDiagnosis (MBD), which is a technique to find the possible reasons why a systemdoes not behave as expected. Several new algorithmic enhancements of the generalMBD approach are combined in this thesis to allow spreadsheet users to debug theirspreadsheets and to efficiently find the reason of the observed unexpected outputvalues. In order to assure a seamless integration into the environment that is well-known to the spreadsheet developers, the presented approaches are implemented asan extension for Microsoft Excel.
The first part of the thesis outlines the different algorithmic approaches that areintroduced in this thesis and summarizes the improvements that were achieved overthe general MBD approach. In the second part, the appendix, a selection of theauthor’s publications are presented. These publications comprise (a) a survey ofthe research in the area of spreadsheet quality assurance, (b) a work describing
iii

how to adapt the general MBD approach to spreadsheets, (c) two new algorithmicimprovements of the general technique to speed up the calculation of the possiblereasons of an observed fault, (d) a new concept and algorithm to efficiently determinequestions that a user can be asked during debugging in order to reduce the numberof possible reasons for the observed unexpected output values, and (e) a new methodto find faults in a set of spreadsheets and a new corpus of real-world spreadsheetscontaining faults that can be used to evaluate the proposed debugging approaches.
iv

Contents
1 Introduction 1
1.1 Faults in Spreadsheets . . . . . . . . . . . . . . . . . . . . . . . . . . 1
1.2 Spreadsheet Quality Assurance . . . . . . . . . . . . . . . . . . . . . 3
1.3 Overview of this Thesis . . . . . . . . . . . . . . . . . . . . . . . . . . 5
1.4 Publications . . . . . . . . . . . . . . . . . . . . . . . . . . . . . . . . 7
1.4.1 Avoiding, Finding and Fixing Spreadsheet Errors – A Surveyof Automated Approaches for Spreadsheet QA . . . . . . . . . 7
1.4.2 Model-Based Diagnosis of Spreadsheet Programs . . . . . . . 7
1.4.3 MERGEXPLAIN: Fast Computation of Multiple Conflicts forDiagnosis . . . . . . . . . . . . . . . . . . . . . . . . . . . . . 8
1.4.4 Parallel Model-Based Diagnosis on Multi-Core Computers . . 8
1.4.5 Efficient Sequential Model-Based Fault-Localization with Par-tial Diagnoses . . . . . . . . . . . . . . . . . . . . . . . . . . . 8
1.4.6 Finding Errors in the Enron Spreadsheet Corpus . . . . . . . . 9
2 Model-Based Diagnosis for Spreadsheets 11
2.1 Introductory Example . . . . . . . . . . . . . . . . . . . . . . . . . . 12
2.2 Computation of the Diagnoses . . . . . . . . . . . . . . . . . . . . . . 13
2.3 An Interactive Tool for Model-Based Spreadsheet Debugging . . . . . 14
3 New Algorithmic Approaches for Faster Calculation of Diagnoses 17
3.1 Faster Conflict Detection . . . . . . . . . . . . . . . . . . . . . . . . . 17
3.2 Parallelizing the Calculation of Diagnoses . . . . . . . . . . . . . . . 20
4 Sequential Diagnosis 23
4.1 The General Sequential Diagnosis Approach . . . . . . . . . . . . . . 23
4.2 Speeding Up the Query Calculation . . . . . . . . . . . . . . . . . . . 24
5 Creating a Corpus of Faulty Spreadsheets 27
5.1 Types of Spreadsheets Used in Research . . . . . . . . . . . . . . . . 27
5.2 Publicly Available Spreadsheet Corpora . . . . . . . . . . . . . . . . . 28
5.3 Building a Real-World Spreadsheet Corpus with Fault Information . . 30
5.3.1 Fault Detection Methods . . . . . . . . . . . . . . . . . . . . . 30
5.3.2 The Enron Error Corpus . . . . . . . . . . . . . . . . . . . . . 32
v

6 Conclusion 33
Bibliography 35
List of Figures 39
List of Tables 41
Publications 43Avoiding, Finding and Fixing Spreadsheet Errors - A Survey of Automated
Approaches for Spreadsheet QA . . . . . . . . . . . . . . . . . . . . . 47Model-Based Diagnosis of Spreadsheet Programs . . . . . . . . . . . . . . 117MERGEXPLAIN: Fast Computation of Multiple Conflicts for Diagnosis . . . 119Parallel Model-Based Diagnosis on Multi-Core Computers . . . . . . . . . 121Efficient Sequential Model-Based Fault-Localization with Partial Diagnoses 175Finding Errors in the Enron Spreadsheet Corpus . . . . . . . . . . . . . . . 177
vi

1Introduction
Spreadsheets are interactive data organization and calculation programs that aredeveloped in spreadsheet environments like Microsoft Excel or LibreOffice Calc. Theyare widely used in business as well as for private calculation tasks and are thereforethe most wide-spread type of end-user developed software [Sca+05]. The successof spreadsheets has several reasons. First, as spreadsheets are designed in a visualenvironment, they are easy to develop also for users without a background in soft-ware development and they are more flexible than traditional software [Hun+05].Yet, they are powerful enough for many daily calculation tasks like budget planningor tax computations. In addition, spreadsheets can be useful even at the beginningof their development as they can start as a simple data storage and then evolve to acomplex calculation tool. For example, a list of expenses can evolve to a completebudget calculation. Therefore, spreadsheets can cover a wider range of tasks overtime as their development progresses.
Especially in the industry, spreadsheets are a common tool for calculations in dailybusiness as well as in preparation for business decisions [Pan+12]. In most com-panies a wide range of spreadsheets is created and maintained. For example, inthe Enron Corporation, formerly one of the biggest energy companies in the US,16,189 unique spreadsheets were sent by email during a time frame of two years[Her+15].
1.1 Faults in Spreadsheets
Although the creation of spreadsheets is often not perceived as software development,a spreadsheet that contains formulas in fact is a software that calculates the valuesof the output cells given the input values. These spreadsheets, as all other software,are prone to error [Pan98].
When speaking about errors, several definitions for the words “fault”, “error”, and“failure” exist in the research literature [Jan+14a]. According to the IEEE StandardClassification for Software Anomalies [IEE10] an “error” is a misapprehension on
1

side of the one developing a software caused by a mistake or misconception occurringin the human thought process. A “fault” is the manifestation of an “error” withina software which may be causing a “failure”. A “failure” is the deviation of theobserved behavior of the software from the expectations. However, in the researchliterature the terms “fault” and “error” are often used interchangeably. In order tocomply with the IEEE standard, in this thesis the terms “fault” and “error” are usedaccording to the given definitions.
Faults in spreadsheets have already caused severe financial losses in the past. Theconsulting company F1F9 lists twelve famous cases of faulty spreadsheets, many ofwhich had severe impacts [F1F]. One well-known example is the economic studyof Reinhart and Rogoff, which states a strong negative relation between the debt ofa country and its economic growth [Rei+10]. Politicians used this study to argueagainst new debts and changed their strategies accordingly. Later, Herndon et al.showed that faults in a spreadsheet led to miscalculations in the study and that thediscovered relation was much weaker than originally stated [Her+13]. As anotherexample, in 2014 the Wall Street Journal informed about a fault in a spreadsheetthat caused an overestimation of the equity value of the software company Tibco by$100 million [Tan14].
When analyzing a spreadsheet for such important faults, different approaches arerequired to locate the various types of faults that can be made when designinga spreadsheet. In the literature, several taxonomies were proposed to classifyspreadsheet errors [Pan98; Pur+06; Pow+08; Pan+10]. In this thesis, a combinedtaxonomy is used to structure the possible errors in a systematic way. The errortaxonomy is shown in Figure 1.1 and can be summarized as follows.
Errors
Application-Identified Errors User-Identified Errors
Qualitative Errors Quantitative Errors
Structural Errors Temporal Errors Mechanical Errors Logic Errors Omission Errors
Syntax Errors Formula Errors
Figure 1.1: Taxonomy of spreadsheet errors, adapted from [Abe15].
Errors in a spreadsheet can be classified into two main categories. Application-Identified Errors can be automatically detected with certainty by the spreadsheetenvironment. Microsoft Excel, for example, automatically detects Syntax Errors anda user is not able to put a syntactically faulty formula in a cell as the spreadsheet
2 Chapter 1 Introduction

environment will inform the user that the written formula is faulty. Formula Errorsare detected by Excel and similar environments when they evaluate the value of aformula, for example, when dividing by zero.
In contrast to Application-Identified Errors, User-Identified Errors cannot be detectedby the spreadsheet environment but have to be detected by the user or otherwiseremain unknown. These errors can be split into two more sub-categories. QualitativeErrors do not result in a wrong calculation outcome in the current version of thespreadsheet but could result in a faulty value when the spreadsheet is changed later.They comprise Structural Errors and Temporal Errors. Structural Errors describeerrors in the design of a spreadsheet, for example, hard-coded values in a formulathat should be inputs. Temporal Errors summarize those values or formulas that areonly correct for a specific time period and can be wrong at a later date, for example,a value that is only correct for a specific day of the year but is not labeled as such.
The group of errors which immediately result in faulty values in the current versionof the spreadsheet is called Quantitative Errors. These errors can be split intoMechanical Errors, which describe errors by a user in the process of typing a formula,Logic Errors, that occur when a wrong function or algorithm is used, and OmissionErrors, that occur if the user does not incorporate some aspect of the task he orshe tries to solve. The main focus of this thesis lies on these Quantitative Errors, asthese errors have a direct impact on the result of the spreadsheet and are thereforeprobably the most important ones to fix.
1.2 Spreadsheet Quality Assurance
To find possible faults when developing spreadsheets and to use the spreadsheets forimportant tasks without any risks, the quality of the spreadsheets has to be assured.This is potentially even more important for spreadsheets than for traditional software,as spreadsheet users who do not have a software development background might notbe aware of the high risks. However, approaches for spreadsheet quality assurance(QA) have to be well integrated into the spreadsheet environment and easy touse even for users without any knowledge in software development. Since oneimportant factor of the success of spreadsheets is their high flexibility compared toother software, this advantage should not be removed by the QA approaches.
Over the years, several techniques for spreadsheet quality assurance have beenproposed in the research literature. In [Jan+14a], which is included in this thesis, asurvey is presented that classifies the existing approaches for spreadsheet QA in twodimensions. The first dimension is used to distinguish between approaches that are
1.2 Spreadsheet Quality Assurance 3

made for locating faults in a spreadsheet and approaches that should help to avoidmaking errors in the first place. The second dimension was made to differentiatebetween the approaches based on how they fulfill their tasks. Table 1.1 shows forwhich tasks the different types of techniques can be used.
Table 1.1: Overview of main categories of automated spreadsheet QA [Jan+14a].
Finding faults Avoiding errors
Visualization-based approaches X X
Static code analysis & reports X X
Testing-based techniques X
Automated fault localization & repair X
Model-driven development approaches X
Design and maintenance support X
The different groups of techniques can be summarized as follows [Jan+14a].
Visualization-based approaches: Approaches of this group help the user by pro-viding visualizations of the spreadsheet. Most of the proposed representations areutilized to explain the dependencies between the cells, groups of cells, or even thedifferent worksheets of a spreadsheet. Such visualizations can help the user in thetasks of both categories finding faults as well as avoiding errors, because the usercan detect anomalies in the existing dependencies or use them to improve the designof the spreadsheet to avoid making errors in the future.
Static code analysis & reports: Methods of this category perform static analyses ofthe formulas and data of a spreadsheet. They can be used to find irregularities and topoint out problematic areas that are prone to be faulty or that can often lead to faultsin subsequent versions of the spreadsheet. Therefore, these approaches can also beused to find faults or to avoid errors. They include techniques like “code smells”,detecting duplicates of data, or other approaches typically found in commercial toolsthat detect suspicious cells.
Testing-based techniques: Techniques in this category are based on the generalapproach of systematic testing. The approaches support the user in creating andorganizing test cases that specify the input values of the spreadsheet and the expectedoutput values of some formulas given the input values. As these techniques do notchange the way a spreadsheet itself is built, they only support the user to find faultsbut not to avoid making errors. However, they can also be used to find faults duringthe construction of the spreadsheet and thus help to improve the quality of thebuilt spreadsheet. The methods of this category include techniques like test casemanagement, automated test case generation, or the analysis of the test coverage.
4 Chapter 1 Introduction
Automated fault localization & repair: The approaches presented in this thesismostly fall into the category of automated fault localization & repair, which containsthe techniques that computationally determine the possible reasons of a fault or anunexpected calculation outcome. To perform these calculations they typically requireadditional information provided by the user about unexpected output values. Inaddition to calculating the possibly faulty formulas, some approaches in this categoryprovide suggestions of how these formulas could be “repaired”.
Model-driven development approaches: In contrast to the previous categories,model-driven development approaches do not aim to find faults in an existingspreadsheet but propose a method to systematically develop a spreadsheet. Thisway these approaches try to support the user in developing spreadsheets that do notcontain any faults. The main idea of these approaches is to use (object-oriented) con-ceptual models or model-driven software development techniques. These conceptshave the advantage of adding an additional layer of abstraction and thus eliminatesome types of possible faults like copy-and-paste errors or mechanical errors.
Design and maintenance support: Methods of this category help the spreadsheetdeveloper when designing or maintaining a spreadsheet by automating commontasks or providing new methods to design spreadsheets in order to avoid com-mon faults like range or reference errors. These techniques include, for example,refactoring tools, methods to avoid wrong cell references, and exception handling.
1.3 Overview of this Thesis
This thesis by publication combines several approaches to automatically locate faultsin a spreadsheet. Most of these approaches are based upon and extend the approachof using Model-Based Diagnosis (MBD) for spreadsheets.
MBD is a systematic approach to find the possible reasons why a system underobservation does not behave as expected. As it is shown in the structural overview ofthis thesis in Figure 1.2, Chapter 2 introduces the general idea of MBD in more detailand describes how it can be adapted to efficiently search for possibly faulty formulasin spreadsheets based on test cases that specify input values and correspondingexpected output values for a spreadsheet [Jan+16a]. The general MBD approach,however, has two limitations depending on the structure and size of the analyzedspreadsheet. In the other chapters of this thesis by publication these limitationsof the general MBD approach are addressed and improvements are introduced tomitigate them.
1.3 Overview of this Thesis 5

Model-Based Diagnosis (Chapter 2)
Introductory Example
Computation of Diagnoses
EXQUISITE Debugging Tool
New Algorithmic Approaches (Chapter 3)
Faster Conflict Detection
Parallelizing the Calculations
Sequential Diagnosis (Chapter 4)
General Sequential Diagnosis Approach
Speeding Up the Query Calculations
A Corpus of Faulty Spreadsheets (Chapter 5)
Types of Spreadsheets
Publicly Available Spreadsheet Corpora
The Enron Error Corpus
Figure 1.2: Structural overview of this thesis.
One limitation of the general approach is that for large or complex spreadsheets, thetime required to calculate the possible reasons of a fault can exceed the time that isacceptable in an interactive setting. Therefore, two new algorithmic enhancementsare proposed to speed up the computation (Chapter 3). First, in Section 3.1 a newapproach is presented to efficiently search for so-called conflicts, which are sets offormulas in a spreadsheet that cannot all be correct at the same time [Shc+15b].Second, the general MBD algorithm is parallelized to utilize the full computationalcapabilities of modern computer hardware (Section 3.2) [Jan+16b].
The other limitation of the general MBD approach is addressed in Chapter 4. De-pending on the provided test cases too many possible reasons for a fault can bereturned by the diagnosis algorithm so that a user cannot inspect all of them inreasonable time. Therefore, in [Shc+16b] a new algorithm is presented to efficientlydetermine questions that can be asked to the user interactively in order to reducethe number of possible reasons and to finally find the true reason of the observedunexpected output.
6 Chapter 1 Introduction

One open challenge that all research about spreadsheet QA faces is how to evaluatenew approaches in a way that allows to draw conclusions about the effectivenessof the approach in real-world settings. Currently most approaches for spreadsheetdebugging are evaluated on real-world spreadsheets which are altered by the re-searchers so that they contain faults. However, whether or not these artificiallyinjected faults are representative for faults encountered in the real world remainsunknown. Therefore, in Chapter 5 a work is presented in which the publicly availablespreadsheets and emails of the Enron company are used to search for real faults andto build a corpus of these real-life faulty spreadsheets [Sch+16a].
1.4 Publications
This thesis by publication includes six of the author’s publications. In this section, theindividual contributions of the author are stated for each publication. The completelist of the author’s publications can be found in the appendix.
1.4.1 Avoiding, Finding and Fixing Spreadsheet Errors – A Surveyof Automated Approaches for Spreadsheet QA
Dietmar Jannach, Thomas Schmitz, Birgit Hofer, and Franz Wotawa. “Avoiding,Finding and Fixing Spreadsheet Errors - A Survey of Automated Approaches forSpreadsheet QA”. in: Journal of Systems and Software 94 (2014), pp. 129–150
This survey was a joint effort with Dietmar Jannach, Birgit Hofer, and Franz Wotawa.The author of this thesis searched for most of the relevant works, categorized all ofthem, and wrote parts of the text.
1.4.2 Model-Based Diagnosis of Spreadsheet Programs
Dietmar Jannach and Thomas Schmitz. “Model-Based Diagnosis of SpreadsheetPrograms: A Constraint-based Debugging Approach”. In: Automated SoftwareEngineering 23.1 (2016), pp. 105–144
This work was written together with Dietmar Jannach. The approach presented inthis paper is based on a preliminary work by Dietmar Jannach, Arash Baharloo, andDavid Williamson [Jan+13]. The author of this thesis designed the parallelizationtechniques in collaboration with Dietmar Jannach, did the implementations that wererequired in addition to the previous work, designed and performed the evaluationsas well as the user study, and wrote the corresponding parts of the text.
1.4 Publications 7

1.4.3 MergeXplain: Fast Computation of Multiple Conflicts forDiagnosis
Kostyantyn Shchekotykhin, Dietmar Jannach, and Thomas Schmitz. “MergeXplain:Fast Computation of Multiple Conflicts for Diagnosis”. In: Proceedings of theInternational Joint Conference on Artificial Intelligence (IJCAI 2015). 2015, pp. 3221–3228
The research of this work was a joint effort with Kostyantyn Shchekotykhin andDietmar Jannach. The proposed MERGEXPLAIN algorithm was designed in a collabo-ration between Kostyantyn Shchekotykhin and the author of this thesis, who alsoimplemented and evaluated it.
1.4.4 Parallel Model-Based Diagnosis on Multi-Core Computers
Dietmar Jannach, Thomas Schmitz, and Kostyantyn Shchekotykhin. “ParallelModel-Based Diagnosis On Multi-Core Computers”. In: Journal of Artificial Intelli-gence Research 55 (2016), pp. 835–887
The paper is the result of a joint work with Dietmar Jannach and KostyantynShchekotykhin. The author of this thesis designed the parallelization approachestogether with Dietmar Jannach, implemented and evaluated them, and wrote partsof the text.
1.4.5 Efficient Sequential Model-Based Fault-Localization withPartial Diagnoses
Kostyantyn Shchekotykhin, Thomas Schmitz, and Dietmar Jannach. “EfficientSequential Model-Based Fault-Localization with Partial Diagnoses”. In: Proceedingsof the International Joint Conference on Artificial Intelligence (IJCAI 2016). 2016,pp. 1251–1257
The work was a joint effort with Kostyantyn Shchekotykhin and Dietmar Jannach.Most parts of the text were written by the author of this thesis who also contributedto the design of the new approach, implemented, and evaluated it.
8 Chapter 1 Introduction

1.4.6 Finding Errors in the Enron Spreadsheet Corpus
Thomas Schmitz and Dietmar Jannach. “Finding Errors in the Enron SpreadsheetCorpus”. In: Proceedings of the IEEE Symposium on Visual Languages and Human-Centric Computing (VL/HCC 2016). 2016, pp. 157–161
This paper was written together with Dietmar Jannach. The author of this the-sis designed the different approaches to search for faults in the spreadsheets incollaboration with Dietmar Jannach and wrote the text of the paper.
1.4 Publications 9


2Model-Based Diagnosis forSpreadsheets
One of the possible ways presented in Section 1.2 to assure the quality of a spread-sheet is to do systematic testing. In order to systematically test a spreadsheet a userhas to write so-called test cases by specifying the input values of the spreadsheetand expected values for some of its formula cells. If these expected values differfrom what the spreadsheet environment actually computes given the input values,there has to be a fault somewhere in the formulas of the spreadsheet. In this casethe task of spreadsheet debugging is to locate the fault, for example, by utilizinga debugging approach like Model-Based Diagnosis (MBD), which can be used tofind the possible reasons of the unexpected calculation outcomes. How MBD can beapplied to spreadsheets is described formally in [Jan+16a] and summarized in thischapter.
The principles of the general MBD technique were proposed in the 1980s [Kle+87;Rei87]. In these early works, MBD was used to search for faults in digital circuits. Itcan, however, be used to debug any kind of observable system for which the func-tionality can be simulated in a deterministic way. The system requires informationabout the expected behavior of the individual components of the system and howthese components are connected. If there is a discrepancy between the simulatedexpected behavior of the system and an observation of its real behavior, the taskof the MBD approach is to determine the sets of components that could possiblybe the reason of this discrepancy. These candidates that, if assumed to behave in afaulty way, explain the faulty behavior of the system are called diagnoses. Formaldefinitions of diagnoses and other terms relevant in the MBD setting are given in[Jan+16a], which is included in this thesis by publication.
In the context of spreadsheets, the system is described as a set of formulas thatrepresent the diagnosable components of the system. The observations are given as atest case that specifies the input values of the spreadsheet and some expected outputvalues of the formulas. If there is a discrepancy between the specified test case andthe calculated outcomes of the formulas given the same inputs, MBD can be used tofind the sets of formulas that can be the reason for the observed discrepancy.
11

2.1 Introductory Example
In this thesis, a small example spreadsheet is used to explain how the MBD techniquecan help to determine the possibly faulty formulas in that spreadsheet. The formulasof the example spreadsheet are shown in Figure 2.1. Assume that the spreadsheetdeveloper forgot to add the value of A1 in the formula of cell C1.
2
1Should be
=B1*B2+A1
A B C
?
?
=A1*3
=A2*5
=B1*B2
Figure 2.1: A faulty spreadsheet.
If the user enters some values for the input cells in column A, as shown in Figure2.2, he or she could realize that the result in cell C1 is wrong, because it shouldbe 305 for the given input values. The values for the two input cells together withthe expected output value therefore form a test case that describes a discrepancybetween the expected and the observed behavior of the spreadsheet.
2
1Should be
305
A B C
5
4
15
20
300
Figure 2.2: A test case for the faulty spreadsheet.
Once the user has detected the discrepancy, he or she can use the MBD approach tolocate the possible reasons that can explain it. With the test case shown in Figure2.2, the MBD approach would return two diagnoses as the possible reasons for theobserved discrepancy: {C1} and {B1, B2}. This means that either the formula in cellC1 is faulty or that the two formulas in the cells B1 and B2 both have to be faulty.In this example, {C1} is the true diagnosis as the formula of cell C1 is in fact faulty.The diagnosis {B1, B2} is therefore not true. In general, it is more unlikely thatdiagnoses containing multiple cells are true, because it would require the developerto have made multiple errors instead of just one.
The rationale behind the diagnoses is the following. The formula in C1 can bechanged in a way that the result of the calculation would be 305, for example, bychanging the formula to “=B1*B2+A1”, “=B1*B2+5”, or “=305”. Therefore {C1}is a diagnosis. {B1}, however, cannot be a diagnosis because changing the formulain B1 alone cannot result in the expected value in C1, assuming that only integervalues are used as in the given test case. The same is true for cell B2. Both cells B1and B2 have to be changed in order to achieve the expected result of 305 in C1 andtherefore {B1, B2} is another diagnosis.
12 Chapter 2 Model-Based Diagnosis for Spreadsheets

2.2 Computation of the Diagnoses
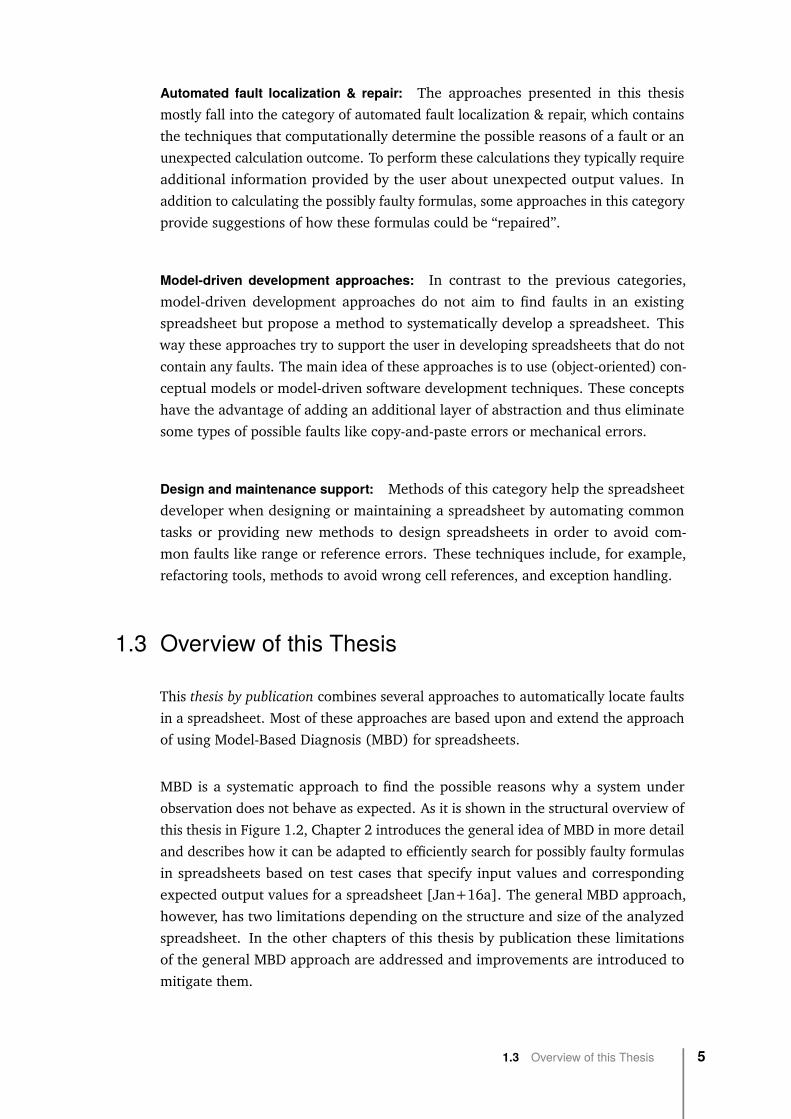
In [Rei87] Reiter proposes an algorithm to build a Hitting Set Tree (HS-Tree) in orderto determine the diagnoses of a faulty system under observation. The algorithmuses the concept of conflicts, which are sets of components of the system that cannotall be correct at the same time given the observations. In the example spreadsheetof Section 2.1 there are two of these conflicts, namely {{B1, C1}, {C1, B2}}. Thismeans that the formulas of B1 and C1 cannot be both correct as well as the formulasof C1 and B2. The reason is that if, for example, both B1 and C1 would be assumedto be correct, the calculation could not result in the expected value. The same is truefor the two formulas C1 and B2.
The idea of the HS-Tree algorithm is to systematically test different hypotheses aboutthe health state of the components. As the algorithm progresses, it tests hypothesesinvolving more and more components that are assumed to be faulty. In the beginningit therefore assumes that everything is working correctly. If this assumption doesnot hold because the expected behavior conflicts with the observed behavior, thealgorithm systematically tries to resolve all conflicts by assuming that at least onecomponent of each conflict is faulty. To achieve this, the algorithm builds a treein breadth-first manner to search for the hitting sets of the conflicts, i.e., sets that“hit” every conflict of the system. In his work Reiter showed that these hitting setscorrespond to the diagnoses. To find the hitting sets efficiently, the algorithm utilizesa set of tree pruning rules to cut subtrees that cannot lead to further diagnoses. Theresulting HS-Tree for the example spreadsheet is shown in Figure 2.3 and explainedin the following.
{B1, C1}
B1 C1
{C1, B2}
C1 B2
1
2 3
4 5
Figure 2.3: The resulting HS-Tree for the example spreadsheet.
At node 1 , the algorithm searches for a conflict when all components (formulas)are assumed to be correct. To determine the conflicts, some kind of conflict detectiontechnique is required that can calculate a conflict for the given system. For the
2.2 Computation of the Diagnoses 13
example spreadsheet, assume that such a conflict detection technique would returnone of the existing conflicts, for example, {B1, C1}. Node 1 is then labeled withthe found conflict and the algorithm will expand the search tree for each componentinside this conflict.
For node 2 , the algorithm assumes the formula of B1 to be faulty and thereforechecks if the spreadsheet still has a conflict when the formula of B1 is ignored.Since the spreadsheet has another conflict {B2, C1}, this conflict will be found thistime and node 2 will be labeled with the newly found conflict. At node 3 , C1 isassumed to be faulty, as shown in Figure 2.3. Because no other conflict remainswhen the formula of C1 is ignored, the algorithm has found the diagnosis {C1} andthe node is labeled with a check mark.
On the next level, the HS-Tree algorithm expands node 2 by creating two new nodesfor the components of the conflict found for this node. Node 4 , however, does nothave to be further inspected and is closed, since for this node the resulting diagnosis{B1, C1} would be a superset of the already found diagnosis {C1} and is thus notrelevant. Last, at node 5 the formulas of both cells B1 and B2 are considered to befaulty and the diagnosis {B1, B2} is found, as no other conflict remains. Since allleaf nodes now either result in a diagnosis or are closed, the algorithm is finishedand has found the two diagnoses {C1} and {B1, B2}.
To compute the conflicts, different conflict detection techniques can be used. How-ever, in order for the original HS-Tree algorithm of Reiter to work correctly, the mini-mality of the returned conflicts has to be ensured, because the algorithm was faultyregarding the use of non-minimal conflicts. In [Gre+89] Greiner et al. proposedan extension to the original algorithm to correct it in cases in which non-minimalconflicts are returned by the used conflict detection technique. In the implementa-tions discussed in this thesis, however, QUICKXPLAIN [Jun04] and MERGEXPLAIN
[Shc+15b] are used to compute the conflicts. Since both of these techniques areguaranteed to only return minimal conflicts, the correction by Greiner et al. is notrequired.
2.3 An Interactive Tool for Model-Based SpreadsheetDebugging
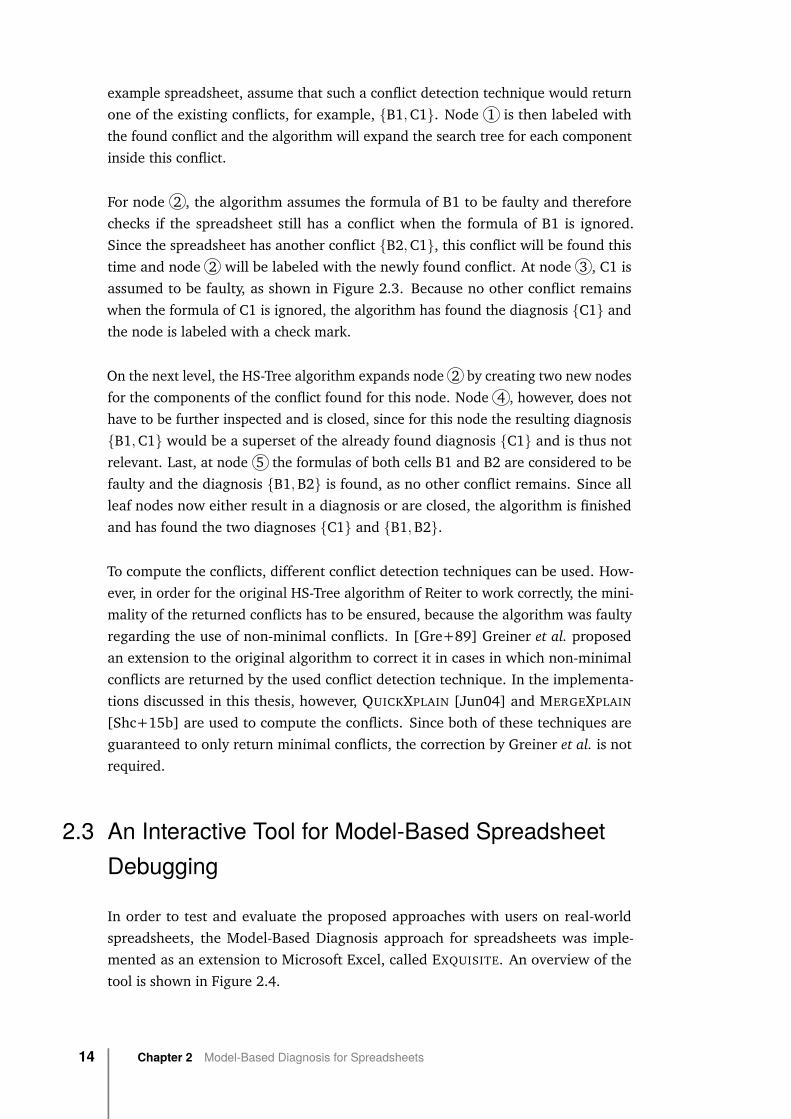
In order to test and evaluate the proposed approaches with users on real-worldspreadsheets, the Model-Based Diagnosis approach for spreadsheets was imple-mented as an extension to Microsoft Excel, called EXQUISITE. An overview of thetool is shown in Figure 2.4.
14 Chapter 2 Model-Based Diagnosis for Spreadsheets

Test case management
Debugging & diagnosis functions
Cell & formula information
Open issues & results
Annotatingvalues
Visual indicators
Figure 2.4: EXQUISITE, a Model-Based spreadsheet debugging tool [Jan+16a].
Exquisite: In the following an exemplary usage of EXQUISITE is described. Whenthe debugging mode is started the tool automatically colors the cells accordingto their role in the spreadsheet. Input cells are colored in green, intermediatecalculations in yellow, and output cells in orange. This colorization alone can helpthe user to spot some kinds of faults, for example, range errors or unused inputs,which are not highlighted. The user can then enter values for the input cells withoutoverriding the values of the original spreadsheet and state expected values for theinterim and output cells. The annotated values are shown as a list next to thespreadsheet and are also highlighted in the spreadsheet with a check mark forcorrect values and a cross for faulty values. The specified test cases can be savedand loaded at later times to support the test case specification over multiple sessions.Once a user detects a discrepancy between the expected and the observed behaviorof the spreadsheet, he or she can start the debugging functionality. The systemwill then determine the diagnoses and present them as a list in the results section,which the user can inspect. By clicking on an item of the list, the cells containing thepossibly faulty formulas are highlighted in the spreadsheet and arrows point to theirprecedents as well as dependents.
2.3 An Interactive Tool for Model-Based Spreadsheet Debugging 15

A preliminary version of the tool was already presented in [Jan+13]. In [Jan+16a]improvements to the tool as well as the algorithms behind it are presented and theperformance of these new algorithmic approaches is evaluated (see Chapter 3).
User study: To evaluate if the MBD approach is advantageous for the users todebug a faulty spreadsheet, also a user study was performed. In this study, 24participants had to locate a fault in a profit calculation spreadsheet. The participantswere randomly split into two groups and were given a description about how thespreadsheet should work and an example with values that the spreadsheet shouldcalculate. The first group had to locate the fault without using EXQUISITE, whilethe second group was introduced to the functionality of the add-in and used it tocalculate a set of formulas that could be the reason of the fault. In both cases theusers had to inspect the formulas which they thought to be faulty in order to findout what the real fault was.
The results of the study show that EXQUISITE can indeed help to locate faults ina spreadsheet. The participants using the tool found the injected fault faster onaverage than the participants not using it (less than 3 minutes compared to morethan 9 minutes). In addition, of the participants not using the tool, 33% were notable to locate the fault at all in the given time frame of 30 minutes.
16 Chapter 2 Model-Based Diagnosis for Spreadsheets

3New Algorithmic Approaches forFaster Calculation of Diagnoses
The general MBD approach proved to be promising for spreadsheet debugging.However, for complex or large spreadsheets the time required to calculate thediagnoses can exceed the time that is acceptable in an interactive setting, in which auser expects a result almost instantly or at most after a few seconds. Therefore, inthe next two sections two new algorithmic approaches to speed up the calculationof diagnoses are summarized. The full papers can be found in the appendix of thisthesis by publication.
3.1 Faster Conflict Detection
As discussed in Section 2.2, the HS-Tree algorithm relies on some conflict detectiontechnique that calculates the conflicts. The HS-Tree algorithm then uses theseconflicts to determine the diagnoses. QUICKXPLAIN [Jun04] is an efficient divide-and-conquer technique proposed by Junker to determine such conflicts. For largeor complex spreadsheets, however, many conflicts can exist. In these cases theHS-Tree algorithm will call QUICKXPLAIN each time a new conflict is required, i.e.,when all known conflicts are already solved at the current node of the tree. SinceQUICKXPLAIN only returns a single conflict for each call, the search for conflicts hasto be “restarted” each time.
MergeXplain: To speed up the overall calculation of diagnoses and to solve theproblem of the slow “restart” of the conflict search, in [Shc+15b] a new approach,called MERGEXPLAIN, is proposed that can calculate multiple conflicts in a single call.The rationale of this technique is that more time is spent to efficiently search forconflicts at the beginning of the calculation of diagnoses and in return the search forconflicts does not have to be restarted so often when the HS-Tree is built, because inmost cases one of the previously found conflicts can be reused.
An example of how MERGEXPLAIN searches for conflicts is shown in Figure 3.1 andexplained in the following. In the example the faulty system has 8 components or
17

1 2 3 4 5 6 7 8
1 2 3 4 5 6 7 8
1 2 3 4 5 7 8
1 2 4 5 7 8
1 2 4 5 7 8
A
B
D
E
F
1 2 3 4 5 6 7 8C
Figure 3.1: Example of MERGEXPLAIN searching for three conflicts shown as red linesbetween the components 1 to 8.
formulas. The system has 3 conflicts and the goal of MERGEXPLAIN is to find atleast one of them or more, if possible. The conflicts, shown as red lines in Figure3.1, are {2, 7}, {3, 4}, and {6, 7, 8}. First, MERGEXPLAIN recursively splits the sets ofcomponents into two separate sets, as long as the components of the set still containat least one conflict. Because of this step, subsets of the components that do notcontain any conflicts can be quickly excluded from further examinations.
Since the 8 components of the system contain a conflict (step A), they are split intotwo sets (step B). In step C, both sets are split again, because they both still containa conflict. This time, however, on the right-hand side the last conflict, shown as adotted line in Figure 3.1, was split and thus the two sets {5, 6} and {6, 7} both donot contain a conflict anymore. Therefore, the algorithm re-combines them and usesJunker’s QUICKXPLAIN to locate a conflict in this set of components. As this set ofcomponents would not have been split if it did not contain any conflict, it is knownto contain one conflict at least. In addition, because this set of components resultedfrom repetitive splitting of the original components and thus it is comparativelysmall, QUICKXPLAIN will find the conflict {6, 7, 8} rather quickly. After this conflicthas been found, one of the conflict’s components, for example, component 6, isremoved from further investigations to resolve the current conflict and QUICKXPLAIN
18 Chapter 3 New Algorithmic Approaches for Faster Calculation of Diagnoses

is iteratively called again in order to find another conflict, if one exists (step D).In step E, the same was done for the left-hand side of the components and herethe conflict {3, 4} was found. Since no more conflicts remain in both halves of thecomponents, the algorithm continues to merge the two sets of components againand searches for the last remaining conflict (step F).
A detailed description of the MERGEXPLAIN algorithm can be found in [Shc+15b],which is included in this thesis by publication. In this paper, it is proven that MERGE-XPLAIN will only return minimal conflicts because it internally uses QUICKXPLAIN,which also only returns minimal conflicts. MERGEXPLAIN is also proven to alwaysreturn at least one conflict or more. However, because it is not guaranteed to returnall existing conflicts of a diagnosable system, MERGEXPLAIN still has to be calledmultiple times when used to determine the conflicts that are required to calculatethe diagnoses.
Evaluation: To evaluate the proposed approach it was compared to QUICKXPLAIN
when used by the HS-Tree algorithm to calculate a small subset of the diagnoses[Shc+15b]. The different tested systems contained digital circuits, ConstraintSatisfaction Problems (CSPs), spreadsheets, as well as artificial systems to simulatedifferent problem characteristics. The average reductions of the calculation timesare summarized in Table 3.1.
Table 3.1: Average reductions of computation times when using MERGEXPLAIN compared toQUICKXPLAIN to search for five diagnoses with the HS-Tree algorithm [Shc+15b].
System type Avg. reduction
Digital circuits 27%
Constraint Satisfactions Problems 22%
Spreadsheets 15%
Simulation experiments 42%
The efficiency of the approach very much depends on the structure of the problemand thus the improvements vary for the individual problems. Although for someproblem instances no speedups could be achieved, for others the time requiredto calculate the diagnoses could be reduced by up to 54%. Therefore, additionalsimulation experiments were performed, in which artificial problems with differentcharacteristics were tested. The goal of this evaluation was to find out which problemcharacteristics lead to the highest performance improvements. Among others, oneresult is that depending on the characteristics of the conflicts MERGEXPLAIN canachieve improvements of up to 76% over QUICKXPLAIN while for other characteristicsit results in the same performance. Details of the evaluation can be found in[Shc+15b].
3.1 Faster Conflict Detection 19

3.2 Parallelizing the Calculation of Diagnoses
In addition to improving the calculation of conflicts, the overall search for diagnosescan be enhanced as well. The HS-Tree algorithm only expands one node of thesearch tree at a time and only a single thread is used for the calculation. As moderncomputers, laptops, and even smartphones have multiple computation cores, thetree construction process can be parallelized by expanding multiple nodes of thesearch tree at the same time. Thereby, the full potential available in today’s hardwarearchitectures is utilized. In [Jan+16a; Jan+16b] different approaches to parallelizethe HS-Tree algorithm were proposed. In this section two of these approaches arepresented: Level-Wise Parallelization and Full Parallelization.
Level-Wise Parallelization: The original HS-Tree algorithm proposed in [Rei87]uses several tree pruning rules to reduce the search space (see Section 2.2 for anexample). As these pruning rules require that the nodes of the search tree areexpanded in the correct order, the parallelization of the HS-Tree algorithm is nottrivial.
Therefore, the main idea of the first parallelization approach presented in this thesis,called Level-Wise Parallelization (LWP), is to mostly keep the order in which thenodes are expanded intact. To achieve this goal, all nodes on the same level areexpanded in parallel and the algorithm continues with the next level once all nodesof the previous level are finished. An example of how LWP works is shown in Figure3.2 and explained in the following.
C
B
1
2
4 5
3
6 7
A
Figure 3.2: Exemplary schedule of the Level-Wise Parallelization technique with threescheduling steps A to C.
In the first step (A), only node 1 can be processed, as no other nodes exist yet.When the first node is created, nodes 2 and 3 are expanded in parallel (B) andthe algorithm waits until the expansions of both nodes are finished. After bothnodes are created, the algorithm continues with the third level (C) and processesall nodes of this level in parallel. As all nodes of the previous level were finished
20 Chapter 3 New Algorithmic Approaches for Faster Calculation of Diagnoses

before the expansion of the new level began, all pruning rules of Reiter’s HS-Treealgorithm [Rei87] can be applied. In addition, synchronization between threads isonly required to ensure that no thread explores a path that is already being exploredby another thread. The soundness and completeness of LWP is proven in [Jan+16b],which can be found in the appendix of this thesis.
The main advantage of the LWP approach is that it provides a way to parallelize theconstruction of nodes in the search tree while requiring only little synchronizationto ensure the correctness of the tree pruning rules. However, if some node of a levelneeds more time to expand than the other nodes of the same level, it can happenthat the algorithm has to wait for this single node before the expansion of the nextlevel can start.
Full Parallelization: The main idea of the Full Parallelization (FP) approach is notto wait at the end of a level but to continue with the expansion of the nodes of thenext level, even though the previous level has not been finished. An example of theparallel expansion progress is shown in Figure 3.3.
C
B
1
2
4 5
3
6 7
A
D
Figure 3.3: Exemplary schedule of the Full Parallelization technique with four schedulingsteps A to D.
The FP algorithm always schedules all available nodes for parallel expansion andthus does not use discrete scheduling steps anymore that correspond to the levels ofthe search tree. In the example the algorithm expands nodes 2 and 3 in parallel(B), after node 1 is finished, as LWP does. After one of these nodes is finished, forexample node 2 , the algorithm immediately continues to expand the child nodes 4and 5 of the finished parent (C) and does not wait at the end of the level like LWP.After node 3 is finished the algorithm can queue nodes 6 and 7 for expansion inaddition to the nodes that are still being expanded (D).
It can happen that nodes of a previous level are still expanding when nodes on thenext level are already finished. In some of these cases an already expanded nodeshould be pruned according to the tree pruning rules. Therefore, after the expansion
3.2 Parallelizing the Calculation of Diagnoses 21

of every node the algorithm has to check if some of the other already created nodesshould be removed again because of the newly obtained information. In [Jan+16b]the details of FP as well as a proof of its correctness are given.
In comparison to LWP, FP has the advantage that it does not have to wait for singlenodes at the end of a level. However, FP has to perform some additional checks andan additional synchronization between the threads to ensure the correctness of theapproach. In cases in which the last nodes of each level finish at the same time, LWPcould therefore be faster than FP, because it has less overhead.
Evaluation: In [Jan+16b] LWP and FP were evaluated on different system types incomparison to the sequential HS-Tree algorithm. Table 3.2 summarizes the averagereductions of the computation times that could be achieved when 4 threads wereused for the parallelized algorithms.
Table 3.2: Average reductions of the computation times of LWP and FP using 4 threadscompared to the sequential HS-Tree algorithm [Jan+16b].
System type LWP FP
Digital circuits 45% 65%
Constraint Satisfactions Problems 39% 40%
Spreadsheets 48% 50%
Ontologies 38% 36%
Simulation experiments 69% 70%
For the tested spreadsheets the required calculation times could be reduced by about48% for LWP and 50% for FP on average. This means that the required calculationtime was halved using the proposed parallelization techniques. Although thesereductions are below the theoretical optimum of 75% when using 4 threads ona computer with 4 computation cores, the results are still encouraging as goodspeedups could be achieved by the proposed approaches, which utilize the fullpotential of the available hardware.
22 Chapter 3 New Algorithmic Approaches for Faster Calculation of Diagnoses

4Sequential Diagnosis
Model-Based Diagnosis approaches determine all possible reasons of a discrepancybetween the expected and the observed calculation outcomes of a spreadsheet. Forlarge or complex spreadsheets and depending on the provided test cases, however, itcan happen that too many diagnoses are returned by these techniques so that a usercannot inspect all of them manually.
To find the true reason of the discrepancy, called preferred diagnosis, one possibleapproach is to reduce the number of diagnoses by iteratively asking the user fornew information. This technique is called sequential diagnosis and is depicted inFigure 4.1. The new information obtained through the queries can include newobservations about correct or faulty values or state the correctness of some formulas.The statements are then added to the knowledge about the spreadsheet and withtheir information new diagnoses can be determined that are more precise than theprevious ones.
Diagnosis problem
Preferreddiagnosis
else
|diags|=1Calculatediagnoses
Ask queryto the user
Calculatequery
Updateknowledge
Figure 4.1: The sequential diagnosis approach [Shc+16c].
4.1 The General Sequential Diagnosis Approach
The general idea of using additional measurements to reduce the number of diag-noses was already proposed in the early works of MBD [Rei87; Kle+87]. De Kleer etal. additionally presented a method to determine the next best query to ask to theuser [Kle+87]. In several later works including [Fel+10; Shc+12; Shc+16b] this
23

method was used and improved. In this thesis, the sequential diagnosis approachis summarized based on the description in [Shc+16b], which can be found in theappendix. Although in this paper sequential diagnosis is not used for the spreadsheetsetting, it can be easily applied to spreadsheets as shown in this section.
The goal of most sequential diagnosis approaches is to find the true reason of anobserved fault with as few queries as possible. Since the system cannot predicthow the user will answer a query, it tries to choose a query that will eliminate asmany diagnoses as possible regardless of the user’s answer. To do so, first, thesystem calculates a set of diagnoses with the currently available knowledge. Next,it splits the set of diagnoses into two sets that have the same value based on somecriteria. The value of a set of diagnoses can, for example, be determined by usingthe number of formulas contained in these diagnoses or by using the probabilitiesof the individual formulas being faulty, if this information is available. Once such apartition is found, the system tries to find a query to discriminate between these twosets, i.e., a query for which one set of the diagnoses remains if the user answers “yes”and the other set remains if the user answers “no”. If no such query can be found,the system tries the next best possible partition and continues until a partition isfound for which a query exists.
The calculated query is then presented to the user who has to evaluate and answerit. The information gained from the user’s answer is added to the knowledge aboutthe spreadsheet and the process is repeated until only a single diagnosis remainsthat is then known to be the true reason of the observed fault.
4.2 Speeding Up the Query Calculation
For large systems determining the next query can take too long in the interactivesequential diagnosis process. The reason is that a set of diagnoses is requiredto determine the next query. Although it was shown that a set of 9 diagnoses issufficient to determine a good query [Shc+12], for larger systems calculating these9 diagnoses can already exceed acceptable times.
Algorithmic approach: In [Shc+16b] a new algorithmic approach was presentedto speed up the calculation of the diagnoses required to determine the next query.The approach builds upon the new concept of so-called partial diagnoses. Thesepartial diagnoses are, as the name suggests, subsets of real diagnoses. The ideaof using partial diagnoses is to search for conflicts only once during the HS-Treeconstruction, for example using MERGEXPLAIN (see Section 3.1), and to use thefound conflicts to determine partial diagnoses without checking if they fully explain
24 Chapter 4 Sequential Diagnosis

the observed fault. Since the found conflicts are a subset of all conflicts of the system,the partial diagnoses determined because of these conflicts will also be subsets ofthe (complete) diagnoses of the system. Therefore, queries that help to discriminatebetween the calculated partial diagnoses will also help to reduce the number of(complete) diagnoses.
If we would have, for example, a system with components 1 to 8 and conflicts{{2, 7}, {3, 4}, {6, 7, 8}}, as used in the example of Section 3.1, the (complete) di-agnoses for this system would be {{3, 7}, {4, 7}, {2, 3, 6}, {2, 3, 8}, {2, 4, 6}, {2, 4, 8}}.If we now assume that we only computed 2 of these 3 conflicts, for example, {{2, 7},
{3, 4}}, we could determine the partial diagnoses {{2, 3}, {2, 4}, {3, 7}, {4, 7}}.These partial diagnoses are all subsets of complete diagnoses. In fact, 2 of thesepartial diagnoses are even complete although only 2 of the 3 conflicts of the systemwere used to calculate them.
2 7 3 4Determine some conflicts:
Calculate partial diagnoses: 2 3 2 4 3 7 4 7
Find preferred partial diagnosis: 2 4
Determine more conflicts: 6 7 8
Calculate partial diagnoses: 2 4 6 2 4 8
Find preferred partial diagnosis: 2 4 6
Figure 4.2: Example of the sequential diagnosis process using partial diagnoses.
The concept of partial diagnoses can be utilized in the sequential diagnosis processusing the following technique [Shc+16b]. An example of the process is shown inFigure 4.2. First, the algorithm searches for a set of conflicts in the given faultysystem using MERGEXPLAIN or some other conflict detection technique that is in thebest case able to efficiently determine multiple conflicts and will find, for example,the conflicts {2, 7} and {3, 4}. The found conflicts are then used to determine alimited number, for example, 9, of partial diagnoses. In the example of Figure 4.2,however, only 4 partial diagnoses can be calculated because of the found conflicts.The system uses these partial diagnoses to determine queries to ask to the user in
4.2 Speeding Up the Query Calculation 25

the same way as the general sequential diagnosis approach does (see Section 4.1).The process of calculating the partial diagnoses, determining a query, and asking itto the user is repeated until only a single partial diagnosis can be found, for example,{2, 4}. This partial diagnosis is then called the preferred partial diagnosis and isknown to be a subset of the true reason of the observed fault. The algorithm thencontinues to search for an additional set of conflicts with MERGEXPLAIN and repeatsthe process for these new conflicts. In the example, the new conflict {6, 7, 8} is found.The component 7, however, was already excluded because of the previously askedquestions and is thus ignored. Therefore, only 2 partial diagnoses can be calculatedwith the new conflict and the system asks another query to find the preferred partialdiagnosis among them. Since no more conflicts can be found in the next step, thepreferred partial diagnosis determined this way is known to be a complete diagnosisand the true reason of the fault. In [Shc+16b], which is included in this thesis, thedetails of this technique are described and its correctness is proven.
Evaluation: To evaluate the new approach it was compared to another techniquethat calculates diagnoses directly without using the concept of conflicts and wasshown to be efficient in [Shc+12]. The average reductions in computation time,number of queries, and number of queried statements, which were asked in thequeries, are shown in Table 4.1 for the two tested types of systems.
Table 4.1: Average reductions of the computation time, number of queries, and number ofqueried statements of the new approach presented in [Shc+16b] compared tothe technique presented in [Shc+12]. Values in parentheses show the reductionsfor systems that require more than a second to compute.
System type Time #Queries #Statements
Digital circuits 61% (81%) 30% 1%
Ontologies 83% (88%) 4% 5%
The results show that using partial diagnoses significantly reduces the time requiredto calculate the queries. This reduction in time is even bigger for those systems thatrequire more than a second to compute (shown in parentheses in Table 4.1). For themost complex digital circuit, the technique proposed in [Shc+12] was not able tofind the true reason of the fault after 24 hours while the new approach needed about40 minutes. Regarding the number of required queries and queried statements inorder to find the true reason of the fault, using partial diagnoses resulted in aboutthe same numbers as the compared approach except for the number of queries forthe digital circuits. For these systems the new approach was able to reduce thenumber of required queries by 30%. This means that using partial diagnoses doesnot lead to an increased amount of effort required by the user.
26 Chapter 4 Sequential Diagnosis

5Creating a Corpus of FaultySpreadsheets
Most of the approaches for fault detection in spreadsheets are evaluated on real-world spreadsheets in which the researchers inserted faults manually or based onrandomly mutating the formulas [Jan+14a]. Although these evaluations are a goodindicator to show that the tested approaches could theoretically help to locate faultsin the spreadsheets, whether these approaches would work for spreadsheets withreal faults cannot be evaluated with certainty based on these artificial faults.
To assess the quality of new approaches for fault detection in practice, spreadsheetsare required that contain formula faults made by real users. An additional challengeis that although many real-world spreadsheets probably contain faults, it has to beknown where these faults are in order to evaluate if the techniques for spreadsheetdebugging are able to detect them. Therefore, we need to know which formulas arefaulty and how they should be corrected.
5.1 Types of Spreadsheets Used in Research
In the research literature about fault detection in spreadsheets, three differenttypes of spreadsheets with fault information are used to evaluate the efficiencyor effectiveness of the approaches. Examples of these evaluations are given in[Jan+14a]. The different types of spreadsheets used in existing evaluations can besummarized as follows:
• Artificial spreadsheets with artificial faults: These spreadsheets were de-signed by the researchers in order to evaluate their new approach. Often, suchspreadsheets are inspired by real-world spreadsheets, but are much simplerand did not evolve over time. In addition, as the faults were artificially insertedby the researchers, evaluations solely based on these spreadsheets can onlyserve as a first indicator for the quality of the approach.
• Artificial spreadsheets with real faults: Spreadsheets of this category arecreated in spreadsheet development experiments, see [Pan00] for examples.
27

In these experiments the participants have to develop a spreadsheet to fulfilla given task. After the experiment, the experimenters can then check thecreated spreadsheets for faults as the expected behavior of the spreadsheetsis well defined. Although the faults found this way are real, the spreadsheetsthemselves are artificial because they were only created for the experimentand it is not known how well the specified task fits to the tasks encountered inpractice.
• Real-world spreadsheets with artificial faults: Most of the approaches forfault detection in spreadsheets are evaluated on spreadsheets of this category.These spreadsheets were used in the industry to solve real tasks and are thusa good example of what kind of spreadsheets can be found in the real world.Although many of these spreadsheets probably contain faults, no informationabout the contained faults is available, as the semantics of a spreadsheet cannotbe reconstructed with certainty. Therefore, researchers insert artificial faults inthese spreadsheets in order to use them for their evaluations.
As all of these spreadsheet types are not sufficient to fully evaluate the functionalityof new approaches in the real world, spreadsheets of the fourth possible type aredesirable.
• Real-world spreadsheets with real faults: The ideal spreadsheets to be usedin an evaluation of a new fault detection approach are real-world spreadsheetsfor which the information about the contained real faults is available, i.e., thespreadsheets have faults made by real users and it is known which formulasare faulty and what the correct formulas should be. Since the spreadsheets ofthis category have been used to solve real tasks and their faults were made byreal users, they represent good examples of faults that should be detected byall testing and fault localization techniques.
5.2 Publicly Available Spreadsheet Corpora
Because companies usually do not publish their internal spreadsheets as they possiblycontain confidential information, researchers have to use corpora of spreadsheetsthat are publicly available in order to evaluate new approaches. In this section, a listof publicly available spreadsheet corpora is given.
EUSES corpus: The most widely used corpus in fault detection research for spread-sheets is the EUSES corpus [Fis+05]. It was created to assist researchers in evaluat-ing new spreadsheet QA approaches and contains 4,498 spreadsheets obtained by a
28 Chapter 5 Creating a Corpus of Faulty Spreadsheets

Google web search with different search terms related to business and education.The spreadsheets can be considered to be authentic although some of them mighthave been created for showcase purposes. The drawback of this corpus is that noinformation about the contained faults is available so that in order to use it forevaluations of fault detection techniques artificial faults have to be inserted.
Fuse corpus: Similar to the EUSES corpus, the Fuse corpus contains spreadsheetsfound through a web search. In their work [Bar+15], Barik et al. give an ex-act description of how the corpus can be obtained to ensure reproducibility andextensibility. The extensive web search led to a corpus of 249,376 spreadsheets.
Info1 corpus: The Info1 corpus was created during a spreadsheet developmentexercise and contains 119 faulty versions of 2 different spreadsheets. Since the in-tended semantics of the spreadsheets are known, the faults made by the participantscould be identified and the information about the contained faults is included in thecorpus. However, the spreadsheets of this corpus cannot be considered to reflectspreadsheets from the industry, because they were developed in an exercise. Thecorpus is described in [Get15] and can be obtained from [Inf].
Payroll/Gradebook corpus: This corpus originally consisted of spreadsheets devel-oped in the academic Forms/3 spreadsheet environment. These artificial spread-sheets with injected faults were used in a user study in which 20 participants had todebug and test two different spreadsheets [Rut+06]. In addition to the informationabout the faults, the (possibly faulty) test cases created by the users are available.An MS Excel version of this corpus can be obtained from [Pgc].
Enron corpus: The Enron Corporation was one of the biggest companies in the USand one of the world’s major electricity and gas companies. When it went bankruptin 2001, a big accounting fraud was revealed, which is known as the Enron scandal.In the process of the investigations, all emails sent from or to Enron between 2000and 2002 were published in 2003. In [Her+15] Hermans and Murphy-Hill extracted15,770 spreadsheets contained in these emails and published them as the Enroncorpus. Since all of these spreadsheets were sent in emails related to the business ofEnron, they can be considered real-world spreadsheets. Again, no information aboutthe contained faults is available.
Of all publicly available spreadsheet corpora, none contains both real-world spread-sheets and information about real faults.
5.2 Publicly Available Spreadsheet Corpora 29

5.3 Building a Real-World Spreadsheet Corpus withFault Information
Although multiple spreadsheet corpora are available to evaluate new approachesin spreadsheet QA, there is still a need for a corpus that consists of real-worldspreadsheets combined with information about the real faults that are contained inthese spreadsheets.
In this thesis, a new method is presented to build such a corpus based on the availablespreadsheets and emails of Enron. The spreadsheets of the Enron corpus were usedin practice and as spreadsheets are error-prone, at least some of them will containfaults made by the users. Because the spreadsheets were sent as email attachments,the information of the spreadsheets can be combined with the information given inthe emails. The following aspects can be used to detect real faults in the spreadsheetsof the Enron corpus:
• In the emails to which the spreadsheets are attached, the text message caninclude some descriptions about the spreadsheets. In these descriptions faultsin the spreadsheets can be mentioned that, for example, were detected orfixed.
• In many cases, multiple versions of the same spreadsheet were sent over timethat only differ in a few cells. If from one version to another only a single ora few formulas have been changed and the rest of the spreadsheet was keptunchanged, these changes could be the result of a fault correction by the user.
5.3.1 Fault Detection Methods
In [Sch+16a], two techniques are presented to help a researcher detect faults in thespreadsheets of the Enron corpus. The techniques were designed to combine theinformation given in the emails and in the spreadsheets themselves. However, theapproach is not limited to the emails of the Enron corpus and can be applied to anycorpus of emails containing spreadsheets, because no domain-specific knowledge isrequired.
Reconstruction of email conversations: A description of a fault that is found in aspreadsheet could possibly be included in the answer to the email that the spread-sheet was attached to. To utilize this information, a tool was developed that auto-matically reconstructs the email conversations, as shown in Figure 5.1.
30 Chapter 5 Creating a Corpus of Faulty Spreadsheets

Figure 5.1: Example of reconstructed email conversations [Sch+16a]. The spreadsheeticons denote that spreadsheets are attached to the emails.
The conversations can be searched for keywords related to errors. The researcher canthen read these conversations in the order in which they were sent. If the messagetext in an email mentions a corrected or a found fault in some spreadsheet, theresearcher can explicitly search for this fault in the attached spreadsheet. To inspecta suspicious spreadsheet attached to an email he or she can click on the spreadsheeticon to open it. The visualization of the conversations helps the researcher to quicklyget an overview of the different conversations and to understand the relationshipsbetween the emails.
To reconstruct the email conversations, for each email of the corpus the previousand following messages of the same conversation have to be found. However, theEnron corpus does not contain any explicit information for the emails that allowsa precise reconstruction of these conversations. Therefore, the system uses a setof heuristics based on the subject, sender, recipients, time stamp, and the messagetext of the emails to do an approximate reconstruction. A detailed description ofthe used heuristics can be found in [Sch+16a], which is included in this thesis bypublication.
Analyzing the differences in spreadsheets: If only a single or a few formula cellsin a spreadsheet were changed, these changes could possibly represent a correctionof a fault. Whether such a difference really represents a correction of a fault or achange of the modeled business logic can only be decided by a spreadsheet expertwho manually inspects the changes. A tool can, however, support the expert in hisor her task by listing a set of candidate spreadsheets of which only a few formulaswere changed and by visualizing these changes.
In [Sch+16a], a systematic approach is presented to detect the changes made fromone spreadsheet version to another. Searching for the differences between two
5.3 Building a Real-World Spreadsheet Corpus with Fault Information 31

spreadsheets in a meaningful way is not trivial. The system has to detect inserted ordeleted rows and columns because otherwise every single cell after such a row orcolumn would be perceived as a difference. It also has to report the same change tomultiple equivalent formulas as only a single difference because otherwise such achange would result in multiple differences. This has to be avoided since spreadsheetversions that contain too many differences are not considered to contain a correctionof a fault. Details of this approach are given in [Sch+16a].
5.3.2 The Enron Error Corpus
With the help of the presented approaches a first initial inspection of the emailconversations and the fault correction candidates was done, which led to a corpusof 30 spreadsheets containing 36 real faults. For most of the faults the corpuscontains a faulty and a corrected version of the spreadsheet. This can be useful toevaluate approaches that propose to make suggestions how faulty formulas shouldbe repaired. The Enron Error Corpus can be found at [Sch+16c].
Table 5.1: Overview of the Enron Error Corpus [Sch+16c].
Error type Nb of errors
Qualitative 8
Quantitative 28
Mechanical 14
Logic 9
Omission 5
Total 36
An overview of the detected faults is given in Table 5.1. The corpus contains 8qualitative faults, which did not result in a faulty value of the current spreadsheetbut could do so in a later version of the spreadsheet. Since the main goal was tosearch for faults that result in wrong output values the majority of the found faultsare quantitative.
The corpus was published in order to support researchers in evaluating their ap-proaches on real-world spreadsheets with real faults and we plan to use it forour future evaluations as well. In addition, the tool was published to allow otherresearchers to search for faults in the Enron spreadsheets.
32 Chapter 5 Creating a Corpus of Faulty Spreadsheets

6Conclusion
Spreadsheets are widely used in the industry for day-to-day business activities andto support strategic business decisions. Since spreadsheets, like any other software,can be faulty and since these faults often remain undetected, they have led to severeconsequences, for example, loosing money or worse. Therefore, better tool supportis required to support the users in detecting and correcting these faults.
In this thesis by publication an overview of the different domains in automatedspreadsheet quality assurance was given and different new algorithmic approacheswere presented that help users to detect faults in spreadsheet formulas. In theevaluations it was shown that all of these approaches are beneficial in comparison toprevious state-of-the-art techniques. Since the presented approaches can be used incombination with each other, they can be utilized to efficiently find the true reasonof a detected miscalculation.
In addition to the various algorithmic enhancements mentioned in the appendedpapers, one open question in the research field is whether extensive tool supportfor spreadsheet quality assurance will be accepted by the spreadsheet users in theindustry. As some of the biggest benefits of the spreadsheets are their flexibility andthe fast development times, it is important that approaches for spreadsheet QA donot reduce these benefits.
Therefore, one important future topic of investigation should be to check if real usersin the industry accept the proposed quality assurance techniques. To evaluate thisaspect, field studies with real users who test the different approaches are required.The studies should show (a) if users are willing to use the tools in their daily businessand (b) if the approaches can help to enhance the quality of the spreadsheets.
Another mostly open question is how the awareness of spreadsheet users for the riskscaused by faulty spreadsheets can be raised. Since a common mistake in the industryis to underestimate these high risks [Pan98; Pan+12], raising the risk awarenesswould help to motivate users to test their spreadsheets and the detected faults couldthen, for example, be located by the approaches presented in this thesis.
33


Bibliography
[Abe15] Stephan Abel. “Automatische Erkennung von Spreadsheetversionen”. Bachelor’sthesis. TU Dortmund, 2015 (cit. on p. 2).
[Bar+15] Titus Barik, Kevin Lubick, Justin Smith, John Slankas, and Emerson Murphy-Hill. “Fuse: A Reproducible, Extendable, Internet-Scale Corpus of Spreadsheets”.In: Proceedings of the IEEE/ACM 12th Working Conference on Mining SoftwareRepositories. 2015, pp. 486–489 (cit. on p. 29).
[Fel+10] Alexander Feldman, Gregory Provan, and Arjan Van Gemund. “A Model-BasedActive Testing Approach to Sequential Diagnosis”. In: Journal of Artificial Intelli-gence Research 39 (2010), p. 301 (cit. on p. 23).
[Fis+05] Marc Fisher and Gregg Rothermel. “The EUSES Spreadsheet Corpus: A sharedresource for supporting experimentation with spreadsheet dependability mecha-nisms”. In: SIGSOFT Software Engineering Notes 30.4 (2005), pp. 1–5 (cit. onp. 28).
[Get15] Elisabeth Getzner. “Improvements for Spectrum-based Fault Localization inSpreadsheets”. Master’s thesis. Graz University of Technology, May 2015 (cit. onp. 29).
[Gre+89] Russell Greiner, Barbara A. Smith, and Ralph W. Wilkerson. “A Correction to theAlgorithm in Reiter’s Theory of Diagnosis”. In: Artificial Intelligence 41.1 (1989),pp. 79–88 (cit. on p. 14).
[Her+13] Thomas Herndon, Michael Ash, and Robert Pollin. Does High Public Debt Consis-tently Stifle Economic Growth? A Critique of Reinhart and Rogoff. Working Paper322, Political Economy Research Institute, University of Massachusetts, Amherst.2013 (cit. on p. 2).
[Her+15] Felienne Hermans and Emerson Murphy-Hill. “Enron’s Spreadsheets and Re-lated Emails: A Dataset and Analysis”. In: Proceedings of the 37th InternationalConference on Software Engineering (ICSE 2015). 2015, pp. 7–16 (cit. on pp. 1,29).
[Hof+14] Birgit Hofer, Dietmar Jannach, Thomas Schmitz, Kostyantyn Shchekotykhin, andFranz Wotawa. “Tool-supported fault localization in spreadsheets: Limitations ofcurrent research practice”. In: Proceedings of the 1st International Workshop onSoftware Engineering Methods in Spreadsheets (SEMS 2014). 2014 (cit. on p. 44).
35

[Hun+05] Christopher D. Hundhausen and Jonathan Lee Brown. “What you see is whatyou code: a radically dynamic algorithm visualization development model fornovice learners”. In: Proceedings of the IEEE Symposium on Visual Languages andHuman-Centric Computing (VL/HCC 2005). 2005, pp. 163–170 (cit. on p. 1).
[Jan+13] Dietmar Jannach, Arash Baharloo, and David Williamson. “Toward an integratedframework for declarative and interactive spreadsheet debugging”. In: Proceed-ings of the 8th International Conference on Evaluation of Novel Approaches toSoftware Engineering (ENASE 2013). 2013, pp. 117–124 (cit. on pp. 7, 16).
[Jan+14a] Dietmar Jannach, Thomas Schmitz, Birgit Hofer, and Franz Wotawa. “Avoiding,Finding and Fixing Spreadsheet Errors - A Survey of Automated Approaches forSpreadsheet QA”. In: Journal of Systems and Software 94 (2014), pp. 129–150(cit. on pp. 1, 3, 4, 7, 27, 43).
[Jan+14b] Dietmar Jannach, Thomas Schmitz, and Kostyantyn Shchekotykhin. “ParallelizedHitting Set Computation for Model-Based Diagnosis”. In: Proceedings of the 25thWorkshop on Principles of Diagnosis (DX 2014). 2014 (cit. on p. 44).
[Jan+14c] Dietmar Jannach, Thomas Schmitz, and Kostyantyn Shchekotykhin. “TowardInteractive Spreadsheet Debugging”. In: Proceedings of the 1st InternationalWorkshop on Software Engineering methods in Spreadsheets (SEMS 2014). 2014(cit. on p. 44).
[Jan+15a] Dietmar Jannach, Thomas Schmitz, and Kostyantyn Shchekotykhin. “ParallelizedHitting Set Computation for Model-Based Diagnosis”. In: Proceedings of the 29thAAAI Conference on Artificial Intelligence (AAAI 2015). 2015, pp. 1503–1510(cit. on p. 44).
[Jan+15b] Dietmar Jannach and Thomas Schmitz. “Using Calculation Fragments for Spread-sheet Testing and Debugging”. In: Proceedings of the 2nd International Workshopon Software Engineering Methods in Spreadsheets at ICSE 2015 (SEMS 2015).2015 (cit. on p. 44).
[Jan+16a] Dietmar Jannach and Thomas Schmitz. “Model-Based Diagnosis of SpreadsheetPrograms: A Constraint-based Debugging Approach”. In: Automated SoftwareEngineering 23.1 (2016), pp. 105–144 (cit. on pp. 5, 7, 11, 15, 16, 20, 43).
[Jan+16b] Dietmar Jannach, Thomas Schmitz, and Kostyantyn Shchekotykhin. “ParallelModel-Based Diagnosis On Multi-Core Computers”. In: Journal of ArtificialIntelligence Research 55 (2016), pp. 835–887 (cit. on pp. 6, 8, 20–22, 43).
[Jun04] Ulrich Junker. “QUICKXPLAIN: Preferred Explanations and Relaxations forOver-Constrained Problems”. In: Proceedings of the 19th National Conference onArtificial Intelligence (AAAI 2004). 2004, pp. 167–172 (cit. on pp. 14, 17).
[Kle+87] Johan de Kleer and Brian C. Williams. “Diagnosing Multiple Faults”. In: ArtificialIntelligence 32.1 (1987), pp. 97–130 (cit. on pp. 11, 23).
[Pan+10] Raymond R. Panko and Salvatore Aurigemma. “Revising the Panko-Halversontaxonomy of spreadsheet errors”. In: Decision Support Systems 49.2 (2010),pp. 235–244 (cit. on p. 2).
36 Bibliography

[Pan+12] Raymond R. Panko and Daniel N. Port. “End User Computing: The Dark Matter(and Dark Energy) of Corporate IT”. In: Proceedings of the 45th Hawaii Inter-national Conference on System Sciences (HICSS 2012). 2012, pp. 4603–4612(cit. on pp. 1, 33).
[Pan00] Raymond R. Panko. “Spreadsheet Errors: What We Know. What We Think WeCan Do.” In: Proceedings of the European Spreadsheet Risks Interest Group 1stAnnual Conference (EuSpRIG 2000). 2000 (cit. on p. 27).
[Pan98] Raymond R. Panko. “What We Know About Spreadsheet Errors”. In: Journal ofEnd User Computing 10.2 (1998), pp. 15–21 (cit. on pp. 1, 2, 33).
[Pow+08] Stephen G. Powell, Kenneth R. Baker, and Barry Lawson. “A critical review ofthe literature on spreadsheet errors”. In: Decision Support Systems 46.1 (2008),pp. 128–138 (cit. on p. 2).
[Pur+06] Michael Purser and David Chadwick. “Does an awareness of differing types ofspreadsheet errors aid end-users in identifying spreadsheets errors?” In: Pro-ceedings of the European Spreadsheet Risks Interest Group 7th Annual Conference(EuSpRIG 2006). 2006, pp. 185–204 (cit. on p. 2).
[Rei+10] Carmen M. Reinhart and Kenneth S. Rogoff. “Growth in a Time of Debt”. In:American Economic Review 100.2 (2010), pp. 573–578 (cit. on p. 2).
[Rei87] Raymond Reiter. “A Theory of Diagnosis from First Principles”. In: ArtificialIntelligence 32.1 (1987), pp. 57–95 (cit. on pp. 11, 13, 20, 21, 23).
[Rut+06] Joseph R. Ruthruff, Margaret Burnett, and Gregg Rothermel. “Interactive FaultLocalization Techniques in a Spreadsheet Environment”. In: IEEE Transactionson Software Engineering 32.4 (2006), pp. 213–239 (cit. on p. 29).
[Sca+05] Christopher Scaffidi, Mary Shaw, and Brad Myers. “Estimating the Numbers ofEnd Users and End User Programmers”. In: Proceedings of the IEEE Symposium onVisual Languages and Human-Centric Computing (VL/HCC 2005). 2005, pp. 207–214 (cit. on p. 1).
[Sch+16a] Thomas Schmitz and Dietmar Jannach. “Finding Errors in the Enron SpreadsheetCorpus”. In: Proceedings of the IEEE Symposium on Visual Languages and Human-Centric Computing (VL/HCC 2016). 2016, pp. 157–161 (cit. on pp. 7, 9, 30–32,44).
[Sch+16b] Thomas Schmitz, Birgit Hofer, Dietmar Jannach, and Franz Wotawa. “Fragment-Based Diagnosis of Spreadsheets”. In: Proceedings of the 3rd International Work-shop on Software Engineering Methods in Spreadsheets (SEMS 2016). 2016 (cit.on p. 44).
[Shc+12] Kostyantyn Shchekotykhin, Gerhard Friedrich, Philipp Fleiss, and Patrick Rodler.“Interactive ontology debugging: Two query strategies for efficient fault localiza-tion”. In: Journal of Web Semantics 12-13 (2012), pp. 788–103 (cit. on pp. 23,24, 26).
[Shc+15a] Kostyantyn Shchekotykhin, Dietmar Jannach, and Thomas Schmitz. “A Divide-And-Conquer Method for Computing Multiple Conflicts for Diagnosis”. In: Pro-ceedings of the 26th Workshop on Principles of Diagnosis (DX 2015). 2015 (cit. onp. 44).
Bibliography 37

[Shc+15b] Kostyantyn Shchekotykhin, Dietmar Jannach, and Thomas Schmitz. “MergeX-plain: Fast Computation of Multiple Conflicts for Diagnosis”. In: Proceedings ofthe International Joint Conference on Artificial Intelligence (IJCAI 2015). 2015,pp. 3221–3228 (cit. on pp. 6, 8, 14, 17, 19, 43).
[Shc+16a] Kostyantyn Shchekotykhin, Thomas Schmitz, and Dietmar Jannach. “EfficientDetermination of Measurement Points for Sequential Diagnosis”. In: Proceedingsof the Joint German/Austrian Conference on Artificial Intelligence (KI 2016). 2016(cit. on p. 44).
[Shc+16b] Kostyantyn Shchekotykhin, Thomas Schmitz, and Dietmar Jannach. “EfficientSequential Model-Based Fault-Localization with Partial Diagnoses”. In: Proceed-ings of the International Joint Conference on Artificial Intelligence (IJCAI 2016).2016, pp. 1251–1257 (cit. on pp. 6, 8, 23–26, 43).
[Shc+16c] Kostyantyn Shchekotykhin, Thomas Schmitz, and Dietmar Jannach. “UsingPartial Diagnoses for Sequential Model-Based Fault Localization”. In: Proceedingsof the 27th International Workshop on Principles of Diagnosis (DX 2016). 2016(cit. on pp. 23, 45).
[IEE10] IEEE Computer Society. “IEEE Standard Classification for Software Anomalies”.In: IEEE Std 1044-2009 (Revision of IEEE Std 1044-1993) (2010), pp. 1–23(cit. on p. 1).
Web pages
[F1F] F1F9. The Dirty Dozen. URL: http://blogs.mazars.com/the-model-auditor/files/2014/01/12-Modelling-Horror-Stories-and-Spreadsheet-Disasters-Mazars-UK.pdf (visited on Apr. 3, 2017) (cit. on p. 2).
[Inf] Info1 corpus. May 2015. URL: http://spreadsheets.ist.tugraz.at/index.php/corpora-for-benchmarking/info1/ (visited on Apr. 3, 2017) (cit. onp. 29).
[Pgc] Payroll/Gradebook corpus. 2006. URL: http://spreadsheets.ist.tugraz.at/index.php/corpora-for-benchmarking/payrollgradebook-2/ (visited onApr. 3, 2017) (cit. on p. 29).
[Sch+16c] Thomas Schmitz and Dietmar Jannach. The Enron Error Corpus. 2016. URL:http://ls13-www.cs.tu-dortmund.de/homepage/spreadsheets/enron-errors.htm (visited on Apr. 3, 2017) (cit. on p. 32).
[Tan14] Gillian Tan. Spreadsheet Mistake Costs Tibco Shareholders $100 Million. 2014.URL: http://on.wsj.com/1vjYdWE (visited on Apr. 3, 2017) (cit. on p. 2).
38 Bibliography

List of Figures
1.1 Taxonomy of spreadsheet errors, adapted from [Abe15]. . . . . . . . . 21.2 Structural overview of this thesis. . . . . . . . . . . . . . . . . . . . . . 62.1 A faulty spreadsheet. . . . . . . . . . . . . . . . . . . . . . . . . . . . . 122.2 A test case for the faulty spreadsheet. . . . . . . . . . . . . . . . . . . . 122.3 The resulting HS-Tree for the example spreadsheet. . . . . . . . . . . . 132.4 EXQUISITE, a Model-Based spreadsheet debugging tool [Jan+16a]. . . 153.1 Example of MERGEXPLAIN searching for three conflicts shown as red
lines between the components 1 to 8. . . . . . . . . . . . . . . . . . . . 183.2 Exemplary schedule of the Level-Wise Parallelization technique with
three scheduling steps A to C. . . . . . . . . . . . . . . . . . . . . . . . 203.3 Exemplary schedule of the Full Parallelization technique with four
scheduling steps A to D. . . . . . . . . . . . . . . . . . . . . . . . . . . 214.1 The sequential diagnosis approach [Shc+16c]. . . . . . . . . . . . . . 234.2 Example of the sequential diagnosis process using partial diagnoses. . . 255.1 Example of reconstructed email conversations [Sch+16a]. The spread-
sheet icons denote that spreadsheets are attached to the emails. . . . . 31
39


List of Tables
1.1 Overview of main categories of automated spreadsheet QA [Jan+14a]. 43.1 Average reductions of computation times when using MERGEXPLAIN
compared to QUICKXPLAIN to search for five diagnoses with the HS-Treealgorithm [Shc+15b]. . . . . . . . . . . . . . . . . . . . . . . . . . . . 19
3.2 Average reductions of the computation times of LWP and FP using 4threads compared to the sequential HS-Tree algorithm [Jan+16b]. . . 22
4.1 Average reductions of the computation time, number of queries, andnumber of queried statements of the new approach presented in [Shc+16b]compared to the technique presented in [Shc+12]. Values in parenthe-ses show the reductions for systems that require more than a second tocompute. . . . . . . . . . . . . . . . . . . . . . . . . . . . . . . . . . . 26
5.1 Overview of the Enron Error Corpus [Sch+16c]. . . . . . . . . . . . . . 32
41


Publications
In this thesis by publication the following six works of the author are included. Thesepublications are closely related to Model-Based Debugging of spreadsheets. The fulltexts of these works can be found after this list.
• Dietmar Jannach, Thomas Schmitz, Birgit Hofer, and Franz Wotawa. “Avoiding,Finding and Fixing Spreadsheet Errors - A Survey of Automated Approaches forSpreadsheet QA”. in: Journal of Systems and Software 94 (2014), pp. 129–150
• Dietmar Jannach and Thomas Schmitz. “Model-Based Diagnosis of SpreadsheetPrograms: A Constraint-based Debugging Approach”. In: Automated SoftwareEngineering 23.1 (2016), pp. 105–144
• Kostyantyn Shchekotykhin, Dietmar Jannach, and Thomas Schmitz. “MergeX-plain: Fast Computation of Multiple Conflicts for Diagnosis”. In: Proceedings ofthe International Joint Conference on Artificial Intelligence (IJCAI 2015). 2015,pp. 3221–3228
• Dietmar Jannach, Thomas Schmitz, and Kostyantyn Shchekotykhin. “ParallelModel-Based Diagnosis On Multi-Core Computers”. In: Journal of ArtificialIntelligence Research 55 (2016), pp. 835–887
• Kostyantyn Shchekotykhin, Thomas Schmitz, and Dietmar Jannach. “EfficientSequential Model-Based Fault-Localization with Partial Diagnoses”. In: Pro-ceedings of the International Joint Conference on Artificial Intelligence (IJCAI2016). 2016, pp. 1251–1257
43

• Thomas Schmitz and Dietmar Jannach. “Finding Errors in the Enron Spread-sheet Corpus”. In: Proceedings of the IEEE Symposium on Visual Languages andHuman-Centric Computing (VL/HCC 2016). 2016, pp. 157–161
In addition to these six main publications, the author of this thesis worked on thefollowing other publications related to spreadsheet debugging that are not part ofthis thesis.
• Dietmar Jannach, Thomas Schmitz, and Kostyantyn Shchekotykhin. “TowardInteractive Spreadsheet Debugging”. In: Proceedings of the 1st InternationalWorkshop on Software Engineering methods in Spreadsheets (SEMS 2014). 2014
• Birgit Hofer, Dietmar Jannach, Thomas Schmitz, Kostyantyn Shchekotykhin,and Franz Wotawa. “Tool-supported fault localization in spreadsheets: Limi-tations of current research practice”. In: Proceedings of the 1st InternationalWorkshop on Software Engineering Methods in Spreadsheets (SEMS 2014). 2014
• Dietmar Jannach, Thomas Schmitz, and Kostyantyn Shchekotykhin. “Paral-lelized Hitting Set Computation for Model-Based Diagnosis”. In: Proceedings ofthe 25th Workshop on Principles of Diagnosis (DX 2014). 2014
• Dietmar Jannach, Thomas Schmitz, and Kostyantyn Shchekotykhin. “Paral-lelized Hitting Set Computation for Model-Based Diagnosis”. In: Proceedings ofthe 29th AAAI Conference on Artificial Intelligence (AAAI 2015). 2015, pp. 1503–1510
• Dietmar Jannach and Thomas Schmitz. “Using Calculation Fragments forSpreadsheet Testing and Debugging”. In: Proceedings of the 2nd InternationalWorkshop on Software Engineering Methods in Spreadsheets at ICSE 2015 (SEMS2015). 2015
• Kostyantyn Shchekotykhin, Dietmar Jannach, and Thomas Schmitz. “A Divide-And-Conquer Method for Computing Multiple Conflicts for Diagnosis”. In:Proceedings of the 26th Workshop on Principles of Diagnosis (DX 2015). 2015
• Thomas Schmitz, Birgit Hofer, Dietmar Jannach, and Franz Wotawa. “Fragment-Based Diagnosis of Spreadsheets”. In: Proceedings of the 3rd InternationalWorkshop on Software Engineering Methods in Spreadsheets (SEMS 2016). 2016
• Kostyantyn Shchekotykhin, Thomas Schmitz, and Dietmar Jannach. “EfficientDetermination of Measurement Points for Sequential Diagnosis”. In: Proceed-
44 Publications

ings of the Joint German/Austrian Conference on Artificial Intelligence (KI 2016).2016
• Kostyantyn Shchekotykhin, Thomas Schmitz, and Dietmar Jannach. “UsingPartial Diagnoses for Sequential Model-Based Fault Localization”. In: Proceed-ings of the 27th International Workshop on Principles of Diagnosis (DX 2016).2016
Publications 45


Avoiding, Finding and Fixing Spreadsheet Errors -
A Survey of Automated Approaches for Spreadsheet QA
Dietmar Jannach1a, Thomas Schmitza, Birgit Hoferb, Franz Wotawab
aTU Dortmund, GermanybTU Graz, Austria
Abstract
Spreadsheet programs can be found everywhere in organizations and they areused for a variety of purposes, including financial calculations, planning, dataaggregation and decision making tasks. A number of research surveys havehowever shown that such programs are particularly prone to errors. Somereasons for the error-proneness of spreadsheets are that spreadsheets are de-veloped by end users and that standard software quality assurance processesare mostly not applied. Correspondingly, during the last two decades, re-searchers have proposed a number of techniques and automated tools aimedat supporting the end user in the development of error-free spreadsheets.In this paper, we provide a review of the research literature and develop aclassification of automated spreadsheet quality assurance (QA) approaches,which range from spreadsheet visualization, static analysis and quality re-ports, over testing and support to model-based spreadsheet development.Based on this review, we outline possible opportunities for future work inthe area of automated spreadsheet QA.
Keywords: Spreadsheet, Quality Assurance, Testing, Debugging
1. Introduction
Spreadsheet applications, based, e.g., on the widespread Microsoft Excelsoftware tool, can nowadays be found almost everywhere and at all levels of
1Corresponding author: D. Jannach ([email protected]), Postal ad-dress: TU Dortmund, 44221 Dortmund, Germany, T: +49 231 755 7272
Preprint submitted to Journal of Systems and Software March 27, 2014

organizations [1]. These interactive computer applications are often devel-oped by non-programmers – that is, domain or subject matter experts – fora number of different purposes including financial calculations, planning andforecasting, or various other data aggregation and decision making tasks.
Spreadsheet systems became popular during the 1980s and represent themost successful example of the End-User Programming paradigm. Theirmain advantage can be seen in the fact that they allow domain experts tobuild their own supporting software tools, which directly encode their do-main expertise. Such tools are usually faster available than other businessapplications, which have to be developed or obtained via corporate IT de-partments and are subject to a company’s standard quality assurance (QA)processes.
Very soon, however, it became obvious that spreadsheets – like any othertype of software – are prone to errors, see, e.g., the early paper by Creeth[2] or the report by Ditlea [3], which were published in 1985 and 1987, re-spectively. More recent surveys on error rates report that in many studieson spreadsheet errors at least one fault was found in every single spreadsheetthat was analyzed [4]. Since in reality even high-impact business decisionsare made, which are at least partially based on faulty spreadsheets, sucherrors can represent a considerable risk to an organization2.
Overall, empowering end users to build their own tools has some advan-tages, e.g., with respect to flexibility, but also introduces additional risks,which is why Panko and Port call them both “dark matter (and energy) ofcorporate IT” [1]. In order to minimize these risks, researchers in differ-ent disciplines have proposed a number of approaches to avoid, detect or fixerrors in spreadsheet applications. In principle, several approaches are possi-ble to achieve this goal, beginning with better education and training of theusers, over organizational and process-related measures such as mandatoryreviews and audits, to better tool support for the user during the spreadsheetdevelopment process. In this paper, we focus on this last type of approaches,in which the spreadsheet developer is provided with additional software toolsand mechanisms during the development process. Such tools can for exam-ple help the developer locate potential faults more effectively, organize the
2See http://www.eusprig.org/horror-stories.htm for a list of real-world stories orthe recent article by Herndorn et al. [5] who found critical spreadsheet formula errors inthe often-cited economic analysis of Reinhart and Rogoff [6].
2

test process in a better structured way, or guide the developer to betterspreadsheet designs in order to avoid faults in the first place. The goals andcontributions of this work are (A) an in-depth review of existing works andthe state-of-the-art in the field, (B) a classification framework for approachesto what we term “automated spreadsheet QA”, and (C) a corresponding dis-cussion of the limitations of existing works and an outline of perspectives forfuture work in this area.
This paper is organized as follows. In Section 2, we will define the scope ofour research, introduce the relevant terminology and discuss the specifics oftypical spreadsheet development processes. Section 3 contains our classifica-tion scheme for approaches to automated spreadsheet QA. In the Sections 4to 9, we will discuss the main ideas of typical works in each category andwe will report how the individual proposals were evaluated. Section 10 re-views the current research practices with respect to evaluation aspects. InSection 11, we point out perspectives for future works and Section 12 sum-marizes this paper.
2. Preliminaries
Before discussing the proposed classification scheme in detail, we willfirst define the scope of our analysis and sketch our research method. Inaddition, we will briefly discuss differences and challenges of spreadsheet QAapproaches in comparison with tool-supported QA approaches for traditionalimperative programs.
2.1. Scope of the analysis, research method, terminology
Spreadsheets are a subject of research in different disciplines includingthe fields of Information Systems (IS) and Computer Science (CS) but alsofields such as Management Accounting or Risk Management, e.g., [2] or [7].
Scope. In our work, we adopt a Computer Science and Software Engineeringperspective, focus on tool support for the spreadsheet development processand develop a classification of automated spreadsheet QA approaches. Ex-amples for such tools could be those that help the user locate faults, e.g.,based on visualization techniques or by directly pointing them to faulty cells,or tools that help the user avoid making faults in the first place, e.g., by sup-porting complex refactoring work. Spreadsheet error reduction techniquesfrom the IS field, see, e.g., [8], and approaches that are mainly based on
3

“manual” tasks like auditing or code inspection will thus not be in the focusof our work.
Research on spreadsheets for example in the field of Information Systemsoften covers additional, more user-related, or fundamental aspects such as er-ror types, error rates and human error research in general, the user interface,cognitive effort and acceptance issues of tools, user over-confidence, as well asmethodological questions regarding the empirical evaluation of systems, see,e.g., [9, 10, 11, 12, 13, 4]. Obviously, these aspects and considerations shouldbe the basis when designing an automated spreadsheet QA tool that shouldbe usable and acceptable by end users. In our work and classification, wehowever concentrate more on the provided functionality and the algorithmicapproaches behind the various tools. We will therefore discuss the underly-ing assumptions for each approach, e.g., with respect to user acceptance orevaluation, only as they are reported in the original papers. Still, in order toassess the overall level of research rigor in the field, we will report for eachclass of approaches how the individual proposals were evaluated or validated.
These insights will be summarized and reviewed in Section 10. In thissection, we will also look at the difficulties of empirically evaluating the truevalue of spreadsheet error reduction techniques according to the literaturefrom the IS field.
Regarding tool support in commercial spreadsheet environments, we willbriefly discuss the existing functionality of MS Excel and comparable systemsin the different sections. Specialized commercial auditing add-ons to MSExcel usually include a number of QA tools. As our work focuses moreon advanced algorithmic approaches to spreadsheet QA, we see the detailedanalysis of current commercial tools to be beyond the scope of this paper.Finally, we will also not cover fault localization or avoidance techniques forthe imperative programming extensions that are typically part of modernspreadsheet environments.
Research method. For creating our survey, we conducted an extensive litera-ture research. Papers about spreadsheets are published in a variety of jour-nals and conference proceedings. However, there exists no publication outletwhich is only concerned with spreadsheets, except maybe for the application-oriented EuSpRIG conference series3. In our research, we therefore followedan approach which consists both of a manual inspection of relevant journals
3http://www.eusprig.org
4

and conference proceedings as well as searches in the digital libraries of ACMand IEEE. Typical outlets for papers on spreadsheets which were inspectedmanually included both broad Software Engineering conferences and journalssuch as ICSE, ACM TOSEM, or IEEE TSE. At the same time, we reviewedpublications at more focused events such as ICSM or the IEEE Symposiumon Visual Languages and Human-Centric Computing (VL/HCC). In addi-tion, major IS journals and events such as Information Systems Research,ACM TOIS or ICIS were considered in our research.
When searching the digital libraries, we started by looking for paperscontaining the term “spreadsheet” in the title or abstract. From the 400to 500 results returned by the search engines of the libraries, we manuallyinspected the abstracts. Provided their scope was relevant for our research,we categorized them according to the categorization framework described inSection 3, and followed the relevant references mentioned in the articles.
Terminology. Regarding the terminology used in the paper, we will use theterms “spreadsheet”, “spreadsheet application”, or “spreadsheet program”more or less interchangeably as often done in the literature. When we refer tothe underlying software system to create spreadsheets (e.g., Microsoft Excel),we will use the term “spreadsheet environment” or “spreadsheet tool”. Insome papers, the term “form-based visual languages” is used [14] to describethe more general family of such systems. In our work, we will however relyon the more widespread term “spreadsheet”.
There are a number of definitions of the terms “error”, “fault”, and “fail-ure” in the literature. According to IEEE standards for Software Engineeringan “error” is a misapprehension on side of the one developing a spreadsheetcaused by a mistake or misconception occurring in the human thought pro-cess. A “fault” is the manifestation of an “error” within a spreadsheet whichmay be causing a “failure”. A “failure” is the deviation of the observed be-havior of the spreadsheet from the expectations. In the literature on spread-sheets, in particular the terms “fault” and “error” are often used in an in-terchangeable manner. Surveys and taxonomies of spreadsheet problems like[15], [16], or [17], for example, more or less only use the term “error”. Inour review, we will – in order to be in line with general Software Engineeringresearch – use the term “fault” instead of “error” whenever appropriate.
5

2.2. Specifics of spreadsheets and their QA toolsThe requirements for automated approaches for spreadsheet QA can be
quite different from those of tools that are used with typical imperative lan-guages. In [14], Rothermel et al. illustrated some of the major differences inthe context of spreadsheet testing. Many of the aspects mentioned in theirwork however do not only hold for the testing domain, but should in gen-eral be taken into account when developing tools supporting the spreadsheetdeveloper.
First, the way in which users interact with a spreadsheet environment islargely different from how programs in imperative languages are developed.In spreadsheets, for example, the user is often constructing a spreadsheetin an unstructured incremental process using some test data. For the giventest data, the user continuously receives visual and immediate feedback. Toincrease the chances of being accepted by developers, any supporting toolshould therefore be designed in a way that it supports such an incrementaldevelopment process. In that context, trying to de-couple the actual imple-mentation tasks from other tasks like testing or design could be problematic.At the same time, being able to provide immediate feedback in the incre-mental process appears to be crucial.
Second, the computation paradigm of spreadsheets is quite different fromimperative programs. The basic nature of spreadsheets is that their compu-tations – the “evaluation” of the program – are driven by data dependenciesbetween cells and explicit control flow statements are only contained in for-mulas in the cells. When designing supporting QA mechanisms and tools,this aspect should be kept in mind. For example, when adapting exist-ing QA approaches from imperative programs to spreadsheet development,there might be different characteristics and quality measures that have to beconsidered. Data dependencies can, for example, be more relevant than thecontrol flow. At the same time, the conceptual model of the users might berather based on the data and formula dependencies than on execution orders.
Third, spreadsheet programs are not only based on a simpler computa-tional model than imperative programs, their “physical” layout – i.e., thespatial arrangement of the labels and formulas – is typically strongly de-termined by the intended computation semantics. This spatial informationcan be used by automatic QA tools, e.g., to detect inconsistencies betweenneighboring cells and to assess the probability of a formula being seman-tically correct, to automatically infer label information, or to rank changesuggestions in goal-directed debugging approaches [18].
6

Finally, developers of spreadsheets are mostly non-professional program-mers. Developers of imperative programs often have a formal training or ed-ucation in software development and are generally aware of the importanceof systematic QA processes. People developing spreadsheets are mostly non-programmers and may have limited interest and awareness when it comesto investing additional efforts in QA activities like testing or refactoring.Therefore, any QA methodology and the corresponding tool support shouldmake it easy for a non-programmer to understand the value of investing theadditional efforts. To cope with this, approaches for spreadsheet QA shouldnot require special training or an understanding of the theory behind theapproach. The used language should avoid special terminology from the un-derlying theory or technique. When discussing the different approaches inthe next sections, we will therefore briefly discuss the approaches from theperspective of usability and what is expected from the end user.
3. A classification of automated approaches to spreadsheet QA
Generally, we classify the various spreadsheet QA approaches into twomain categories depending on their role and use in the development lifecycle.
• “Finding and fixing errors” is about techniques and tools that aremainly designed to help the user detect errors and understand thereasons for the errors. These tools are typically used by the devel-oper or another person, e.g., an auditor or reviewer, during or after theconstruction of the spreadsheet.
• “Avoiding errors” is about techniques and tools that should help thedeveloper create spreadsheets that do not have errors in the first place.These approaches support the creation process of spreadsheets.
In our work, we however aim to develop a finer-grained categorizationscheme to classify the existing approaches to automated spreadsheet QA.The main categories of our proposed scheme are shown in Table 1.
The categories (1) and (2) can serve both the purpose of finding andavoiding errors. A good visualization, for example, of cell dependencies, helpsthe user to spot a problem. At the same time, a visualization can be used tohighlight cells or areas for which there is a high probability that an error willbe made in the future, for example, when there are repetitive structures in thespreadsheet. Static analyses can both identify already existing problems such
7
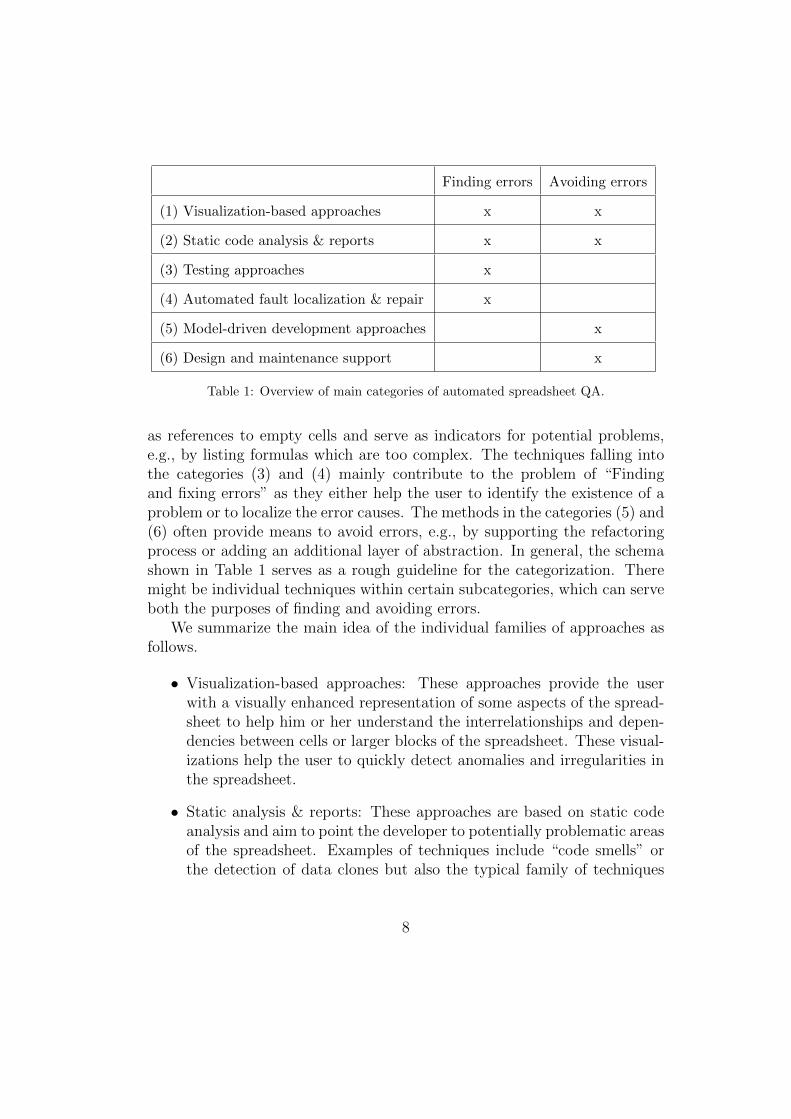
Finding errors Avoiding errors
(1) Visualization-based approaches x x
(2) Static code analysis & reports x x
(3) Testing approaches x
(4) Automated fault localization & repair x
(5) Model-driven development approaches x
(6) Design and maintenance support x
Table 1: Overview of main categories of automated spreadsheet QA.
as references to empty cells and serve as indicators for potential problems,e.g., by listing formulas which are too complex. The techniques falling intothe categories (3) and (4) mainly contribute to the problem of “Findingand fixing errors” as they either help the user to identify the existence of aproblem or to localize the error causes. The methods in the categories (5) and(6) often provide means to avoid errors, e.g., by supporting the refactoringprocess or adding an additional layer of abstraction. In general, the schemashown in Table 1 serves as a rough guideline for the categorization. Theremight be individual techniques within certain subcategories, which can serveboth the purposes of finding and avoiding errors.
We summarize the main idea of the individual families of approaches asfollows.
• Visualization-based approaches: These approaches provide the userwith a visually enhanced representation of some aspects of the spread-sheet to help him or her understand the interrelationships and depen-dencies between cells or larger blocks of the spreadsheet. These visual-izations help the user to quickly detect anomalies and irregularities inthe spreadsheet.
• Static analysis & reports: These approaches are based on static codeanalysis and aim to point the developer to potentially problematic areasof the spreadsheet. Examples of techniques include “code smells” orthe detection of data clones but also the typical family of techniques
8

found in commercial tools capable of detecting circular dependenciesor reporting summaries about unreferenced cells.
• Testing-based techniques: The methods in this category aim to stimu-late and support the developer to systematically test the spreadsheetapplication during or after construction. The supporting tools for ex-ample include mechanisms for test case management, the automatedgeneration of test cases or analysis of the test coverage.
• Automated fault localization & repair: The approaches in this cate-gory rely on a computational analysis of possible causes of an erroror unexpected behavior (algorithmic debugging). They rely on addi-tional input by the developer such as test cases or statements aboutthe correctness of individual cells. Some approaches are also capableof providing “repair” suggestions.
• Model-driven development approaches: Methods in this category mainlyadopt the idea of using (object-oriented) conceptual models as wellas model-driven software development techniques, which are nowadaysquite common in the software industry. The typical advantages of suchapproaches include the introduction of additional layers of abstractionor the use of code-generation mechanisms.
• Design and maintenance support: The approaches in this category ei-ther help the spreadsheet developer to end up with better error-freedesigns or support him or her during spreadsheet construction. Themechanisms proposed in that context for example include automatedrefactoring tools, methods to avoid wrong cell references, and exceptionhandling.
Table 2 outlines the structure of the main sections of the paper.
4. Visualization-based approaches
Visualization-based approaches are helpful in different ways. They can,for example, help a developer or reviewer understand a given spreadsheetand its formulas, so that he or she can check it more easily for potentialerrors or bad design. In addition, visualizations are a good starting point fora reviewer other than the original author of the spreadsheet to understand
9

4. Visualization-basedapproaches
4.1. Dataflow and dependency visualization4.2. Visualization of related areas4.3. Semantic-based visualizations4.4. Information Visualization approaches
5. Static code analysis& reports
5.1. Unit and type inference5.2. Spreadsheet smells5.3. Static analysis in commercial tools
6. Testing approaches 6.1. Test adequacy and test case management6.2. Automated test case generation6.3. Assertion-based testing6.4. Test-driven spreadsheet development
7. Automated fault lo-calization & repair
7.1. Trace-based candidate ranking7.2. Constraint-based fault localization7.3. Repair approaches
8. Model-driven devel-opment approaches
8.1. Declarative spreadsheet models8.2. Spreadsheet templates8.3. Object-oriented visual models8.4. Relational spreadsheet models
9. Design and mainte-nance support
9.1. Reference management9.2. Exception handling9.3. Changes and spreadsheet evolution9.4. Refactoring9.5. Reuse
Table 2: Outline of the main parts of the paper.
its basic structure and the dependencies between the formulas. A typicalapplication scenario is thus the use of visualizations in the auditing process,see, e.g., [19] or [20]. We categorize the different approaches for spreadsheetvisualization from the literature as follows.
4.1. Dataflow and dependency visualization
A number of approaches visualize the dataflow in the spreadsheet and thecorresponding dependencies of the formula cells, see, e.g., [21, 22, 23, 24, 25,
10

26, 27, 28] and [29]. In many cases, arrows are used to represent the usageof a cell in a formula, which is a standard feature of commercial spreadsheetenvironments like MS Excel as shown in Figure 1.
Figure 1: Simple dependency visualization in MS Excel.
One of the earlier works going beyond simple dependency visualizationswas presented by Davis in [19]. In addition to the use of arrows within thespreadsheet to visualize dependencies between cells, spreadsheets are visual-ized as graphs. The graph visualization is based on a spreadsheet descriptionlanguage proposed by Ronen et al. earlier in [30] to model the functionalityof a spreadsheet. In these graphs, the cells correspond to the nodes and edgesrepresent dependencies between cells. Two experiments with users were per-formed in which the new techniques – arrows and graphs – were comparedwith the existing features of MS Excel 3.0. At that time, MS Excel couldonly provide a listing of cell dependencies but had no graphical visualization.In the first experiment, 27 students had to find all dependent cells of a givencell. In the second experiment involving 22 students, the task was to correctan observed fault in a given cell. Overall, both new approaches were foundto be more helpful for the given tasks than the standard functionality of MSExcel. Interestingly, the simple arrow-based approach was outperforming themore complex dependency graph approach.
Another more advanced method for dependency visualization was pre-sented by Igarashi et al. in [21]. In their work, the authors rely on ananimated and interactive visualization approach and “fluid interfaces” togive the user a better understanding of the data flow in the spreadsheet.Advanced animations are used to visualize which cells are input to othercalculations. These animations made it possible to represent comparablycomplex dependencies in a visual form. In addition, users could interactwith the visualizations and thereby manipulate the references through dragand drop operations, e.g., to move references, scale referenced arrays or in-
11

teractively fill areas with formulas. To evaluate their approach, a prototypesystem was built, tested with comparably small spreadsheets and informallydiscussed in their paper. A study with real users and with large spreadsheetswas however not done.
A different approach to visualize complex dependencies in spreadsheetsis to represent parts of the spreadsheet in three-dimensional space as done,e.g., in [22] or [25]. In the approach proposed by Shiozawa et al. [22], forexample, the spreadsheet is rendered in 3D and the user can interactivelymanipulate the visualization and lift cells or groups of cells. The connectedcells are lifted to some extent based on a distance metric, allowing the userto better distinguish between cell dependencies, which are drawn as arrowsin the 3D space. Similar to the work of Igarashi et al. mentioned above,the evaluation of the approach was limited to an informal discussion of aprototype system.
In [23], Chen and Chan proposed additional techniques for cell depen-dency visualization in spreadsheets. One of the main ideas is to visualize thedependencies between larger blocks of formulas in neighboring cells insteadof displaying arrows between individual cells as done, e.g., in MS Excel. Analternative visualization of dependencies between larger blocks of the spread-sheet is proposed by Kankuzi and Ayalew in [26] and [27]. In their approach,the cells are first clustered and the resulting dependencies are then displayedas a tree map in an external window.
A more recent proposal to spreadsheet visualization was made by Her-mans et al. in [28] and [29]. In their approach, the user can inspect thedata flows within the spreadsheet on different levels of detail. On the globalview, only the different worksheets of the spreadsheet and their dependen-cies are shown; on the lowest level, dependencies between individual cellsare displayed. On an intermediate level, the spreadsheet is sliced down tosmaller areas of geometrically adjacent cells. Beside the arrows that are usedto indicate dependencies, their visualization method also displays the math-ematical functions used in the calculations. In [28], Hermans et al. evaluatetheir dataflow visualization in two steps. In the first round, an interviewinvolving 27 subjects about the general usefulness of such diagrams was con-ducted; the second part consisted of 9 observational case studies in which thetask for the participants consisted in transferring or explaining their complexreal-world spreadsheets to another person. The observations during the studyand the qualitative feedback obtained in the post-experiment interviews indi-cated that the proposed techniques are well suited for the task of spreadsheet
12

comprehension and helpful for auditing and validation purposes.
4.2. Visualization of related areas
Different methods and tools for identifying and visualizing semanticallyrelated or structurally similar blocks of cells were proposed in [31, 32, 33, 34].These blocks can be highlighted using different colors to make it easier forthe user to understand the logical structure of the spreadsheet or to identifyirregularities as done in [35].
In the work of Mittermeir and Clermont [31], the concept of “logicalareas” is introduced as a first step in their approach. Such areas can beautomatically identified by looking for structurally similar (equivalent) for-mulas in different areas of the spreadsheet. Such areas are for example theresult of a formula copy operation by the user during the construction pro-cess. Since a preliminary study with a prototype tool on 78 large real-worldspreadsheets revealed that relying on logical areas alone reaches its limitsfor larger spreadsheets, the concept of “semantic classes” was introduced. Inthis semi-automated approach, the user manually specifies related areas inthe spreadsheet. Based on this user-provided input and information aboutthe spatial arrangement of potentially related cells, further reasoning aboutareas with high similarity in the spreadsheet can be performed. The workwas later on improved in [32], where semantic classes were identified based onthe information contained in label cells and a set of heuristics. An alternativemethod for decomposing a given spreadsheet for the purpose of visualizationwas presented in [33, 34]. In that work, the identification of areas is basedon properties of the data flow in the spreadsheet.
Both the approaches proposed in [31] and [33, 34] were discussed in thecorresponding papers using one artificial spreadsheet with a few dozen for-mulas as an example. In [36], Clermont et al. report that the approach from[31] was used to audit real-world spreadsheets, leading to detected error ratesin spreadsheets that are in line with those reported in the literature4. Anevaluation regarding the question to which extent the additional tool sup-port increases the error detection rate or speeds up the inspection processwas however not conducted.
In [20], Sajaniemi proposes two further visualization approaches calledS2 and S3. The basic idea is to detect equivalent formulas in blocks of
4See, e.g., [4], for a discussion of error rates.
13

cells and visualize the dependencies between individual blocks. A theoreticalcomparison with the visualization techniques proposed in [19, 21, 30, 37,38, 39] and the auditing functionality of MS Excel 7.0 was done, showingdifferent advantages of their approaches. Beside the visualization approaches,Sajaniemi’s work represents an interesting methodological contribution, as heproposes a systematic way of theoretically analyzing and comparing differentvisualization techniques.
4.3. Semantic-based visualizations
The missing semantics for the formulas of a spreadsheet, which is causedby the use of numbered cell references instead of information-carrying names,is a well-known problem in spreadsheet research. This was already discussedin an early work by Hendry et al. [37], where they proposed a system forannotating cells in order to describe their semantics.
The work by Chadwick et al. presented in [40] is based on the observa-tion of two typical types of errors that are made by many spreadsheet userswhen creating formulas: (1) formulas sometimes reference the wrong cells asinputs; (2) formulas are sometimes copied incorrectly. To deal with the firstproblem, the authors propose different techniques to make the formulas moreintuitively readable. One of the techniques is for example to transform a for-mula like =SUM(F6:F9) into =SUM(Night Wages Grade1:Night Wages Grade4)
based on cell labels within the spreadsheet. Another idea is to representcomplex formulas in a visual form. For this purpose, the formulas are de-composed, cell references are replaced with readable names and operators aretranslated into natural language such that the logic of the formula can be un-derstood more easily. As a solution to problems arising from wrongly copiedformulas, Chadwick et al. propose to use visual indicators and mark copiedcells and their origin with the same color and add an additional comment tothe original cell.
The different methods of the formula visualization were evaluated througha survey involving 63 students. The students had to rank the methods withrespect to clarity and ease of understanding. The most visual method wasranked first in that survey; interestingly, however, the usual notation of Excelwith cell references was ranked second and was better accepted than theabove-described approach in which cell references were replaced with labels.The visualization that was used to highlight copied formulas was evaluatedthrough a small user study with 5 students. The participants had to constructa spreadsheet and were provided with the additional visualization in that
14

process. The results indicated that the participants liked the approach asthey confirmed its usefulness to check a spreadsheet for correctness.
Nardi and Serrecchia [41] propose a more complex approach to recon-struct the underlying model of the spreadsheet, where a knowledge base isconstructed and reasoning mechanisms are developed to describe calculationpaths of individual cells with descriptive names. Although the approach wasimplemented prototypically, a systematic evaluation was not done.
4.4. Information Visualization approaches
In [42], Brath and Peters apply techniques from the field of InformationVisualization to spreadsheet analysis. These visualizations support the de-veloper in the process of detecting anomalies in the spreadsheet. In contrastto some of the approaches described so far, the aim is thus not to visualizethe data flow or the structures of the spreadsheet but the data itself. To thatpurpose, a 3D representation is proposed, where the cell values are for exam-ple shown as bars instead of numbers. Higher numbers result in higher bars.Using the corresponding tool, the user can navigate through the 3D space,detect outliers or unexpected patterns in the data. The general feasibility ofthe method is informally discussed in the paper based on two case studies5.
In general, a number of techniques from the field of Information Visual-ization, e.g., the “fisheye”-based approach described in [43], can in principlebe applied to visualize large tabular data in spreadsheets for inspection pur-poses. The work of Ballinger et al. [24] is an example for such a work thatrelies, among others, on 3D diagrams and a fisheye view to visualize datadependencies. Overall, however, the number of similar works that rely onInformation Visualization techniques appears to be limited.
4.5. Discussion
Quite a number of proposals have been made in the literature that aimto represent certain aspects of a spreadsheet in visual form. The purposesof the visualization include in particular spreadsheet comprehension, e.g., inan auditing context, and in particular anomaly and error detection.
Regarding the research methodology, only in very few and more recentpapers a systematic and rigorous experimental evaluation of the proposed
5The general idea presented in [42] was later on implemented in a commercial tool byOculusinfo Inc. http://www.oculusinfo.com.
15

methods has been done. In most cases, the validation is limited to qualita-tive interviews or surveys involving a comparably small set of participants orthe informal discussion of prototype systems and individual use cases. Thetrue applicability and usability for end users of many approaches is oftenunclear. Many works in that field would thus benefit if more systematicevaluations and user studies were performed as it is done for example in thefields of Human Computer Interaction and Information Systems. Possibleevaluation approaches for visualization techniques include spreadsheet con-struction, inspection, or understanding exercises as done in IS spreadsheetresearch, e.g., in [9, 10, 44] or [45], but also observational approaches based,e.g., on think-aloud protocols or usage logs.
Regarding practical tools, the market-leading tool MS Excel incorporatesonly a small set of quite simple visualization features for spreadsheet analysisor debugging. Cell dependencies can be visualized as shown in Figure 1 or ascolored rectangles highlighting the referenced cells of a formula. In addition,a small visual clue – a green triangle at the cell border – is displayed whensome of the built-in error checking rules are violated. With respect to theidea of using “semantic” variable names instead of cell references, spreadsheetsystems like MS Excel allow the developer to manually assign names to cellsor areas to make the spreadsheets more comprehensible.
5. Static Analysis and Reports
Static code analysis or reporting-based approaches analyze the formulasof the spreadsheets and show possible faults or bad spreadsheet design thatcan lead to faults in the future. In contrast to automated fault localizationapproaches described in Section 7, the approaches in this category do notuse the values in cells or information from test cases to find errors. Instead,they rather analyze the formulas themselves and the dependencies betweenthem, look at static labels, and determine other structural characteristics ofthe spreadsheets.
5.1. Unit and type Inference
A major research topic in the last decade was related to “unit and typeinference” [46, 47, 48, 49, 50, 51, 52, 53, 54]. The main idea of these ap-proaches is to derive information about the units of the input cells and usethis information to assess if the calculations in the formulas can be plausiblewith respect to the units of the involved cells. To obtain information about
16

a cell’s unit, its headers can be used. Figure 2 shows an example illustratingthe idea [46]. The formulas in cell D3 and D4 can be considered legal. Theycombine apples with oranges, which are both of type fruit. In contrast, C4could be considered illegal, as cells with incompatible units are combined,i.e., apples from May with oranges from June. With the help of such a unitinference mechanism, the semantics of a calculation can be checked for er-rors. The process of deriving the unit information from header cells is calledheader inference.
Figure 2: Unit inference example; adapted from [46].
The idea to use a unit inference system to identify certain kinds of poten-tial errors was introduced by Erwig and Burnett in 2002 [46]. In their initialapproach, a cell could have more than one unit. However, this first workprovided no explicit procedures of how the header inference should be done.In addition, there were some limitations regarding certain operators. Lateron, a header inference approach was proposed in [49], so that the systemcould work without or with limited user interaction. Other improvements tothe basic approach including various forms of more sophisticated reasoningwere put forward in [47, 49, 51, 52, 53, 54]. In [53] and [54], for example,the idea is to do a semantic analysis of the labels in order to map the labelsto known units of measurements. Based on this information, more preciseforms of reasoning about the correctness of the calculations become possible.In contrast to the latter approaches based on semantic analysis of labels, inthe work described in [55] the assumption is that the user manually entersthe units and labels for the input cells and the system is then able to makethe appropriate inferences for the output cells.
The idea of considering relationships between headers (“is-a”, “has-a”),a different reasoning strategy and a corresponding tool capable of process-ing Excel documents were presented in [48] and [50]. The first work for thisapproach [46] included no evaluation. A first small evaluation with 28 spread-sheets was done in [49] to test the header inference and the error detectionmechanism. For both sets of spreadsheets the numbers of detected errors
17

and incorrect header and unit inferences were counted. The header and unitinferences were checked by hand and the system showed good accuracy. Re-garding error detection, the system was capable of finding errors in 7 studentspreadsheets. Since the total number of errors is not reported, no informa-tion about the error detection rate is available. In later papers on the topicincluding [53, 54, 56, 57], the systems were evaluated by comparing themwith previous approaches using the EUSES spreadsheet corpus [58]. Again,the evaluation was done by counting and comparing the detected errors usingdifferent approaches.
5.2. Spreadsheet smells
The term “spreadsheet smells” was derived from code smells in softwaremaintenance [59], where it is used for referring to bad code design. Thesedesigns are not necessarily faults themselves, but can lead to faults during thefuture development of the software, for example, when the software is to berefactored or expanded. A typical example for a code smell is the duplicationof code fragments. If the same part of code is contained several times ina program, it is usually better to place it into a function so that eventualchanges to the code fragment have only to be done once. Duplicated code inaddition makes the code harder to read.
Spreadsheet smells are a comparably recent topic in spreadsheet research.Hermans and colleagues were among the first to adapt the concept of codesmells to the spreadsheet domain, see, e.g., [60, 61, 62]. Similar ideas havealready been proposed earlier in the context of spreadsheet visualization,where heuristics were used to identify irregularities in spreadsheets [35, 42].
In general, spreadsheet smells are heuristics which describe bad designsthat can lead to errors when the spreadsheet is changed or when a new in-stance of it is created with new input data. In [60], Hermans et al. proposeso-called “inter-worksheet smells”. These smells indicate bad spreadsheetdesign based on the analysis of dependencies between different worksheets.If, for example, a formula has too many references to another worksheet,it probably should be moved to that worksheet. In addition to adaptingthe code smells to the spreadsheet domain, Hermans et al. also introducedmetrics to discover these smells and a means to visualize them in their ownworksheet dependency visualization approach [29] (see Section 4.1). “For-mula smells” were discussed in [61]. These smells represent bad designs ofindividual formulas, e.g., when a formula is too complex. Later on, Hermanset al. propose a method for finding data clones in a spreadsheet [62]. To
18

evaluate their spreadsheet smell approach, Hermans et al. performed both aquantitative and a qualitative evaluation in [60]. For the quantitative evalu-ation, the EUSES spreadsheet corpus was searched for the different types ofinter-worksheet spreadsheet smells to understand how frequent these smellsoccur. In the qualitative evaluation, they identified smells in the spreadsheetsof 10 professional spreadsheet developers and discussed the smells with thedevelopers. The evaluation proved that the detected smells point to poten-tial weaknesses in the spreadsheet designs. The same type of evaluation wasdone for the formula smells in [61].
The work of Cunha et al. in [63] is also based on the idea of spreadsheetsmells. In contrast to the works by Hermans et al., they did not aim atadapting known code smells but rather tried to identify spreadsheet-specificsmells by analyzing a larger corpus of spreadsheets.
5.3. Static analysis in commercial tools
Static analysis techniques are often part of commercial spreadsheet en-vironments and spreadsheet auditing tools. As mentioned in Section 4.5,MS Excel, for example, is capable of visualizing “suspicious” formulas. Apre-defined set of rules is checked to determine if a formula is suspicious,e.g., when it refers to an empty cell or when a formula omits cells in a re-gion. Typical spreadsheet auditing tools such as the “Spreadsheet Detective”[64]6 also strongly rely on the identification of such suspicious formulas usingstatic analyses and produce corresponding reports. To identify these formu-las, different heuristics are used, which can take the formula complexity intoaccount, e.g., by checking if there are multiple IF-statements. Other indi-cators include duplicated named ranges or numbers quoted as text. Someaudit tools also comprise mechanisms to support spreadsheet evolution andversioning, e.g., by listing the differences between two variants of the samespreadsheet [65]. An in-depth analysis of these tools is however beyond thescope of our work.
5.4. Discussion
The goal of static analysis techniques usually is to identify formulas orstructural characteristics of spreadsheets which are considered to be indi-cators for potential problems. The accuracy of these methods depends on
6http://www.spreadsheetdetective.com
19

the quality of the error detection heuristics or metrics that are used to de-fine a smell. Generally, such static analysis tools represent a family of errordetection methods which can be found in commercial tools.
Type and unit systems go beyond pure analysis approaches and try toapply additional inferencing to detect additional types of potential problemsand can be considered a lightweight semantic approach. While such infer-encing techniques have the potential of identifying a different class of errors,there is also some danger that they detect too many “false positives”.
From the perspective of the research methodology, both quantitative andqualitative methods are applied in particular in the more recent works. Eval-uations are done using existing document corpora and spreadsheets createdby students or professionals. However, a potential limitation when using theEUSES corpus in that context is that the intended semantics of the formulaswhich are considered faulty by a certain technique are for most formulas notknown. Thus, we cannot determine with certainty if the formula is actu-ally wrong and the technique was successful. From the end-user perspective,many results of a static analysis, e.g., code smells, can be quite easily com-municated and explained to the user.
With respect to “smell” detection based on complex unit inference, Abra-ham et al. [66] conducted a think-aloud study involving 5 subjects. One goalof the study was to evaluate if the users would understand the underlyingconcepts well enough to correct the errors reported by their tool. Their ob-servations indicate that the subjects, who were trained on the topic beforethe experiment, did understand how to interpret the feedback by the tooland correct the unit errors without the need to understand the underlyingreasoning process.
6. Testing approaches
In professional software development processes, systematic testing is cru-cial for ensuring a high quality level of the created software artifacts. Typ-ically, testing activities are performed by different groups of people in thevarious phases of the process; both manual as well as automated test proce-dures are common. As non-professional spreadsheet developers mostly haveno proper education in Software Engineering, the testing process is assumedto be much less structured and systematic. In addition, the developer inmany cases might be the only person that performs any tests.
20

Given the immediate-feedback nature of spreadsheets, testing can be doneby simply typing in some inputs and checking if the intermediate cells andoutput cells contain the expected values. Commercial spreadsheet tools suchas MS Excel do not provide any specific mechanisms to the user for storingsuch test cases or running regression tests. Furthermore, these tools do nothelp the developer assess if a sufficient number of tests has been made. Inthe following, we review approaches that aim at transferring and adaptingideas, concepts, tools and best-practice approaches from standard softwaretesting to the specifics of spreadsheet development.
6.1. Test adequacy and test case management
A number of pioneering works in this area have been done by the re-search group of Burnett, Rothermel and colleagues at Oregon State Univer-sity. Already in 1997, they discussed test strategies and test-adequacy cri-teria for form-based systems and later on proposed a visual and incrementalspreadsheet testing methodology called “What You See Is What You Test”(WYSIWYT) [67, 14, 68]. During the construction of the spreadsheet, theuser can interactively mark the values of some derived cells to be correct forthe currently given inputs. Based on these tests, the system determines the“testedness” of the spreadsheet. This is accomplished through an automaticevaluation of a test adequacy criterion which is based on an abstract model ofthe spreadsheet, spreadsheet-specific “definition-use” (du) associations anddynamic execution traces. Later on, several improvements to this approachwere proposed, such as scaling it up to large homogeneous spreadsheets thatare often found in practice, adding support for recursion, or dealing withquestions of test case reuse [69, 70, 71, 72]. The approach was ported fromForms/3 to Microsoft Excel with additional support of special features suchas higher-order-functions and user defined functions [73]. In [74], Randolphet al. presented an alternative implementation of the WYSIWYT approach,which was designed in a way that it can be used in combination with differentspreadsheet environments.
In [68], the results of a detailed experimental evaluation of the basic ap-proach are reported whose aim was to assess the efficacy of the approach andhow “du-adequate” test suites compare to randomly created tests. In theirevaluations, they used 8 comparably small spreadsheets, in which experi-enced users manually injected a single fault. Then, a number of du-adequateand random pools of test cases were created. The analysis of applying thesetests among other things revealed that the du-adequate pools outperformed
21

random pools of the same size in all cases with respect to their ability ofdetecting the errors. A further study involving 78 subjects in which theefficiency and effectiveness of the approach was tested is described in [75].
6.2. Automated test case generation
When using the WYSIWYT approach, the spreadsheet developer receivesfeedback about how well his or her spreadsheet is tested. Still, the developerhas to specify the test cases manually. To support the user in this process,Fisher et al. proposed techniques for the automated generation of test cases[76, 77].
In these works, two methods for generating values for a test case wereevaluated. The “Random” method randomly generates values and checksif their execution uses a path of a so far unvalidated definition-use pair.The second, goal-oriented method called “Chaining” iterates through theunvalidated definition-use pairs and tries to modify the input values in a waythat both the definition and the use are executed. If the generation of inputvalues for a new test case is successful, the user only has to validate the outputvalue to obtain a complete test case. To assess the effectiveness and efficiencyof their approach an offline simulation-based study without real users basedon 10 comparably small spreadsheets containing only integer type cells wasperformed [77]. The results clearly showed that the “Chaining” method wasmore effective than the “Random” method.
In [78], the AutoTest tool was presented, which implements a differentstrategy for automatic test case generation and uses constraint solving tosearch for values that lead to the execution of the desired definition-use pairs.This method is guaranteed to generate test cases for all feasible definition-use pairs. The method was compared with the previously described methodfrom [77] using the same experimental setup and showed that AutoTest wasboth more effective and could generate the test cases faster.
6.3. Assertion-based testing
A very different approach for users to test and ensure the validity of theirspreadsheets was presented by Burnett et al. in [79]. In this work, the conceptof assertions, which can be found in some imperative languages, was trans-ferred to spreadsheets. Assertions in the spreadsheet domain (called “guards”here) correspond to statements about pre- and post-conditions about allowedcell values in the form of Boolean expressions. The assertions are provided bythe end user through a corresponding user-oriented tool and automatically
22

checked and partially propagated through the spreadsheet in the directionof the dataflow. Whenever a conflict between an assertion and a cell valueor between a user given and a propagated assertion is detected, the user ispointed to this problem through visual feedback.
In [79] and [80] different controlled experiments were performed to evalu-ate the approach. The experimental setup in [79] consisted of a spreadsheettesting and debugging exercise in which 59 subjects participated. About halfof the subjects were using an “assertion-enabled” development environment,whereas the other group used the same system without this functionality.The analysis revealed that assertions helped users to find errors both moreeffectively and efficiently across a range of different error types. A post-experiment questionnaire furthermore showed that the users not only under-stood and liked using the assertions but that assertions are also helpful toreduce the users’ typical over-confidence about the correctness of their pro-gram. Ways of how to extend the concept of guards to multiple cells werediscussed in [81]; a small think-aloud study indicated that such mechanismsmust be carefully designed as the expectations around the reasoning behindsuch complex guards was not consistent across users.
6.4. Test-driven spreadsheet development
Going beyond individual techniques for test case management and testcase generation, McDaid et al. in [82] address the question if the principleof test-driven development (TDD), which received increased attention in theSoftware Engineering community, is applicable in spreadsheet developmentprocesses. Following this principle, the user iteratively creates test cases firstthat define the intended spreadsheets functionality and writes or changesformulas afterwards to fulfill the test. This continuing and systematic formof testing shall help to minimize the number of faults that remain in the finalspreadsheet.
In their work, the authors argue that spreadsheets are well suited forthe TDD principle and present a prototype tool. To evaluate the approach,4 users with different background in spreadsheet expertise and TDD wereasked to develop different spreadsheets and corresponding test cases. Fromthe subsequent interviews, the authors concluded that the approach is easyto use and most of the participants stated that the approach is beneficial,even if the required time for the initial development increased measurably.
23

6.5. Discussion
One of the major problems of end-user programs is that they are usuallynot rigorously tested. As demonstrated through various experimental studies,better tool support during the development process helps users to developspreadsheets with fewer errors. However, commercial spreadsheet systemscontain limited functionality in that direction. MS Excel only provides avery basic data validation tool for describing allowed types and values forindividual cells, which can be seen as a form of assertions.
One problem in that context lies in the design of user interfaces for testtools that are suitable for end users. While in-depth evaluations of the ef-fectiveness of the test case generation or test adequacy were performed asdescribed above, the number of experiments regarding usability aspects withreal users is still somewhat limited. Another main issue is the limited aware-ness of end users regarding the importance and value of thorough testing andtheir overconfidence in the correctness of the programs. More research abouthow to stimulate users to provide more information to the QA process in thesense of [80] is therefore required.
In that context, a better understanding is required in which ways spread-sheet developers actually test their spreadsheets or would be willing to atleast partially adopt a test-driven development principle. In [83], Hermansmade an analysis based on the EUSES corpus which revealed that there are anumber of users who add additional assertions in the form of regular formulasto their spreadsheets. These assertions or tests are however often incompleteand have a low coverage, which led the author to the development of anadd-on tool that automatically points the user to possible improvements forsuch user-specified assertions.
The application of mutation testing techniques to spreadsheet programswas discussed in [84]. Mutation testing consists of introducing small changesto a given program and checking how many of these mutants can be elim-inated by a given set of tests. In their work, Abraham and Erwig proposea set of mutation operators for spreadsheets where some of them are basedon operators that are used for mutating general-purpose languages and someof them are spreadsheet-specific. Generally, mutations can be used to testthe coverage or adequacy of manually or automatically created test suites.In the broader context of fault detection and removal, they can however alsobe used to evaluate debugging approaches as was done in the spreadsheetliterature, e.g., in [85, 86, 87] or [88].
24

7. Automated Fault Localization & Repair
The approaches in this category address scenarios in the developmentprocess, in which the spreadsheet developer enters some test data in thespreadsheet and observes unexpected calculation results in one or more cells.Such situations arise either during the initial development or when one of theabove-mentioned test methodologies is applied. Already for medium-sizedspreadsheets, the set of possible “candidates” that could be the root causeof the unexpected behavior can be large, in particular when the spreadsheetconsists of longer chains of calculations that involve many of the spreadsheet’scells. Without tool support, the user would have to inspect all formulas onwhich the cell with the erroneous value depends and check them for correct-ness. The goal of most of the approaches in this category therefore is to assistthe user in locating the true cause of the problem more efficiently, in manycases by ranking the possible error sources (candidates). Some of the ap-proaches even go beyond that and try to compute a set of possible “repairs”,i.e., changes to some of the formulas to achieve the desired outcomes. Incontrast to static code analysis and inspection approaches, the basis for therequired calculations usually comprises a specification of input values andexpected output values or test cases.
7.1. Trace-based candidate ranking
An early method for candidate ranking which has some similarities tospectrum-based fault localization methods for imperative programs was pre-sented by Reichwein et al. in [89] and [90]. In their method, they firstpropose to transfer the concept of program slicing to spreadsheets in orderto eliminate impossible candidates in an initial step. Their technique usesuser-specified information about correct and incorrect cell values and consid-ers those cells that theoretically contribute to an erroneous cell value to bepossibly faulty. A cell’s formula is more likely to be faulty, if it contributesto more values that are marked as erroneous. Similarly, a formula is morelikely to be correct if it contributes to more correct cell values. If a cellcontributes to an incorrect cell value but the path to it is “blocked” by acell with a correct value, its fault likelihood is assumed to be somewherein between. In later works [91, 92], in which besides two further heuristicsfor fault localization a deeper analysis of the method’s effectiveness factorswere discussed, this technique is called “Blocking Technique”. The “Block-ing Technique” was evaluated in a user study involving 20 subjects in [90].
25

The task of the participants, which were split into two groups of equal size,was to test a given spreadsheet. Both groups were using a tool that imple-mented the WYSIWYT approach. One group additionally had the describedfault localization extension activated. An interview after the experiment andthe analysis of the experiment data showed – among other aspects – thatmost users appreciated the possibility to use the fault localization and theyconsidered it to be particularly useful to locate the “harder” faults.
A similar technique was proposed by Ayalew and Mittermeir in [93], wherefor a faulty cell value the cells are highlighted that have the most influence onit. Later on, Hofer et al. in [87] explicitly proposed to adapt spectrum-basedfault-localization from the traditional programming domain to spreadsheets.In contrast to previous works, they use a more formal approach with simi-larity coefficients to calculate the fault probabilities of the spreadsheet cells.They evaluated their version of spectrum-based fault localization for spread-sheets on a subset of the EUSES spreadsheet corpus and compared the faultlocalization capabilities of spectrum-based fault localization to those of twomodel-based debugging approaches (see Section 7.2).
7.2. Constraint-based fault localization
The following approaches translate a spreadsheet into a constraint-basedrepresentation, such that additional inferences about possible reasons for anunexpected value in some of the cells can be made.
In [94], Jannach and Engler presented an approach in which they firsttranslated the spreadsheet into a Constraint Satisfaction Problem (CSP)[95].Then, based on user-specified test cases and information about unexpectedvalues in some of the cells, they used the principle of Model-Based Diagno-sis (MBD) to determine which cells can theoretically be the true cause forthe observed and unexpected calculation outcomes. With their work, theycontinue a line of research in which the MBD-principle, which was originallydesigned to find problems in hardware artifacts, is adapted for software de-bugging, see, e.g., [96] or [97]. Technically, an approach similar to [97] wasadopted, which is capable of dealing with multiple “positive” and “negative”test cases and at the same time supports the idea of user-provided assertions.
In a first evaluation with relatively small artificial spreadsheets contain-ing a few dozen formulas, it was shown that the approach is – dependingon the provided test cases – able to significantly reduce the number of faultcandidates. Later on, the method was further improved and optimized and
26

embedded in the Exquisite debugging tool for MS Excel [98]. An evalua-tion of the enhanced version on similar examples showed significant enhance-ments with respect to the required calculation time. Mid-sized spreadsheetscontaining about 150 formulas and one injected fault could for example bediagnosed within 2 seconds on a standard laptop computer.
In a later work [88], different algorithmic improvements were proposedwhich helped to increase the scalability of the approach. The method wasevaluated using a number of real-world spreadsheets in which faults whereartificially injected. Furthermore, a small user study in the form of a debug-ging exercise was conducted, which indicated that the users working with theExquisite tool were both more efficient and effective than the group thatdid a manual inspection. The size of the study was however quite small andinvolved only 24 participants.
A similar approach for finding an explanation for unexpected values usinga CSP representation and the MBD-principle has been proposed by Abreuet al. in [99] and [100]. While the general idea is similar to the approachof Jannach and Engler, the technical realization is slightly different. Insteadof using the Hitting-Set Algorithm [101], they encode the reasoning aboutthe correctness of individual formulas directly into the constraint representa-tion. Therefore, they make use of an auxiliary boolean variable for each cellrepresenting the correctness of the cell’s formula. Another difference of thisapproach compared to the work of Jannach and Engler is that Abreu et al.rely on a single test case only. The method was evaluated using four compa-rably small and artificial spreadsheets for which the algorithm could find amanually injected fault very quickly (taking at most 0.17 seconds). In [102],Außerlechner et al. evaluated this constraint-based approach using differentSMT7 and constraint solvers. For their evaluation, they created a specialdocument corpus which both comprised spreadsheets that contain only inte-ger calculations as well as a subset of the EUSES corpus with real numbercalculations. Their evaluation showed that the debugging approach of Abreuet al. can be used to find faults in medium-sized spreadsheets in real-timeand that the approach is capable of debugging spreadsheets containing realnumbers.
In [87], Hofer et al. propose to combine their spectrum-based fault local-ization approach with a light-weight Model-Based Software Debugging tech-
7Satisfiability Modulo Theories
27

nique. In particular, Hofer et al. suggest to use the coefficients obtained fromthe SFL technique as initial probabilities for the model-based debugging pro-cedure. To evaluate the effectiveness of their hybrid method, they comparedtheir approach to a pure spectrum-based approach and a constraint-baseddiagnosis approach. In their experiments, spreadsheets from the EUSESspreadsheet corpus were mutated using a subset of the mutation operatorsproposed in [84]. Overall, 227 mutated spreadsheets containing from 6 toover 4,000 formulas were used in the comparison. The results showed thatthe combined approach led to a better ranking of the potentially faulty cells,but was slightly slower than the pure SFL method.
7.3. Repair approaches
Repair-based approaches do not only point the users to potentially prob-lematic formulas, but also aim to additionally propose possible corrections tothe given formulas in a way that unexpected values in cells can be changedto the expected ones.
A first method for automatically determining such change suggestions(“goal-directed debugging”) was presented by Abraham and Erwig in [85]. Intheir approach, the user states the expected value for an erroneous cell andthe method computes suitable change suggestions by recursively changingindividual formulas and propagating the change back to preceding formulasusing spreadsheet-specific change inference rules. The possible changes thatyield the desired results are then ranked based on heuristics. A revisedand improved version of the method (“GoalDebug”) that is better suitedto address different (artificial) spreadsheet fault types discussed in [84], waspresented in [103]. Later on, GoalDebug was combined with the AutoTestapproach (see Section 6) to further improve the debugging results with thehelp of more test cases and other testing-related information [104].
To test the usefulness of their initial proposal [85], a user study with51 subjects inspecting 2 spreadsheets with seeded faults was conducted. Dur-ing the study, the subjects had to locate the faults using the WYSIWYTapproach (see Section 6.1) but without the goal-directed method. The exper-iment revealed that the users made many mistakes when testing the spread-sheets and that the proposed approach could have prevented these mistakes.Furthermore, all the seeded faults were located with their approach.
GoalDebug was evaluated later on using an offline experiment where faultswere injected into spreadsheets using a set of defined mutation operators.For the experiment, 7500 variants of 15 different spreadsheets with up to 54
28

formulas and 100 cells [84] were created and analyzed. The baseline for theirevaluation was their own previous version of the method. The evaluationshowed that GoalDebug was able to deal with all 9 defined mutation typesand had a “success rate” of finding a correct repair of above 90%, which wasmuch better than the original version of the method.
7.4. Discussion
The effectiveness of the debugging techniques reviewed in this section wasmostly assessed using evaluation protocols in which certain types of faultswere artificially seeded into given spreadsheets. The evaluations showed thatthe proposed techniques either lead to good rankings (of candidates or repairsuggestions) or are able to compute a set of possible explanations. However,the spreadsheets used in the experiments often were small and the scalabil-ity of many approaches remains unclear. Besides, most of the approacheswere evaluated with a non-public set of spreadsheets. Therefore, a directcomparison of the approaches is difficult. In addition, the constraint-basedapproaches are often limited to small spreadsheets and integer calculations.
Unfortunately, “oracle faults” are usually not discussed in the describedapproaches: For all approaches, the spreadsheet developer has to providesome information, e.g., the expected outcomes or which cells produce acorrect output and which cells are erroneous. Most of the approaches areevaluated assuming a perfect user knowing every expected value. However,the spreadsheet developer often does not know all the required informationor might accidentally provide wrong values. Further empirical evaluationsshould therefore consider vague or partly wrong user input.
For some of the proposed techniques, plug-in components for MS Excelhave been developed, including [103] and [98], see Figure 3. Usability aspectsof such tools have however not been systematically explored so far and it isunclear if they are suitable for an average or at least ambitious spreadsheetdeveloper. More research in the sense of [105], where Parnin and Orso eval-uated how and to which extent developers actually use debugging tools forimperative languages, is thus required in the spreadsheet domain.
Debugging support in commercial spreadsheet systems is very limited.Within MS Excel, one of the few features that support the user in the de-bugging process is the “Watch Window” as shown in Figure 4. Similar todebuggers for imperative programs, the spreadsheet developer can definewatchpoints – in this case by selecting certain cells – and the current valuesof the cells are constantly updated and displayed in a compact form.
29

Figure 3: Debugging workbench of the Exquisite system [98]
8. Model-driven development approaches
In contrast to the approaches described in previous chapters, model-driven development approaches were not primarily designed to support theuser in finding potential errors, but rather to improve the quality and struc-ture of the spreadsheets and to prevent errors in the first place. Similar tomodel-driven approaches in the area of general software development, themain idea of these approaches is to introduce another layer of abstraction inthe development process. Typically, the spreadsheet models in this interme-diate layer introduce more abstract conceptualizations of the problem andthus serve as a bridge between the implicit idea, which the developer had of
30

Figure 4: MS Excel’s watch window for cell value inspection
the spreadsheet, and the actual implementation. This way, the semantic gapbetween the intended idea and the spreadsheet implementation, which canbecome large in today’s business spreadsheets [106], can be narrowed.
The abstract spreadsheet models proposed recently in the literature areused in two different phases in the development process. First, they are usedas a form of “code-generators”. In this scenario, parts of the spreadsheetsare automatically generated from the models, thus reducing the risk of me-chanical errors. Second, they are used to recover the underlying conceptualstructures from an existing spreadsheet, which is similar to existing reverseengineering approaches in general software development. Following our clas-sification scheme from Section 3, model-driven development approaches aretherefore usually related to design and maintenance approaches, which wewill discuss later on.
8.1. Declarative and object-oriented spreadsheet models
Isakowitz et al. were among the first to look at spreadsheet programsfrom a modeling perspective [38]. In their work, their main premise is thatspreadsheet programs can be viewed at from a physical and a logical view-point, the physical being the cell’s formulas and values and the logical be-ing a set of functional relations describing the spreadsheets functionality.In their approach, spreadsheets consist of four principal components, amongthem the “schema” which captures the program’s logic and the “data” whichholds the values of the input cells. With the help of tools, this logic canbe automatically extracted from a given spreadsheet and represented in a
31

tool-independent language. In addition, the proposed system is capable ofsynthesizing spreadsheets from such specifications.
A similar object-oriented conceptualization of spreadsheet programs waspresented later on by Paine in [107] and [108]. In the Model Master approach,spreadsheets are specified in a declarative way as text programs. Theseprograms can then be passed to a compiler, which generates spreadsheetsfrom these specifications. The logic of a spreadsheet is organized in thesense of object-oriented programming in the form of classes which encapsulateattributes and the calculation logic, see Figure 5. The comparably simplemodeling language comprises a number of features including inheritance ormulti-dimensional arrays to support tabular calculations.
company = attributes <
incomings [ 1995:2004 ]
outgoings [ 1995:2004 ]
profit [ 1995:2004 ]
>
where
profit[ all t ] = incomings[ t ] - outgoings[ t ]
Figure 5: A class specification in Model Master [107].
Beside the automatic generation of spreadsheets from these models, thesystem also supports the extraction (reconstruction) of models from spread-sheets, which however requires the user to provide additional hints. Theextracted models can be checked for errors or used as a standard for spread-sheet interchange. Particular aspects of structure discovery are discussed in[109]8.
To validate the general feasibility of the approach, different experimentswere made in which small-sized spreadsheets were generated. The test casesused for model reconstruction were even smaller. Unfortunately and similarto the earlier work of Isakowitz et al. [38], no studies with real users wereperformed so far to assess the general usability of the approach at least for
8The work of Lentini et al. [39] is also based on the automatic extraction of themathematical model of a given spreadsheet and a Prolog-based representation. However,their work rather focuses at the generation of a tutoring facility for a given spreadsheetand is thus only marginally relevant for our review.
32

advanced spreadsheet developers.Paine described a different approach for a declarative modeling language
in [110]. Excelsior is a spreadsheet development system which comprises aprogramming language built on Prolog and which is designed for the modularand re-usable specification of Excel spreadsheets. In addition to the stan-dard functionality of Prolog, the programming language comprises specificconstructs and operators to model the logic of a spreadsheet in a modularform. An example for such a specification is given in Figure 6. Based onsuch a design, the layout of the spreadsheet can be separated from its func-tionality and a compiler can be used to automatically generate a spreadsheetinstance from these specifications.
Year[2000] = 2000
Year[2001] = 2001
Sales[2000] = 971
Sales[2001] = 1803
Expenses[2000] = 1492
Expenses[2001] = 1560
Profit[2000] = Sales[2000] - Expenses[2000]
Profit[2001] = Sales[2001] - Expenses[2001]
Layout Year[2000:] as A2 downwards
Layout Expenses[2000:] as B2 downwards
Layout Sales[2000:] as C2 downwards
Layout Profit[2000:] as D2 downwards
Figure 6: A spreadsheet specification in Excelsior [110].
In [111], the functionality of the Excelsior system was tested on a largerspreadsheet. The task was to extract a model, i.e., the logical structure, of aspreadsheet with 10,000 cells and then apply several changes to it with thehelp of Excelsior. After model extraction, refactoring was found to be veryeasy in Excelsior, as only parameters had to be changed to generate a refac-tored and adapted spreadsheet. However, the extraction of the model wasonly semi-automatic and according to the authors took 2 days to complete.Moreover, no systematic evaluation to test the usability of this approach foraverage spreadsheet users was done.
33

8.2. Spreadsheet templates
In contrast to the works of Paine and colleagues, Erwig et al. proposedto rely on a visual and template-based method to capture certain aspectsof the underlying model of a spreadsheet [112, 113, 114]. A “template” intheir Gencel approach can in particular be used to specify repetitive areasin a spreadsheet. Figure 7 shows an example of a template specification.The design of the template can be done using a visualization that is similarto the typical UI paradigm of spreadsheet systems like MS Excel. In theexample, the contents below the column headers B,C, and D are markedas being repetitive. In the model, this is indicated by the missing verticalseparator lines between the column headers and the “. . . ”-symbols betweencolumn and row headers.
Figure 7: Spreadsheet template example; adapted from [114].
Similar to Paine’s work, spreadsheet instances can be automatically gen-erated from models. The generated spreadsheets can furthermore be alteredlater on in predefined ways. The supported operations include the addi-tion or removal of groups of repetitive areas and value updates. Anotherfeature of their approach is the use of a type system. The template-basedapproach also supports a reverse engineering process and the automatic re-construction of templates from a given spreadsheet using certain heuristics[115]. To evaluate their approach, the authors discussed it in terms of the“Cognitive Dimensions of Notations” framework [116, 117] and conducteda small think-aloud study with 4 subjects [112]. Unfortunately, two of thesubjects could not complete the spreadsheet development exercise because oftechnical difficulties; the spreadsheet created by the other participants werehowever error-free.
The template extraction method was evaluated in [115] with the help ofa user study and a sample of 29 randomly selected spreadsheets of the EU-SES spreadsheet corpus. The 23 participating users – 19 novice and 4 expert
34
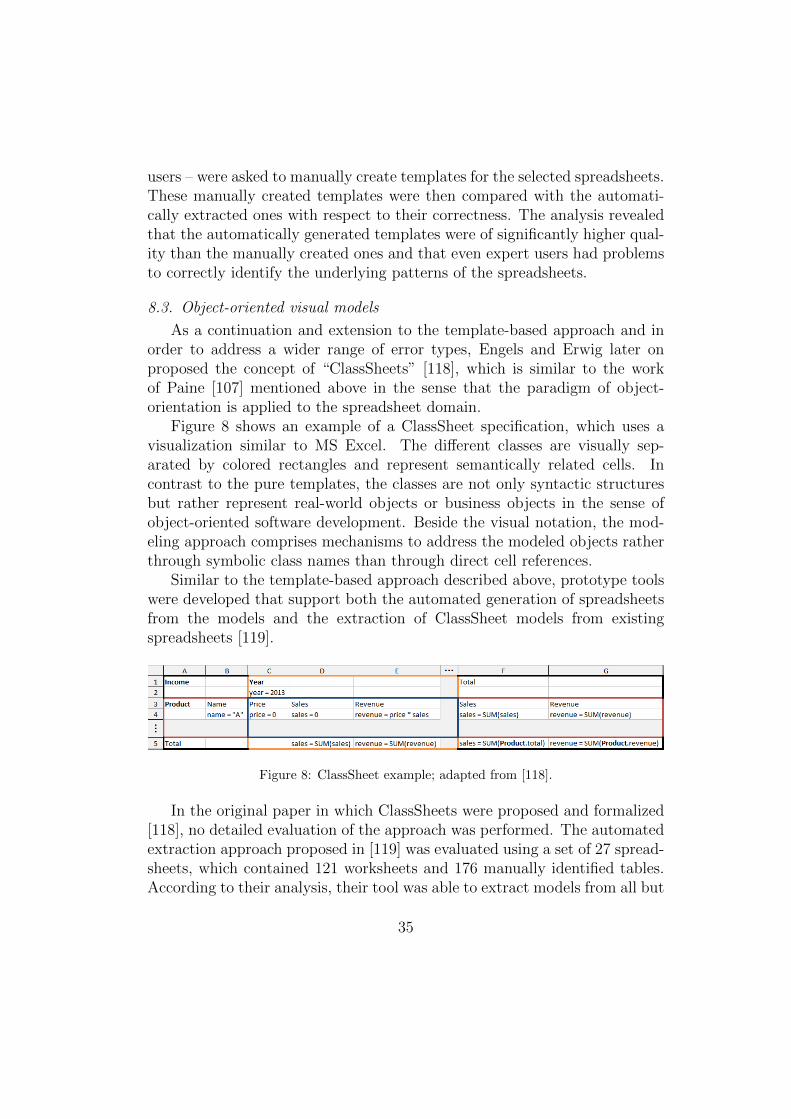
users – were asked to manually create templates for the selected spreadsheets.These manually created templates were then compared with the automati-cally extracted ones with respect to their correctness. The analysis revealedthat the automatically generated templates were of significantly higher qual-ity than the manually created ones and that even expert users had problemsto correctly identify the underlying patterns of the spreadsheets.
8.3. Object-oriented visual models
As a continuation and extension to the template-based approach and inorder to address a wider range of error types, Engels and Erwig later onproposed the concept of “ClassSheets” [118], which is similar to the workof Paine [107] mentioned above in the sense that the paradigm of object-orientation is applied to the spreadsheet domain.
Figure 8 shows an example of a ClassSheet specification, which uses avisualization similar to MS Excel. The different classes are visually sep-arated by colored rectangles and represent semantically related cells. Incontrast to the pure templates, the classes are not only syntactic structuresbut rather represent real-world objects or business objects in the sense ofobject-oriented software development. Beside the visual notation, the mod-eling approach comprises mechanisms to address the modeled objects ratherthrough symbolic class names than through direct cell references.
Similar to the template-based approach described above, prototype toolswere developed that support both the automated generation of spreadsheetsfrom the models and the extraction of ClassSheet models from existingspreadsheets [119].
Figure 8: ClassSheet example; adapted from [118].
In the original paper in which ClassSheets were proposed and formalized[118], no detailed evaluation of the approach was performed. The automatedextraction approach proposed in [119] was evaluated using a set of 27 spread-sheets, which contained 121 worksheets and 176 manually identified tables.According to their analysis, their tool was able to extract models from all but
35

13 tables. The 163 extracted models were then manually inspected. Only 12of the models were categorized as being “bad‘” and 27 as being “acceptable”.The remaining 124 models were found to be “good”.
A number of extensions to the basic ClassSheet approach were later onproposed in the literature. In [106], Luckey et al. addressed the problemof model evolution and how such updates can be automatically transferredto already generated spreadsheets to better support a round-trip engineer-ing process. The same problem of model evolution and the co-evolution ofthe model and the spreadsheet instances was addressed by Cunha et al. in[120, 121]. In [122], Cunha et al. proposed an approach to support the otherupdate direction – the automatic transfer of changes made in the spread-sheet instances back to the spreadsheet model. Further extensions to theClassSheet approach comprise the support of primary and foreign keys asused in relational designs, the generation of UML diagrams from ClassSheetmodels to support model validation or mechanisms to express constraints onallowed values for individual cells [123, 124]. For most of these extensions,no systematic evaluation has been done so far.
A different, in some sense visual approach to re-construct the underly-ing (object-oriented) model was proposed by Hermans et al. in [125]. Theirapproach is based on a library of typical patterns, which they try to lo-cate in spreadsheets with the help of a two-dimensional parsing and patternmatching algorithm. The resulting patterns are then transformed into UMLclass diagrams, which can be used to better understand or improve a givenspreadsheet. For the evaluation of their prototype tool, they first checked theplausibility of their patterns by measuring how often they appear in the EU-SES corpus. Then, for a sample of 50 random spreadsheets, they comparedthe quality of generated class models with manually created ones, which ledto promising results.
8.4. Relational spreadsheet models
One of the main principles of most spreadsheets is that the data is orga-nized in tabular form. An obvious form of trying to obtain a more abstractmodel of the structure of a spreadsheet is to rely on approaches and princi-ples from the design of relational databases. With the goal of ending up inhigher-quality and error-free spreadsheets, Cunha et al. in [126] proposed toextract a relational database schema from the spreadsheet, which shall helpthe user to better understand the spreadsheet and which can consequentlybe used to improve the design of the spreadsheet. The main outcome of such
36

a refactoring process should be a spreadsheet design which is more modu-lar, has no data redundancies and provides suitable means to prevent wrongdata inputs. With respect to the last aspect, Cunha et al. in [127, 128]proposed to use the underlying (extracted) relational schema to provide theuser with advanced editing features including the auto-completion of values,non-editable cells and the safe deletion of rows.
In the original proposal of Cunha et al. [126], no formal evaluation ofthe approach was performed. An evaluation of the model-based approachesproposed in [127] and [126] was however done later on in [129]. In thisuser study, the goal was to assess if relying on the proposed methods canactually help to increase the effectiveness and efficiency of the spreadsheetdevelopment process. The participants of the study had to complete differentdevelopment tasks and these tasks had to be done either on the originalspreadsheet designs or on one of the assumedly improved ones. The results ofthe experiment unfortunately remained partially inconclusive and the resultswere not consistently better when relying on the model-based approaches.
To evaluate the advanced editing features mentioned in [128], a prelimi-nary experiment using a subset of the EUSES spreadsheet corpus was done inthat work. The initial results indicate that the tool is suited to provide help-ful editing assistance for a number of spreadsheets; a more detailed studyabout potential productivity improvements and error rates has so far notbeen done.
8.5. Discussion
The model-driven development approaches discussed in this section aim tointroduce additional syntactic or semantic abstraction layers into the spread-sheet development process. Overall, these additional mechanisms and con-ceptualizations shall help to close the semantic gap between the final spread-sheet and the actual problem in the real world, lead to higher quality levelsin terms of better designs and fewer errors, and allow easier maintenance.Going beyond many model-driven approaches for standard software artifacts,automated “code” generation and support for round-trip engineering are par-ticularly in the focus of spreadsheet researchers.
However, following a model-based approach comes with a number of chal-lenges, which can also be found in standard software development processes.These challenges for example include the problem of the co-evolution of mod-els and programs. Furthermore, the design of the modeling language plays an
37

important role and often a compromise between expressivity and comprehen-sibility has to be made. A particular problem in that context certainly lies inthe fact that the spreadsheet designers usually have no formal IT educationand might have problems understanding the tools or the long-term advan-tages of better abstractions and structures. Furthermore, one of the mainreasons of the popularity of spreadsheets lies in the fact that no structuredor formal development process is required and people are used to developspreadsheets in an ad-hoc, interactive and incremental prototyping process.
From a research perspective, many of the discussed papers only containa preliminary evaluation or no evaluation at all. Thus, a more systematicevaluation and more user studies are required to obtain a better understand-ing if the proposed models are suited for typical spreadsheet developers andif they actually help them to develop spreadsheets of higher quality.
In current spreadsheet environments like MS Excel, only very limitedsupport is provided to visually or semantically enrich the data or the calcu-lations. One of the few features of adding semantics in a light-weight form isthe assignment of symbolic names to individual cells or areas, which increasesthe readability of formulas. In addition, MS Excel provides some featuresfor data organization including the option to group data cells and hide anddisplay them as a block.
9. Design and maintenance support
The following approaches support the user in the development and main-tenance processes. These approaches range from tools whose goal is to avoidwrong references over the handling of exceptional behavior to tools support-ing the long-term use of spreadsheets (e.g., change-monitoring tools, add-insfor automatic refactoring and approaches that handle the reuse of formu-las). All these tools play an important role in spreadsheet quality assuranceas their goal is to avoid faults either by means of a clear and simple rep-resentation, by automation or by dealing with certain types of exceptionalbehavior.
9.1. Reference management
A major drawback of common commercial spreadsheet tools is that theyprovide limited support to ensure the correctness of cell references across thespreadsheet, e.g., because names of referenced cells do not carry semanticinformation about the content. Users often reference the wrong cells because
38

they make off-by-one mistakes when selecting the referenced cell or acciden-tally use relative references instead of absolute references. Identifying suchwrong references can be a demanding task. Even though systems like MSExcel support named cells and areas, most spreadsheet developers use thenumbered and thus abstract cell names consisting of the row and columnindex.
Early approaches to address this problem – including NOPumpG [130,131] and Action Graphics [132] – propose to give up the grid-based paradigmof spreadsheets and force the user to assign explicit names to the “cells”.WYSIWYC (“What you see is what you compute”) [133] is an alternativeapproach which retains the grid-based paradigm and proposes a new visuallanguage for spreadsheets. The approach shall help to make the spreadsheetstructures, calculations and references better visible and thus lead to a bettercorrespondence of a spreadsheet’s visual and logical structure. This shouldhelp to avoid errors caused by wrong cell references.
Unfortunately, while prototype systems have been developed, none ofthe above mentioned techniques have been systematically evaluated, e.g.,through user studies. Therefore, it remains unclear if end users would beable to deal with such alternative development approaches and to whichextent the problem of wrong cell references would actually be solved.
Finally, note that some problems of wrong cell references can be guar-anteed to be avoided when (parts of) the spreadsheets are automaticallygenerated from templates or visual models as done in the Gencel [112] andClassSheet [118] approaches, see Section 8.2 and 8.3. In these systems, cer-tain types of errors including reference errors can be avoided as only definedand correct update operations are allowed.
9.2. Exception Handling
The term exception handling refers to a collection of mechanisms support-ing the detection, signaling and after-the-fact handling of exceptions [134].Exceptions are defined as any unusual event that may require special process-ing [135]. Being aware of possible exceptional situations and handling themaccordingly is an important factor to improve the quality of spreadsheets andmaking them more robust.
In [134], Burnett et al. propose such an approach to exception handlingfor spreadsheets. In their paper, they show that the error value model canbe used for easy and adequate exception handling in spreadsheets. In theerror value model, error messages (like #DIV/0 in MS Excel) are returned
39

instead of the expected values. The advantage of the approach using errorvalues is that no changes to the general evaluation model in the spread-sheet paradigm are necessary. Exception handling approaches for imperativeparadigms, in contrast, usually alter the execution sequence, which is notthe case for spreadsheets with their static evaluation order. In addition, nospecial skills are required by the spreadsheet developers for exception preven-tion and exception handling as they can use the standard language operators(e.g., the if-then-else construct). What makes the approach of Burnett etal. different from the typical error value model in systems like MS Excel isthat it supports customizable error types the end user can define to handleapplication-specific errors. Burnett et al. implemented their exception han-dling approach in the research system Forms/3. However, no evaluation withreal users was done.
9.3. Changes and spreadsheet evolution
Spreadsheets often undergo changes and, unfortunately, changes oftencome with new errors that are introduced. FormulaDataSleuth [136] is atool aimed to help the spreadsheet developer to immediately detect sucherrors when the spreadsheet is changed. Once the developer has specifiedwhich data areas and cells should be monitored by the tool, the systemwill automatically detect a number of potential problems. For the defineddata areas, the tool can for example detect empty cells or input values thathave a wrong data type or exceed the predefined range of allowed values.For monitored formula cells, accidentally overwritten formulas as well asrange changes leading to wrong references can be identified. The authorsdemonstrate the usefulness of their approach by means of a running example.A deeper experimental investigation is however missing.
Understanding how a given spreadsheet evolved over time and seeingthe difference between versions of a spreadsheet is often important when aspreadsheet is reused in a different project. In [137], Chambers et al. proposethe SheetDiff algorithm, which is capable of detecting and visualizing certaintypes of non-trivial differences between two versions of a spreadsheet. Toevaluate the approach, a number of spreadsheets from the EUSES corpuswere selected. Some of them were considered to be modified versions ofeach other. For a number of additional spreadsheets, pre-defined changetypes (e.g., row insertion) were applied. The proposed algorithm was thencompared with two commercial products. As measures, the correct changedetection rate and the compactness of the result presentation were used. The
40

results indicate that the new method is advantageous when compared withexisting tools.
Later on, Harutyunyan et al. in [138] proposed a dynamic-programmingbased algorithm for difference detection called RowColAlign, which addressedexisting problems of the greedy SheetDiff procedure described above. Insteadof relying on manually selected or modified spreadsheets, a parameterizabletest case generation technique was chosen, which allowed the authors toevaluate their method in a more systematic way.
9.4. Refactoring
Refactoring is defined as the process of changing the internal structure ofa program without changing the functionality [139]. Refactoring contributesto the quality of spreadsheets in different ways, for example, by simplify-ing formulas and thus making them easier to understand, and by removingduplicate code thereby supporting easier and less error-prone maintenance.Refactoring in the context of spreadsheets is often concerned with the rear-rangement of the columns and rows, i.e., the transformation of the designof the spreadsheet. Doing this transformation manually can be both time-intensive and prone to errors. Accordingly, different proposals have beenmade in the literature to automate this quality-improving maintenance taskand to thereby prevent the introduction of new errors.
Badame and Dig [140] identify seven refactoring measures for spread-sheets and provide a corresponding plug-in for Microsoft Excel called Ref-Book. The plugin automatically detects the locations for which refactoringis required and supports the user in the refactoring process. Examples forpossible refactoring steps include “Make Cell Constant”, “Guard Cell”, or“Replace Awkward Formula”. Badame and Dig evaluated their approachin different ways. In a survey involving 28 Excel users, the users preferredthe refactored formula versions. In addition, a controlled lab experimentshowed that people introduce faults during manual refactoring which couldbe avoided through automation. A retrospective analysis of spreadsheetsfrom the EUSES corpus was finally done to validate the applicability ofrefactoring operators for real-world spreadsheets.
Harris and Gulwani [141] present an approach that supports complicatedtable transformations using user-specified examples. Their approach is basedon a language for describing table transformations, called TableProg, and thealgorithm ProgFromEx that takes as input a small example of the current
41

spreadsheet and desired output spreadsheet. ProgFromEx automatically in-fers a program that implements the desired transformation. In an empiricalevaluation, Harris and Gulwani applied their algorithm to 51 pairs of spread-sheet examples taken from online help forums for spreadsheets. This empir-ical evaluation proved that the required transformation programs could begenerated for all example spreadsheets. However, sometimes a more detailedexample spreadsheet than the one provided by the users was necessary.
In principle, the Excelsior tool mentioned in Section 8 is also suited tosupport spreadsheet restructuring tasks [111]. Excelsior supports flip andresize operations for tables. In addition, users can create several variantsof a given spreadsheet. In [111], a case study was performed using onespreadsheet with several thousand cells to show the general feasibility ofthe approach. The depth of the evaluation thus considerably differs from theother refactoring approaches discussed in this section, which rely both onuser studies and analyses based on real-world spreadsheets.
9.5. Reuse
In general, reusing existing and already validated software artefacts savestime, avoids the risk of making faults and supports maintainability [142].This obviously also applies for spreadsheet development projects. Individualspreadsheets or parts of them are often reused in other projects. At a micro-level, even individual formulas are often used several times within a singlespreadsheet. The standard solution for the reuse of formulas is to simplycopy and paste the formulas. However, changing the original formula doesnot change its copies and forgotten updates of copied formulas thus can easilylead to faults.
The problem of reuse within spreadsheet programs was addressed byDjang and Burnett [143] and by Montigel [144]. In the approach of Djangand Burnett [143], reuse is mainly achieved through the concept of inher-itance, a reuse approach that is common in object-oriented programming.Their “similarity inheritance” approach is however specifically designed tomatch the spreadsheet paradigm. In principle, it allows the developer tospecify dependencies between (copied) spreadsheet cells in the form of mul-tiple and mutual inheritance both on the level of individual cells and on amore coarse-grained level. The approach is illustrated based on a number ofexamples; an empirical evaluation is mentioned as an important next step.
Montigel [144] proposes the spreadsheet language Wizcell. In particular,Wizcell aims at facilitating reuse by making the possible semantics of copy
42

& paste and drag & drop actions more explicit. In particular, he sees fourpossible outcomes of such actions: (1) Either the copied formula is duplicatedor there is a reference to the original formula. (2) Either the formulas in thecopied cells refer to the cells mentioned in the original cells, or the referencesare changed according to the relative distance of the copy and the origi-nal. The proposed Wizcell language correspondingly allows the developer tospecify the intended semantics, thus reducing the probability of introducinga fault. Similar to the reuse approach presented in [143], no report on anempirical evaluation is provided in [144].
9.6. Discussion
Many of the techniques and approaches presented in this section adaptexisting techniques from traditional Software Engineering to the spreadsheetdomain. In some cases, the authors explicitly address the problem that thebasic spreadsheet development paradigm should not be changed too muchand that the comprehensibility for the end user has to be maintained. How-ever, some approaches require that the developer has a certain understand-ing of non-trivial programming concepts. As end users are usually non-professional programmers, the question of the applicability in practice arises.
Excelsior [111], for example, requires the user to understand conceptsfrom logic programming. Djang and Burnett [143] build their work uponthe concept of inheritance. While this term might not be used in the tooland these details are hidden from the UI through a visual representation,understanding the underlying semantics might be important for the developerto use the tools properly. NOPumpG [130, 131] and Action Graphics [132]use the concept of variables, which might not be known to a spreadsheetuser. It therefore remains partially open whether all of these approachesare suited for end users without programming experience even if comparablysimple visual representations are used.
The exception handling approach of Burnett et al. [134] requires noextended programming skills (except for example simple if-then-else con-structs). Also Harris and Gulwani [141] consider the often limited capabili-ties of spreadsheet developers in their method and propose an example-basedapproach. Badame and Dig [140] rely on a semi-automatic approach and aplug-in to a wide-spread tool like MS Excel.
43

10. Discussion of current research practice
Our review showed that the way the different approaches from the litera-ture are evaluated varies strongly. This can be partially attributed to the factthat research is carried out in different sub-fields of Computer Science as wellas in Information Systems, each having their own standards and protocols.
The following major types of evaluation approaches can be found in theliterature.
1. User studies: The proposed techniques and tools were evaluated inlaboratory or field studies.
2. Empirical studies without users: The approaches were empirically eval-uated, e.g., by applying them on operational spreadsheets or spread-sheets containing artificially injected errors. Such forms of evaluationcan for example show that certain types of faults will be found whenapplying a given method, e.g., [88].
3. Theoretical analyses: Some researchers show by means of theoreticalanalyses that their approaches prevent certain types of errors, e.g.,reference errors [114, 118].
4. No systematic evaluation: In some sub-areas and in particular for someolder proposals, the evaluation was limited to an informal discussionbased on example problems, based on unstructured feedback from asmall group of users, or there was no real evaluation done at all.
Traditionally, research in various sub-fields of Computer Science is oftenbased on offline experimental designs and simulations, whereas user studiesare more common in Information Systems research, see, e.g., [145] for areview of evaluation approaches in the area of recommendation systems. Inmore recent proposals in particular from the Computer Science field, whichis the focus of this work, theoretical or simulation-based analyses are nowmore often complemented with laboratory studies, e.g., in [60] or [88].
Generally, while we observe improvements with respect to research rigorand more systematic evaluations over the last years, in our view the researchpractice in the field can be further improved in different aspects.
10.1. Challenges of empirical evaluation approaches without users
The sample data sets used in offline experimental designs are often said tobe (randomly) taken from the huge and very diverse EUSES corpus. Whichdocuments were actually chosen and which additional criteria were applied
44

is often not well justified. The choice can be influenced for example by thescalability of the proposed method or simply by the capabilities of someparser. Other factors that may influence the observed “success” of a newmethod can be the types or positions of the injected errors. These aspectsare often not well documented and even when the benchmark problems aremade publicly available as in [87], they may have special characteristics thatare required or advantageous for a given method and, e.g., contain only onesingle fault or use only a restricted set of functions or cell data types.
We therefore argue that researchers should report in more detail about thebasis of their evaluations. Otherwise, comparative evaluations are not easilypossible in the field, in particular as source codes or the developed Excelplug-ins are usually not shared in the community. Even though differenttypes of spreadsheets might be required for the different research proposals,one future goal could therefore be to develop a set of defined benchmarkspreadsheets. These can be used and adapted by the research communityand serve as a basis for comparative evaluations, which are barely found incurrent spreadsheet literature.
10.2. Challenges of doing user studies
The more recent works in the field often include reports on different typesof laboratory studies to assess, for example, if users are actually capable ofusing a new tool or, more importantly, if the tool actually helps the usersin the fault identification or removal process. Such studies can be consid-ered to be the main evaluation instrument in IS research and the typicalexperimental designs of such studies include tasks like code inspection andfault localization, error detection and removal, and formula or spreadsheetconstruction.
Conducting reliable user studies, which are done usually in laboratory set-tings, is in general a challenging task even though various standard designs,procedures, and statistical analysis methods exist that are also common, e.g.,in sociobehavioral sciences [146]. A discussion of general properties of validexperimental designs is beyond the scope of this work. However, in our reviewwe observed some typical limitations in the context of spreadsheet research.
First, the number of participants in each “treatment group” – e.g., onegroup with and another group without tool assistance – is often quite small.Various ways including statistical power analysis exist to determine the min-imum number of participants, which can however depend on the goal andtype of the study, the statistical significance criterion used, or the desired
45

confidence level and interval. Typical sample sizes in the literature are forexample 61 participants assigned in two groups [147] or 90 participants thatwere distributed to two groups of different sizes [148].
Additional questions in that context are whether the study participantsare representative for a larger population of spreadsheet users – in [149],students are considered as good surrogates – and how it can be made sure thatthe participants are correctly assigned to the different groups, e.g., based ontheir experience or a random procedure. Finally, the question arises if doingthe experiment in a laboratory setting is not introducing a bias making theevaluation unrealistic. As for the latter aspect, also studies exist in which theparticipants accomplish the tasks at home [150]. In these cases, it is howevereasier for the participants to cheat. In particular for spreadsheet constructionexercises, it has to be considered that the developed spreadsheets can bequite different from real operational spreadsheets, e.g., with respect to theircomplexity [11].
10.3. General remarks
In general, both for user studies and offline experiments in which we useartificially injected errors, the problem exists that we cannot be sure thatthe introduced types of faults are always representative or realistic. Whilea number of studies on error rates exist, Powell et al. [11] argue that it isoften unclear which fault categorization scheme was used or how faults werecounted that were corrected during the construction of the spreadsheet. Itcan thus be dangerous to make inferences about the general efficacy of amethod if it was only evaluated on certain types of faults.
Field studies based on operational spreadsheets and real spreadsheet de-velopers would obviously represent a valuable means to assess the true effi-cacy, e.g., of a certain fault reduction approach. Such reports are howeverrare as they are costly to conduct. The work presented in [148] is an exam-ple of such a study, in which experienced business managers participated andaccomplished a spreadsheet construction exercise. In such settings, however,additional problems arise, e.g., that the participants could not be assignedto different treatment groups randomly as their geographical location had tobe taken into account.
Finally, as in many other research fields, experimental studies are barelyreproduced by other research groups to validate the findings. In addition,the reliability of the reported results can be low, e.g., because of biases by
46

the researchers, weak experimental designs, or questions of the interpretationof the outcomes of statistical tests [151, 152].
Overall, the evaluation of tools and techniques to localize and removefaults in spreadsheets remains a challenging task as it not only involves algo-rithmic questions but at the same time has to be usable by people with a lim-ited background in IT. In many cases, a comprehensive evaluation approachis therefore required which combines the necessary theoretical analysis withuser studies whose design should incorporate the insights from the existingworks, e.g., in the area of IS research or Human Computer Interaction.
11. Perspectives for future works
The literature review has pointed out some interesting new fields of re-search for spreadsheet quality assurance. In the following, we will sketch asubjective selection of possible directions to future works. In the discussion,we will limit ourselves to broader topics and not focus on specific researchopportunities within the different sub-areas.
11.1. Life cycle coverage
Our review shows that a number of proposals have been made to sup-port the developer in various stages of the spreadsheet life cycle includingapplication design and development, testing, debugging, maintenance, com-prehension and reuse. For the early development phases – like domain anal-ysis, requirements specification and the initial design – we have however notfound any proposals for automated tool support. Ko et al. in [153] arguethat these early phases and tasks are mostly not explicitly executed in typi-cal spreadsheet development activities, or more generally, end user program-ming scenarios. In their work, a detailed discussion and analysis of generaldifferences between professional software engineering processes and end usersoftware engineering can be found. Regarding requirements specification, Koet al. for example mention that in contrast to professional software develop-ment, the source of the requirements is the same person as the programmer,e.g., because people often develop spreadsheets for themselves. With respectto design processes, one assumption is that end user programmers might notsee the benefits of making the design an explicit step when translating therequirements into a program.
How to provide better tool support for the very early phases – whichshould ultimately lead to higher-quality spreadsheets in the end – is in our
47

view largely open. Such approaches probably have to be accompanied withorganizational measures and additional training for the end user programmerto raise the awareness of the advantages of a more structured developmentprocess, even if this process is exploratory and prototyping-based in nature.Alternative development approaches such as Example-Driven Modeling [154]or programming by example could be explored as well.
Beside tool support for the early development phases, we see a number ofother areas where existing quality-ensuring or quality-improving techniquescan be applied or further adapted to the spreadsheet domain. This includesbetter quality metrics, formal analysis methods, or techniques for spreadsheetevolution, versioning and “product lines”, which in our view have not beenexplored deeply enough so far.
11.2. Combination of methods
We see a lot of potential for further research in the area of combining dif-ferent specific techniques in hybrid systems. In [86], for example, the authorspropose methods to combine the feedback of the UCheck type checking sys-tem with the results from the WYSIWYT fault localization technique basedon heuristics. An evaluation using various mutations of a spreadsheet showedthat the combination is advantageous, e.g., because different types of faultscan be detected by the two techniques. Other works that integrate differenttypes of information or reasoning strategies include [57, 54, 104] and morerecently [87], who combine declarative debugging with trace-based candidateranking.
Beside the integration of methods to fulfill one particular task, one possi-ble direction of future research is to explore alternative hybridization designs,e.g., to combine methods in a sequential or parallel manner. In such a sce-nario, one computationally cheap method could be used to identify largerregions in the spreadsheet which most probably contain an error. More so-phisticated and computationally demanding techniques could afterwards beapplied within this local area to determine the exact location of the prob-lem. Alternatively, there might be situations in which multiple techniquesare available for a certain task, e.g., to rank the error candidates. Whether ornot a specific technique works well for a given problem setting depends on anumber of factors including the structure and the size of the spreadsheets orthe types of the formulas. A possible future research direction could thereforelie in the development of algorithms which – based on heuristics, past obser-vations, and a concise characterization of the capabilities and requirements
48

of the different techniques – can automatically assess which of the availabletechniques will be the most promising given a specific spreadsheet and task.
11.3. Toward integrated user-friendly tools
Individual research efforts often aim at one particular problem, for exam-ple test support and test case management, propose one particular techniqueand focus on one single optimization criterion such as maximizing the testcoverage. While keeping the work focused is appropriate in the context ofindividual scientific contributions, in reality, the different QA tasks are oftenrelated: a debugging activity, for example, can be initiated by a test activityor a maintenance task. Therefore, to be applicable in practice, one of thegoals of future research is to better understand how integrated tools shouldbe designed that support the developer in the best possible way. Such aresearch could for example include the discussion of suitable user interface(UI) designs, the choice of comprehensible terminology and metaphors, thequestion of the appropriate level of user guidance, the choice of adequatesupporting visualizations, or even questions of how to integrate the toolssmoothly into existing spreadsheet environments.
An example for such an end-user oriented interaction pattern for spread-sheets can be found in [80]. Using a so-called “surprise-explain-reward strat-egy”, the goal of the work is to entice the user to make increased use ofthe assertion feature of the spreadsheet environment without requiring theuser to change his or her usual work process. This is accomplished by au-tomatically generating assertions about cell contents, presenting violationsin the form of passive feedback, and then relying on the user’s curiosity toexplore the potential problems. Beckwith et al. later on continued this workin [155] and investigated gender-specific differences in the adoption of suchnew tool features and proposed different variations of the UI for risk-averseor low confidence users. Finally, another work that builds on psychologicalphenomena to increase tool adoption (and effectiveness) is presented in [156].In this work, the authors focus on the role of the perceivable rewards and ex-periment with UI variants in which the tool’s functionality is identical butthe visual feedback, e.g., in terms of cell coloring is varied.
11.4. Toward a formal spreadsheet language
In the literature, a number of different intermediate representations areused to formally and precisely describe the logic of a given spreadsheet ap-plication. Some of these are based on standard formalisms with defined se-
49

mantics including logic- and constraint-based approaches [110, 88, 99]; otherpapers introduce their own formalisms supporting a specific methodology orvarious forms of reasoning on it [85].
In particular in the latter cases, a precise definition of what can be ex-pressed in these intermediate representations is sometimes missing, for ex-ample, if it is possible to reason about real-valued calculations or which ofthe more complex functions of systems like MS Excel can be expressed whenusing a certain intermediate representation.
In order to be able to better compare and combine different spreadsheetQA techniques in hybrid approaches as discussed above, a unified formalspreadsheet representation, problem definition language, or even a “theoryof spreadsheets” could be useful. It would furthermore help making researchefforts independent of specific environments or tool versions and at the sametime allow for formal reasoning, e.g., about the soundness and completenessof individual fault localization techniques. Such problem definition languagesare for example common in other domains such as Artificial Intelligence basedplanning or Constraint Satisfaction.
11.5. Provision of better abstraction mechanisms
In [157], Peyton Jones et al. argue that spreadsheets in their basic formcan be considered as functional programs that only consist of statementscomprising built-in functions. Thus, spreadsheet developers have no meansto define reusable abstractions in the form of parameterizable functions. Toimplement the desired functionality, users therefore have to copy the formu-las multiple times, which however leads to poor maintainability and lowerspreadsheet quality. As a potential solution, the authors propose a user-oriented approach to design user-defined functions. A main goal of the designis to stay within the spreadsheet paradigm, which for example means thatthe function implementations should be specified as spreadsheets (“functionsheets”) and not in the form of imperative programs as done in MS Excel.The work presented in [157] was mostly based on theoretical considerations.In their evaluation, the authors mainly focus on the expressiveness of the lan-guage and performance aspects. So far, no evaluation investigating if usersare able to understand the concepts of how to define function sheets or tointerpret error messages has been done.
Later on, Sestoft [158] presented a practical realization of the approachthat includes recursion and higher-order functions. To design and use new
50

function sheets in their prototype system called “Funcalc”, the spreadsheetdeveloper has to learn only three new built-in functions.
Both function sheets and the more recent ClassSheets as described inSection 8.3 represent approaches to empower spreadsheet developers withbetter abstraction mechanisms within the spreadsheet paradigm. As a result,these approaches should help users avoid making different types of faults andincrease the general quality of the spreadsheets. Overall, we see the provisionof such advanced concepts for spreadsheet design and implementation asa promising area for future research, where in particular the questions ofunderstandability for the end user should be further investigated.
12. Summary
Errors in spreadsheet programs can have a huge impact on organizations.Unfortunately, current spreadsheet environments like MS Excel only includelimited functionality to help developers create error-free spreadsheets or sup-port them in the error detection and localization process. Over the lastdecades, researches in different subfields of Computer Science and Informa-tion Systems have therefore made a substantial number of proposals aimedat better tool support for spreadsheet developers during the developmentlifecycle.
With our literature review and the presented classification scheme weaimed to provide a basis to structure and relate the different strands of re-search in this area and critically reflected on current research practices. Atthe same time, the review and classification scheme should help to identifypotential directions for future research and opportunities for combining dif-ferent proposals, thereby helping to move from individual techniques andtools to integrated spreadsheet QA environments.
Acknowledgements
This work was partially supported by the European Union through theprogramme “Europaischer Fonds fur regionale Entwicklung - Investition inunsere Zukunft” under contract number 300251802.
References
[1] R. R. Panko, D. N. Port, End User Computing: The Dark Matter (andDark Energy) of Corporate IT, in: Proceedings of the 45th Hawaii
51

International Conference on System Sciences (HICSS 2012), Wailea,HI, USA, 2012, pp. 4603–4612.
[2] R. Creeth, Micro-Computer Spreadsheets: Their Uses and Abuses,Journal of Accountancy 159 (6) (1985) 90–93.
[3] S. Ditlea, Spreadsheets can be hazardous to your health, Personal Com-puting 11 (1) (1987) 60–69.
[4] R. R. Panko, What We Know About Spreadsheet Errors, Journal ofEnd User Computing 10 (2) (1998) 15–21.
[5] T. Herndon, M. Ash, R. Pollin, Does High Public Debt ConsistentlyStifle Economic Growth? A Critique of Reinhart and Rogoff, WorkingPaper 322, Political Economy Research Institute, University of Mas-sachusetts, Amherst (April 2013).
[6] C. M. Reinhart, K. S. Rogoff, Growth in a Time of Debt, AmericanEconomic Review 100 (2) (2010) 573–578.
[7] D. F. Galletta, D. Abraham, M. E. Louadi, W. Lekse, Y. A. Pollalis,J. L. Sampler, An empirical study of spreadsheet error-finding perfor-mance, Accounting, Management and Information Technologies 3 (2)(1993) 79–95.
[8] S. Thorne, A review of spreadsheet error reduction techniques, Com-munications of the Association for Information Systems 25, Article 24.
[9] T. Reinhardt, N. Pillay, Analysis of Spreadsheet Errors Made by Com-puter Literacy Students, in: Proceedings of the IEEE InternationalConference on Advanced Learning Technologies (ICALT 2004), Joen-suu, Finland, 2004, pp. 852–853.
[10] D. F. Galletta, K. S. Hartzel, S. E. Johnson, J. L. Joseph, S. Rustagi,Spreadsheet Presentation and Error Detection: An ExperimentalStudy, Journal of Management Information Systems 13 (3) (1996) 45–63.
[11] S. G. Powell, K. R. Baker, B. Lawson, A critical review of the literatureon spreadsheet errors, Decision Support Systems 46 (1) (2008) 128–138.
52

[12] H. Howe, M. G. Simkin, Factors Affecting the Ability to Detect Spread-sheet Errors, Decision Sciences Journal of Innovative Education 4 (1)(2006) 101–122.
[13] J. R. Olson, E. Nilsen, Analysis of the Cognition Involved in Spread-sheet Software Interaction, Human-Computer Interaction 3 (4) (1987)309–349.
[14] G. Rothermel, L. Li, C. Dupuis, M. Burnett, What You See Is WhatYou Test: A Methodology for Testing Form-Based Visual programs,in: Proceedings of the 20th International Conference on Software En-gineering (ICSE 1998), Kyoto, Japan, 1998, pp. 198–207.
[15] R. R. Panko, R. P. Halverson, Spreadsheets on Trial: A Survey ofResearch on Spreadsheet Risks, in: Proceedings of the 29th HawaiiInternational Conference on System Sciences (HICSS 1996), Wailea,HI, USA, 1996, pp. 326–335.
[16] K. Rajalingham, D. R. Chadwick, B. Knight, Classification of Spread-sheet Errors, in: Proceedings of the European Spreadsheet Risks In-terest Group 2nd Annual Conference (EuSpRIG 2001), Amsterdam,Netherlands, 2001.
[17] R. R. Panko, S. Aurigemma, Revising the Panko-Halverson taxonomyof spreadsheet errors, Decision Support Systems 49 (2) (2010) 235–244.
[18] M. Erwig, Software engineering for spreadsheets, IEEE Software 26 (5)(2009) 25–30.
[19] J. Davis, Tools for spreadsheet auditing, International Journal ofHuman-Computer Studies 45 (4) (1996) 429–442.
[20] J. Sajaniemi, Modeling Spreadsheet Audit: A Rigorous Approach toAutomatic Visualization, Journal of Visual Languages & Computing11 (1) (2000) 49–82.
[21] T. Igarashi, J. Mackinlay, B.-W. Chang, P. Zellweger, Fluid Visualiza-tion of Spreadsheet Structures, in: Proceedings of the IEEE Sympo-sium on Visual Languages (VL 1998), Halifax, NS, Canada, 1998, pp.118–125.
53

[22] H. Shiozawa, K. Okada, Y. Matsushita, 3D Interactive Visualizationfor Inter-Cell Dependencies of Spreadsheets, in: Proceedings of theIEEE Symposium on Information Visualization (Info Vis 1999), SanFrancisco, CA, USA, 1999, pp. 79–82, 148.
[23] Y. Chen, H. C. Chan, Visual Checking of Spreadsheets, in: Proceed-ings of the European Spreadsheet Risks Interest Group 1st AnnualConference (EuSpRIG 2000), London, United Kingdom, 2000.
[24] D. Ballinger, R. Biddle, J. Noble, Spreadsheet visualisation to improveend-user understanding, in: Proceedings of the Asia-Pacific Symposiumon Information Visualisation - Volume 24 (APVIS 2003), Adelaide,Australia, 2003, pp. 99–109.
[25] K. Hodnigg, R. T. Mittermeir, Metrics-Based Spreadsheet Visualiza-tion: Support for Focused Maintenance, in: Proceedings of the Euro-pean Spreadsheet Risks Interest Group 9th Annual Conference (Eu-SpRIG 2008), London, United Kingdom, 2008, pp. 79–94.
[26] B. Kankuzi, Y. Ayalew, An End-User Oriented Graph-Based Visu-alization for Spreadsheets, in: Proceedings of the 4th InternationalWorkshop on End-User Software Engineering (WEUSE 2008), Leipzig,Germany, 2008, pp. 86–90.
[27] Y. Ayalew, A Visualization-based Approach for Improving SpreadsheetQuality, in: Proceedings of the Warm Up Workshop for ACM/IEEEICSE 2010 (WUP 2009), Cape Town, South Africa, 2009, pp. 13–16.
[28] F. Hermans, M. Pinzger, A. van Deursen, Supporting ProfessionalSpreadsheet Users by Generating Leveled Dataflow Diagrams, in: Pro-ceedings of the 33rd International Conference on Software Engineering(ICSE 2011), Waikiki, Honolulu, HI, USA, 2011, pp. 451–460.
[29] F. Hermans, M. Pinzger, A. van Deursen, Breviz: Visualizing Spread-sheets using Dataflow Diagrams, in: Proceedings of the EuropeanSpreadsheet Risks Interest Group 12th Annual Conference (EuSpRIG2011), London, United Kingdom, 2011.
[30] B. Ronen, M. A. Palley, H. C. Lucas, Jr., Spreadsheet Analysis andDesign, Communications of the ACM 32 (1) (1989) 84–93.
54

[31] R. Mittermeir, M. Clermont, Finding High-Level Structures in Spread-sheet Programs, in: Proceedings of the 9th Working Conference onReverse Engineering (WCRE 2002), Richmond, VA, USA, 2002, pp.221–232.
[32] S. Hipfl, Using Layout Information for Spreadsheet Visualization, in:Proceedings of the European Spreadsheet Risks Interest Group 5thAnnual Conference (EuSpRIG 2004), Klagenfurt, Austria, 2004.
[33] M. Clermont, Analyzing Large Spreadsheet Programs, in: Proceedingsof the 10th Working Conference on Reverse Engineering (WCRE 2003),Victoria, BC, Canada, 2003, pp. 306–315.
[34] M. Clermont, A Toolkit for Scalable Spreadsheet Visualization, in: Pro-ceedings of the European Spreadsheet Risks Interest Group 5th AnnualConference (EuSpRIG 2004), Klagenfurt, Austria, 2008.
[35] M. Clermont, Heuristics for the Automatic Identification of Irregulari-ties in Spreadsheets, in: Proceedings of the 1st Workshop on End-UserSoftware Engineering (WEUSE 2005), St. Louis, MO, USA, 2005, pp.1–6.
[36] M. Clermont, C. Hanin, R. T. Mittermeir, A Spreadsheet Auditing ToolEvaluated in an Industrial Context, in: Proceedings of the EuropeanSpreadsheet Risks Interest Group 3rd Annual Conference (EuSpRIG2002), Cardiff, United Kingdom, 2002.
[37] D. Hendry, T. Green, CogMap: a Visual Description Language forSpreadsheets, Journal of Visual Languages & Computing 4 (1) (1993)35–54.
[38] T. Isakowitz, S. Schocken, H. C. Lucas, Jr., Toward a Logical / PhysicalTheory of Spreadsheet Modeling, Transactions on Information Systems13 (1) (1995) 1–37.
[39] M. Lentini, D. Nardi, A. Simonetta, Self-instructive spreadsheets: anenvironment for automatic knowledge acquisition and tutor generation,International Journal of Human-Computer Studies 52 (5) (2000) 775–803.
55

[40] D. Chadwick, B. Knight, K. Rajalingham, Quality Control in Spread-sheets: A Visual Approach using Color Codings to Reduce Errors inFormulae, Software Quality Control 9 (2) (2001) 133–143.
[41] D. Nardi, G. Serrecchia, Automatic Generation of Explanations forSpreadsheet Applications, in: Proceedings of the 10th Conference onArtificial Intelligence for Applications (CAIA 1994), San Antonio, TX,USA, 1994, pp. 268–274.
[42] R. Brath, M. Peters, Excel Visualizer: One Click WYSIWYG Spread-sheet Visualization, in: Proceedings of the 10th International Confer-ence on Information Visualisation (IV 2006), London, United Kingdom,2006, pp. 68–73.
[43] R. Rao, S. K. Card, The Table Lens: Merging Graphical and Sym-bolic Representations in an Interactive Focus+Context Visualizationfor Tabular Information, in: Proceedings of the SIGCHI Conference onHuman Factors in Computing Systems (CHI 1994), Boston, MA, USA,1994, pp. 318–322.
[44] P. S. Brown, J. D. Gould, An Experimental Study of People CreatingSpreadsheets, ACM Transactions on Information Systems 5 (3) (1987)258–272.
[45] S. Aurigemma, R. R. Panko, The Detection of Human SpreadsheetErrors by Humans versus Inspection (Auditing) Software, in: Proceed-ings of the European Spreadsheet Risks Interest Group 11th AnnualConference (EuSpRIG 2010), London, United Kingdom, 2010.
[46] M. Erwig, M. M. Burnett, Adding Apples and Oranges, in: Proceedingsof the 4th International Symposium on Practical Aspects of DeclarativeLanguages (PADL 2002), Portland, OR, USA, 2002, pp. 173–191.
[47] M. Burnett, M. Erwig, Visually Customizing Inference Rules AboutApples and Oranges, in: Proceedings of the IEEE Symposia on Hu-man Centric Computing Languages and Environments (HCC 2002),Arlington, VA, USA, 2002, pp. 140–148.
[48] Y. Ahmad, T. Antoniu, S. Goldwater, S. Krishnamurthi, A Type Sys-tem for Statically Detecting Spreadsheet Errors, in: Proceedings of the
56

18th IEEE/ACM International Conference on Automated Software En-gineering (ASE 2003), Montreal, Canada, 2003, pp. 174–183.
[49] R. Abraham, M. Erwig, Header and Unit Inference for SpreadsheetsThrough Spatial Analyses, in: Proceedings of the IEEE Symposiumon Visual Languages and Human Centric Computing (VL/HCC 2004),Rome, Italy, 2004, pp. 165–172.
[50] T. Antoniu, P. Steckler, S. Krishnamurthi, E. Neuwirth, M. Felleisen,Validating the Unit Correctness of Spreadsheet Programs, in: Pro-ceedings of the 26th International Conference on Software Engineering(ICSE 2004), Edinburgh, United Kingdom, 2004, pp. 439–448.
[51] R. Abraham, M. Erwig, Type Inference for Spreadsheets, in: Proceed-ings of the 8th ACM SIGPLAN International Conference on Principlesand Practice of Declarative Programming (PPDP 2006), Venice, Italy,2006, pp. 73–84.
[52] R. Abraham, M. Erwig, UCheck: A Spreadsheet Type Checker for EndUsers, Journal of Visual Languages & Computing 18 (1) (2007) 71–95.
[53] C. Chambers, M. Erwig, Automatic Detection of Dimension Errors inSpreadsheets, Journal of Visual Languages & Computing 20 (4) (2009)269–283.
[54] C. Chambers, M. Erwig, Reasoning About Spreadsheets with Labelsand Dimensions, Journal of Visual Languages & Computing 21 (5)(2010) 249–262.
[55] M. J. Coblenz, A. J. Ko, B. A. Myers, Using objects of measurementto detect spreadsheet errors, in: Proceedings of the IEEE Symposiumon Visual Languages and Human Centric Computing (VL/HCC 2005),2005, pp. 314–316.
[56] C. Chambers, M. Erwig, Dimension Inference in Spreadsheets, in: Pro-ceedings of the IEEE Symposium on Visual Languages and HumanCentric Computing (VL/HCC 2008), Herrsching am Ammersee, Ger-many, 2008, pp. 123–130.
[57] C. Chambers, M. Erwig, Combining Spatial and Semantic Label Anal-ysis, in: Proceedings of the IEEE Symposium on Visual Languages
57

and Human Centric Computing (VL/HCC 2009), Corvallis, OR, USA,2009, pp. 225–232.
[58] M. Fisher, G. Rothermel, The EUSES Spreadsheet Corpus: A sharedresource for supporting experimentation with spreadsheet dependabil-ity mechanisms, SIGSOFT Software Engineering Notes 30 (4) (2005)1–5.
[59] M. Fowler, Refactoring: Improving the Design of Existing Code,Addison-Wesley Professional, 1999.
[60] F. Hermans, M. Pinzger, A. van Deursen, Detecting and VisualizingInter-Worksheet Smells in Spreadsheets, in: Proceedings of the 34thInternational Conference on Software Engineering (ICSE 2012), Zurich,Switzerland, 2012, pp. 441–451.
[61] F. Hermans, M. Pinzger, A. van Deursen, Detecting Code Smells inSpreadsheet Formulas, in: Proceedings of the 28th IEEE InternationalConference on Software Maintenance (ICSM 2012), Riva del Garda,Trento, Italy, 2012, pp. 409–418.
[62] F. Hermans, B. Sedee, M. Pinzger, A. v. Deursen, Data Clone Detec-tion and Visualization in Spreadsheets, in: Proceedings of the 35thInternational Conference on Software Engineering (ICSE 2013), SanFrancisco, CA, USA, 2013, pp. 292–301.
[63] J. Cunha, J. a. P. Fernandes, H. Ribeiro, J. a. Saraiva, Towards a Cat-alog of Spreadsheet Smells, in: Proceedings of the 12th InternationalConference on Computational Science and Its Applications (ICCSA2012), Salvador de Bahia, Brazil, 2012, pp. 202–216.
[64] D. Nixon, M. O’Hara, Spreadsheet Auditing Software, in: Proceed-ings of the European Spreadsheet Risks Interest Group 2nd AnnualConference (EuSpRIG 2001), Amsterdam, Netherlands, 2001.
[65] J. Hunt, An approach for the automated risk assessment of structuraldifferences between spreadsheets (diffxl), in: Proceedings of the Euro-pean Spreadsheet Risks Interest Group 10th Annual Conference (Eu-SpRIG 2009), Paris, France, 2009.
58

[66] R. Abraham, M. Erwig, S. Andrew, A type system based on end-user vocabulary, in: Proceedings of the IEEE Symposium on VisualLanguages and Human-Centric Computing (VL/HCC 2007), Coeurd’Alene, Idaho, USA, 2007, pp. 215–222.
[67] G. Rothermel, L. Li, M. Burnett, Testing Strategies for Form-BasedVisual Programs, in: Proceedings of the 8th International Symposiumon Software Reliability Engineering (ISSRE 1997), Albuquerque, NM,USA, 1997, pp. 96–107.
[68] G. Rothermel, M. Burnett, L. Li, C. Dupuis, A. Sheretov, A Method-ology for Testing Spreadsheets, ACM Transactions on Software Engi-neering and Methodology 10 (1) (2001) 110–147.
[69] M. Burnett, A. Sheretov, G. Rothermel, Scaling Up a ”What You See IsWhat You Test” Methodology to Spreadsheet Grids, in: Proceedings ofthe IEEE Symposium on Visual Languages (VL 1999), Tokyo, Japan,1999, pp. 30–37.
[70] M. Burnett, A. Sheretov, B. Ren, G. Rothermel, Testing HomogeneousSpreadsheet Grids with the ”What You See Is What You Test” Method-ology, IEEE Transactions on Software Engineering 28 (6) (2002) 576–594.
[71] M. Burnett, B. Ren, A. Ko, C. Cook, G. Rothermel, Visually TestingRecursive Programs in Spreadsheet Languages, in: Proceedings of theIEEE Symposia on Human-Centric Computing Languages and Envi-ronments (HCC 2001), Stresa, Italy, 2001, pp. 288–295.
[72] M. Fisher, II, D. Jin, G. Rothermel, M. Burnett, Test Reuse in theSpreadsheet paradigm, in: Proceedings of the 14th International Sym-posium on Software Reliability Engineering (ISSRE 2003), Denver, CO,USA, 2002, pp. 257–268.
[73] M. Fisher, G. Rothermel, T. Creelan, M. Burnett, Scaling a DataflowTesting Methodology to the Multiparadigm World of CommercialSpreadsheets, in: Proceedings of the 17th International Symposiumon Software Reliability Engineering (ISSRE 2006), Raleigh, NC, USA,2006, pp. 13–22.
59

[74] N. Randolph, J. Morris, G. Lee, A Generalised Spreadsheet VerificationMethodology, in: Proceedings of the 25th Australasian Conference onComputer Science (ACSC 2002), 2002, pp. 215–222.
[75] K. Rothermel, C. Cook, M. Burnett, J. Schonfeld, T. R. G. Green,G. Rothermel, WYSIWYT Testing in the Spreadsheet Paradigm: AnEmpirical Evaluation, in: Proceedings of the 22nd International Con-ference on Software Engineering (ICSE 2000), Limerick, Ireland, 2000,pp. 230–239.
[76] M. Fisher, II, M. Cao, G. Rothermel, C. Cook, M. Burnett, AutomatedTest Case Generation for Spreadsheets, in: Proceedings of the 24th In-ternational Conference on Software Engineering (ICSE 2002), Orlando,FL, USA, 2002, pp. 141–151.
[77] M. Fisher, II, G. Rothermel, D. Brown, M. Cao, C. Cook, M. Burnett,Integrating Automated Test Generation into the WYSIWYT Spread-sheet Testing Methodology, ACM Transactions on Software Engineer-ing and Methodology 15 (2) (2006) 150–194.
[78] R. Abraham, M. Erwig, AutoTest: A Tool for Automatic Test CaseGeneration in Spreadsheets, in: Proceedings of the IEEE Symposiumon Visual Languages and Human-Centric Computing (VL/HCC 2006),Brighton, United Kingdom, 2006, pp. 43–50.
[79] M. Burnett, C. Cook, O. Pendse, G. Rothermel, J. Summet, C. Wal-lace, End-User Software Engineering with Assertions in the Spread-sheet Paradigm, in: Proceedings of the 25th International Conferenceon Software Engineering (ICSE 2003), Portland, Oregon, 2003, pp. 93–103.
[80] A. Wilson, M. Burnett, L. Beckwith, O. Granatir, L. Casburn, C. Cook,M. Durham, G. Rothermel, Harnessing Curiosity to Increase Correct-ness in End-User Programming, in: Proceedings of the SIGCHI Con-ference on Human Factors in Computing Systems (CHI 2003), 2003,pp. 305–312.
[81] L. Beckwith, M. Burnett, C. Cook, Reasoning about Many-to-ManyRequirement Relationships in Spreadsheets, in: Proceedings of the
60

IEEE Symposia on Human Centric Computing Languages and Envi-ronments (HCC 2002), Arlington, VA, USA, 2002, pp. 149–157.
[82] K. McDaid, A. Rust, B. Bishop, Test-Driven Development: Can itWork for Spreadsheets?, in: Proceedings of the 4th International Work-shop on End-User Software Engineering (WEUSE 2008), Leipzig, Ger-many, 2008, pp. 25–29.
[83] F. Hermans, Improving Spreadsheet Test Practices, in: Proceedings ofthe 23rd Annual International Conference on Computer Science andSoftware Engineering (CASCON 2013), Markham, Ontario, Canada,2013, pp. 56–69.
[84] R. Abraham, M. Erwig, Mutation Operators for Spreadsheets, IEEETransactions on Software Engineering 35 (1) (2009) 94–108.
[85] R. Abraham, M. Erwig, Goal-Directed Debugging of Spreadsheets, in:Proceedings of the IEEE Symposium on Visual Languages and Human-Centric Computing (VL/HCC 2005), Dallas, TX, USA, 2005, pp. 37–44.
[86] R. A. Joseph Lawrance, Margaret Burnett, M. Erwig, Sharing reason-ing about faults in spreadsheets: An empirical study, in: Proceedings ofthe IEEE Symposium on Visual Languages and Human-Centric Com-puting (VL/HCC 2006), 2006, pp. 35–42.
[87] B. Hofer, A. Riboira, F. Wotawa, R. Abreu, E. Getzner, On the Em-pirical Evaluation of Fault Localization Techniques for Spreadsheets,in: Proceedings of the 16th International Conference on FundamentalApproaches to Software Engineering (FASE 2013), Rome, Italy, 2013,pp. 68–82.
[88] D. Jannach, T. Schmitz, Model-based diagnosis of spreadsheet pro-grams - A constraint-based debugging approach, Automated SoftwareEngineering to appear.
[89] J. Reichwein, G. Rothermel, M. Burnett, Slicing Spreadsheets: AnIntegrated Methodology for Spreadsheet Testing and Debugging, in:Proceedings of the 2nd Conference on Domain-Specific Languages (DSL1999), Austin, Texas, 1999, pp. 25–38.
61

[90] J. R. Ruthruff, S. Prabhakararao, J. Reichwein, C. Cook, E. Creswick,M. Burnett, Interactive, Visual Fault Localization Support for End-User Programmers, Journal of Visual Languages & Computing 16 (1-2)(2005) 3–40.
[91] J. R. Ruthruff, M. Burnett, G. Rothermel, An Empirical Study ofFault Localization for End-User Programmers, in: Proceedings of the27th International Conference on Software Engineering (ICSE 2005),St. Louis, MO, USA, 2005, pp. 352–361.
[92] J. R. Ruthruff, M. Burnett, G. Rothermel, Interactive Fault Localiza-tion Techniques in a Spreadsheet Environment, IEEE Transactions onSoftware Engineering 32 (4) (2006) 213–239.
[93] Y. Ayalew, R. Mittermeir, Spreadsheet Debugging, in: Proceedings ofthe European Spreadsheet Risks Interest Group 4th Annual Conference(EuSpRIG 2003), Dublin, Ireland, 2003.
[94] D. Jannach, U. Engler, Toward model-based debugging of spreadsheetprograms, in: Proceedings of the 9th Joint Conference on Knowledge-Based Software Engineering (JCKBSE 2010), Kaunas, Lithuania, 2010,pp. 252–264.
[95] E. Tsang, Foundations of Constraint Satisfaction, Academic Press,1993.
[96] C. Mateis, M. Stumptner, D. Wieland, F. Wotawa, Model-Based De-bugging of Java Programs, in: Proceedings of the Fourth InternationalWorkshop on Automated Debugging (AADEBUG 2000), Munich, Ger-many, 2000.
[97] A. Felfernig, G. Friedrich, D. Jannach, M. Stumptner, Consistency-based diagnosis of configuration knowledge bases, Artificial Intelligence152 (2) (2004) 213–234.
[98] D. Jannach, A. Baharloo, D. Williamson, Toward an integrated frame-work for declarative and interactive spreadsheet debugging, in: Pro-cedings of the 8th International Conference on Evaluation of NovelApproaches to Software Engineering (ENASE 2013), Angers, France,2013, pp. 117–124.
62

[99] R. Abreu, A. Riboira, F. Wotawa, Constraint-based Debugging ofSpreadsheets, in: Proceedings of the 15th Ibero-American Conferenceon Software Engineering (CIbSE 2012), Buenos Aires, Argentina, 2012,pp. 1–14.
[100] R. Abreu, A. Riboira, F. Wotawa, Debugging Spreadsheets: A CSP-based Approach, in: Proceedings of the 23rd IEEE InternationalSymposium on Software Reliability Engineering Workshops (ISSREW2012), Dallas, TX, USA, 2012, pp. 159–164.
[101] R. Reiter, A Theory of Diagnosis from First Principles, Artificial In-telligence 32 (1) (1987) 57–95.
[102] S. Außerlechner, S. Fruhmann, W. Wieser, B. Hofer, R. Spork,C. Muhlbacher, F. Wotawa, The Right Choice Matters! SMT Solv-ing Substantially Improves Model-Based Debugging of Spreadsheets,in: Proceedings of the 13th International Conference on Quality Soft-ware (QSIC 2013), Nanjing, China, 2013, pp. 139–148.
[103] R. Abraham, M. Erwig, GoalDebug: A Spreadsheet Debugger for EndUsers, in: Proceedings of the 29th International Conference on SoftwareEngineering (ICSE 2007), Minneapolis, MN, USA, 2007, pp. 251–260.
[104] R. Abraham, M. Erwig, Test-driven goal-directed debugging in spread-sheets, in: Proceedings of the IEEE Symposium on Visual Languagesand Human Centric Computing (VL/HCC 2008), Herrsching am Am-mersee, Germany, 2008, pp. 131–138.
[105] C. Parnin, A. Orso, Are Automated Debugging Techniques ActuallyHelping Programmers?, in: Proceedings of the 2011 International Sym-posium on Software Testing and Analysis (ISSTA 2011), Toronto,Canada, 2011, pp. 199–209.
[106] M. Luckey, M. Erwig, G. Engels, Systematic Evolution of Model-BasedSpreadsheet Applications, Journal of Visual Languages & Computing23 (5) (2012) 267–286.
[107] J. Paine, Model Master: an object-oriented spreadsheet front-end, in:Proceedings of the CALECO Conference on Using Computer Tech-nology in Economics and Business (CALECO 1997), Bristol, UnitedKingdom, 1997, pp. 84–92.
63

[108] J. Paine, Ensuring Spreadsheet Integrity with Model Master, in: Pro-ceedings of the European Spreadsheet Risks Interest Group 2nd AnnualConference (EuSpRIG 2001), Amsterdam, Netherlands, 2001.
[109] J. Paine, Spreadsheet Structure Discovery with Logic Programming,in: Proceedings of the European Spreadsheet Risks Interest Group 5thAnnual Conference (EuSpRIG 2004), Klagenfurt, Austria, 2004.
[110] J. Paine, Excelsior: Bringing the Benefits of Modularisation to Excel,in: Proceedings of the European Spreadsheet Risks Interest Group 6thAnnual Conference (EuSpRIG 2005), London, United Kingdom, 2005.
[111] J. Paine, E. Tek, D. Williamson, Rapid Spreadsheet Reshaping withExcelsior: multiple drastic changes to content and layout are easywhen you represent enough structure, in: Proceedings of the EuropeanSpreadsheet Risks Interest Group 7th Annual Conference (EuSpRIG2006), Cambridge, United Kingdom, 2006.
[112] M. Erwig, R. Abraham, I. Cooperstein, S. Kollmansberger, AutomaticGeneration and Maintenance of Correct Spreadsheets, in: Proceedingsof the 27th International Conference on Software Engineering (ICSE2005), St. Louis, MO, USA, 2005, pp. 136–145.
[113] R. Abraham, M. Erwig, S. Kollmansberger, E. Seifert, Visual Specifica-tions of Correct Spreadsheets, in: Proceedings of the IEEE Symposiumon Visual Languages and Human-Centric Computing (VL/HCC 2005),Dallas, TX, USA, 2005, pp. 189–196.
[114] M. Erwig, R. Abraham, S. Kollmansberger, I. Cooperstein, Gencel:A Program Generator for Correct Spreadsheets, Journal of FunctionalProgramming 16 (3) (2006) 293–325.
[115] R. Abraham, M. Erwig, Inferring Templates from Spreadsheets, in:Proceedings of the 28th International Conference on Software Engi-neering (ICSE 2006), Shanghai, China, 2006, pp. 182–191.
[116] T. R. G. Green, M. Petre, Usability Analysis of Visual ProgrammingEnvironments: a ‘cognitive dimensions’ framework, Journal of VisualLanguages & Computing 7 (2) (1996) 131–174.
64

[117] A. Blackwell, T. R. G. Green, Notational Systems – the Cognitive Di-mensions of Notations Framework, HCI Models, Theories, and Frame-works: Toward a Multidisciplinary Science (2003) 103–134.
[118] G. Engels, M. Erwig, ClassSheets: Automatic Generation of Spread-sheet Applications from Object-Oriented Specifications, in: Proceed-ings of the 20th IEEE/ACM International Conference on AutomatedSoftware Engineering (ASE 2005), Long Beach, CA, USA, 2005, pp.124–133.
[119] J. Cunha, M. Erwig, J. Saraiva, Automatically Inferring ClassSheetModels from Spreadsheets, in: Proceedings of the IEEE Symposiumon Visual Languages and Human-Centric Computing (VL/HCC 2010),Madrid, Spain, 2010, pp. 93–100.
[120] J. Cunha, J. Visser, T. Alves, J. a. Saraiva, Type-Safe Evolution ofSpreadsheets, in: Proceedings of the 14th International Conferenceon Fundamental Approaches to Software Engineering: Part of theJoint European Conferences on Theory and Practice of Software (FASE2011/ETAPS 2011), Saarbrucken, Germany, 2011, pp. 186–201.
[121] J. Cunha, J. Mendes, J. Saraiva, J. Fernandes, Embedding and Evolu-tion of Spreadsheet Models in Spreadsheet Systems, in: Proceedings ofthe IEEE Symposium on Visual Languages and Human-Centric Com-puting (VL/HCC 2011), Pittsburgh, PA, USA, 2011, pp. 179–186.
[122] J. Cunha, J. Fernandes, J. Mendes, H. Pacheco, J. Saraiva, Bidirec-tional Transformation of Model-Driven Spreadsheets, in: Proceedingsof the 5th International Conference on Theory and Practice of ModelTransformations (ICMT 2012), Springer Lecture Notes in ComputerScience, Prague, Czech Republic, 2012, pp. 105–120.
[123] J. Cunha, J. Fernandes, J. Mendes, J. Saraiva, Extension and Imple-mentation of ClassSheet Models, in: Proceedings of the IEEE Sympo-sium on Visual Languages and Human-Centric Computing (VL/HCC2012), Innsbruck, Austria, 2012, pp. 19–22.
[124] J. Cunha, J. a. P. Fernandes, J. a. Saraiva, From Relational ClassSheetsto UML+OCL, in: Proceedings of the 27th Annual ACM Symposiumon Applied Computing (SAC 2012), Trento, Italy, 2012, pp. 1151–1158.
65

[125] F. Hermans, M. Pinzger, A. van Deursen, Automatically ExtractingClass Diagrams from Spreadsheets, in: Proceedings of the 24th Eu-ropean Conference on Object-Oriented Programming (ECOOP 2010),Maribor, Slovenia, 2010, pp. 52–75.
[126] J. Cunha, J. a. Saraiva, J. Visser, From Spreadsheets to RelationalDatabases and Back, in: Proceedings of the 2009 ACM SIGPLANWorkshop on Partial Evaluation and Program Manipulation (PEPM2009), Savannah, GA, USA, 2009, pp. 179–188.
[127] J. Cunha, J. Saraiva, J. Visser, Discovery-Based Edit Assistance forSpreadsheets, in: Proceedings of the IEEE Symposium on Visual Lan-guages and Human Centric Computing (VL/HCC 2009), Corvallis, OR,USA, 2009, pp. 233–237.
[128] J. Cunha, J. a. Saraiva, J. Visser, Model-Based Programming Envi-ronments for Spreadsheets, in: Proceedings of the 16th Brazilian Con-ference on Programming Languages (SBLP 2012), Natal, Brazil, 2012,pp. 117–133.
[129] L. Beckwith, J. Cunha, J. Fernandes, J. Saraiva, End-Users Produc-tivity in Model-Based Spreadsheets: An Empirical Study, in: Proceed-ings of the 3rd International Symposium on End-User Development(IS-EUD 2011), Springer Lecture Notes in Computer Science, TorreCanne, Italy, 2011, pp. 282–288.
[130] N. Wilde, C. Lewis, Spreadsheet-based interactive graphics: from pro-totype to tool, in: Proceedings of the SIGCHI Conference on HumanFactors in Computing Systems (CHI 1990), Seattle, WA, USA, 1990,pp. 153–160.
[131] C. Lewis, NoPumpG: Creating Interactive Graphics with SpreadsheetMachinery, Visual Programming Environments: Paradigms and Sys-tems (1990) 526–546.
[132] C. Hughes, J. Moshell, Action Graphics: A Spreadsheet-based Lan-guage for Animated Simulation, Visual Languages and Applications(1990) 203–235.
66

[133] N. P. Wilde, A WYSIWYC (What You See Is What You Compute)Spreadsheet, in: Proceedings of the IEEE Symposium on Visual Lan-guages (VL 1993), Bergen, Norway, 1993, pp. 72–76.
[134] M. M. Burnett, A. Agrawal, P. van Zee, Exception Handling in theSpreadsheet Paradigm, IEEE Transactions on Software Engineering26 (10) (2000) 923–942.
[135] R. W. Sebesta, Concepts of Programming Languages (4th ed.),Addison-Wesley-Longman, 1999.
[136] B. Bekenn, R. Hooper, Reducing Spreadsheet Risk with Formula-DataSleuth, in: Proceedings of the European Spreadsheet Risks Inter-est Group 9th Annual Conference (EuSpRIG 2008), London, UnitedKingdom, 2008.
[137] C. Chambers, M. Erwig, M. Luckey, SheetDiff: A Tool for IdentifyingChanges in Spreadsheets, in: Proceedings of the IEEE Symposium onVisual Languages and Human-Centric Computing (VL/HCC 2010),Madrid, Spain, 2010, pp. 85–92.
[138] A. Harutyunyan, G. Borradaile, C. Chambers, C. Scaffidi, Planted-model evaluation of algorithms for identifying differences betweenspreadsheets, in: Proceedings of the IEEE Symposium on Visual Lan-guages and Human-Centric Computing (VL/HCC 2012), Innsbruck,Austria, 2012, pp. 7–14.
[139] P. O’Beirne, Spreadsheet Refactoring, in: Proceedings of the EuropeanSpreadsheet Risks Interest Group 11th Annual Conference (EuSpRIG2010), London, United Kingdom, 2010.
[140] S. Badame, D. Dig, Refactoring meets Spreadsheet Formulas, in: Pro-ceedings of the 28th IEEE International Conference on Software Main-tenance (ICSM 2012), Riva del Garda, Trento, Italy, 2012, pp. 399–409.
[141] W. R. Harris, S. Gulwani, Spreadsheet Table Transformations fromExamples, in: Proceedings of the 32nd ACM SIGPLAN conference onProgramming language design and implementation (PLDI 2011), SanJose, CA, USA, 2011, pp. 317–328.
67

[142] Y. Ye, G. Fischer, Reuse-Conducive Development Environments, Au-tomated Software Engineering 12 (2) (2005) 199–235.
[143] R. W. Djang, M. M. Burnett, Similarity Inheritance: A New Model ofInheritance for Spreadsheet VPLs, in: Proceedings of the IEEE Sym-posium on Visual Languages (VL 1998), Halifax, NS, Canada, 1998,pp. 134–141.
[144] M. Montigel, Portability and Reuse of Components for SpreadsheetLanguages, in: Proceedings of the IEEE CS International Symposiumon Human-Centric Computing Languages and Environments (HCC2002), Arlington, VA, USA, 2002, pp. 77–79.
[145] D. Jannach, M. Zanker, M. Ge, M. Groning, Recommender systems incomputer science and information systems - a landscape of research,in: Proceedings of the 13th International Conference on E-Commerceand Web Technologies (EC-WEB 2012), Vienna, 2012, pp. 76–87.
[146] L. P. S. Elazar J. Pedhazur, Measurement Design and Analysis: AnIntegrated Approach, Lawrence Erlbaum Assoc Inc, 1991.
[147] Using a structured design approach to reduce risks in end user spread-sheet development, Information and Management 37 (1) (2000) 1–12.
[148] F. Karlsson, Using two heads in practice, in: Proceedings of the 4thInternational Workshop on End-user Software Engineering (WEUSE2008), Leipzig, Germany, 2008, pp. 43–47.
[149] R. R. Panko, Applying Code Inspection to Spreadsheet Testing, Jour-nal of Management Information Systems 16 (2) (1999) 159–176.
[150] R. R. Panko, R. H. S. Jr., Hitting the wall: errors in developing andcode inspecting a ‘simple’ spreadsheet model, Decision Support Sys-tems 22 (4) (1998) 337–353.
[151] J. P. A. Ioannidis, Why most published research findings are false,PLoS Medizine 2 (8).
[152] R. Nuzzo, Scientific method: Statistical errors, Nature 506 (2014) 150–152.
68

[153] A. J. Ko, R. Abraham, L. Beckwith, A. Blackwell, M. Burnett, M. Er-wig, C. Scaffidi, J. Lawrance, H. Lieberman, B. Myers, M. B. Rosson,G. Rothermel, M. Shaw, S. Wiedenbeck, The State of the Art in End-User Software Engineering, ACM Computing Surveys 43 (3) (2011)21:1–21:44.
[154] S. R. Thorne, D. Ball, Z. Lawson, A Novel Approach to Formulae Pro-duction and Overconfidence Measurement to Reduce Risk in Spread-sheet Modelling, in: Proceedings of the European Spreadsheet RisksInterest Group 5th Annual Conference (EuSpRIG 2004), Klagenfurt,Austria, 2004.
[155] L. Beckwith, S. Sorte, M. Burnett, S. Wiedenbeck, T. Chintakovid,C. Cook, Designing features for both genders in end-user programmingenvironments, in: Proceedings of the IEEE Symposium on Visual Lan-guages and Human-Centric Computing (VL/HCC 2005), Dallas, TX,2005, pp. 153–160.
[156] J. R. Ruthruff, A. Phalgune, L. Beckwith, M. M. Burnett, C. R. Cook,Rewarding “good” behavior: End-user debugging and rewards, in: Pro-ceedings of the IEEE Symposium on Visual Languages and HumanCentric Computing (VL/HCC 2004), 2004, pp. 115–122.
[157] S. P. Jones, A. Blackwell, M. Burnett, A user-centred approach tofunctions in excel, in: Proceedings of the 8th ACM SIGPLAN Interna-tional Conference on Functional Programming (ICFP 2003), Uppsala,Sweden, 2003, pp. 165–176.
[158] P. Sestoft, J. Z. Sørensen, Sheet-defined functions: Implementationand initial evaluation, in: End-User Development, Vol. 7897 of LectureNotes in Computer Science, Springer Berlin Heidelberg, 2013, pp. 88–103.
69


Model-based diagnosis of spreadsheet programs:A constraint-based debugging approach
[Placeholder]
Dietmar JannachTU Dortmund, Germany
Thomas SchmitzTU Dortmund, Germany
This document cannot be published on an open access(OA) repository. To access the document, please follow theDOI: https://doi.org/10.1007/s10515-014-0141-7.
Automated Software Engineering, 23.1, March 2016
DOI: https://doi.org/10.1007/s10515-014-0141-7


MergeXplain: Fast Computation ofMultiple Conflicts for Diagnosis
[Placeholder]
Kostyantyn ShchekotykhinAlpen-Adria University Klagenfurt, [email protected]
Dietmar JannachTU Dortmund, Germany
[email protected] Schmitz
TU Dortmund, [email protected]
This document cannot be published on an open access(OA) repository. To access the document, please followthe link https://www.ijcai.org/Abstract/15/454 or refer tothe Proceedings of the Twenty-Fourth International JointConference on Artificial Intelligence ISBN 978-1-57735-738-4 pages 3221–3228.
IJCAI ’15, July 25–31, 2015, Buenos Aires, Argentina
ISBN: 978-1-57735-738-4


Journal of Artificial Intelligence Research 55 (2016) 835-887 Submitted 10/2015; published 04/2016
Parallel Model-Based Diagnosis on Multi-Core Computers
Dietmar Jannach [email protected] Schmitz [email protected] Dortmund, Germany
Kostyantyn Shchekotykhin [email protected]
Alpen-Adria University Klagenfurt, Austria
Abstract
Model-Based Diagnosis (MBD) is a principled and domain-independent way of ana-lyzing why a system under examination is not behaving as expected. Given an abstractdescription (model) of the system’s components and their behavior when functioning nor-mally, MBD techniques rely on observations about the actual system behavior to reasonabout possible causes when there are discrepancies between the expected and observed be-havior. Due to its generality, MBD has been successfully applied in a variety of applicationdomains over the last decades.
In many application domains of MBD, testing different hypotheses about the reasonsfor a failure can be computationally costly, e.g., because complex simulations of the sys-tem behavior have to be performed. In this work, we therefore propose different schemesof parallelizing the diagnostic reasoning process in order to better exploit the capabilitiesof modern multi-core computers. We propose and systematically evaluate parallelizationschemes for Reiter’s hitting set algorithm for finding all or a few leading minimal diag-noses using two different conflict detection techniques. Furthermore, we perform initialexperiments for a basic depth-first search strategy to assess the potential of parallelizationwhen searching for one single diagnosis. Finally, we test the effects of parallelizing “directencodings” of the diagnosis problem in a constraint solver.
1. Introduction
Model-Based Diagnosis (MBD) is a subfield of Artificial Intelligence that is concerned withthe automated determination of possible causes when a system is not behaving as expected.In the early days of MBD, the diagnosed “systems” were typically hardware artifacts likeelectronic circuits. In contrast to earlier heuristic diagnosis approaches which connectedsymptoms with possible causes, e.g., through expert rules (Buchanan & Shortliffe, 1984),MBD techniques rely on an abstract and explicit representation (model) of the examinedsystem. Such models contain both information about the system’s structure, i.e., the list ofcomponents and how they are connected, as well as information about the behavior of thecomponents when functioning correctly. When such a model is available, the expected be-havior (outputs) of a system given some inputs can thus be calculated. A diagnosis problemarises whenever the expected behavior conflicts with the observed system behavior. MBDtechniques at their core construct and test hypotheses about the faultiness of individualcomponents of the system. Finally, a diagnosis is considered as a subset of the componentsthat, if assumed to be faulty, can explain the observed behavior of the system.
Reiter (1987) suggests a formal logical characterization of the diagnosis problem “fromfirst principles” and proposed a breadth-first tree construction algorithm to determine all
c©2016 AI Access Foundation. All rights reserved.

Jannach, Schmitz, & Shchekotykhin
diagnoses for a given problem. Due to the generality of the used knowledge-representationlanguage and the suggested algorithms for the computation of diagnoses, MBD has beenlater on applied to a variety of application problems other than hardware. The applicationfields of MBD, for example, include the diagnosis of knowledge bases and ontologies, processspecifications, feature models, user interface specifications and user preference statements,and various types of software artifacts including functional and logic programs as well asVHDL, Java or spreadsheet programs (Felfernig, Friedrich, Jannach, & Stumptner, 2004;Mateis, Stumptner, Wieland, & Wotawa, 2000; Jannach & Schmitz, 2014; Wotawa, 2001b;Felfernig, Friedrich, Isak, Shchekotykhin, Teppan, & Jannach, 2009; Console, Friedrich,& Dupre, 1993; Friedrich & Shchekotykhin, 2005; Stumptner & Wotawa, 1999; Friedrich,Stumptner, & Wotawa, 1999; White, Benavides, Schmidt, Trinidad, Dougherty, & Cortes,2010; Friedrich, Fugini, Mussi, Pernici, & Tagni, 2010).
In several of these application fields, the search for diagnoses requires repeated compu-tations based on modified versions of the original model to test the different hypothesesabout the faultiness of individual components. In several works the original problem isconverted into a Constraint Satisfaction Problem (CSP) and a number of relaxed versionsof the original CSP have to be solved to construct a new node in the search tree (Felferniget al., 2004; Jannach & Schmitz, 2014; White et al., 2010). Depending on the applica-tion domain, the computation of CSP solutions or the check for consistency can, however,be computationally intensive and actually represents the most costly operation during theconstruction of the search tree. Similar problems arise when other underlying reasoningtechniques, e.g., for ontology debugging (Friedrich & Shchekotykhin, 2005), are used.
Current MBD algorithms are sequential in nature and generate one node at a time.Therefore, they do not exploit the capabilities of today’s multi-core computer processors,which can nowadays be found even in mobile devices. In this paper, we propose new schemesto parallelize the diagnostic reasoning process to better exploit the available computingresources of modern computer hardware. In particular, this work comprises the followingalgorithmic contributions and insights based on experimental evaluations:
• We propose two parallel versions of Reiter’s (1987) sound and complete Hitting Set(HS) algorithm to speed up the process of finding all diagnoses, which is a commonproblem setting in the above-described MBD applications. Both approaches can beconsidered as “window-based” parallelization schemes, which means that only a lim-ited number of search nodes is processed in parallel at each point in time.
• We evaluate two different conflict detection techniques in a multi-core setting, wherethe goal is to find a few “leading” diagnoses. In this set of experiments, multi-ple conflicts can be computed at the construction of each tree node using the novelMergeXplain method (MXP) (Shchekotykhin, Jannach, & Schmitz, 2015) and moreprocessing time is therefore implicitly allocated for conflict generation.
• We demonstrate that speedups can also be achieved through parallelization for sce-narios in which we search for one single diagnosis, e.g., when using a basic paralleldepth-first strategy.
• We measure the improvements that can be achieved through parallel constraint solvingwhen using a “direct” CSP-based encoding of the diagnosis problem. This experiment
836

Parallel Model-Based Diagnosis on Multi-Core Computers
illustrates that parallelization in the underlying solvers, in particular when using adirect encoding, can be advantageous.
We evaluate the proposed parallelization schemes through an extensive set of experi-ments. The following problem settings are analyzed.
(i) Standard benchmark problems from the diagnosis research community;
(ii) Mutated CSPs from a Constraint Programming competition and from the domain ofCSP-based spreadsheet debugging (Jannach & Schmitz, 2014);
(iii) Faulty OWL ontologies as used for the evaluation of MBD-based debugging techniquesof very expressive ontologies (Shchekotykhin, Friedrich, Fleiss, & Rodler, 2012);
(iv) Synthetically generated problems which allow us to vary the characteristics of theunderlying diagnosis problem.
The results show that using parallelization techniques can help to achieve substantialspeedups for the diagnosis process (a) across a variety of application scenarios, (b) withoutexploiting any specific knowledge about the structure of the underlying diagnosis problem,(c) across different problem encodings, and (d) also for application problems like ontologydebugging which cannot be efficiently encoded as SAT problems.
The outline of the paper is as follows. In the next section, we define the main concepts ofMBD and introduce the algorithm used to compute diagnoses. In Section 3, we present andsystematically evaluate the parallelization schemes for Reiter’s HS-tree method when thegoal is to find all minimal diagnoses. In Section 4, we report the results of the evaluationswhen we implicitly allocate more processing time for conflict generation using MXP forconflict detection. In Section 5 we assess the potential gains for a comparably simplerandomized depth-first strategy and a hybrid technique for the problem of finding onesingle diagnosis. The results of the experiments for the direct CSP encoding are reportedin Section 6. In Section 7 we discuss previous works. The paper ends with a summary andan outlook in Section 8.
2. Reiter’s Diagnosis Framework
This section summarizes Reiter’s (1987) diagnosis framework which we use as a basis forour work.
2.1 Definitions
Reiter (1987) formally characterized Model-Based Diagnosis using first-order logic. Themain definitions can be summarized as follows.
Definition 2.1. (Diagnosable System) A diagnosable system is described as a pair (SD,
Comps) where SD is a system description (a set of logical sentences) and Comps representsthe system’s components (a finite set of constants).
The connections between the components and the normal behavior of the componentsare described in terms of logical sentences. The normal behavior of the system components
837

Jannach, Schmitz, & Shchekotykhin
is usually described in SD with the help of a distinguished negated unary predicate ab(.),meaning “not abnormal”.
A diagnosis problem arises when some observation o P Obs of the system’s input-outputbehavior (again expressed as first-order sentences) deviates from the expected system be-havior. A diagnosis then corresponds to a subset of the system’s components which weassume to behave abnormally (be faulty) and where these assumptions must be consistentwith the observations. In other words, the malfunctioning of these components can be apossible reason for the observations.
Definition 2.2. (Diagnosis) Given a diagnosis problem (SD, Comps, Obs), a diagnosis isa subset minimal set ∆ Ď Comps such that SD Y Obs Y tab(c)|c P ∆u Y t abpcq|c PCompsz∆u is consistent.
According to Definition 2.2, we are only interested in minimal diagnoses, i.e., diagnoseswhich contain no superfluous elements and are thus not supersets of other diagnoses. When-ever we use the term diagnosis in the remainder of the paper, we therefore mean minimaldiagnosis. Whenever we refer to non-minimal diagnoses, we will explicitly mention this fact.
Finding all diagnoses can in theory be done by simply trying out all possible subsetsof Comps and checking their consistency with the observations. Reiter (1987), however,proposes a more efficient procedure based on the concept of conflicts.
Definition 2.3. (Conflict) A conflict for (SD, Comps, Obs) is a set tc1, ..., cku Ď Comps
such that SD Y Obs Y t abpc1q, ..., abpckqu is inconsistent.
A conflict corresponds to a subset of components which, if assumed to behave normally,are not consistent with the observations. A conflict c is considered to be minimal, if noproper subset of c exists which is also a conflict.
2.2 Hitting Set Algorithm
Reiter (1987) then discusses the relationship between conflicts and diagnoses and claimsin his Theorem 4.4 that the set of diagnoses for a collection of (minimal) conflicts F isequivalent to the set H of minimal hitting sets1 of F .
To determine the minimal hitting sets and therefore the diagnoses, Reiter proposes abreadth-first search procedure and the construction of a hitting set tree (HS-tree), whoseconstruction is guided by conflicts. In the logic-based definition of the MBD problem(Reiter, 1987), the conflicts are computed by calls to a Theorem Prover (TP). The TPcomponent itself is considered as a “black box” and no assumptions are made about howthe conflicts are determined. Depending on the application scenario and problem encoding,one can, however, also use specific algorithms like QuickXplain (Junker, 2004), Progres-sion (Marques-Silva, Janota, & Belov, 2013) or MergeXplain (Shchekotykhin et al., 2015),which guarantee that the computed conflict sets are minimal.
The main principle of the HS-tree algorithm is to create a search tree where each nodeis either labeled with a conflict or represents a diagnosis. In the latter case the node isnot further expanded. Otherwise, a child node is generated for each element of the node’s
1. Given a collection C of subsets of a finite set S, a hitting set for C is a subset of S which contains atleast one element from each subset in C. This corresponds to the set cover problem.
838

Parallel Model-Based Diagnosis on Multi-Core Computers
conflict and each outgoing edge is labeled with one component of the node’s conflict. In thesubsequent expansions of each node the components that were used to label the edges onthe path from the root of the tree to the current node are assumed to be faulty. Each newlygenerated child node is again either a diagnosis or will be labeled with a conflict that doesnot contain any component that is already assumed to be faulty at this stage. If no conflictcan be found for a node, the path labels represent a diagnosis in the sense of Definition 2.2.
2.2.1 Example
In the following example we will show how the HS-tree algorithm and the QuickXplain(QXP) conflict detection technique can be combined to locate a fault in a specificationof a CSP. A CSP instance I is defined as a tuple pV,D,Cq, where V “ tv1, . . . , vnu is aset of variables, D “ tD1, . . . , Dnu is a set of domains for each of the variables in V , andC “ tC1, . . . , Cku is a set of constraints. An assignment to any subset X Ď V is a set ofpairs A “ txv1, d1y, . . . , xvk, dmyu where vi P X is a variable and dj P Di is a value from thedomain of this variable. An assignment comprises exactly one variable-value pair for eachvariable in X. Each constraint Ci P C is defined over a list of variables S, called scope,and forbids or allows certain simultaneous assignments to the variables in its scope. Anassignment A to S satisfies a constraint Ci if A comprises an assignment allowed by Ci. Anassignment A is a solution to I if it satisfies all constraints C.
Consider a CSP instance I with variables V “ ta, b, cu where each variable has thedomain t1, 2, 3u and the following set of constraints are defined:
C1 : a ą b, C2 : b ą c, C3 : c “ a, C4 : b ă c
Obviously, no solution for I exists and our diagnosis problem consists in finding subsets ofthe constraints whose definition is faulty. The engineer who has modeled the CSP could,for example, have made a mistake when writing down C2, which should have been b ă c.Eventually, C4 was added later on to correct the problem, but the engineer forgot to removeC2. Given the faulty definition of I, two minimal conflicts exist, namely ttC1, C2, C3u,tC2, C4uu, which can be determined with the help of QXP. Given these two conflicts,the HS-tree algorithm will finally determine three minimal hitting sets ttC2u, tC1, C4u,tC3, C4uu, which are diagnoses for the problem instance. The set of diagnoses also containsthe true cause of the error, the definition of C2.
Let us now review in more detail how the HS-tree/QXP combination works for the ex-ample problem. We illustrate the tree construction in Figure 1. In the logic-based definitionof Reiter, the HS-tree algorithm starts with a check if the observations Obs are consistentwith the system description SD and the components Comps. In our application setting thiscorresponds to a check if there exists any solution for the CSP instance.2 Since this is notthe case, a QXP-call is made, which returns the conflict tC1, C2, C3u, which is used as alabel for the root node ( 1 ) of the tree. For each element of the conflict, a child node iscreated and the conflict element is used as a path label. At each tree node, again the con-sistency of SD, Obs, and Comps is tested; this time, however, all the elements that appear
2. Comps are the constraints tC1...C4u and SD corresponds to the semantics/logic of the constraints whenworking correctly, e.g., ABpC1q _ pa ą bq. Obs is empty in this example but could be a partial valueassignment (test case) in another scenario.
839

Jannach, Schmitz, & Shchekotykhin
{C1,C2, C3}
C1 C2 3
1
2
4
5
C3
{C2,C4} {C2,C4}
C2 C4 C2 C4
Figure 1: Example for HS-tree construction.
as labels on the path from the root node to the current node are considered to be abnormal.In the CSP diagnosis setting, this means that we check if there is any solution to a modifiedversion of our original CSP from which we remove the constraints that appear as labels onthe path from the root to the current node.
At node 2 , C1 is correspondingly considered to be abnormal. As removing C1 from theCSP is, however, not sufficient and no solution exists for the relaxed problem, another callto QXP is made, which returns the conflict tC2, C4u. tC1u is therefore not a diagnosis andthe new conflict is used as a label for node 2 . The algorithm then proceeds in breadth-firststyle and tests if assuming tC2u or tC3u to be individually faulty is “consistent with theobservations”, which in our case means that a solution to the relaxed CSP exists. Since tC2uis a diagnosis – at least one solution exists if C2 is removed from the CSP definition – thenode is marked with 3 and not further expanded. At node 3 , which does not correspondto a diagnosis, the already known conflict tC2, C4u can be reused as it has no overlap withthe node’s path label and no call to TP (QXP) is required. At the last tree level, thenodes 4 and 5 are not further expanded (“closed” and marked with 7) because tC2u hasalready been identified as a diagnosis at the previous level and the resulting diagnoses wouldbe supersets of tC2u. Finally, the sets tC1, C4u and tC3, C4u are identified as additionaldiagnoses.
2.2.2 Discussion
Soundness and Completeness According to Reiter (1987), the breadth-first construc-tion scheme and the node closing rule ensure that only minimal diagnoses are computed.At the end of the HS-tree construction process, each set of edge labels on the path from theroot of the tree to a node marked with 3 corresponds to a diagnosis.3
Greiner, Smith, and Wilkerson (1989), later on, identified a potential problem in Reiter’salgorithm for cases in which the conflicts returned by TP are not guaranteed to be minimal.An extension of the algorithm based on an HS-DAG (directed acyclic graph) structure wasproposed to solve the problem.
In the context of our work, we only use methods that return conflicts which are guar-anteed to be minimal. For example, according to Theorem 1 in the work of Junker (2004),given a set of formulas and a sound and complete consistency checker, QXP always returns
3. Reiter (1987) states in Theorem 4.8 that given a set of conflict sets F , the HS-tree algorithm outputs apruned tree T such that the set tHpnq|n is a node of T labeled with 3u corresponds to the set H of allminimal hitting sets of F where Hpnq is a set of arc labels on the path from the node n to the root.
840

Parallel Model-Based Diagnosis on Multi-Core Computers
either a minimal conflict or ‘no conflict’. This minimality guarantee in turn means that thecombination of the HS-tree algorithm and QXP is sound and complete, i.e., all returnedsolutions are actually (minimal) diagnoses and no diagnosis for the given set of conflictswill be missed. The same holds when computing multiple conflicts at a time with MXP(Shchekotykhin et al., 2015).
To simplify the presentation of our parallelization approaches, we will therefore relyon Reiter’s original HS-tree formulation; an extension to deal with the HS-DAG structure(Greiner et al., 1989) is possible.
On-Demand Conflict Generation and Complexity In many of the above-mentionedapplications of MBD to practical problems, the conflicts have to be computed “on-demand”,i.e., during tree construction, because we cannot generally assume that the set of minimalconflicts is given in advance. Depending on the problem setting, finding these conflicts cantherefore be the computationally most intensive part of the diagnosis process.
Generally, finding hitting sets for a collection of sets is known to be an NP-hard problem(Garey & Johnson, 1979). Moreover, deciding if an additional diagnosis exists when conflictsare computed on demand is NP-complete even for propositional Horn theories (Eiter &Gottlob, 1995). Therefore, a number of heuristics-based, approximate and thus incomplete,as well as problem-specific diagnosis algorithms have been proposed over the years. Wewill discuss such approaches in later sections. In the next section, we, however, focus on(worst-case) application scenarios where the goal is to find all minimal diagnoses for a givenproblem, i.e., we focus on complete algorithms.
Consider, for example, the problem of debugging program specifications (e.g., constraintprograms, knowledge bases, ontologies, or spreadsheets) with MBD techniques as mentionedabove. In these application domains, it is typically not sufficient to find one minimal diag-nosis. In the work of Jannach and Schmitz (2014), for example, the spreadsheet developeris presented with a ranked list of all sets of formulas (diagnoses) that represent possiblereasons why a certain test case has failed. The developer can then either inspect each ofthem individually or provide additional information (e.g., test cases) to narrow down the setof candidates. If only one diagnosis was computed and presented, the developer would haveno guarantee that it is the true cause of the problem, which can lead to limited acceptanceof the diagnosis tool.
3. Parallel HS-Tree Construction
In this section we present two sound and complete parallelization strategies for Reiter’sHS-tree method to determine all minimal diagnoses.
3.1 A Non-recursive HS-Tree Algorithm
We use a non-recursive version of Reiter’s sequential HS-tree algorithm as a basis for theimplementation of the two parallelization strategies. Algorithm 1 shows the main loop of abreadth-first procedure, which uses a list of open nodes to be expanded as a central datastructure.
The algorithm takes a diagnosis problem (DP) instance as input and returns the set∆ of diagnoses. The DP is given as a tuple (SD, Comps, Obs), where SD is the system
841

Jannach, Schmitz, & Shchekotykhin
Algorithm 1: diagnose: Main algorithm loop.
Input: A diagnosis problem (SD, Comps, Obs)
Result: The set ∆ of diagnoses
1 ∆ “ H; paths “ H; conflicts “ H;2 nodesToExpand = xgenerateRootNode(SD, Comps, Obs)y;3 while nodesToExpand ‰ x y do4 newNodes = x y;5 node = head(nodesToExpand) ;6 foreach c P node.conflict do7 generateNode(node, c, ∆, paths, conflicts, newNodes);
8 nodesToExpand = tail(nodesToExpand) ‘ newNodes;
9 return ∆;
Algorithm 2: generateNode: Node generation logic.
Input: An existingNode to expand, a conflict element c P Comps,the sets ∆, paths, conflicts, newNodes
1 newPathLabel = existingNode.pathLabel Y {c};2 if pE l P ∆ : l Ď newPathLabelq ^ checkAndAddPathppaths, newPathLabelq then3 node = new Node(newPathLabel);4 if D S P conflicts : S X newPathLabel “ H then5 node.conflict = S;6 else7 newConflicts = checkConsistency(SD, Comps, Obs, node.pathLabel);8 node.conflict = head(newConflicts);
9 if node.conflict ‰ H then10 newNodes = newNodes ‘ xnodey;11 conflicts = conflicts Y newConflicts;
12 else13 ∆ “ ∆ Y {node.pathLabel};
description, Comps the set of components that can potentially be faulty and Obs a set ofobservations. The method generateRootNode creates the initial node, which is labeledwith a conflict and an empty path label. Within the while loop, the first element of a “first-in-first-out” (FIFO) list of open nodes nodesToExpand is taken as the current element.The function generateNode (Algorithm 2) is called for each element of the node’s conflictand adds new leaf nodes, which still have to be explored, to a global list. These newnodes are then appended (‘) to the remaining list of open nodes in the main loop, which
842

Parallel Model-Based Diagnosis on Multi-Core Computers
continues until no more elements remain for expansion.4 Algorithm 2 (generateNode)implements the node generation logic, which includes Reiter’s proposals for conflict re-use,tree pruning, and the management of the lists of known conflicts, paths and diagnoses. Themethod determines the path label for the new node and checks if the new path label is nota superset of an already found diagnosis.
Algorithm 3: checkAndAddPath: Adding a new path label with a redundancycheck.
Input: The previously explored paths, the newPathLabel to be exploredResult: Boolean stating if newPathLabel was added to paths
1 if E l P paths : l “ newPathLabel then2 paths = paths Y newPathLabel;3 return true;
4 return false;
The function checkAndAddPath (Algorithm 3) is then used to check if the node wasnot already explored elsewhere in the tree. The function returns true if the new path labelwas successfully inserted into the list of known paths. Otherwise, the list of known pathsremains unchanged and the node is “closed”.
For new nodes, either an existing conflict is reused or a new one is created with a callto the consistency checker (Theorem Prover), which tests if the new node is a diagnosisor returns a set of minimal conflicts otherwise. Depending on the outcome, a new node isadded to the list nodesToExpand or a diagnosis is stored. Note that Algorithm 2 has noreturn value but instead modifies the sets ∆, paths, conflicts, and newNodes, which werepassed as parameters.
3.2 Level-Wise Parallelization
Our first parallelization scheme examines all nodes of one tree level in parallel and proceedswith the next level once all elements of the level have been processed. In the example shownin Figure 1, this would mean that the computations (consistency checks and theorem provercalls) required for the three first-level nodes labeled with tC1u, tC2u, and tC3u can be donein three parallel threads. The nodes of the next level are explored when all threads of theprevious level are finished.
Using this Level-Wise Parallelization (LWP) scheme, the breadth-first character is main-tained. The parallelization of the computations is generally feasible because the consistencychecks for each node can be done independently from those done for the other nodes on thesame level. Synchronization is only required to make sure that no thread starts exploring apath which is already under examination by another thread.
Algorithm 4 shows how the sequential Algorithm 1 can be adapted to support thisparallelization approach. Again, we maintain a list of open nodes to be expanded. Thedifference is that we run the expansion of all these nodes in parallel and collect all the
4. A limitation regarding the search depth or the number of diagnoses to find can be easily integrated intothis scheme.
843

Jannach, Schmitz, & Shchekotykhin
Algorithm 4: diagnoseLW: Level-Wise Parallelization.
Input: A diagnosis problem (SD, Comps, Obs)
Result: The set ∆ of diagnoses
1 ∆ “ H; conflicts “ H; paths = H;2 nodesToExpand = xgenerateRootNode(SD, Comps, Obs)y;3 while nodesToExpand ‰ x y do4 newNodes = x y;5 foreach node P nodesToExpand do6 foreach c P node.conflict do // Do computations in parallel
7 threads.execute(generateNode(node, c, ∆, paths, conflicts, newNodes));
8 threads.await(); // Wait for current level to complete
9 nodesToExpand = newNodes; // Prepare next level
10 return ∆;
nodes of the next level in the variable newNodes. Once the current level is finished, weoverwrite the list nodesToExpand with the list containing the nodes of the next level.
The Java-like API calls used in the pseudo-code in Algorithm 4 have to be interpretedas follows. The statement threads.execute() takes a function as a parameter and schedulesit for execution in a pool of threads of a given size. With a thread pool of, e.g., size 2,the generation of the first two nodes would be done in parallel and the next ones wouldbe queued until one of the threads has finished. With this mechanism, we can ensure thatthe number of threads executed in parallel is less than or equal to the number of hardwarethreads or CPUs.
The statement threads.await() is used for synchronization and blocks the execution ofthe subsequent code until all scheduled threads are finished. To guarantee that the samepath is not explored twice, we make sure that no two threads in parallel add a node withthe same path label to the list of known paths. This can be achieved by declaring thefunction checkAndAddPath as a “critical section” (Dijkstra, 1968), which means that notwo threads can execute the function in parallel. Furthermore, we have to make the accessto the global data structures (e.g., the already known conflicts or diagnoses) thread-safe,i.e., ensure that no two threads can simultanuously manipulate them.5
3.3 Full Parallelization
In LWP, there can be situations where the computation of a conflict for a specific nodetakes particularly long. This, however, means that even if all other nodes of the currentlevel are finished and many threads are idle, the expansion of the HS-tree cannot proceedbefore the level is completed. Algorithm 5 shows our proposed Full Parallelization (FP)algorithm variant, which immediately schedules every expandable node for execution andthereby avoids such potential CPU idle times at the end of each level.
5. Controlling such concurrency aspects is comparably simple in modern programming languages like Java,e.g., by using the synchronized keyword.
844

Parallel Model-Based Diagnosis on Multi-Core Computers
Algorithm 5: diagnoseFP: Full Parallelization.
Input: A diagnosis problem (SD, Comps, Obs)
Result: The set ∆ of diagnoses
1 ∆ “ H; paths “ H; conflicts “ H;2 nodesToExpand = xgenerateRootNode(SD, Comps, Obs)y;3 size = 1; lastSize = 0;4 while psize‰lastSizeq _ pthreads.activeThreads‰ 0q do5 for i “ 1 to size ´ lastSize do6 node = nodesToExpand.get[lastSize + i];7 foreach c P node.conflict do8 threads.execute(generateNodeFP(node, c, ∆, paths, conflicts,
nodesToExpand));
9 lastSize = size;10 wait();11 size = nodesToExpand.length();
12 return ∆;
The main loop of the algorithm is slightly different and basically monitors the list ofnodes to expand. Whenever new entries in the list are observed, i.e., when the last observedlist size is different from the current one, it retrieves the recently added elements and addsthem to the thread queue for execution. The algorithm returns the diagnoses when no newelements are added since the last check and no more threads are active.6
With FP, the search does not necessarily follow the breadth-first strategy anymore andnon-minimal diagnoses are found during the process. Therefore, whenever we find a newdiagnosis d, we have to check if the set of known diagnoses ∆ contains supersets of d andremove them from ∆.
The updated generateNode method is listed in Algorithm 6. When updating the shareddata structures (nodesToExpand, conflicts, and ∆), we again make sure that the threads donot interfere with each other. The mutual exclusive section is marked with the synchronized
keyword.
When compared to LWP, FP does not have to wait at the end of each level if a specificnode takes particularly long to generate. On the other hand, FP needs more synchronizationbetween threads, so that in cases where the last nodes of a level are finished at the sametime, LWP could also be advantageous. We will evaluate this aspect in Section 3.5.
3.4 Properties of the Algorithms
Algorithm 1 together with Algorithms 2 and 3 corresponds to an implementation of theHS-tree algorithm (Reiter, 1987). Algorithm 1 implements the breadth-first search strategy– point (1) in Reiter’s HS-tree algorithm – since the nodes stored in the list nodesToExpand
6. The functions wait() and notify() implement the semantics of pausing a thread and awaking a pausedthread in the Java programming language and are used to avoid active waiting loops.
845

Jannach, Schmitz, & Shchekotykhin
Algorithm 6: generateNodeFP: Extended node generation logic.
Input: An existingNode to expand, c P Comps,sets ∆, paths, conflicts, nodesToExpand
1 newPathLabel = existingNode.pathLabel Y {c};2 if pE l P ∆ : l Ď newPathLabelq ^ checkAndAddPathppaths, newPathLabelq then3 node = new Node(newPathLabel);4 if D S P conflicts : S X newPathLabel “ H then5 node.conflict = S;6 else7 newConflicts = checkConsistency(SD, Comps, Obs, node.pathLabel);8 node.conflict = head(newConflicts);
9 synchronized10 if node.conflict ‰ H then11 nodesToExpand = nodesToExpand ‘ xnodey;12 conflicts = conflicts Y newConflicts;
13 else if E d P ∆ : d Ď newPathLabel then14 ∆ “ ∆ Y {node.pathLabel};15 for d P ∆ : d Ě newPathLabel do16 ∆ “ ∆ z d;
17 notify();
are processed iteratively in a first-in-first-out order (see lines 5 and 8). Algorithm 2 firstchecks if the pruning rules (i) and (ii) of Reiter can be applied in line 2. These rules statethat a node can be pruned if (i) there exists a diagnosis or (ii) there is a set of labelscorresponding to some path in the tree such that it is a subset of the set of labels on thepath to the node. Pruning rule (ii) is implemented through Algorithm 3. Pruning rule (iii)of Reiter’s algorithm is not necessary since in our settings a TP -call guarantees to returnminimal conflicts.
Finally, point (2) of Reiter’s HS-tree algorithm description is implemented in the lines4-8 of Algorithm 2. Here, the algorithm checks if there is a conflict that can be reused as anode label. In case no reuse is possible, the algorithm calls the theorem prover TP to findanother minimal conflict. If a conflict is found, the node is added to the list of open nodesnodesToExpand . Otherwise, the set of node path labels is added to the set of diagnoses.This corresponds to the situation in Reiter’s algorithm where we would mark a node in theHS-tree with the 3 symbol. Note that we do not label any nodes with 7 as done in Reiter’salgorithms since we simply do not store such nodes in the expansion list.
Overall, we can conclude that our HS-tree algorithm implementation (Algorithm 1 to3) has the same properties as Reiter’s original HS-tree algorithm. Namely, each hitting setreturned by the algorithm is minimal (soundness) and all existing minimal hitting sets arefound (completeness).
846

Parallel Model-Based Diagnosis on Multi-Core Computers
3.4.1 Level-Wise Parallelization (LWP)
Theorem 3.1. Level-Wise Parallelization is sound and complete.
Proof. The proof is based on the fact that LWP uses the same expansion and pruningtechniques as the sequential algorithm (Algorithms 2 and 3). The main loop in line 3 appliesthe same procedure as the original algorithm with the only difference that the executionsof Algorithm 2 are done in parallel for each level of the tree. Therefore, the only differencebetween the sequential algorithm and LWP lies in the order in which the nodes of one levelare labeled and generated.
Let us assume that there are two nodes n1 and n2 in the tree and that the sequentialHS-tree algorithm will process n1 before n2. Assuming that neither n1 nor n2 correspondto diagnoses, the sequential Algorithm 1 would correspondingly first add the child nodes ofn1 to the queue of open nodes and later on append the child nodes of n2.
If we parallelize the computations needed for the generation of n1 and n2 in LWP, itcan happen that the computations for n1 need longer than those for n2. In this case thechild nodes of n2 will be placed in the queue first. The order of how these nodes aresubsequently processed is, however, irrelevant for the computation of the minimal hittingsets, since neither the labeling nor the pruning rules are influenced by it. In fact, thelabeling of any node n only depends on whether or not a minimal conflict set f exists suchthat Hpnq X f “ H, but not on the other nodes on the same level. The pruning rulesstate that any node n can be pruned if there exists a node n1 labeled with 3 such thatHpn1q Ď Hpnq, i.e., supersets of already found diagnoses can be pruned. If n and n1 areon the same level, then |Hpnq| “ |Hpn1q|. Consequently, the pruning rule is applied only ifHpnq “ Hpn1q. Therefore, the order of nodes, i.e., which of the nodes is pruned, is irrelevantand no minimal hitting set is lost. Consequently, LWP is complete.
Soundness of the algorithm follows from the fact that LWP constructs the hitting setsalways in the order of increasing cardinality. Therefore, LWP will always return only min-imal hitting sets even in scenarios in which we should stop after k diagnoses are found,where 1 ě k ă N is a predefined constant and N is the total number of diagnoses of aproblem.
3.4.2 Full Parallelization (FP)
The minimality of the hitting sets encountered during the search is not guaranteed by FP,since the algorithm schedules a node for processing immediately after its generation (line 8of Algorithm 5). The special treatment in the generateNodeFP function ensures that nosupersets of already found hitting sets are added to ∆ and that supersets of a newly foundhitting set will be removed in a thread-safe manner (lines 13 – 16 of Algorithm 6). Dueto this change in generateNodeFP, the analysis of soundness and completeness has to bedone for two distinct cases.
Theorem 3.2. Full Parallelization is sound and complete, if applied to find all diagnosesup to some cardinality.
Proof. FP stops if either (i) no further hitting set exists, i.e., all leaf nodes of a tree arelabeled either with 3 or with 7, or (ii) the predefined cardinality (tree-depth) is reached. Inthis latter case, every leaf node of the tree is labeled either with 3, 7, or a minimal conflict
847

Jannach, Schmitz, & Shchekotykhin
set. Case (ii) can be reduced to (i) by removing all branches from the tree that are labeledwith a minimal conflict. These branches are irrelevant since they can only contribute tominimal hitting sets of higher cardinality. Therefore, without loss of generality, we can limitour discussion to case (i).
According to the definition of generateNodeFP, the tree is built using the same pruningrule as done in the sequential HS-tree algorithm. As a consequence, the tree generated byFP must comprise at least all nodes of the tree that is generated by the sequential HS-tree procedure. Therefore, according to Theorem 4.8 in the work of Reiter (1987) thetree T generated by FP must comprise a set of leaf nodes labeled with 3 such that theset tHpnq|n is a node of T labeled by 3u corresponds to the set H of all minimal hittingsets. Moreover, the result returned by FP comprises only minimal hitting sets, becausegenerateNodeFP removes all hitting sets from H which are supersets of other hitting sets.Consequently, FP is sound and complete, when applied to find all diagnoses.
Theorem 3.3. Full Parallelization cannot guarantee completeness and soundness whenapplied to find the first k diagnoses, i.e. 1 ě k ă N , where N is the total number ofdiagnoses of a problem.
Proof. The proof can be done by constructing an example for which FP returns at leastone non-minimal hitting set in the set ∆, thus violating Definition 2.2. For instance, thissituation might occur if FP is applied to find one single diagnosis for the example problempresented in Section 2.2.1. Let us assume that the generation of the node correspondingto the path C2 is delayed, e.g., because the operating system scheduled another thread forexecution first, and node 4 is correspondingly generated first. In this case, the algorithmwould return the non-minimal hitting set tC1, C2u which is not a diagnosis.
Note that the elements of the set ∆ returned by FP in this case can be turned todiagnoses by applying a minimization algorithm like Inv-QuickXplain (Shchekotykhin,Friedrich, Rodler, & Fleiss, 2014), an algorithm that adopts the principles of QuickXplainand applies a divide-and-conquer strategy to find one minimal diagnosis for a given set ofinconsistent constraints.
Given a hitting set H and a diagnosis problem, the algorithm is capable of computing aminimal hitting set H 1 Ď H requiring only Op|H 1|`|H 1| logp|H|{|H 1|qqq calls to the theoremprover TP. The first part, |H 1|, reflects the computational costs of determining whether ornot H 1 is minimal. The second part represents the number of subproblems that must beconsidered by the divide-and-conquer algorithm in order to find the minimal hitting set H 1.
3.5 Evaluation
To determine which performance improvements can be achieved through the various formsof parallelization proposed in this paper, we conducted a series of experiments with diagnosisproblems from a number of different application domains. Specifically, we used electroniccircuit benchmarks from the DX Competition 2011 Synthetic Track, faulty descriptions ofConstraint Satisfaction Problems (CSPs), as well as problems from the domain of ontologydebugging. In addition, we ran experiments with synthetically created diagnosis problemsto analyze the impact of varying different problem characteristics. All diagnosis algorithms
848

Parallel Model-Based Diagnosis on Multi-Core Computers
evaluated in this paper were implemented in Java unless noted otherwise. Generally, weuse wall clock times as our performance measure.
In the main part of the paper, we will focus on the results for the DX Competitionproblems as this is the most widely used benchmark. The results for the other problemsetups will be presented and discussed in the appendix of the paper. In most cases, theresults for the DX Competition problems follow a similar trend as those that are achievedwith the other experiments.
In this section we will compare the HS-tree parallelization schemes LWP and FP withthe sequential version of the algorithm, when the goal is to find all diagnoses.
3.5.1 Dataset and Procedure
For this set of experiments, we selected the first five systems of the DX Competition 2011Synthetic Track (see Table 1) (Kurtoglu & Feldman, 2011). For each system, the compe-tition specifies 20 scenarios with injected faults resulting in different faulty output values.We used the system description and the given input and output values for the diagnosisprocess. The additional information about the injected faults was of course ignored. Theproblems were converted into Constraint Satisfaction Problems. In the experiments we usedChoco (Prud’homme, Fages, & Lorca, 2015) as a constraint solver and QXP for conflictdetection, which returns one minimal conflict when called during node construction.
As the computation times required for conflict identification strongly depend on theorder of the possibly faulty constraints, we shuffled the constraints for each test and repeatedall tests 100 times. We report the wall clock times for the actual diagnosis task; the timesrequired for input and output are independent from the HS-tree construction scheme andnot relevant for our benchmarks. For the parallel approaches, we used a thread pool of sizefour.7
Table 1 shows the characteristics of the systems in terms of the number of constraints(#C) and the problem variables (#V).8 The numbers of the injected faults (#F) and thenumbers of the calculated diagnoses (#D) vary strongly because of the different scenariosfor each system. For both columns we show the ranges of values over all scenarios. Thecolumns #D and |D| indicate the average number of diagnoses and their average cardinality.As can be seen, the search tree for the diagnosis can become extremely broad with up to6,944 diagnoses with an average diagnosis size of only 3.38 for the system c432.
3.5.2 Results
Table 2 shows the averaged results when searching for all minimal diagnoses. We first list therunning times in milliseconds for the sequential version (Seq.) and then the improvementsof LWP or FP in terms of speedup and efficiency with respect to the sequential version.Speedup Sp is computed as Sp “ T1{Tp, where T1 is the wall time when using 1 thread (thesequential algorithm) and Tp the wall time when p parallel threads are used. A speedup of
7. Having four hardware threads is a reasonable assumption on standard desktop computers and also mobiledevices. The hardware we used for the evaluation in this chapter – a laptop with an Intel i7-3632QMCPU, 16GB RAM, running Windows 8 – also had four cores with hyperthreading. The results of anevaluation on server hardware with 12 cores are reported later in this Section.
8. For systems marked with *, the search depth was limited to their actual number of faults to ensure thatthe sequential algorithm terminates within a reasonable time frame.
849

Jannach, Schmitz, & Shchekotykhin
System #C #V #F #D #D |D|
74182 21 28 4 - 5 30 - 300 139.0 4.6674L85 35 44 1 - 3 1 - 215 66.4 3.1374283* 38 45 2 - 4 180 - 4,991 1,232.7 4.4274181* 67 79 3 - 6 10 - 3,828 877.8 4.53c432* 162 196 2 - 5 1 - 6,944 1,069.3 3.38
Table 1: Characteristics of the selected DXC benchmarks.
2 would therefore mean that the needed computation times were halved; a speedup of 4,which is the theoretical optimum when using 4 threads, means that the time was reducedto one quarter. The efficiency Ep is defined as Sp{p and compares the speedup with thetheoretical optimum. The fastest algorithm for each system is highlighted in bold.
System Seq.(QXP) LWP(QXP) FP(QXP)[ms] S4 E4 S4 E4
74182 65 2.23 0.56 2.28 0.5774L85 209 2.55 0.64 2.77 0.6974283* 371 2.53 0.63 2.66 0.6774181* 21,695 1.22 0.31 3.19 0.80c432* 85,024 1.47 0.37 3.75 0.94
Table 2: Observed performance gains for the DXC benchmarks when searching for all di-agnoses.
In all tests, both parallelization approaches outperform the sequential algorithm. Fur-thermore, the differences between the sequential algorithm and one of the parallel ap-proaches were statistically significant (p ă 0.05) in 95 of the 100 tested scenarios. Forall systems, FP was more efficient than LWP and the speedups range from 2.28 to 3.75(i.e., up to a reduction of running times of more than 70%). In 59 of the 100 scenariosthe differences between LWP and FP were statistically significant. A trend that can beobserved is that the efficiency of FP is higher for the more complex problems. The reason isthat for these problems the time needed for the node generation is much larger in absolutenumbers than the additional overhead times that are required for thread synchronization.
3.5.3 Adding More Threads
In some use cases the diagnosis process can be done on powerful server architectures thatoften have even more CPU cores than modern desktop computers. In order to assess towhich extent more than 4 threads can help to speed up the diagnosis process, we tested thedifferent benchmarks on a server machine with 12 CPU cores. For this test we comparedFP with 4, 8, 10, and 12 threads to the sequential algorithm.
The results of the DXC benchmark problems are shown in Table 3. For all tested systemsthe diagnosis process was faster using 8 instead of 4 threads and substantial speedups upto 5.20 could be achieved compared to the sequential diagnosis, which corresponds to a
850

Parallel Model-Based Diagnosis on Multi-Core Computers
runtime reduction of 81%. For all but one system, the utilization of 10 threads led toadditional speedups. Using 12 threads was the fastest for 3 of the 5 tested systems. Theefficiency, however, degrades as more threads are used, because more time is needed for thesynchronization between threads. Using more threads than the hardware actually has coresdid not result in additional speedups for any of the tested systems. The reason is that formost of the time all threads are busy with conflict detection, e.g., finding solutions to CSPs,and use almost 100% of the processing power assigned to them.
System Seq.(QXP) FP(QXP)[ms] S4 E4 S8 E8 S10 E10 S12 E12
74182 58 2.09 0.52 2.43 0.30 2.52 0.25 2.54 0.2174L85 184 2.53 0.63 3.29 0.41 3.35 0.34 3.38 0.2874283 51,314 3.04 0.76 4.38 0.55 4.42 0.44 4.50 0.3774181* 13,847 3.45 0.86 5.20 0.65 5.11 0.51 5.19 0.43c432* 43,916 3.43 0.86 4.77 0.60 5.00 0.50 4.74 0.39
Table 3: Observed performance gains for the DXC benchmarks on a server with 12 hardwarethreads.
3.5.4 Additional Experiments
The details of additional experiments that were conducted to compare the proposed paral-lelization schemes with the sequential HS-Tree algorithm are presented in Section A.1 in theappendix. The results show that significant speedups can also be achieved for other Con-straint Satisfaction Problems (Section A.1.1) and ontologies (Section A.1.2). The appendixfurthermore contains an analysis of effects when adding more threads to the benchmarks ofthe CSPs and ontologies (Section A.1.3) and presents the results of a simulation experimentin which we systematically varied different problem characteristics (Section A.1.4).
3.5.5 Discussion
Overall, the results of the evaluations show that both parallelization approaches help to im-prove the performance of the diagnosis process, as for all tested scenarios both approachesachieved speedups. In most cases FP is faster than LWP. However, depending on thespecifics of the given problem setting, using LWP can be advantageous in some situations,e.g., when the time needed to generate each node is very small or when the conflict gener-ation time does not vary strongly. In these cases the synchronization overhead needed forFP is higher than the cost of waiting for all threads to finish. For the tested ontologies inSection A.1.2, this was the case in four of the tested scenarios.
Although FP is on average faster than LWP and significantly better than the sequentialHS-tree construction approach, for some of the tested scenarios its efficiency is still farfrom the optimum of 1. This can be explained by different effects. For example, the effectof false sharing can happen if the memory of two threads is allocated to the same block(Bolosky & Scott, 1993). Then every access to this memory block is synchronized althoughthe two threads do not really share the same memory. Another possible effect is called cache
851

Jannach, Schmitz, & Shchekotykhin
contention (Chandra, Guo, Kim, & Solihin, 2005). If threads work on different computingcores but share the same memory, cache misses can occur more often depending on theproblem characteristics and thus the theoretical optimum cannot be reached in these cases.
4. Parallel HS-Tree Construction with Multiple Conflicts Per Node
Both in the sequential and the parallel version of the HS-tree algorithm, the TheoremProver TP call corresponds to an invocation of QXP. Whenever a new node of the HS-treeis created, QXP searches for exactly one new conflict in case none of the already knownconflicts can be reused. This strategy has the advantage that the call to TP immediatelyreturns after one conflict has been determined. This in turn means that the other parallelexecution threads immediately “see” this new conflict in the shared data structures andcan, in the best case, reuse it when constructing new nodes.
A disadvantage of computing only one conflict at a time with QXP is that the searchfor conflicts is restarted on each invocation. We recently proposed a new conflict detectiontechnique called MergeXplain (MXP) (Shchekotykhin et al., 2015), which is capable ofcomputing multiple conflicts in one call. The general idea of MXP is to continue the searchafter the identification of the first conflict and look for additional conflicts in the remainingconstraints (or logical sentences) in a divide-and-conquer approach.
When combined with a sequential HS-tree algorithm, the effect is that during tree con-struction more time is initially spent for conflict detection before the construction continueswith the next node. In exchange, the chances of having a conflict available for reuse increasefor the next nodes. At the same time, the identification of some of the conflicts is less time-intensive as smaller sets of constraints have to be investigated due to the divide-and-conquerapproach of MXP. An experimental evaluation on various benchmark problems shows thatsubstantial performance improvements are possible in a sequential HS-tree scenario whenthe goal is to find a few leading diagnoses (Shchekotykhin et al., 2015).
In this section, we explore the benefits of using MXP with the parallel HS-tree con-struction schemes proposed in the previous section. When using MXP in combination withmultiple threads, the implicit effect is that more CPU processing power is devoted to con-flict generation as the individual threads need more time to complete the construction of anew node. In contrast to the sequential version, the other threads can continue with theirwork in parallel.
In the next section, we will briefly review the MXP algorithm before we report theresults of the empirical evaluation on our benchmark datasets (Section 4.2).
4.1 Background – QuickXplain and MergeXplain
Algorithm 7 shows the QXP conflict detection technique of Junker (2004) applied to theproblem of finding a conflict for a diagnosis problem during HS-tree construction.
QXP operates on two sets of constraints9 which are modified through recursive calls.The “background theory” B comprises the constraints that will not be considered anymoreto be part of a conflict at the current stage. At the beginning, this set contains SD, Obs,
9. We use the term constraints here as in the original formulation. As QXP is independent from theunderlying reasoning technique, the elements of the sets could be general logical sentences as well.
852

Parallel Model-Based Diagnosis on Multi-Core Computers
Algorithm 7: QuickXplain (QXP)
Input: A diagnosis problem (SD, Comps, Obs), a set visitedNodes of elementsOutput: A set containing one minimal conflict CS Ď C
1 B “ SDYObs Y {ab(c)|c P visitedNodes}; C “ t abpcq|c P CompszvisitedNodesu;2 if isConsistent(B Y C) then return ‘no conflict’;3 else if C “ H then return H;4 return tc| abpcq P getConflictpB,B, Cqu;
function getConflict (B, D, C)5 if D ‰ H^ isConsistent(B) then return H;6 if |C| “ 1 then return C;7 Split C into disjoint, non-empty sets C1 and C2
8 D2 Ð getConflict (B Y C1, C1, C2)9 D1 Ð getConflict (B YD2, D2, C1)
10 return D1 YD2;
and the set of nodes on the path to the current node of the HS-tree (visited nodes). Theset C represents the set of constraints in which we search for a conflict.
If there is no conflict or C is empty, the algorithm immediately returns. Otherwise get-Conflict is called, which corresponds to Junker’s QXP method with the minor differencethat getConflict does not require a strict partial order for the set of constraints C. Weintroduce this variant of QXP since we cannot always assume that prior fault informationis available that would allow us to generate this order.
The rough idea of QXP is to relax the input set of faulty constraints C by partitioningit into two sets C1 and C2. If C1 is a conflict, the algorithm continues partitioning C1 inthe next recursive call. Otherwise, i.e., if the last partitioning has split all conflicts of C sothat there are no conflicts left in C1, the algorithm extracts a conflict from the sets C1 andC2. This way, QXP finally identifies individual constraints which are inconsistent with theremaining consistent set of constraints and the background theory.
MXP builds on the ideas of QXP but computes multiple conflicts in one call (if theyexist). The general procedure is shown in Algorithm 8. After the initial consistency checks,the method findConflicts is called, which returns a tuple xC1,Γy, where C1 is a set ofremaining consistent constraints and Γ is a set of found conflicts. The function recursivelysplits the set C of constraints in two halves. These parts are individually checked forconsistency, which allows us to exclude larger consistent subsets of C from the search process.Besides the potentially identified conflicts, the calls to findConflicts also return two sets ofconstraints which are consistent (C11 and C12q. If the union of these two sets is not consistent,we look for a conflict within C11 Y C11 (and the background theory) in the style of QXP.
More details can be found in our earlier work, where also the results of an in-depthexperimental analysis are reported (Shchekotykhin et al., 2015).
853

Jannach, Schmitz, & Shchekotykhin
Algorithm 8: MergeXplain (MXP)
Input: A diagnosis problem (SD, Comps, Obs), a set visitedNodes of elementsOutput: Γ, a set of minimal conflicts
1 B “ SDYObs Y {ab(c)|c P visitedNodes}; C “ t abpcq|c P Compsz∆u;2 if isConsistentpBq then return ‘no solution’;3 if isConsistentpB Y Cq then return H;4 x ,Γy Ð findConflictspB, Cq5 return tc| abpcq P Γ};
function findConflicts (B, C) returns tuple xC1,Γy6 if isConsistent(B Y C) then return xC,Hy;7 if |C| “ 1 then return xH, tCuy;8 Split C into disjoint, non-empty sets C1 and C2
9 xC11,Γ1y Ð findConflictspB, C1q
10 xC12,Γ2y Ð findConflictspB, C2q
11 Γ Ð Γ1 Y Γ2;12 while isConsistentpC11 Y C12 Y Bq do13 X Ð getConflictpB Y C12, C12, C11q14 CS Ð X Y getConflictpB YX,X, C12q15 C11 Ð C11z tαu where α P X16 Γ Ð ΓY tCSu
17 return xC11 Y C12,Γy;
4.2 Evaluation
In this section we evaluate the effects of parallelizing the diagnosis process when we useMXP instead of QXP to calculate the conflicts. As in (Shchekotykhin et al., 2015) wefocus on finding a limited set of (five) minimal diagnoses.
4.2.1 Implementation Variants
Using MXP during parallel tree construction implicitly means that more time is allocatedfor conflict generation than when using QXP before proceeding to the next node. Toanalyze to which extent the use of MXP is beneficial we tested three different strategies ofusing MXP within the full parallelization method FP.
Strategy (1): In this configuration we simply called MXP instead of QXP during nodegeneration. Whenever MXP finds a conflict, it is added to the global list of known conflictsand can be (re-)used by other parallel threads. The thread that executes MXP during nodegeneration continues with the next node when MXP returns.
Strategy (2): This strategy implements a variant of MXP which is slightly more complex.Once MXP finds the first conflict, the method immediately returns this conflict such thatthe calling thread can continue exploring additional nodes. At the same time, a new back-ground thread is started which continues the search for additional conflicts, i.e., it completesthe work of the MXP call. In addition, whenever MXP finds a new conflict it checks ifany other already running node generation thread could have reused the conflict if it had
854

Parallel Model-Based Diagnosis on Multi-Core Computers
been available beforehand. If this is the case, the search for conflicts of this other threadis stopped as no new conflict is needed anymore. Strategy (2) could in theory result inbetter CPU utilization, as we do not have to wait for a MXP call to finish before we cancontinue building the HS-tree. However, the strategy also leads to higher synchronizationcosts between the threads, e.g., to notify working threads about newly identified conflicts.
Strategy (3): Finally, we parallelized the conflict detection procedure itself. Wheneverthe set C of constraints is split into two parts, the first recursive call of findConflicts isqueued for execution in a thread pool and the second call is executed in the current thread.When both calls are finished, the algorithm continues.
We experimentally evaluated all three configurations on our benchmark datasets. Ourresults showed that Strategy (2) did not lead to measurable performance improvementswhen compared to Strategy (1). The additional communication costs seem to be higherthan what can be saved by executing the conflict detection process in the background in itsown thread. Strategy (3) can be applied in combination with the other strategies, but similarto the experiments reported for the sequential HS-tree construction (Shchekotykhin et al.,2015), no additional performance gains could be observed due to the higher synchronizationcosts. The limited effectiveness of Strategies (2) and (3) can in principle be caused by thenature of our benchmark problems and these strategies might be more advantageous indifferent problem settings. In the following, we will therefore only report the results ofapplying Strategy (1).
4.2.2 Results for the DXC Benchmark Problems
The results for the DXC benchmarks are shown in Table 4. The left side of the table showsthe results when using QXP and the right hand side shows the results for MXP. Thespeedups shown in the FP columns refer to the respective sequential algorithms using thesame conflict detection technique.
Using MXP instead of QXP is favorable when using a sequential HS-tree algorithmas also reported in the work about MXP (Shchekotykhin et al., 2015). The reduction ofrunning times ranges from 17% to 44%. The speedups obtained through FP when usingMXP are comparable to FP using QXP and range from 1.33 to 2.10, i.e., they lead to areduction of the running times of up to 52%. These speedups were achieved in addition tothe speedups that the sequential algorithm using MXP could already achieve over QXP.
The best results are printed in bold face in Table 4 and using MXP in combinationwith FP consistently performs best. Overall, using FP in combination with MXP was38% to 76% faster than the sequential algorithm using QXP. These tests indicate thatour parallelization method works well also for conflict detection techniques that are morecomplex than QXP and, as in this case, return more than one conflict for each call. Inaddition, investing more time for conflict detection in situations where the goal is to find afew leading diagnoses proves to be a promising strategy.
4.2.3 Additional Experiments and Discussion
Again we ran additional experiments on constraint problems and ontology debugging prob-lems. The detailed results are provided in Section A.2.
855

Jannach, Schmitz, & Shchekotykhin
System Seq.(QXP) FP(QXP) Seq.(MXP) FP(MXP)[ms] S4 E4 [ms] S4 E4
74182 12 1.26 0.32 10 1.52 0.3874L85 15 1.36 0.34 12 1.33 0.3374283 49 1.58 0.39 35 1.48 0.3774181 699 1.99 0.55 394 2.10 0.53c432 3,714 1.77 0.44 2,888 1.72 0.43
Table 4: Observed performance gains for the DXC benchmarks (QXP vs MXP).
Overall, the results obtained when embedding MXP in the sequential algorithm confirmthe results by Shchekotykhin et al. (2015) that using MXP is favorable over QXP for allbut a few very small problem instances. However, we can also observe that allocating moretime for conflict detection with MXP in a parallel processing setup can help to furtherspeedup the diagnosis process when we search for a number of leading diagnoses. The best-performing configuration across all experiments is using the Full Parallelization method incombination with MXP as this setup led to the shortest computation times in 20 out ofthe 25 tested scenarios (DX benchmarks, CSPs, ontologies).
5. Parallelized Depth-First and Hybrid Search
In some application domains of MBD, finding all minimal diagnoses is either not requiredor simply not possible because of the computational complexity or application-specific con-straints on the allowed response times. For such settings, a number of algorithms have beenproposed over the years, which for example try to find one or a few minimal diagnoses veryquickly or find all diagnoses of a certain cardinality (Metodi, Stern, Kalech, & Codish, 2014;Feldman, Provan, & van Gemund, 2010b; de Kleer, 2011). In some cases, the algorithmscan in principle be extended or used to find all diagnoses. They are, however, not optimizedfor this task.
Instead of analyzing the various heuristic, stochastic or approximative algorithms pro-posed in the literature individually with respect to their potential for parallelization, we willanalyze in the next section if parallelization can be helpful already for the simple class ofdepth-first algorithms. In that context, we will also investigate if measurable improvementscan be achieved without using any (domain-specific) heuristic. Finally, we will propose ahybrid strategy which combines depth-first and full-parallel HS-tree construction and willconduct additional experiments to assess if this strategy can be advantageous for the taskof quickly finding one minimal diagnosis.
5.1 Parallel Random Depth-First Search
The section introduces a parallelized depth-first search algorithm to quickly find one singlediagnosis. As the different threads explore the tree in a partially randomized form, we callthe scheme Parallel Random Depth-First Search (PRDFS).
856

Parallel Model-Based Diagnosis on Multi-Core Computers
5.1.1 Algorithm Description
Algorithm 9 shows the main program of a recursive implementation of PRDFS. Similar tothe HS-tree algorithm, the search for diagnoses is guided by conflicts. This time, however,the algorithm greedily searches in a depth-first manner. Once a diagnosis is found, ithas to be checked for minimality because the diagnosis can contain redundant elements.The “minimization” of a non-minimal diagnosis can be achieved by calling a method likeInv-QuickXplain (Shchekotykhin et al., 2014) or by simply trying to remove one elementof the diagnosis after the other and checking if the resulting set is still a diagnosis.
Algorithm 9: diagnosePRDFS: Parallelized random depth-first search.
Input: A diagnosis problem (SD, Comps, Obs),the number minDiags of diagnoses to find
Result: The set ∆ of diagnoses
1 ∆ “ H; conflicts “ H;2 rootNode = getRootNode(SD, Comps, Obs);3 for i “ 1 to nbThreads do4 threads.execute(expandPRDFS(rootNode, minDiags, ∆, conflicts));
5 while |∆| ă minDiags do6 wait();
7 threads.shutdownNow();8 return ∆;
The idea of the parallelization approach in the algorithm is to start multiple threadsfrom the root node. All of these threads perform the depth-first search in parallel, but pickthe next conflict element to explore in a randomized manner.
The logic for expanding a node is shown in Algorithm 10. First, the conflict of thegiven node is copied, so that changes to this set of constraints will not affect the otherthreads. Then, as long as not enough diagnoses were found, a randomly chosen constraintfrom the current node’s conflict is used to generate a new node. The expansion function isthen immediately called recursively for the new node, thereby implementing the depth-firststrategy. Any identified diagnosis is minimized before being added to the list of knowndiagnoses. Similar to the previous parallelization schemes, the access to the global lists ofknown conflicts has to be made thread-safe. When the specified number of diagnoses isfound or all threads are finished, the statement threads.shutdownNow() immediately stopsthe execution of all threads that are still running and the results are returned. The semanticsof threads.execute(), wait(), and notify() are the same as in Section 3.
5.1.2 Example
Let us apply the depth-first method to the example from Section 2.2.1. Remember that thetwo conflicts for this problem were ttC1, C2, C3u, tC2, C4uu. A partially expanded tree forthis problem can be seen in Figure 2.
857

Jannach, Schmitz, & Shchekotykhin
Algorithm 10: expandPRDFS: Parallel random depth-first node expansion.
Input: An existingNode to expand, the number minDiags of diagnoses to find,the sets ∆ and conflicts
1 C = existingNode.conflict.clone(); // Copy existingNode’s conflict
2 while |∆| ă minDiags ^|C| ą 0 do3 Randomly pick a constraint c from C4 C “ Cztcu;5 newPathLabel = existingNode.pathLabel Y {c};6 node = new Node(newPathlabel);7 if D S P conflicts : S X newPathLabel “ H then8 node.conflict = S;9 else
10 node.conflict = checkConsistency(SD, Comps, Obs, node.pathLabel);
11 if node.conflict ‰ H then // New conflict found
12 conflicts = conflicts Y node.conflict;// Recursive call implements the depth-first search strategy
13 expandPRDFS(node, minDiags, ∆, conflicts);
14 else // Diagnosis found
15 diagnosis = minimize(node.pathLabel);16 ∆ “ ∆ Y {diagnosis};17 if |∆| ě minDiags then18 notify();
In the example, first the root node 1 is created and again the conflict tC1, C2, C3uis found. Next, the random expansion would, for example, pick the conflict element C1and generate node 2 . For this node, the conflict tC2, C4u will be computed because tC1ualone is not a diagnosis. Since the algorithm continues in a depth-first manner, it willthen pick one of the label elements of node 2 , e.g., C2 and generate node 3 . For thisnode, the consistency check succeeds, no further conflict is computed and the algorithm hasfound a diagnosis. The found diagnosis tC1, C2u is, however, not minimal as it containsthe redundant element C1. The function Minimize, which is called at the end of Algorithm10, will therefore remove the redundant element to obtain the correct diagnosis tC2u.
If we had used more than one thread in this example, one of the parallel threads wouldhave probably started expanding the root node using the conflict element C2 (node 4 ). Inthat case, the single element diagnosis tC2u would have been identified already at the firstlevel. Adding more parallel threads can therefore help to increase the chances to find onehitting set faster as different parts of the HS-tree are explored in parallel.
Instead of the random selection strategy, more elaborate schemes to pick the next nodesare possible, e.g., based on application-specific heuristics or fault probabilities. One couldalso better synchronize the search efforts of the different threads to avoid duplicate cal-culations. We conducted experiments with an algorithm variant that used a shared and
858

Parallel Model-Based Diagnosis on Multi-Core Computers
{C1,C2, C3}
C1C2
1
2
3
C3
{C2,C4} {C2,C4}
C2 C4 C2 C4
4
Figure 2: Example for HS-tree construction with PRDFS.
synchronized list of open nodes to avoid that two threads generate an identical sub-tree inparallel. We did, however, not observe significantly better results than with the methodshown in Algorithm 9 probably due to the synchronization overhead.
5.1.3 Discussion of Soundness and Completeness
Every single thread in the depth-first algorithm systematically explores the full search spacebased on the conflicts returned by the Theorem Prover. Therefore, all existing diagnoseswill be found when the parameter minDiags is equal or higher than the number of actuallyexisting diagnoses.
Whenever a (potentially non-minimal) diagnosis is encountered, the minimization pro-cess ensures that only minimal diagnoses are stored in the list of diagnoses. The duplicateaddition of the same diagnosis by one or more threads in the last lines of the algorithm isprevented because we consider diagnoses to be equal if they contain the same set of elementsand ∆ as a set by definition cannot contain the same element twice.
Overall, the algorithm is designed to find one or a few diagnoses quickly. The computa-tion of all minimal diagnoses is possible with the algorithm but highly inefficient, e.g., dueto the computational costs of minimizing the diagnoses.
5.2 A Hybrid Strategy
Let us again consider the problem of finding one minimal diagnosis. One can easily imaginethat the choice of the best parallelization strategy, i.e., breadth-first or depth-first, candepend on the specifics of the given problem setting and the actual size of the existingdiagnoses. If a single-element diagnosis exists, exploring the first level of the HS-tree in abreadth-first approach might be the best choice (see Figure 3(a)). A depth-first strategymight eventually include this element in a non-minimal diagnosis, but would then have todo a number of additional calculations to ensure the minimality of the diagnosis.
If, in contrast, the smallest actually existing diagnosis has a cardinality of, e.g., five,the breadth-first scheme would have to fully explore the first four HS-tree levels beforefinding the five-element diagnosis. The depth-first scheme, in contrast, might quickly find
859

Jannach, Schmitz, & Shchekotykhin
a superset of the five-element diagnosis, e.g., with six elements, and then only needs sixadditional consistency checks to remove the redundant element from the diagnosis (Figure3(b)).
Diagnosis detected
Diagnosis detected
(a) Breadth-first strategy is advantageous.
Diagnosis detected
Diagnosis detected
(b) Depth-first strategy is advantageous.
Figure 3: Two problem configurations for which different search strategies are favorable.
Since we cannot know the cardinality of the diagnoses in advance, we propose a hybridstrategy, in which half of the threads adopt a depth-first strategy and the other half usesthe fully parallelized breadth-first regime. To implement this strategy, the Algorithms 5(FP) and 9 (PRDFS) can be started in parallel and each algorithm is allowed to use onehalf or some other defined share of the available threads. The coordination between thetwo algorithms can be done with the help of shared data structures that contain the knownconflicts and diagnoses. When enough diagnoses (e.g. one) are found, all running threadscan be terminated and the results are returned.
5.3 Evaluation
We evaluated the different strategies for efficiently finding one minimal diagnosis on thesame set of benchmark problems that were used in the previous sections. The experimentsetup was identical except that the goal was to find one arbitrary diagnosis and that weincluded the additional depth-first algorithms. In order to measure the potential benefits ofparallelizing the depth-first search, we ran the benchmarks for PRDFS both with 4 threadsand with 1 thread, where the latter setup corresponds to a Random Depth First Search(RDFS) without parallelization.
5.3.1 Results for the DXC Benchmark Problems
The results for the DXC benchmark problems are shown in Table 5. Overall, for all testedsystems, each of the approaches proposed in this paper can help to speed up the processof finding one single diagnosis. In 88 of the 100 evaluated scenarios at least one of thetested approaches was statistically significantly faster than the sequential algorithm. Forthe other 12 scenarios, finding one single diagnosis was too simple so that only modest butno significant speedups compared to the sequential algorithm were obtained.
When comparing the individual parallel algorithms, the following observations can bemade:
860

Parallel Model-Based Diagnosis on Multi-Core Computers
• For most of the examples, the PRDFS method is faster than the breadth-first searchimplemented in the FP technique. For one benchmark system, the PRDFS approachcan even achieve a speedup of 11 compared to the sequential algorithm, which corre-sponds to a runtime reduction of 91%.
• When compared with the non-parallel RDFS, PRDFS could achieve higher speedupsfor all tested systems except the most simple one, which only took 16 ms even for thesequential algorithm. Overall, parallelization can therefore be advantageous also fordepth-first strategies.
• The performance of the Hybrid strategy lies in between the performances of its com-ponents PRDFS and FP for 4 of the 5 tested systems. For these systems, it is closer tothe faster one of the two. Adopting the hybrid strategy can therefore represent a goodchoice when the structure of the problem is not known in advance, as it combines bothideas of breadth-first and depth-first search and is able to quickly find a diagnosis forproblem settings with unknown characteristics.
System Seq. FP RDFS PRDFS Hybrid[ms] S4 E4 [ms] S4 E4 S4 E4
74182 16 1.37 0.34 9 0.84 0.21 0.84 0.2174L85 13 1.34 0.33 11 1.06 0.27 1.05 0.2674283 54 1.67 0.42 25 1.22 0.31 1.06 0.2674181 691 2.08 0.52 74 1.23 0.31 1.04 0.26c432 2,789 1.89 0.47 1,435 2.96 0.74 1.81 0.45
Table 5: Observed performance gains for DXC benchmarks for finding one diagnosis.
5.3.2 Additional Experiments
The detailed results obtained through additional experiments are again provided in theappendix. The measurements include the results for CSPs (Section A.3.1) and ontologies(Section A.3.2), as well as results that were obtained by systematically varying the charac-teristics of synthetic diagnosis problems (Section A.3.3). The results indicate that applyinga depth-first parallelization strategy in many cases is advantageous for the CSP problems.The tests on the ontology problems and the simulation results however reveal that depend-ing on the problem structure there are cases in which a breadth-first strategy can be morebeneficial.
5.3.3 Discussion
The experiments show that the parallelization of the depth-first search strategy (PRDFS)can help to further reduce the computation times when we search for one single diagnosis.
In most evaluated cases, PRDFS was faster than its sequential counterpart. In somecases, however, the obtained improvements were quite small or virtually non-existent, whichcan be explained as follows.
861

Jannach, Schmitz, & Shchekotykhin
• For the very small scenarios, the parallel depth-first search cannot be significantlyfaster than the non-parallel variant because the creation of the first node is not paral-lelized. Therefore a major fraction of the tree construction process is not parallelizedat all.
• There are problem settings in which all existing diagnoses have the same size. Allparallel depth-first searching threads therefore have to explore the tree to a certaindepth and none of the threads can immediately return a diagnosis that is much smallerthan one determined by another thread. E.g., given a diagnosis problem, where alldiagnoses have size 5, all threads have to explore the tree to at least level 5 to find adiagnosis and are also very likely to find a diagnosis on that level. Therefore, in thissetting no thread can be much faster than the others.
• Finally, we again suspect problems of cache contention and a correspondingly in-creased number of cache misses, which leads to a general performance deteriorationand overhead caused by the multiple threads.
Overall, the obtained speedups again depend on the problem structure. The hybridtechnique represents a good compromise for most cases as it is faster than the sequentialbreadth first search approach for most of the tested scenarios (including the CSPs, on-tologies, and synthetically created diagnosis problems presented in Section A.3). Also, itis more efficient than PRDFS in some cases for which breadth first search is better thandepth first search.
6. Parallel Direct CSP Encodings
As an alternative to conflict-guided diagnosis approaches like Reiter’s hitting set technique,so-called “direct encodings” have become more popular in the research community in recentyears (Feldman, Provan, de Kleer, Robert, & van Gemund, 2010a; Stern, Kalech, Feldman,& Provan, 2012; Metodi et al., 2014; Mencia & Marques-Silva, 2014; Mencıa, Previti, &Marques-Silva, 2015; Marques-Silva, Janota, Ignatiev, & Morgado, 2015).10
The general idea of direct encodings is to generate a specific representation of a diagnosisproblem instance with some knowledge representation language and then use the theoremprover (e.g., a SAT solver or constraint engine) to compute the diagnoses directly. Thesemethods support the generation of one or multiple diagnoses by calling a theorem proveronly once. Nica, Pill, Quaritsch, and Wotawa (2013) made a number of experiments inwhich they compared conflict-directed search with such direct encodings and showed thatfor several problem settings, using the direct encoding was advantageous.
In this part of the paper, our goal is to evaluate whether the parallelization of the searchprocess – in that case inside the constraint engine – can help to improve the efficiency ofthe diagnostic reasoning process. The goal of this chapter is therefore rather to quantifyto which extent the internal parallelization of a solver is useful than to present a newalgorithmic contribution.
10. Such direct encodings may not always be possible in MBD settings as discussed above.
862

Parallel Model-Based Diagnosis on Multi-Core Computers
6.1 Using Gecode as a Solver for Direct Encodings
For our evaluation we use the Gecode constraint solver (Schulte, Lagerkvist, & Tack, 2016).In particular, we use the parallelization option of Gecode to test its effects on the diagnosisrunning times.11 The chosen problem encoding is similar to the one used by Nica andWotawa (2012). This allows us to make our results comparable with those obtained inprevious works. In addition, the provided encoding is represented in a language which issupported by multiple solvers.
6.1.1 Example
Let us first show the general idea on a small example. Consider the following CSP12
consisting of the integer variables a1, a2, b1, b2, c1 and the constraints X1, X2, and X3
which are defined as:
X1 : b1 “ a1ˆ 2, X2 : b2 “ a2ˆ 3, X3 : c1 “ b1ˆ b2.
Let us assume that the programmer made a mistake and X3 should actually be c1 “b1 ` b2. Given a set of expected observations (a test case) a1 “ 1, a2 “ 6, d1 “ 20, MBDcan be applied by considering the constraints as the possibly faulty components.
In a direct encoding the given CSP is extended with a definition of an array AB “
rab1, ab2, ab3s of boolean (0/1) variables which encode whether a corresponding constraintis considered as faulty or not. The constraints are rewritten as follows:
X 11 : ab1 _ pb1 “ a1ˆ 2q, X 12 : ab2 _ pb2 “ a2ˆ 3q, X 13 : ab3 _ pc1 “ b1ˆ b2q.
The observations can be encoded through equality constraints which bind the values ofthe observed variables. In our example, these constraints would be:
O1 : a1 “ 1, O2 : a2 “ 6, O3 : d1 “ 20
In order to find a diagnosis of cardinality 1, we additionally add the constraint
ab1 ` ab2 ` ab3 “ 1
and let the solver search for a solution. In this case, X3 would be identified as the onlypossible diagnosis, i.e., ab3 would be set to “1” by the solver.
6.1.2 Parallelization Approach of Gecode
When using such a direct encoding, a parallelization of the diagnosis process, as shownfor Reiter’s approach, cannot be done because it is embedded in the underlying searchprocedure. However, modern constraint solvers, such as Gecode, or-tools and many othersolvers of those that participated in the MiniZinc Challenge (Stuckey, Feydy, Schutt, Tack,& Fischer, 2014), internally implement parallelization strategies to better utilize today’smulti-core computer architectures (Michel, See, & Van Hentenryck, 2007; Chu, Schulte, &
11. A state-of-the-art SAT solver capable of parallelization could have been used for this analysis as well.12. Adapted from an earlier work (Jannach & Schmitz, 2014).
863

Jannach, Schmitz, & Shchekotykhin
Stuckey, 2009). In the following, we will therefore evaluate through a set of experiments, ifthese solver-internal parallelization techniques can help to speed up the diagnosis processwhen a direct encoding is used.13
Gecode implements an adaptive work stealing strategy (Chu et al., 2009) for its par-allelization. The general idea can be summarized as follows. As soon as a thread finishesprocessing its nodes of the search tree, it “steals” some of the nodes from non-idle threads.In order to decide from which thread the work should be stolen, an adaptive strategy usesbalancing heuristics that estimate the density of the solutions in a particular part of thesearch tree. The higher the likelihood of containing a solution for a given branch, the morework is stolen from this branch.
6.2 Problem Encoding
In our evaluation we use MiniZinc as a constraint modeling language. This language canbe processed by different solvers and allows us to model diagnosis problems as CSPs asshown above.
6.2.1 Finding One Diagnosis
To find a single diagnosis for a given diagnosis problem (SD, Comps, Obs), we generate adirect encoding in MiniZinc as follows.
(1) For the set of components Comps we generate an array ab = [ab1, . . . , abn] ofboolean variables.
(2) For each formula sdi P SD we add a constraint of the formconstraint abris _ psdiq;
and for each observation oj P Obs the model is extended with a constraintconstraint oj ;
(3) Finally, we add the search goal and an output statement:solve minimize sumpi in 1..nqpbool2intpabrisqq;output[show(ab)];
The first statement of the last part (solve minimize), instructs the solver to search fora (single) solution with a minimal number of abnormal components, i.e., a diagnosis withminimum cardinality. The second statement (output) projects all assignments to the setof abnormal variables, because we are only interested in knowing which components arefaulty. The assignments of the other problem variables are irrelevant.
6.2.2 Finding All Diagnoses
The problem encoding shown above can be used to quickly find one/all diagnoses of min-imum cardinality. It is, however, not sufficient for scenarios where the goal is to find alldiagnoses of a problem. We therefore propose the following sound and complete algorithmwhich repeatedly modifies the constraint problem to systematically identify all diagnoses.
13. In contrast to the parallelization approaches presented in the previous sections, we do not propose anynew parallelization schemes here but rather rely on the existing ones implemented in the solver.
864

Parallel Model-Based Diagnosis on Multi-Core Computers
Technically, the algorithm first searches for all diagnoses of size 1 and then increases thedesired cardinality of the diagnoses step by step.
Algorithm 11: directDiag: Computation of all diagnoses using a direct encoding.
Input: A diagnosis problem (SD, Comps, Obs), maximum cardinality kResult: The set ∆ of diagnoses
1 ∆ “ H; C “ H; card “ 1;2 if k ą |Comps| then k “ |Comps|;3 M = generateModel (SD, Comps, Obs);4 while card ď k do5 M = updateModel (M, card , C);6 ∆1 “ computeDiagnosespMq;7 C “ C Y generateConstraintsp∆1q;8 ∆ “ ∆Y∆1;9 card “ card ` 1;
10 return ∆;
Procedure Algorithm 10 shows the main components of the direct diagnosis method usedin connection with a parallel constraint solver to find all diagnoses. The algorithm startswith the generation of a MiniZinc model (generateModel) as described above. Theonly difference is that we will now search for all solutions of a given cardinality; furtherdetails about the encoding of the search goals are given below.
In each iteration, the algorithm modifies the model by updating the cardinality of thesearched diagnoses and furthermore adds new constraints corresponding to the alreadyfound diagnoses (updateModel). This updated model is then provided to a MiniZincinterpreter (constraint solver), which returns a set of solutions ∆1. Each element δi P ∆1
corresponds to a diagnosis of the cardinality card .
In order to exclude supersets of the already found diagnoses ∆1 in future iterations, wegenerate a constraint for each δi P ∆1 with the formulas j to l (generateConstraints):
constraint abrjs “ false _ ¨ ¨ ¨ _ abrls “ false;
These constraints ensure that an already found diagnosis or supersets of it cannot be foundagain. They are added to the modelM in the next iteration of the main loop. The algorithmcontinues until all diagnoses with cardinalities up to k are computed.
Changes in Encoding To calculate all diagnoses of a given size, we first instruct thesolver to search for all possible solutions when provided with a constraint problem.14 Inaddition, while keeping steps (1) and (2) from Section 6.2.1 we replace the lines of step (3)
14. This is achieved by calling MiniZinc with the --all-solutions flag.
865

Jannach, Schmitz, & Shchekotykhin
by the following statements:
constraint sumpi in 1..nqpbool2intpabrisqq “ card ;
solve satisfy;
output[show(ab)];
The first statement constrains the number of abnormal variables that can be true to acertain value, i.e., the given cardinality card. The second statement tells the solver to findall variable assignments that satisfy the constraints. The last statement again guaranteesthat the solver only considers the solutions to be different when they are different withrespect to the assignments of the abnormal variables.
Soundness and Completeness Algorithm 10 implements an iterative deepening ap-proach which guarantees the minimality of the diagnoses in ∆. Specifically, the algorithmconstructs diagnoses in the order of increasing cardinality by limiting the number of abvariables that can be set to true in a model. The computation starts with card “ 1, whichmeans that only one ab variable can be true. Therefore, only diagnoses of cardinality 1,i.e., comprising only one abnormal variable, can be returned by the solver. For each founddiagnosis we then add a constraint that requires at least one of the abnormal variables ofthis diagnosis to be false. Therefore, neither this diagnosis nor its supersets can be foundin the subsequent iterations. These constraints implement the pruning rule of the HS-treealgorithm. Finally, Algorithm 10 repeatedly increases the cardinality parameter card byone and continues with the next iteration. The algorithm continues to increment the car-dinality until card becomes greater than the number of components, which corresponds tothe largest possible cardinality of a diagnosis. Consequently, given a diagnosis problem aswell as a sound and complete constraint solver, Algorithm 10 returns all diagnoses of theproblem.
6.3 Evaluation
To evaluate if speedups can be achieved through parallelization also for a direct encoding,we again used the first five systems of the DXC Synthetic Track and tested all scenariosusing the Gecode solver without parallelization and with 2 and 4 parallel threads.
6.3.1 Results
We evaluated two different configurations. In setup (A), the task was to find one singlediagnosis of minimum cardinality. In setup (B), the iterative deepening procedure fromSection 6.2.2 was used to find all diagnoses up to the size of the actual error.
The results for setup (A) are shown in Table 6. We can observe that using the parallelconstraint solver pays off except for the tiny problems for which the overall search time isless than 200 ms. Furthermore, adding more worker threads is also beneficial for the largerproblem sizes and a speedup of up to 1.25 was achieved for the most complex test casewhich took about 1.5 seconds to solve.
The same pattern can be observed for setup (B). The detailed results are listed in Table7. For the tiny problems, the internal parallelization of the Gecode solver does not leadto performance improvements but slightly slows down the whole process. As soon as the
866

Parallel Model-Based Diagnosis on Multi-Core Computers
problems become more complex, parallelization pays off and we can observe a speedup of1.55 for the most complex of the tested cases, which corresponds to a runtime reduction of35%.
System Direct EncodingAbs. [ms] S2 E2 S4 E4
74182 27 0.85 0.42 0.79 0.2074L85 30 0.89 0.44 0.79 0.2074283 32 0.85 0.43 0.79 0.2074181 200 1.04 0.52 1.15 0.29c432 1,399 1.17 0.58 1.25 0.31
Table 6: Observed performance gains for DXC benchmarks for finding one diagnosis witha direct encoding using one (column Abs.), two, and four threads.
System Direct EncodingAbs. [ms] S2 E2 S4 E4
74182 136 0.84 0.42 0.80 0.2074L85 60 0.83 0.41 0.77 0.1974283 158 0.93 0.47 0.92 0.2374181 1,670 1.19 0.59 1.33 0.33c432 229,869 1.22 0.61 1.55 0.39
Table 7: Observed performance gains for DXC benchmarks for finding all diagnoses with adirect encoding using one (column Abs.), two, and four threads.
6.3.2 Summary and Remarks
Overall, our experiments show that parallelization can be beneficial when a direct encodingof the diagnosis problem is employed, in particular when the problems are non-trivial.
Comparing the absolute running times of our Java implementation using the open sourcesolver Choco with the optimized C++ implementation of Gecode is generally not appro-priate and for most of the benchmark problems, Gecode works faster on an absolute scale.Note, however, that this is not true in all cases. In particular when searching for all di-agnoses up to the size of the actual error for the most complex system c432, even Reiter’snon-parallelized Hitting Set algorithm was much faster (85 seconds) than using the directencoding based on iterative deepening (230 seconds). This is in line with the observationof Nica et al. (2013) that direct encodings are not always the best choice when searchingfor all diagnoses.
A first analysis of the run-time behavior of Gecode shows that the larger the problem is,the more time is spent by the solver in each iteration to reconstruct its internal structures,which can lead to a measurable performance degradation. Note that in our work we reliedon a MiniZinc encoding of the diagnosis problem to be independent of the specifics of the
867

Jannach, Schmitz, & Shchekotykhin
underlying constraint engine. An implementation that relies on the direct use of the API ofa specific CSP solver might help to address certain performance issues. Nevertheless, suchan implementation must be solver-specific and will not allow us to switch solvers easily asit is now possible with MiniZinc..
7. Relation to Previous Works
In this section we explore works that are related to our approach. First we examine differentapproaches for the computation of diagnoses. Then we will focus on general methods forparallelizing search algorithms.
7.1 Computation of Diagnoses
Computing minimal hitting sets for a given set of conflicts is a computationally hard problemas already discussed in Section 2.2.2 and several approaches were proposed over the years todeal with the issue. These approaches can be divided into exhaustive and approximate ones.The former perform a sound and complete search for all minimal diagnoses, whereas thelatter improve the computational efficiency in exchange for completeness, e.g., they searchfor only one or a small set of diagnoses.
Approximate approaches can for example be based on stochastic search techniques likegenetic algorithms (Li & Yunfei, 2002) or greedy stochastic search (Feldman et al., 2010b).The greedy method proposed by Feldman et al. (2010b), for example, uses a two-stepapproach. In the first phase, a random and possibly non-minimal diagnosis is determinedby a modified DPLL15 algorithm. The algorithm always finds one random diagnosis at eachinvocation due to the random selection of propositional variables and their assignments. Inthe second step, the algorithm minimizes the diagnosis returned by the DPLL technique byrepeatedly applying random modifications. It randomly chooses a negative literal whichdenotes that a corresponding component is faulty and flips its value to positive. Theobtained candidate as well as the diagnosis problem are provided to the DPLL algorithmto check whether the candidate is a diagnosis or not. In case of success the obtaineddiagnosis is kept and another random flip is done. Otherwise, the negative literal is labeledwith “failure” and another negative literal is randomly selected. The algorithm stops if thenumber of “failures” is greater than some predefined constant and returns the best diagnosisfound so far.
In the approach of Li and Yunfei (2002) a genetic algorithm takes a number of conflictsets as input and generates a set of bit-vectors (chromosomes), where every bit encodes atruth value of an atom over the ab(.) predicate. In each iteration the algorithm appliesgenetic operations, such as mutation, crossover, etc., to obtain new chromosomes. Sub-sequently, all obtained bit-vectors are evaluated by a “hitting set” fitting function whicheliminates bad candidates. The algorithm stops after a predefined number of iterations andreturns the best diagnosis.
In general, such approximate approaches are not directly comparable with our LWP andFP techniques, since they are incomplete and do not guarantee the minimality of returned
15. Davis-Putnam-Logemann-Loveland.
868

Parallel Model-Based Diagnosis on Multi-Core Computers
hitting sets. Our goal in contrast is to improve the performance while at the same timemaintaining both the completeness and the soundness property.
Another way of finding approximate solutions is to use heuristic search approaches. Forexample, Abreu and van Gemund (2009) proposed the Staccato algorithm which appliesa number of heuristics for pruning the search space. More “aggressive” pruning techniquesresult in better performance of the search algorithms. However, they also increase the prob-ability that some of the diagnoses will not be found. In this approach the “aggressiveness”of the heuristics can be varied by input parameters depending on the application goals.
More recently, Cardoso and Abreu (2013) suggested a distributed version of the Stac-cato algorithm, which is based on the Map-Reduce scheme (Dean & Ghemawat, 2008) andcan therefore be executed on a cluster of servers. Other more recent algorithms focus onthe efficient computation of one or more minimum cardinality (minc) diagnoses (de Kleer,2011). Both in the distributed approach and in the minimum cardinality scenario, the as-sumption is that the (possibly incomplete) set of conflicts is already available as an inputat the beginning of the hitting-set construction process. In the application scenarios thatwe address with our work, finding the conflicts is considered to be the computationallyexpensive part and we do not assume to know the minimal conflicts in advance but haveto compute them “on-demand” as also done in other works (Felfernig, Friedrich, Jannach,Stumptner, et al., 2000; Friedrich & Shchekotykhin, 2005; Williams & Ragno, 2007); see alsothe work by Pill, Quaritsch, and Wotawa (2011) for a comparison of conflict computationapproaches.
Exhaustive approaches are often based on HS-trees like the work of Wotawa (2001a) –a tree construction algorithm that reduces the number of pruning steps in presence of non-minimal conflicts. Alternatively, one can use methods that compute diagnoses without theexplicit computation of conflict sets, i.e., by solving a problem dual to minimal hitting sets(Satoh & Uno, 2005). Stern et al. (2012), for example, suggest a method that explores theduality between conflicts and diagnoses and uses this symmetry to guide the search. Otherapproaches exploit the structure of the underlying problem, which can be hierarchical (Autio& Reiter, 1998), tree-structured (Stumptner & Wotawa, 2001), or distributed (Wotawa &Pill, 2013). These algorithms are very similar to the HS-tree algorithm and, consequently,can be parallelized in a similar way. As an example, consider the Set-Enumeration Tree(SE-tree) algorithm (Rymon, 1994). This algorithm, similarly to Reiter’s HS-tree approach,uses breadth-first search with a specific expansion procedure that implements the pruningand node selection strategies. Both the LWP and and the FP parallelization variant can beused with the SE-tree algorithm and comparable speedups are expected.
7.2 Parallelization of Search Algorithms
Historically, the parallelization of search algorithms was approached in three different ways(Burns, Lemons, Ruml, & Zhou, 2010):
(i) Parallelization of node processing : When applying this type of parallelization, the treeis expanded by one single process, but the computation of labels or the evaluation ofheuristics is done in parallel.
869

Jannach, Schmitz, & Shchekotykhin
(ii) Window-based processing : In this approach, sets of nodes, called “windows”, are pro-cessed by different threads in parallel. The windows are formed by the search algorithmaccording to some predefined criteria.
(iii) Tree decomposition approaches: Here, different sub-trees of the search tree are as-signed to different processes (Ferguson & Korf, 1988; Brungger, Marzetta, Fukuda, &Nievergelt, 1999).
In principle, all three types of parallelization can be applied in some form to the HS-treegeneration problem.
Applying strategy (i) in the MBD problem setting would mean to parallelize the processof conflict computation, e.g., through a parallel variant of QXP or MXP. We have testeda partially parallelized version of MXP, which however did not lead to further performanceimprovements when compared to a single-threaded approach on the evaluated benchmarkproblems (Shchekotykhin et al., 2015). The experiments in Section 4 however show thatusing MXP in combination with LWP or FP – thereby implicitly allocating more CPU timefor the computation of multiple conflicts during the construction of a single node – can be ad-vantageous. Other well-known conflict or prime implicate computation algorithms (Junker,2004; Marques-Silva et al., 2013; Previti, Ignatiev, Morgado, & Marques-Silva, 2015) incontrast were not designed for parallel execution or the computation of multiple conflicts.
Strategy (ii) – computing sets of nodes (windows) in parallel – was for example applied byPowley and Korf (1991). In their work the windows are determined by different thresholdsof a heuristic function of Iterative Deepening A*. Applying the strategy to an HS-treeconstruction problem would mean to categorize the nodes to be expanded according tosome criterion, e.g., the probability of finding a diagnosis, and to allocate the differentgroups to individual threads. In the absence of such window criteria, LWP and FP could beseen as extreme cases with window size one, where each open node is allocated to one threadon a processor. The experiments done throughout the paper suggest that independent of theparallelization strategy (LWP or FP) the number of parallel threads (windows) should notexceed the number of physically available computing threads to obtain the best performance.
Finally (iii), the strategy exploring different sub-trees during the search with differentprocesses can, for example, be applied in the context of MBD techniques when using BinaryHS-Tree (BHS) algorithms (Pill & Quaritsch, 2012). Given a set of conflict sets, the BHSmethod generates a root node and labels it with the input set of conflicts. Then, it selectsone of the components occurring in the conflicts and generates two child nodes, such thatthe left node is labeled with all conflicts comprising the selected component and the rightnode with the remaining ones. Consequently, the diagnosis tree is decomposed into two sub-trees and can be processed in parallel. The main problem for this kind of parallelization isthat the conflicts are often not known in advance and have to be computed during search.
Anglano and Portinale (1996) suggested another approach in which they ultimatelyparallelized the diagnosis problem based on structural problem characteristics. In theirwork, they first map a given diagnosis problem to a Behavioral Petri Net (BPN). Then,the obtained BPN is manually partitioned into subnets and every subnet is provided to adifferent Parallel Virtual Machine (PVM) for parallel processing. The relationship of theirwork to our LWP and FP parallelization schemes is limited and our approaches also do notrequire a manual problem decomposition step.
870

Parallel Model-Based Diagnosis on Multi-Core Computers
In general, parallelized versions of domain-independent search algorithms like A˚ canbe applied to MBD settings. However, the MBD problem has some specifics that make theapplication of some of these algorithms difficult. For instance, the PRA˚ method and itsvariant HDA˚ discussed in the work of Burns et al. (2010) use a mechanism to minimize thememory requirements by retracting parts of the search tree. These “forgotten” parts arelater on re-generated when required. In our MBD setting, the generation of nodes is howeverthe most costly part, which is why the applicability of HDA˚ seems limited. Similarly,duplicate detection algorithms like PBNF (Burns et al., 2010) require the existence of anabstraction function that partitions the original search space into blocks. In general MBDsettings, we however cannot assume that such a function is given.
In order to improve the performance we have therefore to avoid the parallel generationof duplicate nodes by different threads, which we plan to investigate in our future work.A promising starting point for this research could be the work by Phillips, Likhachev,and Koenig (2014). The authors suggest a variant of the A* algorithm that generates onlyindependent nodes in order to reduce the costs of node generation. Two nodes are consideredas independent if the generation of one node does not lead to a change of the heuristicfunction of the other node. The generation of independent nodes can be done in parallelwithout the risk of the repeated generation of an already known state. The main difficultywhen adopting this algorithm for MBD is the formulation of an admissible heuristic requiredto evaluate the independence of the nodes for arbitrary diagnosis problems. However, forspecific problems that can be encoded as CSPs, Williams and Ragno (2007) present aheuristic that depends on the number of unassigned variables at a particular search node.
Finally, parallelization was also used in the literature to speed up the processing of verylarge search trees that do not fit in memory. Korf and Schultze (2005), for instance, suggestan extension of a hash-based delayed duplicate detection algorithm that allows a searchalgorithm to continue search while other parts of the search tree are written to or read fromthe hard drive. Such methods can in theory be used in combination with our LWP or FPparallelization schemes in case of complex diagnosis problems. We plan to explore the useof (externally) saved search states in the context of MBD as part of our future works.
8. Summary
In this work, we propose and systematically evaluate various parallelization strategies forModel-Based Diagnosis to better exploit the capabilities of multi-core computers. We showthat parallelization can be advantageous in various problem settings and diagnosis ap-proaches. These approaches include the conflict-driven search for all or a few minimaldiagnoses with different conflict detection techniques and the (heuristic) depth-first searchin order to quickly determine a single diagnosis. The main benefits of our parallelizationapproaches are that they can be applied independent of the underlying reasoning engine andfor a variety of diagnostic problems which cannot be efficiently represented as SAT or CSPproblems. In addition to our HS-tree based parallelization approaches, we also show thatparallelization can be beneficial for settings in which a direct problem encoding is possibleand modern parallel solver engines are available.
Our evaluations have furthermore shown that the speedups of the proposed paralleliza-tion methods can vary according to the characteristics of the underlying diagnosis problem.
871

Jannach, Schmitz, & Shchekotykhin
In our future work, we plan to explore techniques that analyze these characteristics in orderto predict in advance which parallelization method is best suited to find one single or alldiagnoses for the given problem.
Regarding algorithmic enhancements, we furthermore plan to investigate how informa-tion about the underlying problem structure can be exploited to achieve a better distri-bution of the work on the parallel threads and to thereby avoid duplicate computations.Furthermore, we plan to explore the usage of parallel solving schemes for the dual algo-rithms, i.e., algorithms that compute diagnoses directly without the computation of min-imal conflicts (Satoh & Uno, 2005; Felfernig, Schubert, & Zehentner, 2012; Stern et al.,2012; Shchekotykhin et al., 2014).
The presented algorithms were designed for the use on modern multi-core computerswhich today usually have less than a dozen cores. Our results show that the additional per-formance improvements that we obtain with the proposed techniques become smaller whenadding more and more CPUs. As part of our future works we therefore plan to developalgorithms that can utilize specialized environments that support massive parallelization.In that context, a future topic of research could be the adaption of the parallel HS-treeconstruction to GPU architectures. GPUs, which can have thousands of computing cores,have proved to be superior for tasks which can be parallelized in a suitable way. Campeotto,Palu, Dovier, Fioretto, and Pontelli (2014) for example used a GPU to parallelize a con-straint solver. However, it is not yet fully clear whether tree construction techniques canbe efficiently parallelized on a GPU, as many data structures have to be shared across allnodes and access to them has to be synchronized.
Acknowledgements
This paper significantly extends and combines our previous work (Jannach, Schmitz, &Shchekotykhin, 2015; Shchekotykhin et al., 2015).
We would like to thank Hakan Kjellerstrand and the Gecode team for their support. Weare also thankful for the various helpful comments and suggestions made by the anonymousreviewers of JAIR, DX’14, DX’15, AAAI’15, and IJCAI’15.
This work was supported by the Carinthian Science Fund (KWF) contract KWF-3520/26767/38701, the Austrian Science Fund (FWF) and the German Research Foun-dation (DFG) under contract numbers I 2144 N-15 and JA 2095/4-1 (Project “Debuggingof Spreadsheet Programs”).
Appendix A.
In this appendix we report the results of additional experiments that were made on differentbenchmark problems as well as results of simulation experiments on artificially createdproblem instances.
• Section A.1 contains the results for the LWP and FP parallelization schemes proposedin Section 3.
• Section A.2 reports additional measurements regarding the use of MergeXplainwithin the parallel diagnosis process, see Section 4.
872

Parallel Model-Based Diagnosis on Multi-Core Computers
• Section A.3 finally provides additional results of the parallelization of the depth-firststrategies discussed in Section 5.
A.1 Additional Experiments for the LWP and FP Parallelization Strategies
In addition to the experiments with the DXC benchmark systems reported in Section 3.5,we made additional experiments with Constraint Satisfaction Problems, ontologies, andartificial Hitting Set construction problems. Furthermore, we examined the effects of furtherincreasing the number of available threads for the benchmarks of the CSPs and ontologies.
A.1.1 Diagnosing Constraint Satisfaction Problems
Data Sets and Procedure In this set of experiments we used a number of CSP instancesfrom the 2008 CP solver competition (Lecoutre, Roussel, & van Dongen, 2008) in whichwe injected faults.16 The diagnosis problems were created as follows. We first generateda random solution using the original CSP formulations. From each solution, we randomlypicked about 10% of the variables and stored their value assignments, which then servedas test cases. These stored variable assignments correspond to the expected outcomes whenall constraints are formulated correctly. Next, we manually inserted errors (mutations) inthe constraint problem formulations17, e.g., by changing a “less than” operator to a “morethan” operator, which corresponds to a mutation-based approach in software testing. Thediagnosis task then consists of identifying the possibly faulty constraints using the partialtest cases. In addition to the benchmark CSPs we converted a number of spreadsheetdiagnosis problems (Jannach & Schmitz, 2014) to CSPs to test the performance gains onrealistic application settings.
Table 8 shows the problem characteristics including the number of injected faults (#F),the number of diagnoses (#D), and the average diagnosis size (|D|). In general, we selectedCSPs which are quite diverse with respect to their size.
Results The measurement results using 4 threads and searching for all diagnoses are givenin Table 9. Improvements could be achieved for all problem instances. With the exceptionof the smallest problem mknap-1-5 all speedups achieved by LWP and FP are statisticallysignificant. For some problems, the improvements are very strong (with a running timereduction of over 50%), whereas for others the improvements are modest. On average, FPis also faster than LWP. However, FP is not consistently better than LWP and often thedifferences are small.
The observed results indicate that the performance gains depend on a number of factorsincluding the size of the conflicts, the computation times for conflict detection, and theproblem structure itself. While on average FP is faster than LWP, the characteristics of theproblem settings seem to have a considerable impact on the speedups that can be obtainedby the different parallelization strategies.
16. To be able to do a sufficient number of repetitions, we picked instances with comparably small runningtimes.
17. The mutated CSPs can be downloaded at http://ls13-www.cs.tu-dortmund.de/homepage/hp_
downloads/jair/csps.zip.
873

Jannach, Schmitz, & Shchekotykhin
Scenario #C #V #F #D |D|
c8 523 239 8 4 6.25costasArray-13 87 88 2 2 2.5domino-100-100 100 100 3 81 2graceful–K3-P2 60 15 4 117 2.94mknap-1-5 7 39 1 2 1queens-8 28 8 15 9 10.9
hospital payment 38 75 4 120 3.8profit calculation 28 140 5 42 4.24course planning 457 583 2 3024 2preservation model 701 803 1 22 1revenue calculation 93 154 4 1452 3
Table 8: Characteristics of selected problem settings.
Scenario Seq.(QXP) LWP(QXP) FP(QXP)[ms] S4 E4 S4 E4
c8 559 1.10 0.27 1.07 0.27costasArray-13 4,013 2.16 0.54 2.58 0.65domino-100-100 1,386 3.08 0.77 3.05 0.76graceful–K3-P2 1,965 2.75 0.69 2.99 0.75mknap-1-5 314 1.03 0.26 1.02 0.25queens-8 141 1.57 0.39 1.65 0.41
hospital payment 12,660 1.64 0.41 1.73 0.43profit calculation 197 1.71 0.43 2.00 0.50course planning 22,130 2.58 0.65 2.61 0.65preservation model 167 1.46 0.37 1.48 0.37revenue calculation 778 2.81 0.70 2.58 0.64
Table 9: Results for CSP benchmarks and spreadsheets when searching for all diagnoses.
A.1.2 Diagnosing Ontologies
Data Sets and Procedure In recent works, MBD techniques are used to locate faults indescription logic ontologies (Friedrich & Shchekotykhin, 2005; Shchekotykhin et al., 2012;Shchekotykhin & Friedrich, 2010), which are represented in the Web Ontology Language(OWL) (Grau, Horrocks, Motik, Parsia, Patel-Schneider, & Sattler, 2008). When testingsuch an ontology, the developer can – similarly to an earlier approach (Felfernig, Friedrich,Jannach, Stumptner, & Zanker, 2001) – specify a set of “positive” and “negative” test cases.The test cases are sets of logical sentences which must be entailed by the ontology (positive)or not entailed by the ontology (negative). In addition, the ontology itself, which is a setof logical sentences, has to be consistent and coherent (Baader, Calvanese, McGuinness,Nardi, & Patel-Schneider, 2010). A diagnosis (debugging) problem in this context arises, ifone of these requirements is not fulfilled.
In the work by Shchekotykhin et al. (2012), two interactive debugging approaches weretested on a set of faulty real-world ontologies (Kalyanpur, Parsia, Horridge, & Sirin, 2007)
874

Parallel Model-Based Diagnosis on Multi-Core Computers
and two randomly modified large real-world ontologies. We use the same dataset to evaluatethe performance gains when applying our parallelization schemes to the ontology debug-ging problem. The details of the different tested ontologies are given in Table 10. Thecharacteristics of the problems are described in terms of the description logic (DL) used toformulate the ontology, the number of axioms (#A), concepts (#C), properties (#P), andindividuals (#I). In terms of the first-order logic, concepts and properties correspond tounary and binary predicates, whereas individuals correspond to constants. Every letter ofa DL name, such as ALCHF pDq, corresponds to a syntactic feature of the language. E.g.,ALCHF pDq is an Attributive concept Language with Complement, properties Hierarchy,Functional properties and Datatypes. As an underlying description logic reasoner, we usedPellet (Sirin, Parsia, Grau, Kalyanpur, & Katz, 2007). The manipulation of the knowl-edge bases during the diagnosis process was accomplished with the OWL-API (Horridge &Bechhofer, 2011).
Note that the considered ontology debugging problem is different from the other diag-nosis settings discussed so far as it cannot be efficiently encoded as a CSP or SAT problem.The reason is that the decision problems, such as the checking of consistency and conceptsatisfiability, for the ontologies given in Table 10 are ExpTime-complete (Baader et al.,2010). This set of experiments therefore helps us to explore the benefits of parallelizationfor problem settings in which the computation of conflict sets is very hard. Furthermore,the application of the parallelization approaches on the ontology debugging problem demon-strates the generality of our methods, i.e., we show that our methods are applicable to awide range of diagnosis problems and only require the existence of a sound and completeconsistency checking procedure.
Due to the generality of Reiter’s general approach and, correspondingly, our implemen-tation of the diagnosis procedures, the technical integration of the OWL-DL reasoner intoour software framework is relatively simple. The only difference to the CSP-based problemsis that instead of calling Choco’s solve() method inside the Theorem Prover, we make a callto the Pellet reasoner via the OWL-API to check the consistency of an ontology.
Ontology DL #A #C/#P/#I #D |D|
Chemical ALCHF pDq 144 48/20/0 6 1.67
Koala ALCON pDq 44 21/5/6 10 2.3
Sweet-JPL ALCHOF pDq 2,579 1,537/121/50 13 1miniTambis ALCN 173 183/44/0 48 3
University SOIN pDq 49 30/12/4 90 3.67
Economy ALCHpDq 1,781 339/53/482 864 7.17
Transportation ALCHpDq 1,300 445/93/183 1,782 8
Cton SHF 33,203 17,033/43/0 15 4
Opengalen-no-propchains ALCHIF pDq 9,664 4,713/924/0 110 4.13
Table 10: Characteristics of the tested ontologies.
Results The obtained results – again using a thread pool of size four – are shown in Table11. Again, in every case parallelization is advantageous when compared to the sequentialversion and in some cases the obtained speedups are substantial. Regarding the comparison
875

Jannach, Schmitz, & Shchekotykhin
of the LWP and FP variants, there is no clear winner across all test cases. LWP seems tobe advantageous for most of the problems that are more complex with respect to theircomputation times. For the problems that can be easily solved, FP is sometimes slightlybetter. A clear correlation between other problem characteristics like the complexity of theknowledge base in terms of its size could not be identified within this set of benchmarkproblems.
Ontology Seq.(QXP) LWP(QXP) FP(QXP)[ms] S4 E4 S4 E4
Chemical 237 1.44 0.36 1.33 0.33Koala 16 1.42 0.36 1.27 0.32Sweet-JPL 7 1.47 0.37 1.55 0.39miniTambis 135 1.43 0.36 1.46 0.37University 85 1.66 0.41 1.68 0.42Economy 355 2.20 0.55 1.90 0.48Transportation 1,696 2.72 0.68 2.33 0.58
Cton 203 1.27 0.32 1.22 0.30Opengalen-no-propchains 11,044 1.59 0.40 1.86 0.47
Table 11: Results for ontologies when searching for all diagnoses.
A.1.3 Adding More Threads
Constraint Satisfaction Problems Table 12 shows the results of the CSP benchmarksand spreadsheets when using up to 12 threads. In this test utilizing more than 4 threadswas advantageous in all but one small scenario. However, for 7 of the 11 tested scenariosdoing the computations with more than 8 threads did not pay off. This indicates thatchoosing the right degree of parallelization can depend on the characteristics of a diagnosisproblem. The diagnosis of the mknap-1-5 problem, for example, cannot be sped up withparallelization as it only contains one single conflict that is found at the root node. Incontrast, the graceful-K3-P2 problem benefits from the use of up to 12 threads and wecould achieve a speedup of 4.21 for this scenario, which corresponds to a runtime reductionof 76%.
Ontologies The results of diagnosing the ontologies with up to 12 threads are shown inTable 13. For the tested ontologies, which are comparably simple debugging cases, usingmore than 4 threads payed off in only 3 of 7 cases. The best results when diagnosing these3 ontologies were obtained when 8 threads were used. For one ontology using more than4 threads was even slower than the sequential algorithm. This again indicates that theeffectiveness of parallelization depends on the characteristics of the diagnosis problem andadding more threads can be even slightly counterproductive.
A.1.4 Systematic Variation of Problem Characteristics
Procedure To better understand in which way the problem characteristics influence theperformance gains, we used a suite of artificially created hitting set construction problems
876

Parallel Model-Based Diagnosis on Multi-Core Computers
Scenario Seq.(QXP) FP(QXP)[ms] S4 E4 S8 E8 S10 E10 S12 E12
c8 444 1.05 0.26 1.07 0.13 1.08 0.11 1.07 0.09costasArray-13 3,854 2.69 0.67 2.88 0.36 2.84 0.28 2.80 0.23domino-100-100 213 2.04 0.51 2.30 0.29 2.22 0.22 2.00 0.17graceful–K3-P2 1,743 3.03 0.76 4.12 0.51 4.18 0.42 4.21 0.35mknap-1-5 4,141 1.00 0.25 1.00 0.13 1.00 0.10 1.00 0.08queens-8 86 1.18 0.30 1.30 0.16 1.24 0.12 1.19 0.10
hospital payment 11,728 1.60 0.40 1.70 0.21 1.51 0.15 1.36 0.11profit calculation 81 1.53 0.38 1.59 0.20 1.51 0.15 1.44 0.12course planning 15,323 2.31 0.58 2.85 0.36 2.84 0.28 2.73 0.23preservation model 127 1.34 0.34 1.41 0.18 1.41 0.14 1.43 0.12revenue calculation 460 2.39 0.60 2.17 0.27 1.96 0.20 1.85 0.15
Table 12: Observed performance gains for the CSP benchmarks and spreadsheets on aserver with 12 hardware threads.
Ontology Seq.(QXP) FP(QXP)[ms] S4 E4 S8 E8 S10 E10 S12 E12
Chemical 246 1.37 0.34 1.29 0.16 1.30 0.13 1.32 0.11Koala 21 1.07 0.27 1.02 0.13 1.03 0.10 0.99 0.08Sweet-JPL 6 1.09 0.27 1.13 0.14 1.08 0.11 1.02 0.09miniTambis 134 1.47 0.37 1.49 0.19 1.47 0.15 1.45 0.12University 88 1.53 0.38 1.64 0.21 1.56 0.16 1.56 0.13Economy 352 1.48 0.37 0.90 0.11 0.76 0.08 0.71 0.06Transportation 1,448 1.74 0.43 1.23 0.15 1.07 0.11 1.09 0.09
Table 13: Observed performance gains for the ontologies on a server with 12 hardwarethreads.
with the following varying parameters: number of components (#Cp), number of conflicts(#Cf), average size of conflicts (|Cf|). Given these parameters, we used a problem generatorwhich produces a set of minimal conflicts with the desired characteristics. The generatorfirst creates the given number of components and then uses these components to generatethe requested number of conflicts.
To obtain more realistic settings, not all generated conflicts were of equal size but rathervaried according to a Gaussian distribution with the desired size as a mean. Similarly, notall components should be equally likely to be part of a conflict and we again used a Gaussiandistribution to assign component failure probabilities. Other probability distributions couldbe used in the generation process as well, e.g., to reflect specifics of a certain applicationdomain.
Since for this experiment all conflicts are known in advance, the conflict detection al-gorithm within the consistency check only has to return one suitable conflict upon request.Because zero computation times are unrealistic and our assumption is that the conflict
877

Jannach, Schmitz, & Shchekotykhin
detection is actually the most costly part of the diagnosis process, we varied the assumedconflict computation times to analyze their effect on the relative performance gains. Thesecomputation times were simulated by adding artificial active waiting times (Wt) inside theconsistency check (shown in ms in Table 14). Note that the consistency check is only calledif no conflict can be reused for the current node; the artificial waiting time only applies tocases in which a new conflict has to be determined.
Each experiment was repeated 100 times on different variations of each problem settingto factor out random effects. The number of diagnoses #D is thus an average as well. Allalgorithms had, however, to solve identical sets of problems and thus returned identicalsets of diagnoses. We limited the search depth to 4 for all experiments to speed up thebenchmark process. The average running times are reported in Table 14.
Results – Varying Computation Times First, we varied the assumed conflict com-putation times for a quite small diagnosis problem using 4 parallel threads (Table 14). Thefirst row with assumed zero computation times shows how long the HS-tree constructionalone needs. The improvements of the parallelization are smaller for this case because of theoverhead of thread creation and synchronization. However, as soon as we add an averagerunning time of 10ms for the consistency check, both parallelization approaches result in aspeedup of about 3, which corresponds to a runtime reduction of 67%. Further increasingthe assumed computation time does not lead to better relative improvements using the poolof 4 threads.
Results – Varying Conflict Sizes The average conflict size impacts the breadth of theHS-tree. Next, we therefore varied the average conflict size. Our hypothesis was that largerconflicts and correspondingly broader HS-trees are better suited for parallel processing.The results shown in Table 14 confirm this assumption. FP is always slightly more efficientthan LWP. Average conflict sizes larger than 9 did, however, not lead to strong additionalimprovements when using 4 threads.
Results – Adding More Threads For larger conflicts, adding additional threads leadsto further improvements. Using 8 threads results in improvements of up to 7.27 (corre-sponding to a running time reduction of over 85%) for these larger conflict sizes because inthese cases even higher levels of parallelization can be achieved.
Results – Adding More Components Finally, we varied the problem complexity byadding more components that can potentially be faulty. Since we left the number andsize of the conflicts unchanged, adding more components led to diagnoses that includedmore different components. As we limited the search depth to 4 for this experiment, fewerdiagnoses were found up to this level and the search trees were narrower. As a result, therelative performance gains were lower than when there are fewer components (constraints).
Discussion The simulation experiments demonstrate the advantages of parallelization.For all tests, the speedups of LWP and FP are statistically significant. The results alsoconfirm that the performance gains depend on different characteristics of the underlyingproblem. The additional gains of not waiting at the end of each search level for all workerthreads to be finished typically led to small further improvements.
Redundant calculations can, however, still occur, in particular when the conflicts fornew nodes are determined in parallel and two worker threads return the same conflict.
878

Parallel Model-Based Diagnosis on Multi-Core Computers
#Cp, #Cf, #D Wt Seq. LWP FP
|Cf| [ms] [ms] S4 E4 S4 E4
Varying computation times Wt
50, 5, 4 25 0 23 2.26 0.56 2.58 0.64
50, 5, 4 25 10 483 2.98 0.75 3.10 0.77
50, 5, 4 25 100 3,223 2.83 0.71 2.83 0.71
Varying conflict sizes
50, 5, 6 99 10 1,672 3.62 0.91 3.68 0.92
50, 5, 9 214 10 3,531 3.80 0.95 3.83 0.96
50, 5, 12 278 10 4,605 3.83 0.96 3.88 0.97
Varying numbers of components
50, 10, 9 201 10 3,516 3.79 0.95 3.77 0.94
75, 10, 9 105 10 2,223 3.52 0.88 3.29 0.82
100, 10, 9 97 10 2,419 3.13 0.78 3.45 0.86
#Cp, #Cf, #D Wt Seq. LWP FPI|Cf| [ms] [ms] S8 E8 S8 E8
Adding more threads (8 instead of 4)
50, 5, 6 99 10 1,672 6.40 0.80 6.50 0.81
50, 5, 9 214 10 3,531 7.10 0.89 7.15 0.89
50, 5, 12 278 10 4,605 7.25 0.91 7.27 0.91
Table 14: Simulation results.
Although without parallelization the computing resources would have been left unusedanyway, redundant calculations can lead to overall longer computation times for very smallproblems because of the thread synchronization overheads.
A.2 Additional Experiments Using MXP for Conflict Detection
In this section we report the additional results that were obtained when using MergeXplaininstead of QuickXplain as a conflict detection strategy as described in Section 4.2. Thedifferent experiments were again made using a set of CSPs and ontology debugging prob-lems. Remember that in this set of experiments our goal is to identify a set of leadingdiagnoses.
A.2.1 Diagnosing Constraint Satisfaction Problems
Table 15 shows the results when searching for five diagnoses using the CSP and spreadsheetbenchmarks. MXP could again help to reduce the running times for most of the testedscenarios except for some of the smaller ones. For the tiny scenario mknap-1-5, the simplesequential algorithm using QXP is the fastest alternative. For most of the other scenarios,however, parallelization pays off and is faster than when sequentially expanding the searchtree. The best result could be achieved for the scenario costasArray-13, where FP usingMXP reduced the running times by 83% compared to the sequential algorithm using QXP,
879

Jannach, Schmitz, & Shchekotykhin
which corresponds to a speedup of 6. The results again indicate that FP works well forboth QXP and MXP.
Scenario Seq.(QXP) FP(QXP) Seq.(MXP) FP(MXP)[ms] S4 E4 [ms] S4 E4
c8 455 1.03 0.26 251 1.06 0.26costasArray-13 2,601 3.66 0.91 2,128 4.92 1.23domino-100-100 53 1.26 0.32 50 1.43 0.36graceful–K3-P2 528 2.67 0.67 419 2.48 0.62mknap-1-5 19 0.99 0.25 21 1.01 0.25queens-8 75 1.55 0.39 63 1.67 0.42
hospital payment 1,885 1.17 0.29 1,426 1.28 0.32profit calculation 33 1.92 0.48 40 1.86 0.46course planning 1,522 0.99 0.25 1,188 1.42 0.35preservation model 411 1.50 0.37 430 1.50 0.37revenue calculation 48 1.21 0.30 42 1.48 0.37
Table 15: Results for CSP benchmarks and spreadsheets (QXP vs MXP).
Note that in one case (costasArray-13) we see an efficiency value larger than one, whichmeans that the obtained speedup is super-linear. This can happen in special situationsin which we search for a limited number of diagnoses and use the FP method (see alsoSection A.3.1). Assume that generating one specific node takes particularly long, i.e., thecomputation of a conflict set requires a considerable amount of time. In that case, asequential algorithm will be “stuck” at this node for some time, while the FP method willcontinue generating other nodes. If these other nodes are then sufficient to find the (limited)required number of diagnoses, this can lead to an efficiency value that is greater than thetheoretical optimum.
A.2.2 Diagnosing Ontologies
The results are shown in Table 16. Similar to the previous experiment, using MXP incombination with FP pays off in all cases except for the very simple benchmark problems.
A.3 Additional Experiments – Parallel Depth-First Search
In this section, we report the results of additional experiments that were made to assess theeffects of parallelizing a depth-first search strategy as described in Section 5.3. In this set ofexperiments the goal was to find one single minimal diagnosis. We again report the resultsobtained for the constraint problems and the ontology debugging problems and discussthe findings of a simulation experiment in which we systematically varied the problemcharacteristics.
A.3.1 Diagnosing Constraint Satisfaction Problems
The results of searching for a single diagnosis for the CSPs and spreadsheets are shownin Table 17. Again, parallelization generally shows to be a good strategy to speed up the
880

Parallel Model-Based Diagnosis on Multi-Core Computers
Ontology Seq.(QXP) FP(QXP) Seq.(MXP) FP(MXP)[ms] S4 E4 [ms] S4 E4
Chemical 187 2.10 0.53 144 1.94 0.48Koala 15 1.49 0.37 13 1.27 0.32Sweet-JPL 5 1.27 0.32 4 1.05 0.26miniTambis 68 1.04 0.26 56 1.08 0.27University 33 1.05 0.26 26 1.02 0.26Economy 19 1.10 0.27 14 1.00 0.25Transportation 71 1.08 0.27 53 1.10 0.27
Cton 174 1.36 0.34 154 1.33 0.33Opengalen-no-propchains 2,145 1.22 0.30 1,748 1.35 0.34
Table 16: Results for Ontologies (QXP vs MXP).
diagnosis process. All measured speedups except the speedup of RDFS for the first scenarioc8 are statistically significant. In this specific problem setting, only the FP strategy hada measurable effect and for some strategies even a modest performance deterioration wasobserved when compared to Reiter’s sequential algorithm. The reason lies in the resultingstructure of the HS-tree which is very narrow as most conflicts are of size one.
The following detailed observations can be made when comparing the algorithms.
• In most of the tested CSPs, FP is advantageous when compared to RDFS and PRDFS.
• For the spreadsheets, in contrast, RDFS or PRDFS were better than the breadth-firstapproach of FP in three of five cases.
• When comparing RDFS and PRDFS, we can again observe that parallelization canbe advantageous also for these depth-first strategies.
• Again, however, the improvements seem to depend on the underlying problem struc-ture. In the case of the hospital payment scenario, the speedup of PRDFS is as high as3.1 compared to the sequential algorithm, which corresponds to a runtime reductionof more than 67%. The parallel strategy is, however, not consistently better for alltest cases.
• The performance of the Hybrid method again lies in between the performances of itstwo components for many, but not all, of the tested scenarios.
A.3.2 Diagnosing Ontologies
Next, we evaluated the search for one diagnosis on the real-world ontologies (Table 18). Inthe tested scenarios, applying the depth-first strategy did often not pay off when comparedto the breadth-first methods. The reason is that in the tested examples from the ontol-ogy debugging domain in many cases single-element diagnoses exist, which can be quicklydetected by a breadth-first strategy. Furthermore the absolute running times are often com-parably small. Parallelizing the depth-first strategy leads to significant speedups in somebut not all cases.
881

Jannach, Schmitz, & Shchekotykhin
Scenario Seq. FP RDFS PRDFS Hybrid[ms] S4 E4 [ms] S4 E4 S4 E4
c8 462 1.09 0.27 454 0.89 0.22 0.92 0.23costasArray-13 1,996 4.78 1.19 3,729 3.42 0.85 5.90 1.47domino-100-100 57 1.22 0.30 45 1.17 0.29 1.05 0.26graceful–K3-P2 372 2.86 0.71 305 2.01 0.50 1.89 0.47mknap-1-5 166 2.18 0.55 114 1.02 0.26 1.35 0.33queens-8 72 1.38 0.34 55 1.02 0.26 0.95 0.24
hospital payment 263 1.83 0.46 182 2.14 0.54 1.72 0.43profit calculation 99 1.67 0.42 70 1.15 0.29 1.10 0.28course planning 3,072 1.11 0.28 2,496 0.90 0.23 0.87 0.22preservation model 182 1.78 0.44 104 0.99 0.25 0.95 0.24revenue calculation 152 1.11 0.28 121 0.92 0.23 0.90 0.22
Table 17: Results for CSP benchmarks and spreadsheets for finding one diagnosis.
Ontology Seq. FP RDFS PRDFS Hybrid[ms] S4 E4 [ms] S4 E4 S4 E4
Chemical 73 2.18 0.54 57 1.62 0.41 1.47 0.37Koala 10 2.20 0.55 9 1.93 0.48 1.39 0.35Sweet-JPL 3 0.92 0.23 4 0.97 0.24 0.92 0.23miniTambis 58 0.95 0.24 62 0.92 0.23 0.93 0.23University 29 1.06 0.27 30 1.03 0.26 1.03 0.26Economy 17 1.10 0.27 18 1.16 0.29 1.10 0.27Transportation 65 1.03 0.26 61 1.03 0.26 0.98 0.24
Table 18: Observed performance gains for ontologies for finding one diagnosis.
A.3.3 Systematic Variation of Problem Characteristics
Table 19 finally shows the simulation results when searching for one single diagnosis. Inthe experiment we used a uniform probability distribution when selecting the componentsof the conflicts to obtain more complex diagnosis problems. The results can be summarizedas follows.
• FP is as expected better than the sequential version of the HS-tree algorithm for alltested configurations.
• For the very small problems that contain only a few and comparably small conflicts,the depth-first strategy does not work well. Both the parallel and sequential versionsare even slower than Reiter’s original proposal, except for cases where zero conflictcomputation times are assumed. This indicates that the costs for hitting set mini-mization are too high.
• For the larger problem instances, relying on a depth-first strategy to find one singlediagnosis is advantageous and also better than FP. An additional test with an even
882

Parallel Model-Based Diagnosis on Multi-Core Computers
#Cp, #Cf, I|D| Wt Seq. FP RDFS PRDFS HybridI|Cf| [ms] [ms] S4 E4 [ms] S4 E4 S4 E4
Varying computation times Wt
50, 5, 4 3.40 0 11 2.61 0.65 2 1.01 0.25 0.85 0.21
50, 5, 4 3.40 10 89 1.50 0.37 155 1.28 0.32 2.24 0.56
50, 5, 4 3.40 100 572 1.50 0.37 1,052 1.30 0.33 2.26 0.56
Varying conflict sizes
50, 5, 6 2.86 10 90 1.57 0.39 143 1.26 0.31 2.12 0.53
50, 5, 9 2.36 10 86 1.55 0.39 138 1.34 0.33 2.04 0.51
50, 5, 12 2.11 10 83 1.61 0.40 124 1.23 0.31 1.95 0.49
Varying numbers of components
50, 10, 9 3.47 10 229 2.36 0.59 202 1.35 0.34 1.65 0.41
75, 10, 9 3.97 10 570 3.09 0.77 228 1.37 0.34 1.42 0.36
100, 10, 9 4.34 10 1,467 2.37 0.59 240 1.34 0.33 1.26 0.31
More conflicts
100, 12, 9 5.00 10 26,870 1.28 0.32 280 1.39 0.35 1.24 0.31
Table 19: Simulation results for finding one diagnosis.
larger problem shown in the last line of Table 19 reveals the potential of a depth-firstsearch approach.
• When the problems are larger, PRDFS can again help to obtain further runtimeimprovements compared to RDFS.
• The Hybrid method works well for all but the single case with zero computation times.Again, it represents a good choice when the problem structure is not known.
Overall, the simulation experiments show that the speedups that can be achieved withthe different methods depend on the underlying problem structure also when we search forone single diagnosis.
References
Abreu, R., & van Gemund, A. J. C. (2009). A Low-Cost Approximate Minimal Hitting SetAlgorithm and its Application to Model-Based Diagnosis. In SARA’09, pp. 2–9.
Anglano, C., & Portinale, L. (1996). Parallel model-based diagnosis using PVM. In Eu-roPVM’96, pp. 331–334.
Autio, K., & Reiter, R. (1998). Structural Abstraction in Model-Based Diagnosis. InECAI’98, pp. 269–273.
Baader, F., Calvanese, D., McGuinness, D., Nardi, D., & Patel-Schneider, P. (2010). TheDescription Logic Handbook: Theory, Implementation and Applications, Vol. 32.
Bolosky, W. J., & Scott, M. L. (1993). False Sharing and Its Effect on Shared MemoryPerformance. In SEDMS’93, pp. 57–71.
883

Jannach, Schmitz, & Shchekotykhin
Brungger, A., Marzetta, A., Fukuda, K., & Nievergelt, J. (1999). The parallel search benchZRAM and its applications. Annals of Operations Research, 90 (0), 45–63.
Buchanan, B., & Shortliffe, E. (Eds.). (1984). Rule-based Expert Systems: The MYCIN Ex-periments of the Stanford Heuristic Programming Project. Addison-Wesley, Reading,MA.
Burns, E., Lemons, S., Ruml, W., & Zhou, R. (2010). Best-First Heuristic Search forMulticore Machines. Journal of Artificial Intelligence Research, 39, 689–743.
Campeotto, F., Palu, A. D., Dovier, A., Fioretto, F., & Pontelli, E. (2014). Exploring theUse of GPUs in Constraint Solving. In PADL’14, pp. 152–167.
Cardoso, N., & Abreu, R. (2013). A Distributed Approach to Diagnosis Candidate Gener-ation. In EPIA’13, pp. 175–186.
Chandra, D., Guo, F., Kim, S., & Solihin, Y. (2005). Predicting Inter-Thread Cache Con-tention on a Chip Multi-Processor Architecture. In HPCA’11, pp. 340–351.
Chu, G., Schulte, C., & Stuckey, P. J. (2009). Confidence-Based Work Stealing in ParallelConstraint Programming. In CP’09, pp. 226–241.
Console, L., Friedrich, G., & Dupre, D. T. (1993). Model-Based Diagnosis Meets ErrorDiagnosis in Logic Programs. In IJCAI’93, pp. 1494–1501.
de Kleer, J. (2011). Hitting set algorithms for model-based diagnosis. In DX’11, pp. 100–105.
Dean, J., & Ghemawat, S. (2008). MapReduce: Simplified Data Processing on Large Clus-ters. Communications of the ACM, 51 (1), 107–113.
Dijkstra, E. W. (1968). The Structure of the “THE”-Multiprogramming System. Commu-nications of the ACM, 11 (5), 341–346.
Eiter, T., & Gottlob, G. (1995). The Complexity of Logic-Based Abduction. Journal of theACM, 42 (1), 3–42.
Feldman, A., Provan, G., de Kleer, J., Robert, S., & van Gemund, A. (2010a). Solvingmodel-based diagnosis problems with max-sat solvers and vice versa. In DX’10, pp.185–192.
Feldman, A., Provan, G., & van Gemund, A. (2010b). Approximate Model-Based DiagnosisUsing Greedy Stochastic Search. Journal of Artifcial Intelligence Research, 38, 371–413.
Felfernig, A., Friedrich, G., Isak, K., Shchekotykhin, K. M., Teppan, E., & Jannach, D.(2009). Automated debugging of recommender user interface descriptions. AppliedIntelligence, 31 (1), 1–14.
Felfernig, A., Friedrich, G., Jannach, D., & Stumptner, M. (2004). Consistency-based diag-nosis of configuration knowledge bases. Artificial Intelligence, 152 (2), 213–234.
Felfernig, A., Friedrich, G., Jannach, D., Stumptner, M., & Zanker, M. (2001). Hierarchicaldiagnosis of large configurator knowledge bases. In KI’01, pp. 185–197.
Felfernig, A., Schubert, M., & Zehentner, C. (2012). An efficient diagnosis algorithm forinconsistent constraint sets. Artificial Intelligence for Engineering Design, Analysisand Manufacturing, 26 (1), 53–62.
884

Parallel Model-Based Diagnosis on Multi-Core Computers
Felfernig, A., Friedrich, G., Jannach, D., Stumptner, M., et al. (2000). Consistency-baseddiagnosis of configuration knowledge bases. In ECAI’00, pp. 146–150.
Ferguson, C., & Korf, R. E. (1988). Distributed tree search and its application to alpha-betapruning. In AAAI’88, pp. 128–132.
Friedrich, G., & Shchekotykhin, K. M. (2005). A General Diagnosis Method for Ontologies.In ISWC’05, pp. 232–246.
Friedrich, G., Stumptner, M., & Wotawa, F. (1999). Model-Based Diagnosis of HardwareDesigns. Artificial Intelligence, 111 (1-2), 3–39.
Friedrich, G., Fugini, M., Mussi, E., Pernici, B., & Tagni, G. (2010). Exception handling forrepair in service-based processes. IEEE Transactions on Software Engineering, 36 (2),198–215.
Friedrich, G., & Shchekotykhin, K. (2005). A General Diagnosis Method for Ontologies. InISWC’05, pp. 232–246.
Garey, M. R., & Johnson, D. S. (1979). Computers and Intractability: A Guide to the Theoryof NP-Completeness. W. H. Freeman & Co.
Grau, B. C., Horrocks, I., Motik, B., Parsia, B., Patel-Schneider, P., & Sattler, U. (2008).OWL 2: The next step for OWL. Web Semantics: Science, Services and Agents onthe World Wide Web, 6 (4), 309–322.
Greiner, R., Smith, B. A., & Wilkerson, R. W. (1989). A Correction to the Algorithm inReiter’s Theory of Diagnosis. Artificial Intelligence, 41 (1), 79–88.
Horridge, M., & Bechhofer, S. (2011). The OWL API: A Java API for OWL Ontologies.Semantic Web Journal, 2 (1), 11–21.
Jannach, D., & Schmitz, T. (2014). Model-based diagnosis of spreadsheet programs: aconstraint-based debugging approach. Automated Software Engineering, February2014 (published online).
Jannach, D., Schmitz, T., & Shchekotykhin, K. (2015). Parallelized Hitting Set Computationfor Model-Based Diagnosis. In AAAI’15, pp. 1503–1510.
Junker, U. (2004). QUICKXPLAIN: Preferred Explanations and Relaxations for Over-Constrained Problems. In AAAI’04, pp. 167–172.
Kalyanpur, A., Parsia, B., Horridge, M., & Sirin, E. (2007). Finding all justifications ofowl dl entailments. In The Semantic Web, Vol. 4825 of Lecture Notes in ComputerScience, pp. 267–280.
Korf, R. E., & Schultze, P. (2005). Large-scale parallel breadth-first search. In AAAI’05,pp. 1380–1385.
Kurtoglu, T., & Feldman, A. (2011). Third International Diagnostic Competition (DXC11). https://sites.google.com/site/dxcompetition2011. Accessed: 2016-03-15.
Lecoutre, C., Roussel, O., & van Dongen, M. R. C. (2008). CPAI08 competition. http:
//www.cril.univ-artois.fr/CPAI08/. Accessed: 2016-03-15.
Li, L., & Yunfei, J. (2002). Computing Minimal Hitting Sets with Genetic Algorithm. InDX’02, pp. 1–4.
885

Jannach, Schmitz, & Shchekotykhin
Marques-Silva, J., Janota, M., Ignatiev, A., & Morgado, A. (2015). Efficient Model BasedDiagnosis with Maximum Satisfiability. In IJCAI’15, pp. 1966–1972.
Marques-Silva, J., Janota, M., & Belov, A. (2013). Minimal Sets over Monotone Predicatesin Boolean Formulae. In Computer Aided Verification, pp. 592–607.
Mateis, C., Stumptner, M., Wieland, D., & Wotawa, F. (2000). Model-Based Debugging ofJava Programs. In AADEBUG’00.
Mencia, C., & Marques-Silva, J. (2014). Efficient Relaxations of Over-constrained CSPs. InICTAI’14, pp. 725–732.
Mencıa, C., Previti, A., & Marques-Silva, J. (2015). Literal-based MCS extraction. InIJCAI’15, pp. 1973–1979.
Metodi, A., Stern, R., Kalech, M., & Codish, M. (2014). A novel sat-based approach tomodel based diagnosis. Journal of Artificial Intelligence Research, 51, 377–411.
Michel, L., See, A., & Van Hentenryck, P. (2007). Parallelizing constraint programs trans-parently. In CP’07, pp. 514–528.
Nica, I., Pill, I., Quaritsch, T., & Wotawa, F. (2013). The route to success: a performancecomparison of diagnosis algorithms. In IJCAI’13, pp. 1039–1045.
Nica, I., & Wotawa, F. (2012). ConDiag - computing minimal diagnoses using a constraintsolver. In DX’12, pp. 185–191.
Phillips, M., Likhachev, M., & Koenig, S. (2014). PA*SE: Parallel A* for Slow Expansions.In ICAPS’14.
Pill, I., Quaritsch, T., & Wotawa, F. (2011). From conflicts to diagnoses: An empiricalevaluation of minimal hitting set algorithms. In DX’11, pp. 203–211.
Pill, I., & Quaritsch, T. (2012). Optimizations for the Boolean Approach to ComputingMinimal Hitting Sets. In ECAI’12, pp. 648–653.
Powley, C., & Korf, R. E. (1991). Single-agent parallel window search. IEEE Transactionson Pattern Analysis and Machine Intelligence, 13 (5), 466–477.
Previti, A., Ignatiev, A., Morgado, A., & Marques-Silva, J. (2015). Prime Compilation ofNon-Clausal Formulae. In IJCAI’15, pp. 1980–1987.
Prud’homme, C., Fages, J.-G., & Lorca, X. (2015). Choco Documentation. TASC, INRIARennes, LINA CNRS UMR 6241, COSLING S.A.S. http://www.choco-solver.org.
Reiter, R. (1987). A Theory of Diagnosis from First Principles. Artificial Intelligence, 32 (1),57–95.
Rymon, R. (1994). An SE-tree-based prime implicant generation algorithm. Annals ofMathematics and Artificial Intelligence, 11 (1-4), 351–365.
Satoh, K., & Uno, T. (2005). Enumerating Minimally Revised Specifications Using Dual-ization. In JSAI’05, pp. 182–189.
Schulte, C., Lagerkvist, M., & Tack, G. (2016). GECODE - An open, free, efficient constraintsolving toolkit. http://www.gecode.org. Accessed: 2016-03-15.
886

Parallel Model-Based Diagnosis on Multi-Core Computers
Shchekotykhin, K., Friedrich, G., Fleiss, P., & Rodler, P. (2012). Interactive ontology debug-ging: Two query strategies for efficient fault localization. Journal of Web Semantics,1213, 88–103.
Shchekotykhin, K. M., & Friedrich, G. (2010). Query strategy for sequential ontologydebugging. In ISWC’10, pp. 696–712.
Shchekotykhin, K., Jannach, D., & Schmitz, T. (2015). MergeXplain: Fast Computation ofMultiple Conflicts for Diagnosis. In IJCAI’15, pp. 3221–3228.
Shchekotykhin, K. M., Friedrich, G., Rodler, P., & Fleiss, P. (2014). Sequential diagnosis ofhigh cardinality faults in knowledge-bases by direct diagnosis generation. In ECAI’14,pp. 813–818.
Sirin, E., Parsia, B., Grau, B. C., Kalyanpur, A., & Katz, Y. (2007). Pellet: A PracticalOWL-DL Reasoner. Web Semantics: Science, Services and Agents on the World WideWeb, 5 (2), 51 – 53.
Stern, R., Kalech, M., Feldman, A., & Provan, G. (2012). Exploring the Duality in Conflict-Directed Model-Based Diagnosis. In AAAI’12, pp. 828–834.
Stuckey, P. J., Feydy, T., Schutt, A., Tack, G., & Fischer, J. (2014). The MiniZinc Challenge2008-2013. AI Magazine, 35 (2), 55–60.
Stumptner, M., & Wotawa, F. (1999). Debugging functional programs. In IJCAI’99, pp.1074–1079.
Stumptner, M., & Wotawa, F. (2001). Diagnosing Tree-Structured Systems. ArtificialIntelligence, 127 (1), 1–29.
White, J., Benavides, D., Schmidt, D. C., Trinidad, P., Dougherty, B., & Cortes, A. R.(2010). Automated diagnosis of feature model configurations. Journal of Systems andSoftware, 83 (7), 1094–1107.
Williams, B. C., & Ragno, R. J. (2007). Conflict-directed A* and its role in model-basedembedded systems. Discrete Applied Mathematics, 155 (12), 1562–1595.
Wotawa, F. (2001a). A variant of Reiter’s hitting-set algorithm. Information ProcessingLetters, 79 (1), 45–51.
Wotawa, F. (2001b). Debugging Hardware Designs Using a Value-Based Model. AppliedIntelligence, 16 (1), 71–92.
Wotawa, F., & Pill, I. (2013). On classification and modeling issues in distributed model-based diagnosis. AI Communications, 26 (1), 133–143.
887


Efficient Sequential Model-BasedFault-Localization with Partial Diagnoses
[Placeholder]
Kostyantyn ShchekotykhinAlpen-Adria University Klagenfurt, [email protected]
Thomas SchmitzTU Dortmund, Germany
[email protected] Jannach
TU Dortmund, [email protected]
This document cannot be published on an open access(OA) repository. To access the document, please follow thelink https://www.ijcai.org/Abstract/16/181 or refer to theProceedings of the Twenty-Fifth International Joint Confer-ence on Artificial Intelligence ISBN 978-1-57735-770-4 pages1251–1257.
IJCAI ’16, July 9–15, 2016, New York, NY, USA
ISBN: 978-1-57735-770-4


Finding Errors in the Enron Spreadsheet CorpusThomas Schmitz
TU Dortmund44221 Dortmund, [email protected]
Dietmar JannachTU Dortmund
44221 Dortmund, [email protected]
Abstract—Spreadsheet environments like MS Excel are themost widespread type of end-user software development tools andspreadsheet-based applications can be found almost everywherein organizations. Since spreadsheets are prone to error, severalapproaches were proposed in the research literature to help userslocate formula errors. However, the proposed methods were oftendesigned based on assumptions about the nature of errors andwere evaluated with mutations of correct spreadsheets.
In this work we propose a method and tool to identify real-world formula errors within the Enron spreadsheet corpus.Our approach is based on heuristics that help us identifyversions of the same spreadsheet and our software helps theuser identify spreadsheets of which we assume that they containerror corrections. An initial manual inspection of a subset ofsuch candidates led to the identification of more than two dozenformula errors. We publicly share the new collection of real-worldspreadsheet errors.
I. INTRODUCTION
Spreadsheets are used almost everywhere and at all levelsof organizations [1]. They are often used for financial calcula-tions and planning purposes so that errors in the calculationscan have severe impacts for organizations [2]. Errors inspreadsheets are unfortunately not uncommon, in particularbecause spreadsheets are often developed by end-users with noeducation in software development. Already in the late 1990sa survey showed that in many studies on spreadsheet errors atleast one fault1 was found in every analyzed spreadsheet [4].
Different approaches to avoid spreadsheet errors are pos-sible, starting with better training for end-users or definedquality procedures for spreadsheets. Over the years, also avariety of proposals for better tool support were made in theliterature [3], ranging from visualization approaches [5], overenvironments that support systematic tests [6], to interactivedebugging aids [7]. Many of the proposed error detection andcorrection tools focus on errors in individual formulas.
A common challenge when designing and evaluating suchapproaches is that not many real-world spreadsheets withknown formula errors are available. Although larger collec-tions of real-world spreadsheets exist, usually no informationabout the contained errors is given [8], [9]. To evaluate noveltest and debugging techniques researchers therefore ofteninject errors into real-world or artificial spreadsheets using,e.g., the set of mutation operators for spreadsheets proposed
1In this paper we use the terms error and fault in an interchangeable manner.A discussion of the usage of the different terms can be found in [3].
in [10]. Such mutations can represent a useful approximationof the true errors that are made by users. Nonetheless, thesemutation-based evaluations are based on certain assumptionsabout the types and frequency of different types of errors.
In 2015, Hermans and Murphy-Hill [11] published a newcorpus of spreadsheets extracted from the publicly availableemails of Enron, a huge US-company that went bankrupt in2001 (“Enron scandal”). The new corpus comprises 15,770spreadsheets that were created for productive use and of which9,120 contain formulas. Again, however, no information isavailable about the errors that these spreadsheets contain.
In this paper, we therefore propose a method and publisha tool [12] to locate formula errors in spreadsheets of theEnron corpus. To find such errors, we first try to identifydifferent versions of the same spreadsheet in the corpus,where one version contains a fix to a bug that existed in theprevious version. We use different heuristics to detect suchspreadsheet versions. In one strategy we reconstruct parts ofthe email conversations in which spreadsheets were exchangedand look for indicators in the email texts which suggest thatthe enclosed spreadsheet contains a bug fix. All spreadsheetsthat are attached in this conversation are then automaticallychecked for differences. In another approach we look forspreadsheets whose names are similar or slightly different and,e.g., contain a suffix like “ v2” or “ fixed”. We then againcompute the differences between these files. If only one ora few formulas were changed, these files represent candidatespreadsheets, which can then be manually inspected for errors.
Determining if a change of a formula represents a bug fixor rather implements an updated business logic is hard toautomate as one has to understand the intended semantics ofeach formula. We therefore implemented a visual tool thatautomatically retrieves the different versions of a spreadsheetand supports the user in inspecting them. With the help of thistool we identified several spreadsheet errors of different typesusing only a limited set of heuristics. We publicly share ourcollection of errors to foster future research in the field [13].
II. TECHNICAL APPROACH
In this section we present how we reconstruct the emailconversations and how we analyze differences in spreadsheets.
A. Reconstruction of Email Conversations
To identify emails that discuss errors in the attached spread-sheets, we propose to reconstruct the email conversations.978-1-5090-0252-8/16/$31.00 c©2016 IEEE

Fig. 1. A screenshot of our interactive tool for finding errors in the Enron corpus.
1) General Idea: Figure 1 shows the interactive visualiza-tion of such a conversation in our tool. Nodes in the graphcorrespond to emails and the edges represent that, for example,one email was sent in reply to another.
Our tool reconstructs such conversations using differentheuristics. With the implemented heuristics we created 13,440conversation graphs that had at least one spreadsheet attached.1,100 of them consisted of two or more nodes. In our tool,individual keywords like “fix” or “error” as well as complexregular expressions can be used to filter those conversationsthat contain these keywords in the subject line, email text, oras part of a spreadsheet name.
The conversation and the attached spreadsheets can thenbe manually inspected one by one. To support the user inthis manual process, the tool automatically determines anddisplays the exact differences between each spreadsheet of theconversation. If the number of differences between two filesis very small and, e.g., only one single formula was changed,this might be an indicator of a possible bug fix.
Our approach of searching for certain terms in email conver-sations is inspired by [11], who found over 4,000 emails in theEnron corpus which had a spreadsheet attached and containedone of several keywords like error or mistake. Retrievingemails with certain keywords is however not sufficient forour purpose, as our goal is to find different versions of onespreadsheet to be able to identify possible errors.
2) Reconstruction Heuristics: Reconstructing the emailconversations is not a straightforward process with the givendata. The emails of the corpus unfortunately do not containthe two header fields called references and in-reply-to ofthe Internet Message Standard, which should contain uniquemessage identifiers of previous messages.
Therefore, we used the email header information about thesubject, sender, recipients and the timestamp of the message,as well as the message text itself to approximately reconstruct
the conversations. Specifically, we inserted a link in a conver-sation graph – indicating that a message a is followed by amessage b – whenever the following conditions were fulfilled.
(i) One of the recipients of a is the sender of b, i.e., thesender of b replied to a or forwarded a.
(ii) The subject lines of message a and b match (afterremoving prefixes like “Re:”) or the message text of bcontains the entire text of a.
(iii) The timestamp of b is later than the one of a and thereis no other email c with a timestamp that lies between aand b and for which conditions 1 and 2 are fulfilled.
Checking these conditions again requires some heuristics-based approximations due to the noisiness of the data. Thesender and recipient names, for example, are often set bythe email client based on an integrated address book and donot contain email addresses but real names with no consistentordering of first and last names. Therefore, we implemented aname matching technique that tries different orderings and usesthe Jaro-Winkler distance to assess the similarity of differententries. We assumed the names to be identical if a certainthreshold was surpassed.
B. Analyzing the Differences in Spreadsheets
Once we have determined a subset of spreadsheets thatare presumably related, e.g., because they are in the sameconversation graph or because they have similar names, ourtool supports the user with an automated analysis of thedifferences between the files.
1) Detecting Modifications: Our analysis of differencesfocuses on changes in formulas. Changes only in number andtext constants between two versions are not considered. Weconsider formula updates, insertions and deletions as changesbetween spreadsheet versions.
As mentioned above, spreadsheet versions that only have alimited number of differences are particularly relevant for us as

a
a
b
b
c
c
b
b
S1 S2
(a) Formulas were changed.
a
b
c
d
a
b
c
d
S1 S2
(b) Formulas were moved.
Fig. 2. Analyzing differences of a spreadsheet.
it makes it easier to understand the modifications. A commonlyused functionality in spreadsheet systems is to copy formulasto apply the same calculations on different rows or columns.In the Enron corpus a spreadsheet with formulas on averagecontains 2,223 formulas of which only 100 are unique [11]. Ifa bug fix concerns such a copied formula, we would thereforedetect multiple formula changes.
In our calculation scheme for differences we account forsuch situations where so-called “copy-equivalent” formulas arechanged. We achieve this through the use of the R1C1 notationin which copy-equivalent formulas have the same cell content.Figure 2a shows an example where in two copy-equivalentcells the formula was changed from a to c. According to ourheuristic, this would only count as one difference.
2) Detecting Moved Cells: Another situation in which anaive approach to spot differences would lead to too manysuspected changes is when new rows or columns are insertedas part of a change. Figure 2b shows such a situation wherean empty row was inserted. The goal of the subsequentlydescribed heuristic is to detect when (blocks of) cells aremoved. In the example in Figure 2b, our method shouldtherefore report “no change” instead of a formula deletion inthe topmost cell and a formula addition at the bottom.
To detect such movements we use heuristics regarding thesurrounding of the changed cells. If we find the formula of thechanged cell and an identical surrounding area of a specifiedsize at a different location in the changed spreadsheet, weassume that the whole area was moved to this location.
Algorithm 1 sketches the idea of our corresponding spread-sheet difference analysis. The algorithm takes two spreadsheetsS1 and S2 to be compared as input and maintains a listcalled diffs in which the found differences are stored. Themain function examines all cells which contain a formula inat least one of the spreadsheets. For these cells, the functionISDIFFERENT is called, which checks if the content of the celldiffers in the two spreadsheets. Internally, this method alsochecks if the same difference was already observed beforefor a copy-equivalent cell as we only want to count eachdifference once. In case a difference was found, i.e., one of thecells contains no formula or the formulas differ, the functionWASMOVED is called, which returns true if we assume thata formula and its surroundings were moved. If the observeddifference is not the result of a move, the cell c is stored as adifference in the set diffs .
The function WASMOVED checks if the formula in the given
Algorithm 1: FINDDIFFERENCES
Input: Two spreadsheets S1 , S2 ; A minimum area sizeminSize to recognize moved areas
Output: A set of cell positions diffs for whichdifferences were found between S1 and S2
1 foreach c ∈ FORMULACELLS(S1 )∪ FORMULACELLS(S2 ) do
2 if ISDIFFERENT(c, S1 , S2 , diffs) ∧¬WASMOVED(c, S1 , S2 , minSize) then
3 diffs ← diffs ∪ {c};
4 return diffs;
function WASMOVED(c, S1 , S2 , minSize)5 candidates ← FINDSAMEFORMULAS(c, S1 , S2 );6 foreach candidate ∈ candidates do7 areas ← areas ∪ {FINDEQUIVALENTAREA(c,
S1 , candidate , S2 )};8 return minSize < MAXSIZE(areas);
cell with the same surrounding area can be found elsewherein the spreadsheet. The function first searches for all cells inS2 that have the same formula as cell c in S1 . Then it iteratesover all elements of this list called candidates and calculatesthe size of the area in S2 that is equal to the area surroundingc in S1 . If a sufficiently large identical block – as specifiedby the minSize parameter – is found for at least one of thecandidates , the algorithm assumes that the corresponding areawas moved.
More complex heuristics or even exact pattern matchingmethods could of course be used but can come at the cost ofhigher computational complexity. We chose a simple heuristicas our goal is to support the parameterizable “on-demand”calculation of differences, e.g., in the context of email conver-sation graphs.
III. VALIDATION – DETECTING ERRORS IN THE CORPUS
To validate our general approach and the designed heuris-tics, we used the developed software tool to locate an initialset of real-world errors in the Enron corpus.
Our method supports two modes of operation to findspreadsheet versions: (a) based on the inspection of emailconversations, (b) based on the similarity of file names.
A. Classifying Changes as Error Corrections
Determining whether a change from one spreadsheet versionto another led to the correction or introduction of an error canin most cases only be done through a manual process2. Eachidentified error that we report here was therefore classifiedas such by at least two independent spreadsheet experts ina manual process. We adopted a conservative strategy andclassified changes only as errors if the intended semantics of
2In our view, only very simple cases like the removal of a #DIV/0 errorcan probably be automatically detected with some confidence.

the calculations in the spreadsheet were understandable andthe bug was obvious or even mentioned in the email text.
1) Example 1: We searched for email conversations thatcontained the words “error” and “spreadsheet” in the messagetext.3 One filtered email contained the text “Ron pointed out anerror to me in my spreadsheet. The revised one is attached”.The sender pointed out that one calculation outcome was “toolow”. An automated comparison of the attached spreadsheetwith other versions of it quickly led us to the change. In cellD6, the formula “=D4*1500” was changed by the sender of theemail to “=D10*1500”, i.e., a cell reference error was madein the original file, which led to the faulty (too low) outcome.
In that particular case the file names of the different versionsof the spreadsheet attached to the emails were identical. Thisfile and its different versions would therefore also be foundby our tool when we only look for file versions withoutreconstructing the email conversations. The text of the emailmessage however assures us that the change was actually anerror and not a change of the business rules.
2) Example 2: When searching for files with similarnames, our tool returned two versions of a multi-worksheetspreadsheet named CrackSpreadOptions.xls. The files con-tained six formula differences, which were however detectedas changes to copy-equivalent formulas and counted as one.Specifically, the formulas in column M were changed from“=HEAT($B9;...;M$7)” to “=C9*HEAT($B9;...;M$7)” etc.,i.e., the computation was extended with a multiplication factorthat was forgotten in the previous version.4 We were confidentthat this was truly a hard-to-detect omission error [14] becausethe updated spreadsheet also contained the comment “Had toscale column M by the gas price!!!”.
B. An Initial Corpus of Errors in the Enron Corpus
So far, we have only conducted a few first sessions to builda corpus of spreadsheet errors with the help of our tool. Wehave inspected a few dozen of the email conversations with theabove mentioned keywords manually to locate obvious errorsas those reported above. Furthermore, we made a search basedon identical filenames and limited the search to files whichdiffered from each other in at most three formulas. From thereturned spreadsheets we inspected about 200 files manually.
Overall, already through our initial search we could identify28 occurrences which we classified as quantitative errors withhigh confidence. According to the classification of [15], wefound 14 mechanical errors, 9 logical errors, and 5 omissionerrors. In addition to these errors, we found 8 qualitativeerrors [15], i.e., errors which do not directly lead to immediatefailures but degrade the quality of the spreadsheet. Such qual-itative errors for example include wrong labels for formulas.We are continuing to extend the corpus and provide all detailson a public web site [13]. Our results so far confirm that allerror types mentioned in the literature actually appear in real-world spreadsheets.
3The search with the two terms returned quite a number of irrelevantconversations as the word “error” was often part of email disclaimers.
4The function HEAT is part of an external library.
In the current corpus the majority of the problems wasidentified based on matching file names as this was the firsttechnique that we explored. More than half of the errors couldhowever have been found using either of our identificationtechniques (name-based or conversation-based). Specifically,for 19 of the 36 errors the email conversations includedinformation about a corrected error or even its exact location.
IV. RELATED WORK
Besides the Enron document corpus [11] used in this work,other collections of spreadsheets were published over the yearsto support error research for spreadsheets. Both the often-usedEUSES corpus [8] (4,498 documents) and the more recentFUSE corpus [9] (249,376 documents) contain spreadsheetsthat were retrieved with the help of search engines. Many ofthe documents, however, contain no formulas at all. Further-more, no additional information is available about potentialerrors in the spreadsheets or if they were in practical use.
Other spreadsheet collections were designed to includeinformation about errors. The Hawaii Kooker Corpus forexample comprises 75 spreadsheets (with 97 faults) that werecreated by undergraduate students [16]. A comparable corpusof spreadsheet documents created by students was presentedin [17]. While these corpora obviously contain real errorsmade by humans, it is not fully clear if the spreadsheetsand example calculations are representative for spreadsheetsthat are found in industry. Furthermore, spreadsheets that arecreated in exercises can be structurally quite diverse, hard tocomprehend, or incomplete. Comparing a submitted solutionwith a reference solution can therefore be tedious.
Using email conversations as an additional source to detecterrors in real-world spreadsheets has to our knowledge notbeen done before. Some works, however, exist that aim atautomatically detecting differences in spreadsheets. SheetDiff[18], for example, uses a greedy technique to search for severaltypes of differences which are then visually presented to theuser. Later on, an approach called RowColAlign was proposedthat uses a dynamic programming technique to address someshortcomings of SheetDiff [19]. In the current version ofour tool the differences between spreadsheets are presentedin a structured and compact text-based form. We see theintegration of the ideas proposed in [18] or [19] to visualizethe differences as a promising direction for our future work.
V. CONCLUSION
Research on error detection techniques for spreadsheetsrequires a solid understanding of the types of errors thatusers make when creating spreadsheets. In this work we havepresented a method and tool to locate errors in the Enronspreadsheet corpus based on the identification of versions ofthe same spreadsheet. One particular novelty of our approachlies in the utilization of information from the email conversa-tions in the company. Through a first manual inspection of anumber of version candidates with our tool, we could developan initial set of real-world spreadsheet errors which we planto continuously extend in the future.

ACKNOWLEDGMENT
The work was funded by the Austrian Science Fund (FWF,contract I2144) and the German Research Foundation (DFG,contract JA 2095/4-1). Thanks to Tom-Philipp Seifert forimplementation works.
REFERENCES
[1] R. R. Panko and D. N. Port, “End User Computing: The Dark Matter(and Dark Energy) of Corporate IT,” in Proceedings of the 45th HawaiiInternational Conference on System Sciences (HICSS 2012), Wailea, HI,USA, 2012, pp. 4603–4612.
[2] EuSpRIG, “Spreadsheet horror stories,” Published online at http://www.eusprig.org/horror-stories.htm, Last accessed 2016.
[3] D. Jannach, T. Schmitz, B. Hofer, and F. Wotawa, “Avoiding, findingand fixing spreadsheet errors - a survey of automated approaches forspreadsheet QA,” Journal of Systems and Software, vol. 94, pp. 129–150, 2014.
[4] R. R. Panko, “What We Know About Spreadsheet Errors,” Journal ofEnd User Computing, vol. 10, no. 2, pp. 15–21, 1998.
[5] F. Hermans, M. Pinzger, and A. van Deursen, “Supporting ProfessionalSpreadsheet Users by Generating Leveled Dataflow Diagrams,” in Pro-ceedings of the 33rd International Conference on Software Engineering(ICSE ’11), 2011, pp. 451–460.
[6] R. Abraham and M. Erwig, “AutoTest: A Tool for Automatic Test CaseGeneration in Spreadsheets,” in Proceedings of the IEEE Symposiumon Visual Languages and Human-Centric Computing (VL/HCC 2006),2006, pp. 43–50.
[7] D. Jannach and T. Schmitz, “Model-based diagnosis of spreadsheetprograms: a constraint-based debugging approach,” Automated SoftwareEngineering, vol. 23, no. 1, pp. 105–144, 2016.
[8] M. Fisher and G. Rothermel, “The EUSES Spreadsheet Corpus: Ashared resource for supporting experimentation with spreadsheet depend-ability mechanisms,” SIGSOFT Software Engineering Notes, vol. 30,no. 4, pp. 1–5, 2005.
[9] T. Barik, K. Lubick, J. Smith, J. Slankas, and E. Murphy-Hill, “FUSE:A Reproducible, Extendable, Internet-scale Corpus of Spreadsheets,”in Proceedings of the 12th Working Conference on Mining SoftwareRepositories, Data Challenge, 2015.
[10] R. Abraham and M. Erwig, “Mutation Operators for Spreadsheets,”IEEE Transactions on Software Engineering, vol. 35, no. 1, pp. 94–108,2009.
[11] F. Hermans and E. R. Murphy-Hill, “Enron’s Spreadsheets and RelatedEmails: A Dataset and Analysis,” in Proceedings of the 37th Interna-tional Conference on Software Engineering (ICSE 2015), Florence, Italy,2015, pp. 7–16.
[12] T. Schmitz and D. Jannach, “Enron Spreadsheet Error Finder,” Publishedonline at http://ls13-www.cs.tu-dortmund.de/homepage/spreadsheets/enron-spreadsheet-tool.shtml, last accessed 2016.
[13] ——, “The Enron Errors Corpus,” Published online at http://ls13-www.cs.tu-dortmund.de/homepage/spreadsheets/enron-errors.htm, lastaccessed 2016.
[14] R. R. Panko and R. P. Halverson, “Are two heads better than one? (atreducing spreadsheet errors in spreadsheet modeling?),” Office SystemsResearch Journal, vol. 15, no. 1, pp. 21–32, 1997.
[15] ——, “Spreadsheets on Trial: A Survey of Research on SpreadsheetRisks,” in Proceedings of the 29th Hawaii International Conference onSystem Sciences (HICSS 1996), Wailea, HI, USA, 1996, pp. 326–335.
[16] S. Aurigemma and R. R. Panko, “The Detection of Human SpreadsheetErrors by Humans versus Inspection (Auditing) Software,” in Proceed-ings of EuSpRIG 2010 Conference, London, United Kingdom, 2010.
[17] E. Getzner, “Improvements for Spectrum-based Fault Localizationin Spreadsheets,” Master’s thesis, Graz University ofTechnology, http://spreadsheets.ist.tugraz.at/index.php/corpora-for-benchmarking/info1/, 2015.
[18] C. Chambers, M. Erwig, and M. Luckey, “SheetDiff: A Tool for Identi-fying Changes in Spreadsheets,” in Proceedings of the IEEE Symposiumon Visual Languages and Human-Centric Computing (VL/HCC 2010),Madrid, Spain, 2010, pp. 85–92.
[19] A. Harutyunyan, G. Borradaile, C. Chambers, and C. Scaffidi, “Planted-model evaluation of algorithms for identifying differences betweenspreadsheets,” in Proceedings of the IEEE Symposium on Visual Lan-guages and Human-Centric Computing (VL/HCC 2012), Innsbruck,Austria, 2012, pp. 7–14.

Related Documents