Automated mapping of tropical deforestation and forest degradation: CLASlite Gregory P. Asner, David E. Knapp, Aravindh Balaji, and Guayana Páez-Acosta Department of Global Ecology, Carnegie Institution for Science, 260 Panama Street, Stanford, California 94305 [email protected], [email protected], [email protected], [email protected] Abstract. Monitoring deforestation and forest degradation is central to assessing changes in carbon storage, biodiversity, and many other ecological processes in tropical regions. Satellite remote sensing is the most accurate and cost-effective way to monitor changes in forest cover and degradation over large geographic areas, but the tools and methods have been highly manual and time consuming, often requiring expert knowledge. We present a new user- friendly, fully automated system called CLASlite, which provides desktop mapping of forest cover, deforestation and forest disturbance using advanced atmospheric correction and spectral signal processing approaches with Landsat, SPOT, and many other satellite sensors. CLASlite runs on a standard Windows-based computer, and can map more than 10,000 km 2 , at 30 m spatial resolution, of forest area per hour of processing time. Outputs from CLASlite include maps of the percentage of live and dead vegetation cover, bare soils and other substrates, along with quantitative measures of uncertainty in each image pixel. These maps are then interpreted in terms of forest cover, deforestation and forest disturbance using automated decision trees. CLASlite output images can be directly input to other remote sensing programs, geographic information systems (GIS), Google Earth™, or other visualization systems. Here we provide a detailed description of the CLASlite approach with example results for deforestation and forest degradation scenarios in Brazil, Peru, and other tropical forest sites worldwide. Keywords: ALI, ASTER, deforestation, forest degradation, forest disturbance, Landsat, logging, MODIS, REDD, satellite monitoring, SPOT, UNFCCC. 1 INTRODUCTION As the United Nations Framework Convention on Climate Change (UNFCCC) moves to implement the program for Reduced Deforestation and Degradation (REDD) [1, 2], the scientific community is tasked with providing concrete methodologies to monitor forest cover and to estimate changes in carbon stocks over time. For REDD to move forward, these methodologies must be put into operation in a relatively short period of time. In support of this effort, the Intergovernmental Panel on Climate Change provided Good Practice Guidelines to assist countries in developing three different tiers of carbon assessment, with the Tier-I approach based on the most general estimates of national forest cover and generic forest carbon density values (e.g., tons ha-1), to Tier-III that provides very detailed landscape- and species-specific carbon stock estimates with regular reassessments [3]. The range of possible technical approaches is enormous, and the accessibility, applicability and accuracy of many critical steps remain poorly demonstrated. At the national level, it is likely that many tropical countries will rely initially on Tier-I levels of accuracy, yet this approach will provide carbon stock estimates with very large uncertainties [4]. Evolving the national monitoring capacities to Tier-II and III accuracies will require improved regional monitoring methods. A major motivation to move from Tier-I to Journal of Applied Remote Sensing, Vol. 3, 033543 (18 August 2009) © 2009 Society of Photo-Optical Instrumentation Engineers [DOI: 10.1117/1.3223675] Received 26 Jun 2009; accepted 12 Aug 2009; published 18 Aug 2009 [CCC: 19313195/2009/$25.00] Journal of Applied Remote Sensing, Vol. 3, 033543 (2009) Page 1

Welcome message from author
This document is posted to help you gain knowledge. Please leave a comment to let me know what you think about it! Share it to your friends and learn new things together.
Transcript
Automated mapping of tropical deforestation and forest degradation CLASlite
Gregory P Asner David E Knapp Aravindh Balaji and Guayana Paacuteez-Acosta
Department of Global Ecology Carnegie Institution for Science 260 Panama Street Stanford California 94305
gpastanfordedu deknappstanfordedu aravindhstanfordedu gpaezstanfordedu
Abstract Monitoring deforestation and forest degradation is central to assessing changes in carbon storage biodiversity and many other ecological processes in tropical regions Satellite remote sensing is the most accurate and cost-effective way to monitor changes in forest cover and degradation over large geographic areas but the tools and methods have been highly manual and time consuming often requiring expert knowledge We present a new user-friendly fully automated system called CLASlite which provides desktop mapping of forest cover deforestation and forest disturbance using advanced atmospheric correction and spectral signal processing approaches with Landsat SPOT and many other satellite sensors CLASlite runs on a standard Windows-based computer and can map more than 10000 km2 at 30 m spatial resolution of forest area per hour of processing time Outputs from CLASlite include maps of the percentage of live and dead vegetation cover bare soils and other substrates along with quantitative measures of uncertainty in each image pixel These maps are then interpreted in terms of forest cover deforestation and forest disturbance using automated decision trees CLASlite output images can be directly input to other remote sensing programs geographic information systems (GIS) Google Earthtrade or other visualization systems Here we provide a detailed description of the CLASlite approach with example results for deforestation and forest degradation scenarios in Brazil Peru and other tropical forest sites worldwide
Keywords ALI ASTER deforestation forest degradation forest disturbance Landsat logging MODIS REDD satellite monitoring SPOT UNFCCC
1 INTRODUCTION As the United Nations Framework Convention on Climate Change (UNFCCC) moves to implement the program for Reduced Deforestation and Degradation (REDD) [1 2] the scientific community is tasked with providing concrete methodologies to monitor forest cover and to estimate changes in carbon stocks over time For REDD to move forward these methodologies must be put into operation in a relatively short period of time In support of this effort the Intergovernmental Panel on Climate Change provided Good Practice Guidelines to assist countries in developing three different tiers of carbon assessment with the Tier-I approach based on the most general estimates of national forest cover and generic forest carbon density values (eg tons ha-1) to Tier-III that provides very detailed landscape- and species-specific carbon stock estimates with regular reassessments [3] The range of possible technical approaches is enormous and the accessibility applicability and accuracy of many critical steps remain poorly demonstrated
At the national level it is likely that many tropical countries will rely initially on Tier-I levels of accuracy yet this approach will provide carbon stock estimates with very large uncertainties [4] Evolving the national monitoring capacities to Tier-II and III accuracies will require improved regional monitoring methods A major motivation to move from Tier-I to
Journal of Applied Remote Sensing Vol 3 033543 (18 August 2009)
copy 2009 Society of Photo-Optical Instrumentation Engineers [DOI 10111713223675]Received 26 Jun 2009 accepted 12 Aug 2009 published 18 Aug 2009 [CCC 193131952009$2500]Journal of Applied Remote Sensing Vol 3 033543 (2009) Page 1
Tier-III is the increase in accuracy and transparency of reporting carbon stocks with the positive cascading effect of increased investment for carbon sequestration
To achieve increased monitoring accuracy and transparency spatially-explicit information on forest cover change at large scales must be derived from satellites Global satellite mapping of forest cover has greatly improved and may be considered routine for delivering estimates of deforestation [5 6] However these global mapping approaches currently require experts to maintain them The global approaches also often miss millions of small forest clearings that occur at the few-hectare scale and they miss most of the forest degradation [the second D in REDD 7] Several other higher resolution regional mapping approaches have also been developed [8-10] but to our knowledge none have been designed for and widely distributed to non-experts outside of the remote sensing community In response to this gap we have developed a regional satellite monitoring tool for both deforestation and forest disturbance at lt 01 ha spatial resolution Here we define disturbance as a diffuse thinning of the forest canopy caused by human activities [11] We further define degradation as the temporal or spatial persistence of disturbance extensive high-impact logging or repeated fires are examples of forest degradation
We present a new approach called CLASlite which allows a non-expert user to quickly assess the regional distribution of tropical forest cover deforestation and degradation CLASlite is a user-friendly software package specifically designed to support forest monitoring for REDD We provide a detailed description of the CLASlite algorithms as well as examples from Peru Brazil and other tropical forest regions that demonstrate the steps outputs and common uses of the method
2 DESIGN REQUIREMENTS Our overarching goal is to develop a system for rapid mapping of forest cover deforestation and disturbance over large geographic regions From an operational monitoring perspective it is important that the method be sufficiently general to accommodate a wide range of tropical forest conditions Tropical canopies come in a wide variety of architectures from stands with large-statured interlocking tree crowns to narrow-stemmed densely foliated bamboo stems These architectures affect the spectral signatures measured by spaceborne sensors [12 13] Similarly the spectral reflectance properties of tropical forests are largely driven by species composition as many species express variation in chemical and structural characteristics [14 15] To generically detect deforestation and disturbance the method needs to identify changes in forest canopy cover without being overly sensitive to variation in forest type architecture and species composition
The method must also accommodate a wide range of atmospheric conditions Tropical atmospheres are particularly challenging often containing high water vapor content and haze (aerosol) from biomass burning and other sources [16 17] These atmospheric constituents cause uncertainty in the spectral signatures measured by spaceborne sensors which can have cascading effects on estimates of canopy cover deforestation and disturbance [18] The method must therefore allow for correction of atmospheric effects yet also accommodate a degree of uncertainty in the composition of the atmosphere at the time of satellite data acquisition even pixel to pixel within the image
The algorithms must work with a wide variety of satellite sensors and imagery Although a few satellites such as the Landsat series are common and highly accessible (httplandsatusgsgov) a number of new spaceborne sensors have become available providing increased frequency of coverage over the tropical forest biome Given the great extent of tropical forests about 10 million km2 along with the heavy cloud cover typically encountered in these regions [19] a constellation of satellite sensors is needed for operational
Journal of Applied Remote Sensing Vol 3 033543 (2009) Page 2
monitoring Finally the method must be highly accessible to non-expert users From a technology perspective accessibility is foremost determined by three factors (i) automation of method (ii) applicability to a standard desktop computer and (iii) accessibility to entry-level geospatial analysts or technicians
3 METHODOLOGICAL HERITAGE The Carnegie Landsat Analysis System (CLAS) was originally developed as an expert system for large-scale mapping of tropical forest disturbance including selective logging [20] In initial studies CLAS was used to map selective logging throughout much of the Brazilian Amazon with an estimate of mapping errors of 11-14 Following its initial use in Brazil CLAS was successfully updated to include deforestation and validated in the Peruvian Amazon yielding uncertainties in deforestation and forest disturbance detection of 05 and 90 respectively [21] In addition CLAS has been successfully tested in lowland to montane forests of Borneo Mozambique Madagascar and the Hawaiian Islands
CLASlite builds off several of the core modules within CLAS ndash modules that facilitate high-resolution forest cover analysis The CLASlite approach was redeveloped and streamlined to increase automation The key aspects of CLASlite are discussed in the following section on algorithms It is the combination of methods applied in a unique modeling environment that allows for repeatable automated solutions to the deforestation and disturbance mapping problem
4 CLASLITE ALGORITHMS CLASlite integrates a series of processes that take raw satellite imagery and produce forest cover change images (1) radiometric calibration and atmospheric correction of satellite data (2) cloud water and shadow masking (3) decomposition of image pixels into fractional surface covers and (4-5) classification of the imagery into forest cover deforestation and forest disturbance (Fig 1) The next sections provide a detailed description of these processes illustrated with examples taken from analyses of tropical forests in Peru and Brazil
41 Satellite imagery A wide variety of satellite imagery can be analyzed using CLASlite Currently the following images are supported Landsat 4 and 5 Thematic Mapper (TM) Landsat 7 Enhanced Thematic Mapper Plus (ETM+) Advanced Spaceborne Thermal Emission and Reflection Radiometer (ASTER) Earth Observing-1 Advanced Land Imager (ALI) Satellite pour lObservation de la Terre 4 and 5 (SPOT) and the Moderate Resolution Imaging Spectrometer (MODIS) Along with the raw imagery information on geographic location and basic sensor settings is required both of which are provided in the satellite metadata often stored in the image header information or supplied with the raw imagery
Journal of Applied Remote Sensing Vol 3 033543 (2009) Page 3
Fig 1 CLASlite version 20 processing stream Major processes are numbered 1-6
42 Calibration and atmospheric correction CLASlite ingests raw satellite imagery and applies established sensor gains and offsets to derive exo-atmospheric radiance for each image band The radiance data are then passed to a fully automated version of the 6S atmospheric radiative transfer model [22] to derive apparent surface reflectance for each spectral band (Process 1a-b Fig 1) The 6S model requires a number of inputs which include an estimate of aerosol optical thickness (AOT) and water vapor Within CLASlite these atmospheric parameters are held in geographic look-up tables derived from the NASA MODIS 1-degree atmospheric products (httpgcmdnasagov recordsGCMD_MOD08_M3html) Spatial and temporal co-location of MODIS AOT and water vapor data with the high resolution satellite imagery is done on an automated basis
Journal of Applied Remote Sensing Vol 3 033543 (2009) Page 4
CLASlite uses the latest version of 6S (http6sltdriorg) which supports Landsat-4 5 and 7 as well as ASTER ALI and SPOT CLASlite does not perform atmospheric correction on MODIS land imagery because those data are already processed to surface reflectance in the 8-day composite product (MOD09A1 httpslpdaac usgsgovlpdaacproductsmodis_ products_tablesurface_reflectance8_day_l3_global_500mv5terra)
Because biomass burning is very common in optical satellite imagery of tropical regions we implemented an automated haze correction that runs as a secondary atmosphere-compensation option for Landsat data in CLASlite (Fig 2) The empirical method uses the NIR and SWIR bands (45 and 7) to develop a lookup table of average radiance of the visible
Fig 2 (a) Raw Landsat 7 Enhanced Thematic Mapper Plus (ETM+) imagery taken over the Peruvian Amazon in 2002 (b) Same image following atmospheric correction and haze suppression Equivalent histogram stretches were applied to both images
Journal of Applied Remote Sensing Vol 3 033543 (2009) Page 5
bands (1 2 and 3) for each unique combination of the NIR and SWIR bands The NIR and SWIR bands are not as affected by haze as the visible bands so assigning the average radiance for bands 1 2 and 3 homogenizes the haze throughout the image reducing the variation of haze between pixels in the image This method is an improvement over other haze equalization methods in that it preserves subtle detail between pixels and maintains spectral integrity among image bands [23]
43 Initial image masking CLASlite automatically masks water bodies such as rivers and lakes removing them from subsequent analysis steps (Process 2 Fig 1) Water masking is achieved by detecting the unique reflectance properties of water which is generally characterized by decreasing reflectance from the blue (~400 nm) to the near infrared (gt 800 nm) portions of the spectrum Some cloud shadow features are also masked by identifying pixels that appear in the reflectance image as having negative reflectance These pixels are typically those that do not receive direct sunlight
CLASlite includes an option to mask clouds in the imagery using the thermal band of Landsat when this sensor is used (Fig 1) This option is not available for SPOT or ALI data and is not applied to ASTER imagery in the current version of the software The primary advantage of masking cloud cover is to decrease the processing time of subsequent steps in CLASlite This step does not completely mask out all clouds or pixels partially contaminated by clouds Additional cloud and cloud-shadow masking is done after sub-pixel analysis described next
44 Sub-pixel analysis The core process within CLASlite is a sub-model called the AutoMCU (Automated Monte Carlo Unmixing Process 3 Fig 1) which provides quantitative analysis of the fractional or percentage cover (0-100) of live and dead vegetation and bare substrate within each satellite pixel (eg within each 30 x 30 m pixel in a Landsat image) (Fig 3) The live vegetation is technically called Photosynthetic Vegetation (PV) because it maintains unique spectral properties associated with leaf photosynthetic pigments and canopy water content [24] The dead or senescent vegetation fraction is termed Non-photosynthetic Vegetation (NPV) which is expressed in the spectrum as bright surface material with spectral features associated with plant carbon compounds [reviewed by 25] Bare substrate is often dominated by exposed mineral soil but is secondarily comprised of various rock types [26]
The AutoMCU sub-model is based on a probabilistic algorithm originally developed for savanna woodland and shrubland ecosystems [27 28] which was later modified for broadleaf tropical forests [20 29] The method uses three spectral endmember libraries derived from extensive field measurements and hyperspectral satellite imagery to decompose each image pixel using the following linear equation
ρ(λ)pixel = Σ [Ce bull ρ(λ)e]+ε = [Cpv bull ρ(λ)pv + Cnpv bull ρ(λ)npv + Csubstrate bull ρ(λ)substrate]+ε (1) where ρ(λ)e is the reflectance of each land-cover endmember (e) at wavelength λ and ε is an error term The land-cover endmembers are PV NPV and bare substrate Solving for each sub-pixel cover fraction (Ce) requires that the satellite observations (ρ(λ)pixel) contain sufficient spectral information to solve a set of linear equations each of the form in equation (1) but at different wavelengths (λ) An additional constraint over the solution to equation (1) is that the cover fractions within each pixel sum to unity
Journal of Applied Remote Sensing Vol 3 033543 (2009) Page 6
Fig 3 Processing stream for the Automated Monte Carlo Unmixing (AutoMCU) sub-model within CLASlite
Traditionally there have been a limited number of spectral signatures of PV NPV and
bare substrates for tropical regions yet the AutoMCU technique requires spectral reflectance libraries [ρpv(λ) ρnpv(λ) and ρsubstrate(λ)] that encompass the common variation in these spectral signatures Using field spectroradiometers measuring surface reflectance from 400-2500 nm the bare substrate spectral library was collected across a diverse range of soil types surface organic matter levels and moisture conditions (Fig 3) This library contains spectra from exposed mineral soils such as oxisols and ultisols and rocks including granites and basalts Spectral collections for NPV included surface litter senescent grasslands and deforestation residues (slash) from a wide range of species and decomposition stages These two spectral endmember libraries encompass the common variation in surface materials found
Journal of Applied Remote Sensing Vol 3 033543 (2009) Page 7
throughout tropical forests of Amazonia Central America and Hawaii with statistical variability well defined
In contrast to the NPV and bare substrate spectra that can be collected using ground-based spectrometers the PV spectra of forest species require overhead viewing conditions This is very difficult to achieve in forest canopies reaching 50 m or more in height Spectral measurements of individual leaves stacks of foliage or partial canopies (eg branches) introduce major errors in spectral mixture models and cannot be used [25 30] Therefore the canopy spectra were compiled from measurements made using the Earth Observing-1 Hyperion sensor the first spaceborne hyperspectral sensor for environmental applications [31] The PV spectral library was compiled from study areas in the Brazilian and Peruvian Amazon region Costa Rica and the Hawaiian Islands (Fig 4)
Fig 4 An example series of EO-1 Hyperion images of humid tropical forests throughout the Brazilian Amazon Intact closed-canopy forest areas were selected for analysis of spatial variations in forest photosynthetic vegetation (PV Fig 3) spectra Other images used in the library development include forests in Peru Costa Rica and Hawaii
Journal of Applied Remote Sensing Vol 3 033543 (2009) Page 8
The Hyperion spectra were atmospherically corrected to apparent top-of-canopy
reflectance using the ACORN-4 atmospheric correction algorithm for hyperspectral data (ImSpec Inc Palmdale CA USA) and convolved to the optical channels of each satellite supported in CLASlite The PV library includes Hyperion spectra collected over intact terra firme riparian and floodplain forests lowland to montane forests bamboo- and palm-dominated forests early to late-stage secondary forest regrowth and logged forest of varying years post-harvest The spectra held in the endmember libraries for the AutoMCU sub-model represent more than 400000 field and spaceborne spectrometer observations collected throughout Central and South American as well as Pacific Island tropical forests
The AutoMCU iteratively selects a PV NPV and bare substrate spectrum from each library and unmixes the pixel reflectance into constituent cover fractions using equation (1) The process of random selection is repeated until the solution converges on a mean value for each surface cover fraction In the original CLAS [20] the iteration was done dynamically until a stable standard deviation between successive fractional cover estimates was reached Following a series of studies on different tropical forests we found that 30 iterations per pixel is usually sufficient to achieve a stable solution based on this Monte Carlo approach and thus this value is fixed in CLASlite (Fig 3)
An advantage of the Monte Carlo approach is that the per-pixel iterations produce a standard deviation of the estimate for PV NPV and bare substrate fractions (Fig 3) These are output from CLASlite as standard deviation images In addition a final analysis of the fit of the modeled spectrum (right side of eq 1) to the input spectrum (left side of eq 1) is computed for each pixel leading to a root mean squared error (RMSE) image Combined the standard deviation and RMSE images provide a way to assess the performance of the AutoMCU on a pixel by pixel basis allowing the user to identify areas of concern Such areas can occur when a vegetation type is not well represented in the spectral libraries in areas where inorganic materials are present (eg infrastructure) or atmospheric disturbances remain unmasked from other CLASlite steps (eg edges of clouds severe haze)
45 Secondary image masking After the AutoMCU determines the fractional cover of PV NPV and bare substrate within each image pixel there is a secondary masking and rescaling step (Process 4 Fig 1) The masking step applies a user-selected threshold value to the RMSE image derived from the AutoMCU model The threshold is one of the few user inputs to CLASlite to allow customized removal of cloud shadows and other features in the image that cannot be adequately modeled from the core PV NPV and bare substrate spectral libraries These features can include water wetlands or cloudy pixels that did not meet the preliminary masking criteria applied prior to the AutoMCU step This second masking step improves the accuracy of the fractional cover estimates of the pixels that are processed with the AutoMCU by preventing contaminated pixels from being included in the statistics used in a rescaling step described below
AutoMCU works best with hyperspectral imagery [28] With the smaller number of spectral bands available in Landsat SPOT and other multispectral imagery results from multispectral AutoMCU can be improved by scaling them so that the mean PV fraction of forested areas (gt 80 PV) matches that of areas with gt 80 forest as defined in the timeseries NASA Vegetation Continuous Fields Tree Cover product (VCF) data (httpglcfumiacsumdedudatavcf) [6 32] By finding the difference in the mean AutoMCU PV value for pixels with gt 80 PV and comparing it to coincident areas in the VCF data (Fig 5) we apply an offset to the AutoMCU PV data so that the mean of the distributions of the coincident forested pixels from VCF and the CLASlite image are equal The NPV and bare substrate fractions are adjusted accordingly so that the sum of fractional
Journal of Applied Remote Sensing Vol 3 033543 (2009) Page 9
covers remains close to 10 or 100 By leveraging the coarse resolution data from MODIS to improve the AutoMCU results from CLASlite a more consistent set of fractional cover images can be produced making change detection more reliable
Fig 5 Example of automatically colocating CLASlite imagery - here Landsat 7 ETM - with the MODIS VCF product (red 1 x 1 km pixels) The VCF maps are held in a geographic database that is embedded in CLASlite the VCF maps are updated annually via the internet (httpclasliteciwedu)
46 Deforestation and disturbance mapping (multi-image mode) CLASlite includes the fully automated capability to detect change between a timeseries images taken of the same geographic area over time (Process 5 Fig 1) Multi-image analysis is the most accurate approach for detection of forest loss (deforestation) gain (secondary regrowth) or degradation (areas of persistent forest disturbance) The following expressions were derived from extensive field testing and validation to identify disturbance [20 21] For this decision logic the subscripts 0 and 1 indicate changes from one year to the next
Journal of Applied Remote Sensing Vol 3 033543 (2009) Page 10
Deforestation (eq 2) (PV0 gt 60) AND ((-100 lt PV1-PV0 lt -40) and (NPV1-NPV0 gt 4)) OR ((NPV0 lt 30 and S0 lt 15) and (PV1 lt 80 and NPV1 gt 20 and S1 gt 0) and (PV1-PV0 lt -9 and NPV1-NPV0 gt 15 and S1-S0 gt -999))
Forest disturbance (eq 3)
(PV1-PV0 gt -40) AND (PV0 gt 80 and NPV0 lt 25 and S0 lt 15) AND (PV1 lt 85 and NPV1 gt 15 and S1 lt 7) AND ((PV1-PV0 lt -6 and 7 lt NPV1-NPV0 lt 14 and S1-S0 gt -1) or (PV1-PV0 lt -7 and NPV1-NPV0 gt 13 and S1-S0 lt -1))
46 Forest cover analysis (single-image mode) Although it is preferable to use at least two consecutive (lt 1 year apart) images to detect deforestation and forest disturbance it is possible to map forest canopy cover using single images in CLASlite (Process 6 Fig 1) These forest cover images often indicate areas of past clear-cutting and disturbance Based on extensive testing and field-based validation the following decision tree was developed to convert the single-image AutoMCU results to an estimate of forest cover Large forest clearings (eq 4)
PV lt 56 Small forest clearings (eq 5)
56 lt PV lt 80 and 14 lt NPV lt 34 and 0 lt Bare lt 17 OR PV lt 80 and not already identified as a clearing
47 Technical limitations While the CLASlite program alone does not distinguish different types of disturbance (anthropogenic vs natural logged vs fire scars) it allows the user to rapidly classify the total disturbance at high spatial resolution in a highly automated way Outputs from CLASlite particularly the disturbance maps usually require additional analysis in order to interpret them as specific types of disturbance In practice the outputs from CLASlite are often best used in GIS or similar approaches to integrate multiple data sources for large-scale thematic mapping
Journal of Applied Remote Sensing Vol 3 033543 (2009) Page 11
5 CASE STUDIES
51 Forest cover in the Peruvian Amazon The following case studies demonstrate the CLASlite approach using both single- and multi-image analysis techniques These studies also highlight several critical issues relating forest cover monitoring to deforestation and forest degradation analysis and tracking The first example uses Landsat 7 ETM+ imagery collected over a 900 km2 portion of the Peruvian Amazon The study area shown in Fig 2 neighbors the town of Pulcallpa Peru located about 125 km west of the Brazilian border in lowland tropical forest The area includes recent deforestation associated with the expansion of cattle ranching and crop agriculture The Landsat image was collected on July 9 2002
The AutoMCU was run on the calibrated reflectance image yielding the results shown in Fig 6 Intact forest is dominated by high PV fractions (90-98 green colors) low NPV (2-
Fig 6 Typical output from the AutoMCU sub-model run on the imagery shown in Fig 2b In each image pixel the fractions of PV NPV and bare substrate are expressed in percentages (0-100) The areas in black include rivers lakes clouds and cloud shadows masked via the RMSE analysis immediately following the AutoMCU
Journal of Applied Remote Sensing Vol 3 033543 (2009) Page 12
10 blues) and very low bare substrate (~ 0) A road and a large number of deforested areas are readily visible in the western portion of the image Both the road and many of the clearings are dominated by high bare substrate fractions (gt 50 reds) whereas other clearings are predominantly covered with NPV (gt 50 blues) which is predominantly dry pasture grass All clearings display the prototypical reticular shape caused by humans Riparian zones show areas of high canopy cover and bare substrate (yellow colors) These areas are seasonally disturbed by flood waters which remove much of the smaller standing vegetation and most of the surface litter leaving a riverine mosaic of recent canopy growth (dominated by bamboo) and a bare mineral soil surface In contrast drier areas within the river itself are dominated by bare sands and rocks as shown as high bare substrate fractions in red colors
The uncertainty images for each fractional cover estimate are shown in Fig 7 along with the RMSE image indicating the overall fit between each modeled and measured spectrum in the dataset The standard deviation (sd) images for PV NPV and bare substrate indicate areas of relatively low to high uncertainty in the Monte Carlo unmixing PV sd are low
Fig 7 AutoMCU output images of the standard deviation (sd) of photosynthetic vegetation (PV) non-photosynthetic vegetation (NPV) and bare substrate (Bare) The final fit of the modeled spectrum to the measured spectrum in each pixel is reported in a root mean square error (RMSE) image
(lt 5) to high (gt 10) in the forested and cleared areas respectively NPV follows a similar pattern although uncertainty in this cover fraction is slightly higher (~ 5-8) in forested
Journal of Applied Remote Sensing Vol 3 033543 (2009) Page 13
areas The highest sd among NPV and bare substrate are found in the seasonally disturbed riparian areas where materials likely exhibit intimate mixtures of all three materials with non-linear mixing and thus emergent spectral properties [33] The RMSE image shows the geographic areas of relatively high overall uncertainty in the modeling for example the riparian corridor has the largest errors approaching 10 In contrast deforested areas show very low error in the AutoMCU results often only 1-2 Together these images provide a quantitative spatially explicit means to assess uncertainty in the fractional cover estimates resulting from CLASlite
The final step in this single-image analysis utilizes the decision tree (eqs 4-5) described earlier to estimate forest canopy cover and non-forest cover throughout the region (Fig 8) A simple map such as this one can then be used to calculate forest extent In this 900 km2 region of the Peruvian Amazon the total forest cover is 7743 km2 Image masking results are also reported as shown in grey areas here indicating water bodies clouds and cloud shadows
Fig 8 Automated forest cover mapping from single-image analysis in CLASlite Green areas are forest cover orange areas are non-forest cover grey areas are water bodies clouds and cloud shadows masked during analysis
Journal of Applied Remote Sensing Vol 3 033543 (2009) Page 14
Field visits to this area of Peru indicated false-positive and false-negative detection rates of less than 1 for deforested and forested lands [GP Asner unpub data 21] Furthermore we exported this image to ArcGIS (ESRI Inc Redlands CA USA) and calculated the percentage of forest clearings at different distances from the main road running north-south in the left side of the image (Fig 8) The forest cover image indicated that 73 and 94 of all clearings occurred within 5 km and 10 km of the road respectively corroborating recent studies suggesting that road building is a key factor determining deforestation patterns in Amazonia [34] Other analyses can be readily applied to the CLASlite imagery either at the sub-pixel level (Fig 6) or regional scale (Fig 8) to study patterns and rates of forest loss recovery and degradation as discussed in the next example
52 Selective logging in the Brazilian Amazon Our second case study focuses on a timeseries analysis of deforestation and forest disturbance in a 3000 km2 region of the eastern Brazilian Amazon The area is located approximately 250 km south of the city of Beleacutem Brazil in the State of Paraacute The area is a known hotspot for timber extraction which was underway in this region in the late 1990s and early 2000s The area was under intense field study at the time with reports indicating that different logging intensities (m3 wood ha-1) and methods (conventional vs reduced-impact) resulted in different levels of canopy damage and dead vegetation production [29 35 36]
We compiled four Landsat 7 ETM+ images collected on July 13 1999 July 31 2000 August 3 2001 and September 7 2002 The images were co-registered to less than one pixel RMS error using the Environment for Visualizing Images (ENVI ITT Inc Boulder CO USA) and were input into CLASlite as raw data values Radiance calibration atmospheric correction and Monte Carlo unmixing were automatically performed on the four images The single-image decision tree analysis (eqs 4-5) was then run on each image independently to highlight areas of forest and non-forest cover each year of observation The multi-image analysis (eqs 2-3) was then run again on the combined image timeseries to isolate forest clear-cutting (deforestation) from the diffuse disturbances that occurred throughout the study period
Single-image analysis indicated that forest cover changes were substantial during the period 1999 to 2002 (Fig 9) The total forest cover was 26097 km2 in 1999 Forest area was 25181 km2 by 2002 representing a net decrease of 836 km2 or 35 From a net forest cover perspective this loss is considered fairly large since it occurred in just a three year period [37] However multi-image analysis which provides a means to track gross changes in forest cover and which can separate deforestation events from forest disturbance provided a different perspective The gross rate of deforestation was 104 111 and 292 km2 yr-1 in 1999-2000 2000-2001 and 2001-2002 respectively (Fig 10a) However the gross rate of forest disturbance was far larger 262 312 and 386 km2 yr-1 (Fig 10b) Combined the gross rate of deforestation and disturbance was 1467 km2 or a 57 over the three-year period
This difference between the net (35) and gross (57) loss of forest cover is typically caused either by regrowth of secondary forest on deforested lands or by the reestablishment of leaf cover in disturbed forest canopies Our previous work demonstrated that more than 98 of the forest disturbance in this area resulted from selective logging [29] and that this region underwent almost no secondary forest regrowth between 1999 and 2002 In contrast leaf cover rapidly returned in areas that underwent disturbance from selective logging Moreover although the leaf cover returned within two years following timber harvests [29 35 38] the forest volume did not ndash it takes as much as 50-80 years for forest biomass to return to original pre-logging levels [39 40] Therefore the observed recovery of vegetation leaf cover following logging is the principal cause of the ldquoapparentrdquo low net rates of forest loss throughout the region From a forest carbon monitoring perspective the gross rate of canopy damage is far more important than the net rate because gross rates indicate the initial largest
Journal of Applied Remote Sensing Vol 3 033543 (2009) Page 15
carbon losses caused by either deforestation (clear-cutting) and disturbances such as selective logging
Fig 9 Automated CLASlite analysis of forest (green) and non-forest (orange) cover throughout a 3000 km2 region of the eastern Brazilian Amazon
From a UNFCCC REDD monitoring perspective the consequences of tracking net versus
gross rates of deforestation and disturbance on carbon loss estimates are enormous For example assuming an average forest aboveground carbon density of 200 Mg C ha-1 (IPCC 2006) this region underwent a net aboveground carbon loss of 183 Tg C (1 Tg = 1 million metric tons) in three years (35 of 2607 km2 multiplied by 200 Mg C ha-1) Using an analysis of gross forest losses which accounts for losses from both deforestation and disturbance such as selective logging the total aboveground carbon emitted was 293 Tg C a full 60 increase in carbon emission estimates from the same region over the same period Although the amount of carbon lost per hectare by logging is far lower than by deforestation in this case the logging was far more widespread resulting in a large regional-scale loss of carbon from the system Focusing on deforestation alone or net rates of change is clearly inferior to using gross rates of deforestation and forest disturbance Finally the persistence of
Journal of Applied Remote Sensing Vol 3 033543 (2009) Page 16
Fig 10 Automated CLASlite analysis of deforestation and forest degradation in a 3000 km2 region of the eastern Brazilian Amazon Orange indicates forest loss and disturbance from 1999 to 2000 green from 2000 to 2001 and grey from 2001-2002
Journal of Applied Remote Sensing Vol 3 033543 (2009) Page 17
logging in this region of the Brazilian Amazon is so great that one can probably apply the descriptor ldquodegradationrdquo to this area Other forms of degradation not represented in this particular example but which are common in tropical forest areas exposed to logging include fire which results in even greater canopy losses and thus carbon emissions to the atmosphere [41 42]
53 Prospects for global forest cover mapping The accuracy and precision of CLASlite or any method for mapping forest cover is dependent upon the selection of satellite data One major problem among past studies is that many classification methods are highly sensitive to sensor specifications particularly spectral resolution and radiometric calibration Atmospheric conditions are another confounding factor affecting classification results Any high-resolution (lt 30 m) mapping approach for global applications must inherently support a suite of sensors that can be used to piece together large-area coverage of forests This is particularly true in humid tropical regions where cloud cover is persistent and so mosaicking of cloud-free data must use various sensors each with varying multi-spectral resolution and radiometric calibration
CLASlite addresses many of these issues CLASlite makes multi-image multi-sensor mosaicking possible because the AutoMCU sub-model is fully probabilistic with its spectral libraries inherently accommodating differences in spectral and radiometric image properties and variable effects of changing atmospheric conditions between images To illustrate the image-to-image stability of the method we show AutoMCU output for the Cauaxi study region in Brazil using Landsat 7 (30 m) SPOT-4 (20 m) and MODIS (500 m) data (Fig 11)
Fig 11 Fractional PV NPV and bare substrate cover from the AutoMCU sub-model of CLASlite These example results using Landsat 7 ETM+ SPOT-4 and MODIS data cover the same study area shown in Figs 9-10
Journal of Applied Remote Sensing Vol 3 033543 (2009) Page 18
It is obvious that forest clearings selective logging areas roads and the composition of PV NPV and bare substrate are nearly identical using Landsat or SPOT imagery Our experience is similar with ASTER and ALI data as well With MODIS only the larger (gt 25 ha) forest clearings are readily mapped and no logging is apparent in the spectrally unmixed MODIS imagery This represents a fundamental limitation in using global sensors with 500 m (or lower) spatial resolution they are inappropriate for forest disturbance and thus for most forest degradation monitoring Despite the limits of global sensors CLASlite provides a robust way to incorporate imagery from multiple sources which in the long run allows for mosaicking of otherwise incompatible images for large-area deforestation and disturbance mapping This is an emergent property of the CLASlite approach that ultimately makes global-scale high-resolution mapping of tropical forest possible
The forests of Amazonia represent more than 40 of the global humid tropical forest biome [37] yet other forest types occur in the tropics and thus we have tested CLASlite on a wide range of canopies found around the world Fig 12 provides example imagery from Borneo Madagascar the Hawaiian Islands and Mozambique to indicate the applicability of CLASlite to map a wide range of forest types and conditions Since the AutoMCU output is core to the process and because this step occurs after radiometric calibration atmospheric compensation and (most) masking steps we show the fractional cover results here for visual comparison Fig 12a shows large-scale clearing of mesic ldquospinyrdquo forests of southern Madagascar where fuel wood and other subsistent uses are systematically removing the forest
Fig 12 Fractional PV NPV and bare substrate cover for four distinct tropical forest regions (A) mesic spiny forests in Madagascar (B) lowland dry tropical forest in Mozambique (C) Montane rain forests in Borneo and (D) lowland to sub-montane Hawaiian rain forests
Journal of Applied Remote Sensing Vol 3 033543 (2009) Page 19
cover Fig 12b shows diffuse small-landholder clearings emanating from an unpaved single-lane road in Mozambique Fig 12c shows a web of roads and skid-trails caused by logging activities in montane rain forests of Borneo Fig 12d indicates long-term forest cover losses in lowland to montane rain forest in Hawaii Despite the vast differences in forest type and composition of each of these 2000 km2 examples the output remains highly comparable across various types of satellite sensors By reducing the radiometric data to fractional cover results (using a probabilistic method with other steps for ensuring compatibility) the condition and state of very different forests can be directly assessed and compared anywhere in the world This is the ultimate goal of CLASlite for tropical forest monitoring
6 VALIDATION CLASlite and its predecessor CLAS have been through a number of validation exercises summarized in Table 1 As mentioned earlier the deforestation and forest disturbance results were validated over large geographic areas in Brazil and Peru [20 21] The Brazil studies included a series of field projects to comprehensively validate fractional cover output from the AutoMCU sub-model which remains unchanged in CLASlite as well as forest disturbance maps generated from the decision trees that follow the AutoMCU step [29 38 43] The Peru validation was carried out by an independent Peruvian organization Both deforestation and forest disturbance were assessed and found to be highly accurate [21] Other AutoMCU validation studies were conducted in Bolivia [44] Mozambique [45] and the United States [46]
Table 1 Summary of validation studies using CLAS CLASlite and its sub-models
Country Ecoregion Algorithm Uncertainty Reference Brazil Amazon forests CLAS logging 11-14 [20] Peru Amazon forests CLAS deforestation
and disturbance 05 and 95
[21]
Brazil Amazon forests CLAS disturbance ~4 [29] Bolivia Amazon forests AutoMCU lt 10 [44] Mozambique Dry sub-tropical
forests AutoMCU 3-6 [45]
United States Southwestern woodlands
AutoMCU lt 20 [46]
United States Hawaiian forests CLASlite v2 25 Unpub data Peru Amazon forests CLASlite v2 3-13 Unpub data Indonesia Borneo forests CLASlite v2 4 Unpub data
At the time of this writing the CLASlite v2 user base consists of 45 federal non-
government and academic organizations in seven countries Their work with CLASlite involves validation exercises and although there are no published reports available at this time the results continue to look encouraging While these activities continue we are also validating forest cover deforestation and disturbance maps produced by CLASlite In the Hawaiian Islands we completed a 1040900 ha analysis Using field surveys and high-resolution aerial imagery we calculated a 25 uncertainty (81 false negatives 19 false positives) in forest cover In the southern Peruvian Amazon we used CLASlite to map deforestation and disturbance over a 42 million ha area with estimated errors of 3 and 13 respectively (Table 1) Finally throughout Borneo (Indonesia) we used high-resolution GeoEye satellite imagery to evaluate CLASlite results based on Landsat 7 ETM+ data This yielded an estimated uncertainty in forest cover of 4 These and other validation studies and their results will be reported in forthcoming papers
Journal of Applied Remote Sensing Vol 3 033543 (2009) Page 20
7 CONCLUSIONS We presented an integrated analysis environment to support rapid regional-scale mapping of tropical forests using a variety of common satellite sensors CLASlite is operationally robust in that image preparation atmospheric correction cloud-water masking and AutoMCU spectral mixture model work together seamlessly to provide fractional cover estimates of live and dead vegetation as well as bare substrates The single- and multi-image decision trees provide further analysis to reduce the image results to simple maps of forest cover deforestation and disturbance The overall approach requires very little training and thus it can be used by non-experts tasked with tropical forest mapping and monitoring CLASlite can be incorporated into larger forest mapping efforts at the national level In this way the method directly supports forest monitoring efforts for the UNFCCC REDD program However the need for monitoring deforestation and forest disturbance goes far beyond carbon and REDD conservation and management efforts require high-resolution mapping to support policies intended to protect and promote the sustainability of ecosystems and the services they provide as well as global biodiversity
Acknowledgments We thank L Secada for helpful testing of and suggestions for the CLASlite software We thank the subject editor and two anonymous reviewers for comments on the manuscript CLASlite is owned by the Carnegie Institution for Science Carnegie is currently disseminating software licenses to non-commercial government non-government and academic organizations in the Andes-Amazon countries We thank the Gordon and Betty Moore Foundation and the John D and Catherine T MacArthur Foundation for supporting the development application and dissemination of CLASlite
References [1] M Herold and T Johns Linking requirements with capabilities for deforestation
monitoring in the context of the UNFCCC-REDD process Env Res Lett 2 (2007) [doi1010881748-932624045025]
[2] UNFCCC Issues relating to reducing emissions from deforestation in developing countries and recommendations on any further process in Submissions from Parties UNFCCC Ed (2006)
[3] IPCC IPCC Guidelines for National Greenhouse Gas Inventories H S Eggleston L Buendia K Miwa T Ngara and K Tanabe Eds Japan National Greenhouse Gas Inventories Programme (2006)
[4] H K Gibbs S Brown J O Niles and J A Foley Monitoring and estimating tropical forest carbon stocks making REDD a reality Env Res Lett 2 1-13 (2007) [doi1010881748-932624045023]
[5] F Achard R Defries H Eva M Hansen P Mayaux and H-J Stibig Pan-tropical monitoring of deforestation Env Res Lett 2 1-11 (2007) [doi1010881748-932624045022]
[6] M C Hansen S V Stehman P V Potapov T R Loveland J R G Townshend R S DeFries K W Pittman B Arunarwati F Stolle M K Steininger M Carroll and C DiMiceli Humid tropical forest clearing from 2000 to 2005 quantified by using multitemporal and multiresolution remotely sensed data Proc Nat Acad Sci USA105 9439-9444 (2008) [doi101073pnas0804042105]
Journal of Applied Remote Sensing Vol 3 033543 (2009) Page 21
[7] GOFC-GOLD Reducing greenhouse gas emissions from deforestation and degradation in developing countries a sourcebook of methods and procedures for monitoring measuring and reporting Alberta Canada (2008)
[8] M C Hansen D P Roy E Lindquist B Adusei C O Justice and A Altstatt A method for integrating MODIS and Landsat data for systematic monitoring of forest cover and change in the Congo Basin Rem Sens Environ 112 2495-2513 (2008) [doi101016jrse200711012]
[9] C Huang K Song S Kim J R G Townshend P Davis J G Masek and S N Goward Use of a dark object concept and support vector machines to automate forest cover change analysis Rem Sens Environ 112 970-985 (2008) [doi101016jrse200707023]
[10] R E Kennedy W B Cohen and T A Schroeder Trajectory-based change detection for automated characterization of forest disturbance dynamics Rem Sens Environ 110 370-386 (2007) [doi101016jrse200703010]
[11] G P Asner E N Broadbent P J C Oliveira M Keller D E Knapp and J N M Silva Condition and fate of logged forests in the Brazilian Amazon Proc Nat Acad Sci USA 103 12947-12950 (2006) [doi101073pnas0604093103]
[12] R B Myneni and G Asrar Radiative transfer in three-dimensional atmosphere-vegetation media J Quant Spectrosc Rad Transfer 49 585-598 (1993) [doi1010160022-4073(93)90003-Z]
[13] J Ross The Radiation Regime and Architecture of Plant Stands The Hague Netherlands (1981)
[14] K L Castro-Esau G A Sanchez-Azofeifa and T Caelli Discrimination of lianas and trees with leaf-level hyperspectral data Rem Sens Environ 90 353-372 (2004) [doi101016jrse200401013]
[15] M L Clark D A Roberts and D B Clark Hyperspectral discrimination of tropical rain forest tree species at leaf to crown scales Rem Sens Environ 96 375-398 (2005) [doi101016jrse200503009]
[16] N Eguchi and M Shiotani Intraseasonal variations of water vapor and cirrus clouds in the tropical upper troposphere J Geophys Res 109 D12106 (2004) [doi1010292003JD004314]
[17] Y J Kaufman P V Hobbs V W J H Kirchhoff P Artaxo L A Remer B N Holben M D King D E Ward E M Prins K M Longo L F Mattos C A Nobre J D Spinhirne Q Ji A M Thompson J F Gleason S A Christopher and S C Tsay Smoke Clouds and Radiation - Brazil (SCAR-B) experiment J Geophys Res 103 31783-31808 (1998) [doi10102998JD02281]
[18] J Southworth An assessment of Landsat TM band 6 thermal data for analysing land cover in tropical dry forest regions Intl J Rem Sens 25 689-706 (2004) [doi1010800143116031000139917]
[19] G P Asner Cloud cover in Landsat observations of the Brazilian Amazon Intl J Rem Sens 22 3855-3862 (2001) [doi10108001431160010006926]
[20] G P Asner D E Knapp E N Broadbent P J C Oliveira M Keller and J N M Silva Selective logging in the Brazilian Amazon Science 310 480-482 (2005) [doi101126science1118051]
[21] P J C Oliveira G P Asner D E Knapp A Almeyda R Galvan-Gildemeister S Keene R Raybin and R C Smith Land-use allocation protects the Peruvian Amazon Science 317 1233-1236 (2007) [doi101126science1146324]
[22] E F Vermote D Tanre J L Deuze M Herman and J-J Morcrette Second simulation of the satellite signal in the solar spectrum 6S An overview IEEE Trans Geosci Rem Sens 35 675-686 (1997) [doi10110936581987]
Journal of Applied Remote Sensing Vol 3 033543 (2009) Page 22
[23] M J Carlotto Reducing the effects of space-varying wavelength-dependent scattering in multispectral imagery Intl J Rem Sens 20 3333-3344 (1999) [doi101080014311699211363]
[24] D A Roberts M O Smith and J B Adams Green vegetation nonphotosynthetic vegetation and soils in AVIRIS data Rem Sens Environ 44 255-269 (1993) [doi1010160034-4257(93)90020-X]
[25] R F Kokaly G P Asner S V Ollinger M E Martin and C A Wessman Characterizing canopy biochemistry from imaging spectroscopy and its application to ecosystem studies Rem Sens Environ 113 S78-S91 (2009) [doi101016jrse200810018]
[26] G P Asner Biophysical remote sensing signatures of arid and semi-arid regions in Remote Sensing for Natural Resources Management and Environmental Monitoring S L Ustin Ed pp 53-109 Wiley amp Sons New York (2004)
[27] G P Asner and D B Lobell A biogeophysical approach for automated SWIR unmixing of soils and vegetation Rem Sens Environ 74 99-112 (2000) [doi101016S0034-4257(00)00126-7]
[28] G P Asner and K B Heidebrecht Spectral unmixing of vegetation soil and dry carbon cover in arid regions comparing multispectral and hyperspectral observations Intl J Rem Sens 23 3939-3958 (2002) [doi10108001431160110115960]
[29] G P Asner M Keller R Pereira J C Zweede and J N M Silva Canopy damage and recovery after selective logging in Amazonia Field and satellite studies Ecol App 14 S280-S298 (2004) [doi10189001-6019]
[30] G P Asner Biophysical and biochemical sources of variability in canopy reflectance Rem Sens Environ 64 134-153 (1998) [doi101016S0034-4257(98)00014-5]
[31] S G Ungar J S Pearlman J A Mendenhall and D Reuter Overview of the Earth Observing One (EO-1) mission IEEE Trans Geosci Rem Sens 41 1149-1160 (2003) [doi101109TGRS2003815999]
[32] R S Defries M C Hansen J R G Townshend A C Janetos and T R Loveland A new global 1-km dataset of percentage tree cover derived from remote sensing Global Change Biol 6 247-254 (2000) [doi101046j1365-2486200000296x]
[33] C C Borel and S A W Gerstl Nonlinear spectral mixing models for vegetative and soil surfaces Rem Sens Environ 47 403-416 (1994) [doi1010160034-4257(94)90107-4]
[34] D Nepstad G Carvalho A C Barros A Alencar J P Capobianco J Bishop P Moutinho P Lefebvre U L Silva and E Prins Road paving fire regime feedbacks and the future of Amazon forests For Ecol Manage 154 395-407 (2001) [doi101016S0378-1127(01)00511-4]
[35] R Pereira J Zweede G P Asner and M Keller Forest canopy damage and recovery in reduced-impact and conventional selective logging in eastern Para Brazil For Ecol Manage 168 77-89 (2002) [doi101016S0378-1127(01)00732-0]
[36] M Keller M Palace G P Asner R Pereira and J N M Silva Coarse woody debris in undisturbed and logged forests in the eastern Brazilian Amazon Global Change Biol 10 784-795 (2004) [doi101111j1529-8817200300770x]
[37] F Achard H D Eva H J Stibig P Mayaux J Gallego T Richards and J P Malingreau Determination of deforestation rates of the worlds humid tropical forests Science 297 999-1002 (2002) [doi101126science1070656]
[38] G P Asner M Keller and J N M Silva Spatial and temporal dynamics of forest canopy gaps following selective logging in the eastern Amazon Global Change Biol 10 765-783 (2004) [doi101111j1529-8817200300756x]
Journal of Applied Remote Sensing Vol 3 033543 (2009) Page 23
[39] M Keller G P Asner N Silva and M Palace Sustainability of selective logging of upland forests in the Brazilian Amazon carbon budgets and remote sensing as tools for evaluating logging effects in Working forests in the Neotropics Conservation through Sustainable Management D J Zarin J R R Alavalapati F E Putz and M Schmink Eds pp 41-63 Columbia University Press New York (2004)
[40] M Huang G P Asner M Keller and J A Berry An ecosystem model for tropical forest disturbance and selective logging J Geophys Res 113 (2008) [doi1010292007JG000438]
[41] M A Cochrane A Alencar M D Schulze C M Souza D C Nepstad P Lefebvre and E A Davidson Positive feedbacks in the fire dynamic of closed canopy tropical forests Science 284 1832-1835 (1999) [doi101126science28454211832]
[42] C Souza D A Roberts and M A Cochrane Combining spectral and spatial information to map canopy damages from selective logging and forest fires Rem Sens Environ 98 329-343 (2005) [doi101016jrse200507013]
[43] G P Asner M M C Bustamante and A R Townsend Scale dependence of biophysical structure in deforested areas bordering the Tapajos National Forest Central Amazon Rem Sens Environ 87 507-520 (2003) [doi101016jrse200303001]
[44] E N Broadbent D J Zarin G P Asner M Pena-Claros A Cooper and R Littell Forest structure and spectral properties after selective logging in Bolivia Ecol App 16 1148-1163 (2006) [doi1018901051-0761(2006)016[1148ROFSAS] 20CO2]
[45] A N Gillison G P Asner E C Fernandes J E Richey D L da Sousa E Cruz J Mafalacusser A Banze S Izidine A R da Fonseca H Pacate H Greenberg L McGeoch and N Voisin Valuing biodiversity in changing environments new approaches to integrated baseline surveys Global Change Biol in press
[46] C Huang G P Asner R E Martin N N Barger and J C Neff Multiscale analysis of tree cover and aboveground carbon stocks in pinyon-juniper woodlands Ecol App19 668-681 (2009) [doi10189007-21031]
Journal of Applied Remote Sensing Vol 3 033543 (2009) Page 24
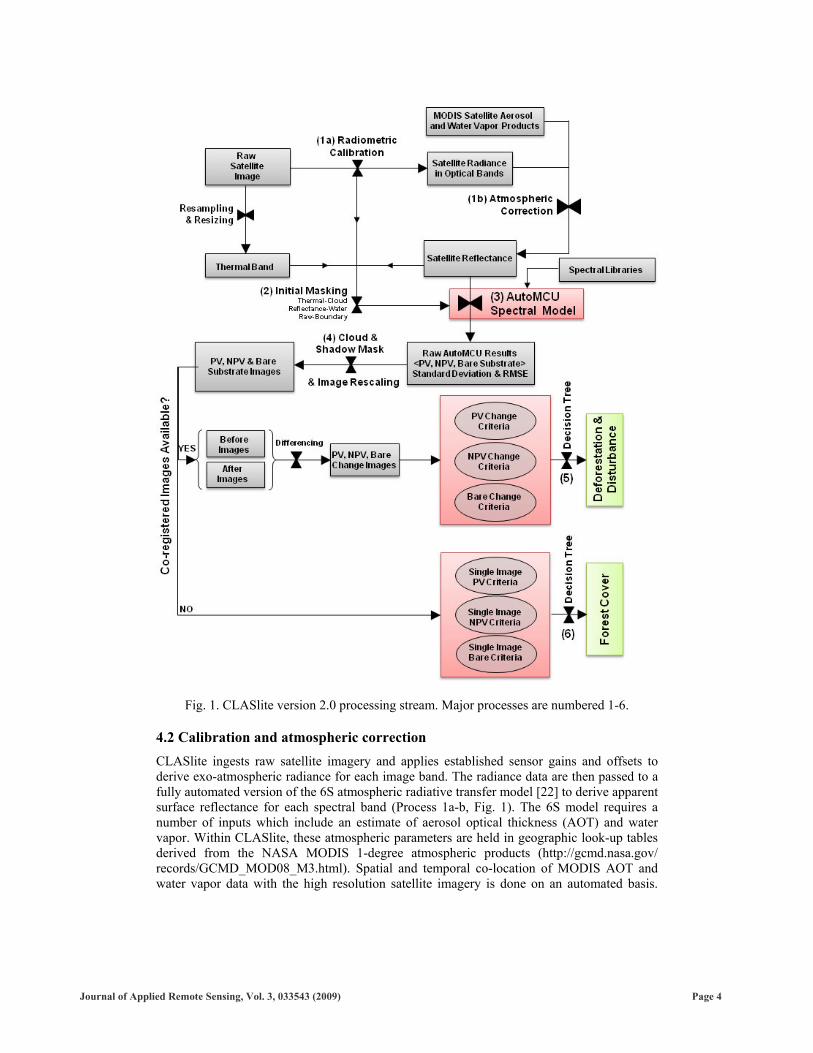
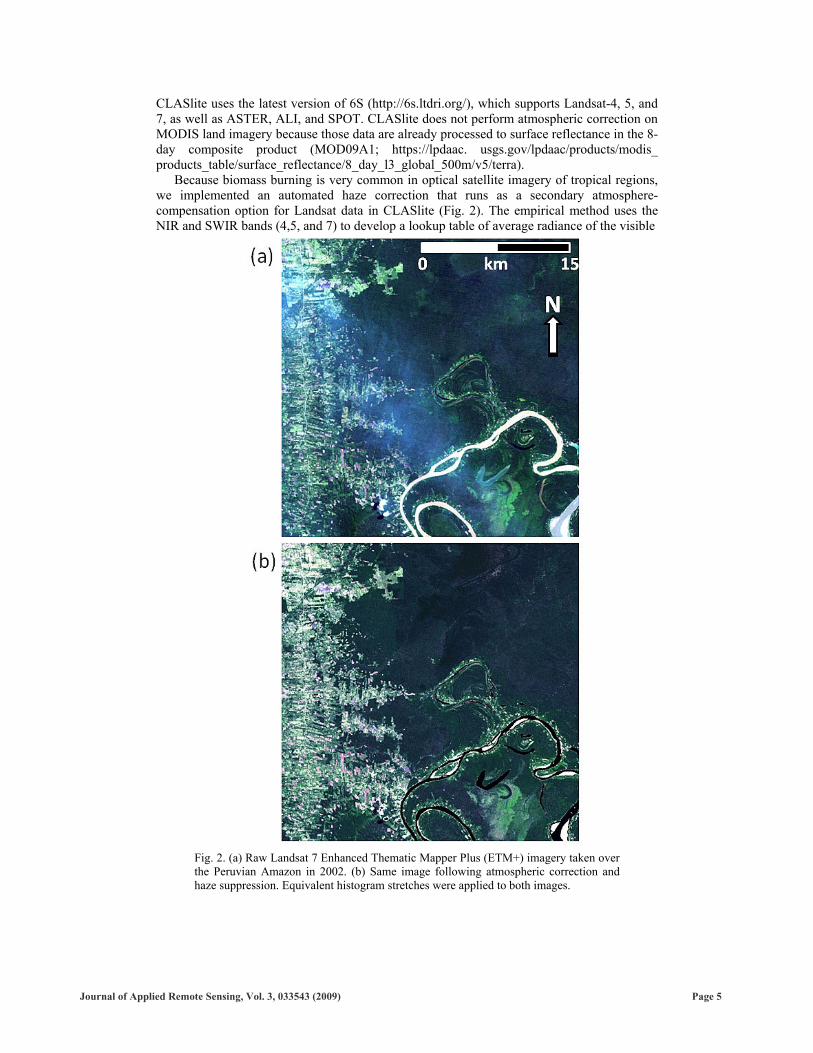
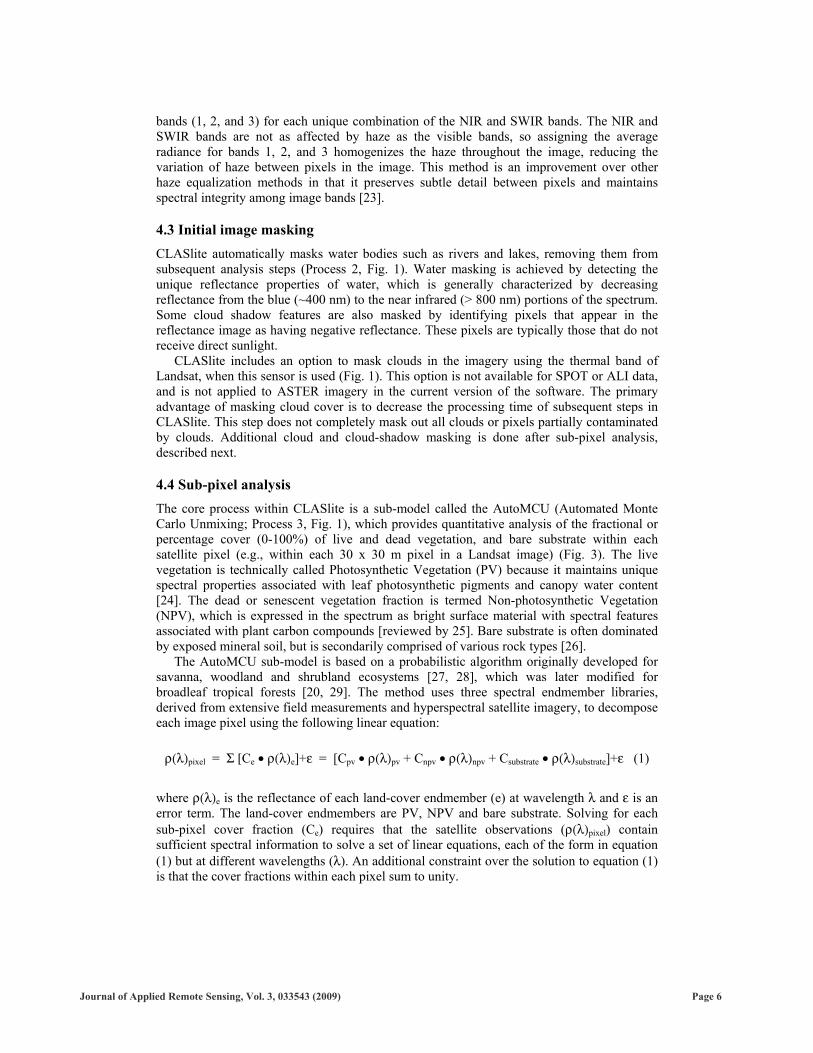
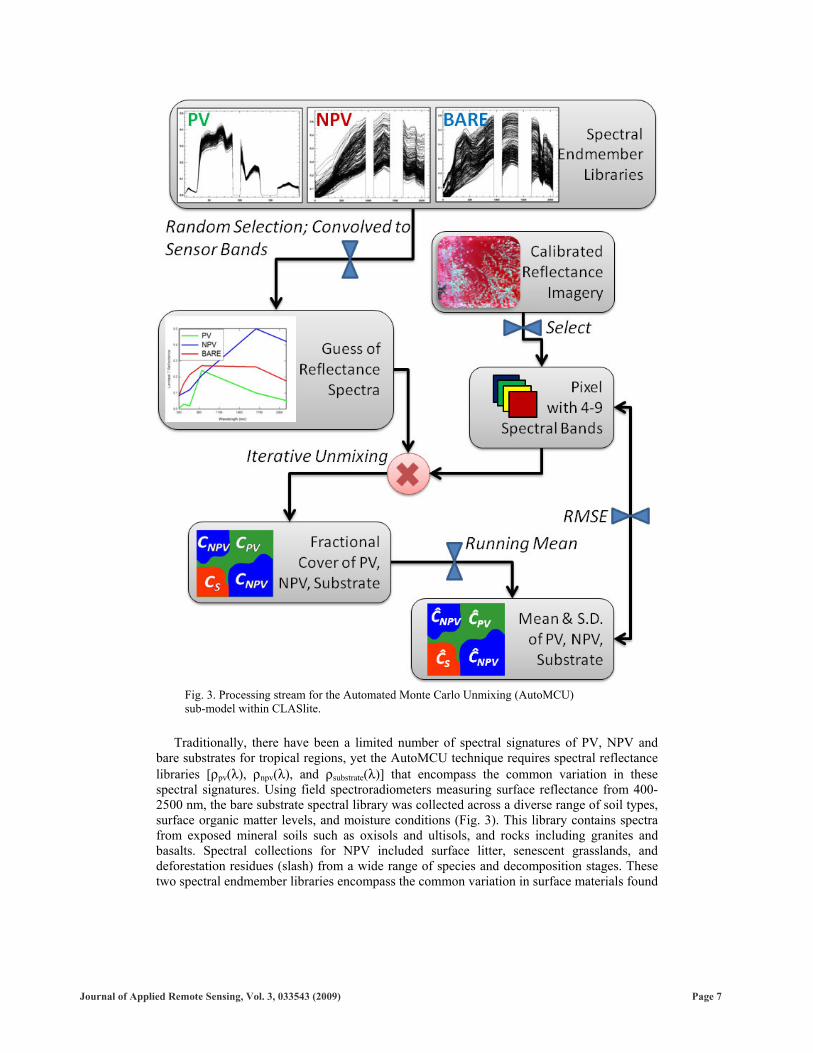
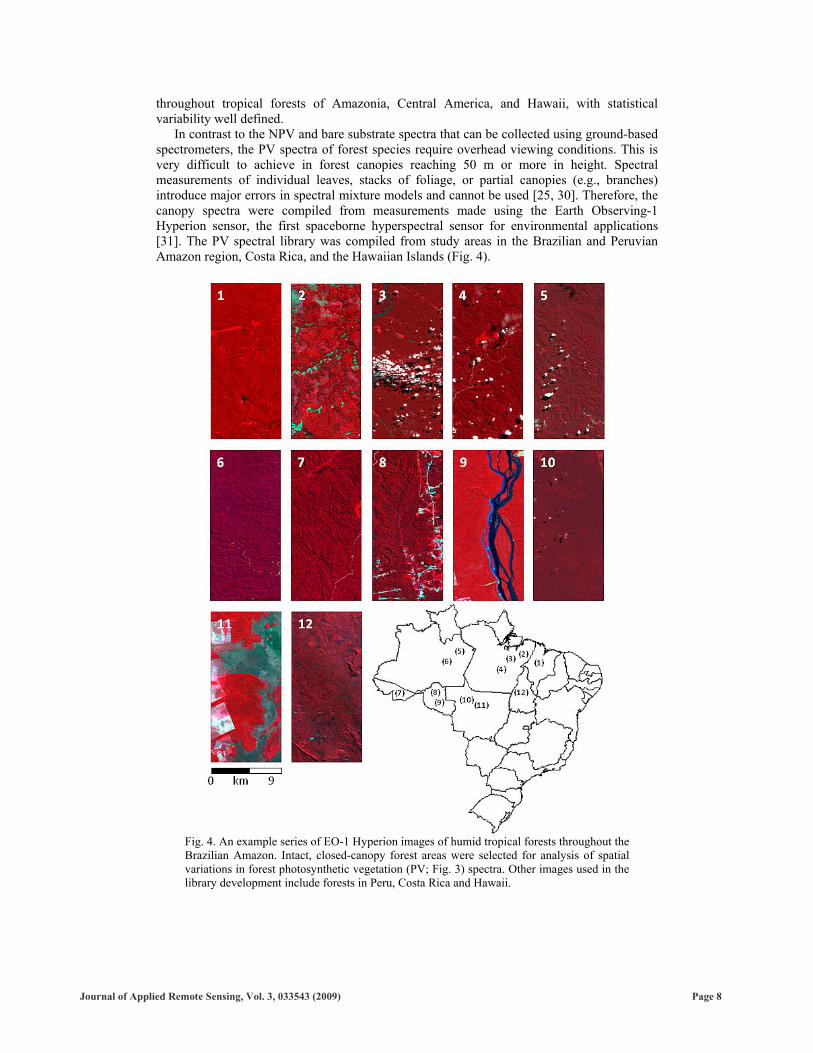
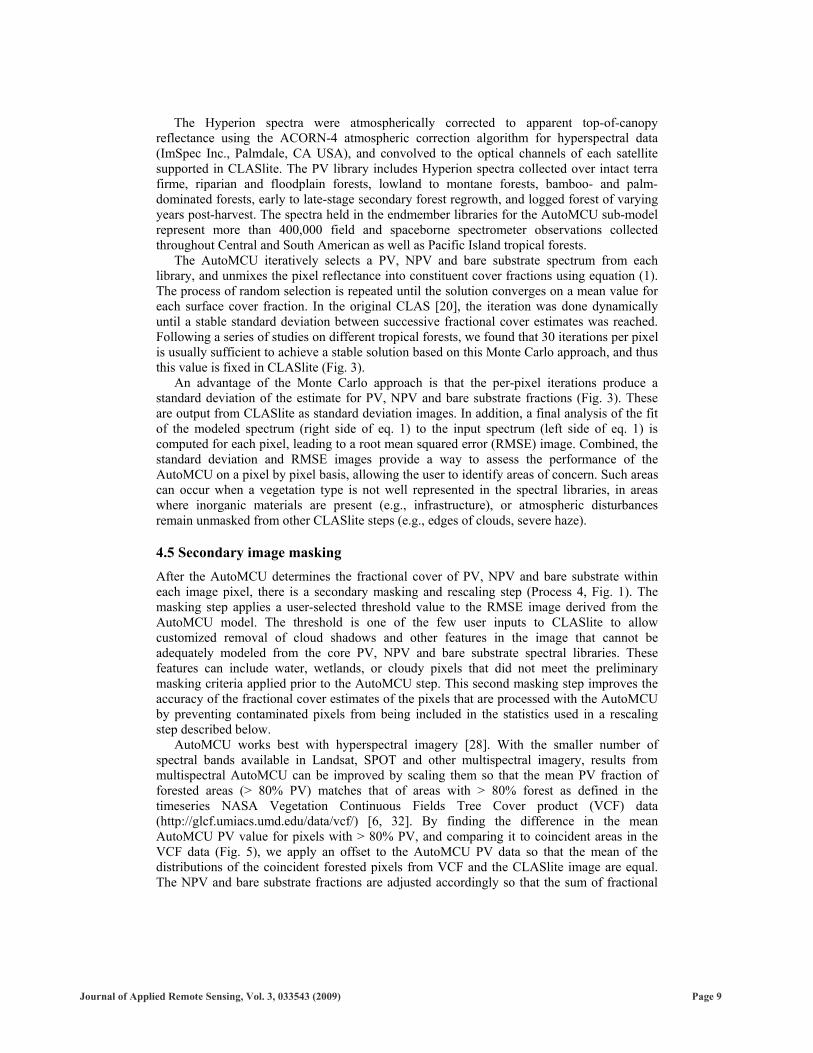
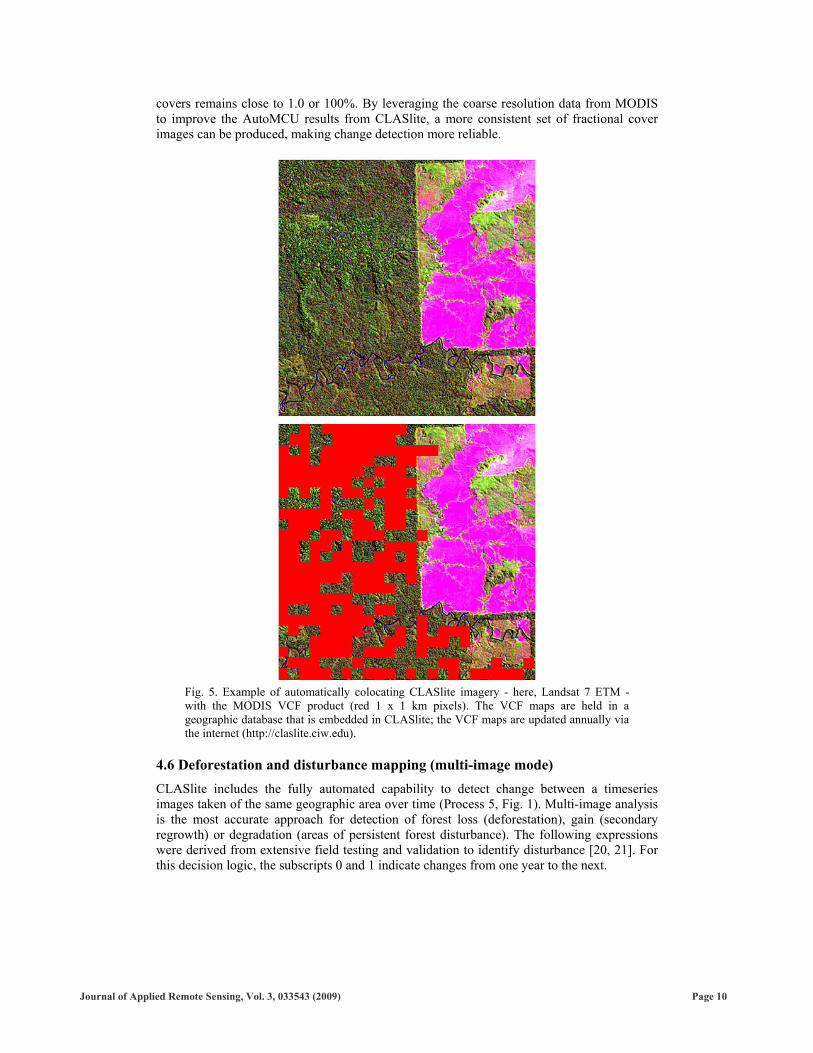
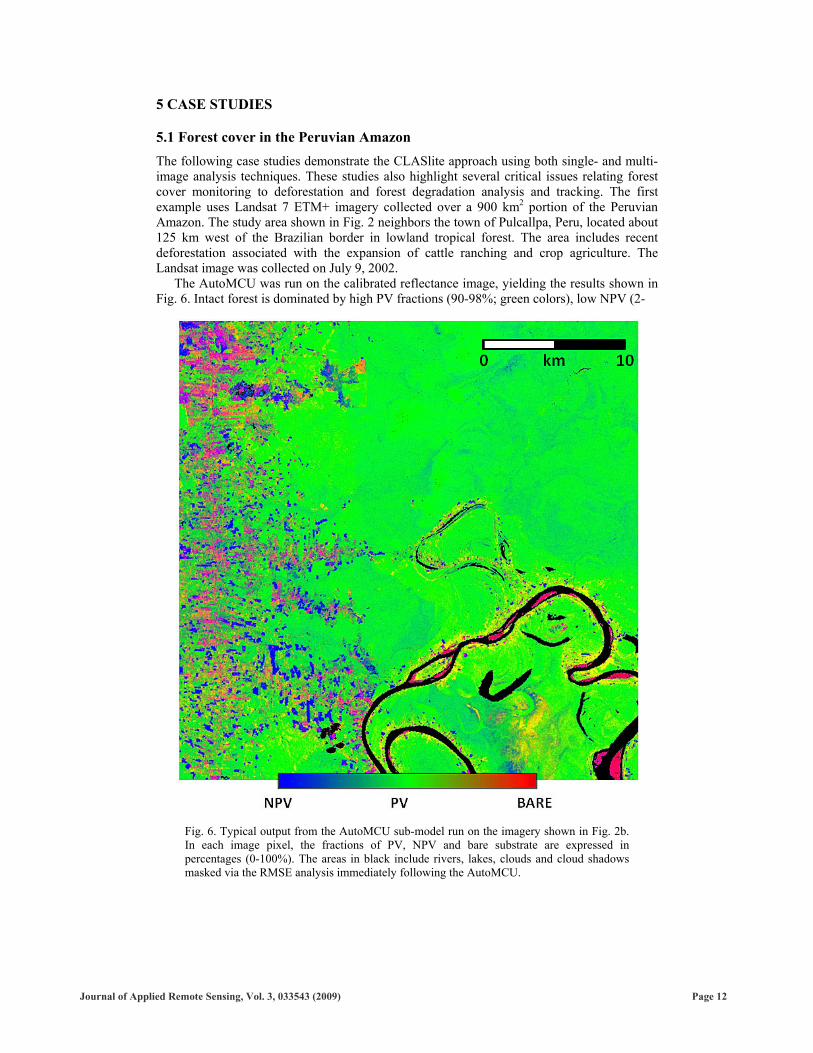
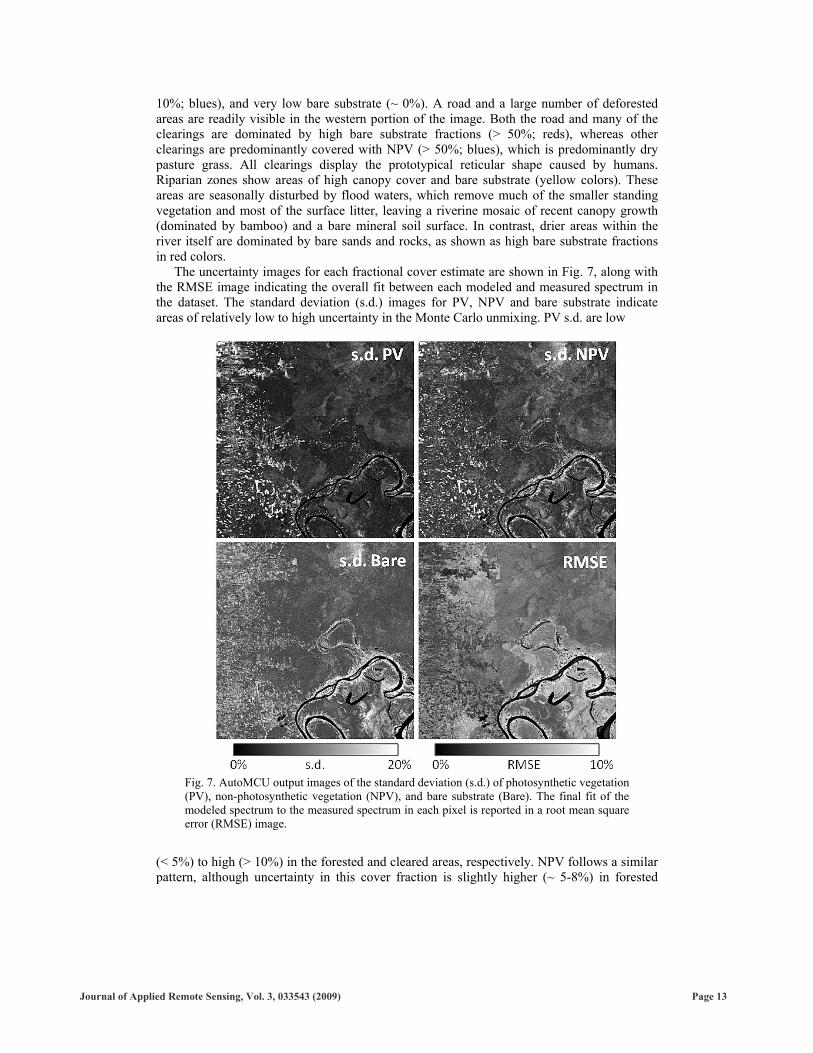
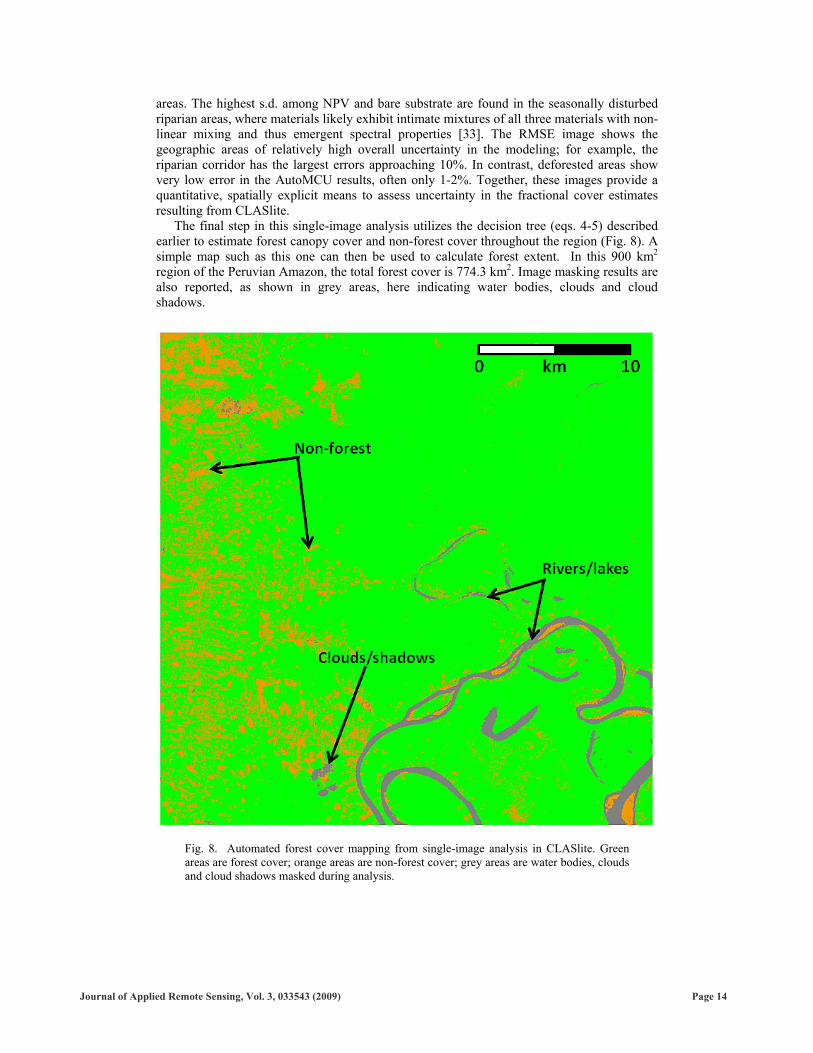
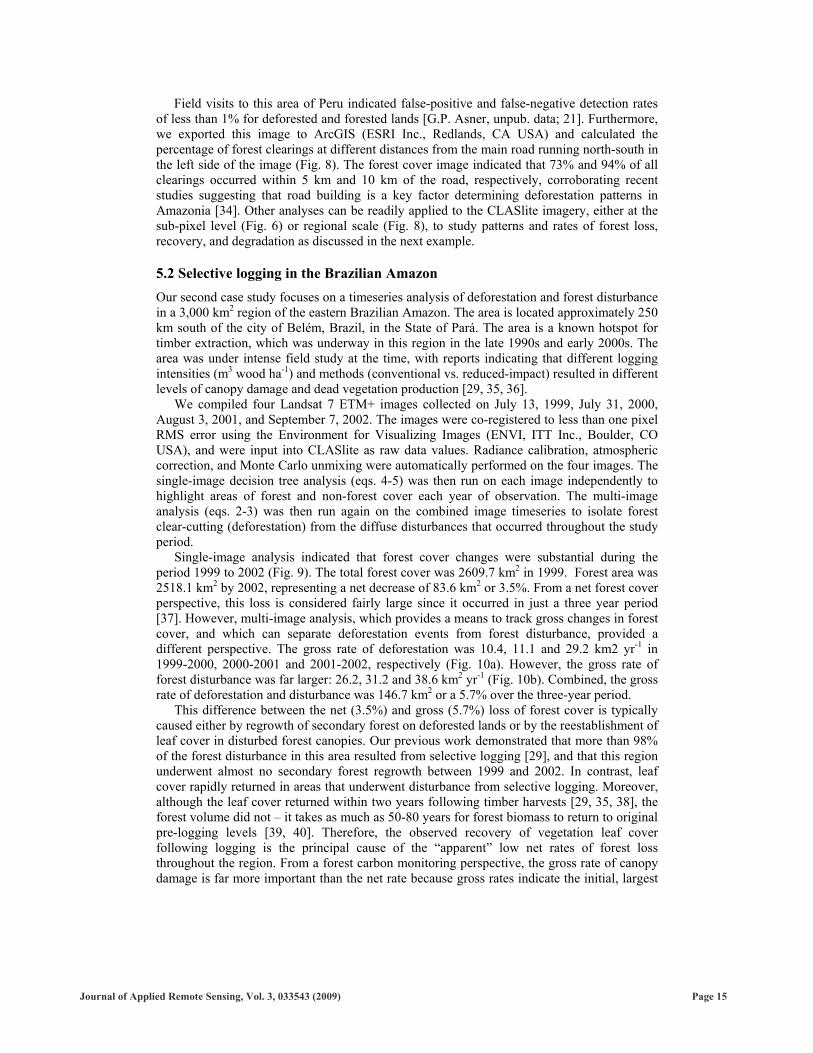
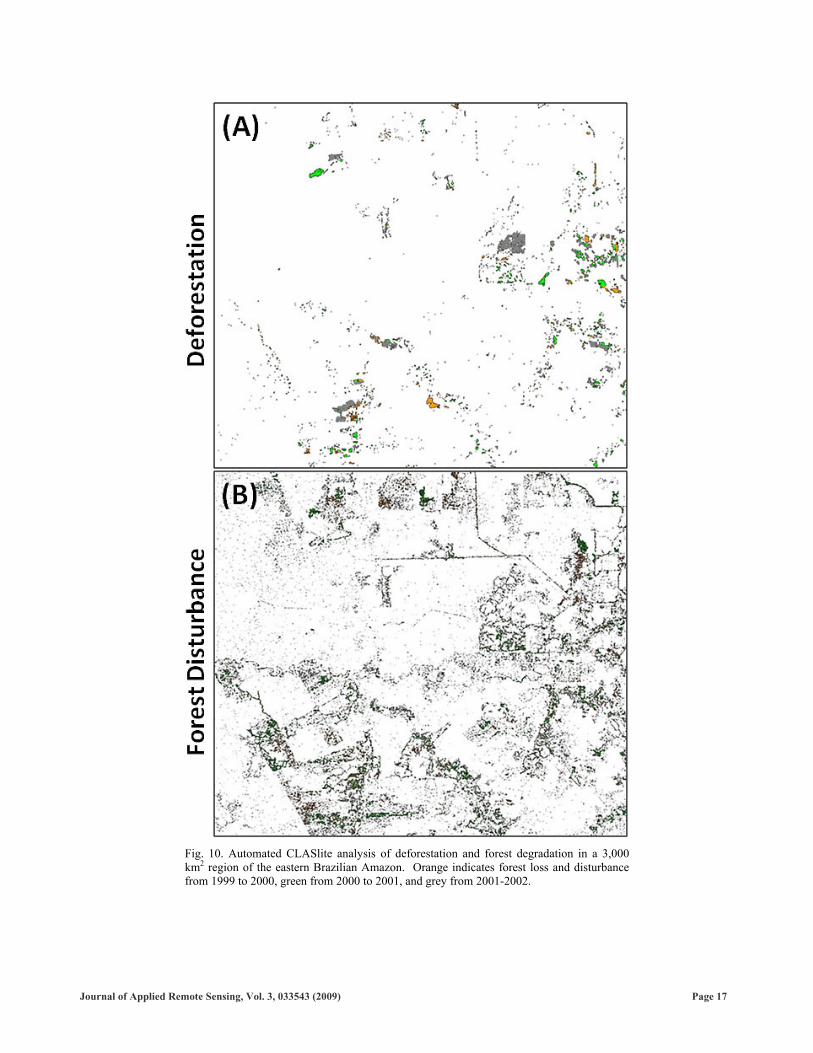
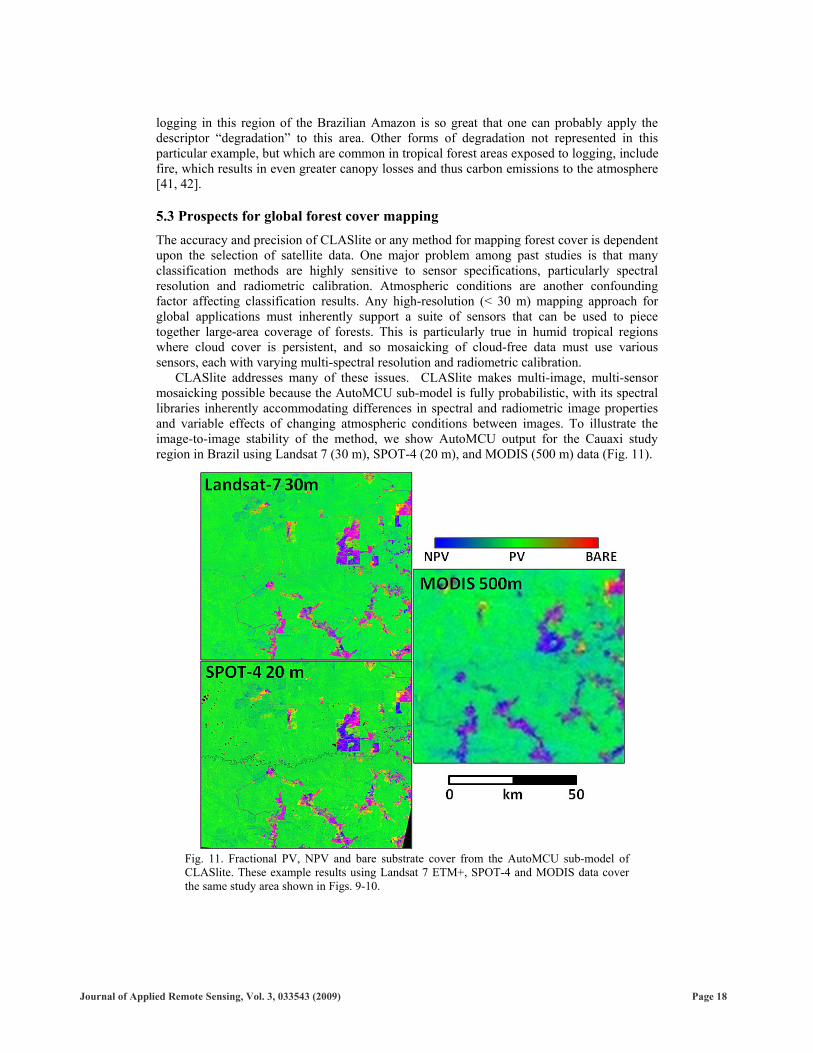
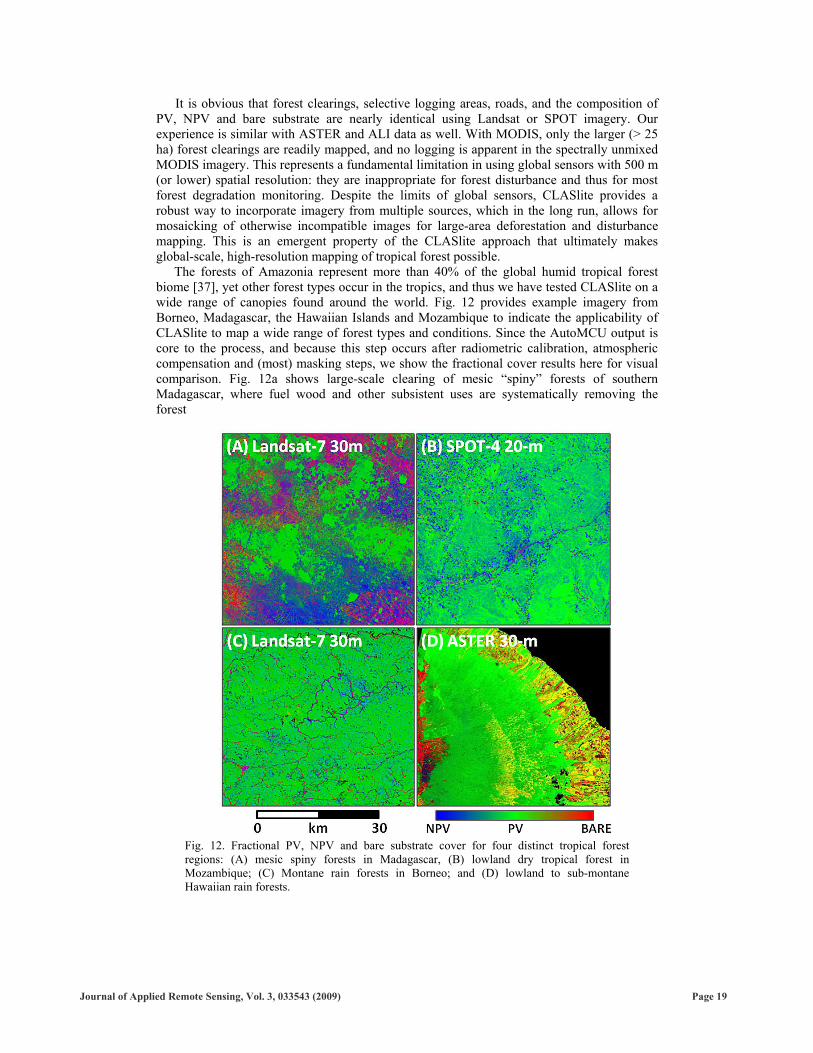
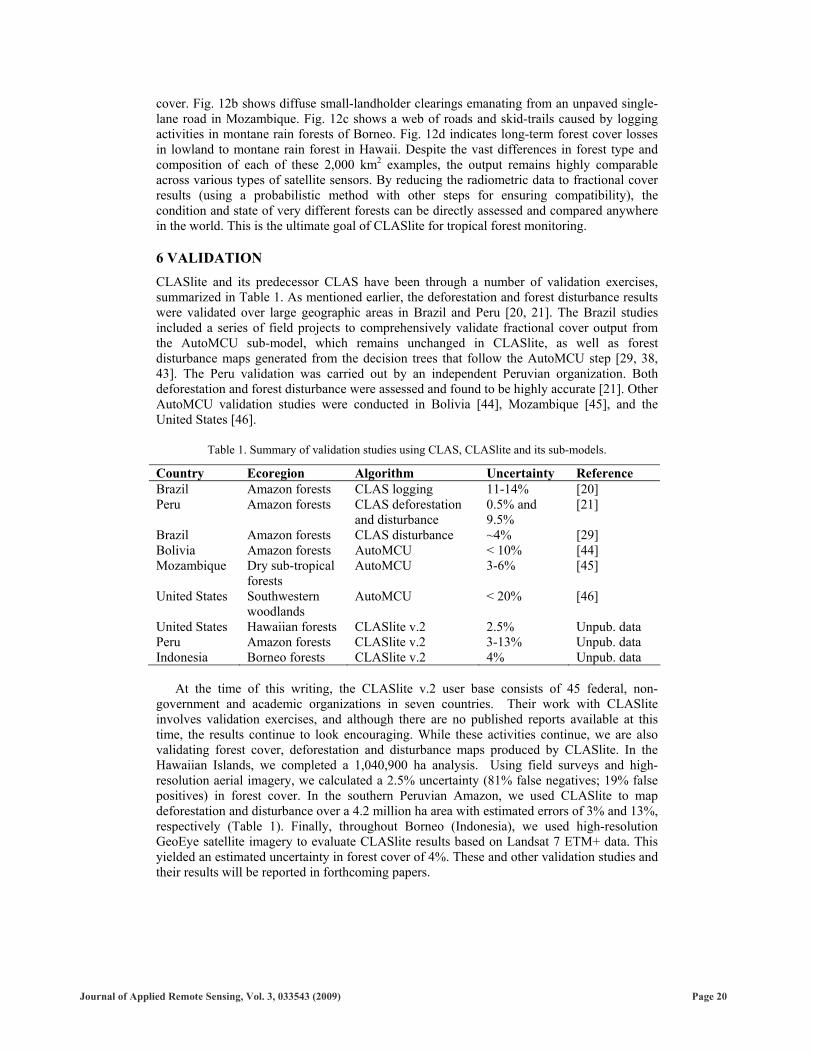
Related Documents