Volume 57, Number 12, 2003 APPLIED SPECTROSCOPY 1461 0003-7028 / 03 / 5712-1461$2.00 / 0 q 2003 Society for Applied Spectroscopy Automated Line-Focused Laser Ablation for Mapping of Inclusions in Stainless Steel M. P. MATEO, L. M. CABALI ´ N, AND J. J. LASERNA * Department of Analytical Chemistry, Faculty of Sciences, University of Ma ´laga, E-29071 Ma ´laga, Spain An automated line imaging arrangement for two-dimensional (2D) and three-dimensional (3D) generation of chemical maps of inclu- sions in stainless steel by laser-induced plasma spectrometry (LIPS) is presented. The plasma was generated in air at atmospheric pres- sure by focusing a at-top Nd:YAG laser beam operating at 532 nm to a microline on the sample surface. The emitted light from the microline plasma was projected through an imaging spectro- graph onto a charge-coupled device (CCD) detector to generate a spatially and spectrally resolved data set. Compositional distribu- tion maps of inclusion constituents (Mn, Mg, Ca, Al, and Ti) in stainless steel of different grades have been generated. Comparative studies with the point-to-point LIPS mapping method have been performed, resulting in a 51-fold reduction in the number of pulses and analysis time when the microline imaging approach is em- ployed. The results illustrate the capability of microline imaging LIPS for fast-automated acquisition of tomographic maps with spa- tial resolution of 50 mm between adjacent craters and 4.8 mm along the microline. Index Headings: Laser-induced plasma spectrometry; Microline LIPS; Materials characterization; Mapping. INTRODUCTION The technological progress of several sectors in indus- try has impelled steel producers to improve process con- trol and implement better quality assurance, with a spe- cial emphasis on steel cleanliness. In particular, the char- acterization of impurities and inclusions in nal products and process steel samples has now become a top priority in modern steelmaking due to the crucial in uence of their composition and abundance on nal product prop- erties. For this reason, the steel industry is demanding fast analytical techniques that provide spatially resolved chemical information to characterize inclusionary mate- rial in terms of number, size, distribution, and composi- tion, while minimizing analysis time. Some classical techniques using electrons and ions are usually employed for the acquisition of chemical images from steel sam- ples, that is, the spatial distribution of single chemical species. However, some of these techniques require long analysis time and have limited applicability for steel cleanliness assessment of large sample areas. Laser-induced plasma spectrometry (LIPS) is being employed in the industry eld as a powerful tool that provides solutions to a great number of analytical prob- lems in the manufacture of stainless steel. These appli- cations include bulk 1–5 and quantitative analysis, 6–8 anal- ysis of liquid 9,10 and high-temperature steel, 11 surface to- pography studies, 12,13 depth pro ling of coated steel, 14–18 automation, 19,20 and routine industrial applications for Received 21 March 2003; accepted 22 July 2003. * Author to whom correspondence should be sent. E-mail address: [email protected]. quality assessment 21 and remote analysis. 11,22–25 Part of this success is due to both the relative simplicity of the technique with no-vacuum requirements that opens up on-site industrial quality analysis possibilities and to the inherent spatial location attribute of laser ablation that makes it possible to obtain spatially resolved chemical information about the sample. In this sense, through sev- eral advances in technique and instrumentation, LIPS has developed to the point where it is possible to generate chemical images or depth pro les without major restric- tions in sample characteristics and operating conditions. However, strong efforts still need to be made to upgrade LIPS in order to improve depth resolution, spatial reso- lution, detection power, analysis time, and precision in material analysis. An alternative to the current LIPS point-to-point meth- od has been devoted to this purpose that consists of fo- cusing the laser beam to a microline instead of a point. The use of a charge-coupled device (CCD) detector in conjunction with an imaging spectrograph opens up the possibility of this microline LIPS for imaging or pro ling studies on a realistic time scale. The fundamental require- ment for such work is an instrument capable of focusing and collecting the laser-induced emission signal from a microline illumination on the sample. This approach al- lows LIPS spectra from the length of the focused micro- line to be recovered simultaneously. This imaging system has been reported in detail for the analysis of photovol- taic cell and printed circuit board samples. 26,27 The main advantage of line-focused LIPS over single-point LIP spectrometry is the reduction of laser pulse number nec- essary for generating LIPS chemical maps and conse- quently, the improvement of speed of data collection. On the other hand, as the laser power is distributed over a much larger area, ablation rate is reduced and air break- down is avoided. The present paper reports a fast and automated LIPS method for two-dimensional (2D) and three-dimensional (3D) characterization of inclusionary material in stainless steel of different grades. A range of inclusion types that are common in manufactured stainless steel have been investigated, and chemical maps of manganese, magne- sium, calcium, aluminum, and titanium are presented. EXPERIMENTAL Instrumentation. Main speci cations of the instru- mental setup have been previously reported. 27,28 The beam from a Q-Switched Nd : YAG laser (Spectron, mod- el SL 284, pulse width 5 ns, beam diameter 4 mm) op- erating at the second harmonic wavelength of 532 nm at a pulse energy of 33 mJ was 3-fold expanded by an op- tical system consisting of two lenses, a 25-mm-focal-

Welcome message from author
This document is posted to help you gain knowledge. Please leave a comment to let me know what you think about it! Share it to your friends and learn new things together.
Transcript

Volume 57 Number 12 2003 APPLIED SPECTROSCOPY 14610003-7028 03 5712-1461$200 0q 2003 Society for Applied Spectroscopy
Automated Line-Focused Laser Ablation for Mapping ofInclusions in Stainless Steel
M P MATEO L M CABALIN AND J J LASERNADepartment of Analytical Chemistry Faculty of Sciences University of Malaga E-29071 Malaga Spain
An automated line imaging arrangement for two-dimensional (2D)and three-dimensional (3D) generation of chemical maps of inclu-sions in stainless steel by laser-induced plasma spectrometry (LIPS)is presented The plasma was generated in air at atmospheric pres-sure by focusing a at-top Nd YAG laser beam operating at 532nm to a microline on the sample surface The emitted light fromthe microline plasma was projected through an imaging spectro-graph onto a charge-coupled device (CCD) detector to generate aspatially and spectrally resolved data set Compositional distribu-tion maps of inclusion constituents (Mn Mg Ca Al and Ti) instainless steel of different grades have been generated Comparativestudies with the point-to-point LIPS mapping method have beenperformed resulting in a 51-fold reduction in the number of pulsesand analysis time when the microline imaging approach is em-ployed The results illustrate the capability of microline imagingLIPS for fast-automated acquisition of tomographic maps with spa-tial resolution of 50 mm between adjacent craters and 48 mm alongthe microline
Index Headings Laser-induced plasma spectrometry MicrolineLIPS Materials characterization Mapping
INTRODUCTION
The technological progress of several sectors in indus-try has impelled steel producers to improve process con-trol and implement better quality assurance with a spe-cial emphasis on steel cleanliness In particular the char-acterization of impurities and inclusions in nal productsand process steel samples has now become a top priorityin modern steelmaking due to the crucial in uence oftheir composition and abundance on nal product prop-erties For this reason the steel industry is demandingfast analytical techniques that provide spatially resolvedchemical information to characterize inclusionary mate-rial in terms of number size distribution and composi-tion while minimizing analysis time Some classicaltechniques using electrons and ions are usually employedfor the acquisition of chemical images from steel sam-ples that is the spatial distribution of single chemicalspecies However some of these techniques require longanalysis time and have limited applicability for steelcleanliness assessment of large sample areas
Laser-induced plasma spectrometry (LIPS) is beingemployed in the industry eld as a powerful tool thatprovides solutions to a great number of analytical prob-lems in the manufacture of stainless steel These appli-cations include bulk1ndash5 and quantitative analysis6ndash8 anal-ysis of liquid 910 and high-temperature steel11 surface to-pography studies1213 depth pro ling of coated steel14ndash18
automation1920 and routine industrial applications for
Received 21 March 2003 accepted 22 July 2003 Author to whom correspondence should be sent E-mail address
lasernaumaes
quality assessment21 and remote analysis1122ndash25 Part ofthis success is due to both the relative simplicity of thetechnique with no-vacuum requirements that opens upon-site industrial quality analysis possibilities and to theinherent spatial location attribute of laser ablation thatmakes it possible to obtain spatially resolved chemicalinformation about the sample In this sense through sev-eral advances in technique and instrumentation LIPS hasdeveloped to the point where it is possible to generatechemical images or depth pro les without major restric-tions in sample characteristics and operating conditionsHowever strong efforts still need to be made to upgradeLIPS in order to improve depth resolution spatial reso-lution detection power analysis time and precision inmaterial analysis
An alternative to the current LIPS point-to-point meth-od has been devoted to this purpose that consists of fo-cusing the laser beam to a microline instead of a pointThe use of a charge-coupled device (CCD) detector inconjunction with an imaging spectrograph opens up thepossibility of this microline LIPS for imaging or pro lingstudies on a realistic time scale The fundamental require-ment for such work is an instrument capable of focusingand collecting the laser-induced emission signal from amicroline illumination on the sample This approach al-lows LIPS spectra from the length of the focused micro-line to be recovered simultaneously This imaging systemhas been reported in detail for the analysis of photovol-taic cell and printed circuit board samples2627 The mainadvantage of line-focused LIPS over single-point LIPspectrometry is the reduction of laser pulse number nec-essary for generating LIPS chemical maps and conse-quently the improvement of speed of data collection Onthe other hand as the laser power is distributed over amuch larger area ablation rate is reduced and air break-down is avoided
The present paper reports a fast and automated LIPSmethod for two-dimensional (2D) and three-dimensional(3D) characterization of inclusionary material in stainlesssteel of different grades A range of inclusion types thatare common in manufactured stainless steel have beeninvestigated and chemical maps of manganese magne-sium calcium aluminum and titanium are presented
EXPERIMENTAL
Instrumentation Main speci cations of the instru-mental setup have been previously reported2728 Thebeam from a Q-Switched Nd YAG laser (Spectron mod-el SL 284 pulse width 5 ns beam diameter 4 mm) op-erating at the second harmonic wavelength of 532 nm ata pulse energy of 33 mJ was 3-fold expanded by an op-tical system consisting of two lenses a 25-mm-focal-
1462 Volume 57 Number 12 2003
FIG 1 Photograph of (A) MnS inclusions in AISI 303 stainless steel and (B) TiN inclusions in AISI 321 stainless steel obtained by opticalmicroscopy
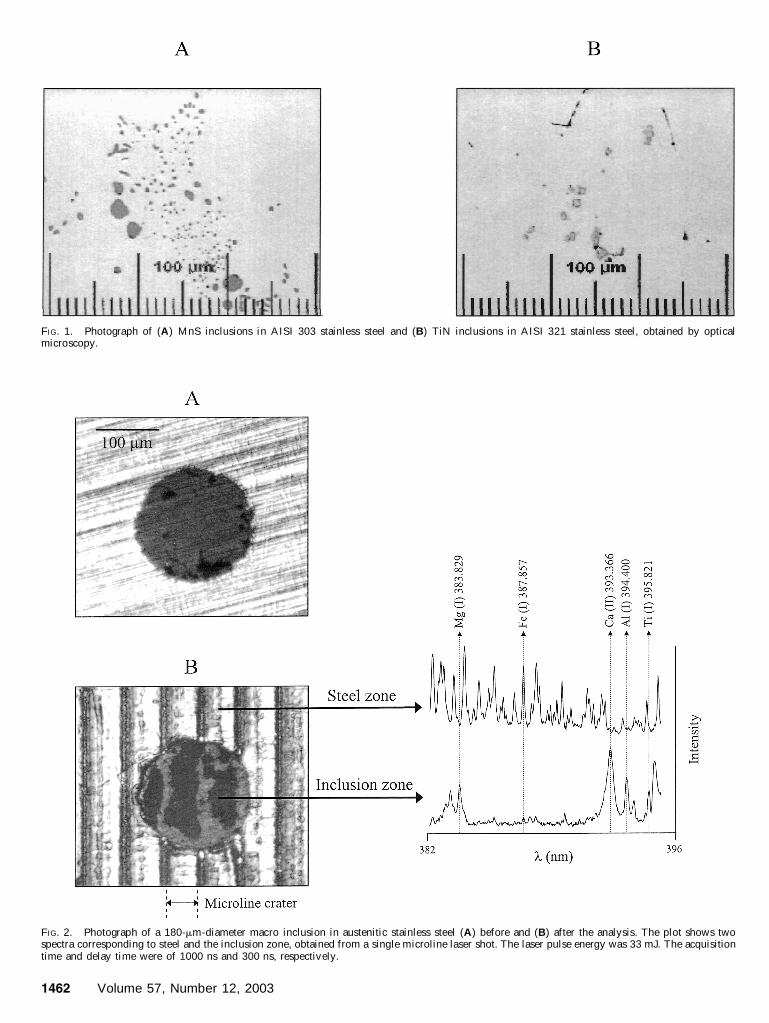
FIG 2 Photograph of a 180-mm-diameter macro inclusion in austenitic stainless steel (A) before and (B) after the analysis The plot shows twospectra corresponding to steel and the inclusion zone obtained from a single microline laser shot The laser pulse energy was 33 mJ The acquisitiontime and delay time were of 1000 ns and 300 ns respectively
APPLIED SPECTROSCOPY 1463
FIG 3 Microline LIPS images corresponding to the spatial distribution of Mg Fe Ca Al and Ti in the inclusion shown in Fig 2 Intensities ofthe Mg(I) 383829 nm Fe(I) 387857 nm Ca(II) 393366 nm Al(I) 394400 nm and Ti(I) 395821 nm lines are shown with a gray scale in arbitraryunits Other experimental conditions are as in Fig 2
FIG 4 Mn mapping of an AISI 303 stainless steel sample with mi-croline imaging LIPS Plotted data correspond to the intensity distri-bution of the Mn(I) 482352 nm emission line The mapped area was2400 3 2500 mm 2 Other experimental conditions are as in Fig 2
length concave lens and a 75-mm-focal-length convexlens Then the beam was focused to a line by a cylin-drical lens with a focal length of 50 mm onto the samplesurface Plasma emission generated in air at atmosphericpressure was collected with a planoconvex quartz lenswith a focal length of 100 mm onto the entrance slit ofa 05-m-focal-length CzernyndashTurner imaging spectro-graph (Chromex model 500 IS f 8 tted with indexablegratings of 300 1200 and 2400 grooves mm21) Thegrating of 2400 grooves mm21 with a reciprocal lineardispersion of 25 nm mm21 was used in this study Thespectrograph entrance slit was 10 mm high and 20 mmwide The axis along the microline plasma was parallelto the spectrograph entrance slit The plasma dispersedlight was spatially resolved by an intensi ed solid-state
two-dimensional charge-coupled device (ICCD StanfordComputer Optics model 4Quik 05) The CCD consistedof 768 3 512 elements each 78 3 87 mm The activearea was 6 3 44 mm 2 The dynamic range of the CCDdetector system is 1012 For data acquisition the ICCDsystem was triggered by an output TTL pulse from thelaser In order to observe the plasma at an early expansionstage and therefore reduce atom diffusion in the vaporphase timing conditions of 300 ns (delay time) and 1000ns (integration time) were established in this experimentOperation of the detector was controlled by a personalcomputer with 4Spec software The sample was placedon two crossed motorized stages (Physik Instrumente)The stages were computer controlled which allowed ex-act movement of the sample in both the x and y direc-tions The laser trigger was controlled externally by adigital delaypulse generator (Stanford Research SystemModel DG535) A laboratory-developed software al-lowed the exact synchronization between the motorizedstage movement and laser ring to perform automatedacquisition of chemical map data Communication be-tween devices was carried out by an IEEE 488 general-purpose interface bus (GPIB) Stored data were treatedby a lab-developed software that reduced the volume ofacquired data to an XY matrix for each depth level andelement of interest In order to generate chemical mapsthese matrices were plotted using a commercial imaginganalysis data software The area of the inclusions in per-cent regarding the total map area was calculated withcommercial image analysis software (Visilog 52)
Samples The following stainless steel grades havebeen studied AISI 304 AISI 303 and AISI 321 Suchsteel types consist of production process materials thathave been chosen in order to cover ve elements of in-terest that are part of the general chemical compositionof the inclusions manganese (sul de) aluminum (alu-minosilicates) titanium (nitride) calcium (aluminosili-cates and silicates) and magnesium (aluminosilicates andsilicates) To simultaneously monitor the emission linesof Mg Fe Ca Al and Ti the grating was centered at3883 nm while for the analysis of MnS inclusions aspectral window centered at 476 nm was used AISI 303and AISI 321 stainless steel samples were characterizedby scanning electron microscopy with a microanalysisEDS system and by optical microscopy The results dem-onstrate the presence of a single type of inclusion in thesesteels manganese sul de and titanium nitride respec-
1464 Volume 57 Number 12 2003
FIG 5 Comparison of LIPS maps of TiN inclusions in AISI 321 stainless steel generated with (A) the point-to-point approach and (B) themicroline approach Plotted data correspond to the intensity distribution of the Ti(I) 395821 nm emission line Other experimental conditions areas in Fig 2
tively due to the high sulfur content (03) and titanium(01) of these steel grades For this reason it has beenassumed that detection by LIPS of Mn or Ti in the sampleindicates the presence of MnS or TiN inclusions On theother hand it is necessary to consider the existence ofpores and trapped slag The appearance of these inclu-sions has been studied by optical microscopy The dis-tribution of MnS inclusions in AISI 303 steel is morehomogeneous and can be of two types globular or den-drite net Figure 1A shows some details of these types ofinclusions In contrast the size and distribution of TiNinclusions present in AISI 321 steel are shown in Fig1B They usually appear in groups in some zones of thesample
According to size the inclusions are usually classi edas micro and macro inclusions There are no exact limitsde ned for the different inclusion size since for differentsteel grades the de nition of macro inclusions variesHowever in some works the following de nition of in-clusion sizes is used micro inclusions (20 mm) semi-macro inclusions (20 and 100 mm) and macro inclu-sions (100 mm)
RESULTS AND DISCUSSION
Multielemental Mapping of a Single Inclusion inStainless Steel The performance of the automated mi-croline approach for compositional mapping was testedwith inclusions of large diameter in austenitic stainlesssteel Figure 2 shows the photograph of a 180 mm di-ameter macro inclusion before and after the analysis bythe microline LIPS approach Inclusion size was directly
measured by optical microscopy using a calibrated reti-cule In this gure two of the spectra obtained from theCCD microline image corresponding to a single lasershot in the inclusion zone are also shown These spectraexhibit information from different areas in the samplethat correspond to the location of the steel matrix and themacro inclusion as manifested in the differences in theemission spectra features Chemical maps of Mg Fe CaAl and Ti in an area 700 3 625 mm 2 that included themacro inclusion are shown in Fig 3 To emphasize thedifferences between intensity distributions in the pre-sented maps only the cited area has been shown al-though the total analyzed area was 1300 3 2500 mm 2These maps were obtained from 27 single laser shots witha lateral resolution of 50 mm between adjacent microlinecraters The total analysis time for generating the multiel-emental map including time intervals for decelerationand acceleration of the X stage was 30 s It should benoted that for this study the stage was moved and stoppedfor each X position The generation of this multielemen-tal chemical map involved combining net peak intensityinformation from the emission line chosen for each ele-ment (labeled in Fig 2) along the microlines obtainedfrom adjacent positions on the sample with its spatialcoordinates The spatial resolution along the microlinewas estimated as 48 mm This value was calculated fromthe analysis of inclusions of known size to account foroptical magni cation in collection pixel size and plasmaexpansion In the chemical images of Fig 3 differencesin elemental distribution are represented by gray gradingAs shown in the maps whereas Mg Ca and Al present
APPLIED SPECTROSCOPY 1465
FIG 7 Depth images for Ca and Al generated by applying 45 lasershots on the same position (x 5 1100 mm) It should be noted that theaxes are not to scale Maps were constructed from data in Fig 6
not
FIG 6 Tomographic microline LIPS images of (A) Ca(II) 393366 nmand (B) Al(I) 394400 nm in a 1450 3 2500 mm 2 area of AISI 304stainless steel corresponding to the 1 st 5th 10th 15th 20 th 25th 30th and35th laser shots performed in 30 adjacent positions Other experimentalconditions are as in Fig 2
only minor differences in intensity distribution inside theinclusion the differences are more acute with respect tothe Ti map which indicates that the chemical composi-tion of the inclusion under study was a mixture of tita-nium nitride and aluminosilicate of calcium and magne-sium The maps demonstrate that the LIPS images rep-resent quite accurately the dimensions and position of theanalyzed inclusion in the sample indicating a good cor-respondence between the calculated size from LIPS im-ages using a lateral resolution along the microline of 48mm and the real size of the inclusion measured by opticalmicroscopy
Mapping of MnS and TiN Inclusions in StainlessSteel In a second step AISI 303 and AISI 321 stainlesssteel samples presenting a predominant type of inclusionmanganese sul de and titanium nitride respectively wereanalyzed
In the case of the AISI 303 steel sample an area of2400 3 2500 mm 2 was analyzed by a sequence of 49
1466 Volume 57 Number 12 2003
FIG 8 Histogram of percentage area of inclusionary material in re-lation to the total mapped area for Ca and Al inclusions Data wereobtained from maps in Fig 6
FIG 9 3D map of Al inclusions in stainless steel by microline LIPS The gray scale represents depth level Other experimental conditions are asin Fig 2
single laser shots separated by 50 mm in the X directionThe time required to obtain this map was 54 s Figure 4shows the resulting chemical image obtained by moni-toring the net emission signal of Mn(I) 482352 nm Inthis map white areas correspond to the steel matrixwhile the gray scale was established by assigning theminimum to a net intensity value lower than three timesthe net intensity of Mn in the matrix so that dark areasindicate the spatial location of MnS inclusions The samecriterion of distinguishing between the emission signalscorresponding to the presence of the element in the ma-trix or in the inclusions was selected for generating fur-ther multielemental chemical maps The results of Fig 4corroborate the abundance and heterogeneous distributionof the MnS inclusions in this type of steel
To compare mapping features of the microline LIPSapproach to the conventional point-to-point method TiNinclusions in AISI 321 steel sample were studied Figure5 shows two LIPS images corresponding to two differentsample areas of the same size (1560 3 2500 mm 2) gen-erated with both methods In the case of the point-to-point procedure 1632 pulses were required to obtain themap with a lateral resolution of 50 mm in both the X andY axes On the other hand only 32 microlines separatedby 50 mm in the X direction were enough to analyze thesame area size In this sense the time required to generatethe point-to-point map was 51 times higher than the mi-croline map As observed in both maps the dispersionof TiN inclusions in AISI 321 samples is higher than thatof MnS inclusions in AISI 303
Tomographic Study of Inclusions in Stainless Steel
In order to evaluate the variation of inclusionary materialwith depth a tomographic study was performed using anAISI 304 steel sample presenting inclusions of differenttypes The chemical maps of Ca(II) 393366 nm and Al(I)394406 nm are presented in Fig 6 These LIPS images(1450 3 2500 mm 2) presented in binary code to markthe location of inclusions correspond to the 1st 5 th 10 th15th 20th 25th 30 th and 35 th laser shots from a total of45 laser shots performed in 30 adjacent positions with alateral resolution of 50 mm In this gure the conversionof number of laser shots to depth was made by estimatingthe averaged ablation rate using optical microscopy Itshould be noted that with the at-top laser used in thisstudy the crater pro les produced by the microline ap-proach were at and almost homogenous along the mi-croline with a depth variation in the observed zone ofless than 10 This tomographic study was performed in2 min and 35 s (1351 total shots repetition rate 10 Hz)while with the point-to-point method it would require ananalysis time 56-fold higher 2 h and 32 min (68 850 totalshots) to map the same volume with a lateral resolutionof 50 mm and the same repetition rate As shown in themaps the location of Ca and Al in the sampled area doesnot coincide in all cases indicating that these elementsbelong to inclusions with different chemical composi-tions In the positive case the inclusions will correspondto an aluminosilicate of calcium In this gure the dis-appearance of the inclusions with depth and the appear-ance of new ones is also noticeable For this reason thecorresponding depth maps for Ca and Al taken at x 51100 mm transverse section generated after 45 laser shotsapplied in the same position are also constructed Theresults are shown in Fig 7 where the above fact is ob-servable On the other hand to study the variation ofinclusionary material abundance with depth the percent-age area occupied by Ca and Al inclusions in the totalarea analyzed in the tomographic maps of Fig 6 wasdetermined and the result has been plotted as a histogramin Fig 8 As shown the inclusionary area for both ele-ments varies considerably map to map This result sug-gests that surface mapping is not enough to characterizethe inclusion content of a steel sample but an analysisof deeper layers must be performed to provide a repre-sentative result Furthermore there are differences be-tween percentages of both elements which corroboratesthe existence of inclusions containing both Ca and Al andother inclusions where only one of these two elements ispresent
Three-Dimensional Map of Inclusions in Stainless
APPLIED SPECTROSCOPY 1467
Steel Finally in order to demonstrate the full capabilityof the automated microline LIPS method a 3D map ofinclusions present in a 600 3 2500 3 56 mm3 volume ofan austenitic stainless steel was generated In this caseto generate the map 100 consecutive laser shots in 13sample positions separated by 50 mm were required Thedepth ablated in each laser shot was estimated to be 560nm by optical microscopy inspection of the craters Fig-ure 9 shows a portion of 600 3 875 3 56 mm3 of thetotal volume map obtained by monitoring the intensity ofthe emission line of Al(I) 394400 nm As shown theanalyzed inclusions present different shapes and depthsand some disappear before the 100th laser shot (depth of56 mm) It should be noted that this map was generatedfrom 1300 laser shots in 2 min and 30 s with a repetitionrate of 10 Hz while 24 700 laser shots would have beenrequired with the point-to-point con guration
CONCLUSION
The results of the present work demonstrate the ca-pability of the automated microline imaging LIPS tech-nique for generating 2D and 3D multielemental chemicalmaps of inclusions in stainless steel samples Simplicityof operation and rapid data acquisition are the main char-acteristics of this LIPS approach The use of a line-im-aging arrangement results in a 51-fold improvement inthe number of laser shots and total acquisition time com-pared to the conventional point-to-point LIPS mode Thisfact is especially outstanding when tomographic or vol-ume studies are required The results indicate that micro-line imaging LIPS is a suitable tool for fast characteriza-tion of morphology composition and distribution of in-clusions in stainless steel
ACKNOWLEDGMENTS
One of the authors (MPM) acknowledges the fellowship providedby Secretar Daggera de Estado de Universidades Investigacion y Desarrolloof Spain This work was supported by Project BQU2001-1854 of theMinisterio de Ciencia y TecnologDaggera Secretar Daggera de Estado de PolDaggerticaCient Dagger ca y Tecnologica of Spain and by the ECSC under contract7210PD230 The authors also acknowledge Acerinox SA (Los Bar-rios Cadiz Spain) for providing the stainless steel samples
1 A Gonzalez M Ortiz and J Campos Appl Spectrosc 49 1632(1995)
2 R Sattmann V Sturm and R Noll J Phys D Appl Phys 282181 (1995)
3 M Hemmerlin R Meilland H Falk P Wintjens and L PaulardSpectrochim Acta Part B 56 661 (2001)
4 V Sturm L Peter and R Noll Appl Spectrosc 54 1275 (2000)5 C Chaleard P Mauchien N Andre J Uebbing J L Lacour and
C Geertsen J Anal At Spectrom 12 183 (1997)6 C Aragon J A Aguilera and F Penalba Appl Spectrosc 53
1259 (1999)7 I Bassiotis A Diamantopoulou A Giannoudakos F Roubani-Ka-
lantzopoulou and M Kompitsas Spectrochim Acta Part B 56 671(2001)
8 L M CabalDaggern D Romero C C Garc Daggera J M Baena and J JLaserna Anal Bioanal Chem 372 352 (2002)
9 J Gruber J Heitz H Strasser D Bauerle and N RamasederSpectrochim Acta Part B 56 685 (2001)
10 C J Lorenzen C Carlhoff U Hahn and M Jogwich J Anal AtSpectrom 7 1029 (1992)
11 S Palanco L M CabalDaggern D Romero and J J Laserna J AnalAt Spectrom 14 1883 (1999)
12 L M CabalDaggern D Romero J M Baena and J J Laserna SurfInterface Anal 27 805 (1999)
13 X Mao W T Chan and R E Russo Appl Spectrosc 51 1047(1997)
14 C C Garc Daggera M Corral J M Vadillo and J J Laserna ApplSpectrosc 54 1027 (2000)
15 D R Anderson C W McLeod T English and A T Smith ApplSpectrosc 49 691 (1995)
16 J M Vadillo and J J Laserna J Anal At Spectrom 12 859(1997)
17 J M Vadillo C C Garc Daggera S Palanco and J J Laserna J AnalAt Spectrom 13 793 (1998)
18 L St-Onge and M Sabsabi Spectrochim Acta Part B 55 299(2000)
19 S Palanco and J J Laserna J Anal At Spectrom 15 1321(2000)
20 I B Gornushkin B W Smith H Nasajpour and J D Wineford-ner Anal Chem 71 5157 (1999)
21 R Noll H Bette A Brysch M Kraushaar I Monch L Peterand V Sturm Spectrochim Acta Part B 56 637 (2001)
22 S Palanco J M Baena and J J Laserna Spectrochim Acta PartB 57 591 (2002)
23 D A Cremers J E Bare eld and A C Kostelo Appl Spectrosc49 857 (1995)
24 C M Davies H H Telle D J Montgomery and R E CorbettSpectrochim Acta Part B 50 1059 (1995)
25 J M Vadillo P L Garc Daggera S Palanco D Romero J M Baenaand J J Laserna Anal Bioanal Chem 375 1144 (2003)
26 M P Mateo S Palanco J M Vadillo and J J Laserna ApplSpectrosc 54 1429 (2000)
27 L M Cabal Daggern M P Mateo and J J Laserna Surf Interface Anal35 263 (2003)
28 M P Mateo L M CabalDaggern and J J Laserna Appl Spectrosc 57343 (2003)
1462 Volume 57 Number 12 2003
FIG 1 Photograph of (A) MnS inclusions in AISI 303 stainless steel and (B) TiN inclusions in AISI 321 stainless steel obtained by opticalmicroscopy
FIG 2 Photograph of a 180-mm-diameter macro inclusion in austenitic stainless steel (A) before and (B) after the analysis The plot shows twospectra corresponding to steel and the inclusion zone obtained from a single microline laser shot The laser pulse energy was 33 mJ The acquisitiontime and delay time were of 1000 ns and 300 ns respectively
APPLIED SPECTROSCOPY 1463
FIG 3 Microline LIPS images corresponding to the spatial distribution of Mg Fe Ca Al and Ti in the inclusion shown in Fig 2 Intensities ofthe Mg(I) 383829 nm Fe(I) 387857 nm Ca(II) 393366 nm Al(I) 394400 nm and Ti(I) 395821 nm lines are shown with a gray scale in arbitraryunits Other experimental conditions are as in Fig 2
FIG 4 Mn mapping of an AISI 303 stainless steel sample with mi-croline imaging LIPS Plotted data correspond to the intensity distri-bution of the Mn(I) 482352 nm emission line The mapped area was2400 3 2500 mm 2 Other experimental conditions are as in Fig 2
length concave lens and a 75-mm-focal-length convexlens Then the beam was focused to a line by a cylin-drical lens with a focal length of 50 mm onto the samplesurface Plasma emission generated in air at atmosphericpressure was collected with a planoconvex quartz lenswith a focal length of 100 mm onto the entrance slit ofa 05-m-focal-length CzernyndashTurner imaging spectro-graph (Chromex model 500 IS f 8 tted with indexablegratings of 300 1200 and 2400 grooves mm21) Thegrating of 2400 grooves mm21 with a reciprocal lineardispersion of 25 nm mm21 was used in this study Thespectrograph entrance slit was 10 mm high and 20 mmwide The axis along the microline plasma was parallelto the spectrograph entrance slit The plasma dispersedlight was spatially resolved by an intensi ed solid-state
two-dimensional charge-coupled device (ICCD StanfordComputer Optics model 4Quik 05) The CCD consistedof 768 3 512 elements each 78 3 87 mm The activearea was 6 3 44 mm 2 The dynamic range of the CCDdetector system is 1012 For data acquisition the ICCDsystem was triggered by an output TTL pulse from thelaser In order to observe the plasma at an early expansionstage and therefore reduce atom diffusion in the vaporphase timing conditions of 300 ns (delay time) and 1000ns (integration time) were established in this experimentOperation of the detector was controlled by a personalcomputer with 4Spec software The sample was placedon two crossed motorized stages (Physik Instrumente)The stages were computer controlled which allowed ex-act movement of the sample in both the x and y direc-tions The laser trigger was controlled externally by adigital delaypulse generator (Stanford Research SystemModel DG535) A laboratory-developed software al-lowed the exact synchronization between the motorizedstage movement and laser ring to perform automatedacquisition of chemical map data Communication be-tween devices was carried out by an IEEE 488 general-purpose interface bus (GPIB) Stored data were treatedby a lab-developed software that reduced the volume ofacquired data to an XY matrix for each depth level andelement of interest In order to generate chemical mapsthese matrices were plotted using a commercial imaginganalysis data software The area of the inclusions in per-cent regarding the total map area was calculated withcommercial image analysis software (Visilog 52)
Samples The following stainless steel grades havebeen studied AISI 304 AISI 303 and AISI 321 Suchsteel types consist of production process materials thathave been chosen in order to cover ve elements of in-terest that are part of the general chemical compositionof the inclusions manganese (sul de) aluminum (alu-minosilicates) titanium (nitride) calcium (aluminosili-cates and silicates) and magnesium (aluminosilicates andsilicates) To simultaneously monitor the emission linesof Mg Fe Ca Al and Ti the grating was centered at3883 nm while for the analysis of MnS inclusions aspectral window centered at 476 nm was used AISI 303and AISI 321 stainless steel samples were characterizedby scanning electron microscopy with a microanalysisEDS system and by optical microscopy The results dem-onstrate the presence of a single type of inclusion in thesesteels manganese sul de and titanium nitride respec-
1464 Volume 57 Number 12 2003
FIG 5 Comparison of LIPS maps of TiN inclusions in AISI 321 stainless steel generated with (A) the point-to-point approach and (B) themicroline approach Plotted data correspond to the intensity distribution of the Ti(I) 395821 nm emission line Other experimental conditions areas in Fig 2
tively due to the high sulfur content (03) and titanium(01) of these steel grades For this reason it has beenassumed that detection by LIPS of Mn or Ti in the sampleindicates the presence of MnS or TiN inclusions On theother hand it is necessary to consider the existence ofpores and trapped slag The appearance of these inclu-sions has been studied by optical microscopy The dis-tribution of MnS inclusions in AISI 303 steel is morehomogeneous and can be of two types globular or den-drite net Figure 1A shows some details of these types ofinclusions In contrast the size and distribution of TiNinclusions present in AISI 321 steel are shown in Fig1B They usually appear in groups in some zones of thesample
According to size the inclusions are usually classi edas micro and macro inclusions There are no exact limitsde ned for the different inclusion size since for differentsteel grades the de nition of macro inclusions variesHowever in some works the following de nition of in-clusion sizes is used micro inclusions (20 mm) semi-macro inclusions (20 and 100 mm) and macro inclu-sions (100 mm)
RESULTS AND DISCUSSION
Multielemental Mapping of a Single Inclusion inStainless Steel The performance of the automated mi-croline approach for compositional mapping was testedwith inclusions of large diameter in austenitic stainlesssteel Figure 2 shows the photograph of a 180 mm di-ameter macro inclusion before and after the analysis bythe microline LIPS approach Inclusion size was directly
measured by optical microscopy using a calibrated reti-cule In this gure two of the spectra obtained from theCCD microline image corresponding to a single lasershot in the inclusion zone are also shown These spectraexhibit information from different areas in the samplethat correspond to the location of the steel matrix and themacro inclusion as manifested in the differences in theemission spectra features Chemical maps of Mg Fe CaAl and Ti in an area 700 3 625 mm 2 that included themacro inclusion are shown in Fig 3 To emphasize thedifferences between intensity distributions in the pre-sented maps only the cited area has been shown al-though the total analyzed area was 1300 3 2500 mm 2These maps were obtained from 27 single laser shots witha lateral resolution of 50 mm between adjacent microlinecraters The total analysis time for generating the multiel-emental map including time intervals for decelerationand acceleration of the X stage was 30 s It should benoted that for this study the stage was moved and stoppedfor each X position The generation of this multielemen-tal chemical map involved combining net peak intensityinformation from the emission line chosen for each ele-ment (labeled in Fig 2) along the microlines obtainedfrom adjacent positions on the sample with its spatialcoordinates The spatial resolution along the microlinewas estimated as 48 mm This value was calculated fromthe analysis of inclusions of known size to account foroptical magni cation in collection pixel size and plasmaexpansion In the chemical images of Fig 3 differencesin elemental distribution are represented by gray gradingAs shown in the maps whereas Mg Ca and Al present
APPLIED SPECTROSCOPY 1465
FIG 7 Depth images for Ca and Al generated by applying 45 lasershots on the same position (x 5 1100 mm) It should be noted that theaxes are not to scale Maps were constructed from data in Fig 6
not
FIG 6 Tomographic microline LIPS images of (A) Ca(II) 393366 nmand (B) Al(I) 394400 nm in a 1450 3 2500 mm 2 area of AISI 304stainless steel corresponding to the 1 st 5th 10th 15th 20 th 25th 30th and35th laser shots performed in 30 adjacent positions Other experimentalconditions are as in Fig 2
only minor differences in intensity distribution inside theinclusion the differences are more acute with respect tothe Ti map which indicates that the chemical composi-tion of the inclusion under study was a mixture of tita-nium nitride and aluminosilicate of calcium and magne-sium The maps demonstrate that the LIPS images rep-resent quite accurately the dimensions and position of theanalyzed inclusion in the sample indicating a good cor-respondence between the calculated size from LIPS im-ages using a lateral resolution along the microline of 48mm and the real size of the inclusion measured by opticalmicroscopy
Mapping of MnS and TiN Inclusions in StainlessSteel In a second step AISI 303 and AISI 321 stainlesssteel samples presenting a predominant type of inclusionmanganese sul de and titanium nitride respectively wereanalyzed
In the case of the AISI 303 steel sample an area of2400 3 2500 mm 2 was analyzed by a sequence of 49
1466 Volume 57 Number 12 2003
FIG 8 Histogram of percentage area of inclusionary material in re-lation to the total mapped area for Ca and Al inclusions Data wereobtained from maps in Fig 6
FIG 9 3D map of Al inclusions in stainless steel by microline LIPS The gray scale represents depth level Other experimental conditions are asin Fig 2
single laser shots separated by 50 mm in the X directionThe time required to obtain this map was 54 s Figure 4shows the resulting chemical image obtained by moni-toring the net emission signal of Mn(I) 482352 nm Inthis map white areas correspond to the steel matrixwhile the gray scale was established by assigning theminimum to a net intensity value lower than three timesthe net intensity of Mn in the matrix so that dark areasindicate the spatial location of MnS inclusions The samecriterion of distinguishing between the emission signalscorresponding to the presence of the element in the ma-trix or in the inclusions was selected for generating fur-ther multielemental chemical maps The results of Fig 4corroborate the abundance and heterogeneous distributionof the MnS inclusions in this type of steel
To compare mapping features of the microline LIPSapproach to the conventional point-to-point method TiNinclusions in AISI 321 steel sample were studied Figure5 shows two LIPS images corresponding to two differentsample areas of the same size (1560 3 2500 mm 2) gen-erated with both methods In the case of the point-to-point procedure 1632 pulses were required to obtain themap with a lateral resolution of 50 mm in both the X andY axes On the other hand only 32 microlines separatedby 50 mm in the X direction were enough to analyze thesame area size In this sense the time required to generatethe point-to-point map was 51 times higher than the mi-croline map As observed in both maps the dispersionof TiN inclusions in AISI 321 samples is higher than thatof MnS inclusions in AISI 303
Tomographic Study of Inclusions in Stainless Steel
In order to evaluate the variation of inclusionary materialwith depth a tomographic study was performed using anAISI 304 steel sample presenting inclusions of differenttypes The chemical maps of Ca(II) 393366 nm and Al(I)394406 nm are presented in Fig 6 These LIPS images(1450 3 2500 mm 2) presented in binary code to markthe location of inclusions correspond to the 1st 5 th 10 th15th 20th 25th 30 th and 35 th laser shots from a total of45 laser shots performed in 30 adjacent positions with alateral resolution of 50 mm In this gure the conversionof number of laser shots to depth was made by estimatingthe averaged ablation rate using optical microscopy Itshould be noted that with the at-top laser used in thisstudy the crater pro les produced by the microline ap-proach were at and almost homogenous along the mi-croline with a depth variation in the observed zone ofless than 10 This tomographic study was performed in2 min and 35 s (1351 total shots repetition rate 10 Hz)while with the point-to-point method it would require ananalysis time 56-fold higher 2 h and 32 min (68 850 totalshots) to map the same volume with a lateral resolutionof 50 mm and the same repetition rate As shown in themaps the location of Ca and Al in the sampled area doesnot coincide in all cases indicating that these elementsbelong to inclusions with different chemical composi-tions In the positive case the inclusions will correspondto an aluminosilicate of calcium In this gure the dis-appearance of the inclusions with depth and the appear-ance of new ones is also noticeable For this reason thecorresponding depth maps for Ca and Al taken at x 51100 mm transverse section generated after 45 laser shotsapplied in the same position are also constructed Theresults are shown in Fig 7 where the above fact is ob-servable On the other hand to study the variation ofinclusionary material abundance with depth the percent-age area occupied by Ca and Al inclusions in the totalarea analyzed in the tomographic maps of Fig 6 wasdetermined and the result has been plotted as a histogramin Fig 8 As shown the inclusionary area for both ele-ments varies considerably map to map This result sug-gests that surface mapping is not enough to characterizethe inclusion content of a steel sample but an analysisof deeper layers must be performed to provide a repre-sentative result Furthermore there are differences be-tween percentages of both elements which corroboratesthe existence of inclusions containing both Ca and Al andother inclusions where only one of these two elements ispresent
Three-Dimensional Map of Inclusions in Stainless
APPLIED SPECTROSCOPY 1467
Steel Finally in order to demonstrate the full capabilityof the automated microline LIPS method a 3D map ofinclusions present in a 600 3 2500 3 56 mm3 volume ofan austenitic stainless steel was generated In this caseto generate the map 100 consecutive laser shots in 13sample positions separated by 50 mm were required Thedepth ablated in each laser shot was estimated to be 560nm by optical microscopy inspection of the craters Fig-ure 9 shows a portion of 600 3 875 3 56 mm3 of thetotal volume map obtained by monitoring the intensity ofthe emission line of Al(I) 394400 nm As shown theanalyzed inclusions present different shapes and depthsand some disappear before the 100th laser shot (depth of56 mm) It should be noted that this map was generatedfrom 1300 laser shots in 2 min and 30 s with a repetitionrate of 10 Hz while 24 700 laser shots would have beenrequired with the point-to-point con guration
CONCLUSION
The results of the present work demonstrate the ca-pability of the automated microline imaging LIPS tech-nique for generating 2D and 3D multielemental chemicalmaps of inclusions in stainless steel samples Simplicityof operation and rapid data acquisition are the main char-acteristics of this LIPS approach The use of a line-im-aging arrangement results in a 51-fold improvement inthe number of laser shots and total acquisition time com-pared to the conventional point-to-point LIPS mode Thisfact is especially outstanding when tomographic or vol-ume studies are required The results indicate that micro-line imaging LIPS is a suitable tool for fast characteriza-tion of morphology composition and distribution of in-clusions in stainless steel
ACKNOWLEDGMENTS
One of the authors (MPM) acknowledges the fellowship providedby Secretar Daggera de Estado de Universidades Investigacion y Desarrolloof Spain This work was supported by Project BQU2001-1854 of theMinisterio de Ciencia y TecnologDaggera Secretar Daggera de Estado de PolDaggerticaCient Dagger ca y Tecnologica of Spain and by the ECSC under contract7210PD230 The authors also acknowledge Acerinox SA (Los Bar-rios Cadiz Spain) for providing the stainless steel samples
1 A Gonzalez M Ortiz and J Campos Appl Spectrosc 49 1632(1995)
2 R Sattmann V Sturm and R Noll J Phys D Appl Phys 282181 (1995)
3 M Hemmerlin R Meilland H Falk P Wintjens and L PaulardSpectrochim Acta Part B 56 661 (2001)
4 V Sturm L Peter and R Noll Appl Spectrosc 54 1275 (2000)5 C Chaleard P Mauchien N Andre J Uebbing J L Lacour and
C Geertsen J Anal At Spectrom 12 183 (1997)6 C Aragon J A Aguilera and F Penalba Appl Spectrosc 53
1259 (1999)7 I Bassiotis A Diamantopoulou A Giannoudakos F Roubani-Ka-
lantzopoulou and M Kompitsas Spectrochim Acta Part B 56 671(2001)
8 L M CabalDaggern D Romero C C Garc Daggera J M Baena and J JLaserna Anal Bioanal Chem 372 352 (2002)
9 J Gruber J Heitz H Strasser D Bauerle and N RamasederSpectrochim Acta Part B 56 685 (2001)
10 C J Lorenzen C Carlhoff U Hahn and M Jogwich J Anal AtSpectrom 7 1029 (1992)
11 S Palanco L M CabalDaggern D Romero and J J Laserna J AnalAt Spectrom 14 1883 (1999)
12 L M CabalDaggern D Romero J M Baena and J J Laserna SurfInterface Anal 27 805 (1999)
13 X Mao W T Chan and R E Russo Appl Spectrosc 51 1047(1997)
14 C C Garc Daggera M Corral J M Vadillo and J J Laserna ApplSpectrosc 54 1027 (2000)
15 D R Anderson C W McLeod T English and A T Smith ApplSpectrosc 49 691 (1995)
16 J M Vadillo and J J Laserna J Anal At Spectrom 12 859(1997)
17 J M Vadillo C C Garc Daggera S Palanco and J J Laserna J AnalAt Spectrom 13 793 (1998)
18 L St-Onge and M Sabsabi Spectrochim Acta Part B 55 299(2000)
19 S Palanco and J J Laserna J Anal At Spectrom 15 1321(2000)
20 I B Gornushkin B W Smith H Nasajpour and J D Wineford-ner Anal Chem 71 5157 (1999)
21 R Noll H Bette A Brysch M Kraushaar I Monch L Peterand V Sturm Spectrochim Acta Part B 56 637 (2001)
22 S Palanco J M Baena and J J Laserna Spectrochim Acta PartB 57 591 (2002)
23 D A Cremers J E Bare eld and A C Kostelo Appl Spectrosc49 857 (1995)
24 C M Davies H H Telle D J Montgomery and R E CorbettSpectrochim Acta Part B 50 1059 (1995)
25 J M Vadillo P L Garc Daggera S Palanco D Romero J M Baenaand J J Laserna Anal Bioanal Chem 375 1144 (2003)
26 M P Mateo S Palanco J M Vadillo and J J Laserna ApplSpectrosc 54 1429 (2000)
27 L M Cabal Daggern M P Mateo and J J Laserna Surf Interface Anal35 263 (2003)
28 M P Mateo L M CabalDaggern and J J Laserna Appl Spectrosc 57343 (2003)
Related Documents


