Automated frame selection process for high-resolution microendoscopy Ayumu Ishijima Richard A. Schwarz Dongsuk Shin Sharon Mondrik Nadarajah Vigneswaran Ann M. Gillenwater Sharmila Anandasabapathy Rebecca Richards-Kortum Downloaded From: http://biomedicaloptics.spiedigitallibrary.org/ on 06/13/2016 Terms of Use: http://spiedigitallibrary.org/ss/TermsOfUse.aspx

Welcome message from author
This document is posted to help you gain knowledge. Please leave a comment to let me know what you think about it! Share it to your friends and learn new things together.
Transcript
Automated frame selection process forhigh-resolution microendoscopy
Ayumu IshijimaRichard A. SchwarzDongsuk ShinSharon MondrikNadarajah VigneswaranAnn M. GillenwaterSharmila AnandasabapathyRebecca Richards-Kortum
Downloaded From: http://biomedicaloptics.spiedigitallibrary.org/ on 06/13/2016 Terms of Use: http://spiedigitallibrary.org/ss/TermsOfUse.aspx

Automated frame selection process forhigh-resolution microendoscopy
Ayumu Ishijima,a,b Richard A. Schwarz,a Dongsuk Shin,a Sharon Mondrik,a Nadarajah Vigneswaran,cAnn M. Gillenwater,d Sharmila Anandasabapathy,e and Rebecca Richards-Kortuma,*aRice University, Department of Bioengineering MS 142, 6100 Main Street, Houston, Texas 77005, United StatesbUniversity of Tokyo, Department of Precision Engineering, 7-3-1 Hongo, Bunkyo-ku, Tokyo 113-0033, JapancUniversity of Texas School of Dentistry, 7500 Cambridge Street, Houston, Texas 77054, United StatesdUniversity of Texas M. D. Anderson Cancer Center, 1515 Holcombe Boulevard, Houston, Texas 77030, United StateseMount Sinai Medical Center, Division of Gastroenterology, One Gustave L. Levy Place, New York, New York 10029, United States
Abstract. We developed an automated frame selection algorithm for high-resolution microendoscopy videosequences. The algorithm rapidly selects a representative frame with minimal motion artifact from a shortvideo sequence, enabling fully automated image analysis at the point-of-care. The algorithm was evaluatedby quantitative comparison of diagnostically relevant image features and diagnostic classification resultsobtained using automated frame selection versus manual frame selection. A data set consisting of video sequen-ces collected in vivo from 100 oral sites and 167 esophageal sites was used in the analysis. The area under thereceiver operating characteristic curve was 0.78 (automated selection) versus 0.82 (manual selection) for oralsites, and 0.93 (automated selection) versus 0.92 (manual selection) for esophageal sites. The implementationof fully automated high-resolution microendoscopy at the point-of-care has the potential to reduce the number ofbiopsies needed for accurate diagnosis of precancer and cancer in low-resource settings where there may belimited infrastructure and personnel for standard histologic analysis. © The Authors. Published by SPIE under a Creative
Commons Attribution 3.0 Unported License. Distribution or reproduction of this work in whole or in part requires full attribution of the original publication,
including its DOI. [DOI: 10.1117/1.JBO.20.4.046014]
Keywords: frame selection; microendoscopy; motion blur; speeded up robust features; image analysis; image classification.
Paper 140542R received Aug. 27, 2014; accepted for publication Apr. 9, 2015; published online Apr. 28, 2015.
1 IntroductionIt is estimated that global cancer incidence and mortalitywill approximately double during the next two decades.1 Theincrease is particularly notable in low-income and middle-income countries, where population growth, aging, and reducedmortality from infectious diseases have led to a steadily increas-ing cancer burden.2 Low-income countries often lack effectivecancer screening and prevention services. In these settings, con-ventional diagnostic methods, such as biopsy and histopathol-ogy, are limited by the lack of laboratory infrastructure, the lackof trained personnel,3 and the difficulty of ensuring patient fol-low-up when test results are not immediately available at thepoint-of-care. As a result, most cancer patients in low-incomecountries are diagnosed with advanced-stage disease. There isa widespread need for rapid, effective methods for early detec-tion of cancer at the point-of-care in low-resource settings.
Optical imaging technologies have the potential to aid inearly detection of cancer in real time at the point-of-care.High-resolution fiber-optic microendoscopy is an imaging tech-nology that has emerged as a cost-effective and noninvasivemethod for point-of-care diagnosis of precancer and cancer inorgan sites including the oral cavity and esophagus.4 Thismethod enables direct visualization of neoplastic indicatorssuch as elevated nuclear-to-cytoplasmic area ratio (N/C ratio),nuclear crowding, and nuclear pleomorphism with similar
resolution to confocal microendoscopy but with significantlyreduced system complexity and cost.5 These indicators areconventionally only observed during cytologic or histologicanalysis following an invasive biopsy. Recent clinical studies ofhigh-resolution fiber-optic microendoscopy have demonstratedthat this method can be used to detect neoplastic lesions inpatients with oral squamous cell carcinoma6 and Barrett’sesophagus.7
In high-resolution microendoscopy a coherent fiber opticbundle is placed in contact with the tissue, providing a real-time video display showing the size, shape, and distributionof cell nuclei in the epithelium. The field of view is typically0.5 to 1.0 mm in diameter with a lateral resolution of about4 μm. The images may be subjectively interpreted by trainedpersonnel or they may be quantitatively analyzed usingimage analysis algorithms to diagnostically assess relevantparameters, such as N/C ratio and nuclear size. In vivo clinicaldata are typically collected in the form of short video sequences,to ensure that a high-quality individual frame free of motionartifact can subsequently be selected for quantitative imageanalysis.8 The selection of a representative and informativekey frame for quantitative image analysis is typically performedmanually at some time after the imaging session has been com-pleted, based on a subjective evaluation of image quality andmotion artifact by an observer blinded to clinical impressionand pathology diagnosis. An algorithm that automates theframe selection procedure is needed to enable real-time quanti-tative image analysis for high-resolution microendoscopy atthe point-of-care.*Address all correspondence to: Rebecca Richards-Kortum, E-mail: rkortum@
rice.edu
Journal of Biomedical Optics 046014-1 April 2015 • Vol. 20(4)
Journal of Biomedical Optics 20(4), 046014 (April 2015)
Downloaded From: http://biomedicaloptics.spiedigitallibrary.org/ on 06/13/2016 Terms of Use: http://spiedigitallibrary.org/ss/TermsOfUse.aspx
Automated selection of key frames is important in othertypes of medical imaging as well. Automated frame selectionalgorithms and procedures have been reported for laparoscopicvideos,9 colonoscopy videos,10 capsule endoscopy videos,11–15
cystoscopy videos,16 angiography videos,17 bronchoscopic vid-eos,18 larynx endoscopy videos,19 and retinal videos.20 Thesealgorithms are generally designed to remove redundant videoframes and/or identify key frames in order to spare cliniciansthe need to spend time viewing and selecting individual images,thus enhancing diagnostic efficiency.
However, frame selection algorithms previously reportedin the literature cannot easily be applied to high-resolutionmicroendoscopy because they are matched to specific featuresseen in a particular class of videos, as in the case of retinalimaging20 in which key frames are identified through auto-mated recognition of vessel structure. Also, most key frameselection algorithms are intended to summarize the video orautomatically detect boundaries between shots in order tostructure the video.21 Thus, key frames are identified whenevera significant content change between a frame and its precedingframe can be observed.22,23 These algorithms are not wellsuited to high-resolution microendoscopy videos, whichcontain features different from those of most other imagingmodalities. High-resolution microendoscopy videos typicallyshow bright nuclei on a dark background, with the nuclearsize, shape, and distribution related to the disease state ofthe tissue. Some frames in each video are expected to containmotion artifact because the field of view is small and the micro-endoscope is manually held in place by the clinician or insertedthrough the working channel of an endoscope during in vivoimaging.
For these reasons, a key frame selection algorithmspecific for high-resolution microendoscopy is required.Here, we present an algorithm that automates the frameselection procedure, which is an important step that is neededto enable real-time quantitative image analysis at the point-of-care. The goal of the present study was to developan algorithm that automatically selects a high-quality, repre-sentative frame free of motion artifact from each videosequence.
2 Automated Frame Selection AlgorithmThe automated frame selection algorithm aims to select a framethat is free of motion artifact, that has sufficient intensity formeaningful analysis but is not saturated, and that is representa-tive. Motion artifact can be minimized by identifying segmentswithin the video sequence with minimal frame-to-frame varia-tion, but this method alone cannot account for image quality,pixel saturation, and low-light levels. Images of optimal qualitycan be selected by calculating the entropy of the image and iden-tifying feature points in the image, but these methods alone canresult in a bias against images that have less distinctly represen-tative features such as neoplastic tissue (in which the nuclei havea more crowded and disordered appearance) or keratinized tis-sue (in which nuclei are not visible). We, therefore, developeda hybrid frame selection algorithm that uses a combination ofthese methods. Part 1 of the algorithm identifies a subset ofimages within the video sequence with minimal frame-to-frame variation. Part 2 selects images within that subset whichmeet certain criteria related to the entropy of the image. Part 3uses feature point analysis to select the final frame. Each step isdescribed in further detail below.
3 Part 1: Frame SubtractionSimple subtraction of images can be used to characterize frame-to-frame variation. If the intensity difference between two suc-cessive images is low, the two images are similar to each other.The difference between two successive images can be calculatedby Eqs. (1) and (2):
Idifferencek ¼ ½Ikþ1 − Ik�2; (1)
k ¼ 1;2; 3; : : : ; ðNumber of framesÞ − 1: (2)
The steps to select frames which are least affected by motionartifact are described below.
Step 1: Let k be the number of images in the video sequence.Calculate (k − 1) difference images using Eq. (1).
Step 2: Calculate the summation of pixel values in eachdifference image.
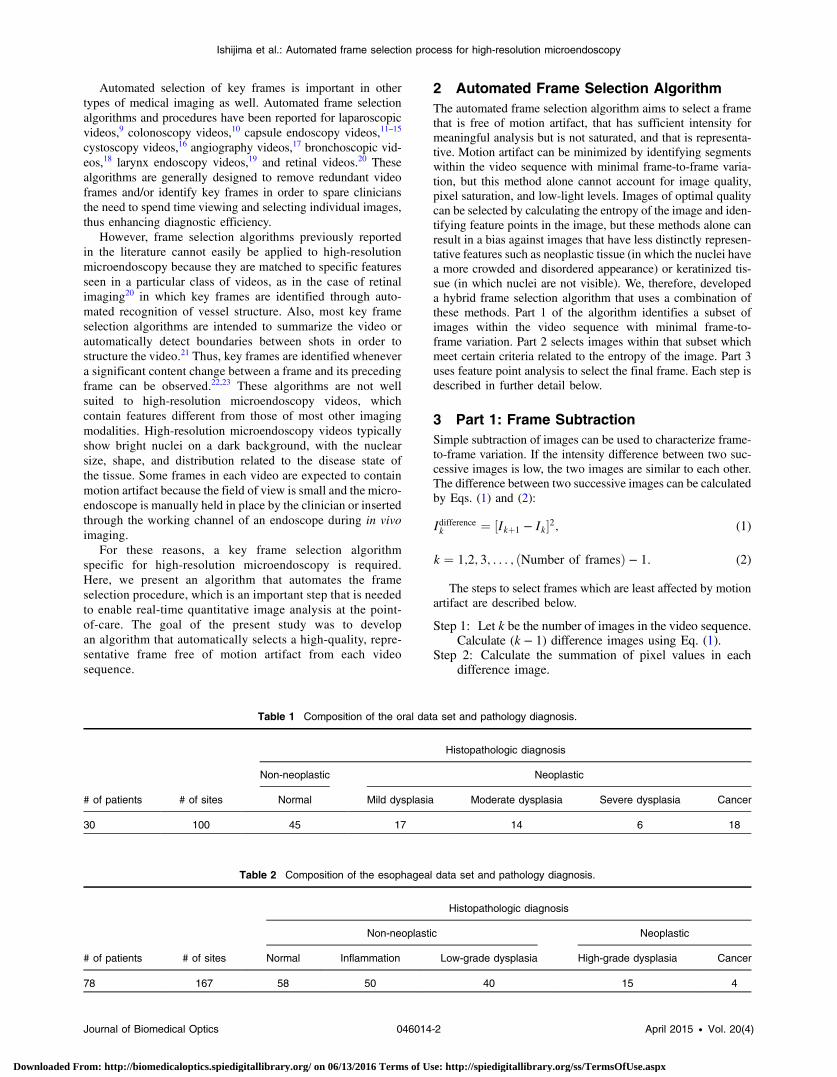
Table 1 Composition of the oral data set and pathology diagnosis.
# of patients # of sites
Histopathologic diagnosis
Non-neoplastic Neoplastic
Normal Mild dysplasia Moderate dysplasia Severe dysplasia Cancer
30 100 45 17 14 6 18
Table 2 Composition of the esophageal data set and pathology diagnosis.
# of patients # of sites
Histopathologic diagnosis
Non-neoplastic Neoplastic
Normal Inflammation Low-grade dysplasia High-grade dysplasia Cancer
78 167 58 50 40 15 4
Journal of Biomedical Optics 046014-2 April 2015 • Vol. 20(4)
Ishijima et al.: Automated frame selection process for high-resolution microendoscopy
Downloaded From: http://biomedicaloptics.spiedigitallibrary.org/ on 06/13/2016 Terms of Use: http://spiedigitallibrary.org/ss/TermsOfUse.aspx

Step 3: Identify the r1 × k difference images that have thelowest summation of pixel values. The variable r1 is anarbitrarily selected value that sets the fraction of framesto be retained in this part of the algorithm ð0 ≤ r1 ≤ 1Þ.We set r1 ¼ 0.5, based on our observation that in thisdata set about half of the frames in a typical videosequence are free of motion artifact. Therefore, 50% ofthe frames are retained and 50% are discarded in thispart of the algorithm. Note that the value of r1 × k isrounded to the nearest integer.
Step 4: Identify the original images corresponding to thedifference images selected in Step 3. For each differenceimage Idifferencek selected in Step 3, the single originalimage Ik is retained. Other images are discarded.
4 Part 2: EntropyEntropy is a statistical feature which represents the diversity ofintensity values in an image; it is a measure of information
content.24,25 The entropy of an image can be determined froma histogram of the gray level values represented in the image.The entropy E is defined as Eq. (3), where M is the numberof gray levels and pj is the probability associated with graylevel j.
E ¼ −XM−1
j¼0
pj logðpjÞ: (3)
Images containing pixels with similar intensity values (lowpixel-to-pixel contrast) have low entropy values, whereas imageswith high pixel-to-pixel contrast have high entropy values.Entropy can, therefore, be used to help evaluate whether animage is properly focused, since an in-focus image tends tocontain higher pixel-to-pixel contrast and higher informationcontent than an out-of-focus image.26
The steps to select frames which are minimally affected bymotion artifact and have sufficient entropy are described below.
Fig. 1 Examples of high-resolution microendoscopy frames selected from video sequences in the oraldata set. Top row: manually selected frames from (a) non-neoplastic oral site (Video 1) and (b) neoplasticoral site (Video 2). Bottom row: automatically selected frames from (c) non-neoplastic oral site (Video 1)and (d) neoplastic oral site (Video 2). (Video 1: QuickTime, 5.2 MB [URL: http://dx.doi.org/10.1117/1.JBO.20.4.046014.1]. Video 2: QuickTime, 5.9 MB [URL: http://dx.doi.org/10.1117/1.JBO.20.4.046014.2].Scale bar ¼ 100 μm).
Journal of Biomedical Optics 046014-3 April 2015 • Vol. 20(4)
Ishijima et al.: Automated frame selection process for high-resolution microendoscopy
Downloaded From: http://biomedicaloptics.spiedigitallibrary.org/ on 06/13/2016 Terms of Use: http://spiedigitallibrary.org/ss/TermsOfUse.aspx
Step 1: Calculate the entropy of images previously selectedin Part 1 using Eq. (3).
Step 2: Identify the r2 × ðr1 × kÞ images which have thehighest entropy values. The variable r2 is an arbitrarilyselected value that sets the fraction of frames to beretained in this part of the algorithm ð0 ≤ r2 ≤ 1Þ.We set r2 ¼ 0.5 in this analysis; therefore, 50% of theframes are retained and 50% are discarded in this part ofthe algorithm. Note that the value of r2 × ðr1 × kÞ isrounded to the nearest integer.
5 Part 3: Feature Point DetectionThe third part of the algorithm is based on the detection of pointsof interest, called feature points, within the image. We adapteda feature-based registration technique known as Speeded UpRobust Features (SURF) for this purpose.27 SURF is widely
used in computer vision technologies. The frame selection algo-rithm utilizes feature points calculated by the SURF algorithmon the assumption that a high-quality representative frame (infocus, no motion blur) possesses, in general, a larger number offeature points than other frames that are lower in quality or lesssuitable to represent the site. We also tested this assumptionexperimentally (see Sec. 8).
The SURF algorithm is described in detail in the literature.27
It is a scale- and rotation-invariant detector and descriptor offeature points in an image. Its important characteristics arespeed, robustness, accuracy, and performance repeatability. Inour algorithm, we utilized the feature point detection componentof the SURF algorithm.
The steps to select a final single frame to represent the videosequence are described below.
Step 1: Calculate the feature points of images previouslyselected in Part 2.
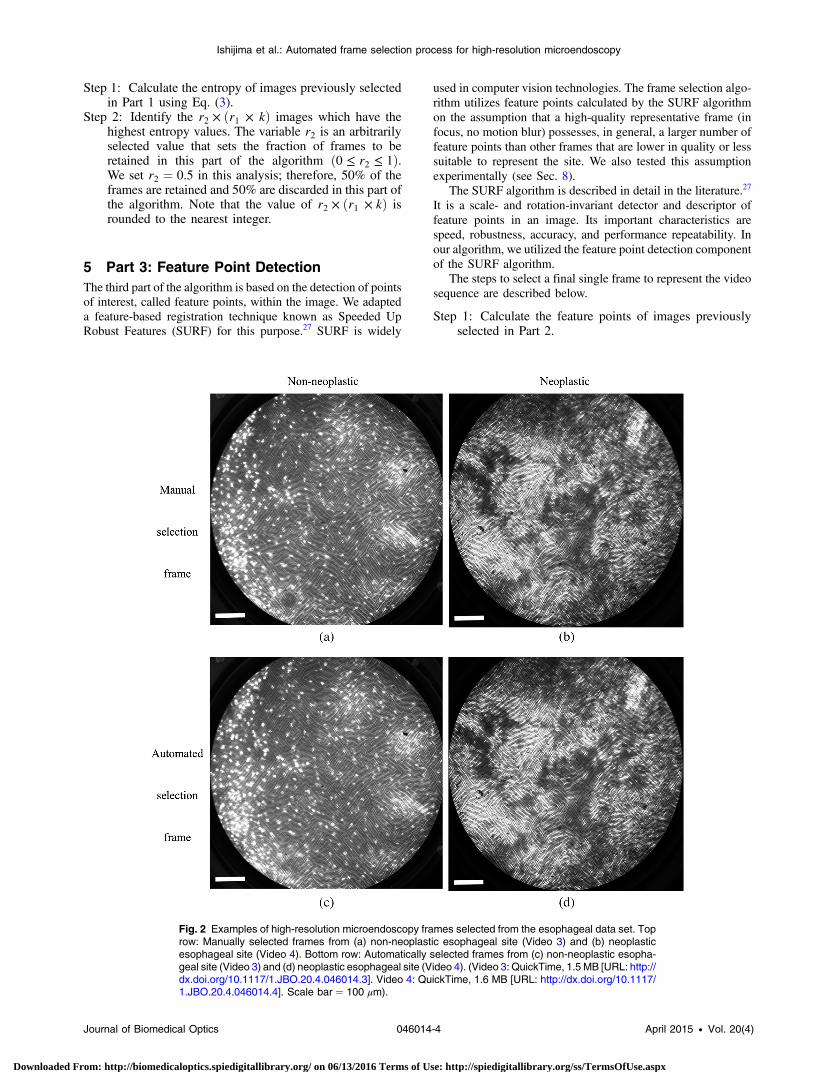
Fig. 2 Examples of high-resolution microendoscopy frames selected from the esophageal data set. Toprow: Manually selected frames from (a) non-neoplastic esophageal site (Video 3) and (b) neoplasticesophageal site (Video 4). Bottom row: Automatically selected frames from (c) non-neoplastic esopha-geal site (Video 3) and (d) neoplastic esophageal site (Video 4). (Video 3: QuickTime, 1.5 MB [URL: http://dx.doi.org/10.1117/1.JBO.20.4.046014.3]. Video 4: QuickTime, 1.6 MB [URL: http://dx.doi.org/10.1117/1.JBO.20.4.046014.4]. Scale bar ¼ 100 μm).
Journal of Biomedical Optics 046014-4 April 2015 • Vol. 20(4)
Ishijima et al.: Automated frame selection process for high-resolution microendoscopy
Downloaded From: http://biomedicaloptics.spiedigitallibrary.org/ on 06/13/2016 Terms of Use: http://spiedigitallibrary.org/ss/TermsOfUse.aspx
Step 2: Identify the frame which has the largest number offeature points. This single frame is used as the represen-tative frame for the video sequence.
6 ExperimentsThe automated frame selection algorithm was implementedusing MATLAB software (MathWorks, Inc., Natick,Massachusetts). The algorithm was applied to select a singlerepresentative frame from each video in a series of videosacquired in two clinical studies. Results of the automatedprocess were compared to manual frame selection by a trainedobserver. The purpose of the evaluation was to investigatethe similarity of manually and automatically selected framesfrom the video sequences in the data set. We compared thevalues of features extracted from frames selected manually and
automatically and compared the performance of diagnostic clas-sification algorithms based on these features.
6.1 Patient Data
The performance of the automated frame selection algorithmwas evaluated using two high-resolution microendoscopydata sets that have been previously analyzed and reportedusing manual frame selection.8,28 In these studies, a representa-tive frame from a given video sequence was selected by anobserver blinded to clinical impression and pathologic diagno-sis, based on subjective evaluation of image quality and the pres-ence/absence of motion artifact. The first data set consists ofvideo sequences collected in vivo from 100 oral sites in 30patients under an institutional review board (IRB)-approvedprotocol at the University of Texas M. D. Anderson CancerCenter.28 The second data set consists of video sequences col-lected in vivo from 167 esophageal sites in 78 patients under anIRB-approved protocol at the Cancer Institute at the ChineseAcademy of Medical Sciences.8 Within each data set, theimage features and classification results obtained using thenew automated frame selection algorithm were compared tothe image features and classification results obtained previouslyusing manual frame selection.
The composition of the oral data set is summarized inTable 1. Of the 100 oral sites, 45 were non-neoplastic and 55were neoplastic by histopathology (the gold standard). Milddysplasia was grouped in the neoplastic category in accordancewith the convention used in the original analysis.28
The composition of the esophageal data set is summarized inTable 2. Of the 167 esophageal sites, 148 were non-neoplasticand 19 were neoplastic by histopathology (the gold standard).Low-grade dysplasia was grouped in the non-neoplastic cat-egory in accordance with the convention used in the originalanalysis.8
6.2 Quantitative Parameter Analysis
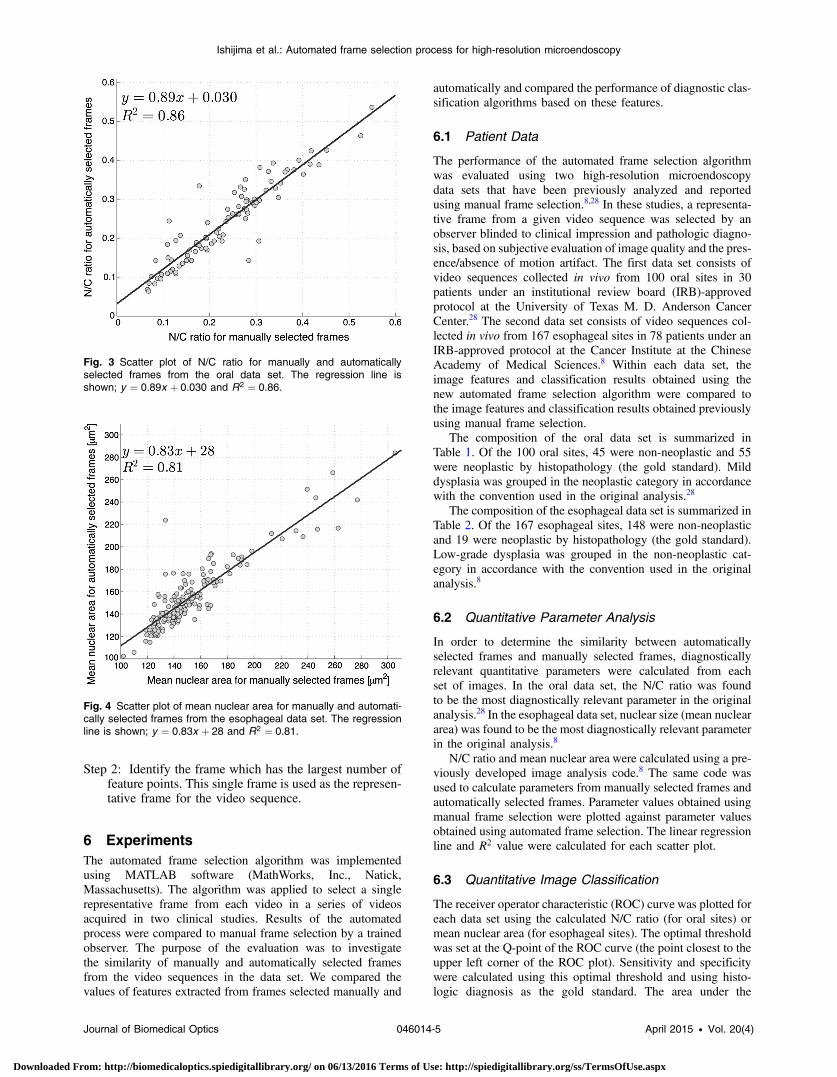
In order to determine the similarity between automaticallyselected frames and manually selected frames, diagnosticallyrelevant quantitative parameters were calculated from eachset of images. In the oral data set, the N/C ratio was foundto be the most diagnostically relevant parameter in the originalanalysis.28 In the esophageal data set, nuclear size (mean nucleararea) was found to be the most diagnostically relevant parameterin the original analysis.8
N/C ratio and mean nuclear area were calculated using a pre-viously developed image analysis code.8 The same code wasused to calculate parameters from manually selected frames andautomatically selected frames. Parameter values obtained usingmanual frame selection were plotted against parameter valuesobtained using automated frame selection. The linear regressionline and R2 value were calculated for each scatter plot.
6.3 Quantitative Image Classification
The receiver operator characteristic (ROC) curve was plotted foreach data set using the calculated N/C ratio (for oral sites) ormean nuclear area (for esophageal sites). The optimal thresholdwas set at the Q-point of the ROC curve (the point closest to theupper left corner of the ROC plot). Sensitivity and specificitywere calculated using this optimal threshold and using histo-logic diagnosis as the gold standard. The area under the
Fig. 3 Scatter plot of N/C ratio for manually and automaticallyselected frames from the oral data set. The regression line isshown; y ¼ 0.89x þ 0.030 and R2 ¼ 0.86.
Fig. 4 Scatter plot of mean nuclear area for manually and automati-cally selected frames from the esophageal data set. The regressionline is shown; y ¼ 0.83x þ 28 and R2 ¼ 0.81.
Journal of Biomedical Optics 046014-5 April 2015 • Vol. 20(4)
Ishijima et al.: Automated frame selection process for high-resolution microendoscopy
Downloaded From: http://biomedicaloptics.spiedigitallibrary.org/ on 06/13/2016 Terms of Use: http://spiedigitallibrary.org/ss/TermsOfUse.aspx
ROC curve (AUC) was calculated for each data set, usingmanual frame selection and using automated frame selection.
7 ResultsThe frame selection procedure was fully automated. The timerequired for automated frame selection was ∼1 s∕frame in theoriginal video sequence.
Examples of high-resolution microendoscopy video sequen-ces from the oral data set are shown in Video 1 and Video 2.Video 1 shows a non-neoplastic oral site and Video 2 shows aneoplastic oral site. Manually selected frames from Video 1 andVideo 2 are shown in Figs. 1(a) and 1(b). Automatically selectedframes fromVideo 1 andVideo 2 are shown in Figs. 1(c) and 1(d).
Examples of high-resolution microendoscopy video sequen-ces from the esophageal data set are shown in Video 3 andVideo 4. Video 3 shows a non-neoplastic esophageal site andVideo 4 shows a neoplastic esophageal site. Manually selectedframes from Video 3 and Video 4 are shown in Figs. 2(a) and2(b). Automatically selected frames from Video 3 and Video 4are shown in Figs. 2(c) and 2(d).
7.1 Quantitative Parameter Analysis
We compared two quantitative parameters extracted from man-ually and automatically selected frames: N/C ratio (for oral sites)and mean nuclear area (for esophageal sites). Results are shown
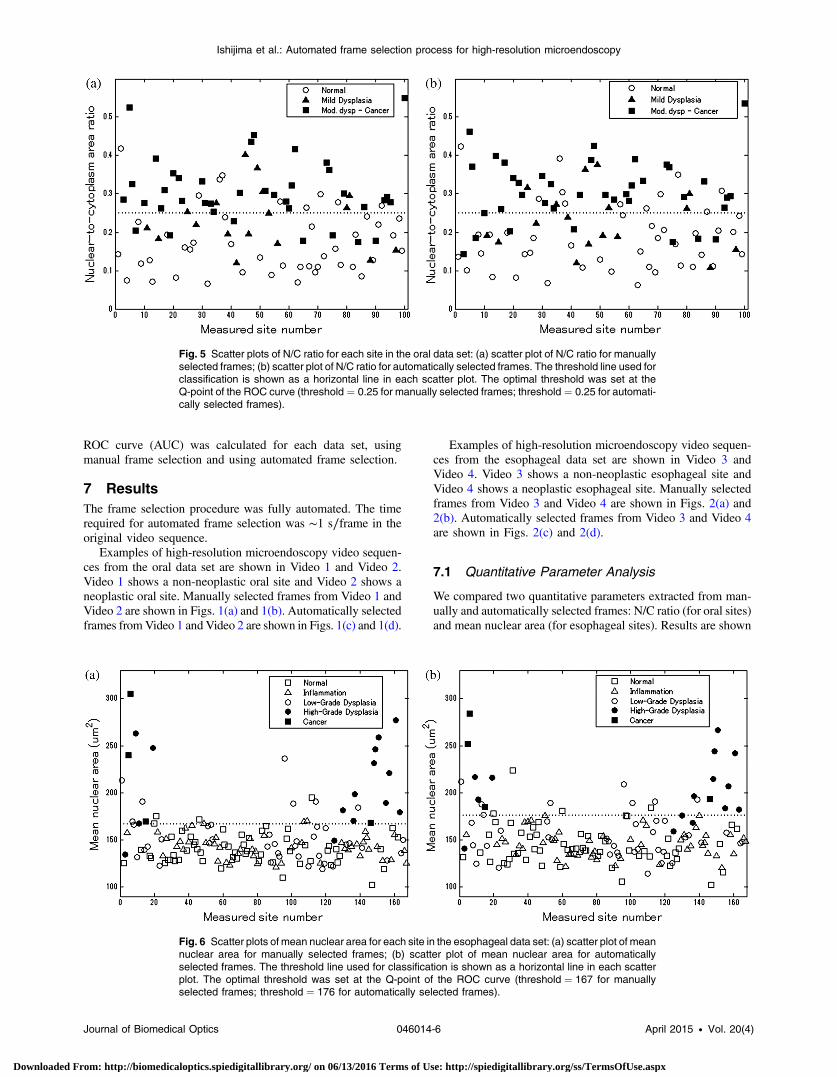
Fig. 6 Scatter plots of mean nuclear area for each site in the esophageal data set: (a) scatter plot of meannuclear area for manually selected frames; (b) scatter plot of mean nuclear area for automaticallyselected frames. The threshold line used for classification is shown as a horizontal line in each scatterplot. The optimal threshold was set at the Q-point of the ROC curve (threshold ¼ 167 for manuallyselected frames; threshold ¼ 176 for automatically selected frames).
Fig. 5 Scatter plots of N/C ratio for each site in the oral data set: (a) scatter plot of N/C ratio for manuallyselected frames; (b) scatter plot of N/C ratio for automatically selected frames. The threshold line used forclassification is shown as a horizontal line in each scatter plot. The optimal threshold was set at theQ-point of the ROC curve (threshold ¼ 0.25 for manually selected frames; threshold ¼ 0.25 for automati-cally selected frames).
Journal of Biomedical Optics 046014-6 April 2015 • Vol. 20(4)
Ishijima et al.: Automated frame selection process for high-resolution microendoscopy
Downloaded From: http://biomedicaloptics.spiedigitallibrary.org/ on 06/13/2016 Terms of Use: http://spiedigitallibrary.org/ss/TermsOfUse.aspx
in Figs. 3 and 4 for the oral data set and the esophageal data set,respectively.
7.2 Quantitative Image Classification
Figure 5 depicts the scatter plots of the N/C ratio for each site inthe oral data set. Figure 5(a) is a scatter plot of the N/C ratio formanually selected frames and Fig. 5(b) is a scatter plot of theN/C ratio for automatically selected frames. All 100 measure-ment sites were grouped into three pathology categories inaccordance with the original analysis.28 The threshold line setat the Q-point of the ROC curve for classification is shown asa horizontal line in each scatter plot.
Figure 6 depicts the scatter plots of mean nuclear area foreach site in the esophageal data set. Figure 6(a) is a scatterplot of the mean nuclear area for manually selected framesand Fig. 6(b) is a scatter plot of the mean nuclear area forautomatically selected frames. All 167 measurement sites weregrouped into five pathology categories in accordance with theoriginal analysis.8 The threshold line set at the Q-point of theROC curve for classification is shown as a horizontal line ineach scatter plot.
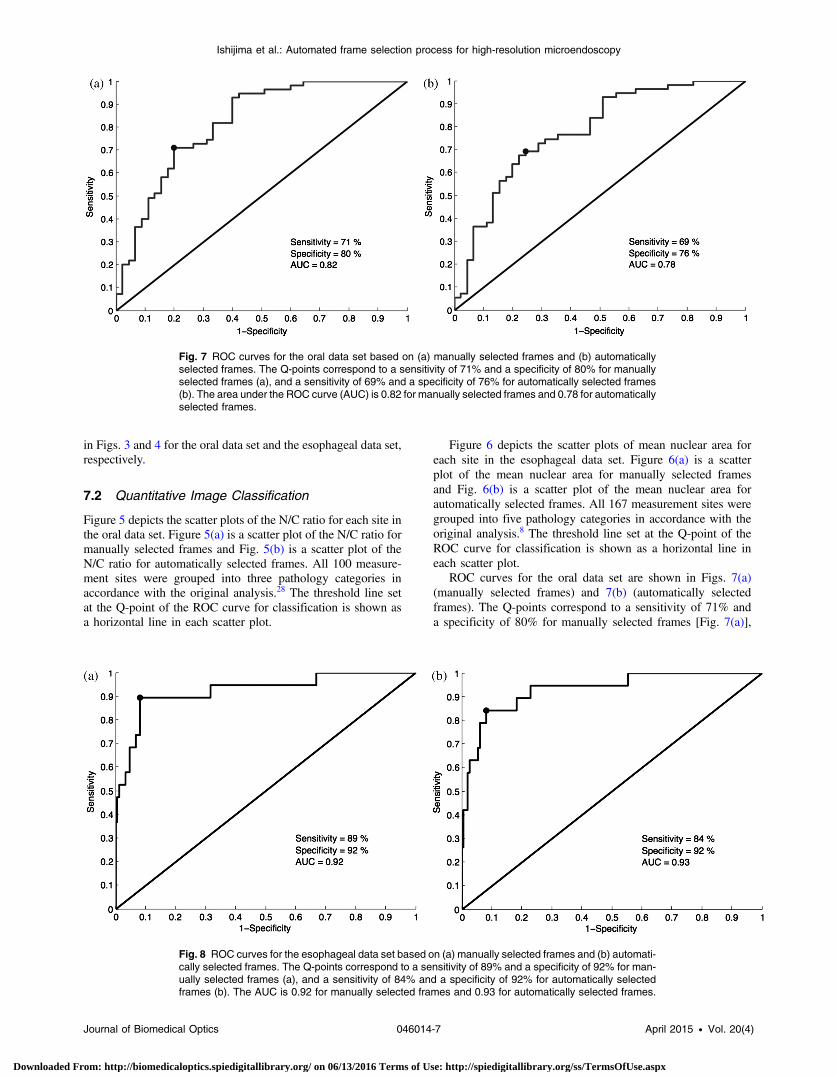
ROC curves for the oral data set are shown in Figs. 7(a)(manually selected frames) and 7(b) (automatically selectedframes). The Q-points correspond to a sensitivity of 71% anda specificity of 80% for manually selected frames [Fig. 7(a)],
Fig. 7 ROC curves for the oral data set based on (a) manually selected frames and (b) automaticallyselected frames. The Q-points correspond to a sensitivity of 71% and a specificity of 80% for manuallyselected frames (a), and a sensitivity of 69% and a specificity of 76% for automatically selected frames(b). The area under the ROC curve (AUC) is 0.82 for manually selected frames and 0.78 for automaticallyselected frames.
Fig. 8 ROC curves for the esophageal data set based on (a) manually selected frames and (b) automati-cally selected frames. The Q-points correspond to a sensitivity of 89% and a specificity of 92% for man-ually selected frames (a), and a sensitivity of 84% and a specificity of 92% for automatically selectedframes (b). The AUC is 0.92 for manually selected frames and 0.93 for automatically selected frames.
Journal of Biomedical Optics 046014-7 April 2015 • Vol. 20(4)
Ishijima et al.: Automated frame selection process for high-resolution microendoscopy
Downloaded From: http://biomedicaloptics.spiedigitallibrary.org/ on 06/13/2016 Terms of Use: http://spiedigitallibrary.org/ss/TermsOfUse.aspx
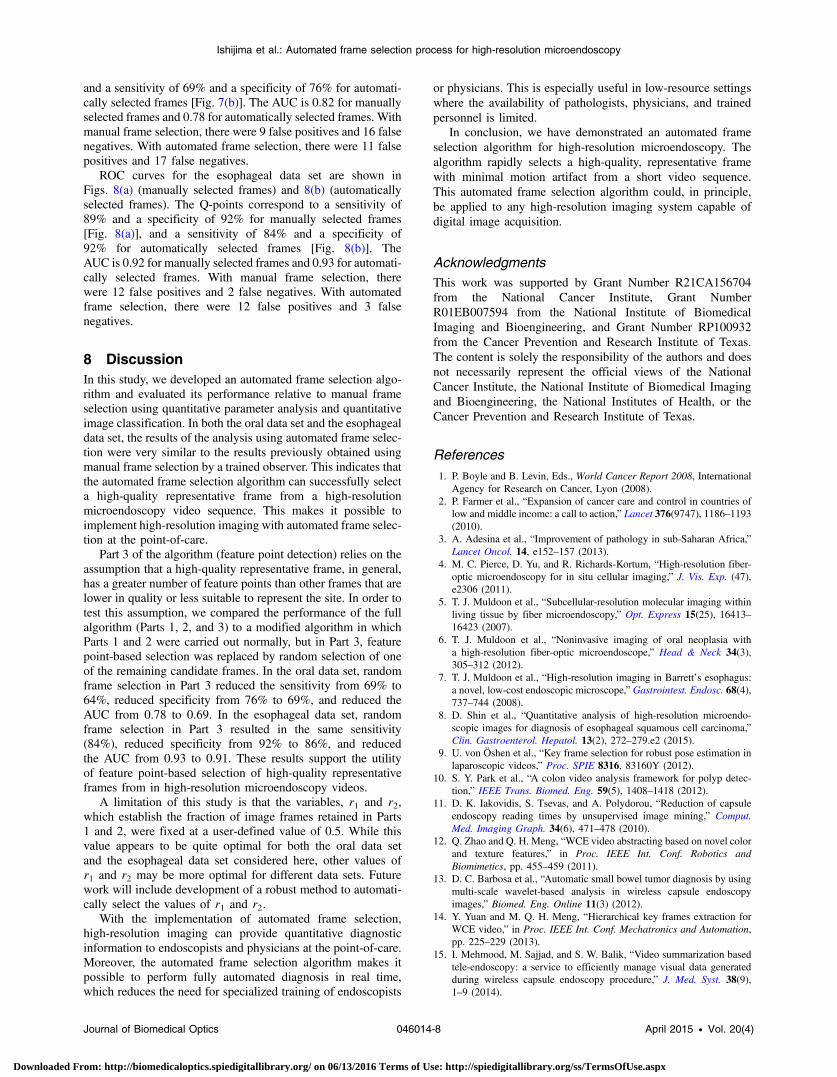
and a sensitivity of 69% and a specificity of 76% for automati-cally selected frames [Fig. 7(b)]. The AUC is 0.82 for manuallyselected frames and 0.78 for automatically selected frames. Withmanual frame selection, there were 9 false positives and 16 falsenegatives. With automated frame selection, there were 11 falsepositives and 17 false negatives.
ROC curves for the esophageal data set are shown inFigs. 8(a) (manually selected frames) and 8(b) (automaticallyselected frames). The Q-points correspond to a sensitivity of89% and a specificity of 92% for manually selected frames[Fig. 8(a)], and a sensitivity of 84% and a specificity of92% for automatically selected frames [Fig. 8(b)]. TheAUC is 0.92 for manually selected frames and 0.93 for automati-cally selected frames. With manual frame selection, therewere 12 false positives and 2 false negatives. With automatedframe selection, there were 12 false positives and 3 falsenegatives.
8 DiscussionIn this study, we developed an automated frame selection algo-rithm and evaluated its performance relative to manual frameselection using quantitative parameter analysis and quantitativeimage classification. In both the oral data set and the esophagealdata set, the results of the analysis using automated frame selec-tion were very similar to the results previously obtained usingmanual frame selection by a trained observer. This indicates thatthe automated frame selection algorithm can successfully selecta high-quality representative frame from a high-resolutionmicroendoscopy video sequence. This makes it possible toimplement high-resolution imaging with automated frame selec-tion at the point-of-care.
Part 3 of the algorithm (feature point detection) relies on theassumption that a high-quality representative frame, in general,has a greater number of feature points than other frames that arelower in quality or less suitable to represent the site. In order totest this assumption, we compared the performance of the fullalgorithm (Parts 1, 2, and 3) to a modified algorithm in whichParts 1 and 2 were carried out normally, but in Part 3, featurepoint-based selection was replaced by random selection of oneof the remaining candidate frames. In the oral data set, randomframe selection in Part 3 reduced the sensitivity from 69% to64%, reduced specificity from 76% to 69%, and reduced theAUC from 0.78 to 0.69. In the esophageal data set, randomframe selection in Part 3 resulted in the same sensitivity(84%), reduced specificity from 92% to 86%, and reducedthe AUC from 0.93 to 0.91. These results support the utilityof feature point-based selection of high-quality representativeframes from in high-resolution microendoscopy videos.
A limitation of this study is that the variables, r1 and r2,which establish the fraction of image frames retained in Parts1 and 2, were fixed at a user-defined value of 0.5. While thisvalue appears to be quite optimal for both the oral data setand the esophageal data set considered here, other values ofr1 and r2 may be more optimal for different data sets. Futurework will include development of a robust method to automati-cally select the values of r1 and r2.
With the implementation of automated frame selection,high-resolution imaging can provide quantitative diagnosticinformation to endoscopists and physicians at the point-of-care.Moreover, the automated frame selection algorithm makes itpossible to perform fully automated diagnosis in real time,which reduces the need for specialized training of endoscopists
or physicians. This is especially useful in low-resource settingswhere the availability of pathologists, physicians, and trainedpersonnel is limited.
In conclusion, we have demonstrated an automated frameselection algorithm for high-resolution microendoscopy. Thealgorithm rapidly selects a high-quality, representative framewith minimal motion artifact from a short video sequence.This automated frame selection algorithm could, in principle,be applied to any high-resolution imaging system capable ofdigital image acquisition.
AcknowledgmentsThis work was supported by Grant Number R21CA156704from the National Cancer Institute, Grant NumberR01EB007594 from the National Institute of BiomedicalImaging and Bioengineering, and Grant Number RP100932from the Cancer Prevention and Research Institute of Texas.The content is solely the responsibility of the authors and doesnot necessarily represent the official views of the NationalCancer Institute, the National Institute of Biomedical Imagingand Bioengineering, the National Institutes of Health, or theCancer Prevention and Research Institute of Texas.
References1. P. Boyle and B. Levin, Eds., World Cancer Report 2008, International
Agency for Research on Cancer, Lyon (2008).2. P. Farmer et al., “Expansion of cancer care and control in countries of
low and middle income: a call to action,” Lancet 376(9747), 1186–1193(2010).
3. A. Adesina et al., “Improvement of pathology in sub-Saharan Africa,”Lancet Oncol. 14, e152–157 (2013).
4. M. C. Pierce, D. Yu, and R. Richards-Kortum, “High-resolution fiber-optic microendoscopy for in situ cellular imaging,” J. Vis. Exp. (47),e2306 (2011).
5. T. J. Muldoon et al., “Subcellular-resolution molecular imaging withinliving tissue by fiber microendoscopy,” Opt. Express 15(25), 16413–16423 (2007).
6. T. J. Muldoon et al., “Noninvasive imaging of oral neoplasia witha high-resolution fiber-optic microendoscope,” Head & Neck 34(3),305–312 (2012).
7. T. J. Muldoon et al., “High-resolution imaging in Barrett’s esophagus:a novel, low-cost endoscopic microscope,” Gastrointest. Endosc. 68(4),737–744 (2008).
8. D. Shin et al., “Quantitative analysis of high-resolution microendo-scopic images for diagnosis of esophageal squamous cell carcinoma,”Clin. Gastroenterol. Hepatol. 13(2), 272–279.e2 (2015).
9. U. von Öshen et al., “Key frame selection for robust pose estimation inlaparoscopic videos,” Proc. SPIE 8316, 83160Y (2012).
10. S. Y. Park et al., “A colon video analysis framework for polyp detec-tion,” IEEE Trans. Biomed. Eng. 59(5), 1408–1418 (2012).
11. D. K. Iakovidis, S. Tsevas, and A. Polydorou, “Reduction of capsuleendoscopy reading times by unsupervised image mining,” Comput.Med. Imaging Graph. 34(6), 471–478 (2010).
12. Q. Zhao and Q. H. Meng, “WCE video abstracting based on novel colorand texture features,” in Proc. IEEE Int. Conf. Robotics andBiomimetics, pp. 455–459 (2011).
13. D. C. Barbosa et al., “Automatic small bowel tumor diagnosis by usingmulti-scale wavelet-based analysis in wireless capsule endoscopyimages,” Biomed. Eng. Online 11(3) (2012).
14. Y. Yuan and M. Q. H. Meng, “Hierarchical key frames extraction forWCE video,” in Proc. IEEE Int. Conf. Mechatronics and Automation,pp. 225–229 (2013).
15. I. Mehmood, M. Sajjad, and S. W. Balik, “Video summarization basedtele-endoscopy: a service to efficiently manage visual data generatedduring wireless capsule endoscopy procedure,” J. Med. Syst. 38(9),1–9 (2014).
Journal of Biomedical Optics 046014-8 April 2015 • Vol. 20(4)
Ishijima et al.: Automated frame selection process for high-resolution microendoscopy
Downloaded From: http://biomedicaloptics.spiedigitallibrary.org/ on 06/13/2016 Terms of Use: http://spiedigitallibrary.org/ss/TermsOfUse.aspx

16. T. D. Soper, M. P. Porter, and E. J. Seibel, “Surface mosaics of the blad-der reconstructed from endoscopic video for automated surveillance,”IEEE Trans. Biomed. Eng. 59(6), 1670–1680 (2012).
17. T. Syeda-Mahmood et al., “Automatic selection of keyframes fromangiogram videos,” in Proc. IEEE Int. Conf. Pattern Recognition,pp. 4008–4011 (2010).
18. P. D. Byrnes and W. E. Higgins, “Construction of a multimodalCT-video chest model,” Proc. SPIE 9036, 903607 (2014).
19. C.-F. J. Kuo et al., “Using image processing technology and mathemati-cal algorithm in the automatic selection of vocal cord opening andclosing images from the larynx endoscopy video,” Comput. MethodsPrograms Biomed. 112(3), 455–465 (2013).
20. E. Poletti, G. Benedetti, and A. Ruggeri, “Super-image mosaic of infantretinal fundus: selection and registration of the best-quality frames fromvideos,” in Proc. IEEE 35th Annual Int. Conf. on Engineering inMedicine and Biology Society, pp. 5883–5886 (2013).
21. A. L. Smeaton, P. Over, and A. R. Doherty, “Video shot boundary detec-tion: Seven years of TRECVid activity,” Comput. Vision Image Underst.114(4), 411–418 (2010).
22. C. Kim and J.-N. Hwang, “Object-based video abstraction for videosurveillance systems,” IEEE Trans. Circuits Syst. Video Technol.12(12), 1128–1138 (2002).
23. X.-D. Zhang et al., “Dynamic selection and effective compression ofkey frames for video abstraction,” Pattern Recognit. Lett. 24(9),1523–1532 (2003).
24. D.-Y. Tsai, Y. Lee, and E. Matsuyama, “Information entropy measure forevaluation of image quality,” J. Digital Imaging 21(3), 338–347 (2008).
25. S. Srivastava et al., “Computer-aided identification of ovarian cancer inconfocal microendoscope images,” J. Biomed. Opt. 13(2), 024021(2008).
26. L. Firestone et al., “Comparison of autofocus methods for automatedmicroscopy,” Cytometry 12, 195–206 (1991).
27. H. Bay et al., “Speeded-up robust features (surf),” Comput. VisionImage Underst. 110(3), 346–359 (2008).
28. M. C. Pierce et al., “Accuracy of in vivo multimodal imaging for detec-tion of oral neoplasia,” Cancer Prevent. Res. 5(6), 801–809 (2012).
Biographies of the authors are not available.
Journal of Biomedical Optics 046014-9 April 2015 • Vol. 20(4)
Ishijima et al.: Automated frame selection process for high-resolution microendoscopy
Downloaded From: http://biomedicaloptics.spiedigitallibrary.org/ on 06/13/2016 Terms of Use: http://spiedigitallibrary.org/ss/TermsOfUse.aspx
Related Documents