Received December 4, 2019, accepted December 21, 2019, date of publication December 31, 2019, date of current version January 14, 2020. Digital Object Identifier 10.1109/ACCESS.2019.2963213 Automated Extraction of Human Settlement Patterns From Historical Topographic Map Series Using Weakly Supervised Convolutional Neural Networks JOHANNES H. UHL 1,4 , STEFAN LEYK 1,4 , YAO-YI CHIANG 2 , WEIWEI DUAN 2 , AND CRAIG A. KNOBLOCK 2,3 , (Senior Member, IEEE) 1 Department of Geography, University of Colorado Boulder, Boulder, CO 80309, USA 2 Spatial Sciences Institute, University of Southern California, Los Angeles, CA 90089, USA 3 Information Sciences Institute, University of Southern California, Marina del Rey, CA 90292, USA 4 Institute of Behavioral Science, University of Colorado Boulder, Boulder, CO 80309, USA Corresponding author: Johannes H. Uhl ([email protected]) This work was supported in part by the National Science Foundation through the University of Colorado Boulder under Grant IIS 1563933, in part by the National Science Foundation through the University of Southern California under Grant IIS 1564164. ABSTRACT Information extraction from historical maps represents a persistent challenge due to inferior graphical quality and the large data volume of digital map archives, which can hold thousands of digitized map sheets. Traditional map processing techniques typically rely on manually collected templates of the symbol of interest, and thus are not suitable for large-scale information extraction. In order to digitally preserve such large amounts of valuable retrospective geographic information, high levels of automation are required. Herein, we propose an automated machine-learning based framework to extract human settlement symbols, such as buildings and urban areas from historical topographic maps in the absence of training data, employing contemporary geospatial data as ancillary data to guide the collection of training samples. These samples are then used to train a convolutional neural network for semantic image segmentation, allowing for the extraction of human settlement patterns in an analysis-ready geospatial vector data format. We test our method on United States Geological Survey historical topographic maps published between 1893 and 1954. The results are promising, indicating high degrees of completeness in the extracted settlement features (i.e., recall of up to 0.96, F-measure of up to 0.79) and will guide the next steps to provide a fully automated operational approach for large-scale geographic feature extraction from a variety of historical map series. Moreover, the proposed framework provides a robust approach for the recognition of objects which are small in size, generalizable to many kinds of visual documents. INDEX TERMS Convolutional neural networks, digital humanities, digital preservation, document analysis, geospatial analysis, geospatial artificial intelligence, human settlement patterns, image analysis, weakly supervised learning. I. INTRODUCTION Historical maps constitute unique sources of retrospective geographic information. Recently, several archives contain- ing historical map series covering large spatial and tem- poral extents have been systematically scanned and made available to the public (e.g., [1]–[4]). The spatial-temporal information contained in such archives represents valuable The associate editor coordinating the review of this manuscript and approving it for publication was Andrea F. F. Abate . information for a myriad of scientific applications [5]. To pro- vide this geographic information in analysis-ready geospatial data formats, it needs to be unlocked from scanned maps using adequate recognition and extraction techniques that can handle very large volumes and varieties of complex data and provide a high degree of automation. Thus, traditional topographic map processing techniques based on manually created templates of the cartographic symbols of interest cannot be applied for information extraction from such large archives, holding map content of high levels of heterogeneity. 6978 This work is licensed under a Creative Commons Attribution 4.0 License. For more information, see http://creativecommons.org/licenses/by/4.0/ VOLUME 8, 2020

Welcome message from author
This document is posted to help you gain knowledge. Please leave a comment to let me know what you think about it! Share it to your friends and learn new things together.
Transcript
Received December 4, 2019, accepted December 21, 2019, date of publication December 31, 2019,date of current version January 14, 2020.
Digital Object Identifier 10.1109/ACCESS.2019.2963213
Automated Extraction of Human SettlementPatterns From Historical Topographic MapSeries Using Weakly SupervisedConvolutional Neural NetworksJOHANNES H. UHL 1,4, STEFAN LEYK 1,4, YAO-YI CHIANG 2, WEIWEI DUAN 2,AND CRAIG A. KNOBLOCK 2,3, (Senior Member, IEEE)1Department of Geography, University of Colorado Boulder, Boulder, CO 80309, USA2Spatial Sciences Institute, University of Southern California, Los Angeles, CA 90089, USA3Information Sciences Institute, University of Southern California, Marina del Rey, CA 90292, USA4Institute of Behavioral Science, University of Colorado Boulder, Boulder, CO 80309, USA
Corresponding author: Johannes H. Uhl ([email protected])
This work was supported in part by the National Science Foundation through the University of Colorado Boulder under Grant IIS 1563933,in part by the National Science Foundation through the University of Southern California under Grant IIS 1564164.
ABSTRACT Information extraction from historical maps represents a persistent challenge due to inferiorgraphical quality and the large data volume of digital map archives, which can hold thousands of digitizedmap sheets. Traditional map processing techniques typically rely on manually collected templates of thesymbol of interest, and thus are not suitable for large-scale information extraction. In order to digitallypreserve such large amounts of valuable retrospective geographic information, high levels of automation arerequired. Herein, we propose an automated machine-learning based framework to extract human settlementsymbols, such as buildings and urban areas from historical topographic maps in the absence of training data,employing contemporary geospatial data as ancillary data to guide the collection of training samples. Thesesamples are then used to train a convolutional neural network for semantic image segmentation, allowingfor the extraction of human settlement patterns in an analysis-ready geospatial vector data format. We testour method on United States Geological Survey historical topographic maps published between 1893 and1954. The results are promising, indicating high degrees of completeness in the extracted settlement features(i.e., recall of up to 0.96, F-measure of up to 0.79) and will guide the next steps to provide a fully automatedoperational approach for large-scale geographic feature extraction from a variety of historical map series.Moreover, the proposed framework provides a robust approach for the recognition of objects which are smallin size, generalizable to many kinds of visual documents.
INDEX TERMS Convolutional neural networks, digital humanities, digital preservation, document analysis,geospatial analysis, geospatial artificial intelligence, human settlement patterns, image analysis, weaklysupervised learning.
I. INTRODUCTIONHistorical maps constitute unique sources of retrospectivegeographic information. Recently, several archives contain-ing historical map series covering large spatial and tem-poral extents have been systematically scanned and madeavailable to the public (e.g., [1]–[4]). The spatial-temporalinformation contained in such archives represents valuable
The associate editor coordinating the review of this manuscript and
approving it for publication was Andrea F. F. Abate .
information for amyriad of scientific applications [5]. To pro-vide this geographic information in analysis-ready geospatialdata formats, it needs to be unlocked from scanned mapsusing adequate recognition and extraction techniques thatcan handle very large volumes and varieties of complex dataand provide a high degree of automation. Thus, traditionaltopographic map processing techniques based on manuallycreated templates of the cartographic symbols of interestcannot be applied for information extraction from such largearchives, holding map content of high levels of heterogeneity.
6978 This work is licensed under a Creative Commons Attribution 4.0 License. For more information, see http://creativecommons.org/licenses/by/4.0/ VOLUME 8, 2020
J. H. Uhl et al.: Automated Extraction of Human Settlement Patterns
The renaissance of convolutional neural networks (CNNs)and the increasing use of other machine learning methods forrecognition tasks in computer vision have catalyzed the appli-cation of such frameworks for information extraction tasksin the geospatial sciences [6]. In recent years, CNN-basedapproaches for object detection, scene classification, andsemantic segmentation have been applied to remotely sensedgeospatial data and have shown promising results that out-perform traditional methods [7]. This indicates the potentialof applying CNN-based semantic segmentation methods forinformation extraction from historical maps as well. How-ever, encoder-decoder CNNs (e.g., [8]–[11]), which performsemantic segmentation at a fine level of spatial granularity(i.e., at the pixel level), require large amounts of pixel-leveltraining data. While in remote sensing applications suchpixel-level training labels can be generated efficiently, usingancillary spatial data such as land cover data [12], in the caseof historical maps, it is more difficult. Often, spatial offsetsbetween geographic features of interest in the map and theancillary data are caused by inaccurate georeferencing, mapdistortions, map design or scale-induced displacements andimpede the straight-forward generation of pixel-level train-ing labels by overlaying the georeferenced map with ancil-lary data directly using their geocoordinates and projectionmetadata. In such cases, weakly supervised learning can beapplied. Weak supervision refers to supervised learning whenthe granularity of annotations used for training is coarserthan the granularity of the predicted annotations [13]. Thisis typically the case when pixel-level semantic segmentationis desired, but the location of the feature1 of interest in thetraining data can only be determined approximately, e.g.,within a certain spatial range.
In image processing, weakly supervised learning, forexample, consists of the training of a CNN for image classifi-cation, i.e., learning image patch level annotations, indicatingthe presence of the object of interest somewhere within animage patch, and subsequent spatially dense inferences basedon sliding windows, allowing for pixel-level labelling, typi-cally of the center pixel in each sliding window. The resultis a semantically segmented output image (see [14]–[16] forsome examples). Thus, weakly supervised learning poten-tially allows for pixel-level semantic segmentation, in caseswhen the location of salient features for training can only bedetermined approximately, e.g., within a subset or patch ofthe image. However, such weakly supervised segmentationapproaches may result in a loss of spatial detail due to hetero-geneous image content and the translation invariance propertyof CNNs, as previous work has demonstrated [17], [18].
Thus, in order to successfully apply a CNN-based semanticsegmentation framework for information extraction from his-torical maps, such a framework needs to 1) reliably and auto-matically generate sufficiently large amounts of training dataand labels for the recognition of geographic features from
1Herein, the term ‘‘feature’’ is used for geographic features, i.e., the spatialobjects depicted in topographic maps.
historical maps, and 2) allow for the extraction of geographicfeatures at sufficiently fine spatial granularity.
In this paper, we present and evaluate an improvedapproach for the extraction of human settlement features(i.e., building locations and urban area delineations), usingpublicly available (i.e., down-sampled), early United StatesGeological Survey (USGS) historical topographic maps pub-lished between 1893 and 1949. The proposed method aimsto provide a framework for automated, weakly supervisedCNN-based feature extraction from historical maps at finespatial granularity without the availability of pixel-level train-ing labels. To overcome the absence of training data, the pro-posed framework employs ancillary spatial data to automat-ically collect training data. Locational settlement informa-tion given in the ancillary data enables to spatially con-strain the regions in which objects of interest can be foundand allows for automated sampling of a map underlyingthe ancillary locations by cropping the map image at thoselocations.
However, potential spatial and temporal offsets betweenmap content and ancillary spatial data may result in collectedsamples being a) not centered at the object of interest (e.g., ata building symbol), or b) being annotated with an erroneouslabel (e.g., labelled as ‘‘building’’ where the map does notcontain a building symbol). These effects are mitigated by ahierarchical, spatially-stratified random sampling scheme incombination with image processing techniques and featuredetection and description methods to obtain reliable trainingsamples centered at the object of interest.
The generated training data consist of small samples ofeach training map (‘‘map patches’’) found in proximity ofthe ancillary locations, cropped around the objects of interest,and corresponding labels describing their content accordingto a given classification scheme. We then employ these datato train CNNs commonly used for image classification, whichwe use for subsequent semantic segmentation in a weaklysupervised manner. The previous centering of the trainingpatches to the likely location of the objects of interest reducesthe loss of spatial granularity when these weakly super-vised CNNs are employed for dense, pixel-level inferences toextract human settlement features at fine spatial resolution.Moreover, the proposed method represents a generalizablestrategy for the recognition of small objects from visualdocuments in general.
II. BACKGROUNDA. MAP PROCESSINGMap processing, a branch of document analysis, focuseson developing methods for the extraction and recognitionof information in scanned map documents such as printedengineering drawings, floor plans, cadastral and topographicmaps published prior to the era of digital cartography andsystematic earth observation. It combines elements of com-puter vision, pattern recognition, geographic information sci-ence, cartography, and geoinformatics. The main goal ofmap processing is to unlock spatial information from those
VOLUME 8, 2020 6979
J. H. Uhl et al.: Automated Extraction of Human Settlement Patterns
(mainly historical) scanned map documents, to provide thisinformation in digital, machine-readable data formats andthus to preserve the data digitally, facilitating their usefor analytical purposes [5]. The application of recogni-tion methods to map documents often faces specific chal-lenges compared to traditional document analysis due tolow graphical quality and complex, human-made map con-tent (e.g., overlapping cartographic symbols) [19]. Exam-ple applications of map processing include the extraction ofbuildings [20]–[22], residential areas [23], road networks [24]contour lines [25], [26], composite forest symbols [27], text[28] as well as the digitization of cadastral maps [29]. Suc-cessful map processing requires georeferencing ([30]–[35])and the alignment of georeferenced maps and ancillary spa-tial data ([36], [37], see [5], [38] for detailed overviews).Three recent developments are currently changing thefield of map processing: 1) An increasing availability oflarge amounts of scanned, often georeferenced historicalmaps [39], 2) advances in computer-vision based informationextraction using (deep) machine learning [40], and 3) increas-ing availability of digital geospatial data [41] that can be usedas ancillary data to support symbol sample collection.
B. DIGITAL HISTORICAL MAP ARCHIVESThere is an increased availability of large map collec-tions holding thousands of map documents as digital andgeoreferenced archives hosted by map agencies includingthe USGS topographic map archive, holding approximately200,000 topographic maps published between 1884 and2006 [1], the Sanborn fire insurance map collection whichcontains approximately 700,000 sheets of large-scale mapsof approximately 12,000 cities and towns within the U.S.,Canada, Mexico, and Cuba published since 1867 [2],the United Kingdom topographic map archive (>200, 000maps, dating back to the 1840s [3], or the historical maparchive of Switzerland (approximately 52,000 maps dat-ing back to 1844 [4]. Moreover, several digital map col-lections2345 and data infrastructure efforts [42] have beenestablished. Given this vast amount of valuable historicalinformation, there is an urgent demand to preserve map con-tents through efficient information extraction while reducingor eliminating user interaction.
C. CURRENT TRENDS IN HISTORICAL MAP PROCESSINGDeep-learning-based models such as convolutional neu-ral networks (CNNs) have revolutionized many scientificfields and offer great potential for numerous applicationsin the geospatial sector, such as map processing [43]. Suchefforts include the use of deep learning and data min-ing for automated map georeferencing [44], [45], for textrecognition [46], for the extraction of road intersections [47],
2David Rumsey Map Collection: https://www.davidrumsey.com3Mapire: https://mapire.eu4Old maps online: https://www.oldmapsonline.org5Pahar - the Mountains of Central Asia Digital Dataset: http://pahar.in
or for map archive content exploration [48], [49]. Further-more, training and benchmark datasets tailored to informationextraction from scannedmaps or plans have increasingly beenmade available to the public [49]–[51]. Several contributionspropose the use of advancedmachine learning for informationextraction from map documents including topographic maps[52]–[54], cadastral maps [55], [56] or floor plans [57]. Theneed for large amounts of training data can be overcomeby using crowdsourcing [58] or by employing (contempo-rary) ancillary spatial data [59]–[64]. For example, the useof building footprint data, cadastral parcel data and othersettlement-related geospatial databases has proven useful forthe extraction of human settlement features from historicaltopographic maps [17], [18].
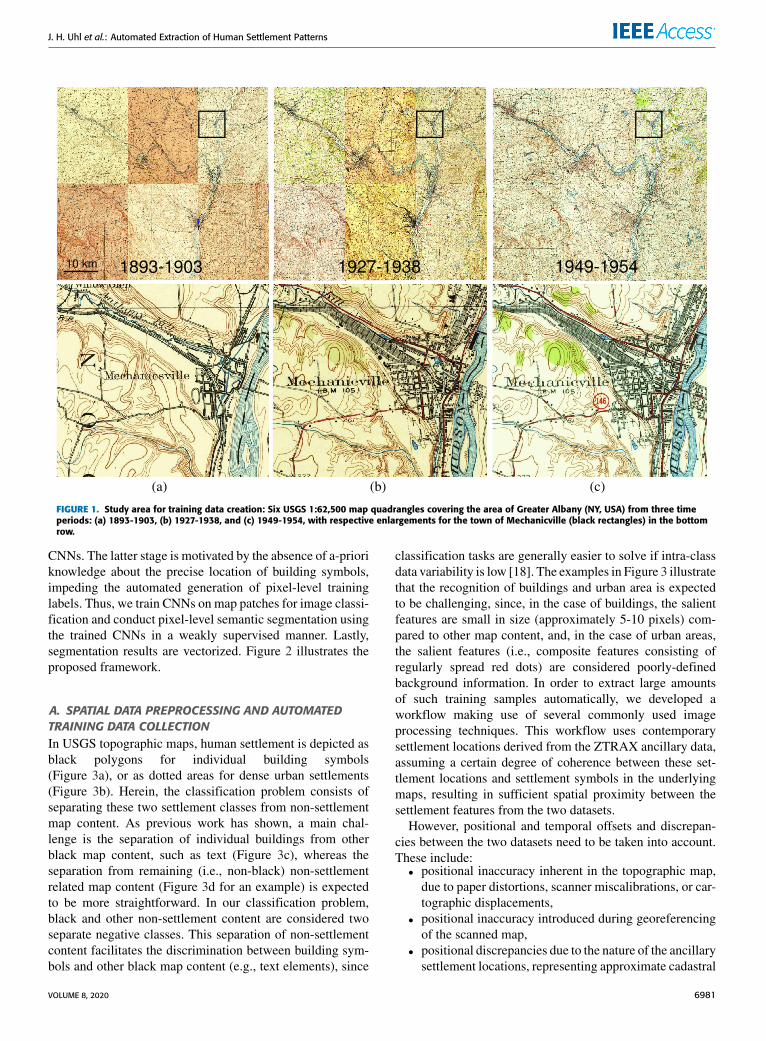
III. DATAThe experiment in this study is based on USGS topographicmaps, publicly available through the USGS TopoView webapplication6, at a spatial resolution of approximately 5× 5m,downsampled from original scans by an approximate factorof 5. More specifically, we choose 18 map sheets of scale1:62,500, organized in six adjacent map quadrangles cover-ing Greater Albany (NY), and three epochs (1893 - 1903,1927 - 1938, and 1949 - 1954) including the earliest edi-tions of available USGS topographic maps. Since the Albanyregion is characterized by relatively early settlements, a highproportion of built-up area can be expected and thus, providesa suitable study area to test extraction methods for earlycartographic products. These 18 maps are shown in Figure 1,including respective enlargements for the town of Mechan-icville (NY).
The ancillary spatial data used for training data collec-tion are settlement locations (i.e., approximate centroids ofbuilt-up cadastral parcels) derived from the ZTRAX (ZillowTransaction and Assessment Dataset) data [65], containingapproximately 230,000 settlement locations in the study areain 2016. Moreover, we use a metadata file from USGS7
to extract quadrangle boundary coordinates for each mapsheet and perform subsequent map sheet edge removal byclipping the georeferenced maps to the respective quadrangleboundaries. Moreover, we employ a set of building and urbanarea outlines manually digitized from selected map sheets(i.e., a total number of approximately 4,700 building outlinesand urban area delineations) to validate the semantic segmen-tation results.
IV. METHODThe method proposed in this study consists of the followingstages: a) spatial data preprocessing and automated train-ing data collection at map patch level for building symbols,urban areas, and non-settlement classes using a hierarchical,spatially stratified random sampling scheme, and b) CNNtraining and semantic segmentation using weakly supervised
6https://ngmdb.usgs.gov/topoview/viewer7https://thor-f5.er.usgs.gov/ngtoc/metadata/misc
6980 VOLUME 8, 2020
J. H. Uhl et al.: Automated Extraction of Human Settlement Patterns
FIGURE 1. Study area for training data creation: Six USGS 1:62,500 map quadrangles covering the area of Greater Albany (NY, USA) from three timeperiods: (a) 1893-1903, (b) 1927-1938, and (c) 1949-1954, with respective enlargements for the town of Mechanicville (black rectangles) in the bottomrow.
CNNs. The latter stage is motivated by the absence of a-prioriknowledge about the precise location of building symbols,impeding the automated generation of pixel-level traininglabels. Thus, we train CNNs on map patches for image classi-fication and conduct pixel-level semantic segmentation usingthe trained CNNs in a weakly supervised manner. Lastly,segmentation results are vectorized. Figure 2 illustrates theproposed framework.
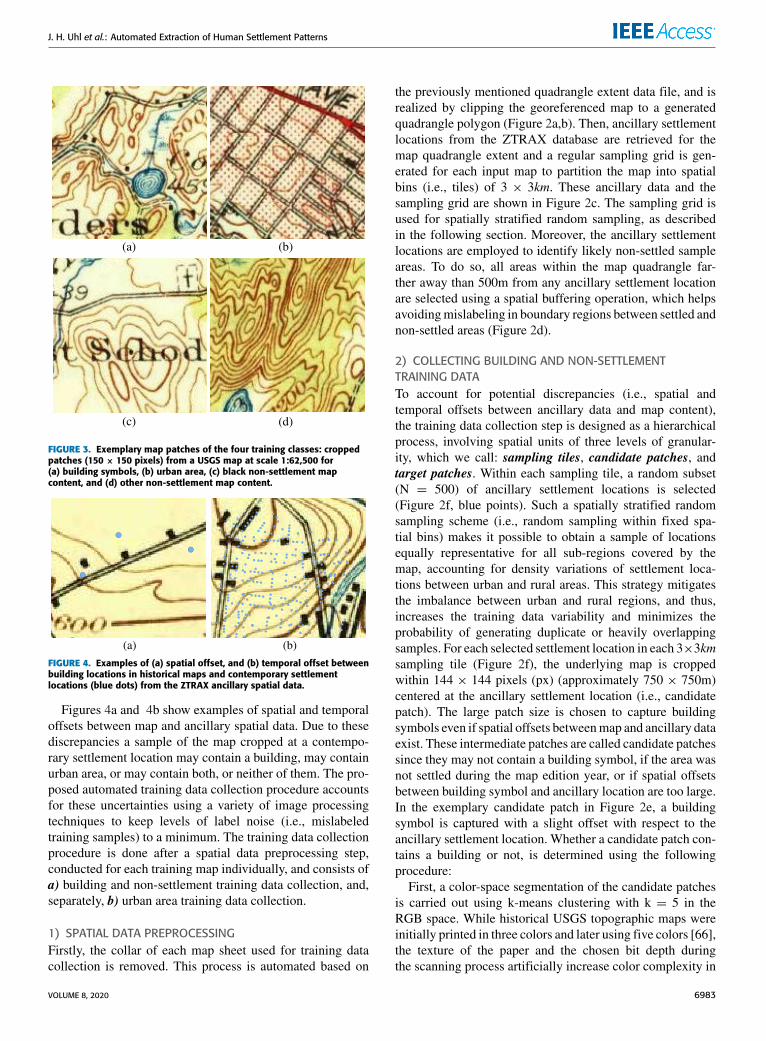
A. SPATIAL DATA PREPROCESSING AND AUTOMATEDTRAINING DATA COLLECTIONIn USGS topographic maps, human settlement is depicted asblack polygons for individual building symbols(Figure 3a), or as dotted areas for dense urban settlements(Figure 3b). Herein, the classification problem consists ofseparating these two settlement classes from non-settlementmap content. As previous work has shown, a main chal-lenge is the separation of individual buildings from otherblack map content, such as text (Figure 3c), whereas theseparation from remaining (i.e., non-black) non-settlementrelated map content (Figure 3d for an example) is expectedto be more straightforward. In our classification problem,black and other non-settlement content are considered twoseparate negative classes. This separation of non-settlementcontent facilitates the discrimination between building sym-bols and other black map content (e.g., text elements), since
classification tasks are generally easier to solve if intra-classdata variability is low [18]. The examples in Figure 3 illustratethat the recognition of buildings and urban area is expectedto be challenging, since, in the case of buildings, the salientfeatures are small in size (approximately 5-10 pixels) com-pared to other map content, and, in the case of urban areas,the salient features (i.e., composite features consisting ofregularly spread red dots) are considered poorly-definedbackground information. In order to extract large amountsof such training samples automatically, we developed aworkflow making use of several commonly used imageprocessing techniques. This workflow uses contemporarysettlement locations derived from the ZTRAX ancillary data,assuming a certain degree of coherence between these set-tlement locations and settlement symbols in the underlyingmaps, resulting in sufficient spatial proximity between thesettlement features from the two datasets.
However, positional and temporal offsets and discrepan-cies between the two datasets need to be taken into account.These include:• positional inaccuracy inherent in the topographic map,due to paper distortions, scanner miscalibrations, or car-tographic displacements,
• positional inaccuracy introduced during georeferencingof the scanned map,
• positional discrepancies due to the nature of the ancillarysettlement locations, representing approximate cadastral
VOLUME 8, 2020 6981
J. H. Uhl et al.: Automated Extraction of Human Settlement Patterns
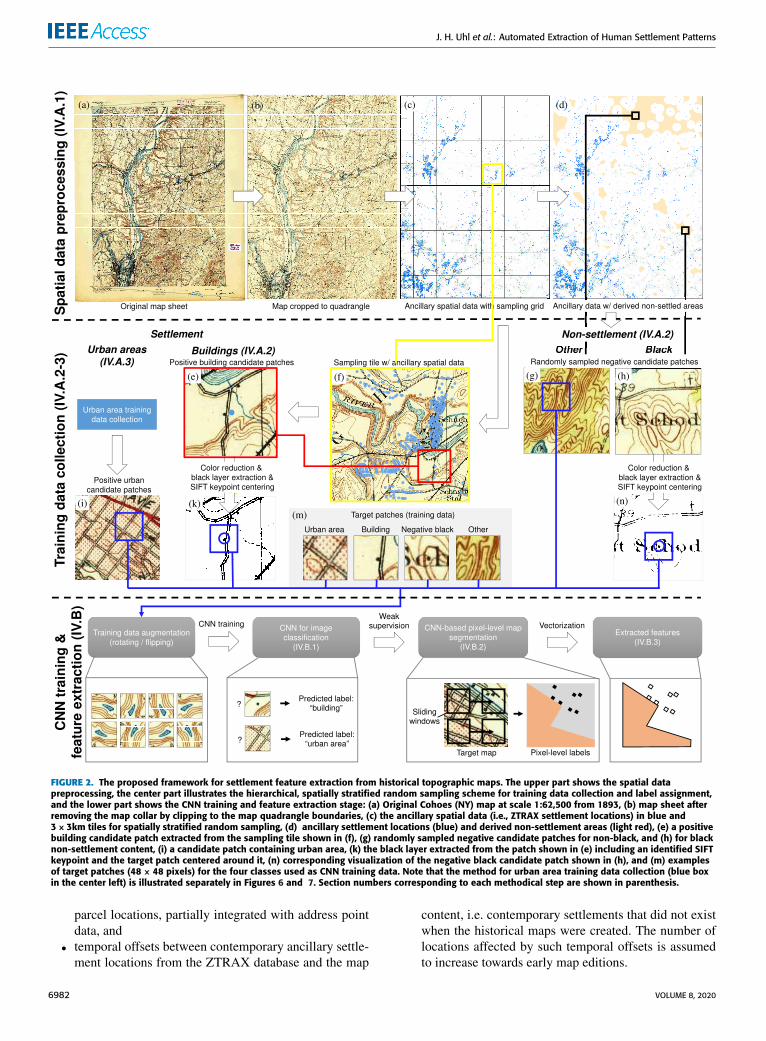
FIGURE 2. The proposed framework for settlement feature extraction from historical topographic maps. The upper part shows the spatial datapreprocessing, the center part illustrates the hierarchical, spatially stratified random sampling scheme for training data collection and label assignment,and the lower part shows the CNN training and feature extraction stage: (a) Original Cohoes (NY) map at scale 1:62,500 from 1893, (b) map sheet afterremoving the map collar by clipping to the map quadrangle boundaries, (c) the ancillary spatial data (i.e., ZTRAX settlement locations) in blue and3 × 3km tiles for spatially stratified random sampling, (d) ancillary settlement locations (blue) and derived non-settlement areas (light red), (e) a positivebuilding candidate patch extracted from the sampling tile shown in (f), (g) randomly sampled negative candidate patches for non-black, and (h) for blacknon-settlement content, (i) a candidate patch containing urban area, (k) the black layer extracted from the patch shown in (e) including an identified SIFTkeypoint and the target patch centered around it, (n) corresponding visualization of the negative black candidate patch shown in (h), and (m) examplesof target patches (48 × 48 pixels) for the four classes used as CNN training data. Note that the method for urban area training data collection (blue boxin the center left) is illustrated separately in Figures 6 and 7. Section numbers corresponding to each methodical step are shown in parenthesis.
parcel locations, partially integrated with address pointdata, and
• temporal offsets between contemporary ancillary settle-ment locations from the ZTRAX database and the map
content, i.e. contemporary settlements that did not existwhen the historical maps were created. The number oflocations affected by such temporal offsets is assumedto increase towards early map editions.
6982 VOLUME 8, 2020
J. H. Uhl et al.: Automated Extraction of Human Settlement Patterns
FIGURE 3. Exemplary map patches of the four training classes: croppedpatches (150 × 150 pixels) from a USGS map at scale 1:62,500 for(a) building symbols, (b) urban area, (c) black non-settlement mapcontent, and (d) other non-settlement map content.
FIGURE 4. Examples of (a) spatial offset, and (b) temporal offset betweenbuilding locations in historical maps and contemporary settlementlocations (blue dots) from the ZTRAX ancillary spatial data.
Figures 4a and 4b show examples of spatial and temporaloffsets between map and ancillary spatial data. Due to thesediscrepancies a sample of the map cropped at a contempo-rary settlement location may contain a building, may containurban area, or may contain both, or neither of them. The pro-posed automated training data collection procedure accountsfor these uncertainties using a variety of image processingtechniques to keep levels of label noise (i.e., mislabeledtraining samples) to a minimum. The training data collectionprocedure is done after a spatial data preprocessing step,conducted for each training map individually, and consists ofa) building and non-settlement training data collection, and,separately, b) urban area training data collection.
1) SPATIAL DATA PREPROCESSINGFirstly, the collar of each map sheet used for training datacollection is removed. This process is automated based on
the previously mentioned quadrangle extent data file, and isrealized by clipping the georeferenced map to a generatedquadrangle polygon (Figure 2a,b). Then, ancillary settlementlocations from the ZTRAX database are retrieved for themap quadrangle extent and a regular sampling grid is gen-erated for each input map to partition the map into spatialbins (i.e., tiles) of 3 × 3km. These ancillary data and thesampling grid are shown in Figure 2c. The sampling grid isused for spatially stratified random sampling, as describedin the following section. Moreover, the ancillary settlementlocations are employed to identify likely non-settled sampleareas. To do so, all areas within the map quadrangle far-ther away than 500m from any ancillary settlement locationare selected using a spatial buffering operation, which helpsavoidingmislabeling in boundary regions between settled andnon-settled areas (Figure 2d).
2) COLLECTING BUILDING AND NON-SETTLEMENTTRAINING DATATo account for potential discrepancies (i.e., spatial andtemporal offsets between ancillary data and map content),the training data collection step is designed as a hierarchicalprocess, involving spatial units of three levels of granular-ity, which we call: sampling tiles, candidate patches, andtarget patches. Within each sampling tile, a random subset(N = 500) of ancillary settlement locations is selected(Figure 2f, blue points). Such a spatially stratified randomsampling scheme (i.e., random sampling within fixed spa-tial bins) makes it possible to obtain a sample of locationsequally representative for all sub-regions covered by themap, accounting for density variations of settlement loca-tions between urban and rural areas. This strategy mitigatesthe imbalance between urban and rural regions, and thus,increases the training data variability and minimizes theprobability of generating duplicate or heavily overlappingsamples. For each selected settlement location in each 3×3kmsampling tile (Figure 2f), the underlying map is croppedwithin 144 × 144 pixels (px) (approximately 750 × 750m)centered at the ancillary settlement location (i.e., candidatepatch). The large patch size is chosen to capture buildingsymbols even if spatial offsets betweenmap and ancillary dataexist. These intermediate patches are called candidate patchessince they may not contain a building symbol, if the area wasnot settled during the map edition year, or if spatial offsetsbetween building symbol and ancillary location are too large.In the exemplary candidate patch in Figure 2e, a buildingsymbol is captured with a slight offset with respect to theancillary settlement location. Whether a candidate patch con-tains a building or not, is determined using the followingprocedure:
First, a color-space segmentation of the candidate patchesis carried out using k-means clustering with k = 5 in theRGB space. While historical USGS topographic maps wereinitially printed in three colors and later using five colors [66],the texture of the paper and the chosen bit depth duringthe scanning process artificially increase color complexity in
VOLUME 8, 2020 6983
J. H. Uhl et al.: Automated Extraction of Human Settlement Patterns
the scanned document. Thus, color reduction decreases thecomplexity of the scanned image without losing importantinformation. Since building symbols are expected to be black,the cluster with the centroid closest to (0,0,0) in RGB space(i.e., the ‘‘darkest’’ cluster) is considered the black layer,if R < 80∩G < 80∩B < 80. Subsequently, the black layer istested for the presence of dark blobs, potentially representingbuilding symbols. This is done by searching for maxima inthe Difference-of-Gaussian scale space (i.e., Scale-InvariantFeature Transform - SIFT keypoint detection, [67]). It hasbeen shown that SIFT keypoints reliably detect dark blobssuch as building symbols [17], [18]. If multiple keypoints aredetected, only one of them is randomly selected and retained.If such a keypoint is found, a small patch (48 × 48 pixels,approximately 250× 250m) is cropped, centered around thekeypoint location (see Figure 2k,m). This is the target patch,and its training label is ‘‘building’’.
To create non-settlement training samples, the map iscropped at random locations within the non-settled areas(Figure 2d). These map patches are called negative samplecandidates (Figure 2g,h). To determine whether these patchescontain black or other non-settlement related map content,the patches are processed in analogy to the building candidatepatches (i.e., color reduction, black layer extraction, SIFTkeypoint detection). If no keypoint is found, a target patchis cropped at a random location within the candidate patch,and the target patch is labelled ‘‘other non-settlement mapcontent’’ (Figure 2g,m), otherwise, if a keypoint is foundon the black layer, a target patch is cropped at the keypointlocation, and the target patch is annotated ‘‘negative black’’(Figure 2h,m,n). In latter case, the eight patches adjacent tothe respective candidate patch are examined for salient nega-tive black content as well, assuming that larger text elementstypically extend over multiple candidate patches. Conclud-ing, this unsupervised procedure yields annotated trainingdata of building symbols and the two negative classes, withbuildings and negative black map content geometrically cen-tered in the map patches.
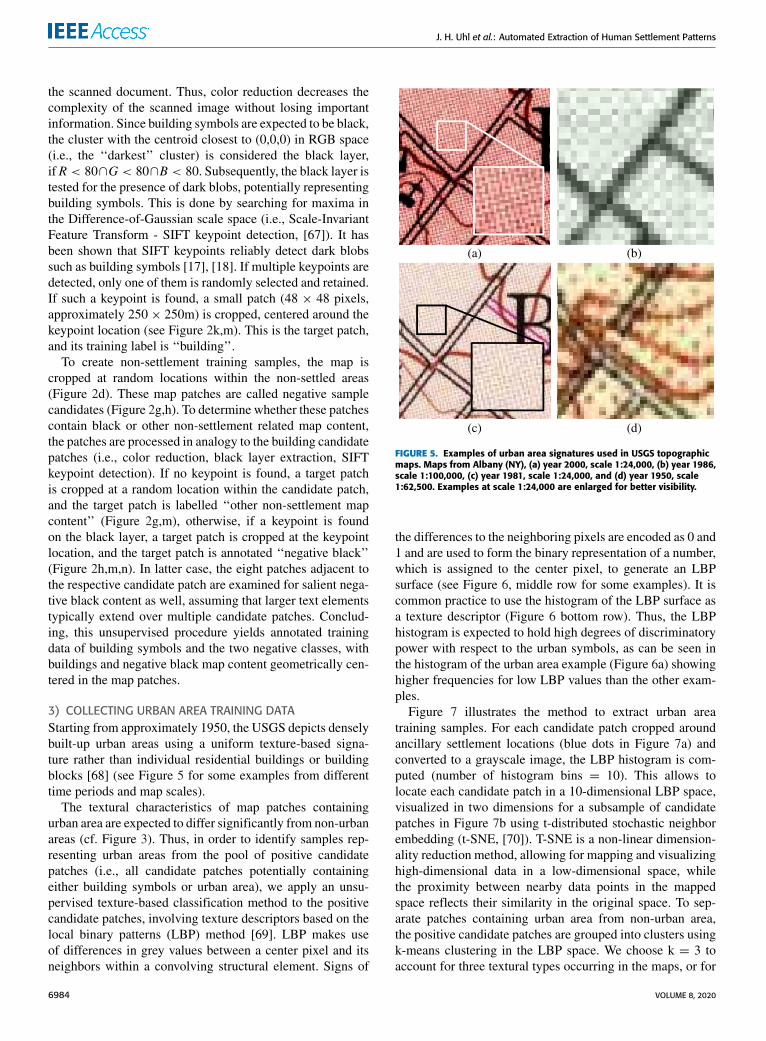
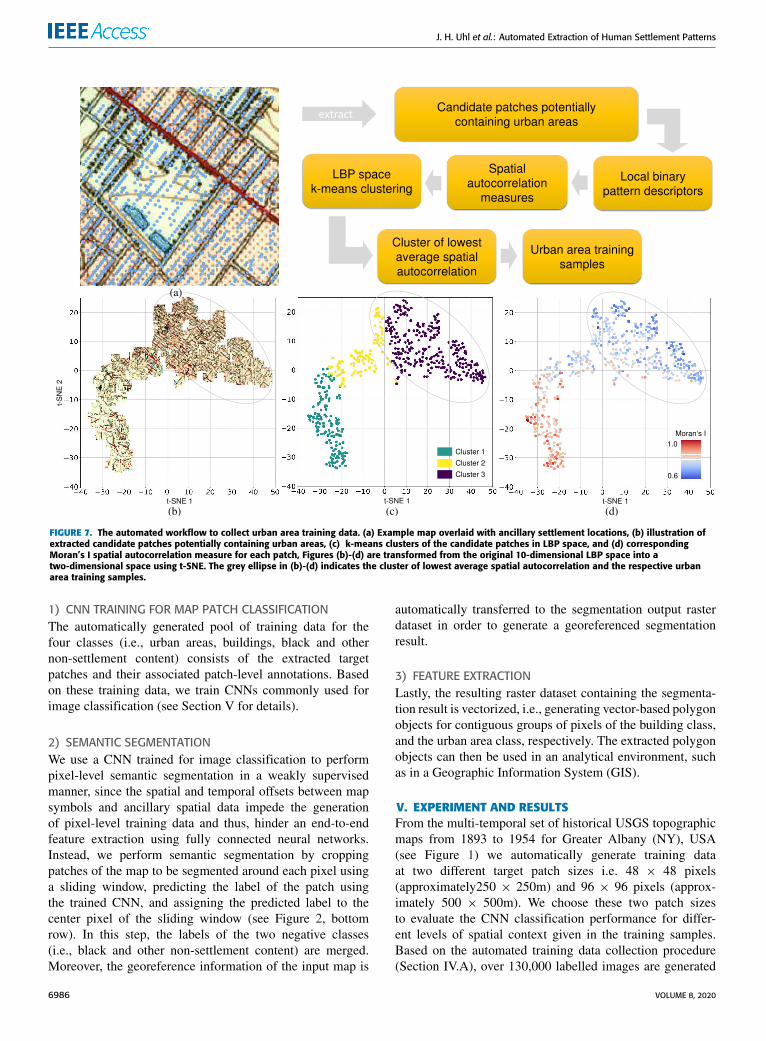
3) COLLECTING URBAN AREA TRAINING DATAStarting from approximately 1950, the USGS depicts denselybuilt-up urban areas using a uniform texture-based signa-ture rather than individual residential buildings or buildingblocks [68] (see Figure 5 for some examples from differenttime periods and map scales).
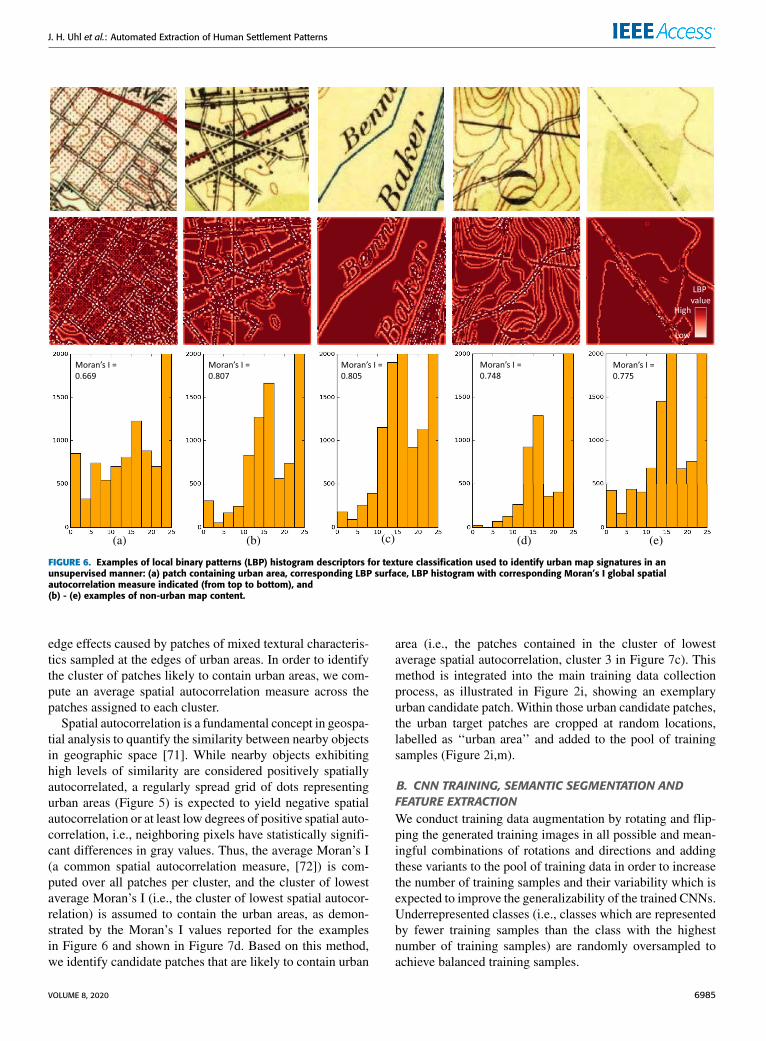
The textural characteristics of map patches containingurban area are expected to differ significantly from non-urbanareas (cf. Figure 3). Thus, in order to identify samples rep-resenting urban areas from the pool of positive candidatepatches (i.e., all candidate patches potentially containingeither building symbols or urban area), we apply an unsu-pervised texture-based classification method to the positivecandidate patches, involving texture descriptors based on thelocal binary patterns (LBP) method [69]. LBP makes useof differences in grey values between a center pixel and itsneighbors within a convolving structural element. Signs of
FIGURE 5. Examples of urban area signatures used in USGS topographicmaps. Maps from Albany (NY), (a) year 2000, scale 1:24,000, (b) year 1986,scale 1:100,000, (c) year 1981, scale 1:24,000, and (d) year 1950, scale1:62,500. Examples at scale 1:24,000 are enlarged for better visibility.
the differences to the neighboring pixels are encoded as 0 and1 and are used to form the binary representation of a number,which is assigned to the center pixel, to generate an LBPsurface (see Figure 6, middle row for some examples). It iscommon practice to use the histogram of the LBP surface asa texture descriptor (Figure 6 bottom row). Thus, the LBPhistogram is expected to hold high degrees of discriminatorypower with respect to the urban symbols, as can be seen inthe histogram of the urban area example (Figure 6a) showinghigher frequencies for low LBP values than the other exam-ples.
Figure 7 illustrates the method to extract urban areatraining samples. For each candidate patch cropped aroundancillary settlement locations (blue dots in Figure 7a) andconverted to a grayscale image, the LBP histogram is com-puted (number of histogram bins = 10). This allows tolocate each candidate patch in a 10-dimensional LBP space,visualized in two dimensions for a subsample of candidatepatches in Figure 7b using t-distributed stochastic neighborembedding (t-SNE, [70]). T-SNE is a non-linear dimension-ality reduction method, allowing for mapping and visualizinghigh-dimensional data in a low-dimensional space, whilethe proximity between nearby data points in the mappedspace reflects their similarity in the original space. To sep-arate patches containing urban area from non-urban area,the positive candidate patches are grouped into clusters usingk-means clustering in the LBP space. We choose k = 3 toaccount for three textural types occurring in the maps, or for
6984 VOLUME 8, 2020
J. H. Uhl et al.: Automated Extraction of Human Settlement Patterns
FIGURE 6. Examples of local binary patterns (LBP) histogram descriptors for texture classification used to identify urban map signatures in anunsupervised manner: (a) patch containing urban area, corresponding LBP surface, LBP histogram with corresponding Moran’s I global spatialautocorrelation measure indicated (from top to bottom), and(b) - (e) examples of non-urban map content.
edge effects caused by patches of mixed textural characteris-tics sampled at the edges of urban areas. In order to identifythe cluster of patches likely to contain urban areas, we com-pute an average spatial autocorrelation measure across thepatches assigned to each cluster.
Spatial autocorrelation is a fundamental concept in geospa-tial analysis to quantify the similarity between nearby objectsin geographic space [71]. While nearby objects exhibitinghigh levels of similarity are considered positively spatiallyautocorrelated, a regularly spread grid of dots representingurban areas (Figure 5) is expected to yield negative spatialautocorrelation or at least low degrees of positive spatial auto-correlation, i.e., neighboring pixels have statistically signifi-cant differences in gray values. Thus, the average Moran’s I(a common spatial autocorrelation measure, [72]) is com-puted over all patches per cluster, and the cluster of lowestaverage Moran’s I (i.e., the cluster of lowest spatial autocor-relation) is assumed to contain the urban areas, as demon-strated by the Moran’s I values reported for the examplesin Figure 6 and shown in Figure 7d. Based on this method,we identify candidate patches that are likely to contain urban
area (i.e., the patches contained in the cluster of lowestaverage spatial autocorrelation, cluster 3 in Figure 7c). Thismethod is integrated into the main training data collectionprocess, as illustrated in Figure 2i, showing an exemplaryurban candidate patch. Within those urban candidate patches,the urban target patches are cropped at random locations,labelled as ‘‘urban area’’ and added to the pool of trainingsamples (Figure 2i,m).
B. CNN TRAINING, SEMANTIC SEGMENTATION ANDFEATURE EXTRACTIONWe conduct training data augmentation by rotating and flip-ping the generated training images in all possible and mean-ingful combinations of rotations and directions and addingthese variants to the pool of training data in order to increasethe number of training samples and their variability which isexpected to improve the generalizability of the trained CNNs.Underrepresented classes (i.e., classes which are representedby fewer training samples than the class with the highestnumber of training samples) are randomly oversampled toachieve balanced training samples.
VOLUME 8, 2020 6985
J. H. Uhl et al.: Automated Extraction of Human Settlement Patterns
FIGURE 7. The automated workflow to collect urban area training data. (a) Example map overlaid with ancillary settlement locations, (b) illustration ofextracted candidate patches potentially containing urban areas, (c) k-means clusters of the candidate patches in LBP space, and (d) correspondingMoran’s I spatial autocorrelation measure for each patch, Figures (b)-(d) are transformed from the original 10-dimensional LBP space into atwo-dimensional space using t-SNE. The grey ellipse in (b)-(d) indicates the cluster of lowest average spatial autocorrelation and the respective urbanarea training samples.
1) CNN TRAINING FOR MAP PATCH CLASSIFICATIONThe automatically generated pool of training data for thefour classes (i.e., urban areas, buildings, black and othernon-settlement content) consists of the extracted targetpatches and their associated patch-level annotations. Basedon these training data, we train CNNs commonly used forimage classification (see Section V for details).
2) SEMANTIC SEGMENTATIONWe use a CNN trained for image classification to performpixel-level semantic segmentation in a weakly supervisedmanner, since the spatial and temporal offsets between mapsymbols and ancillary spatial data impede the generationof pixel-level training data and thus, hinder an end-to-endfeature extraction using fully connected neural networks.Instead, we perform semantic segmentation by croppingpatches of the map to be segmented around each pixel usinga sliding window, predicting the label of the patch usingthe trained CNN, and assigning the predicted label to thecenter pixel of the sliding window (see Figure 2, bottomrow). In this step, the labels of the two negative classes(i.e., black and other non-settlement content) are merged.Moreover, the georeference information of the input map is
automatically transferred to the segmentation output rasterdataset in order to generate a georeferenced segmentationresult.
3) FEATURE EXTRACTIONLastly, the resulting raster dataset containing the segmenta-tion result is vectorized, i.e., generating vector-based polygonobjects for contiguous groups of pixels of the building class,and the urban area class, respectively. The extracted polygonobjects can then be used in an analytical environment, suchas in a Geographic Information System (GIS).
V. EXPERIMENT AND RESULTSFrom the multi-temporal set of historical USGS topographicmaps from 1893 to 1954 for Greater Albany (NY), USA(see Figure 1) we automatically generate training dataat two different target patch sizes i.e. 48 × 48 pixels(approximately250 × 250m) and 96 × 96 pixels (approx-imately 500 × 500m). We choose these two patch sizesto evaluate the CNN classification performance for differ-ent levels of spatial context given in the training samples.Based on the automated training data collection procedure(Section IV.A), over 130,000 labelled images are generated
6986 VOLUME 8, 2020
J. H. Uhl et al.: Automated Extraction of Human Settlement Patterns
of size 48 × 48px, and over 120,000 labelled images of size96×96px, respectively, both at a map scale 1:62,500. We testand evaluate the proposed method in a variety of ways: 1)Wevisually assess the automatically generated training data (seeSection V.A). 2) We design a set of image classificationscenarios using several CNN architectures and input datadimensions, and evaluate them by holding back training datafor testing (see Section V.B). 3) We use large amounts ofmanually digitized building outlines and urban areas from aset of validation maps to be employed as external validationdata (see Section V.C). For the two best-performing CNNs,we conduct semantic segmentation of the validation maps,as described in Section IV.B, and use Receiver-Operator-Characteristic (ROC, [73]) diagnostics to assess the suitabil-ity of these two CNNs for semantic segmentation of eachvalidation map, and 4) for the CNN yielding best Area-under-the-curve (AUC, [74]) values, we compute a variety ofaccuracymeasures to evaluate the segmentation results acrossthe validation maps using pixel-based and object-based mapcomparison techniques (see Section V.C). For this exper-iment, spatial data processing is done in Python, mainlyusing GDAL/OGR8 and ESRI ArcPy9 geoprocessing pythonpackages. Training data collection is implemented usingGDAL/OGR and OpenCV10. CNN training and subsequentinferences are implemented and conducted using Keras11 onan AWSEC212 instance of type g2.8xlarge (4 NVIDIAGRIDGPUs, 32 vCPUs, 60 GB of memory).
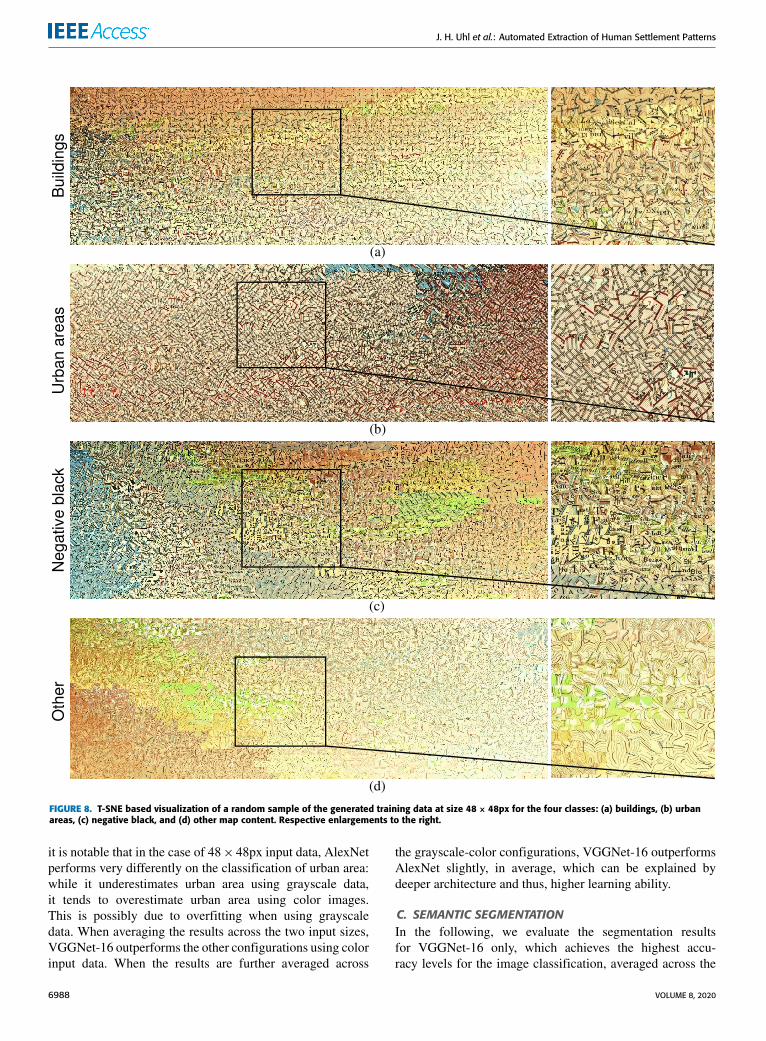
A. VISUAL TRAINING DATA INSPECTIONThe proposed automated training data collection method isunsupervised, and potentially prone to mislabeled trainingsamples due to the mentioned spatial and temporal offsetsbetween maps and ancillary spatial data (Figure 4), as wellas due to heterogeneous map content within an extractedcandidate patch. Hence, we use a visual inspection method(see [48] for details), arranging the training patches in atwo-dimensional space based on color moments derived fromthe color histogram [75] and t-SNE. These visualizations andrespective enlargements for each class (Figure 8) indicatehigh levels of precision, i.e., small proportions of misla-beled training samples. As Figure 8a suggests, most sampleslabelled as building are of high quality, i.e., show a buildingobject at the patch center, which is a result of the previouslydescribed SIFT keypoint centering. While some false posi-tives (i.e., text elements labeled as buildings) occur, almostno building symbols are mislabeled as ‘‘negative black’’.However, the texture-based clustering employed to generatethe urban class samples falsely labels some patches contain-ing bathymetry lines as urban (Figure 8b). This could be anedge effect (i.e., rivers crossing urban cores), or due to thecharacteristics of dense bathymetry lines, yielding textural
8https://pcjericks.github.io/py-gdalogr-cookbook9https://pro.arcgis.com/en/pro-app/arcpy10https://docs.opencv.org/master/d0/de3/tutorial_py_intro.html11https://keras.io12https://aws.amazon.com/de/ec2
descriptors similar to the urban textural signature, and lowlevels of spatial autocorrelation.
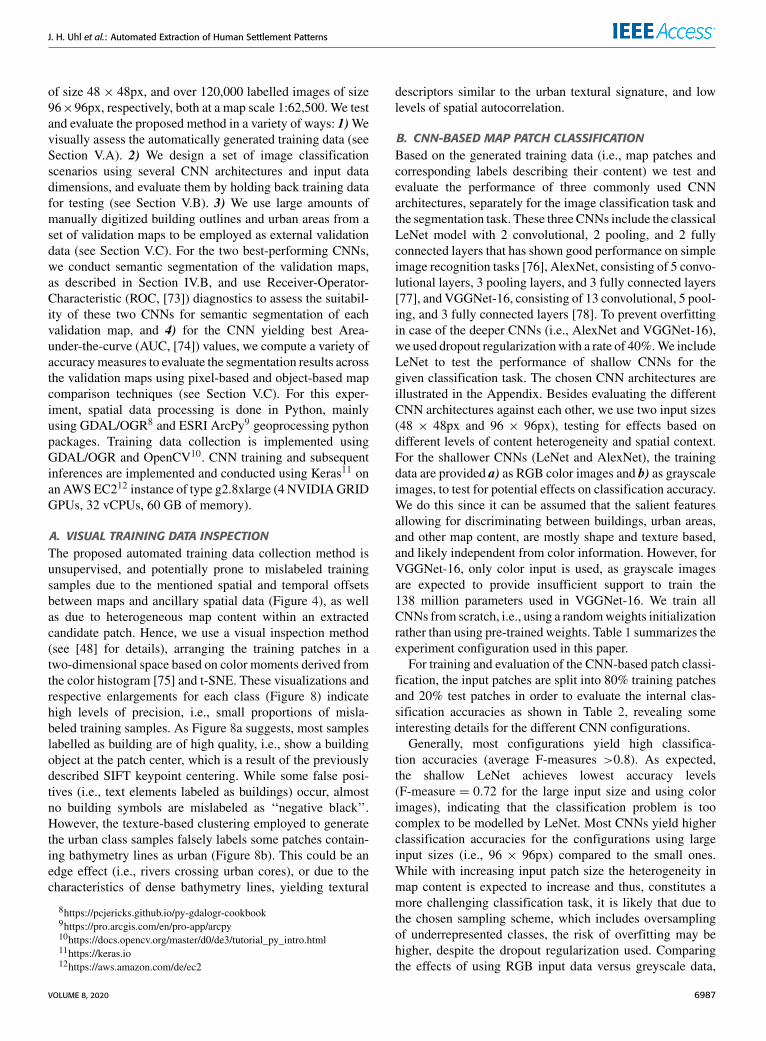
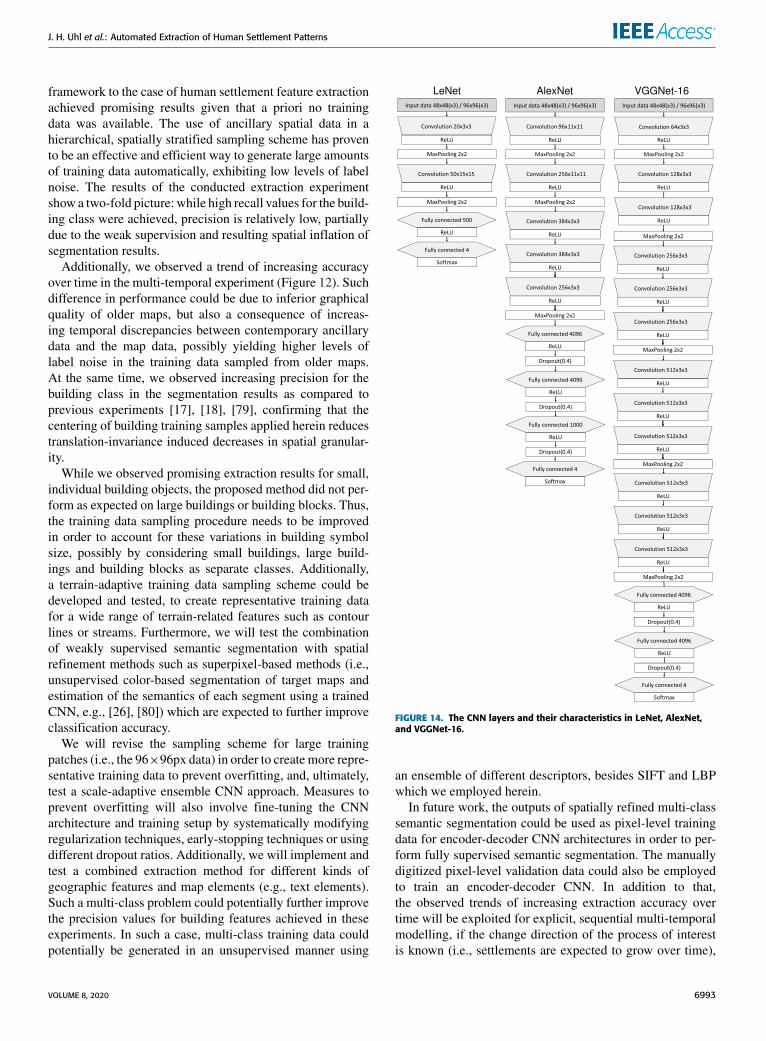
B. CNN-BASED MAP PATCH CLASSIFICATIONBased on the generated training data (i.e., map patches andcorresponding labels describing their content) we test andevaluate the performance of three commonly used CNNarchitectures, separately for the image classification task andthe segmentation task. These three CNNs include the classicalLeNet model with 2 convolutional, 2 pooling, and 2 fullyconnected layers that has shown good performance on simpleimage recognition tasks [76], AlexNet, consisting of 5 convo-lutional layers, 3 pooling layers, and 3 fully connected layers[77], and VGGNet-16, consisting of 13 convolutional, 5 pool-ing, and 3 fully connected layers [78]. To prevent overfittingin case of the deeper CNNs (i.e., AlexNet and VGGNet-16),we used dropout regularizationwith a rate of 40%.We includeLeNet to test the performance of shallow CNNs for thegiven classification task. The chosen CNN architectures areillustrated in the Appendix. Besides evaluating the differentCNN architectures against each other, we use two input sizes(48 × 48px and 96 × 96px), testing for effects based ondifferent levels of content heterogeneity and spatial context.For the shallower CNNs (LeNet and AlexNet), the trainingdata are provided a) as RGB color images and b) as grayscaleimages, to test for potential effects on classification accuracy.We do this since it can be assumed that the salient featuresallowing for discriminating between buildings, urban areas,and other map content, are mostly shape and texture based,and likely independent from color information. However, forVGGNet-16, only color input is used, as grayscale imagesare expected to provide insufficient support to train the138 million parameters used in VGGNet-16. We train allCNNs from scratch, i.e., using a randomweights initializationrather than using pre-trained weights. Table 1 summarizes theexperiment configuration used in this paper.
For training and evaluation of the CNN-based patch classi-fication, the input patches are split into 80% training patchesand 20% test patches in order to evaluate the internal clas-sification accuracies as shown in Table 2, revealing someinteresting details for the different CNN configurations.
Generally, most configurations yield high classifica-tion accuracies (average F-measures >0.8). As expected,the shallow LeNet achieves lowest accuracy levels(F-measure = 0.72 for the large input size and using colorimages), indicating that the classification problem is toocomplex to be modelled by LeNet. Most CNNs yield higherclassification accuracies for the configurations using largeinput sizes (i.e., 96 × 96px) compared to the small ones.While with increasing input patch size the heterogeneity inmap content is expected to increase and thus, constitutes amore challenging classification task, it is likely that due tothe chosen sampling scheme, which includes oversamplingof underrepresented classes, the risk of overfitting may behigher, despite the dropout regularization used. Comparingthe effects of using RGB input data versus greyscale data,
VOLUME 8, 2020 6987
J. H. Uhl et al.: Automated Extraction of Human Settlement Patterns
FIGURE 8. T-SNE based visualization of a random sample of the generated training data at size 48 × 48px for the four classes: (a) buildings, (b) urbanareas, (c) negative black, and (d) other map content. Respective enlargements to the right.
it is notable that in the case of 48× 48px input data, AlexNetperforms very differently on the classification of urban area:while it underestimates urban area using grayscale data,it tends to overestimate urban area using color images.This is possibly due to overfitting when using grayscaledata. When averaging the results across the two input sizes,VGGNet-16 outperforms the other configurations using colorinput data. When the results are further averaged across
the grayscale-color configurations, VGGNet-16 outperformsAlexNet slightly, in average, which can be explained bydeeper architecture and thus, higher learning ability.
C. SEMANTIC SEGMENTATIONIn the following, we evaluate the segmentation resultsfor VGGNet-16 only, which achieves the highest accu-racy levels for the image classification, averaged across the
6988 VOLUME 8, 2020
J. H. Uhl et al.: Automated Extraction of Human Settlement Patterns
TABLE 1. Experiment configuration for CNN-based map patch classification.
TABLE 2. Patch-based classification results for the CNN configurations used in this experiment.
tested scenarios. To assess the performance of the pixel-wisesemantic segmentation based on the weakly supervised (i.e.,patch-level trained) CNN, we define three test cases (i.e.,maps and study areas). These test cases include:
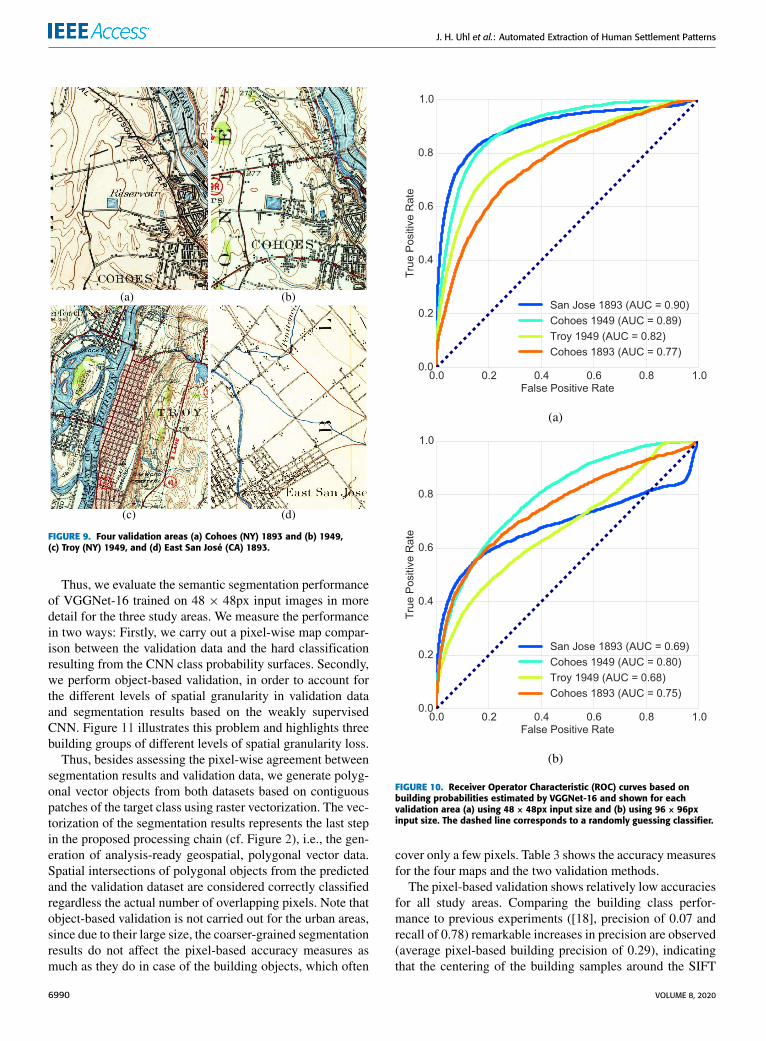
• A multi-temporal test case, using two maps (i.e., from1893 and 1949) in a peri-urban environment nearCohoes (NY), see Figure 9a,b,
• an urban test case, using a map covering Troy (NY) fromthe year 1949 (Figure 9c), and
• a test case on an unseen map (i.e., a map not used fortraining data collection) of East San José (CA) from1893 (Figure 9d).
We carried out dense pixel-wise inferences for the twotrained VGGNet-16 models, which showed best overall per-formance in the patch-based classification scenarios. Sincedense inferences are computationally intensive, we chose astride of 2, resulting in probability surfaces of a spatial reso-lution of approximately 10m. Based on the results of previousexperiments [17], [18] the detection sensitivity for buildings
can be considered as crucial herein, while we expect theextraction of urban area to be less challenging. We evaluatethe sensitivity of VGGNet-16 in detecting building symbolsfor each of the four test maps using ROC plots, based on themanually digitized validation features as categorical variableand the underlying pixel-wise building class probabilitiesas continuous variable to which a range of discriminationthresholds is applied.
These ROC plots are shown separately for VGGNet-16 based on 48×48px input (Figure 10a) and 96×96px input(Figure 10b), respectively. These plots show a clear trend,indicating higher degrees of receptiveness for VGGNet-16trained on small input images, resulting in an average AUCacross the four test maps of 0.85, as compared to 0.73 forthe large input image configurations. This supports the obser-vation of possible overfitting of the 96 × 96px input dataconfigurations, possibly due to a smaller amount of originallycollected training samples, resulting in lower degrees of com-plexity in the data, alongside with less representative trainingdata, in particular for underrepresented classes.
VOLUME 8, 2020 6989
J. H. Uhl et al.: Automated Extraction of Human Settlement Patterns
FIGURE 9. Four validation areas (a) Cohoes (NY) 1893 and (b) 1949,(c) Troy (NY) 1949, and (d) East San José (CA) 1893.
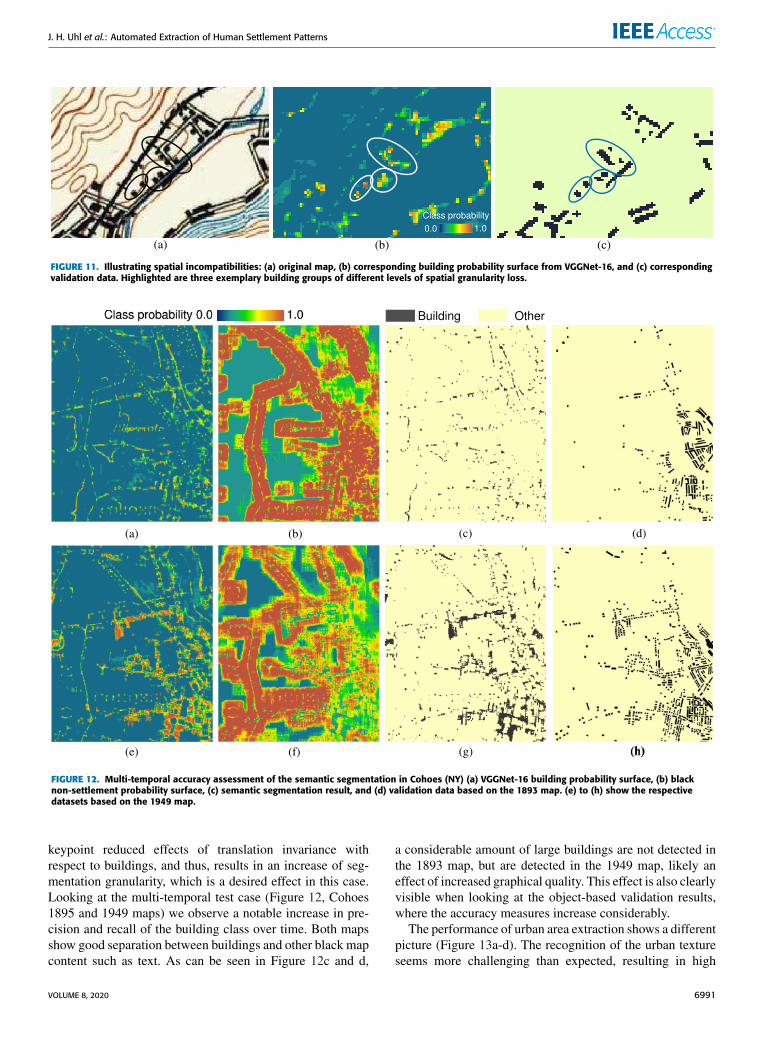
Thus, we evaluate the semantic segmentation performanceof VGGNet-16 trained on 48 × 48px input images in moredetail for the three study areas. We measure the performancein two ways: Firstly, we carry out a pixel-wise map compar-ison between the validation data and the hard classificationresulting from the CNN class probability surfaces. Secondly,we perform object-based validation, in order to account forthe different levels of spatial granularity in validation dataand segmentation results based on the weakly supervisedCNN. Figure 11 illustrates this problem and highlights threebuilding groups of different levels of spatial granularity loss.
Thus, besides assessing the pixel-wise agreement betweensegmentation results and validation data, we generate polyg-onal vector objects from both datasets based on contiguouspatches of the target class using raster vectorization. The vec-torization of the segmentation results represents the last stepin the proposed processing chain (cf. Figure 2), i.e., the gen-eration of analysis-ready geospatial, polygonal vector data.Spatial intersections of polygonal objects from the predictedand the validation dataset are considered correctly classifiedregardless the actual number of overlapping pixels. Note thatobject-based validation is not carried out for the urban areas,since due to their large size, the coarser-grained segmentationresults do not affect the pixel-based accuracy measures asmuch as they do in case of the building objects, which often
FIGURE 10. Receiver Operator Characteristic (ROC) curves based onbuilding probabilities estimated by VGGNet-16 and shown for eachvalidation area (a) using 48 × 48px input size and (b) using 96 × 96pxinput size. The dashed line corresponds to a randomly guessing classifier.
cover only a few pixels. Table 3 shows the accuracy measuresfor the four maps and the two validation methods.
The pixel-based validation shows relatively low accuraciesfor all study areas. Comparing the building class perfor-mance to previous experiments ([18], precision of 0.07 andrecall of 0.78) remarkable increases in precision are observed(average pixel-based building precision of 0.29), indicatingthat the centering of the building samples around the SIFT
6990 VOLUME 8, 2020
J. H. Uhl et al.: Automated Extraction of Human Settlement Patterns
FIGURE 11. Illustrating spatial incompatibilities: (a) original map, (b) corresponding building probability surface from VGGNet-16, and (c) correspondingvalidation data. Highlighted are three exemplary building groups of different levels of spatial granularity loss.
FIGURE 12. Multi-temporal accuracy assessment of the semantic segmentation in Cohoes (NY) (a) VGGNet-16 building probability surface, (b) blacknon-settlement probability surface, (c) semantic segmentation result, and (d) validation data based on the 1893 map. (e) to (h) show the respectivedatasets based on the 1949 map.
keypoint reduced effects of translation invariance withrespect to buildings, and thus, results in an increase of seg-mentation granularity, which is a desired effect in this case.Looking at the multi-temporal test case (Figure 12, Cohoes1895 and 1949 maps) we observe a notable increase in pre-cision and recall of the building class over time. Both mapsshow good separation between buildings and other black mapcontent such as text. As can be seen in Figure 12c and d,
a considerable amount of large buildings are not detected inthe 1893 map, but are detected in the 1949 map, likely aneffect of increased graphical quality. This effect is also clearlyvisible when looking at the object-based validation results,where the accuracy measures increase considerably.
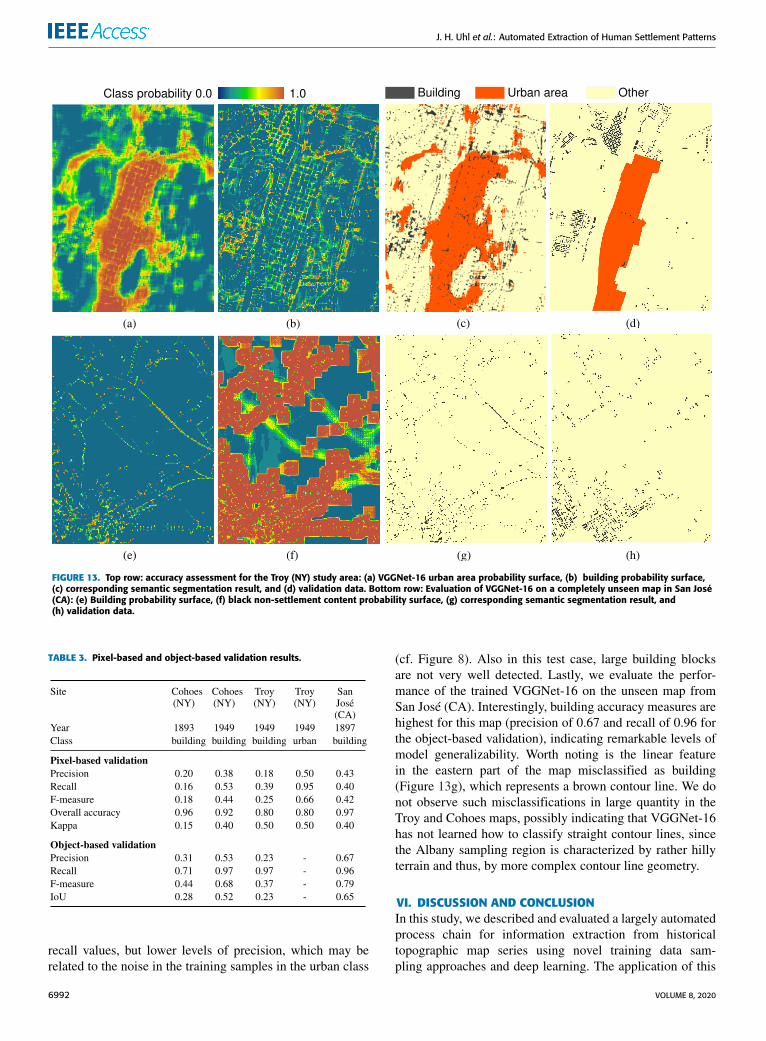
The performance of urban area extraction shows a differentpicture (Figure 13a-d). The recognition of the urban textureseems more challenging than expected, resulting in high
VOLUME 8, 2020 6991
J. H. Uhl et al.: Automated Extraction of Human Settlement Patterns
FIGURE 13. Top row: accuracy assessment for the Troy (NY) study area: (a) VGGNet-16 urban area probability surface, (b) building probability surface,(c) corresponding semantic segmentation result, and (d) validation data. Bottom row: Evaluation of VGGNet-16 on a completely unseen map in San José(CA): (e) Building probability surface, (f) black non-settlement content probability surface, (g) corresponding semantic segmentation result, and(h) validation data.
TABLE 3. Pixel-based and object-based validation results.
recall values, but lower levels of precision, which may berelated to the noise in the training samples in the urban class
(cf. Figure 8). Also in this test case, large building blocksare not very well detected. Lastly, we evaluate the perfor-mance of the trained VGGNet-16 on the unseen map fromSan José (CA). Interestingly, building accuracy measures arehighest for this map (precision of 0.67 and recall of 0.96 forthe object-based validation), indicating remarkable levels ofmodel generalizability. Worth noting is the linear featurein the eastern part of the map misclassified as building(Figure 13g), which represents a brown contour line. We donot observe such misclassifications in large quantity in theTroy and Cohoes maps, possibly indicating that VGGNet-16has not learned how to classify straight contour lines, sincethe Albany sampling region is characterized by rather hillyterrain and thus, by more complex contour line geometry.
VI. DISCUSSION AND CONCLUSIONIn this study, we described and evaluated a largely automatedprocess chain for information extraction from historicaltopographic map series using novel training data sam-pling approaches and deep learning. The application of this
6992 VOLUME 8, 2020
J. H. Uhl et al.: Automated Extraction of Human Settlement Patterns
framework to the case of human settlement feature extractionachieved promising results given that a priori no trainingdata was available. The use of ancillary spatial data in ahierarchical, spatially stratified sampling scheme has provento be an effective and efficient way to generate large amountsof training data automatically, exhibiting low levels of labelnoise. The results of the conducted extraction experimentshow a two-fold picture: while high recall values for the build-ing class were achieved, precision is relatively low, partiallydue to the weak supervision and resulting spatial inflation ofsegmentation results.
Additionally, we observed a trend of increasing accuracyover time in the multi-temporal experiment (Figure 12). Suchdifference in performance could be due to inferior graphicalquality of older maps, but also a consequence of increas-ing temporal discrepancies between contemporary ancillarydata and the map data, possibly yielding higher levels oflabel noise in the training data sampled from older maps.At the same time, we observed increasing precision for thebuilding class in the segmentation results as compared toprevious experiments [17], [18], [79], confirming that thecentering of building training samples applied herein reducestranslation-invariance induced decreases in spatial granular-ity.
While we observed promising extraction results for small,individual building objects, the proposed method did not per-form as expected on large buildings or building blocks. Thus,the training data sampling procedure needs to be improvedin order to account for these variations in building symbolsize, possibly by considering small buildings, large build-ings and building blocks as separate classes. Additionally,a terrain-adaptive training data sampling scheme could bedeveloped and tested, to create representative training datafor a wide range of terrain-related features such as contourlines or streams. Furthermore, we will test the combinationof weakly supervised semantic segmentation with spatialrefinement methods such as superpixel-based methods (i.e.,unsupervised color-based segmentation of target maps andestimation of the semantics of each segment using a trainedCNN, e.g., [26], [80]) which are expected to further improveclassification accuracy.
We will revise the sampling scheme for large trainingpatches (i.e., the 96×96px data) in order to create more repre-sentative training data to prevent overfitting, and, ultimately,test a scale-adaptive ensemble CNN approach. Measures toprevent overfitting will also involve fine-tuning the CNNarchitecture and training setup by systematically modifyingregularization techniques, early-stopping techniques or usingdifferent dropout ratios. Additionally, we will implement andtest a combined extraction method for different kinds ofgeographic features and map elements (e.g., text elements).Such a multi-class problem could potentially further improvethe precision values for building features achieved in theseexperiments. In such a case, multi-class training data couldpotentially be generated in an unsupervised manner using
FIGURE 14. The CNN layers and their characteristics in LeNet, AlexNet,and VGGNet-16.
an ensemble of different descriptors, besides SIFT and LBPwhich we employed herein.
In future work, the outputs of spatially refined multi-classsemantic segmentation could be used as pixel-level trainingdata for encoder-decoder CNN architectures in order to per-form fully supervised semantic segmentation. The manuallydigitized pixel-level validation data could also be employedto train an encoder-decoder CNN. In addition to that,the observed trends of increasing extraction accuracy overtime will be exploited for explicit, sequential multi-temporalmodelling, if the change direction of the process of interestis known (i.e., settlements are expected to grow over time),
VOLUME 8, 2020 6993
J. H. Uhl et al.: Automated Extraction of Human Settlement Patterns
by sequential processing of temporal stacks of maps chrono-logically backwards and deriving spatial constraints based oncontemporary data (cf. [81], [82]). Such approaches makeuse of the assumption that spatial and semantic discrepanciesbetween map content and ancillary data are a function of thetemporal gap between these datasets, and thus, less prevalentif this temporal gap is small. Hence, sequential retrospec-tive extraction of geographic features starting from the mostrecent available data could potentially increase the reliabilityof extracted information and mitigate some of the shortcom-ings of the presented approaches when applied to earliermaps. Finally, we will test the generalizability of such anapproach to other map series. In particular, we will examinethe applicability of the presentedmethod for the texture-basedtraining data collection of urban areas on other poorly definedcartographic elements, i.e., composite elements of vaguelydefined areal extent, such as forests or swamps.
Lastly, it should be mentioned that we exemplarily appliedthe proposed framework to human settlement features andhistorical maps, however, the main concept, which includesthe use of contemporary, and possibly publicly availableancillary spatial data for automated training data collectioncan be transferred to other geographic features of interest, andto other geospatial data sources, such as remote sensing data.The proposed method represents a novel and generalizablestrategy for the recognition of small objects in complex visualdocuments, in cases when only approximate and uncertaina-priori locational information is available to generate graph-ical examples of the features of interest.
APPENDIXCNN ARCHITECTURES USED IN THIS WORKSee Figure 14.
ACKNOWLEDGMENTThe authors were provided access to the Zillow Transactionand Assessment Dataset (ZTRAX) through a data use agree-ment between the University of Colorado Boulder andZillow Inc. Support by Zillow Inc. is gratefully acknowl-edged. Publication of this article was funded by theUniversityof Colorado Boulder Libraries Open Access Fund.
REFERENCES[1] K. A. Fishburn, L. R. Davis, and G. J. Allord, ‘‘Scanning and georefer-
encing historical USGS quadrangles,’’ U.S. Geol. Surv., Reston VA, USA,Tech. Rep. 2017-3048, 2017.
[2] The Library of Congress, Geography and Map Division. Sanborn Maps.Accessed: Nov. 25, 2019. [Online]. Available: https://www.loc.gov/collections/sanborn-maps/
[3] The National Library of Scotland. Ordnance Survey Maps. Accessed:Nov. 25, 2019. [Online]. Available: https://maps.nls.uk/os/
[4] Swiss Federal Office of Topography Swisstopo. A Journey ThroughTime—Maps. Accessed: Nov. 25, 2019. [Online]. Available: https://www.swisstopo.admin.ch/en/maps-data-online/maps-geodata-online/journey-through-time.html
[5] Y.-Y. Chiang, S. Leyk, and C. A. Knoblock, ‘‘A survey of digital mapprocessing techniques,’’ ACM Comput. Surv., vol. 47, no. 1, pp. 1:1-1:44,May 2014.
[6] J. E. Ball, D. T. Anderson, and C. S. Chan, ‘‘Comprehensive survey ofdeep learning in remote sensing: Theories, tools, and challenges for thecommunity,’’ J. Appl. Remote Sens., vol. 11, no. 4, p. 1, Sep. 2017.
[7] L. Zhang, L. Zhang, and B. Du, ‘‘Deep learning for remote sensing data:A technical tutorial on the state of the art,’’ IEEE Geosci. Remote Sens.Mag., vol. 4, no. 2, pp. 22–40, Jun. 2016.
[8] J. Long, E. Shelhamer, and T. Darrell, ‘‘Fully convolutional networksfor semantic segmentation,’’ in Proc. IEEE Conf. Comput. Vis. PatternRecognit. (CVPR), Jun. 2015, pp. 3431–3440.
[9] V. Badrinarayanan, A. Kendall, and R. Cipolla, ‘‘SegNet: A deep convolu-tional encoder–decoder architecture for image segmentation,’’ IEEE Trans.Pattern Anal. Mach. Intell., vol. 39, no. 12, pp. 2481–2495, Dec. 2017.
[10] C. Peng, X. Zhang, G. Yu, G. Luo, and J. Sun, ‘‘Large kernel matters–improve semantic segmentation by global convolutional network,’’ inProc. IEEE Conf. Comput. Vis. Pattern Recognit. (CVPR), Jul. 2017,pp. 4353–4361.
[11] L.-C. Chen, G. Papandreou, I. Kokkinos, K. Murphy, and A. L. Yuille,‘‘DeepLab: Semantic image segmentation with deep convolutional nets,atrous convolution, and fully connected CRFs,’’ IEEE Trans. Pattern Anal.Mach. Intell., vol. 40, no. 4, pp. 834–848, Apr. 2018.
[12] C. J. Henry, C. D. Storie, M. Palaniappan, V. Alhassan, M. Swamy,D. Aleshinloye, A. Curtis, and D. Kim, ‘‘Automated LULC map produc-tion using deep neural networks,’’ Int. J. Remote Sens., vol. 40, no. 11,pp. 4416–4440, Jun. 2019.
[13] Z.-H. Zhou, ‘‘A brief introduction to weakly supervised learning,’’Nat. Sci.Rev., vol. 5, no. 1, pp. 44–53, Jan. 2018.
[14] M. Oquab, L. Bottou, I. Laptev, and J. Sivic, ‘‘Is object localization forfree?—Weakly-supervised learning with convolutional neural networks,’’in Proc. IEEE Conf. Comput. Vis. Pattern Recognit. (CVPR), Jun. 2015,pp. 685–694.
[15] T. Durand, N. Thome, and M. Cord, ‘‘WELDON: Weakly supervisedlearning of deep convolutional neural networks,’’ in Proc. IEEE Conf.Comput. Vis. Pattern Recognit. (CVPR), Jun. 2016, pp. 4743–4752.
[16] D. Pathak, P. Krahenbuhl, and T. Darrell, ‘‘Constrained convolutionalneural networks for weakly supervised segmentation,’’ in Proc. IEEE Int.Conf. Comput. Vis. (ICCV), Dec. 2015, pp. 1796–1804.
[17] J. Uhl, S. Leyk, Y.-Y. Chiang, W. Duan, and C. Knoblock, ‘‘Extractinghuman settlement footprint from historical topographic map series usingcontext–based machine learning,’’ in Proc. 8th Int. Conf. Pattern Recognit.Syst. (ICPRS), 2017.
[18] J. H. Uhl, S. Leyk, Y.-Y. Chiang, W. Duan, and C. A. Knoblock, ‘‘Spatial-ising uncertainty in image segmentation using weakly supervised convolu-tional neural networks: A case study from historical map processing,’’ IETImage Process., vol. 12, no. 11, pp. 2084–2091, Nov. 2018.
[19] S. Leyk and R. Boesch, ‘‘Colors of the past: Color image segmentationin historical topographic maps based on homogeneity,’’ Geoinformatica,vol. 14, no. 1, pp. 1–21, Jan. 2010.
[20] T. Miyoshi, W. Li, K. Kaneda, H. Yamashita, and E. Nakamae, ‘‘Auto-matic extraction of buildings utilizing geometric features of a scannedtopographicmap,’’ inProc. 17th Int. Conf. Pattern Recognit. (ICPR), vol. 3,2004, pp. 626–629.
[21] S. Laycock, P. Brown, R. Laycock, and A. Day, ‘‘Aligning archive mapsand extracting footprints for analysis of historic urban environments,’’Comput. Graph., vol. 35, no. 2, pp. 242–249, Apr. 2011.
[22] M. G. Arteaga, ‘‘Historical map polygon and feature extractor,’’ in Proc.1st ACM SIGSPATIAL Int. Workshop MapInteraction, 2013, pp. 66–71.
[23] J. Wu, P. Wei, X. Yuan, Z. Shu, Y.-Y. Chiang, Z. Fu, and M. Deng, ‘‘A newGabor filter–based method for automatic recognition of hatched residentialareas,’’ IEEE Access, vol. 7, pp. 40649–40662, 2019.
[24] Y.-Y. Chiang, S. Leyk, and C. A. Knoblock, ‘‘Efficient and robust graphicsrecognition from historical maps,’’ in Graphics Recognition. New Trendsand Challenges (Lecture Notes in Computer Science), vol. 7423. Berlin,Germany: Springer, 2013, pp. 25–35.
[25] Y. Chen, R. Wang, and J. Qian, ‘‘Extracting contour lines from common-conditioned topographic maps,’’ IEEE Trans. Geosci. Remote Sens.,vol. 44, no. 4, pp. 1048–1057, Apr. 2006.
[26] Q. Miao, T. Liu, J. Song, M. Gong, and Y. Yang, ‘‘Guided superpixelmethod for topographic map processing,’’ IEEE Trans. Geosci. RemoteSens., vol. 54, no. 11, pp. 6265–6279, Nov. 2016.
[27] S. Leyk and R. Boesch, ‘‘Improving feature extraction of composite car-tographic information in low-quality maps,’’ in Proc. 17th Int. Res. Symp.Comput.-Based Cartogr. (AutoCarto), 2008, pp. 8–11.
[28] Y.-Y. Chiang, S.Moghaddam, S. Gupta, R. Fernandes, and C. A. Knoblock,‘‘From map images to geographic names,’’ in Proc. 22nd ACM SIGSPA-TIAL Int. Conf. Adv. Geograph. Inf. Syst. (SIGSPATIAL), 2014, pp. 4–7.
[29] E. Katona and G. Hudra, ‘‘An interpretation system for cadastral maps,’’in Proc. 10th Int. Conf. Image Anal. Process., Jan. 2003, pp. 792–797.
6994 VOLUME 8, 2020
J. H. Uhl et al.: Automated Extraction of Human Settlement Patterns
[30] A. J. Saalfeld, ‘‘Conflation: Automated map compilation,’’ Int. J. Geogr.Inf. Sci., vol. 2, no. 3, pp. 217–228, 1988.
[31] Y. Li andR. Briggs, ‘‘Automated georeferencing based on topological pointpattern matching,’’ in Proc. Int. Symp. Automat. Cartogr. (AutoCarto),Vancouver, WA, USA, 2006.
[32] Y. Li and R. Briggs, ‘‘An automated system for image-to-vector georefer-encing,’’ Cartogr. Geogr. Inf. Sci., vol. 39, no. 4, pp. 199–217, Jan. 2012.
[33] H. Herold, P. Roehm, R. Hecht, and G. Meinel, ‘‘Automatically georef-erenced maps as a source for high resolution urban growth analyses,’’ inProc. ICA 25th Int. Cartographic Conf., 2011, pp. 1–5.
[34] J. Weinman, ‘‘Toponym recognition in historical maps by gazetteer align-ment,’’ in Proc. 12th Int. Conf. Document Anal. Recognit., Aug. 2013,pp. 1044–1048.
[35] J. E. Burt, J. White, and G. J. Allord. QUAD-G: Automated Georeferenc-ing of Scanned Map Images. Accessed: Nov. 25, 2019. [Online]. Avail-able: https://geography.wisc.edu/research/projects/QUAD-G/files/QUAD-GUserManualver2.10.pdf
[36] W. Duan, Y.-Y. Chiang, C. A. Knoblock, V. Jain, D. Feldman, J. H. Uhl, andS. Leyk, ‘‘Automatic alignment of geographic features in contemporaryvector data and historical maps,’’ in Proc. 1st Workshop Artif. Intell. DeepLearn. Geograph. Knowl. Discovery (GeoAI), 2017.
[37] W. Duan, Y.-Y. Chiang, S. Leyk, J. H. Uhl, and C. A. Knoblock, ‘‘Auto-matic alignment of contemporary vector data and georeferenced historicalmaps using reinforcement learning,’’ Int. J. Geogr. Inf. Sci., pp. 1–26,Dec. 2019.
[38] T. Liu, P. Xu, and S. Zhang, ‘‘A review of recent advances in scanned topo-graphicmap processing,’’Neurocomputing, vol. 328, pp. 75–87, Feb. 2019.
[39] Y.-Y. Chiang, W. Duan, S. Leyk, J. H. Uhl, and C. A. Knoblock, UsingHistorical Maps in Scientific Studies: Challenges and Best Practices.Cham, Switzerland: Springer, 2020, doi: 10.1007/978-3-319-66908-3.
[40] Y. LeCun, Y. Bengio, and G. Hinton, ‘‘Deep learning,’’ Nature, vol. 521,no. 7553, pp. 436–444, 2015.
[41] R. Kitchin, The Data Revolution: Big Data, Open Data, Data Infrastruc-tures and Their Consequences. Newbury Park, CA, USA: Sage, 2014.
[42] S. Tavakkol, Y.-Y. Chiang, T. Waters, F. Han, K. Prasad, and R. Kiveris,‘‘Kartta labs: Unrendering historical maps,’’ in Proc. 3rd ACM SIGSPA-TIAL Int. Workshop AI Geograph. Knowl. Discovery (GeoAI), 2019,pp. 48–51.
[43] T. Vopham, J. E. Hart, F. Laden, and Y.-Y. Chiang, ‘‘Emerging trends ingeospatial artificial intelligence (geoAI): Potential applications for envi-ronmental epidemiology,’’Environ. Health, vol. 17, no. 1, p. 40, Dec. 2018.
[44] J. Weinman, ‘‘Geographic and style models for historical map alignmentand toponym recognition,’’ in Proc. 14th IAPR Int. Conf. Document Anal.Recognit. (ICDAR), vol. 1, Nov. 2017, pp. 957–964.
[45] L. Dong, F. Zheng, H. Chang, and Q. Yan, ‘‘Corner points localization inelectronic topographic maps with deep neural networks,’’ Earth Sci. Inf.,vol. 11, no. 1, pp. 47–57, Mar. 2018.
[46] J. Weinman, Z. Chen, B. Gafford, N. Gifford, A. Lamsal, andL. Niehus-Staab, ‘‘Deep neural networks for text detection and recognitionin historical maps,’’ in Proc. IAPR Int. Conf. Document Anal. Recognit.,2019, pp. 902–909.
[47] M. Saeedimoghaddam and T. F. Stepinski, ‘‘Automatic extraction of roadintersection points from USGS historical map series using deep convolu-tional neural networks,’’ Int. J. Geogr. Inf. Sci., pp. 1–22, Nov. 2019.
[48] J. Uhl, S. Leyk, Y.-Y. Chiang, W. Duan, and C. Knoblock, ‘‘Map archivemining: Visual–analytical approaches to explore large historical map col-lections,’’ ISPRS Int. J. Geo-Inf., vol. 7, no. 4, p. 148, Apr. 2018.
[49] X. Zhou, W. Li, S. T. Arundel, and J. Liu, ‘‘Deep convolutional neuralnetworks for map-type classification,’’ 2018, arXiv:1805.10402. [Online].Available: https://arxiv.org/abs/1805.10402
[50] Y. Kiyota, ‘‘Promoting open innovations in real estate tech: Provision ofthe LIFULL HOME’S data set and collaborative studies,’’ in Proc. ACMInt. Conf. Multimedia Retr. (ICMR), 2018, p. 6.
[51] A. Ray, Z. Chen, B. Gafford, N. Gifford, J. J. Kumar, A. Lamsa,L. Niehus-Staab, J. Weinman, and E. Learned-Miller, ‘‘Historical mapannotations for text detection and recognition,’’ Grinnell College, Grinnell,IA, USA, Tech. Rep., 2018. Accessed: Nov. 25, 2019. [Online]. Available:https://www.cs.grinnell.edu/~weinman/data/complete-map-dataset.pdf
[52] B. Budig and T. C. Van Dijk, ‘‘Active learning for classifying templatematches in historical maps,’’ in Discovery Science (Lecture Notes in Com-puter Science). Cham, Switzerland: Springer, 2015, pp. 33–47.
[53] B. Budig, T. C. Van Dijk, and A. Wolff, ‘‘Matching labels and markersin historical maps: An algorithm with interactive postprocessing,’’ ACMTrans. Spat. Algorithms Syst., vol. 2, no. 4, p. 13, 2016.
[54] H. Li, J. Liu, and X. Zhou, ‘‘Intelligent map reader: A framework fortopographic map understanding with deep learning and gazetteer,’’ IEEEAccess, vol. 6, pp. 25363–25376, 2018.
[55] S. A. Oliveira, I. D. Lenardo, B. Tourenc, and F. Kaplan, ‘‘A deep learningapproach to cadastral computing,’’ presented at the Digit. Hum. Conf.,Utrecht, The Netherlands, 2019.
[56] J. Ignjatić, B. Nikolić, A. Rikalović, and D. Ćulibrk, ‘‘Deep learning forhistorical cadastral maps digitization: Overview, challenges and potential,’’in Proc. WSCG Poster Papers, Aug. 2018.
[57] C. Liu, J. Wu, P. Kohli, and Y. Furukawa, ‘‘Raster-to-vector: Revisitingfloorplan transformation,’’ in Proc. IEEE Int. Conf. Comput. Vis. (ICCV),Oct. 2017, pp. 2195–2203.
[58] B. Budig, T. C. Van Dijk, F. Feitsch, and M. G. Arteaga, ‘‘Polygon consen-sus: Smart crowdsourcing for extracting building footprints from historicalmaps,’’ inProc. 24th ACMSIGSPATIAL Int. Conf. Adv. Geograph. Inf. Syst.(GIS), 2016, p. 66.
[59] L. Hurni, C. Lorenz, and L. Oleggini, ‘‘Cartographic reconstruc-tion of historic settlement development by means of modern geo-data,’’ in Proc. 26th Int. Cartograph. Conf., Dresden, Germany, 2013,pp. 25–30.
[60] A. Tsorlini, I. Iosifescu, C. Iosifescu, and L. Hurni, ‘‘A methodologicalframework for analyzing digitally historical maps using data from differentsources through an online interactive platform,’’ e-Perimetron, vol. 9, no. 4,pp. 153–165, 2014.
[61] S. Leyk and Y.-Y. Chiang, ‘‘Information extraction based on the conceptof geographic context,’’ in Proc. AutoCarto, 2016, pp. 100–110.
[62] Y. Y. Chiang and S. Leyk, ‘‘Exploiting online gazetteer for fully automaticextraction of cartographic symbols,’’ in Proc. 27th Int. Cartograph. Conf.(ICC), 2015, pp. 23–28.
[63] Y.-Y. Chiang, S. Leyk, N. Honarvar Nazari, S. Moghaddam, and T.X. Tan, ‘‘Assessing the impact of graphical quality on automatic textrecognition in digital maps,’’ Comput. Geosci., vol. 93, pp. 21–35,Aug. 2016.
[64] R. Yu, Z. Luo, and Y.-Y. Chiang, ‘‘Recognizing text in historical mapsusing maps from multiple time periods,’’ in Proc. 23rd Int. Conf. PatternRecognit. (ICPR), Dec. 2016, pp. 3993–3998.
[65] Zillow. ZTRAX: Zillow Transaction Assessment Dataset.Accessed: Nov. 25, 2019. [Online]. Available: https://www.zillow.com/research/ztrax/
[66] E. L. Usery, D. E. Varanka, and L. R. Davis, ‘‘Topographic mapping evo-lution: From field and photographically collected data to GIS productionand linked open data,’’ Cartogr. J., vol. 55, no. 4, pp. 378–390, Oct. 2018.
[67] D. Lowe, ‘‘Object recognition from local scale-invariant features,’’ inProc.7th IEEE Int. Conf. Comput. Vis., Sep. 1999, pp. 1150–1157.
[68] U.S. Geological Survey. Topographic Map Symbols.Accessed: Nov. 25, 2019. [Online]. Available: https://pubs.usgs.gov/GIP/TopoMapSymbols/
[69] T. Ojala, M. Pietikainen, and T. Maenpaa, ‘‘Multiresolution gray-scale androtation invariant texture classification with local binary patterns,’’ IEEETrans. Pattern Anal. Mach. Intell., vol. 24, no. 7, pp. 971–987, Jul. 2002.
[70] L. van derMaaten andG.Hinton, ‘‘Visualizing data using t-SNE,’’ J.Mach.Learn. Res., vol. 9, pp. 2579–2605, Nov. 2008.
[71] A. D. Cliff and K. Ord, ‘‘Spatial autocorrelation: A review of exist-ing and new measures with applications,’’ Econ. Geogr., vol. 46, no. 1,pp. 269–292, Jun. 1970.
[72] P. A. P. Moran, ‘‘The interpretation of statistical maps,’’ J. Roy. Stat. Soc.,B, Methodol., vol. 10, no. 2, pp. 243–251, Jul. 1948.
[73] D. M. Green and J. A. Swets, Signal Detection Theory and Psychophysics,vol. 1. New York, NY, USA: Wiley, 1966.
[74] J. A. Hanley and B. J. Mcneil, ‘‘The meaning and use of the area under areceiver operating characteristic (ROC) curve,’’ Radiology, vol. 143, no. 1,pp. 29–36, Apr. 1982.
[75] M. J. Swain and D. H. Ballard, ‘‘Color indexing,’’ Int. J. Comput. Vis.,vol. 7, no. 1, pp. 11–32, 1991.
[76] Y. Lecun, B. Boser, J. S. Denker, D. Henderson, R. E. Howard, W. Hub-bard, and L. D. Jackel, ‘‘Backpropagation applied to handwritten zip coderecognition,’’ Neural Comput., vol. 1, no. 4, pp. 541–551, Dec. 1989.
[77] A. Krizhevsky, I. Sutskever, and G. E. Hinton, ‘‘ImageNet classificationwith deep convolutional neural networks,’’ Commun. ACM, vol. 60, no. 6,pp. 84–90, May 2017.
[78] K. Simonyan and A. Zisserman, ‘‘Very deep convolutional networks forlarge-scale image recognition,’’ 2014, arXiv:1409.1556. [Online]. Avail-able: https://arxiv.org/abs/1409.1556
VOLUME 8, 2020 6995
J. H. Uhl et al.: Automated Extraction of Human Settlement Patterns
[79] J. H. Uhl, ‘‘Spatio-temporal information extraction under uncertainty usingmulti-source data integration andmachine learning: Applications to humansettlement modelling,’’ Ph.D. dissertation, Dept. Geogr., Univ. Colorado atBoulder, Boulder, CO, USA, 2019.
[80] W. Zhao, L. Jiao, W. Ma, J. Zhao, J. Zhao, H. Liu, X. Cao, and S. Yang,‘‘Superpixel–based multiple local CNN for panchromatic and multispec-tral image classification,’’ IEEE Trans. Geosci. Remote Sens., vol. 55, no. 7,pp. 4141–4156, Jul. 2017.
[81] J. H. Uhl and S. Leyk, ‘‘Towards a novel backdating strategy for creatingbuilt-up land time series data using contemporary spatial constraints,’’Remote Sens. Environ., Art. no. 111197, Jun. 2019.
[82] H. Taubenböck, T. Esch, A. Felbier, M. Wiesner, A. Roth, and S. Dech,‘‘Monitoring urbanization in mega cities from space,’’ Remote Sens. Envi-ron., vol. 117, pp. 162–176, Feb. 2012.
JOHANNES H. UHL received the Diploma degreein surveying and geomatics from the KarlsruheUniversity of Applied Sciences, Germany, in 2009,and the double M.Sc. degrees in geomatics fromthe Karlsruhe University of Applied Sciences,Germany, and in cartography and geodesy from thePolytechnic University of Valencia (UPV), Spain,in 2011, and the Ph.D. degree in geographic infor-mation science from the University of Colorado,Boulder, USA, in 2019. From 2008 to 2009, he was
a Student Intern with the Department of Photogrammetry and Image Anal-ysis (IMF), German Aerospace Center (DLR), Oberpfaffenhofen, Germany.From 2012 to 2015, he worked as a Geospatial Data Analyst and a Soft-ware Developer at Pfalzwerke Netz AG, Ludwigshafen, Germany, and as aGraduate Research Assistant with the Department of Geography, Universityof Colorado, Boulder, USA, from 2016 to 2019. Since 2019, he has been aPostdoctoral Research Associate at the University of Colorado PopulationCenter (CUPC), Institute of Behavioral Science, University of Colorado,Boulder. His research interests include the efficient integration and analy-sis of large geospatial datasets, spatio-temporal modeling and informationextraction based on multisource geospatial data using machine learning,image processing and statistical analysis, and uncertainty quantification andmodeling of spatio-temporal data. Hewas a recipient of the Best Paper Awardat the International Conference of Pattern Recognition Systems (ICPRS)2017, Madrid, Spain, and received the Gilbert F. White Fellowship from theUniversity of Colorado, in 2018.
STEFAN LEYK is currently an Associate Pro-fessor with the Department of Geography, Uni-versity of Colorado Boulder, and a ResearchFellow with the Institute of Behavioral Sci-ence. He is also a Geographical InformationScientist with research interests in informa-tion extraction, spatio-temporal modeling, andsocio-environmental systems. In his work, he usesvarious sources of historical spatial data to betterunderstand the evolution of human systems and
how the built environment interacts with environmental processes in thecontext of land use and natural hazards.
YAO-YI CHIANG received the bachelor’s degreein information management from National TaiwanUniversity and the Ph.D. degree in computer sci-ence from the University of Southern California.He is currently an Associate Professor (Research)in Spatial Sciences, the Director of the SpatialComputing Laboratory, and the Associate Directorof the NSF’s Integrated Media Systems Center(IMSC), University of Southern California (USC).He is also a Faculty in data science at the USC
Viterbi Data Science M.S. program. Before USC, he worked as a ResearchScientist with Geosemble Technologies and Fetch Technologies, CA, USA.Geosemble Technologies was founded based on a patent on geospatialdata fusion techniques, where he was a Co-Inventor. His current researchcombines spatial science theories with computer algorithms to enable thediscovery of useful insights from heterogeneous data for solving real-worldproblems. His research interests include information integration, machinelearning, data mining, computer vision, and knowledge graphs.
WEIWEI DUAN is currently pursuing the Ph.D.degree in computer science with the Universityof Southern California (USC). She is workingon building a computer-vision-based system forextracting information from georeferenced imagesand storing them in a structured format for analy-sis, making use of geospatial data integration andusing limited amounts of noisy labeling data. Herresearch interests are computer vision, knowledgegraphs, and machine learning.
CRAIG A. KNOBLOCK received the B.Sc. degreefrom Syracuse University and the master’s andPh.D. degrees in computer science from CarnegieMellon University. He is currently the Execu-tive Director of the Information Sciences Insti-tute, University of Southern California (USC),a Research Professor of both computer scienceand spatial sciences at USC, and the Director ofthe Data Science Program at USC. His researchfocuses on techniques for describing, acquiring,
and exploiting the semantics of data. He has worked extensively on sourcemodeling, schema and ontology alignment, entity and record linkage, datacleaning and normalization, extracting data from the Web, and combiningall of these techniques to build knowledge graphs. He has published morethan 300 journal articles, book chapters, and conference papers on thesetopics and has received seven best paper awards on this work. He is a Fellowof the Association for the Advancement of Artificial Intelligence (AAAI)and the Association of Computing Machinery (ACM). He was the pastPresident and Trustee of the International Joint Conference on ArtificialIntelligence (IJCAI). He received the Robert S. Engelmore Award.
6996 VOLUME 8, 2020
Related Documents