Spectroscopy Spectroscopy • • Chromatography Chromatography • • PhysChem PhysChem • • Naming Naming Drawing and Drawing and Databasing Databasing • • Enterprise Solutions Enterprise Solutions Automated Estimation Automated Estimation of Hammett Constants of Hammett Constants Robert DeWitte & Ed Kolovanov Advanced Chemistry Development

Welcome message from author
This document is posted to help you gain knowledge. Please leave a comment to let me know what you think about it! Share it to your friends and learn new things together.
Transcript

SpectroscopySpectroscopy •• ChromatographyChromatography •• PhysChemPhysChem •• NamingNaming
Drawing and Drawing and Databasing Databasing •• Enterprise SolutionsEnterprise Solutions
Automated Estimation Automated Estimation of Hammett Constantsof Hammett Constants
Robert DeWitte & Ed KolovanovAdvanced Chemistry Development
Integrated Integrated
Software Software
SolutionsSolutions SpectroscopySpectroscopy •• ChromatographyChromatography •• PhysChemPhysChem •• NamingNaming
Drawing and Drawing and Databasing Databasing •• Enterprise SolutionsEnterprise Solutions
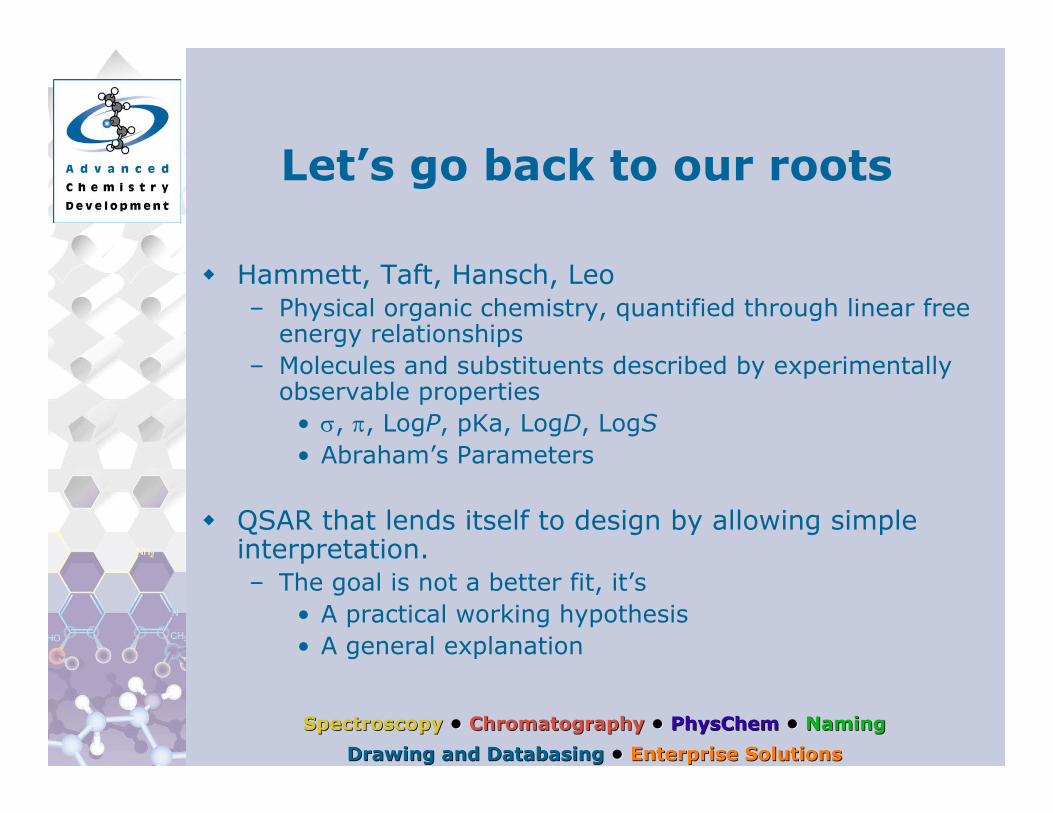
Let’s go back to our roots
Hammett, Taft, Hansch, Leo– Physical organic chemistry, quantified through linear free
energy relationships– Molecules and substituents described by experimentally
observable properties• σ, π, LogP, pKa, LogD, LogS• Abraham’s Parameters
QSAR that lends itself to design by allowing simple interpretation.– The goal is not a better fit, it’s
• A practical working hypothesis• A general explanation

Integrated Integrated
Software Software
SolutionsSolutions SpectroscopySpectroscopy •• ChromatographyChromatography •• PhysChemPhysChem •• NamingNaming
Drawing and Drawing and Databasing Databasing •• Enterprise SolutionsEnterprise Solutions
Application in today’s world
Explain Activity & Describe Diversity– QSAR, Clustering, Decision trees, Neural Nets, …
Plan Experiments– Library Design (in parallel synthesis or combichem)– Compound selection for screening
Avoid costly errors– Drug-like-ness, Lipinski– ADME prediction– Toxicity alerts– Environmental fate

Integrated Integrated
Software Software
SolutionsSolutions SpectroscopySpectroscopy •• ChromatographyChromatography •• PhysChemPhysChem •• NamingNaming
Drawing and Drawing and Databasing Databasing •• Enterprise SolutionsEnterprise Solutions
Molecules can be characterized in many different ways
Different forms of input– Whole molecule properties
• pKa• LogP• LogD• Solubility• MW
– Substituent coefficients• Study the impact of substitutions on electronic
structure• Only relevant and effective among series of congeners
– Topological, fingerprints, Bcuts, Keys, etc.• Efficient means to represent chemical structures and
chemistry space within a computer

Integrated Integrated
Software Software
SolutionsSolutions SpectroscopySpectroscopy •• ChromatographyChromatography •• PhysChemPhysChem •• NamingNaming
Drawing and Drawing and Databasing Databasing •• Enterprise SolutionsEnterprise Solutions
Whole Molecule Properties
ACD has been active in prediction of whole molecule properties since inception nearly 8 years ago– pKa, LogP, LogD, Solubility, BP, VP
Recent commercial highlights– CAS has computed and published properties for over
12Million compounds using ACD PhysChem software– Pfizer has signed a world-wide license for ACD/PhysChem
SoftwareRecent scientific highlights– ACD/LogP now includes the BioByte star list, and has
dramatically increased accuracy– ACD/pKa now includes pKa from BioByte Masterfile,
dramatic improvement in accuracy expected in one year– ACD/Solubility includes AquaSol Database, dramatic
improvements in accuracy coming regularly

Integrated Integrated
Software Software
SolutionsSolutions SpectroscopySpectroscopy •• ChromatographyChromatography •• PhysChemPhysChem •• NamingNaming
Drawing and Drawing and Databasing Databasing •• Enterprise SolutionsEnterprise Solutions
Substituent Coefficients
Trained from data on 850 substituents with over 3000 carefully derived experimental electronic constants. σ I - 592, σ * (Taft) - 265, σ R - 453, σ R
- - 157, σ R
+ - 143, σ Para - 585, σ Meta - 431,
These same coefficients are used in ACD/pKaPredicted by a fragmental algorithm, similar to ACD/LogP
σ Para- - 142,
σ Para+ - 135,
σ Phosph (P-Acids) -68, σ Ortho (Benzoic Acid) - 41, σ Ortho (Phenol) - 37, σ Ortho (Aniline) - 30, and σ Ortho (Pyridine) - 48

Integrated Integrated
Software Software
SolutionsSolutions SpectroscopySpectroscopy •• ChromatographyChromatography •• PhysChemPhysChem •• NamingNaming
Drawing and Drawing and Databasing Databasing •• Enterprise SolutionsEnterprise Solutions
Some illustrations
Diversity/Library Design– Benzoic acid library
QSAR– Recent articles from J Med Chem– PLS models done in collaboration with Umetrics
• Sophisticated analysis using only statistically significant components that offer incremental improvement of Q2
– Multilinear regressions done in Excel• Naïve analyses done with manual selection of
variables• No cross validation

Integrated Integrated
Software Software
SolutionsSolutions SpectroscopySpectroscopy •• ChromatographyChromatography •• PhysChemPhysChem •• NamingNaming
Drawing and Drawing and Databasing Databasing •• Enterprise SolutionsEnterprise Solutions
O
OH
An example: Benzoic acid Library
A simple library based on the benzoic acid core
Draw in the core structure, save it in an SD File

Integrated Integrated
Software Software
SolutionsSolutions SpectroscopySpectroscopy •• ChromatographyChromatography •• PhysChemPhysChem •• NamingNaming
Drawing and Drawing and Databasing Databasing •• Enterprise SolutionsEnterprise Solutions
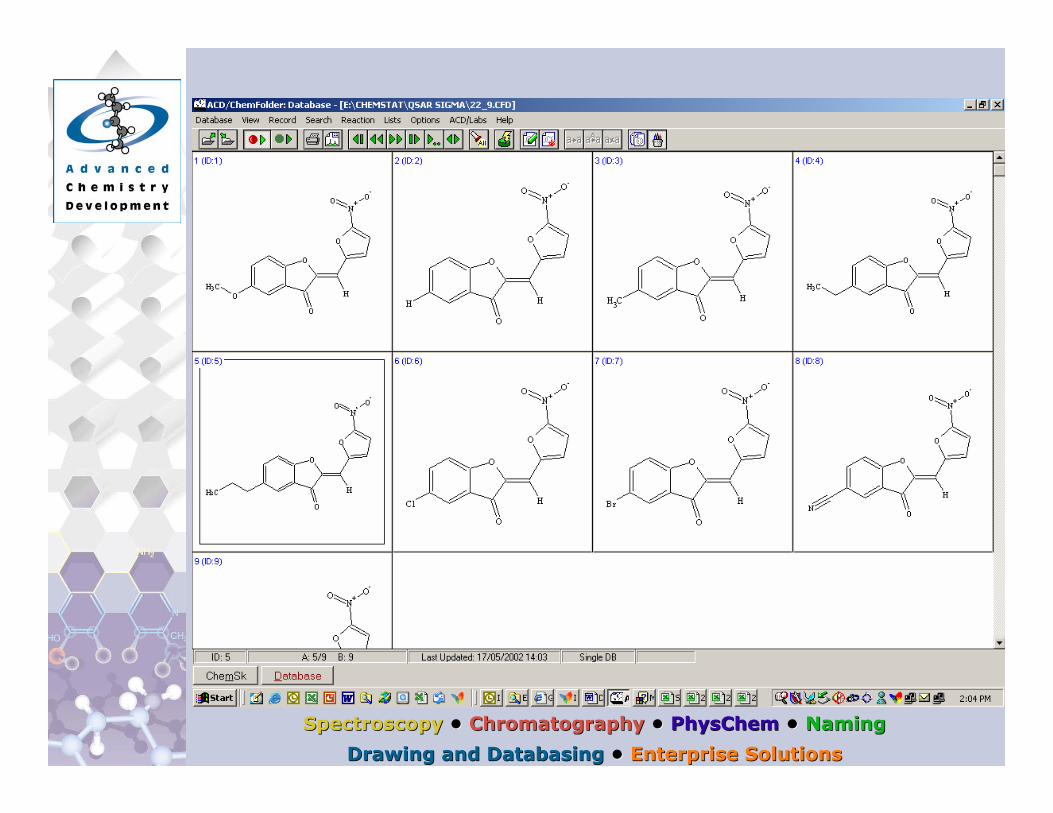
ChemFolder view of the Library
Integrated Integrated
Software Software
SolutionsSolutions SpectroscopySpectroscopy •• ChromatographyChromatography •• PhysChemPhysChem •• NamingNaming
Drawing and Drawing and Databasing Databasing •• Enterprise SolutionsEnterprise Solutions
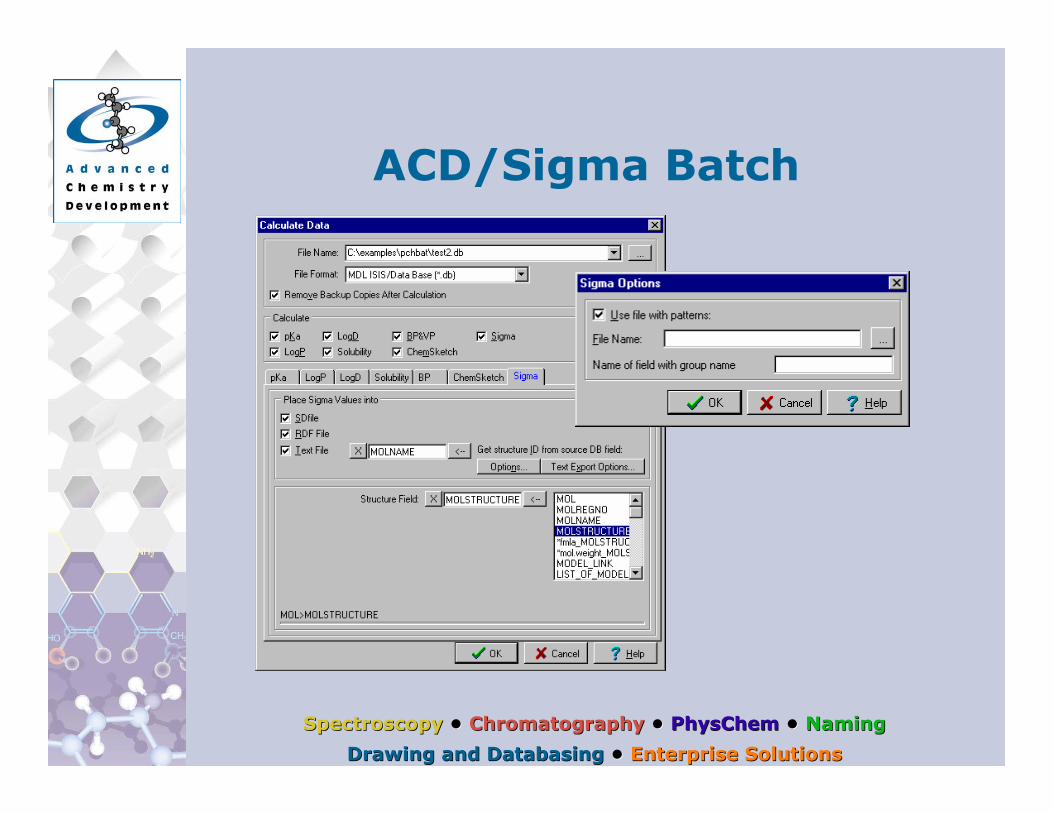
ACD/Sigma Batch

Integrated Integrated
Software Software
SolutionsSolutions SpectroscopySpectroscopy •• ChromatographyChromatography •• PhysChemPhysChem •• NamingNaming
Drawing and Drawing and Databasing Databasing •• Enterprise SolutionsEnterprise Solutions
ChemFolder view of molecules and substituent constants

Integrated Integrated
Software Software
SolutionsSolutions SpectroscopySpectroscopy •• ChromatographyChromatography •• PhysChemPhysChem •• NamingNaming
Drawing and Drawing and Databasing Databasing •• Enterprise SolutionsEnterprise Solutions
ID’s and Sigma’s in Excel

Integrated Integrated
Software Software
SolutionsSolutions SpectroscopySpectroscopy •• ChromatographyChromatography •• PhysChemPhysChem •• NamingNaming
Drawing and Drawing and Databasing Databasing •• Enterprise SolutionsEnterprise Solutions
Variability in Sigma (Para) substituent Coefficient
-0.8
-0.6
-0.4
-0.2
0
0.2
0.4
0.6
0.8
1
1 4 7 10 13 16 19 22 25 28 31 34 37 40 43 46 49

Integrated Integrated
Software Software
SolutionsSolutions SpectroscopySpectroscopy •• ChromatographyChromatography •• PhysChemPhysChem •• NamingNaming
Drawing and Drawing and Databasing Databasing •• Enterprise SolutionsEnterprise Solutions
Results
Notice that Sigma varies significantly with different substituents
Next steps:– Correlation Analysis– Statistical Design of Experiments– QSAR
Output (SDFile or CSV) is compatible with molecular modeling and statistics software packages.

Integrated Integrated
Software Software
SolutionsSolutions SpectroscopySpectroscopy •• ChromatographyChromatography •• PhysChemPhysChem •• NamingNaming
Drawing and Drawing and Databasing Databasing •• Enterprise SolutionsEnterprise Solutions
Example: QSAR on Antibacterial Activity of Nitrofuran Derivatives
Pires et al. J. Med. Chem 2001, 44, 3673-3681
O
O
H
O
N+
O-
O
R
Integrated Integrated
Software Software
SolutionsSolutions SpectroscopySpectroscopy •• ChromatographyChromatography •• PhysChemPhysChem •• NamingNaming
Drawing and Drawing and Databasing Databasing •• Enterprise SolutionsEnterprise Solutions

Integrated Integrated
Software Software
SolutionsSolutions SpectroscopySpectroscopy •• ChromatographyChromatography •• PhysChemPhysChem •• NamingNaming
Drawing and Drawing and Databasing Databasing •• Enterprise SolutionsEnterprise Solutions
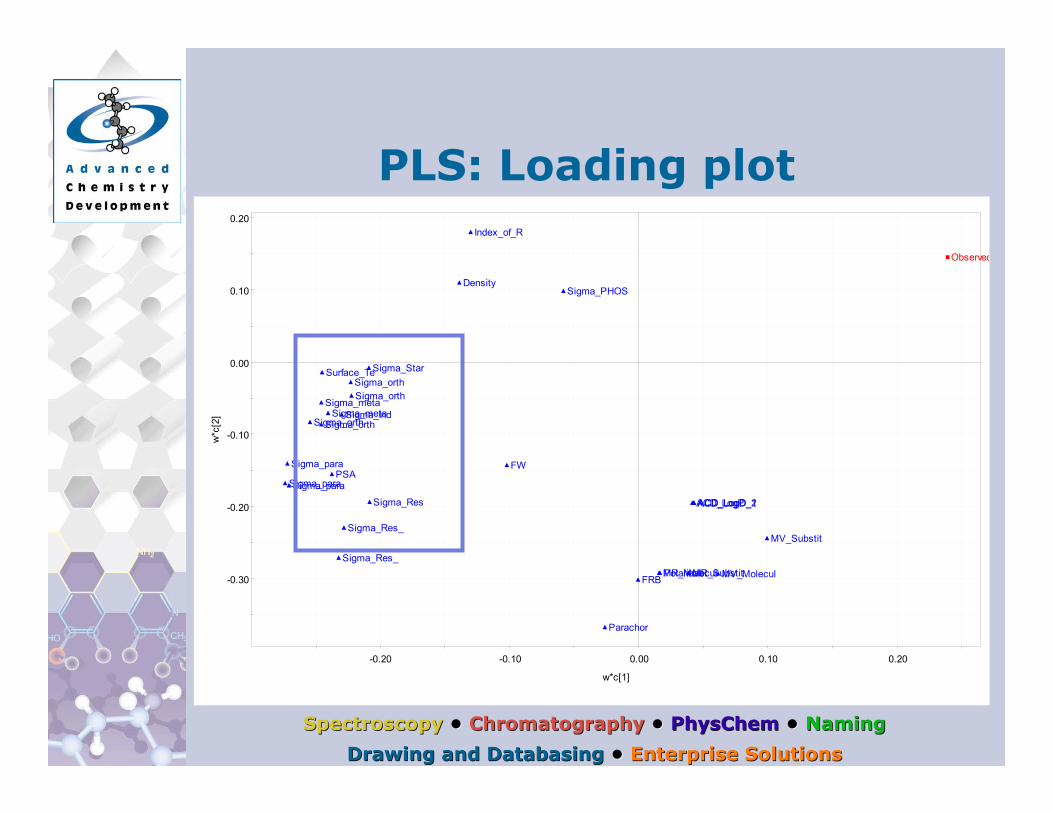
PLS: Two significant principal components
0.927 0.821
Integrated Integrated
Software Software
SolutionsSolutions SpectroscopySpectroscopy •• ChromatographyChromatography •• PhysChemPhysChem •• NamingNaming
Drawing and Drawing and Databasing Databasing •• Enterprise SolutionsEnterprise Solutions
-0.30
-0.20
-0.10
0.00
0.10
0.20
-0.20 -0.10 0.00 0.10 0.20
w*c
[2]
w*c[1]
ACD_LogD_1ACD_LogD_2ACD_LogP
Density
FRB
FW
Index_of_R
MR_MoleculMR_SubstitMV_Molecul
MV_Substit
PSA
Parachor
Polarizabi
Sigma_Ind
Sigma_PHOS
Sigma_Res
Sigma_Res_
Sigma_Res_
Sigma_Star
Sigma_metaSigma_meta
Sigma_orth
Sigma_orth
Sigma_orth
Sigma_orth
Sigma_para
Sigma_paraSigma_para
Surface_Te
Observed
PLS: Loading plot

Integrated Integrated
Software Software
SolutionsSolutions SpectroscopySpectroscopy •• ChromatographyChromatography •• PhysChemPhysChem •• NamingNaming
Drawing and Drawing and Databasing Databasing •• Enterprise SolutionsEnterprise Solutions
PLS: Loadings in the second component
-0.180
-0.160
-0.140
-0.120
-0.100
-0.080
-0.060
-0.040
-0.020
0.000
0.020
0.040
0.060
0.080
AC
D_L
ogD
_1
AC
D_L
ogD
_2
AC
D_L
ogP
Den
sity
FRB
FW
Inde
x_of
_R
MR
_Mol
ecul
MR
_Sub
stit
MV
_Mol
ecul
MV
_Sub
stit
PS
A
Par
acho
r
Pol
ariz
abi
Sig
ma_
Ind
Sig
ma_
PH
OS
Sig
ma_
Res
Sig
ma_
Res
_
Sig
ma_
Res
_
Sig
ma_
Sta
r
Sig
ma_
met
a
Sig
ma_
met
a
Sig
ma_
orth
Sig
ma_
orth
Sig
ma_
orth
Sig
ma_
orth
Sig
ma_
para
Sig
ma_
para
Sig
ma_
para
Sur
face
_Te
Coe
ffCS
[2](O
bser
ved)
Var ID (Primary)

Integrated Integrated
Software Software
SolutionsSolutions SpectroscopySpectroscopy •• ChromatographyChromatography •• PhysChemPhysChem •• NamingNaming
Drawing and Drawing and Databasing Databasing •• Enterprise SolutionsEnterprise Solutions
PLS: Predicted vs Observed
2.30
2.40
2.50
2.60
2.70
2.80
2.90
3.00
3.10
3.20
3.30
3.40
3.50
3.60
3.70
3.80
3.90
4.00
2.30 2.40 2.50 2.60 2.70 2.80 2.90 3.00 3.10 3.20 3.30 3.40 3.50 3.60 3.70 3.80 3.90 4.00
YVar
(Obs
erve
d)
YPred[2](Observed)
1
2
3
45
67
8
9
y=0.9987*x-0.01038R2=0.9276
Integrated Integrated
Software Software
SolutionsSolutions SpectroscopySpectroscopy •• ChromatographyChromatography •• PhysChemPhysChem •• NamingNaming
Drawing and Drawing and Databasing Databasing •• Enterprise SolutionsEnterprise Solutions
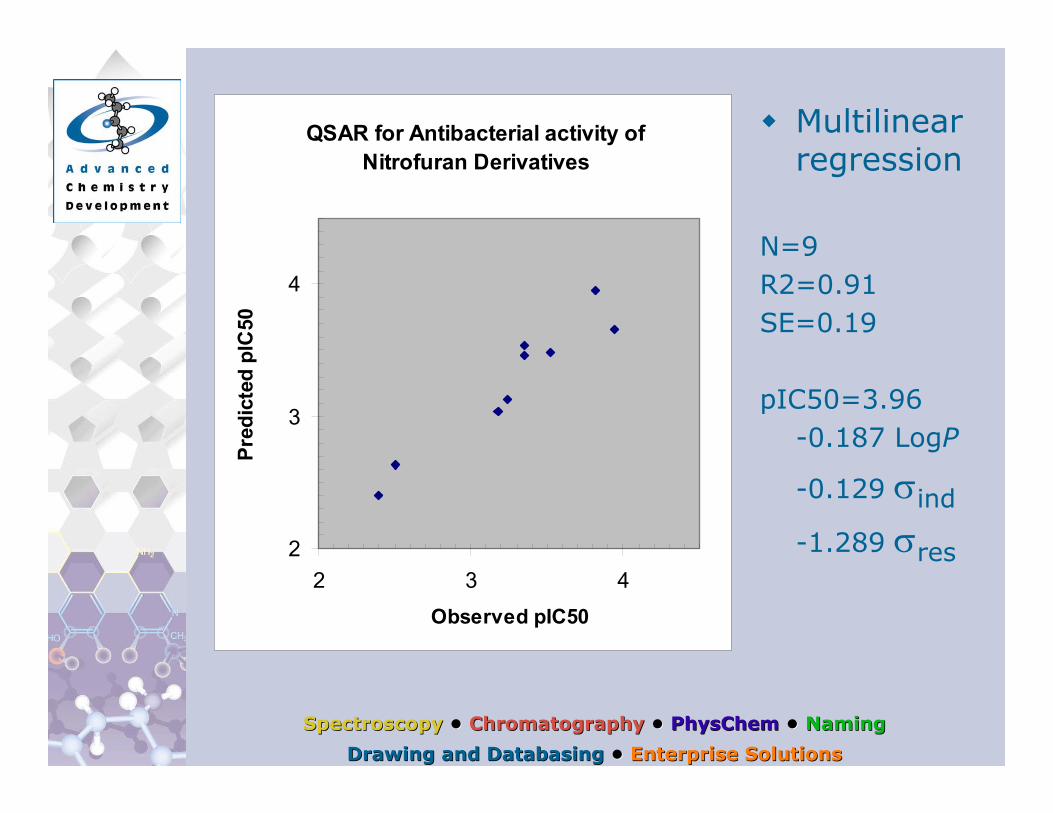
QSAR for Antibacterial activity of Nitrofuran Derivatives
2
3
4
2 3 4Observed pIC50
Pred
icte
d pI
C50
Multilinearregression
N=9R2=0.91SE=0.19
pIC50=3.96-0.187 LogP
-0.129 σind
-1.289 σres
Integrated Integrated
Software Software
SolutionsSolutions SpectroscopySpectroscopy •• ChromatographyChromatography •• PhysChemPhysChem •• NamingNaming
Drawing and Drawing and Databasing Databasing •• Enterprise SolutionsEnterprise Solutions
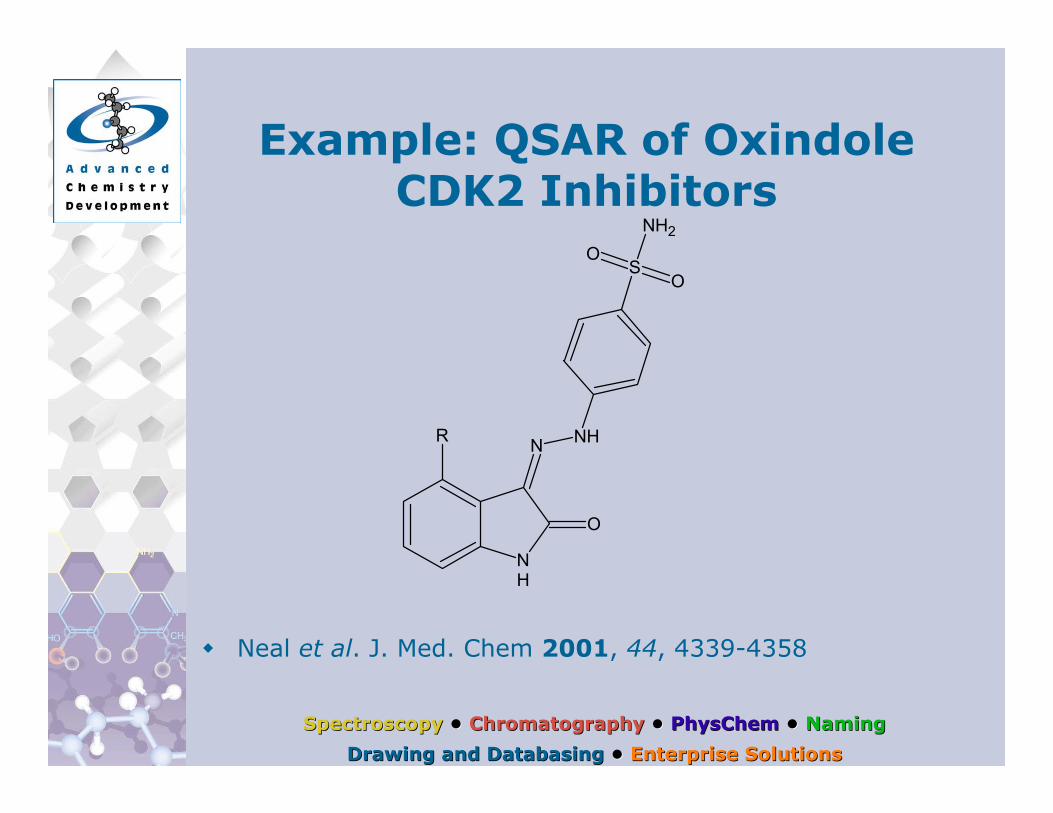
Example: QSAR of OxindoleCDK2 Inhibitors
Neal et al. J. Med. Chem 2001, 44, 4339-4358
NH
N NH
SO
O
NH2
O
R

Integrated Integrated
Software Software
SolutionsSolutions SpectroscopySpectroscopy •• ChromatographyChromatography •• PhysChemPhysChem •• NamingNaming
Drawing and Drawing and Databasing Databasing •• Enterprise SolutionsEnterprise Solutions

Integrated Integrated
Software Software
SolutionsSolutions SpectroscopySpectroscopy •• ChromatographyChromatography •• PhysChemPhysChem •• NamingNaming
Drawing and Drawing and Databasing Databasing •• Enterprise SolutionsEnterprise Solutions
PLS: one significant principal component
0.527 0.407

Integrated Integrated
Software Software
SolutionsSolutions SpectroscopySpectroscopy •• ChromatographyChromatography •• PhysChemPhysChem •• NamingNaming
Drawing and Drawing and Databasing Databasing •• Enterprise SolutionsEnterprise Solutions
-0.40
-0.30
-0.20
-0.10
0.00
0.10
0.20
0.30
0.40
0.50A
CD
_Log
D_1
AC
D_L
ogD
_2
AC
D_L
ogP
AC
D_p
Ka_
Ap
AC
D_p
Ka_
Ap
Den
sity
FRB
FW
Inde
x_of
_R
MR
_Mol
ecul
MV
_Mol
ecul
PS
A
Par
acho
r
Pol
ariz
abi
Sig
ma_
Ind
Sig
ma_
Res
Sur
face
_Te
MR
_Sub
stit
MV
_Sub
stit
Sig
ma_
Res
_
Sig
ma_
Res
_
Sig
ma_
Sta
r
Sig
ma_
met
a
Sig
ma_
met
a
Sig
ma_
orth
Sig
ma_
orth
Sig
ma_
orth
Sig
ma_
orth
Sig
ma_
para
Sig
ma_
para
Sig
ma_
para
Sub
stP
os
Sig
ma_
PH
OS
Act
ivity
1
Act
ivity
2
w*c
[1]
Var ID (Primary)
Loading plot

Integrated Integrated
Software Software
SolutionsSolutions SpectroscopySpectroscopy •• ChromatographyChromatography •• PhysChemPhysChem •• NamingNaming
Drawing and Drawing and Databasing Databasing •• Enterprise SolutionsEnterprise Solutions
PLS: Predicted vs Observed
0
1
2
3
0 1 2 3
YVar
(Act
ivity
2)(tr
ans)
YPred[1](Activity2)(trans)
21
22
23
24
2526
27
28
29
30
3132
33
34
35
y=1*x+0.00425R2=0.6263

Integrated Integrated
Software Software
SolutionsSolutions SpectroscopySpectroscopy •• ChromatographyChromatography •• PhysChemPhysChem •• NamingNaming
Drawing and Drawing and Databasing Databasing •• Enterprise SolutionsEnterprise Solutions
QSAR for Oxindole CDK2 Inhibitors
5
6
7
8
9
5 6 7 8 9
Observed pIC50
Pred
icte
d pI
C50
Multilinearregression
N=15R2=0.82SE=0.51
pIC50=5.38+0.346 LogP
-2.561 σind
-1.254 σres
-0.425 #FRB+0.00962MW

Integrated Integrated
Software Software
SolutionsSolutions SpectroscopySpectroscopy •• ChromatographyChromatography •• PhysChemPhysChem •• NamingNaming
Drawing and Drawing and Databasing Databasing •• Enterprise SolutionsEnterprise Solutions
Conclusions
Now you can consider variation in substituent constants when– Evaluating SAR– Designing Libraries
ACD/Sigma Batch is available– In v6.0 of ACD software– For Win32, Solaris and SGI– As another module for ACD/PhysChem Batch
ACD/Sigma Pro is available for the desktop– One compound at a time.

Integrated Integrated
Software Software
SolutionsSolutions SpectroscopySpectroscopy •• ChromatographyChromatography •• PhysChemPhysChem •• NamingNaming
Drawing and Drawing and Databasing Databasing •• Enterprise SolutionsEnterprise Solutions
Acknowledgements
ACD– Eduard Kolovanov– Daria Jouravleva
Umetrics– Svante Wold– Mark Earll
Related Documents