BioMed Central Page 1 of 20 (page number not for citation purposes) BMC Medical Imaging Open Access Research article Automated detection of regions of interest for tissue microarray experiments: an image texture analysis Bilge Karaçali and Aydin Tözeren* Address: Center for Integrated Bioinformatics, School of Biomedical Engineering, Science and Health Systems, Drexel University, 3141 Chestnut Street, Philadelphia, Pennsylvania 19104-2875, USA Email: Bilge Karaçali - [email protected]; Aydin Tözeren* - [email protected] * Corresponding author Abstract Background: Recent research with tissue microarrays led to a rapid progress toward quantifying the expressions of large sets of biomarkers in normal and diseased tissue. However, standard procedures for sampling tissue for molecular profiling have not yet been established. Methods: This study presents a high throughput analysis of texture heterogeneity on breast tissue images for the purpose of identifying regions of interest in the tissue for molecular profiling via tissue microarray technology. Image texture of breast histology slides was described in terms of three parameters: the percentage of area occupied in an image block by chromatin (B), percentage occupied by stroma-like regions (P), and a statistical heterogeneity index H commonly used in image analysis. Texture parameters were defined and computed for each of the thousands of image blocks in our dataset using both the gray scale and color segmentation. The image blocks were then classified into three categories using the texture feature parameters in a novel statistical learning algorithm. These categories are as follows: image blocks specific to normal breast tissue, blocks specific to cancerous tissue, and those image blocks that are non-specific to normal and disease states. Results: Gray scale and color segmentation techniques led to identification of same regions in histology slides as cancer-specific. Moreover the image blocks identified as cancer-specific belonged to those cell crowded regions in whole section image slides that were marked by two pathologists as regions of interest for further histological studies. Conclusion: These results indicate the high efficiency of our automated method for identifying pathologic regions of interest on histology slides. Automation of critical region identification will help minimize the inter-rater variability among different raters (pathologists) as hundreds of tumors that are used to develop an array have typically been evaluated (graded) by different pathologists. The region of interest information gathered from the whole section images will guide the excision of tissue for constructing tissue microarrays and for high throughput profiling of global gene expression. Published: 9 March 2007 BMC Medical Imaging 2007, 7:2 doi:10.1186/1471-2342-7-2 Received: 25 August 2006 Accepted: 9 March 2007 This article is available from: http://www.biomedcentral.com/1471-2342/7/2 © 2007 Karaçali and Tözeren; licensee BioMed Central Ltd. This is an Open Access article distributed under the terms of the Creative Commons Attribution License (http://creativecommons.org/licenses/by/2.0 ), which permits unrestricted use, distribution, and reproduction in any medium, provided the original work is properly cited.

Welcome message from author
This document is posted to help you gain knowledge. Please leave a comment to let me know what you think about it! Share it to your friends and learn new things together.
Transcript
BioMed CentralBMC Medical Imaging
ss
Open AcceResearch articleAutomated detection of regions of interest for tissue microarray experiments: an image texture analysisBilge Karaçali and Aydin Tözeren*Address: Center for Integrated Bioinformatics, School of Biomedical Engineering, Science and Health Systems, Drexel University, 3141 Chestnut Street, Philadelphia, Pennsylvania 19104-2875, USA
Email: Bilge Karaçali - [email protected]; Aydin Tözeren* - [email protected]
* Corresponding author
AbstractBackground: Recent research with tissue microarrays led to a rapid progress toward quantifyingthe expressions of large sets of biomarkers in normal and diseased tissue. However, standardprocedures for sampling tissue for molecular profiling have not yet been established.
Methods: This study presents a high throughput analysis of texture heterogeneity on breast tissueimages for the purpose of identifying regions of interest in the tissue for molecular profiling viatissue microarray technology. Image texture of breast histology slides was described in terms ofthree parameters: the percentage of area occupied in an image block by chromatin (B), percentageoccupied by stroma-like regions (P), and a statistical heterogeneity index H commonly used inimage analysis. Texture parameters were defined and computed for each of the thousands of imageblocks in our dataset using both the gray scale and color segmentation. The image blocks were thenclassified into three categories using the texture feature parameters in a novel statistical learningalgorithm. These categories are as follows: image blocks specific to normal breast tissue, blocksspecific to cancerous tissue, and those image blocks that are non-specific to normal and diseasestates.
Results: Gray scale and color segmentation techniques led to identification of same regions inhistology slides as cancer-specific. Moreover the image blocks identified as cancer-specific belongedto those cell crowded regions in whole section image slides that were marked by two pathologistsas regions of interest for further histological studies.
Conclusion: These results indicate the high efficiency of our automated method for identifyingpathologic regions of interest on histology slides. Automation of critical region identification willhelp minimize the inter-rater variability among different raters (pathologists) as hundreds of tumorsthat are used to develop an array have typically been evaluated (graded) by different pathologists.The region of interest information gathered from the whole section images will guide the excisionof tissue for constructing tissue microarrays and for high throughput profiling of global geneexpression.
Published: 9 March 2007
BMC Medical Imaging 2007, 7:2 doi:10.1186/1471-2342-7-2
Received: 25 August 2006Accepted: 9 March 2007
This article is available from: http://www.biomedcentral.com/1471-2342/7/2
© 2007 Karaçali and Tözeren; licensee BioMed Central Ltd. This is an Open Access article distributed under the terms of the Creative Commons Attribution License (http://creativecommons.org/licenses/by/2.0), which permits unrestricted use, distribution, and reproduction in any medium, provided the original work is properly cited.
Page 1 of 20(page number not for citation purposes)
BMC Medical Imaging 2007, 7:2 http://www.biomedcentral.com/1471-2342/7/2
1 BackgroundThe standard procedure in clinical assessment of invasivebreast cancer is the classification of the tumor into one ofthe three distinct histology grades [1]. Main difficultiesrelated to grading of breast cancer in a reliable and repro-ducible fashion have been attributed by researchers to thearbitrary mathematical formula for grade assignment,observer-dependent evaluation of the grade parametersand the cellular and texture heterogeneity of the tumor[2,3]. Recent advances in global gene expression profilingand tissue microarrays have uncovered the potential ofbiomarker expression sets in clinically relevant classifica-tion and subsequent individualized treatment [4-9].
Rapid progress is being made in developing gene chipswith high diagnostic potential [10-12]. Similarly, recentadvances in the development of high density tissue micro-arrays allow the assessment of multiple protein expressionfor diagnostic and prognostic purposes over a largenumber of tissue sections from breast disease tissue banks[13-16]. Both the gene chip and tissue microarray meth-ods require sampling of the tumor tissue at a location con-taining large amounts of cancer cells. Because thesemethods are so new, standard automated protocols havenot yet been developed to identify the regions of interestin the tumor tissue. Instead, these regions are selected onthe basis of the visual evaluation of histology slide imagesby expert pathologists and as such, the molecular profil-ing obtained for the tissue with these new high through-put methods may be operator dependent. Present studyaims to develop automated procedures for identifyingcancer cell rich regions of interest in whole section histol-ogy slides for guidance in sampling tissue in constructingtissue microarrays. Our automated image processingmethod is capable of classifying breast histology imageblocks into three clusters specific to normal appearance,specific to cancerous appearance, and those that are notspecific to either. The spatial distributions of cancer-spe-cific image blocks predicted using the statistical learning
algorithms developed in this study can be used to guidethe sampling of tumor tissue for constructing tissuemicroarrays. Advanced image analysis such as those thatare present in the literature can then be utilized to processthe biomarker decorated images in tissue microarrays forclinically relevant classification of the tissue [1,17-26].
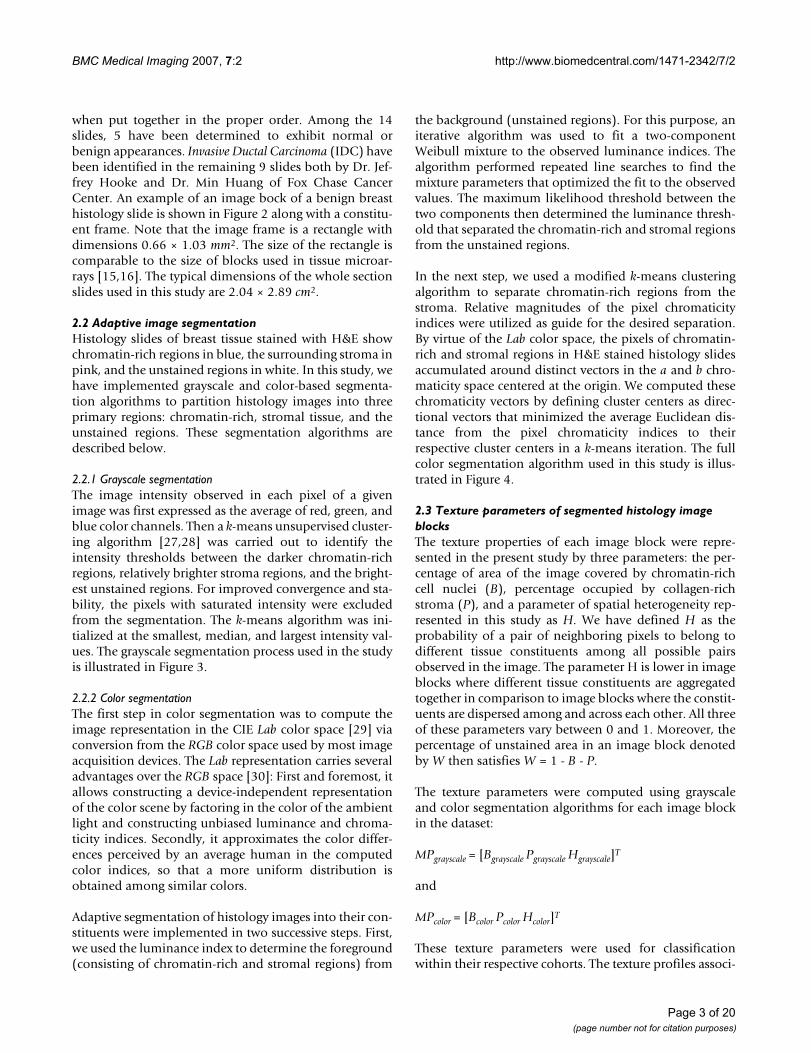
2 MethodsIn this section, we describe our dataset of image blocks,the series of automated image analysis algorithms thatwere used to collect image texture parameters for theseblocks, and the statistical learning algorithm developed inthis study to classify these blocks into normal-specific,cancer-specific, and non-specific categories. A flowchart ofthe methodology is shown in Figure 1. The details on eachstep are described below.
2.1 Histology image datasetThe image dataset used in this analysis was obtained bycapturing the digital images of 14 Hematoxylin and Eosin(H&E) stained whole section breast tissue slides from atotal of 6 specimens. This collection of histology slideswas provided to this study by Dr. Jeffrey Hooke of WalterReed Army Medical Center. Drexel University Institu-tional Review Board reviewed our research concerninghistology slides taken from breast tumors from patientswhose identities were undisclosed, and determined that itwas in compliance with Federal-Wide Assurance #00001852 on the treatment of human subjects as well asbeing in compliance with Drexel University research pol-icy involving biological samples with undisclosed privateinformation. The images were taken using a Nikon Cools-cope VS digital microscope (Nikon Corporation Co., Ltd.,Parale Mitsui Bldg., 8, Higashida-cho, Kawasaki-ku, Kawa-saki, Kanagawa, 210-0005, Japan) at 10× magnification,corresponding to a pixel size of approximately 1.37 µm ×1.37 µm. The digitization of whole section slides wasachieved in terms of consecutive frames (7817 overall forall 14 histology slides) that reconstruct a complete slide
Flowchart of the methods used to analyze image blocks and determine the normal-specific, cancer-specific, and non-specific clustersFigure 1Flowchart of the methods used to analyze image blocks and determine the normal-specific, cancer-specific, and non-specific clusters.
Page 2 of 20(page number not for citation purposes)
BMC Medical Imaging 2007, 7:2 http://www.biomedcentral.com/1471-2342/7/2
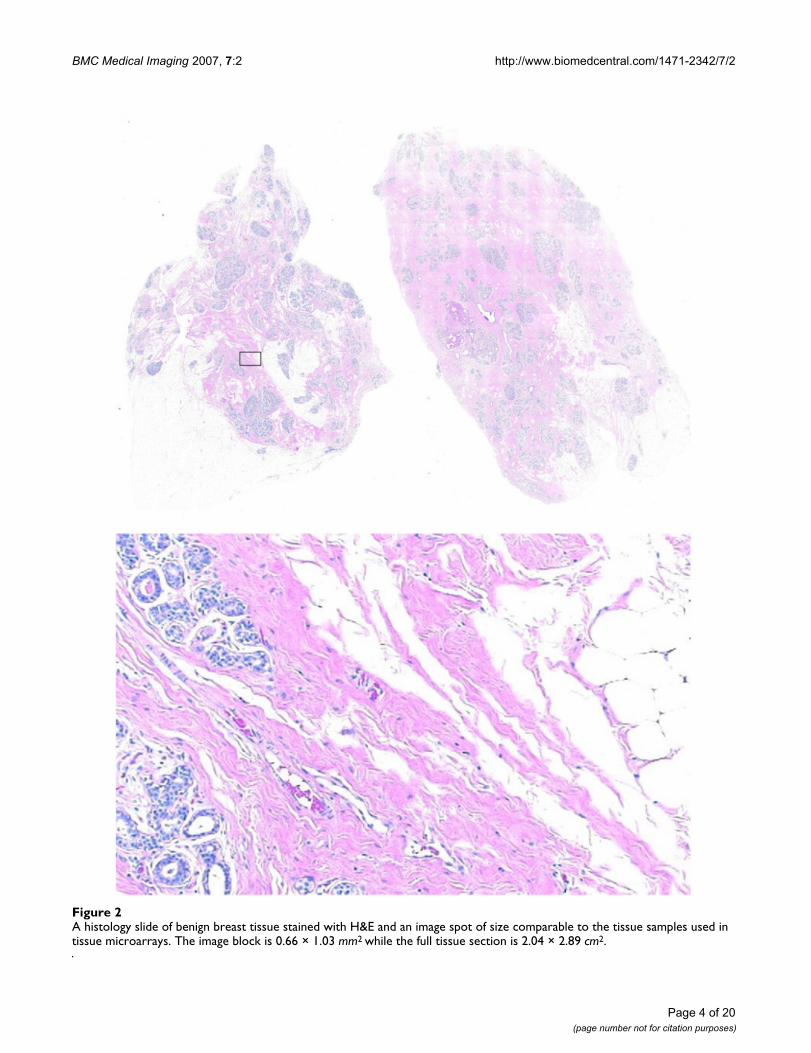
when put together in the proper order. Among the 14slides, 5 have been determined to exhibit normal orbenign appearances. Invasive Ductal Carcinoma (IDC) havebeen identified in the remaining 9 slides both by Dr. Jef-frey Hooke and Dr. Min Huang of Fox Chase CancerCenter. An example of an image bock of a benign breasthistology slide is shown in Figure 2 along with a constitu-ent frame. Note that the image frame is a rectangle withdimensions 0.66 × 1.03 mm2. The size of the rectangle iscomparable to the size of blocks used in tissue microar-rays [15,16]. The typical dimensions of the whole sectionslides used in this study are 2.04 × 2.89 cm2.
2.2 Adaptive image segmentationHistology slides of breast tissue stained with H&E showchromatin-rich regions in blue, the surrounding stroma inpink, and the unstained regions in white. In this study, wehave implemented grayscale and color-based segmenta-tion algorithms to partition histology images into threeprimary regions: chromatin-rich, stromal tissue, and theunstained regions. These segmentation algorithms aredescribed below.
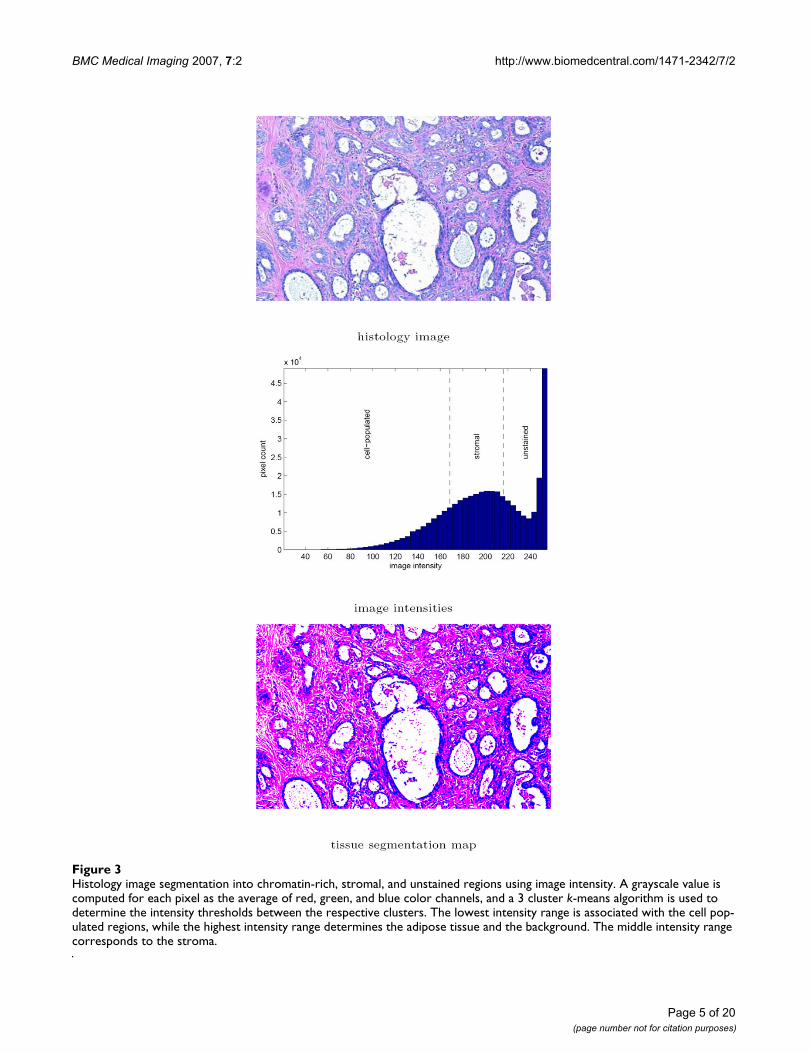
2.2.1 Grayscale segmentationThe image intensity observed in each pixel of a givenimage was first expressed as the average of red, green, andblue color channels. Then a k-means unsupervised cluster-ing algorithm [27,28] was carried out to identify theintensity thresholds between the darker chromatin-richregions, relatively brighter stroma regions, and the bright-est unstained regions. For improved convergence and sta-bility, the pixels with saturated intensity were excludedfrom the segmentation. The k-means algorithm was ini-tialized at the smallest, median, and largest intensity val-ues. The grayscale segmentation process used in the studyis illustrated in Figure 3.
2.2.2 Color segmentationThe first step in color segmentation was to compute theimage representation in the CIE Lab color space [29] viaconversion from the RGB color space used by most imageacquisition devices. The Lab representation carries severaladvantages over the RGB space [30]: First and foremost, itallows constructing a device-independent representationof the color scene by factoring in the color of the ambientlight and constructing unbiased luminance and chroma-ticity indices. Secondly, it approximates the color differ-ences perceived by an average human in the computedcolor indices, so that a more uniform distribution isobtained among similar colors.
Adaptive segmentation of histology images into their con-stituents were implemented in two successive steps. First,we used the luminance index to determine the foreground(consisting of chromatin-rich and stromal regions) from
the background (unstained regions). For this purpose, aniterative algorithm was used to fit a two-componentWeibull mixture to the observed luminance indices. Thealgorithm performed repeated line searches to find themixture parameters that optimized the fit to the observedvalues. The maximum likelihood threshold between thetwo components then determined the luminance thresh-old that separated the chromatin-rich and stromal regionsfrom the unstained regions.
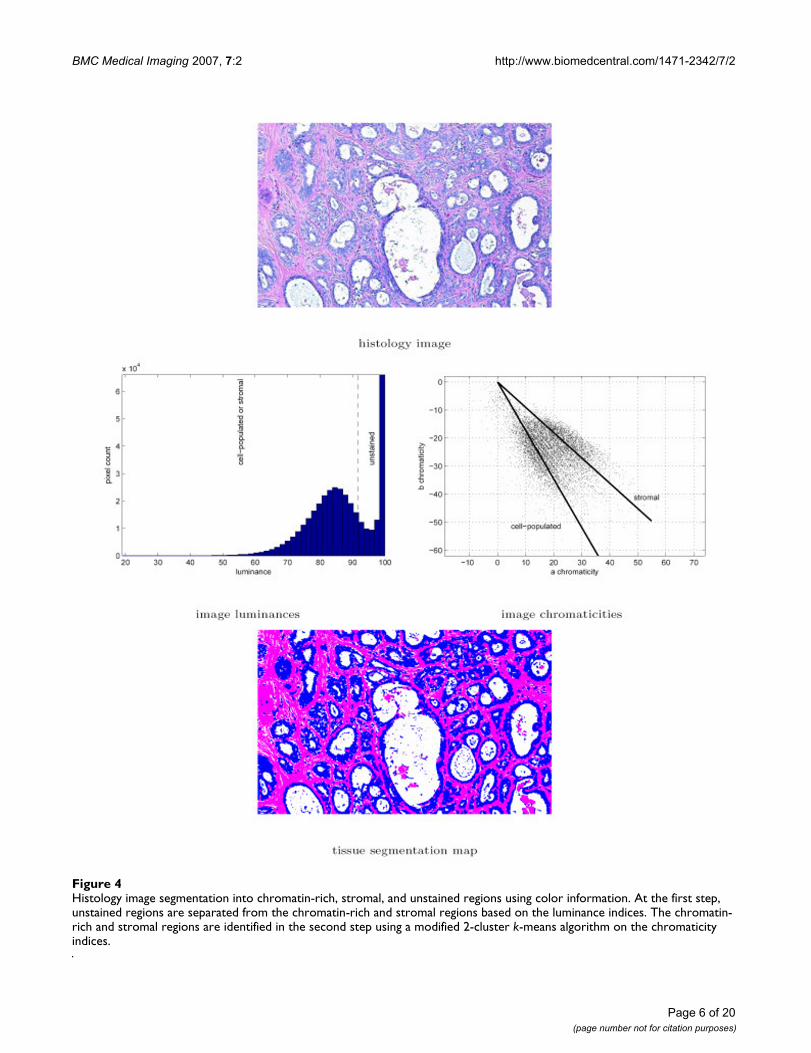
In the next step, we used a modified k-means clusteringalgorithm to separate chromatin-rich regions from thestroma. Relative magnitudes of the pixel chromaticityindices were utilized as guide for the desired separation.By virtue of the Lab color space, the pixels of chromatin-rich and stromal regions in H&E stained histology slidesaccumulated around distinct vectors in the a and b chro-maticity space centered at the origin. We computed thesechromaticity vectors by defining cluster centers as direc-tional vectors that minimized the average Euclidean dis-tance from the pixel chromaticity indices to theirrespective cluster centers in a k-means iteration. The fullcolor segmentation algorithm used in this study is illus-trated in Figure 4.
2.3 Texture parameters of segmented histology image blocksThe texture properties of each image block were repre-sented in the present study by three parameters: the per-centage of area of the image covered by chromatin-richcell nuclei (B), percentage occupied by collagen-richstroma (P), and a parameter of spatial heterogeneity rep-resented in this study as H. We have defined H as theprobability of a pair of neighboring pixels to belong todifferent tissue constituents among all possible pairsobserved in the image. The parameter H is lower in imageblocks where different tissue constituents are aggregatedtogether in comparison to image blocks where the constit-uents are dispersed among and across each other. All threeof these parameters vary between 0 and 1. Moreover, thepercentage of unstained area in an image block denotedby W then satisfies W = 1 - B - P.
The texture parameters were computed using grayscaleand color segmentation algorithms for each image blockin the dataset:
MPgrayscale = [Bgrayscale Pgrayscale Hgrayscale]T
and
MPcolor = [Bcolor Pcolor Hcolor]T
These texture parameters were used for classificationwithin their respective cohorts. The texture profiles associ-
Page 3 of 20(page number not for citation purposes)
BMC Medical Imaging 2007, 7:2 http://www.biomedcentral.com/1471-2342/7/2
Page 4 of 20(page number not for citation purposes)
A histology slide of benign breast tissue stained with H&E and an image spot of size comparable to the tissue samples used in tissue microarraysFigure 2A histology slide of benign breast tissue stained with H&E and an image spot of size comparable to the tissue samples used in tissue microarrays. The image block is 0.66 × 1.03 mm2 while the full tissue section is 2.04 × 2.89 cm2.
BMC Medical Imaging 2007, 7:2 http://www.biomedcentral.com/1471-2342/7/2
Page 5 of 20(page number not for citation purposes)
Histology image segmentation into chromatin-rich, stromal, and unstained regions using image intensityFigure 3Histology image segmentation into chromatin-rich, stromal, and unstained regions using image intensity. A grayscale value is computed for each pixel as the average of red, green, and blue color channels, and a 3 cluster k-means algorithm is used to determine the intensity thresholds between the respective clusters. The lowest intensity range is associated with the cell pop-ulated regions, while the highest intensity range determines the adipose tissue and the background. The middle intensity range corresponds to the stroma.
BMC Medical Imaging 2007, 7:2 http://www.biomedcentral.com/1471-2342/7/2
Page 6 of 20(page number not for citation purposes)
Histology image segmentation into chromatin-rich, stromal, and unstained regions using color informationFigure 4Histology image segmentation into chromatin-rich, stromal, and unstained regions using color information. At the first step, unstained regions are separated from the chromatin-rich and stromal regions based on the luminance indices. The chromatin-rich and stromal regions are identified in the second step using a modified 2-cluster k-means algorithm on the chromaticity indices.
BMC Medical Imaging 2007, 7:2 http://www.biomedcentral.com/1471-2342/7/2
ated with the image block in Figures 3 and 4 are MPgrayscale= [0.2105 0.4108 0.2397]T and MPcolor = [0.3682 0.32330.1176]T based on the tissue segmentation maps obtainedusing the two segmentation methods.
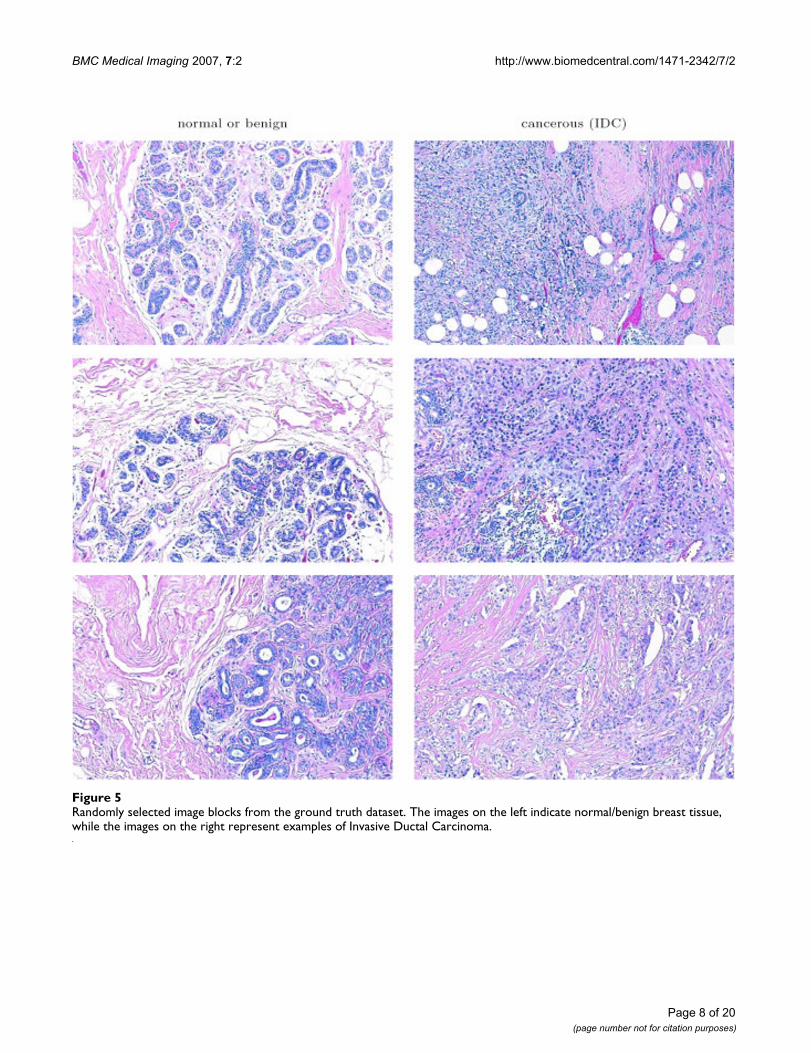
Image blocks that contained extensive fat or unstainedregion were excluded from our dataset via the use of aground truth data subset. This subset contained 16 framesof benign presentation and 20 frames of IDC. Randomlyselected elements of this subset are shown in Figure 5. Theground truth data subset was used to estimate the upperbound for unstained regions in both cancerous andbenign tissue in cell crowded regions. Image blocks thathad white in amounts greater than this upper bound wereeliminated from the dataset for further analysis. Theresulting dataset contained 2395 image blocks for whichimage texture analysis was conducted.
2.4 Statistical learning for detecting cancer-specific tissue image regionsImage blocks in our dataset were classified using the B, P,and H values for each block into three clusters: thoseobserved in normal (N) or cancerous specimens (C) alongwith those observed frequently in both tissue types (G).To this end, we estimated the log-likelihood ratios ofprobability density functions that govern the distributionsof texture profiles of image blocks obtained from normaland cancerous whole section slides. This estimation wasperformed using a nonparametric method at each imageblock described below.
Let pn and pc denote the probability density functions forthe texture profiles of image blocks observed in normaland cancerous specimens. We defined the normal-spe-cific, cancer-specific, and non-specific image block clus-ters based on their texture profiles as
where N, C, and G denote the three clusters, and τ =log(95/5) is the 95% specificity threshold that ensuresthat no more than 5% of image blocks assigned to nor-mal-specific and cancer-specific clusters are mislabeled.
We estimated the likelihood ratio pn (MP)/pc (MP) for atexture profile MP using an asymptotic property of a near-est neighbor classification rule. Suppose a texture profileMP is given, and a series of nearest neighbor classifiershave been invoked using randomly selected referencedatasets with N samples observed in normal slides and Nsamples observed from cancerous slides. Suppose alsothat out of a total of M such classifications, the profile MPis assigned to the normal class Mn times and to the cancer-ous class Mc = M - Mn times. It can be shown that for largeN and large M, pn (MP)/pc (MP) � Mn/Mc.
Let n and c represent the classes of texture profiles col-
lected from normal and cancerous histology slides respec-tively. Given the texture profiles {MPi}, i = 1, ..., �,
collected from image blocks observed in normal and can-cerous histology slides, we first normalized the corre-sponding texture parameters observed across the datasetso that they span the range [0, 1] as uniformly as possible,and then used the algorithm below to estimate their like-lihood ratios.
• initialize = 0 and = 0 for all i = 1, ..., �
• for j = 1, ..., M do
- randomly select N texture profiles of image blocksobserved in normal histology slides and N profiles fromthose observed in cancerous slides
- collect all selected profiles into a reference dataset
- assign each texture profile to n or c using a nearest
neighbor rule based on the reference dataset
- for i = 1, ..., � do
* if MPi is not in the reference dataset, then
• if MPi is assigned to n, increment ← + 1
• if MPi is assigned to c, increment ← + 1
• for i = 1, ..., � do
- for each texture profile MPi, compute the estimated log-
likelihood ratio LLRi = /
The number of times different texture profiles (B, P, H)were evaluated in classification varied according to a Pois-
N =
>
( )MP
p MP
p MPn
clog
( )
( )τ 1
C =
< −
( )MP
p MP
p MPn
clog
( )
( )τ 2
G =
≤
≥ −
MP
p MP
p MP
p MP
p MPn
c
n
clog
( )
( )log
( )
( )τ τ and
( )3
Mni Mc
i
Mni Mn
i
Mci Mc
i
Mni Mc
i
Page 7 of 20(page number not for citation purposes)
BMC Medical Imaging 2007, 7:2 http://www.biomedcentral.com/1471-2342/7/2
Page 8 of 20(page number not for citation purposes)
Randomly selected image blocks from the ground truth datasetFigure 5Randomly selected image blocks from the ground truth dataset. The images on the left indicate normal/benign breast tissue, while the images on the right represent examples of Invasive Ductal Carcinoma.
BMC Medical Imaging 2007, 7:2 http://www.biomedcentral.com/1471-2342/7/2
son distribution controlled by N and the total number of
samples in n and c. Thus, the number of repetitions M
could be adjusted so that most of the samples were testedat least a predetermined number of times.
In order to refine the estimated log-likelihood ratios, weused a support vector regression algorithm operated by a
radial basis function kernel [31-33] for an ε-insensitive
cost function with ε = log( ). This final step ensuredthat the log-likelihood ratios varied smoothly across thetexture feature profiles and substantially improved thereliability of the estimates.
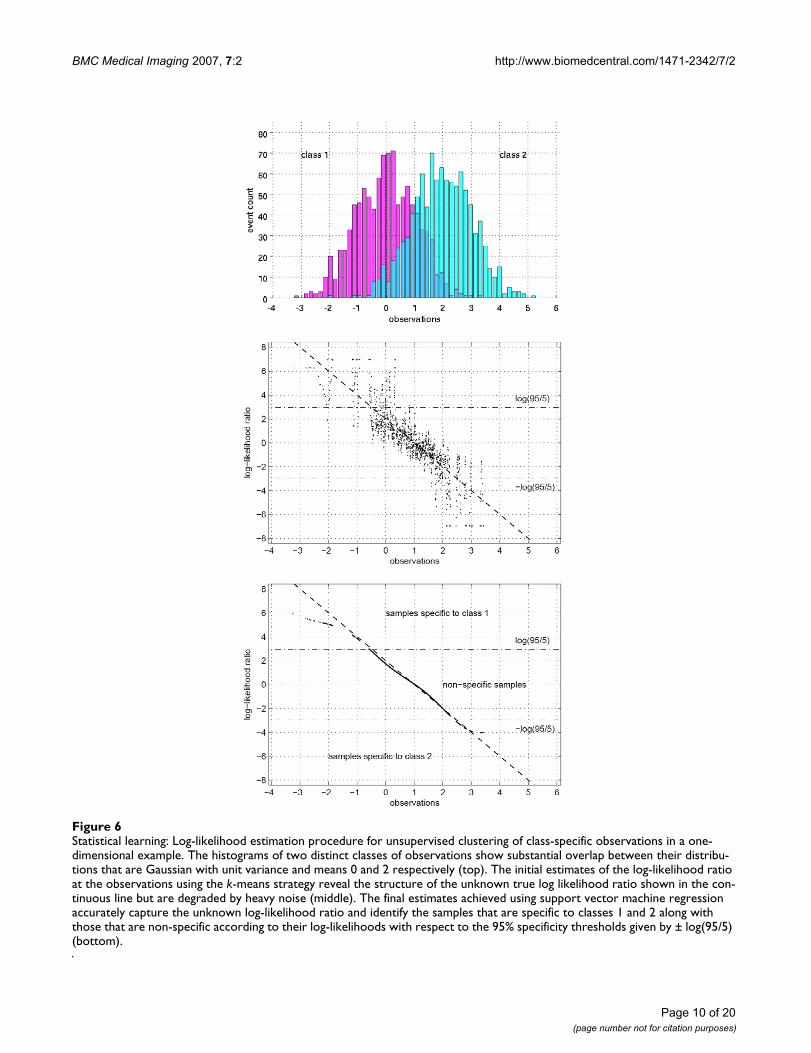
The complete procedure used to estimate log-likelihoodratios at observed data points is illustrated in Figure 6.Two separate classes are shown with 1000 samples each,with Gaussian distributions at respective means 0 and 2and unit variances. The procedure to estimate the log-like-lihood ratios of the two classes at the observed samplesrepeated 1000 times provides noisy estimates, while thesupport vector machine regression estimate accuratelycaptures the unknown true log-likelihood ratio. Note thatonly the samples over which at least one misclassificationhas been observed are included in the support vectorregression procedure since the others do not carry anyinformation on the log-likelihood ratios of the two classesat their specific locations in the observation space.
3 ResultsThis section presents our results on the segmentation ofimage blocks; distribution of texture parameters B, P, andH in the dataset of image blocks; the normal-specific, can-cer-specific, and non-specific image block clusters; andtheir spatial distributions across histology slide images.Image regions that are comprised of cancer-specific blocksare considered as regions of interest and this informationis utilized in sampling of the tumor tissue for constructingtissue microarrays with significant clinical relevance.Computations were carried out in parallel using grayscaleand color tissue segmentation methods and results arepresented for both segmentation methods.
3.1 Comparison of texture profiles via grayscale and color segmentationThe grayscale tissue segmentation algorithms used in thisstudy relies on the image intensities whereas the color tis-sue segmentation algorithms utilizes image luminance toidentify the unstained regions first, and then uses imagechromaticity indices to differentiate between the chroma-tin-rich and stromal regions. The examples in Figures 3and 4 show that the tissue segmentation maps achievedby the two methods vary, and this variation is reflected onthe texture parameters (B, P, and H) estimated for each
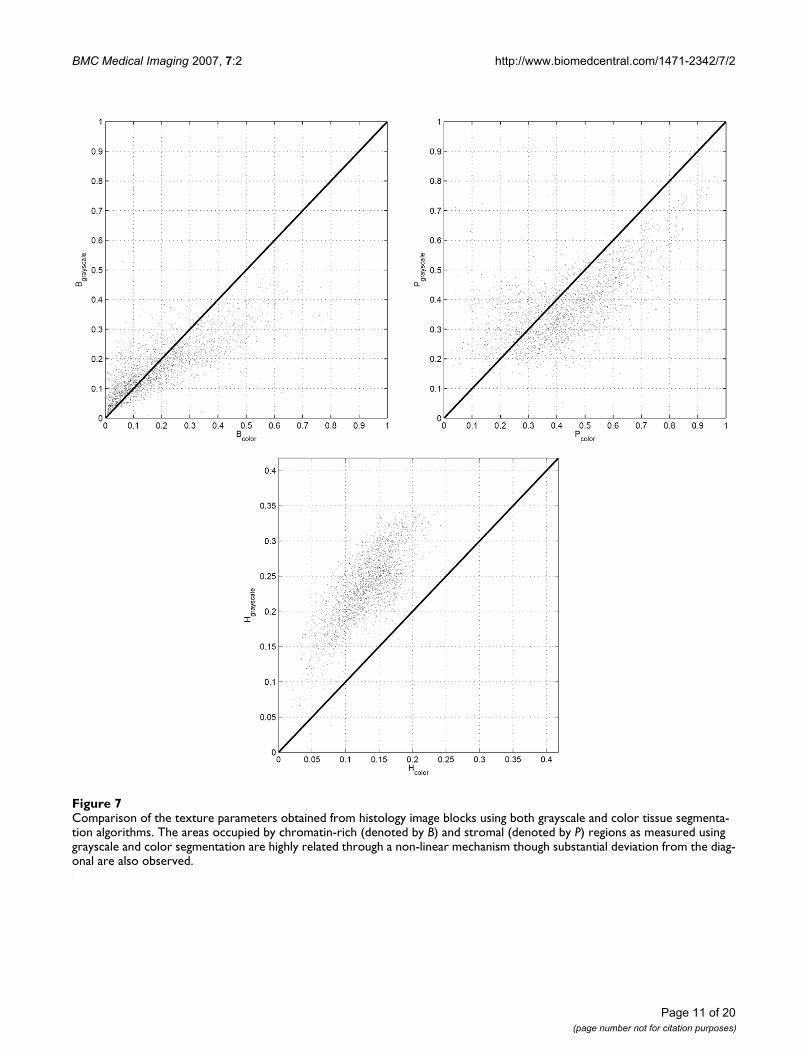
image block using two different segmentation algorithms.Note that B and P represent the percentages of area of theimage occupied by chromatin and stroma respectively,whereas H was defined in the Methods Section as a meas-ure of heterogeneity in the image block. Scatter plots of B,P, and H obtained for each image block in the datasetalgorithms are shown in Figure 7 for grayscale and colortissue segmentation. The figure indicates that the parame-ters B, P, and H vary significantly when computed by thetwo different segmentation methods for the same imageblock. For B and P, the relationship between the grayscaleand color tissue segmentation measurements follows anonlinear pattern. The grayscale segmentation algorithmprovides larger values than the color segmentation whenB and P are relatively low, and vice versa. This can beattributed to the preference of the k-means algorithm thatforms the basis of grayscale segmentation to produce clus-ters of similar sizes, potentially leading to over-expressedvalues when they are low and under-expressed valueswhen they are high. The scatter plot of the heterogeneityindices show a systematic difference between the two seg-mentation methods as H is estimated larger in grayscalesegmentation than color segmentation. This can also beseen visually in the segmentation maps in Figures 3 and 4where the map obtained by grayscale tissue segmentationis noticeably more grainy than the one obtained usingcolor tissue segmentation, suggesting that color is morehomogeneous across H&E stained tissue histology imagesthan intensity. Since it is not possible to quantitativelydetermine which algorithm provides more accurate seg-mentation maps, we conducted the subsequent analysisusing both segmentation algorithms in parallel. In theanalysis of comprehensive image subsets involving differ-ent types of malignancy and/or tumors of differentorgans, the parameter set used in this article (B, P, H) canreadily be revised and enriched with additional textureparameters causing minimal change in the rest of the log-likelihood estimation algorithm.
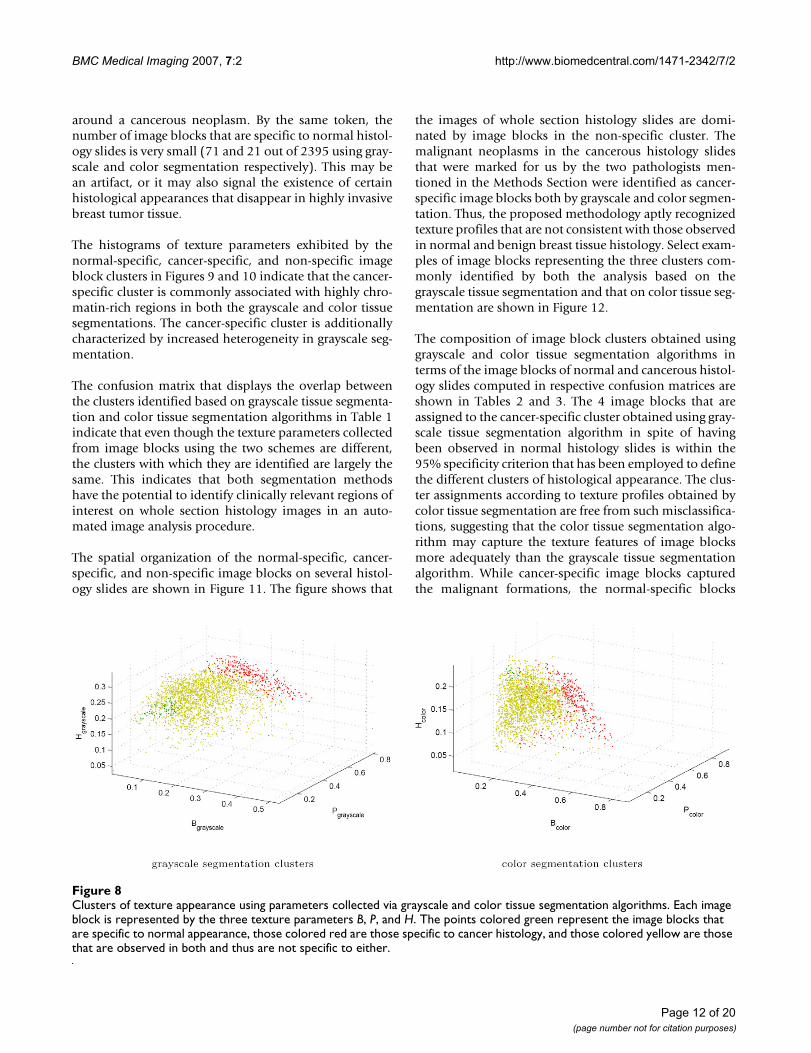
3.2 Detection of cancer-specific image blocks using statistical learningWe have determined the (B, P, H) profiles of the 2395image blocks in our dataset. These texture features werethen used as described in the Methods Section to classifythe image blocks into three clusters: those that are specificto normal (N) and cancerous histology slides (C) andthose that exhibit no particular specificity to cancer ornormal tissue (G). The texture profiles of the normal-spe-cific, cancer-specific, and non-specific image blocks asidentified separately using grayscale and color tissue seg-mentation algorithms are shown in Figure 8. Not surpris-ingly, the bulk of the image blocks show no particularpreference to either normal or cancerous histology slides,since a great portion of histology slides of cancerous sam-ples are often occupied by normal appearing tissue
2
Page 9 of 20(page number not for citation purposes)
BMC Medical Imaging 2007, 7:2 http://www.biomedcentral.com/1471-2342/7/2
Page 10 of 20(page number not for citation purposes)
Statistical learning: Log-likelihood estimation procedure for unsupervised clustering of class-specific observations in a one-dimensional exampleFigure 6Statistical learning: Log-likelihood estimation procedure for unsupervised clustering of class-specific observations in a one-dimensional example. The histograms of two distinct classes of observations show substantial overlap between their distribu-tions that are Gaussian with unit variance and means 0 and 2 respectively (top). The initial estimates of the log-likelihood ratio at the observations using the k-means strategy reveal the structure of the unknown true log likelihood ratio shown in the con-tinuous line but are degraded by heavy noise (middle). The final estimates achieved using support vector machine regression accurately capture the unknown log-likelihood ratio and identify the samples that are specific to classes 1 and 2 along with those that are non-specific according to their log-likelihoods with respect to the 95% specificity thresholds given by ± log(95/5) (bottom).
BMC Medical Imaging 2007, 7:2 http://www.biomedcentral.com/1471-2342/7/2
Page 11 of 20(page number not for citation purposes)
Comparison of the texture parameters obtained from histology image blocks using both grayscale and color tissue segmenta-tion algorithmsFigure 7Comparison of the texture parameters obtained from histology image blocks using both grayscale and color tissue segmenta-tion algorithms. The areas occupied by chromatin-rich (denoted by B) and stromal (denoted by P) regions as measured using grayscale and color segmentation are highly related through a non-linear mechanism though substantial deviation from the diag-onal are also observed.
BMC Medical Imaging 2007, 7:2 http://www.biomedcentral.com/1471-2342/7/2
around a cancerous neoplasm. By the same token, thenumber of image blocks that are specific to normal histol-ogy slides is very small (71 and 21 out of 2395 using gray-scale and color segmentation respectively). This may bean artifact, or it may also signal the existence of certainhistological appearances that disappear in highly invasivebreast tumor tissue.
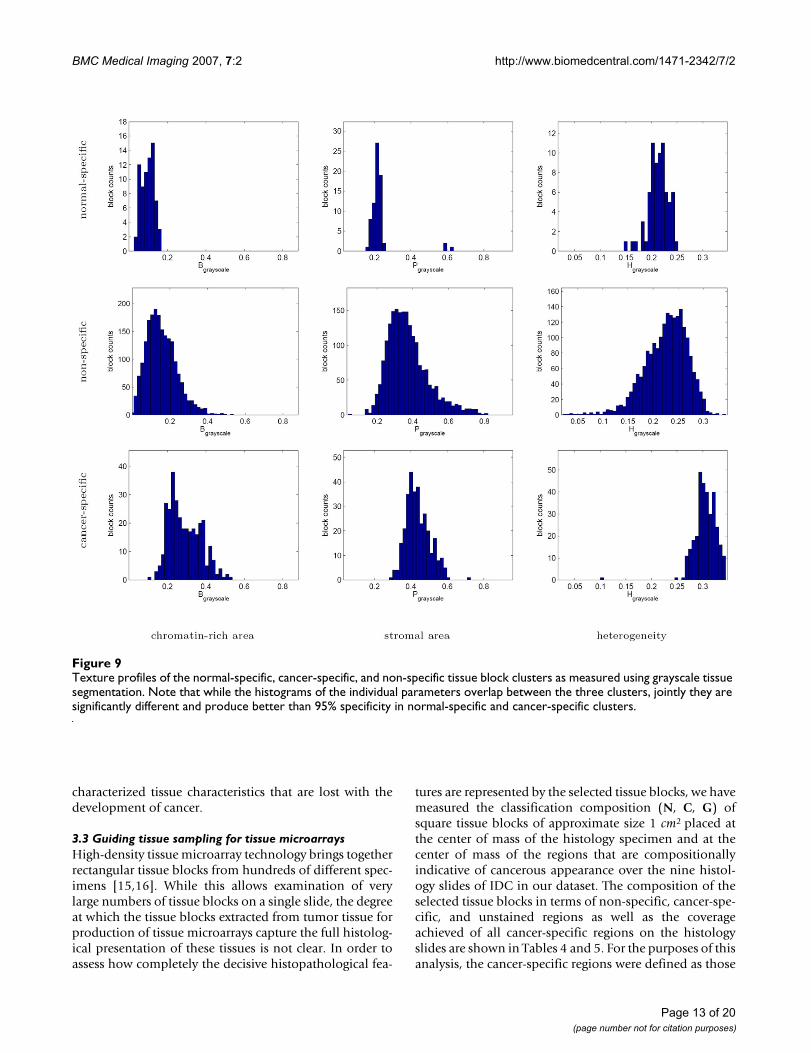
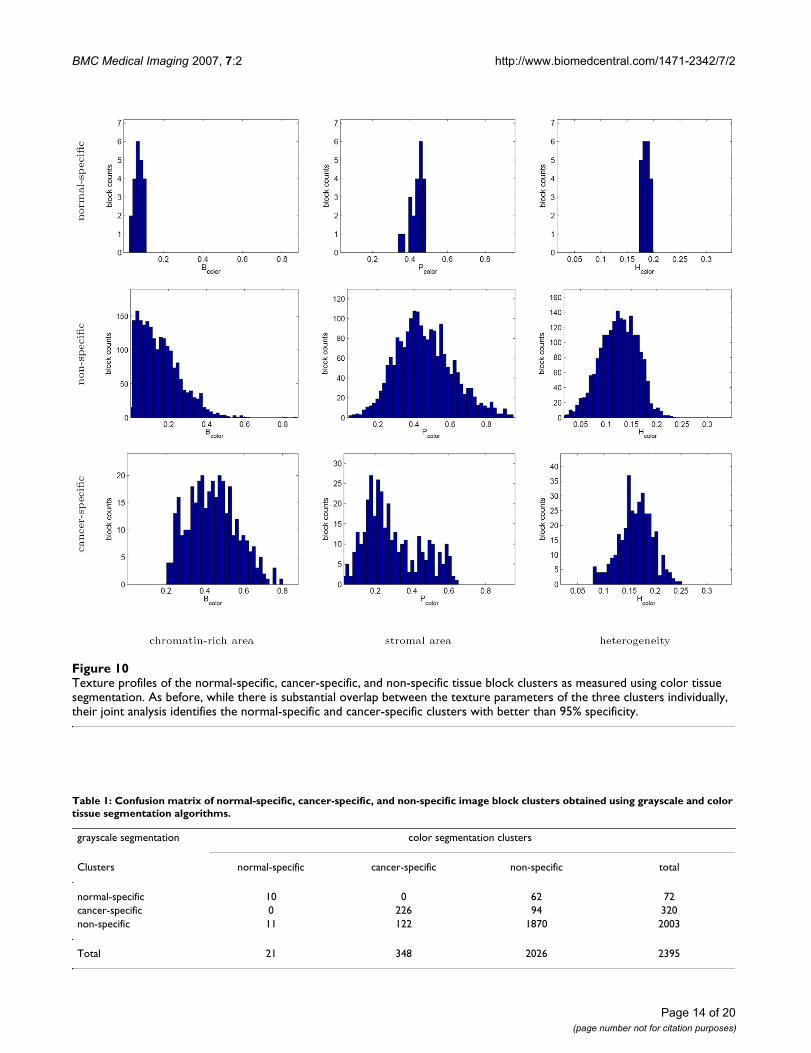
The histograms of texture parameters exhibited by thenormal-specific, cancer-specific, and non-specific imageblock clusters in Figures 9 and 10 indicate that the cancer-specific cluster is commonly associated with highly chro-matin-rich regions in both the grayscale and color tissuesegmentations. The cancer-specific cluster is additionallycharacterized by increased heterogeneity in grayscale seg-mentation.
The confusion matrix that displays the overlap betweenthe clusters identified based on grayscale tissue segmenta-tion and color tissue segmentation algorithms in Table 1indicate that even though the texture parameters collectedfrom image blocks using the two schemes are different,the clusters with which they are identified are largely thesame. This indicates that both segmentation methodshave the potential to identify clinically relevant regions ofinterest on whole section histology images in an auto-mated image analysis procedure.
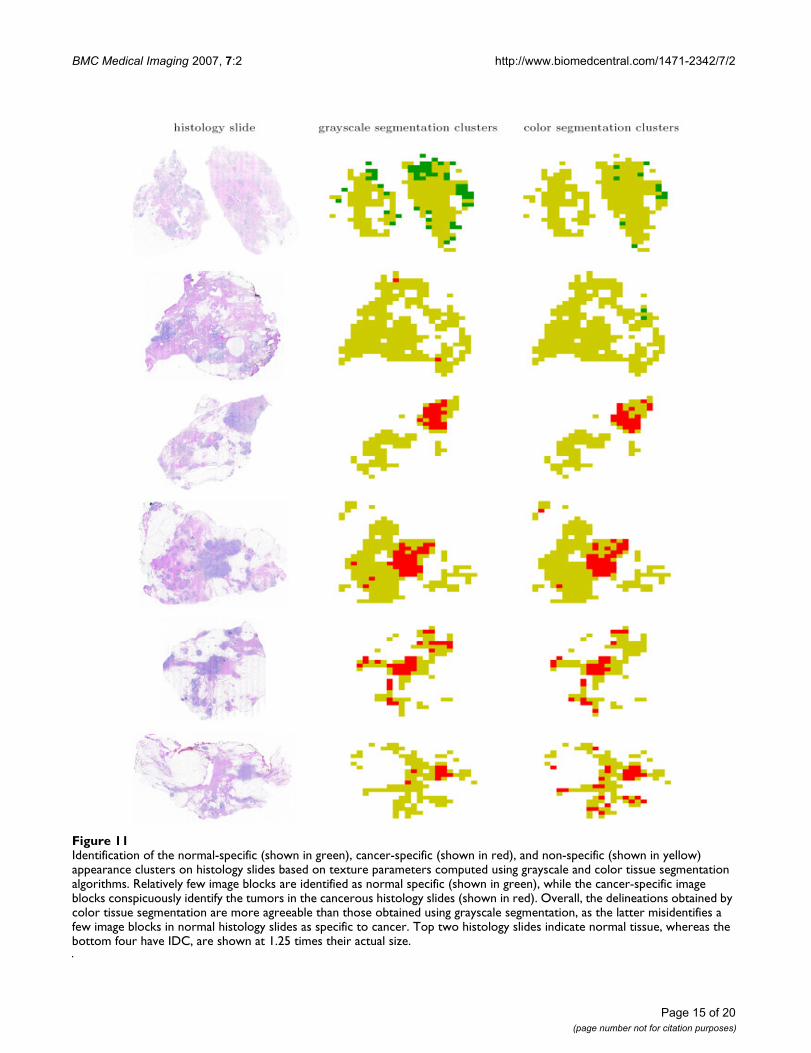
The spatial organization of the normal-specific, cancer-specific, and non-specific image blocks on several histol-ogy slides are shown in Figure 11. The figure shows that
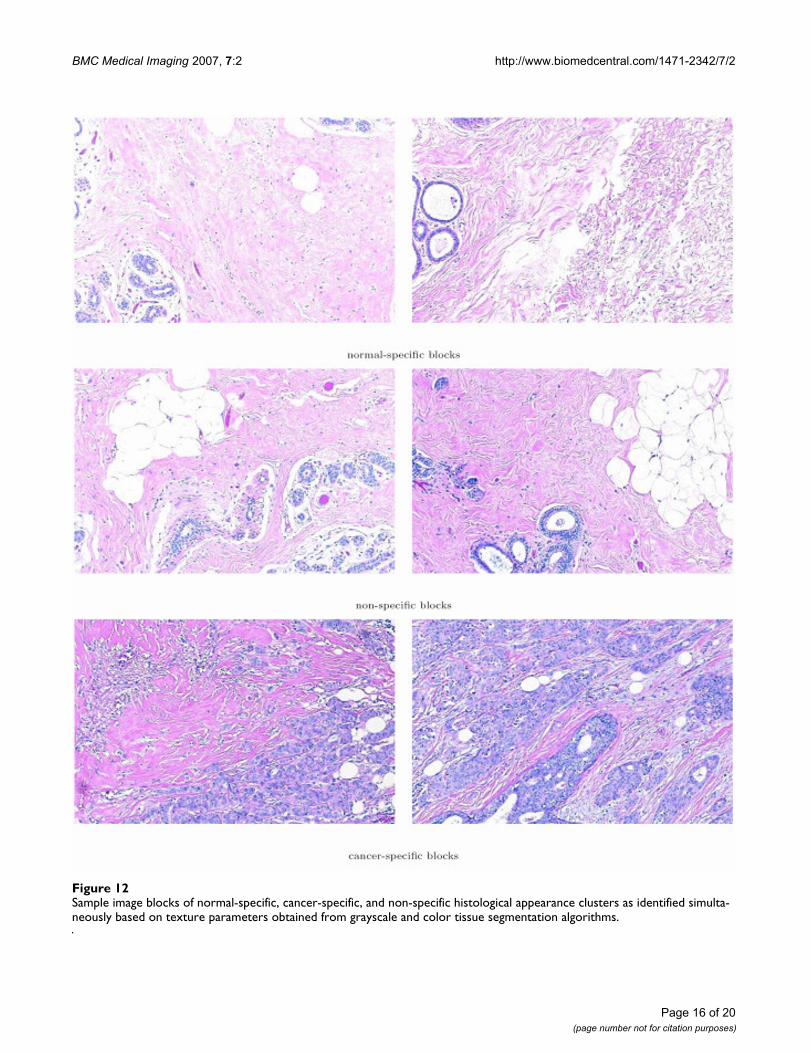
the images of whole section histology slides are domi-nated by image blocks in the non-specific cluster. Themalignant neoplasms in the cancerous histology slidesthat were marked for us by the two pathologists men-tioned in the Methods Section were identified as cancer-specific image blocks both by grayscale and color segmen-tation. Thus, the proposed methodology aptly recognizedtexture profiles that are not consistent with those observedin normal and benign breast tissue histology. Select exam-ples of image blocks representing the three clusters com-monly identified by both the analysis based on thegrayscale tissue segmentation and that on color tissue seg-mentation are shown in Figure 12.
The composition of image block clusters obtained usinggrayscale and color tissue segmentation algorithms interms of the image blocks of normal and cancerous histol-ogy slides computed in respective confusion matrices areshown in Tables 2 and 3. The 4 image blocks that areassigned to the cancer-specific cluster obtained using gray-scale tissue segmentation algorithm in spite of havingbeen observed in normal histology slides is within the95% specificity criterion that has been employed to definethe different clusters of histological appearance. The clus-ter assignments according to texture profiles obtained bycolor tissue segmentation are free from such misclassifica-tions, suggesting that the color tissue segmentation algo-rithm may capture the texture features of image blocksmore adequately than the grayscale tissue segmentationalgorithm. While cancer-specific image blocks capturedthe malignant formations, the normal-specific blocks
Clusters of texture appearance using parameters collected via grayscale and color tissue segmentation algorithmsFigure 8Clusters of texture appearance using parameters collected via grayscale and color tissue segmentation algorithms. Each image block is represented by the three texture parameters B, P, and H. The points colored green represent the image blocks that are specific to normal appearance, those colored red are those specific to cancer histology, and those colored yellow are those that are observed in both and thus are not specific to either.
Page 12 of 20(page number not for citation purposes)
BMC Medical Imaging 2007, 7:2 http://www.biomedcentral.com/1471-2342/7/2
characterized tissue characteristics that are lost with thedevelopment of cancer.
3.3 Guiding tissue sampling for tissue microarraysHigh-density tissue microarray technology brings togetherrectangular tissue blocks from hundreds of different spec-imens [15,16]. While this allows examination of verylarge numbers of tissue blocks on a single slide, the degreeat which the tissue blocks extracted from tumor tissue forproduction of tissue microarrays capture the full histolog-ical presentation of these tissues is not clear. In order toassess how completely the decisive histopathological fea-
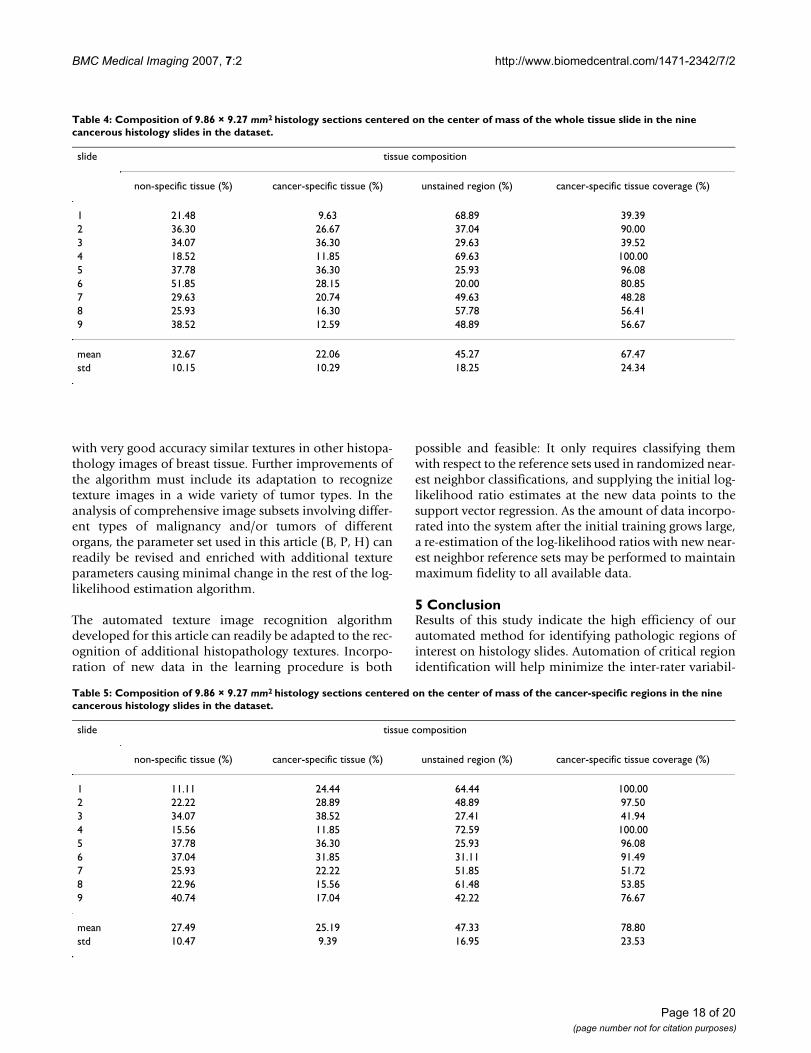
tures are represented by the selected tissue blocks, we havemeasured the classification composition (N, C, G) ofsquare tissue blocks of approximate size 1 cm2 placed atthe center of mass of the histology specimen and at thecenter of mass of the regions that are compositionallyindicative of cancerous appearance over the nine histol-ogy slides of IDC in our dataset. The composition of theselected tissue blocks in terms of non-specific, cancer-spe-cific, and unstained regions as well as the coverageachieved of all cancer-specific regions on the histologyslides are shown in Tables 4 and 5. For the purposes of thisanalysis, the cancer-specific regions were defined as those
Texture profiles of the normal-specific, cancer-specific, and non-specific tissue block clusters as measured using grayscale tissue segmentationFigure 9Texture profiles of the normal-specific, cancer-specific, and non-specific tissue block clusters as measured using grayscale tissue segmentation. Note that while the histograms of the individual parameters overlap between the three clusters, jointly they are significantly different and produce better than 95% specificity in normal-specific and cancer-specific clusters.
Page 13 of 20(page number not for citation purposes)
BMC Medical Imaging 2007, 7:2 http://www.biomedcentral.com/1471-2342/7/2
Page 14 of 20(page number not for citation purposes)
Table 1: Confusion matrix of normal-specific, cancer-specific, and non-specific image block clusters obtained using grayscale and color tissue segmentation algorithms.
grayscale segmentation color segmentation clusters
Clusters normal-specific cancer-specific non-specific total
normal-specific 10 0 62 72cancer-specific 0 226 94 320non-specific 11 122 1870 2003
Total 21 348 2026 2395
Texture profiles of the normal-specific, cancer-specific, and non-specific tissue block clusters as measured using color tissue segmentationFigure 10Texture profiles of the normal-specific, cancer-specific, and non-specific tissue block clusters as measured using color tissue segmentation. As before, while there is substantial overlap between the texture parameters of the three clusters individually, their joint analysis identifies the normal-specific and cancer-specific clusters with better than 95% specificity.
BMC Medical Imaging 2007, 7:2 http://www.biomedcentral.com/1471-2342/7/2
Page 15 of 20(page number not for citation purposes)
Identification of the normal-specific (shown in green), cancer-specific (shown in red), and non-specific (shown in yellow) appearance clusters on histology slides based on texture parameters computed using grayscale and color tissue segmentation algorithmsFigure 11Identification of the normal-specific (shown in green), cancer-specific (shown in red), and non-specific (shown in yellow) appearance clusters on histology slides based on texture parameters computed using grayscale and color tissue segmentation algorithms. Relatively few image blocks are identified as normal specific (shown in green), while the cancer-specific image blocks conspicuously identify the tumors in the cancerous histology slides (shown in red). Overall, the delineations obtained by color tissue segmentation are more agreeable than those obtained using grayscale segmentation, as the latter misidentifies a few image blocks in normal histology slides as specific to cancer. Top two histology slides indicate normal tissue, whereas the bottom four have IDC, are shown at 1.25 times their actual size.
BMC Medical Imaging 2007, 7:2 http://www.biomedcentral.com/1471-2342/7/2
Page 16 of 20(page number not for citation purposes)
Sample image blocks of normal-specific, cancer-specific, and non-specific histological appearance clusters as identified simulta-neously based on texture parameters obtained from grayscale and color tissue segmentation algorithmsFigure 12Sample image blocks of normal-specific, cancer-specific, and non-specific histological appearance clusters as identified simulta-neously based on texture parameters obtained from grayscale and color tissue segmentation algorithms.
BMC Medical Imaging 2007, 7:2 http://www.biomedcentral.com/1471-2342/7/2
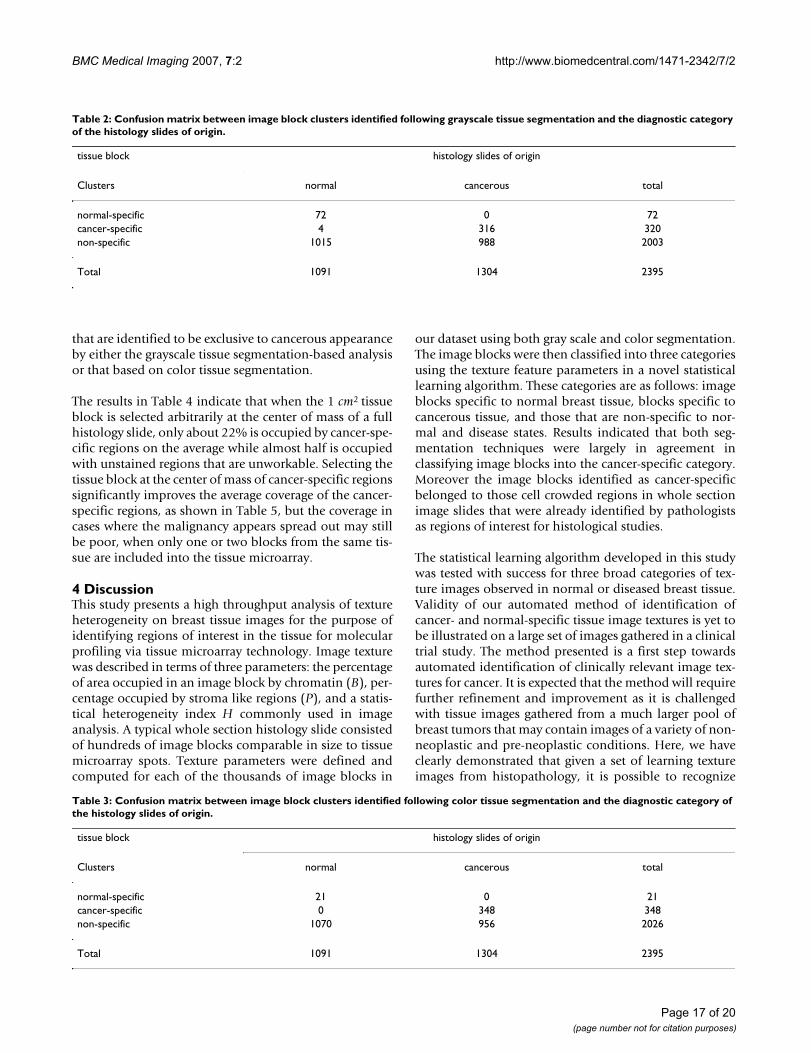
that are identified to be exclusive to cancerous appearanceby either the grayscale tissue segmentation-based analysisor that based on color tissue segmentation.
The results in Table 4 indicate that when the 1 cm2 tissueblock is selected arbitrarily at the center of mass of a fullhistology slide, only about 22% is occupied by cancer-spe-cific regions on the average while almost half is occupiedwith unstained regions that are unworkable. Selecting thetissue block at the center of mass of cancer-specific regionssignificantly improves the average coverage of the cancer-specific regions, as shown in Table 5, but the coverage incases where the malignancy appears spread out may stillbe poor, when only one or two blocks from the same tis-sue are included into the tissue microarray.
4 DiscussionThis study presents a high throughput analysis of textureheterogeneity on breast tissue images for the purpose ofidentifying regions of interest in the tissue for molecularprofiling via tissue microarray technology. Image texturewas described in terms of three parameters: the percentageof area occupied in an image block by chromatin (B), per-centage occupied by stroma like regions (P), and a statis-tical heterogeneity index H commonly used in imageanalysis. A typical whole section histology slide consistedof hundreds of image blocks comparable in size to tissuemicroarray spots. Texture parameters were defined andcomputed for each of the thousands of image blocks in
our dataset using both gray scale and color segmentation.The image blocks were then classified into three categoriesusing the texture feature parameters in a novel statisticallearning algorithm. These categories are as follows: imageblocks specific to normal breast tissue, blocks specific tocancerous tissue, and those that are non-specific to nor-mal and disease states. Results indicated that both seg-mentation techniques were largely in agreement inclassifying image blocks into the cancer-specific category.Moreover the image blocks identified as cancer-specificbelonged to those cell crowded regions in whole sectionimage slides that were already identified by pathologistsas regions of interest for histological studies.
The statistical learning algorithm developed in this studywas tested with success for three broad categories of tex-ture images observed in normal or diseased breast tissue.Validity of our automated method of identification ofcancer- and normal-specific tissue image textures is yet tobe illustrated on a large set of images gathered in a clinicaltrial study. The method presented is a first step towardsautomated identification of clinically relevant image tex-tures for cancer. It is expected that the method will requirefurther refinement and improvement as it is challengedwith tissue images gathered from a much larger pool ofbreast tumors that may contain images of a variety of non-neoplastic and pre-neoplastic conditions. Here, we haveclearly demonstrated that given a set of learning textureimages from histopathology, it is possible to recognize
Table 3: Confusion matrix between image block clusters identified following color tissue segmentation and the diagnostic category of the histology slides of origin.
tissue block histology slides of origin
Clusters normal cancerous total
normal-specific 21 0 21cancer-specific 0 348 348non-specific 1070 956 2026
Total 1091 1304 2395
Table 2: Confusion matrix between image block clusters identified following grayscale tissue segmentation and the diagnostic category of the histology slides of origin.
tissue block histology slides of origin
Clusters normal cancerous total
normal-specific 72 0 72cancer-specific 4 316 320non-specific 1015 988 2003
Total 1091 1304 2395
Page 17 of 20(page number not for citation purposes)
BMC Medical Imaging 2007, 7:2 http://www.biomedcentral.com/1471-2342/7/2
with very good accuracy similar textures in other histopa-thology images of breast tissue. Further improvements ofthe algorithm must include its adaptation to recognizetexture images in a wide variety of tumor types. In theanalysis of comprehensive image subsets involving differ-ent types of malignancy and/or tumors of differentorgans, the parameter set used in this article (B, P, H) canreadily be revised and enriched with additional textureparameters causing minimal change in the rest of the log-likelihood estimation algorithm.
The automated texture image recognition algorithmdeveloped for this article can readily be adapted to the rec-ognition of additional histopathology textures. Incorpo-ration of new data in the learning procedure is both
possible and feasible: It only requires classifying themwith respect to the reference sets used in randomized near-est neighbor classifications, and supplying the initial log-likelihood ratio estimates at the new data points to thesupport vector regression. As the amount of data incorpo-rated into the system after the initial training grows large,a re-estimation of the log-likelihood ratios with new near-est neighbor reference sets may be performed to maintainmaximum fidelity to all available data.
5 ConclusionResults of this study indicate the high efficiency of ourautomated method for identifying pathologic regions ofinterest on histology slides. Automation of critical regionidentification will help minimize the inter-rater variabil-
Table 5: Composition of 9.86 × 9.27 mm2 histology sections centered on the center of mass of the cancer-specific regions in the nine cancerous histology slides in the dataset.
slide tissue composition
non-specific tissue (%) cancer-specific tissue (%) unstained region (%) cancer-specific tissue coverage (%)
1 11.11 24.44 64.44 100.002 22.22 28.89 48.89 97.503 34.07 38.52 27.41 41.944 15.56 11.85 72.59 100.005 37.78 36.30 25.93 96.086 37.04 31.85 31.11 91.497 25.93 22.22 51.85 51.728 22.96 15.56 61.48 53.859 40.74 17.04 42.22 76.67
mean 27.49 25.19 47.33 78.80std 10.47 9.39 16.95 23.53
Table 4: Composition of 9.86 × 9.27 mm2 histology sections centered on the center of mass of the whole tissue slide in the nine cancerous histology slides in the dataset.
slide tissue composition
non-specific tissue (%) cancer-specific tissue (%) unstained region (%) cancer-specific tissue coverage (%)
1 21.48 9.63 68.89 39.392 36.30 26.67 37.04 90.003 34.07 36.30 29.63 39.524 18.52 11.85 69.63 100.005 37.78 36.30 25.93 96.086 51.85 28.15 20.00 80.857 29.63 20.74 49.63 48.288 25.93 16.30 57.78 56.419 38.52 12.59 48.89 56.67
mean 32.67 22.06 45.27 67.47std 10.15 10.29 18.25 24.34
Page 18 of 20(page number not for citation purposes)
BMC Medical Imaging 2007, 7:2 http://www.biomedcentral.com/1471-2342/7/2
ity among different raters (pathologists) as hundreds oftumors that are used to develop an array have typicallybeen evaluated (graded) by different pathologists. Theregion of interest information gathered from the wholesection images will guide the excision of tissue for highthroughput profiling of global gene expression. Recentstudies by Schuetz et al. [34], Yang et al. [35], and Murphyet al. [36] indicate the importance of choosing the tissuesample for global gene expression profiling via imageassessment of tissue texture. These studies utilize the lasercapture microdissection tool to dissect regions of interestassessed by pathologists via microscopic examination.The procedure developed in this article would automatethis process and eliminate possible human eye bias affect-ing the resultant data on the levels of activation of nearly40000 genes.
Our method will play a similarly positive role in samplingtissue for tissue microarrays [16,37,38]. These tissue chipsconsist of paraffin blocks in which up to several thousandseparate tissue cores are assembled in array fashion toallow simultaneous analysis of biomarker presence andabsence as well as their spatial distribution. The recentadvances in nanotechnology employing quantum dotsallow multiple biomarkers to be shown on the images ofthe same array [39,40] and therefore there is a need fornormalizing fluorescence image distribution with factorssuch as the parameter B of the present study indicating theextent of chromatin presence in the image. The techniqueproposed here can also be utilized as an initial screeningphase of an automated image analysis for which the sec-ond phase focuses on more advanced techniques evaluat-ing nuclei morphology [1,20-22,41] and/or the spatialarrangement of cell nuclei [23-25,42].
Competing interestsThe author(s) declare that they have no competing inter-ests.
Authors' contributionsAuthors BK and AT designed the study and drafted thepaper. Both authors have read and approved the finalmanuscript.
AcknowledgementsThis study was supported by the National Institute of Health Grant 232240 and by the National Science Foundation grant 235327 to A. Tözeren. The authors thank Dr. Jeffrey Hooke of Walter Reed Army Medical Center for providing the breast tissue histology used in this study and to Dr. Min Huang of Fox Chase Cancer Center for independently assessing the regions of interest in these slides.
References1. Tavassoli F, Devilee P: Pathology and Genetics of Tumours: the Breast and
Female Genital Organs World Health Organisation Classification ofTumours, IARC Press; 2003.
2. Sharifi-Salamatian V, Pesquet-Popescu B, Simony-Lafontaine J, RigautJP: Index for spatial heterogeneity in breast cancer. Journal ofMicroscopy 2004, 216:110-122.
3. Alexandrova R: Tumor heterogeneity. Experimental Pathology andParasitology 2001, 4:57-67.
4. Kim NG, Roh JK, Kim JH, Chung WY, Park CS, Kim H: Clonalityanalysis using methylation-specific polymerase chain reac-tion: a novel method for investigating tumor clonality. Labo-ratory Investigation 1999, 79:1727-1729.
5. Unger MA, Rishi M, Clemmer VB, Hartman JL, Keiper EA, GreshockJD, Chodosh LA, Liebman MN, Weber BL: Characterization ofadjacent breast tumors using oligonucleotide microarrays.Breast Cancer Research 2001, 3:336-341.
6. Baisse B, Bouzourene H, Saraga EP, Bosman FT, Benhattar J: Intratu-mor genetic heterogeneity in advanced human colorectaladenocarcinoma. International Journal of Cancer 2001, 93:346-352.
7. Gonzalez-Garcia I, Sole RV, Costa J: Metapopulation dynamicsand spatial heterogeneity in cancer. Proceedings of the NAtionalAcademy of Sciences of the USA 2002, 99:13085-13089.
8. Gorre ME, Mohammed M, Ellwood K, Hsu N, Paquette R, Rao PN,Sawyers CL: Clinical Resistance to STI-571 Cancer TherapyCaused by BCR-ABL Gene Mutation or Amplification. Sci-ence 2001, 293:876-880.
9. Fleuren GJ, Gorter A, Kuppen PJ, Litvinov S, Warnaar SO: Tumorheterogeneity and immunotherapy of cancer. ImmunologicalReviews 1995, 145:91-122.
10. van't Veer LJ, Dai H, de Vijver MJV, He YD, Hart AAM, Mao M,Peterse HL, van der Kooy K, Marton MJ, Witteveen AT, Schreiber GJ,Merkhoven RM, Roberts C, Linsley PS, Bernards R, Friend SH: Geneexpression profiling predicts clinical outcome of breast can-cer. Nature 2002, 415:530-536.
11. Bertucci F, Houlgatte R, Benziane A, Granjeaud S, Adélaïde J, TagettR, Loriod B, Jacquemier J, Viens P, Jordan B, Birnbaum D, Nguyen C:Gene expression profiling of primary breast carcinomasusing arrays of candidate genes. Human Molecular Genetics 2000,9(20):2981-2991.
12. Liu ET: Classification of cancers by expression profiling. Cur-rent Opinion in Genetics & Development 2003, 13:97-103.
13. Camp RL, Charette LA, Rimm DL: Validation of tissue microar-ray technology in breast carcinoma. Laboratory Investigation2000, 80:1943-1949.
14. Torhorst J, Bucher C, Kononen J, Haas P, Zuber M, Köchli OR, MrossF, Dieterich H, Moch H, Mihatsch M, Kallioniemi OP, Sauter G: Tis-sue microarrays for rapid linking of molecular changes toclinical endpoints. American Journal of Pathology 2001,159:2249-2256.
15. LeBaron MJ, Crismon HR, Utama FE, Neilson LM, Sultan AS, JohnsonKJ, Andersson EC, Rui H: Ultrahigh density microarrays of solidsamples. Nature Methods 2005, 2:511-513.
16. LeBaron MJ, Rui H: Creating tissue microarrays by cutting-edge matrix assembly. Expert Review of Medical Devices 2005,2:673-680.
17. Demir C, Yener B: Automated cancer diagnosis based on his-topathological images: a systematic survey. Tech. Rep. TR-05-09, Rennselaer Polytechnic Institute, Department Of Computer Science2005.
18. Hoque A, Lippman SM, Boiko IV, Atkinson EN, Sneige N, Sahin A,Weber DM, Risin S, Lagios MD, Schwarting R, Colburn WJ, DhingraK, Follen M, Kelloff GJ, Boone CW, Hittelman WN: QuantitativeNuclear Morphometry by Image Analysis for Prediction ofRecurrence of Ductal Carcinoma in Situ of the Breast. CancerEpidemiology, Biomarkers & Prevention 2001, 10:249-259.
19. Dreyer T, Doudkine A, Popella C: Nuclear shape and nucleartexture analysis in normal and neoplastic laryngeal epithe-lium. The First South-East European Symposium on InterdisciplinaryApproaches in Fractal Analysis 2003:241-244.
20. Schmid K, Angerstein N, Geleff S, Gschwendtner A: Quantitativenuclear texture features analysis confirms WHO classifica-tion 2004 for lung carcinomas. Modern Pathology 2006,19(3):453-459.
21. Roula MA, Bouridane A, Kurugöllü F, Amira A: A quadratic classi-fier based on multispectral texture features for prostate can-cer diagnosis. Seventh International Symposium on Signal Processingand its Applications 2003, 2:37-40.
22. Raimondo F, Gavrielides MA, Karayannopoulou G, Lyroudia K, PitasI, Kostopoulos I: Automated Evaluation of Her-2/neu Status in
Page 19 of 20(page number not for citation purposes)
http://www.ncbi.nlm.nih.gov/entrez/query.fcgi?cmd=Retrieve&db=PubMed&dopt=Abstract&list_uids=7590832
BMC Medical Imaging 2007, 7:2 http://www.biomedcentral.com/1471-2342/7/2
Publish with BioMed Central and every scientist can read your work free of charge
"BioMed Central will be the most significant development for disseminating the results of biomedical research in our lifetime."
Sir Paul Nurse, Cancer Research UK
Your research papers will be:
available free of charge to the entire biomedical community
peer reviewed and published immediately upon acceptance
cited in PubMed and archived on PubMed Central
yours — you keep the copyright
Submit your manuscript here:http://www.biomedcentral.com/info/publishing_adv.asp
BioMedcentral
Breast Tissue From Fluorescent In Situ HybridizationImages. IEEE Transactions on Image Processing 2005,14(9):1288-1299.
23. Todman A, Naguib RNG, Bennett MK: Visual Characterisation ofColon Images. Proceedings of Medical Image Understanding and Anal-ysis 2001:161-164.
24. Petushi S, Katsinis C, Coward C, Garcia F, Tözeren A: Automatedidentification of microstructures on histology slides. IEEEInternational Symposium on Biomedical Imaging: Macro to Nano 2004,1:424-427.
25. Braumann UD, Kuska JP, Einenkel J, Horn LC, Löffler M, Höckel M:Three-Dimensional Reconstruction and Quantification ofCervical Carcinoma Invasion Fronts From HistologicalSerial Sections. IEEE Transactions on Medical Imaging 2005,24(10):1286-1307.
26. Kayser K, Radziszowski D, Bzdyl P, Sommer R, Kayser G: Towardsan automated virtual slide screening: theoretical considera-tions and practical experiences of automated tissue-basedvirtual diagnosis to be implemented in the Internet. Diagnos-tic Pathology 2006, 1(10):.
27. Devijver PA, Kittler J: Pattern Recognition: A statistical approach London:Prentice Hall; 1982.
28. Duda RO, Hart PE, Stork DG: Pattern Classification Wiley-Interscience;2000.
29. CIE: CIE Colorimetry: Official recommendations of theInternational Commission on Illumination. Tech. Rep. 15.2,International Commission on Illumination 1986.
30. Schwarz MW, Cowan WB, Beatty JC: An experimental compari-son of RGB, YIQ, LAB, HSV, and opponent color models.ACM Transactions on Graphics 1987, 6(2):123-158.
31. Vapnik VN, Golowich SE, Smola A: Support vector method forfunction approximation, regression estimation and signalprocessing. Proceedings of Advances in Neural Information ProcessingSystems 9 1996:281-287.
32. Vapnik VN: Statistical Learning Theory Wiley; 1998. 33. Smola AJ, Schölkopf B: A tutorial on support vector regression Volume 14.
Kluwer Academic Publishers; 2004:199-222. 34. Schuetz CS, Bonin M, Clare SE, Nieselt K, Sotlar K, Walter M, Fehm
T, Solomayer E, Riess O, Wallwiener D, Kurek R, Neubauer HJ: Pro-gression-Specific Genes Identified by Expression Profiling ofMatched Ductal Carcinomas In situ and Invasive BreastTumors, Combining Laser Capture Microdissection and Oli-gonucleotide Microarray Analysis. Cancer Research 2006,66:5278-5286.
35. Yang F, Foekens JA, Yu J, Sieuwerts AM, Timmermans M, Klijn JGM,Atkins D, Wang Y, Jiang Y: Laser microdissection and microar-ray analysis of breast tumors reveal ER- related genes andpathways. Oncogene 2006, 25:1413-1419.
36. Murphy N, Millar E, Lee CS: Gene expression profiling in breastcancer: towards individualising patient management. Pathol-ogy 2005, 37(4):271-277.
37. Battifora H: The multitumor (sausage) tissue block: novelmethod for immunohistochemical antibody testing. Labora-tory Investigation 1986, 55(2):244-248.
38. Kononen J, Bubendorf L, Kallionimeni A, Bärlund M, Schraml P,Leighton S, Torhorst J, Mihatsch MJ, Sauter G, Kallionimeni OP: Tis-sue microarrays for high-throughput molecular profiling oftumor specimens. Nature Medicine 1998, 4:844-847.
39. Kaul Z, Yaguchi T, Kaul SC, Wadhwa R: Quantum Dot-Based Pro-tein Imaging and Functional Significance of Two Mitochon-drial Chaperones in Cellular Senescence andCarcinogenesis. Annals of New York Academy of Sciences 2006,1067:469-473.
40. Zhang C, Yeh SC, Kuroki M, Wang TH: Single Quantum Dot-Based DNA Nanosensor. Nature Materials 2005, 4(11):826-831.
41. Roula MA, Bouridane A, Kurugöllü F: An evolutionary snake algo-rithm for the segmentation of nuclei in histopathologicalimages. IEEE International Conference on Image Processing 2004,1:127-130.
42. Demir C, Gültekin SH, Yener B: Learning the Topological Prop-erties of Brain Tumors. IEEE/ACM Transactions on ComputationalBiology and Bioinformatics 2005, 2(3):262-270.
Pre-publication historyThe pre-publication history for this paper can be accessedhere:
http://www.biomedcentral.com/1471-2342/7/2/prepub
Page 20 of 20(page number not for citation purposes)
http://www.ncbi.nlm.nih.gov/entrez/query.fcgi?cmd=Retrieve&db=PubMed&dopt=Abstract&list_uids=3525985
http://www.ncbi.nlm.nih.gov/entrez/query.fcgi?cmd=Retrieve&db=PubMed&dopt=Abstract&list_uids=3525985
http://www.ncbi.nlm.nih.gov/entrez/query.fcgi?cmd=Retrieve&db=PubMed&dopt=Abstract&list_uids=9662379
http://www.ncbi.nlm.nih.gov/entrez/query.fcgi?cmd=Retrieve&db=PubMed&dopt=Abstract&list_uids=9662379
Related Documents