AUTOMATED CAPACITY PLANNING AND SUPPORT FOR ENTERPRISE APPLICATIONS by Dharmesh Thakkar A thesis submitted to the School of Computing In conformity with the requirements for the degree of Master of Science Queen’s University Kingston, Ontario, Canada January, 2009 Copyright © Dharmesh Thakkar, 2009

Welcome message from author
This document is posted to help you gain knowledge. Please leave a comment to let me know what you think about it! Share it to your friends and learn new things together.
Transcript

AUTOMATED CAPACITY PLANNING AND SUPPORT
FOR ENTERPRISE APPLICATIONS
by
Dharmesh Thakkar
A thesis submitted to the School of Computing
In conformity with the requirements for
the degree of Master of Science
Queen’s University
Kingston, Ontario, Canada
January, 2009
Copyright © Dharmesh Thakkar, 2009

ii
Abstract
Capacity planning is crucial for successful development of enterprise applications. Capacity
planning activities are most consequential during the verification and maintenance phases of
Software Development Life Cycle. During the verification phase, analysts need to execute a large
number of performance tests to build accurate performance models. Performance models help
customers in capacity planning for their deployments. To build valid performance models, the
performance tests must be redone for every release or build of an application. This is a time-
consuming and error-prone manual process, which needs tools and techniques to speed up the
process. In the maintenance phase, when customers run into performance and capacity related
issues after deployment, they commonly engage the vendor of the application for troubleshooting
and fine tuning of the troubled deployments. At the end of the engagement, analysts create
engagement report, which contain valuable information about the observed symptoms, attempted
workarounds, identified problems, and the final solutions. Engagement reports are stored in a
customer engagement repository. While information stored in the engagement reports is valuable
in helping analysts with future engagements, no systematic techniques exist to retrieve relevant
reports from such a repository.
In this thesis we present a framework for the systematic and automated building of capacity
calculators during software verification phase. Then, we present a technique to retrieve relevant
reports from a customer engagement repository. Our technique helps analyst fix performance and
capacity related issues in the maintenance phase by providing easy access to information from
relevant reports. We demonstrate our contributions with case studies on an open-source
benchmarking application and an enterprise application.

iii
Acknowledgements
This thesis would not have been possible without the continuous support of my wife and parents
who always supported me and gave me the will to succeed.
I cannot thank enough my supervisor Dr. Ahmed E. Hassan for his continuous support and
advice. Dr Hassan always provided great suggestion and constant motivation throughout my
research career. This has been one of the best memorable experiences of my life.
I sincerely appreciate the valuable feedback from my thesis readers: Dr. Mohammad Zulkernine,
Dr. Tom Dean, and Dr. Jim Cordy.
I am very fortunate to work with the amazing members of Software Analysis and Intelligence Lab
(SAIL). In particular, I would like to thank ZhenMing (Jack) Jiang, Haroon Malik, and Emad
Shihab for all their help and encouragement. A special thanks to Jack for being a close friend ever
since I moved to Canada and started my graduate studies at the University of Victoria. I also
thank Gilbert Hamann and Parminder Flora from the Enterprise Performance Engineering group
at Research In Motion (RIM) for providing me the opportunity to conduct practical research to
help their business.
Finally, I thank my wife again for patiently taking care of our daughter and everything else in life
while I worked away on my research and thesis.

iv
Statement of Originality
I hereby certify that all of the work described within this thesis is the original work of the author.
Any published (or unpublished) ideas and/or techniques from the work of others are fully
acknowledged in accordance with the standard referencing practices.
(Dharmesh Thakkar)

v
Table of Contents
Abstract ............................................................................................................................................ ii
Acknowledgements ......................................................................................................................... iii
Statement of Originality .................................................................................................................. iv
Table of Contents ............................................................................................................................. v
List of Figures ............................................................................................................................... viii
List of Tables .................................................................................................................................. ix
Chapter 1 Introduction ..................................................................................................................... 1
1.1 Capacity Planning .................................................................................................................. 2
1.2 Customer Support on Capacity Planning ............................................................................. 10
1.3 Overview of Thesis .............................................................................................................. 13
1.4 Major Thesis Contributions ................................................................................................. 17
1.5 Thesis Organization ............................................................................................................. 18
Chapter 2 Literature Review .......................................................................................................... 20
2.1 Capacity Planning ................................................................................................................ 20
2.2 Fault Resolution ................................................................................................................... 23
2.3 Event Correlation ................................................................................................................. 21
2.4 Mining Customer Engagement Repository .......................................................................... 22
2.5 Operational Profile and Signature Profile Retrieval ............................................................ 23
2.6 Summary of Literature Review ............................................................................................ 24
Chapter 3 Framework for Building Capacity Calculators.............................................................. 26
3.1 The Dell DVD Store Web Application ................................................................................ 28
3.2 Test Enumeration ................................................................................................................. 30
3.3 Test Reduction ..................................................................................................................... 33
3.3.1 Static Test Reduction .................................................................................................... 34
3.3.2 Dynamic Test Reduction ............................................................................................... 34
3.4 Environment Setup............................................................................................................... 35

vi
3.5 Test Execution ..................................................................................................................... 37
3.5.1 Test Setup...................................................................................................................... 37
3.5.2 Test Run ........................................................................................................................ 37
3.5.3 Test Shutdown .............................................................................................................. 39
3.6 Test Transition ..................................................................................................................... 39
3.7 Test Analysis ........................................................................................................................ 40
3.7.1 Validate the Test ........................................................................................................... 41
3.7.2 Metric Analysis ............................................................................................................. 44
3.8 Model Building .................................................................................................................... 45
3.9 Customization Efforts .......................................................................................................... 45
3.10 Chapter Summary .............................................................................................................. 47
Chapter 4 Technique for Customer Support on Capacity Planning ............................................... 48
4.1 Execution Logs .................................................................................................................... 50
4.1.1 Legal Requirements on Application Logging ............................................................... 51
4.1.2 Execution Logs vs. Tracing Logs ................................................................................. 51
4.2 Convert Log Lines to Event Distribution ............................................................................. 52
4.3 Identify Signature Events ..................................................................................................... 53
4.4 Compare Event Distributions ............................................................................................... 56
4.4.1 Kullback-Leibler Divergence Metric ............................................................................ 57
4.4.2 Cosine Distance Metric ................................................................................................. 57
4.5 Measuring Performance of the Technique ........................................................................... 59
4.6 Chapter Summary ................................................................................................................ 60
Chapter 5 Case Studies for Customer Support Technique ............................................................. 61
5.1 Case Study on an Open-Source Application ........................................................................ 62
5.2 Case Study on an Industrial Application .............................................................................. 65
5.2.1 Studying Retrieval by Operational Profile .................................................................... 65
5.2.2 Studying Retrieval by Signature Profile ....................................................................... 69
5.3 Chapter Summary ................................................................................................................ 70
Chapter 6 Results and Limitations ................................................................................................. 71
6.1 Framework for Building Capacity Calculators .................................................................... 71
6.2 Technique for Customer Support on Capacity Planning...................................................... 72
6.3 Chapter Summary ................................................................................................................ 76

vii
Chapter 7 Conclusion ..................................................................................................................... 77
7.1 Major Topics Addressed ...................................................................................................... 77
7.2 Major Thesis Contributions ................................................................................................. 79
7.3 Future Research ................................................................................................................... 80
7.4 Commercialization ............................................................................................................... 82
Bibliography .................................................................................................................................. 83
viii
List of Figures
Figure 1: Classic Waterfall SDLC ................................................................................................... 1
Figure 2: An example of a capacity calculator ................................................................................ 6
Figure 3: Customer Engagement Reporting ................................................................................... 11
Figure 4: Overview of the Thesis ................................................................................................... 16
Figure 5: Our Framework for Building Capacity Calculators ....................................................... 27
Figure 6: DS2 high-level architecture ............................................................................................ 29
Figure 7: Instability in Resource Utilization .................................................................................. 42
Figure 8: Processor Utilization vs. Response Time ....................................................................... 45
Figure 9: Our Technique to Retrieve Relevant Engagement Reports ............................................ 49
Figure 10: An Example of Execution Logs ................................................................................... 51
Figure 11: Visually Examining Distribution Similarity ................................................................. 56
Figure 12: Geometric Representation of Two Dimensional Vectors ............................................. 58
Figure 13: Precision and Recall ..................................................................................................... 59
Figure 14: Case Studies Tree ......................................................................................................... 61
Figure 15: Example of Imbalance in Event Logging ..................................................................... 73
ix
List of Tables Table 1: Enumeration of performance tests ................................................................................... 33
Table 2: Reduced list of performance tests for DS2 ...................................................................... 36
Table 3: Estimated efforts for customizing our framework ........................................................... 46
Table 4: An Example of Event Distribution .................................................................................. 53
Table 5: Contingency Table for Chi-Square Test .......................................................................... 56
Table 6: List of Log Files Tested for Retrieval .............................................................................. 64
Table 7: Performance of Retrieval using Operational Profiles ...................................................... 66

1
Chapter 1
Introduction
Modern enterprise applications have components deployed on different servers separated by
physical boundaries and connected by computer networks. Medium and large scale enterprise
applications that are intended to serve from ten to tens of thousands people are commonly
deployed as distributed applications. Quality of Service (QoS) measures, such as availability and
performance are of prime importance for such applications. Quality of Service of enterprise
applications affects the productivity of the people using those applications. Problems after the
deployment of enterprise applications are rarely due to functionality errors. Rather, most
problems are concerned with the application not responding fast enough, crashing or hanging
under heavy load, and other performance or capacity related problems [3, 48]. Still, capacity
planning remains one of the most overlooked aspects in software development [10].
Figure 1: Classic Waterfall SDLC
Figure 1 shows the classic waterfall Software Development Life Cycle (SDLC) phases. Capacity
planning activities span all the SDLC phases. While the SDLC phases may differ across software
development methodologies, such as the iterative or agile methodologies, the capacity planning
steps still remain important steps in the life cycle. We focus on the classic waterfall SDLC phases

2
in this discussion. Performance objectives need to be clearly identified in the requirement phase.
An objective and measurable requirement is, for example, 90% of requests should be served
within end-to-end response time of 5 seconds. During the design phase, platform and technology
selection, architecture, and development modeling should be done that would support the stated
performance requirements. In the implementation phase, algorithmic, data structure, and
programming decisions need to be made that would optimize the performance. In the verification
phase, performance test need to be conducted to verify that the required performance objectives
are met. In the final phase of maintenance, continuous capacity planning and tuning is done to
ensure that the application continues to meet the performance objectives as the number of users
and their workload changes.
While capacity planning related activities are important to execute in all the SDLC phases to
obtain full advantage of capacity planning [36], post-implementation performance engineering
activities carry profound impact, and hence remain commonly adopted in the industry. The work
presented in this thesis addresses capacity planning related tasks in those important SDLC phases
of verification and maintenance. In the next two sections, we introduce capacity planning related
activities performed in verification phase, and customer support activities performed in the
maintenance phase. We provide a brief overview of our thesis in section 1.3. We discuss major
contributions of our thesis in section 1.4. Then we discuss the organization of the rest of the thesis
chapters in section 1.5.
1.1 Capacity Planning
In the verification phase, functional testing activities need to be performed to ensure that the
application meets its functional requirements. Load testing checks whether the application works
well under heavy workloads. Both functional and load testing result in a pass or failure

3
classifications for each test. Then a set of performance tests is performed which quantitatively
summarizes application performance parameters, such as response time, throughput and hardware
resource utilizations. Using the results of a large number of performance tests, a performance
model is built. Using the performance models the performance characteristics of an application
under different workloads and deployment (hardware and platform) settings can be predicted.
Based on the prediction, software maintenance practitioners plan for hardware resource
requirements ahead of time, so that crucial Service Level Agreements (SLAs) are always met.
Performance modeling techniques are broadly classified into measurement, analytical and
simulation based techniques:
1) Measurement based techniques rely on conducting extensive performance measurements on
the application being studied. Measurement based techniques can only be conducted once the
application is fully developed and available.
2) Analytical techniques allow the building of models to study and predict ahead of time the
performance characteristics of an application. Analytical techniques use mathematical models
based on queueing theory [22], layered queueing network [24], regression analysis (such as
linear regression or regression splines) [4], and queueing petri net [21]).
3) Simulation techniques emulate the functionally of the application using a computer
simulation whose performance can be probed. Performance engineering and capacity
planning has grown into a profession. Ample research and development have been done on
the practice of all three techniques for performance engineering and capacity planning of
software applications.

4
Both simulation and analytical based techniques require a good understanding of the application
and require the presence of accurate documentation of its behavior. However, up-to-date and
complete documentation and understanding of an application rarely exists in practice. The source
code in many cases represents the only source of accurate information about the application [40].
Therefore practitioners commonly use measurement based techniques. Instead of building
mathematical models or computer simulations, practitioners use the best model for a software
application, the application itself! Measurement based techniques are often the only type of
performance analysis used in practice, as noted by Sankarasetty et al. [38].
Measurement based modeling of a software application is commonly used in practice to produce
capacity calculators and performance white papers. Such calculators and white papers are
commonly developed for hardware platforms (e.g. [30]) and large enterprise applications (e.g.,
[34, 35]). These calculators help customers in capacity planning activities. Capacity planning
involves selecting the most appropriate configurations for deploying an application while
satisfying performance requirements and financial constraints. When deploying enterprise
applications, customers must determine whether their current deployment infrastructure is over-
engineered (then they can reduce deployment costs) or under-engineered (then they can invest
more to improve the user's experience). For example, a capacity analysis for a web application
may indicate that a 90% of requests will be served within response time of 8 milli-seconds, if the
application is servicing 200 requests per second (i.e., usage workload) while running on a
machine with dual core Intel Pentium 4 1.2Ghz processor, 4 GB of memory, and two 136GB
10,000 RPM SATA disks configured as RAID 0 connected to the Internet over fiber optic
backbone network of an ISP. The response time in that prediction might be excluding the network
latency and rendering time in the browser, as both of that depend on the user environment, on

5
which deployers have no control. In short, customers and support staff would like to address
issues such as:
• What hardware is sufficient to deploy product X and offer a good user experience?
• If I upgrade to version 3.x, will my current quality of service be affected? Will I need
new hardware?
• How much quality of service improvements should I expect if I upgrade my I/O
subsystem?
• If I enable another 100 users on my current hardware, what will be my CPU and disk
utilizations?
• When should I upgrade my current hardware given my expected workload growth?
Figure 2 shows an example of a capacity calculator for the Dell DVD Store web application. The
DVD Store application is a benchmarking web application developed by Dell to benchmark the
performance of the Dell server systems. We introduce the DVD store application in greater detail
in chapter 3. The predictions produced by the capacity calculator are based on the inputs given in
the UI and a performance model for that application. For example, given a particular hardware
configuration of two 3.2 GHz Intel Pentium-IV processors and a set of workload parameters as
shown in Figure 2, the calculator produces the predications using a performance model. The user
interface of the calculator can be as simple as a spread-sheet, or a sophisticated web application.
The model can be a measurement based regression model, an analytical model or a simulation
model, which is invoked from the user interface. The figure shows model predicting an average
CPU utilization of 40%, a memory usage of 790MB and a response time of 16 milliseconds. A
customer could modify the hardware or workload configurations in the calculator to determine a
suitable configuration that would meet future demands and their budget. Other way round, a

6
calculator can be built using the same performance model to allow customer specify input
workload and the required performance levels, and the calculator would present hardware
configurations that would meet those requirements.
Figure 2: An example of a capacity calculator
Measurement based techniques require the execution of a large number of performance tests for
every release or build of a software application. A performance test measures the performance
characteristics (e.g., response time) of the application for a specific workload under a particular
hardware and software configuration. Performance tests are typically conducted after functional
and load testing of an application is complete. Functional testing checks whether an application
meets its functional requirements. Load testing checks whether the application works well under
7
heavy workloads. Both functional and load testing result in a pass or failure classifications for
each test. In contrast the results of a performance test are summarized quantitatively in metrics
such as response time, throughput and hardware resource utilizations. Using the results of a large
number of performance tests, a performance model can be built. Deployers of enterprise
applications use this performance model to determine the most suitable capacity configurations
when deploying a new application [30, 34, 35]. This process is commonly referred to as capacity
planning.
To ensure that a performance model is complete and accurate a large number of performance tests
must be conducted. The large number of tests leads to many challenges when performing
measurement based modeling in practice. Setting up the environment for executing each test is
usually a manual process, which is lengthy and error prone. Setup mis-configurations are
common, costly, and are usually hard to detect. The test setup process is repeated a large number
of times since tests are repeated many times. Tests are repeated to ensure the statistical validity of
results and to study the performance of an application in different hardware and platform settings.
With each build or version of a software application, the measurement based models must be
updated by re-running most of the performance tests. Building and maintaining measurement
based models is a time consuming and resource intensive process. For instance, if a bug is
discovered in an application during performance modeling then the full performance modeling is
usually repeated once the bug is fixed.
Much of practice focuses on automating performance testing instead of modeling. Industry is
primarily focused on building sophisticated load testing tools, such as WebLOAD [46] and HP
LoadRunner [25]. Such tools, although valuable for performance testing, do not help address the
full life cycle of measurement based performance modeling. Since measurement based

8
performance modeling is one of the final steps in an already late release schedule, techniques are
needed to speed up the modeling process. Practitioners require tools to assist them in building and
updating measurement based models by automating the various steps in performance modeling.
Building a measurement based performance model is a challenging task in practice due to many
of the following reasons:
1) The large number of tests that must be executed. A large number of tests must be
executed in order to ensure that the model captures the various possible workload and
configuration options for an application. For example, tests should be conducted for
various configuration settings of an application. Tests may be repeated several times to
gain statistical confidence in the captured performance metrics. Tests must be conducted
on multiple platforms to model and benchmark the effects of changing underlying
hardware platforms.
2) The limited time that is available for performance modeling. Performance modeling
is usually done as the last step in an already tight and usually delayed release schedule.
Hence managers are always hoping to reduce the time allocated for performance
modeling.
3) The risk of error due to the manual process that is followed to setup, execute and
analyze the tests. There exist many tools to help in automating the generation of loads
for performance testing. However, there exist no tools for configuring the application
under tests, setting up the tests, and analyzing the results in an automated fashion. In
practice, all these tasks are done manually and are especially error prone.

9
4) The risk of having to repeat the full modeling process. All too often the modeling
process reveals problems or mis-configurations are discovered. Once the identified
problems are addressed, the modeling process must be restarted from scratch while
having minimal impact on the time allocated for performance modeling.
Such challenges have been noted by other researchers and practitioners as well. For instance,
Gunther cites lengthy measurement and modeling phases as the main reasons for management’s
skepticism towards performance modeling and capacity planning [10].
In this work we propose a performance modeling framework which addresses the aforementioned
capacity planning challenges as follows:
1) The large number of tests that must be executed. Our proposed framework supports
the use of advanced test selection and prioritization techniques such as ANOVA selection
[42] and screening designs [51], to reduce the number of tests. The framework also
supports the re-use of data from previous releases or builds of an application.
2) The limited time that is available for performance modeling. The framework
automates many of the time consuming tasks needed for building performance models.
The framework also reduces the time needed for tests.
3) The risk of error due to the manual process that is followed to setup, execute and
analyze the tests. The framework automates the processes for setting up the
environment, executing the tests and analyzing the tests. This automation ensures that
errors are minimal. Moreover the framework contains a validation step which uses prior
performance tests and heuristics to flag possible bad tests and to rerun them or remove
them from the model building step.
10
4) The risk of having to repeat the full modeling process. The framework detects and
flags possibly problematic or mis-configured performance tests. The modeling process
can be automatically executed incrementally after the problems are addressed.
1.2 Customer Support on Capacity Planning
After deployment, in the maintenance phase of software development life cycle, customers report
bugs and issues that need to be addressed efficiently in short time, compliant to stringent QoS
requirements. We focus on the performance and capacity related issue resolution in our work. To
resolve performance and capacity related issues, support analysts often use their experience to
troubleshoot the application deployment. Support analysts take their cues from the operation
profile, problem symptoms, operating system and hardware platform of the deployment at the
client site.
As shown in Figure 3, after providing issue resolution, the application support analyst creates a
customer engagement report, which captures observed symptoms, identified problems, attempted
workarounds and the final solution. One or more execution log files from the customer site are
attached to the report. At mature software development organizations, these customer
engagement reports are archived in a Customer Engagement Repository. The repository contains
practically acquired invaluable information, which can be useful in many ways [12]. However,
retrieval of information from this repository is not well-explored. We could not find more
research works pertaining to that. There exist no systematic techniques to retrieve and use
information in such a knowledge base for future engagements. In this thesis we present a
technique to support future engagements by reusing information stored in the customer
engagement repository. This idea is represented by the dotted line connecting the repository to the
analyst in Figure 3. Retrieval of information from the repository is also needed when a team of

11
analysts are employed to serve a large customer base and no single analyst has all the knowledge.
New analysts joining the team carry no domain knowledge, and need to rely on information
retrieval from the engagement repository as they start working to troubleshoot customer
deployments.
Figure 3: Customer Engagement Reporting
When working on a particular engagement, support analysts rely on their experience in
identifying prior engagements with similar circumstances. Analysts commonly use basic text
search technology to retrieve relevant reports of prior engagements using specific keywords.
However, such an approach requires consistent entry of the data in the reports and the use of the
appropriate keywords in the search. For example, a search for “hung thread” would not return a
report which talks about a “non-responsive thread”. The use of basic search technology all too
often prevents the analyst from quickly locating the appropriate reports.
Our goal is to help the support analyst in the task of troubleshooting the application deployment
by retrieving relevant information from the customer engagement repository. We present a
ApplicationSupportAnalyst
Symptoms Identified Problems Solutions
Execution Logs
Customer Engagement
Report
Customer Engagement Repository
Create Store
Contains
Attempted Workarounds

12
technique which uses the execution logs attached to the engagement reports to retrieve relevant
customer engagement reports from the engagement repository. For information retrieval purpose,
the execution logs provide certain advantages over other pieces of information attached to report.
Execution logs are consistent since they are automatically generated by the application, while all
other information in the report is manually entered. The manually entered information might
suffer from issues such as, (a) varying level of completeness of information (b) inconsistent use
of terms (b) analysts’ incomplete knowledge of all operations and features of the application (c)
analysts’ inexperience, leading to bias towards documenting known territories. On the other hand,
the execution logs are a direct representative of the application’s operations and problems.
Our technique for customer support on capacity planning takes as input an execution log file for a
particular deployment and returns relevant engagement reports. The technique returns two types
of relevant reports:
1. Reports of engagement with a similar operational profile. The operational profile
identifies the workload characteristics of a particular application deployment. For
example, given a deployment of an email server with an operational profile where 80% of
the traffic is outgoing email and 20% in incoming email, our technique would return
engagement reports for deployments with similar profiles. These reports are valuable
when investigating workload problems (e.g. slow response time under a particular
workload).
2. Reports of engagement with a similar signature profile. Whereas an operational
profile summarizes the workload characteristics of an application, a signature profile
identifies the characteristics which are most peculiar for a particular deployment relative
to all other deployments. For example, if a deployment has a relatively high number of

13
deadlock events, then our technique would return engagement reports for deployments
with relatively high number of deadlock events, even though that deployment might be
similar to some other deployment with respect to its workload characteristics. These
reports are valuable when investigating configuration and environment problems (e.g.,
environment error messages, hung threads, and restarts).
Our technique uses readily available yet hardly used information in the customer engagement
repository. Analysts can pick the type of retrieval method to use depending on the situation at
hand. For example, if a deployment is facing a problem of higher response time in some
transactions, it would be appropriate to retrieve reports based on the operational profile. If a
deployment is facing isolated occurrences of applications restarts or hung threads, it might be
appropriate to retrieve relevant reports based on the signature profile. We show the validity and
usability of our technique in practice through case studies performed on two applications – first
the Dell DVD Store application, and second a large enterprise application. Our results confirm the
high performance (i.e., precision and recall) of our technique.
1.3 Overview of Thesis
As we affirmed earlier, performance engineering related activities in the verification and
maintenance phases carry profound impact on software quality and customer satisfaction. This
thesis presents our work targeting performance engineering activities in the verification and
maintenance phases of the software development life cycle. Specifically, we present:
a) A framework for building performance model based capacity calculators, that capture
performance characteristics of the application during the verification phase.

14
Our framework captures and explains important steps in the process of building performance
model based capacity calculator. The framework is a result of our research and practice in
performance engineering. It helps the performance analyst to automate and speed the task of
building measurement based capacity calculator. We demonstrate our framework using an
open source application as a test-bed. The framework can be reused with customization for
successive builds, successive versions, versions targeting a different platform, or an altogether
different application. We also discuss effort estimation for such customizations. We presented
this work at the Seventh International Workshop on Software and Performance (WoSP)
organized at Princeton, NJ, USA in June 2008 [56].
b) A technique for helping troubleshoot performance issues during the maintenance phase
by retrieving relevant report from a customer engagement repository.
Our technique for customer support on capacity planning marks one of the first efforts to mine
customer engagement reports to solve performance problems of customers. Our technique
retrieves relevant engagement reports based on similar operational profile and similar problem
profile, that helps support analyst apply past knowledge to solve future performance and
capacity related problems. We demonstrate the applicability and generality of our technique
using an open source application and a commercial application as examples. We show the
good precision and accuracy of our retrieval technique using classical metrics of precision and
recall. We presented this work at the IEEE International Conference on Software Maintenance
(ICSM) organized at Beijing, China in September 2008 [57].
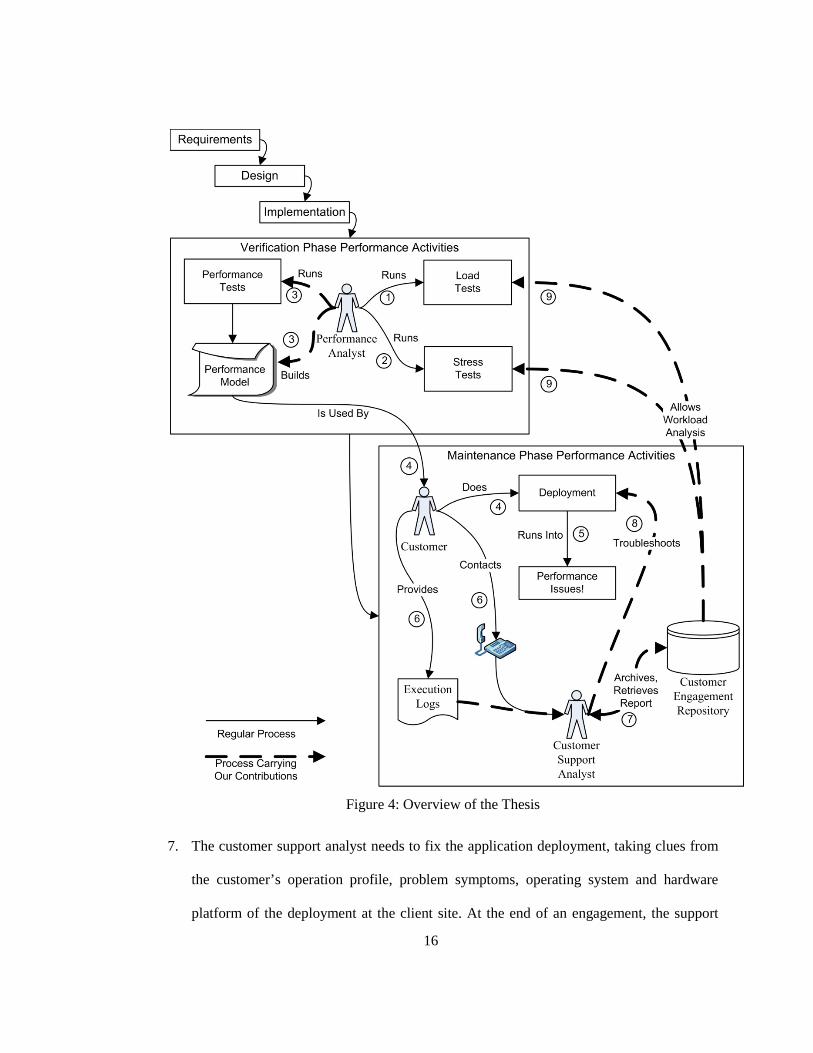
We expand the SDLC phases of verification and maintenance in Figure 4 to provide an overview
of how our work helps performance engineering activities in those two SDLC phases. Please note
that we show only performance engineering related activities in the Figure. In the Figure, the

15
steps to which we contribute in this work are highlighted with thick broken lines. Now we explain
each of the steps from the Figure.
1. In the verification phase, performance engineering activities include load testing, stress
testing and performance testing. In load testing, the application is run for long periods
under high workloads that are typically expected at customer deployments.
2. In stress testing, the workload or the deployment scenario is modified to put excessive
stress on one or more system resources, such as disk, processor and network. The purpose
of both load testing and stress testing is to verify that the application continues to meet
the performance requirements laid for it.
3. The goal of performance testing is not to find bugs, but to establish benchmarks on how
software will perform under different workload and resource availability situations.
Sophisticated performance model is built using the results of the performance tests. Such
performance model is used to build a capacity calculator that allows predicting
application performance under different workload and resource availability situations.
4. The capacity calculator informs customers of required hardware resources to support the
anticipated workload, such as the number of users and the transaction volume. Customers
can now take informed decision on the needed resource capacity to deploy the
application.
5. Performance issues arise in customers’ production environment, which needs
troubleshooting.
6. Customers engage the vendor’s support analyst to resolve the issues with application.
16
Figure 4: Overview of the Thesis
7. The customer support analyst needs to fix the application deployment, taking clues from
the customer’s operation profile, problem symptoms, operating system and hardware
platform of the deployment at the client site. At the end of an engagement, the support

17
analyst archives the engagement report to the customer engagement repository. Our
technique helps the support analyst by retrieving relevant reports from the customer
engagement repository, allowing the support analyst to apply the solutions that worked in
similar problem situation in the past.
8. Using the information retrieved by our technique, the support analyst troubleshoots the
customer deployment.
9. The goal of load testing and stress testing is to verify that the application continues to
perform under possible customer deployment scenarios. To that end, the strive to bring
the workloads used in load testing and stress testing closer to real world customer
workloads has always been challenging. Our technique allows comparing log files
generated by running load tests and stress tests against the log files of the customers, so
that the workload in the load tests and stress tests can be modified to make it closer to
real world customer deployment scenarios.
1.4 Major Thesis Contributions
In this thesis we present a framework for building capacity calculators using measurement based
performance models of software applications. The need for such a framework is felt from the
current challenges in performance modeling practices in industry. These models are produced
through a labor intensive and error prone process which always occurs at the end of already late
release schedules. Our proposed framework automates the building of measurement based
performance models. The framework is based on our experience in performance modeling of two
large applications: the DVD store application by Dell Corporation and another larger enterprise
application. We present the limitations of our framework and highlighted our experience in using
it. Moreover we discuss the effort involved in customizing our framework for other applications

18
and other platforms. The main contribution of our work is the proposal of a framework that brings
together various venues of research to support analysts in their day-to-day activities. Using our
framework researchers can explore contributing and fitting their own research work into the
proposed framework. Moreover, analysts can compare various tools and techniques using the
structure of our framework.
Retrieval of relevant engagement reports helps support analysts resolve client issues quicker and
better. Retrieval of relevant engagement reports is based on similar operational and signature
profiles. We present a technique to analyze the execution logs from the customer engagement
repository and retrieve the relevant execution logs and corresponding customer engagement
reports. Our technique can equally aid in remote issue resolution by identifying relevant
engagement reports and recommending resolution steps. Our technique can be applied
immediately on an application, since the execution logs of most applications are readily available
and are usually archived in the customer engagement repository. It requires no code changes, nor
does it require any data collection from customers. Hence it can be easily adopted by companies
and does not depend on a particular software application, version, build, or platform.
1.5 Thesis Organization
The rest of the thesis is organized as follows. Chapter 2 provides a literature review of existing
research and practice on the topics related our thesis. Chapter 3 discusses our framework for
building performance measurement based capacity calculators, with the help of a case study.
Then we discuss our technique for customer support for capacity issues in chapter 4. Chapter 5
discusses case studies for our customer support technique. Chapter 6 discusses the results and
limitations of our framework and technique. Chapter 7 concludes with a summary of topics

19
addressed, thesis contributions, and directions for future research and commercialization of our
research.

20
Chapter 2
Literature Review
In this chapter we present work in the areas related to the topic of our thesis, that is, capacity
planning and customer support. Our technique for customer support is a data mining technique
based on event correlation, so related work in the areas of event correlation and mining customer
engagement repository is presented. Related work in operational profile retrieval and fault
resolution techniques is also presented, as techniques from these areas are often used for customer
support.
2.1 Capacity Planning
Capacity planning requires accurate performance measurement and modeling. We refer the reader
to the book by Jain [16] as one of best texts on the subject. Goldsmith et al. present a
measurement based technique for modeling computational complexity, to avoid relying only on
theoretical asymptotic analysis [9]. Similar to their work, our framework aids in measurement-
based modeling, rather than analytical or simulation based modeling. Their modeling effort is for
algorithmic performance of non-Markovian applications. In contrast, our modeling effort,
presented in chapter 3, is for enterprise applications which are Markovian in nature. In Markovian
systems, service demands from each new request are independent of previous requests and the
current state of the application [16]. Moreover, the presented framework would be useful to
Goldsmith et al. in performing and managing the numerous performance tests required for
empirically measuring computational complexity.
A tool called JUnitPerf developed by Clarkware Consulting helps automate performance testing
during the development cycle [19]. JUnitPerf helps reuse the unit tests written in JUnit [18] for
performance testing of code units, as the developers finish coding and refactoring. JUnitPerf is
21
valuable for performance testing during the development cycle. However, our framework,
presented in chapter 3, is used to model the overall performance of the whole application before
shipping instead of modeling a particular unit of code.
Mania and Murphy present a framework for automated LQN based performance modeling [27],
which is derived from the trace-based modeling technique proposed by Woodside et al. [13].
Smith et al. propose a process for building software and system performance models from UML
models [41]. Both Mania and Murphy’s framework, and Smith’s process are limited to analytical
performance modeling, in particular LQN based modeling. In contrast, our framework is used for
measurement based performance modeling.
2.2 Event Correlation
Techniques that analyze the run-time behaviour of programs are called dynamic analysis
techniques. In contrast, static analysis techniques analyze the program’s text [45]. Static analysis
derives properties that hold for all executions, while dynamic analysis derives properties that hold
for one or more executions. Hence, dynamic analysis lends itself well to reasoning that involves
compare and contrast. Dynamic analysis includes both offline techniques that operate on a trace
of the system's behavior, and online techniques that operate while the system is producing its
behavior. Common examples of dynamic analysis techniques are profilers, memory allocation
monitors, assertion checkers, and event correlation. Among these, we focus on event correlation,
as our technique for customer support, presented in chapter 4, is based on event correlation. Event
correlation strives to produce conceptual interpretation where new meaning is assigned to a set of
events happening within a pre-defined time interval [17]. For example, consecutive events
“Message received” and “Message queue full” could be automatically interpreted together as an
22
event “Message not delivered due to event queue full”. Jakobson and Weissman have considered
the following common event correlation operations in their work:
• Compression: Reduction of multiple occurrences of identical events into a single event
• Filtering: Suppression of an event if one of its parameters has a certain value
• Suppression: Suppression of an event if a certain operational context is present
• Counting: Counting and thresholding of repeated arrivals of identical events
• Escalation: In presence of a certain operational context, assigning a higher value to a
certain event parameter (e.g., severity)
• Generalization: Replacing an event with an event from its superclass
• Specialization: Replacing an event with an event from its subclass
• Temporal relationship: Correlating events depending on the order and time of their arrival
• Clustering: Classification of events or information associated with events into groups
(clusters) based on some common traits
Out of the aforementioned event correlation operations, our customer support technique includes
generalization, counting, filtering, and clustering operations. We generalize log lines to events by
removing instance-specific dynamic information. Then we count the occurrences of the events to
obtain an event distribution. To obtain a signature event distribution, we filter all the other events
to obtain a signature event distribution. Lastly we classify the engagement report associated with
the event log file as either “similar to” or “different from” a given event log file. We discuss these
operations in greater detail in chapter 4.
2.3 Mining Customer Engagement Repository
With the increasing application of computing in science, computing, and government, there has
been an explosive growth in electronic data and databases. This led to a growing demand for tools

23
and techniques to analyze the electronic data to discover knowledge, such as patterns,
classifications, associations, and anomalies. Consequently, data mining is becoming an
increasingly important research area. Based on kind of knowledge extracted, data mining
techniques are commonly classified as classification, clustering, association, summarization,
prediction and pattern mining. A variety of techniques are used in data mining, including
database-oriented, machine learning, and statistical techniques.
Even though mining of other software repositories has been well explored, there has been little
research work in the area of mining of customer engagement repository since Hui and Jha [12]
proposed mining the customer support repository for the manufacturing industry to retrieve
relevant reports. The authors apply mining techniques, such as neural networks, case-based
reasoning, and rule-based reasoning on the textual service records stored in the repository.
However, success of their technique would depend on the willingness of the support analysts of
previous engagements to enter large textual information, and the search skills of the support
analysts working on later engagements. In contrast, our technique for customer support, discussed
in chapter 4, is based on applying statistical techniques on the execution logs attached to the
engagement reports; hence it does not need to rely on manually entered textual information.
2.4 Fault Resolution
In chapter 4, we propose a technique for fault resolution in production deployments of enterprise
applications at customer site. Different classes of techniques have been researched and applied to
fault resolution in different areas of computing. For instance, spectrum based fault localization
and model based diagnosis have been successfully applied in fault resolution in hardware and
embedded systems [55]. Rule bases reasoning is another prominent class of techniques for fault
resolution in software support, originally proposed by Cronk et al [6]. Rule based reasoning

24
systems build, query, and update a knowledge database of symptom-solution. However, Lewis
noted [23] that rule based reasoning methods tend to suffer from difficulty in adapting to new
problem situations, and large knowledge database, leading to unpredictable results. Lewis
proposed case based reasoning as a means to overcome limitations of the rule based reasoning.
The case based reasoning enhances the previous approach with user-feedback-capturing in order
to update the knowledge database. Our technique, presented in chapter 4, however, is
fundamentally different, in that it draws from event correlation and statistical analysis. One of the
advantages of our technique is that we do not need to create and maintain any manual metadata,
apart from the customer engagement report routinely prepared at the end of a customer
engagement. Hence, we believe our technique is easier to deploy and maintain.
2.5 Operational Profile and Signature Profile Retrieval
We use execution logs as representatives of operational profiles which capture the workload
characteristics of an application. There are many techniques to create operational profiles, such as
[8, 28, 33]. Our technique for customer support is different from those approaches in that it goes
on to compare execution logs based on the operational profiles that they represent, without
actually retrieving operational profiles.
Unlike operational profiles, signature profiles are not well explored by researchers and
practitioners. Researchers working in areas related to software quality and reliability often
analyze signature events in an application [1, 47]. However, retrieval of engagement reports
based on the signature profile, as done in this work, has not been proposed.
2.6 Summary of Literature Review
We presented related research work in the areas that this thesis touches: capacity planning, event
correlation, mining customer engagement repository, and operational profile and signature profile

25
retrieval. While capacity planning has over the years gained significant research and practical
body of knowledge, limited research has been done in measurement based modeling and capacity
planning challenges. No systematic technique exists for retrieving relevant reports from a
customer engagement repository of software applications.

26
Chapter 3
Framework for Building Capacity Calculators
In this chapter we discuss our framework for building capacity calculators. Building measurement
based performance model requires running and analyzing a large number of tests. We propose a
framework for building capacity calculators using measurement based performance modeling.
Figure 5 shows the various steps in our framework. Our framework constitutes of the following
steps:
1) Test enumeration determines the set of performance tests that should be executed. The
aim of the test enumeration step is to define the search space of all the tests which should
be executed to build an accurate performance model.
2) Test reduction uses domain knowledge and historical information from prior runs to
reduce the number of performance tests. Moreover test reduction uses statistical and
experimental design techniques to reduce the number of tests that should be run.
3) Environment setup automates setting up the environment for performance testing. This
includes installing the application and load testing tools. The application and the tools
may be required to run on different operating system platforms. To support multi
platform applications, practitioners can customize this step and reuse the other steps
across platforms.
4) Test execution automates the task of running the test suite. It has three major activities
of: Test Setup, Test Run, and Test Shutdown. This step is customizable to allow the use
of performance/load testing tool that can be invoked automatically (e.g., from the
command line).

27
Figure 5: Our Framework for Building Capacity Calculators
5) Test transition prepares the environment to execute the next performance test from the
tests specified in the first step in our framework. The practitioner can configure the
framework between one extreme of full restore and restart of the system under test and
the other extreme of directly starting the load for the following test. The framework
automatically executes the transition steps after finishing each performance test.

28
6) Test analysis step first compares the test results against other test results and against
heuristics to detect any issues with the performance test itself. Next, the metrics from the
performance counters are analyzed to draw the relation between performance counters
and load injected.
7) Model building In this final step, a regression model is built using statistical analysis
tools, which models the application performance as a function of its load parameters.
8) A performance database stores the performance test and analysis data. The database is
used in the test reduction, test analysis and model building steps. The database could be
implemented using sophisticated database systems, or using files.
The framework permits performance analyst to encode the various heuristics that are used in their
model building process on a daily basis. By encoding the heuristics they ensure that their model
building process is repeatable. The documentation of the heuristics permits analysts to closely
examine these heuristics and update them as their understanding of the application matures.
Analysts could also replace their heuristics with more sophisticated techniques as they evolve
their modeling process. In the next section, we describe the Dell DVD Store application, which
we have used as a running example to demonstrate the various steps of our framework. We
describe each step of our framework in section 3.2 to section 3.8. Section 3.9 discusses the efforts
required to customize the framework to use it for a different build, different version, different
platform or different application.
3.1 The Dell DVD Store Web Application
We now briefly introduce the Dell DVD Store application. The DVD Store (DVD Store 2 or
DS2) application is an open source enterprise software application. The DS2 application is
29
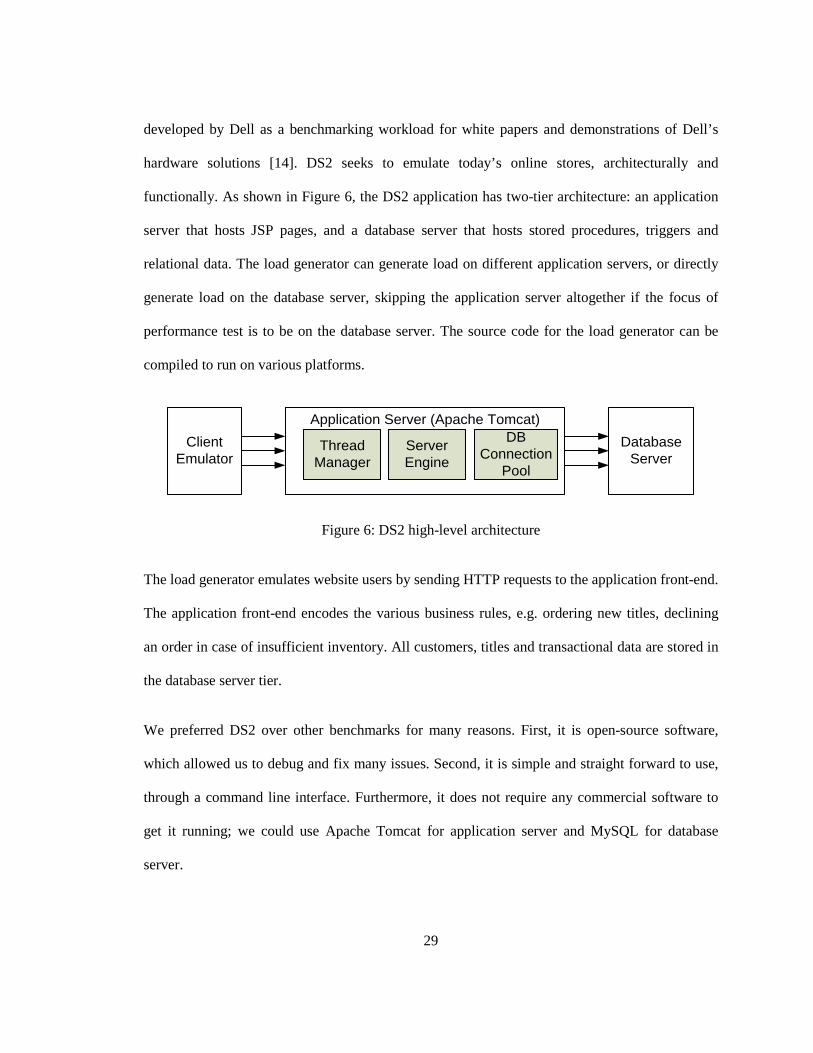
developed by Dell as a benchmarking workload for white papers and demonstrations of Dell’s
hardware solutions [14]. DS2 seeks to emulate today’s online stores, architecturally and
functionally. As shown in Figure 6, the DS2 application has two-tier architecture: an application
server that hosts JSP pages, and a database server that hosts stored procedures, triggers and
relational data. The load generator can generate load on different application servers, or directly
generate load on the database server, skipping the application server altogether if the focus of
performance test is to be on the database server. The source code for the load generator can be
compiled to run on various platforms.
Client Emulator
Application Server (Apache Tomcat)
Thread Manager
Server Engine
DB Connection
Pool
Database Server
Figure 6: DS2 high-level architecture
The load generator emulates website users by sending HTTP requests to the application front-end.
The application front-end encodes the various business rules, e.g. ordering new titles, declining
an order in case of insufficient inventory. All customers, titles and transactional data are stored in
the database server tier.
We preferred DS2 over other benchmarks for many reasons. First, it is open-source software,
which allowed us to debug and fix many issues. Second, it is simple and straight forward to use,
through a command line interface. Furthermore, it does not require any commercial software to
get it running; we could use Apache Tomcat for application server and MySQL for database
server.

30
We modified the Application Server code to capture more metrics, including the average time
spent in obtaining a connection, average number of threads waiting for connection, average
number of threads sleeping. For the purpose of conducting experiments, we also modified the
code to allow us to configure the maximum number of connections in the database connection
pool.
We had to fix a critical dead-lock situation to allow us to conduct performance tests at
concurrencies significantly higher than ever done before on DS2. The application server tier
would open first connection with the database to allow customer login and querying its purchase
history. Then after, it would open a second connection to browse the titles related to the titles in
the customer history. After a few minutes of run, all the Application Server threads would end-up
waiting for the second connection after capturing the first connection. As it was not possible with
the current MySQL driver to reuse connection, we modified the code to do not query the purchase
history and related titles. All these would not have been possible with any commercial closed-
source benchmark. We now explain each step of our framework using the DS2 application as a
running example.
3.2 Test Enumeration
The first step towards performance modeling of a software application is to enumerate the list of
performance tests which should be performed to build a performance model that would fulfill the
requirements of customers. This step is the only manual step in our framework. Our framework
automates the execution of the remaining steps. The test enumeration step consists of four
phases. We discuss below each phase using the DS2 application.

31
Phase 1: Enumeration of functional transactions
The performance analyst begins with enumerating the functional transactions available in the
application. For our case study, the functional transactions in the DS2 application are:
i. Creation of a new customer profile
ii. Customer login
iii. Searching for titles by category, actors, and genre.
iv. Purchasing a title
Phase 2: Mapping functional transactions to workload classes
The performance analyst needs to map the functional transaction to workload classes. Multiple
transactions can be grouped and modeled as a single workload, or each transaction can be
modeled as a separate workload. The analyst should decide based on the granularity and level of
details required in the model. For example for the DS2 application, if we are not interested in
modeling the performance demands of each individual transaction, we can consider a sequence of
login-search-purchase transactions as a single workload, as done by researchers at Dell [30].
Rather, we decide to consider each transaction as a workload class. We consider that the sequence
of login-search-purchase as a single workload may not be a valid assumption since a user might
do several search operations before making a purchase.
Phase 3: Prioritizing workload classes for test execution
The workload classes should be prioritized since the framework will execute tests to ensure that
each workload is represented in the final performance model. For instance, if the performance
model is being built for a new release in which the purchase functionality has been modified to
accept a new method of payment, the analyst may decide to only execute the tests corresponding
to the purchase workload and to reuse the data for other tests from the older model of the
application.

32
Phase 4: Picking the ranges for each workload class and the step size within a range
The range for each workload class and the step size within the range are picked based on the
experience of the analyst, the requirements imposed on the final performance model, and
historical knowledge about the application. For instance, if a particular setting would peg a
hardware resource at full utilization, the workload might be too high for the system to handle so
the range should be adjusted. In the absence of historical data, some trial and error might be
required to decide the ranges and stepping size, so that the measurement points are evenly
distributed. Now we enlist the settings available for the DS2 workload classes, so that we can
enumerate the tests with different values of those:
1. Frequency of a transaction: Number of transactions per hour.
2. Concurrency: Number of processes or threads concurrently generating the load on the
application.
3. Search categories: Search by name, category, actors or genre.
4. Purchase quantity: Number of DVDs purchased in one transaction.
The frequency and concurrency settings are applicable to all four workload classes. The search
category settings are applicable only to search workload. The purchase quantity settings are
applicable only to purchase workload. Table 1 shows the relation between the various settings
and the workload classes. All four settings (frequency, concurrency, search, and purchase) have
four levels.
Performance tests should be conducted at various combinations of the available settings for each
workload. For instance, the Login workload class has 4 levels for the frequency and concurrency
settings resulting in 16 possible combinations, for which a performance test needs to be
conducted. Based on studying the documentation of the DS2 application, we decided not to
33
consider the interaction between the workload classes, since each workload class has a service
demand that is independent of the demands of any other workload class. Based on our assumption
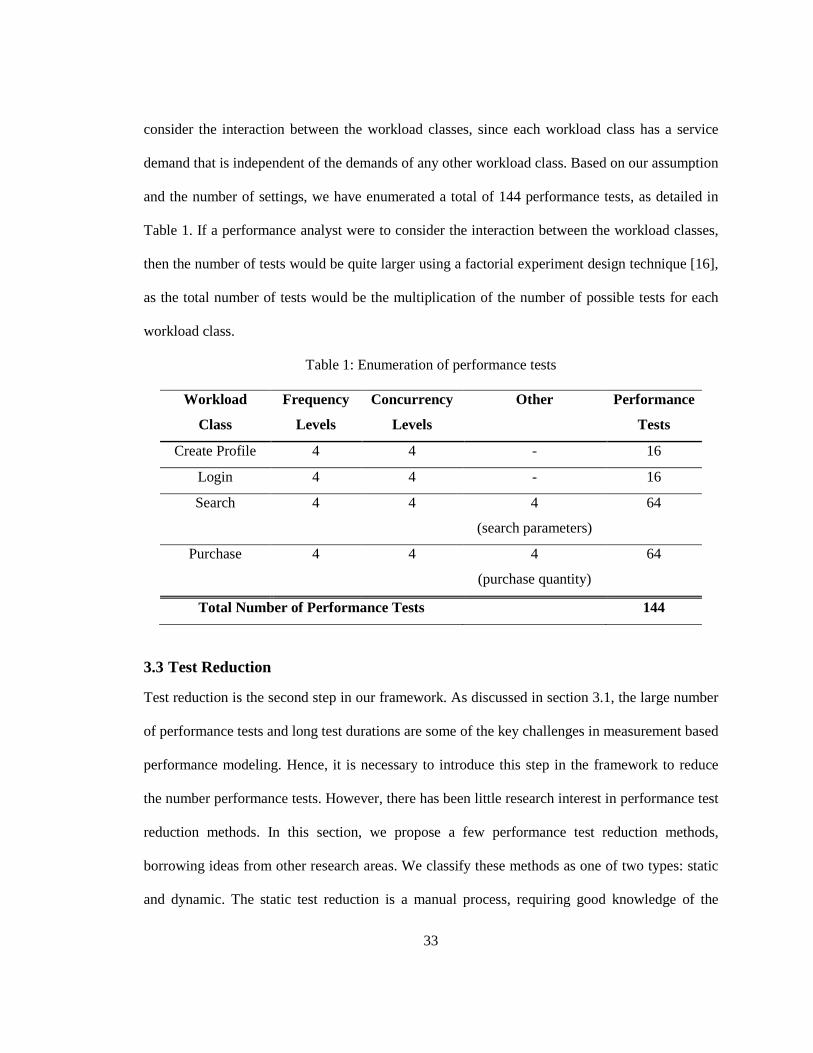
and the number of settings, we have enumerated a total of 144 performance tests, as detailed in
Table 1. If a performance analyst were to consider the interaction between the workload classes,
then the number of tests would be quite larger using a factorial experiment design technique [16],
as the total number of tests would be the multiplication of the number of possible tests for each
workload class.
Table 1: Enumeration of performance tests
Workload
Class
Frequency
Levels
Concurrency
Levels
Other Performance
Tests
Create Profile 4 4 - 16
Login 4 4 - 16
Search 4 4 4
(search parameters)
64
Purchase 4 4 4
(purchase quantity)
64
Total Number of Performance Tests 144
3.3 Test Reduction
Test reduction is the second step in our framework. As discussed in section 3.1, the large number
of performance tests and long test durations are some of the key challenges in measurement based
performance modeling. Hence, it is necessary to introduce this step in the framework to reduce
the number performance tests. However, there has been little research interest in performance test
reduction methods. In this section, we propose a few performance test reduction methods,
borrowing ideas from other research areas. We classify these methods as one of two types: static
and dynamic. The static test reduction is a manual process, requiring good knowledge of the

34
requirements of the performance model and the implementation of the application. The dynamic
test reduction methods are based on mathematical tools and techniques, which are built into the
framework and are carried out automatically.
3.3.1 Static Test Reduction
There usually are several functional transactions in a large software application. However, all of
the functional transactions may not be important for performance modeling. For instance,
customers who want to deploy a DVD Store application would not be much interested in the
performance of the admin functionalities. Rather, they would like to know how the store front
performs in regards to customer operations. Hence, uninteresting functional transactions can be
filtered out. Such a reduction method draws from the knowledge of the requirements.
Another set of reduction methods draws from the knowledge about the implementation. For
instance, if two features are similar to each other, it might be sufficient to conduct performance
tests on only one of them. For example, purchasing a DVD and purchasing a DVD Collection
features might differ by only a few code modules, so the performance analyst can decide to build
a model that captures only one of the features to reduce the number of needed tests, at least in the
first iteration of model building.
3.3.2 Dynamic Test Reduction
The idea of test reduction has been researched thoroughly in the functional testing area [37, 49].
However, this idea has not been explored much for performance testing and modeling. We
present a few approaches, which although used for other purposes, can be practically used here.
The Pareto principle [20] suggests that a small number of the application features account for
majority of the issues. This principle is applicable to functional as well as performance issues.

35
The dynamic test reduction techniques seek to identify those few features which contribute
significantly to application performance and only execute the tests that correspond to these
features.
The framework supports using the aforementioned methods or other research work in a plug-and-
play fashion. In our case study, we used a simplistic method for test reduction. We ran the two
extreme performance tests for each workload class: one with the lowest value and another with
the highest value from the entire array of workload sizes, as derived after the test enumeration
step. For instance, we ran the test for Purchase workload with quantities: one, and one thousand.
If the framework does not discover significant differences in performance between these two
tests, the framework skips the tests corresponding to the intermediate values. However, if the
framework discovers significant differences in performance due to the parameter settings (such as
concurrency, frequency and search type), it conducts the remaining tests for those settings. Using
this simplistic method we could reduce the number of tests from 144 tests to 64 tests. The
reduced list of performance tests is shown in Table 2.
3.4 Environment Setup
The environment setup is the third step in our framework. This step is designed to install the
application and the performance/load testing tools. Currently environment setup in the industry is
a manual, ad-hoc and error-prone process. There has not been much research work on automating
this step.
In our framework, we automated and implemented this step using a set of scripts in a stand-alone
module, which is invoked by the framework engine. The scripts set up multiple computer systems
– the application servers, database servers, load generators and performance tracking machines.
The scripts then verify the correctness of environment setup by making sure that the relevant

36
processes and services are running. However, each application and load testing tool has its own
installation steps. Hence, we anticipate a significant amount of rework is required in this step
when customizing the framework to another application or platform. We discuss the efforts
needed for customizing our framework in Section 3.9. Despite relatively large customization
efforts needed for this step, our experience using the framework shows that it is worthwhile to
automate this step, considering that the customization effort is a one-time effort.
Table 2: Reduced list of performance tests for DS2
Frequency (transactions per hour)
20 40 60 80
Conc
urre
ncy
250 Creating Customer Profile T111 T112 T113 T114
Customer Login T121 T122 T123 T124
Search Title T131 T132 T133 T134
Purchase Title T141 T142 T143 T144
Conc
urre
ncy
500 Creating Customer Profile T211 T212 T213 T214
Customer Login T221 T222 T223 T224
Search Title T231 T232 T233 T234
Purchase Title T241 T242 T243 T244
Conc
urre
ncy
1000
Creating Customer Profile T311 T312 T313 T314
Customer Login T321 T322 T323 T324
Search Title T331 T332 T333 T334
Purchase Title T341 T342 T343 T344
Conc
urre
ncy
1500
Creating Customer Profile T411 T412 T413 T414
Customer Login T421 T422 T423 T424
Search Title T431 T432 T433 T434
Purchase Title T441 T442 T443 T444

37
3.5 Test Execution
Conducting performance tests is a lengthy and tedious step. This major step is further divided into
three sub tasks: test setup, test run and test shutdown.
3.5.1 Test Setup
Each component of the application may need a set of test data for a particular test. For instance,
the DVD Store application in our case study needs to be loaded with test data of DVD titles,
registered customers, and their purchase history. Another important task in test setup is the
configurations of the application server, the database server and the load generator. Different
setting of the configuration parameters values can lead to drastically different performance
results. It is important to associate a performance test result with its configuration for the test
analysis step. Our framework archives the configuration files of the application with each
performance test.
Being confident that the tests are not affected by any one-off anomalies includes making sure that
the application is in a correct state before triggering the test. Problems with test setup are not
usually captured until the test analysis step, when the counters contradict themselves or do not
match expectations. For this reason, it is of prime importance to validate the test setup.
Our framework allows the writing of custom routines for test data setup, configuration, and setup
validation. These routines are invoked by the framework before triggering the test, thus allowing
complete automation of test setup tasks. Our experience at using the framework shows that such
custom routines provide significant time savings.
3.5.2 Test Run
There has been considerable work in recent years in automating the running of load and
performance tests. Sophisticated performance/load testing programs such as LoadRunner and

38
WebLOAD are available. These programs include 1) tools to record a script which represents the
workload class that is being tested, and 2) tools to generate workload by playing multiple
instances of the recorded scripts that emulate real-life concurrent users. To conduct the tests,
multiple instances of the recorded scripts are played from the load generating machines,
simultaneously probing the performance of the application. Once the scripts representing the
workload classes are recorded, running of each test is a three step process:
1. Start the performance counters.
2. Turn on the application.
3. Start the load generating tools.
Starting of the performance counters can be the last or the first step in the process. However,
starting the counters first allows capturing the transient response of the application while it is
being turned on and the load is building up. Each of these three main components of the test setup
might have multiple subcomponents that need to be turned on in appropriate sequence.
Appropriate time gaps might be needed between the successive steps.
Similar to test setup, the framework achieves automation in running tests by allowing scripting
and error checking of this important step in a modular way.
Each performance test goes through three phases:
1. Warm-up: Also known as ramp-up phase, during which the application is being subjected to
the workload. However the workload is not at its full strength but it is building towards the
designated workload level.
2. Steady-state: The warm-up phase gives way to the steady state phase if the environment is
well configured and the application can sustain the workload. During this phase, the
performance metrics are normally distributed with respect to the average.
39
3. Cool-down: Also known as ramp-down phase, during which the load generator gradually
stops injecting the workload and the resource utilizations gradually drop as the workload is
winding down.
3.5.3 Test Shutdown
The load generating tools should be shutdown. Often, the load generating tools are timed and can
be setup to shutdown once a test is completed. The application under test may need to be
triggered for shutdown or may continue running for the following tests. The decision to shut
down or to continue running the application is taken by the Test transition step. To remove the
need for manual intervention, the framework manages this process with scripting and error
checking.
3.6 Test Transition
Test transition is the process of switching from one performance test to the next. There are
various approaches for test transition. The fastest way to transition is to conduct the tests back to
back, meaning to start loading the application with the new workload, as soon as testing with the
previous one is completed. This approach results in fast test transition. However, it may not be
recommended in all instances, since the residual load from the previous test may interfere with
the next test. A slightly better transition approach is to add a delay, ranging from a few seconds to
few minutes, between performance tests, so that the residual load would flow out of the system.
The length of the delay can be determined experimentally. In practice, it is preferable to use a
heuristic based transition approach. The approach uses heuristics which monitor a few metrics to
determine if the residual load has flowed out and the system has reached idle state. For example,
a check can be made on application resources to ensure that the next test is not triggered until the
processor utilization of the application machine is below a particular threshold (e.g., 5%).

40
For some application domains, previous test data if continually accumulated can affect the results
of the following tests. For example, mail server applications continuously accumulate emails so if
the mail store is not cleaned up after every test, then the size of mail store will keep on increasing.
With an ever increasing mail store size, the disk resource might show sluggish performance in the
following performance tests. A regular archival process should be setup. After archival, fresh test
data for a particular test should be loaded. The best approach for such application is to clean-up
and restart the application after every test. The clean-up and restart approach would ensure that
there is no interference between performance tests.
Similar to the previous steps, the framework manages to automate these tasks with modularity of
invoking custom routines that carry out these transition tasks.
3.7 Test Analysis
Data derived from each executed test should be analyzed for absence of errors. Manually
analyzing the performance counters and application logs for these purposes could be time
consuming, tedious and repetitive task due to the large amount of produced data. Our framework
goes a step beyond by not only automating the analysis for errors, but also using the analysis for
test reduction and model building.
The framework triggers the analysis of the results automatically after a test is completed. The
major tasks of validating the test and analyzing the metrics are discussed in the subsections
below.

41
3.7.1 Test Validation
Several problems can arise during a performance test. For example:
• A functionality bug, e.g. a memory leak or inefficient implementation which results in a drift
of the hardware resources towards instability during the test.
• An interference from other processes or applications such as automatic download and install
of critical OS patches, or disk backup, These processes would cause abrupt changes in
resource availability and would lead to invalid values for the performance counters.
• A physical aspect, such as the rise in the operating temperature of the data center housing the
application under test. This temperature rise may lead to invalid performance counters.
Such problems leave the performance test data unusable for analysis and model building. To
detect such problems, the framework invokes validation routines, which check if the application
reached and maintained stability during the performance test and all counters are within their
expected bounds. Moreover the logs produced by the application are mined to detect any
execution anomalies which may indicate bugs in the application. There exists various log mining
techniques to detect bugs from logs [50]. A performance analyst can choose a technique based on
their needs.
A simple way to detect instability is the method of central moving average, which filters short
term fluctuations and highlights long-term trends. The instability in Figure 7 could be easily
detected algorithmically using this method. The method would show that the hardware resource
usage keeps on growing throughout the test and never stabilizes.

42
Figure 7: Instability in Resource Utilization
Our implementation of the validation module for the DS2 does four types of validations:
1. If the application reaches and maintains steady state during the test, but the utilization of a
resource is above 90% then we flag that test as unusable for modeling purposes. The reason
being, that measurement data at high utilizations are hardly reliable and repeatable [31].
Furthermore, all scheduled tests at higher settings than the current test are skipped (as part of
the test reduction step). This technique helps avoid wasting time in conducting performance
test which would produce invalid data due to overloading of the application.
2. If the application does not reach steady state (exhibit ever increasing or ever decreasing trend
in resource utilization), then we flag the test as unusable for modeling purposes. However, the
framework continues executing the tests at higher workload settings, unlike the previous case,
because instability in the current test may not necessary result into instability in tests at the
higher workload settings.

43
3. If a performance test with the same workload was executed previously (for a previous or
same build/version), and the measured metrics (utilization, response time, throughput) differ
by a configurable boundary value, the framework flags the current test as a possibly bad run.
The performance analyst can then do further analysis of such bad runs. After solving any
issues, the framework can run incremental modeling tests, only executing the performance
tests that were flagged out previously.
4. If the logs of the application show errors during a performance test show, then we flag the
test as unusable for modeling purposes. However, the framework continues executing the
tests at higher workload. The performance analyst can override this decision and incorporate
the results of this test in the modeling if they deem that the reported errors are not
performance critical.
After all the tests are automatically executed by the framework and results are presented to the
performance analysts. If there are any failures, manual debugging may be required to find the root
cause of test failure. Once problems are fixed, the flagged test can be re-run. The modularity and
automation in the framework allows the re-running of all or only a subset of the performance
tests.
Using our framework’s validation step, we identified a dead-lock bug in the DS2 application. The
application server tier would first open a connection to the database in order to allow customer to
login and query its purchase history. Then the application would open a second connection to
browse the titles related to the titles in the customer history. Within a few minutes of running a
test, all the threads in the application server would end-up waiting for the second connection after
capturing the first connection. As it was not possible with the current MySQL driver to reuse
connection, we modified the code to do not query the purchase history and related titles. We had

44
to fix the bug to allow us to conduct performance tests at concurrency levels that are significantly
higher than previously modeled for DS2. Once we fixed the bug, we could perform modeling at
higher concurrency levels.
3.7.2 Metric Analysis
For each performance test, the counters collected during the warm-up and cool-down periods
should be pruned from the analysis, while the counters from the steady state time period are
carried forward for analysis. Then, counters are imported in a statistical analysis package, such as
R [32], and statistical functions are applied to derive the average performance metric values.
Traditionally metric analysis has been a tedious manual task in performance modeling studies.
We automated this task by creating a script module that is invoked by the framework. The scripts
chop off the performance counter data captured during the warm-up and cool-down periods of
each test. We keep the length of the warm-up and cool-down period configurable in the
framework, to allow it to be easily customized for different applications. Finally, the framework
obtains the average metric values and stores the values in the performance database to support the
modeling effort.
We observed that for the DS2 application, a warm-up period of ten minutes was enough to reach
steady state. The cool-down period for DS2 was negligible because of the way the load
generating tool operates – it does not ramp-down the load during the trailing period of a test, it
rather drops the load from its determined levels to zero when the test time is up. However, many
performance analysts choose to keep the warm-up and cool-down period quite longer, to show the
longevity and sustainability that are desired in commercial application.

45
3.8 Model Building
In the previous step, the framework produced the performance metrics at different workload
sizes. In this step, the framework invokes the R statistical tool which builds a linear or nonlinear
regression model for the performance of the application. Figure 8 shows an example of fourth
order regression model between response time and processor utilization. Once a regression model
is built, performance predictions at arbitrary load levels are done using the fitted model. For a
comprehensive discussion of regression models and prediction techniques, refer to [16],
particularly chapters 14 and 15. The developed regression model could be used as a backend for a
capacity calculator.
Figure 8: Fourth order regression model
3.9 Customization Efforts
A major benefit of adopting our framework is the ability to reuse modeling efforts when building
performance models for other applications; or other platforms, versions and builds of the same
application. In addition to using the framework for building capacity calculator for the DS2
application, we are using the framework for building capacity calculators for a large multi-
platform enterprise application.

46
Table 3: Estimated efforts for customizing our framework
Framework Step
Another Build
Another Version
Another Platform
Another Application
Test Enumeration Minimal Reasonable Minimal Extensive
Test Reduction Minimal Reasonable Minimal Reasonable
Environment Setup Minimal Minimal Extensive Extensive
Test Execution Minimal Minimal Reasonable Extensive
Test Transition Minimal Minimal Reasonable Reasonable
Test Analysis Minimal Minimal Minimal Reasonable
Model Creation Minimal Minimal Minimal Minimal
When reusing the framework, several steps in the framework need to be customized to achieve
automation. Table 3 lists the estimated efforts needed to customize the steps in our framework.
We classify the customization efforts as Minimal, Reasonable or Extensive. Minimal efforts are
characterized by a quick review of the step; most of the implementation would be applicable as it
is, with little changes needed. Reasonable efforts imply the need for changing or rewriting of
some parts of the implementation of that step. Extensive efforts are characterized by a major
rewrite of the implementation for that step.
We anticipate that the efforts to customize the framework for another build to be minimal,
because all the steps would be applicable, as they are. For instance, no changes to the framework
were needed after we produced a new build of the DS2 application after we fixed the bugs in it.
For another version of the same application, reasonable efforts may be required in test
enumeration and reduction, considering that new features introduced in the version would result
in additional workloads which should to be tested and modeled. The rest of the framework would
still be applicable as is. Continuing the example of the DS2 application, if, for example, a Buyer
Feedback feature is added to the application, then only new tests related benchmarking of Buyer

47
Feedback workload need to be added. The new feature would not induce any major changes to
the implementation.
To customize the framework for the same application running on a different platform, the setup
and transition steps would need a rewrite of most of the implementation, resulting in extensive
effort requirement. However, spending the extensive efforts to customize the framework would
show returns many times, which would easily justify the cost. For example, once the framework
is implemented for the DS2 application for Microsoft Windows server using Windows scripting,
to build the framework for benchmarking the DS2 application on Linux server, the scripts for
environment setup, test execution and test transition would need to be rewritten using Linux shell
scripts. If a portable scripting language, such as PERL is used, the logic implementation would be
reusable but functionality that interact with processes and job scheduling would still need to be
updated.
To customize the framework for a different application deployed on the same platform,
reasonable efforts are required in the setup, execution and analysis steps because changes to the
automation scripts are needed.
3.10 Chapter Summary
Building capacity calculator using measurement based performance model is a challenging
process, requiring running a large number of performance tests in several steps. We presented our
framework for building capacity calculators that seeks to automate and speed up the process. We
provided the details of each step in the framework, demonstrating those steps using an example of
the open source DS2 application. We also discussed estimated efforts needed to customize the
framework. The next chapter discusses our technique for customer support on capacity planning.

48
Chapter 4
Technique for Customer Support on Capacity Planning
As established in Chapter 1, our work focuses on helping performance engineering and capacity
planning tasks in the important SLDC phases of verification and maintenance. In previous chapter
we discussed our framework for building capacity calculators, an important activity in
verification phase. In this chapter we provide details of our technique to help customer support on
capacity planning related issues that appear during the maintenance phase.
Our technique takes the execution log files for a customer as an input and retrieves the relevant
execution log files and corresponding customer engagement reports from the engagement
repository. Our technique retrieves two sets of engagement reports: (a) a set based on similar
operational profile, and (b) a set based on similar signature profile. Figure 9 summarizes the steps
of our technique. Algorithm of our technique is summarized as follows:
Obtain events distribution P for the input execution log
Obtain signature events distribution S for the input execution log
For each execution log Ri in the engagement repository
Obtain events distribution Pi
Obtain signature events distribution Si
Calculate distance Dp between P and Pi
Calculate distance Ds between S and Si
End For
Present engagement reports from the repository sorted by ascending order of Dp
Present engagement reports from the repository sorted by ascending order of Ds

49
CustomerExecution Logs
Convert Log Lines to Event
Distribution
Compare Event Distributions
Customer Engagement Repository
Compare Event Distributions
Identify Signature Events
Signature Event Distribution
OUTPUT RESULT SET
Closest Customer Engagement Reports
wrtSignature Profile
Closest Customer Engagement Reports
wrtOperational Profile
Event Distribution
Figure 9: Our Technique to Retrieve Relevant Engagement Reports
Our technique obtains event distribution from the customer execution logs by removing dynamic
information from the logs lines. Then it obtains a signature event distribution by identifying and
keeping the signature events and removing all other events from the event distribution. Similarly,
50
our technique obtains event distribution and signature event distribution for each of the
customer’s execution logs in the engagement repository. Then our technique compares the event
distribution of the incumbent customer to the event distribution of each of customer’s execution
logs stored in the engagement repository. Comparing the event distributions allows ranking of the
execution logs in the repository by their distance from the incumbent customer’s execution logs.
Using that ranking, closest customer engagement reports are presented to the support analyst, so
that the support analyst can apply the solution steps that worked in those engagements to the
incumbent customer engagement. The same process of comparing, ranking and presenting the
engagement reports is done for the signature event distributions. Next section examines execution
logs of enterprise applications. Section 4.2 to section 4.5 discusses the steps in our technique for
customer support. Section 4.5 discusses how we measure the performance of our technique.
4.1 Execution Logs
An operational feature of an application is made up of one or more code modules. A code module
can generate one or more events in the execution log once it is executed. Thus, one of the most
readily available information related to application usage at any customer deployment site is the
execution logs (or activity logs). The execution logs typically contain time-stamped sequence of
events at run-time. Figure 10 shows a sample execution log for an enterprise collaboration suite,
such as Zimbra [54] or Microsoft Exchange Server [29]. We note that execution logs tend to be
quite large in size, as they record code module level activities at runtime.
Execution logs help remote debugging by providing a detailed context for field issues. While
many applications are designed with their own logging mechanisms, logging frameworks such as
the Apache Logging Services [2] can be used to enable event-logging in applications.

51
<time> Queuing new mail msgid=ABC threadid=XYZ
<time> New meeting request msgid=ABC threadid=XYZ
<time> Instant msg. Sending packet to client msgid=ABC threadid=XYZ
<time> Client established IMAP session emailid=ABC threadid=XYZ
<time> Client disconnected. Cannot deliver msgid=ABC threadid=XYZ
<time> New contact in address book emailid=ABC threadid=XYZ
<time> User initiated appointment deletion emailid=ABC threadid=XYZ
<time> Instant msg. Sending packet to client msgid=ABC threadid=XYZ
Figure 10: An Example of Execution Logs
4.1.1 Legal Requirements on Application Logging
In response to increased accounting and security regulations, governments in various nations
created laws requiring the logging of the execution of enterprise and financial applications. For
instance, the Sarbanes-Oxley Act of 2002 [43] in the US, and the EU directive of 2006 on data
retention [7] are major steps in that direction. These legal requirements helped increase the
availability of the execution logs required as an input for our technique. There has also been an
increased concern over privacy and security information present in the execution logs. It is
common to remove such sensitive information from the logs before passing it for application
analysis. Our log mining technique works equally well on such anonymized execution logs.
4.1.2 Execution Logs vs. Tracing Logs
Execution logs are routinely generated at customer installation sites according to selected logging
levels. Execution logs contain activity events (such as “Account verified” or “Message
delivered”) as well as error events (such as “Message queue full” or “Too many requests, server
busy”). In contrast, tracing logs (or implementation logs) are generated by code instrumentation
or statistical sampling using profiling tools. Tracing logs provide lower level details, such as
logging of each function call during runtime (such as “Function CheckPassword() called”).

52
While tracing logs provide more accurate details, they are mainly used during development [11]
and result in a high overhead on the application. Hence tracing logs are not normally available at
customer sites, though they might provide a better representation of the operational and signature
profiles. For this work, we use the readily available execution logs.
4.2 Obtain an Event Distribution from Log Lines
Execution logs are composed of dynamic and static information. Each log line has static
information about the execution event and dynamic information that is specific to the particular
occurrence of that event. We must obtain log events from the execution log lines by removing the
dynamic information. We use an approach which employs clone detection techniques to identify
the variation points for each log line and abstracts the variation points by replacing those with
generic tokens [53]. For example, given the two log lines “Open inbox user=A” and “Open inbox
user=B”, our technique would abstract both the log lines to the event “Open inbox user=?”.
Once the log lines are abstracted to events, we obtain a distribution of log events by event
counting. The event distribution is then normalized as the percentage of each event in the event
log, so that we can compare event logs for different running times without bias. For retrieval
based on signature profile, we want to give higher weight to the events occurring at lower than
normal rate (rare events) over events occurring at higher than normal rate. To give events with
lower than average occurrence a boost in the distribution, the frequency for each event is inverted
in the signature distribution.
An example of three logs files is shown in Table 4. R1, R2 and R3 represent the original event
distributions of three log files F1, F2 and F3 respectively. Their corresponding operational event
distributions P1, P2, and P3 are used for operational profile based retrieval. The last three
columns S1, S2 and S3 show the inverted event distributions used for signature profile based

53
retrieval. This example is used as a running example in this section. Looking at the frequencies of
the events in R1, R2 and R3, we expect our technique to show that F1 is closer to F2 in terms of
operational profile, while F1 is closer to F3 in terms of signature profile. Note that this is a very
small example intended to show our technique at work. For real applications, the number of
events is expected to run into hundreds or thousands, instead of just five events as considered in
this example.
Table 4: An Example of Event Distribution
ID Event
Original
Event Counts
Event
Distributions
Signature Event
Distributions
R1 R2 R3 P1 P2 P3 S1 S2 S3
E1 New Message 4000 3500 1000 44.39 46.66 22.16 0.02 0.02 0.05
E2 New Contact 3500 3000 1500 38.84 39.99 33.24 0.03 0.03 0.03
E3 New Meeting Request 1500 1000 2000 16.64 13.33 44.33 0.06 0.08 0.03
E4 Message Queue Full 5 1 6 0.06 0.01 0.13 18.02 75.01 7.52
E5 Connection Lost 7 0 6 0.08 0.00 0.13 12.87 0.02 7.52
Total 9012 7501 4512 100 100 100 31.01 75.13 15.14
4.3 Identify Signature Events
A signature event is a rare, i.e., infrequent event in a log file relative to the occurrences of all
events in other log files from other deployments stored in the repository. Events such as dropped
connections, thread dumps, and full queues are examples of signature events. Instead of searching
for such events in log files in a hard-coded way, we examine the distribution of the events in all

54
log files and we pick the events that are occurring at rates that vary considerably from the norm.
These signature events indicate potential problems or outlier execution paths that are experienced
by the application. By counting those signature events, signature event distribution is created.
Signature event distribution is a subset of the operational event distribution, as it contains only the
signature events.
The problem of deciding whether an event is a signature event for a given log file is essentially a
problem of statistical hypothesis testing. Statistical hypothesis testing determines whether
observed frequency of an event contains enough information to justify that the frequency is
different from the norm. Pearson’s chi-square test, commonly referred to as the chi-square test is
one of the best known hypothesis testing procedure. We use chi-square test to filter out the non-
signature events from the logs. Other possible statistical tools that can be used include the popular
hypothesis testing procedures, such as the z-test, and student’s t-test.
We use the chi-square test to determine whether or not a particular event (E) in a log file is
occurring at a frequency that is consistent with the occurrence of that event (E) in the rest of the
log files in the repository. To use the chi-square test, a null hypothesis is to be established, such
as, the likelihood of occurrence of an event in one distribution is same as likelihood of its
occurrence in another distribution. We establish the null hypothesis: the likelihood of occurrence
of the event E in the given log file is same as likelihood of its occurrence in any other log file.
The chi-square statistic is calculated for event E using the formula:
where

55
Oi = an observed frequency
Ei = the expected frequency, asserted by the null hypothesis
n = the number of possible outcomes
Continuing the example considered in Table 4, the contingency table for the event E4 in the log
file F1 is shown in Table 5. The contingency table is used to obtain values needed to compute the
chi-square statistic. The number of possible outcomes is two: the event in the input file is the
event E4, or the event is any other event. The contingency table lists the observed frequency of
the event. The expected frequency is calculated for each cell of the contingency table using the
equation:
The chi-square statistic is then used to obtain a chi-square probability (also called p-value) by
comparing the value of the statistic to a chi-square distribution table, commonly found in any
statistics textbook. A chi-square probability of 0.05 or less is commonly interpreted as
justification for rejecting the null hypothesis. However, we consider a probability of 0.10 or less
as a justification to reject null hypothesis, as we intend to be liberal to be able to capture lighter
peculiarities while comparing log files. All the events from a log file for which the null
hypothesis gets rejected are peculiar events to that log file, and will be part of the signature
profile of the particular log file.
Using the equation for chi-square statistic, the value for chi-square statistic is 2.749, which
corresponds to a p-value smaller than 0.10. Thus, the null hypothesis is rejected. Thus the chi-
square test flags that event E4 is occurring at a different rate in the input file F1 than usual. Using
the chi-square test on the rest of the events in Table 4, events E4 and E5 are flagged as signature

56
events for S1; E4 for S2; and E4 and E5 for S3. Only these events are considered part of the
signature event distribution for the corresponding log file. The events filtered out by chi-square
test are highlighted in gray background in the columns S1, S2, and S3 in Table 4.
Table 5: Contingency Table for Chi-Square Test
Frequency of the Event Frequency of Other Events Column Total
In input log file 18.02 12.99 31.01
In all other log files 41.26 3.87 45.13
Row Total 59.28 16.86 76.14
4.4 Compare Event Distributions
After the previous two steps, we have an operational event distribution and a signature event
distribution for the input log file and all the log files in the repository. The characteristics of the
event distributions vary depending on the operational profile and problem symptoms of a
customer. If two customers have similar operational profiles, they would have similar event
distributions. Figure 11 shows three different distributions of events for visual examination. The
horizontal axis represents different events in the event distributions and the vertical axis
represents the frequencies of those events. Visual inspection reveals that distributions D1 and D2
are similar to each other, compared to D1 and D3, or D2 and D3. We measure the distance
between event distributions using two commonly used distance metrics: the Kullback-Leibler
divergence and the cosine distance.
Figure 11: Visually Examining Distribution Similarity
D1 D2 D3

57
In the next two subsections, we discuss the distance metrics that we used to measure the
similarity between two event distributions. We also apply these metrics on the example presented
in Table 4.
4.4.1 Kullback-Leibler Divergence Metric
Given two distributions P and Q, the Kullback-Leibler divergence [5] (here after called K-L
divergence) between P and Q is defined as:
K-L divergence is sometimes referred to as relative entropy or information gain. K-L divergence
is not a distance metric in the strictest sense, because it is not symmetric, and the triangle
inequality does not hold. That is, KL(P,R) is not equal to KL(R,P), and KL(P,R) can be greater
than KL(P,Q)+KL(Q,R). To surmount the asymmetry limitation, we define distance DKL(P,Q) as
the sum of KL(P,Q) and KL(Q,P). The smaller the DKL value, the closer the distributions are.
We now show the use of K-L divergence using the example of Table 4. For this example, the
operational profile distance DKL(P1,P2) is 0.41, DKL(P1,P3) is 18.9, which confirms that the
operational profiles for F1 and F2 are closer compared to F1 and F3. The signature profile
distance DKL(S1,S2) is 35.29, and DKL(S1,S3) is 5.24, which confirms that signature profiles
for F1 and F3 are closer compared to F1 and F2.
4.4.2 Cosine Distance Metric
To compare two event distributions, they can be represented as vectors and similarity can be
drawn in terms of the geometric distance. Each event type can be considered as a dimension and
the frequency of occurrence of an event type can be considered as the weight in that dimension.

58
Thus, for a given event log, the relevant event log is the one with the minimum distance in the
vector space. One widely used distance metric in this context is the cosine distance, which is
defined as:
Figure 12 shows a two dimensional example for geometric interpretation of cosine distance. In
the Figure, the cosine distance measures the cosine of the angle between the vectors A and B,
with values between 0 and 1. In information retrieval systems, the cosine distance has been used
as a similarity measure between two vectors representing two entities, such as queries, documents
or web pages. If the two vectors are similar (congruent in geometric representation), the cosine
distance reaches its maximum value, 1. If the vectors have least in common (perpendicular to
each other in the geometric representation), the cosine distance reaches its minimum value, 0.
For the example in Table 4, the cosine distance for operational profiles DC(P1,P2) is 0.998 and
DC(P1,P3) is 0.824, which quantify that F1 is closer to F2, compared to F3. The cosine distance
for signature profiles DC(S1,S2) is 0.814 and DC(S1,S3) is 0.986, which confirms that signature
profile for F1 is closer to F3, compared to F2. In this example, the results for both K-L and cosine
distance metrics are consistent, but in practice the results may vary. We explore both distance
metrics in our case studies in chapter 5.
Figure 12: Geometric Representation of Two Dimensional Vectors

59
4.5 Measuring Performance of the Technique
To measure the performance of our technique, we employ traditional metrics for information
retrieval: precision and recall [44]. Our technique retrieves the most relevant log files for a given
execution log file. For example, if the set of relevant log files for a given a log file F is C = {F1,
F2, F3} and our technique returned the set R = {F1, F3, F4, F5}, as shown in Figure 13, then we
measure precision and recall as follows:
CR = {F1, F3} is the intersection of the sets C and R. For our example, the precision would be
2/4 = 50% and the recall would be 2/3 = 66%. An optimal retrieval technique is the one which
produces the best values for both precision and recall.
Figure 13: Precision and Recall
The precision and recall measures above are applicable to a single log file. To measure the
accuracy of our technique over several log files, we use the average precision and recall as
follows:
CClosest
Log Files
RRetrievedLog Files
F2
F1
F3
F4F5
CR

60
Here N is the total number of log files on which we applied our technique.
4.6 Chapter Summary
In this chapter we discussed our technique to help support analysts in issue resolution of capacity
planning problems. We explained each step of technique. The technique is based on comparing
execution logs of incumbent support request with those of previously solved support requests.
The execution log lines are first raised to execution events by removing dynamic information. We
obtain operation profile event distribution by counting those events. Then signature events are
filtered using statistical hypothesis testing. We obtain a signature profile event distribution by
counting those filtered signature events. Then, a distance metric, such as Kullback–Leibler
divergence or cosine distance metric is used to measure closeness of the event distributions from
the incumbent support request to the event distributions from previously solved support requests.
Comparing those events logs provides two sets of previously solved engagement reports:
1) One set which is closest to the incumbent support request w.r.t. its operational profile, and
2) Another set which is closest to the incumbent support request w.r.t. its signature profile.
Using the engagement reports retrieved by our technique, support analysts can now apply the
solutions that worked in previous engagements to the incumbent support engagement.
In the next chapter we demonstrate the effectiveness of our technique through cases studies based
on applying our technique on one open-source test application, and one widely deployed
commercial application. The results of the case studies prove the effectiveness of our technique
with high precision and high recall.

61
Chapter 5
Case Studies for Customer Support Technique
Previous chapter introduced our technique for retrieving relevant reports from a customer
engagement repository. We reason that retrieving relevant reports enormously helps support
analyst because the support analyst can then apply the solution that worked in the previous
engagement to the incumbent support request. To study the effectiveness of our technique for
customer support for capacity planning, we conducted case studies using synthetic and field
deployment logs from a test application and an enterprise application. Using the synthetic logs
we could measure the performance of our technique under specific simulated settings. Using the
field deployment logs, we could measure the performance of our technique in a real life setting.
We present the two case studies in the following sections. Figure 14 summarizes the case studies
we performed and the results we obtained.
Case Studies
Test Application
Industrial Application
Operational Profile based
Retrieval
Signature Profile based
Retrieval
Signature Profile based
Retrieval
Operational Profile based
Retrieval
Section 5.1 Section 5.1 Section 5.2.1 Section 5.2.2
Figure 14: Case Studies Tree
62
5.1 Case Study on an Open-Source Application
The application
Our first test application is the Dell DVD Store application. The DVD Store (DVD Store 2 or
DS2) application is an open source enterprise software application. The DS2 application is
developed by Dell as a benchmarking workload for white papers and demonstrations of Dell’s
hardware solutions [15]. DS2 seeks to emulate today’s online stores, architecturally and
functionally. DS2 has a three-tier architecture. DS2 includes application server components,
database server components and a load generator engine (client emulator).
The DS2 load generator emulates website users by sending HTTP requests to the application
front-end. The DS2 application front-end encodes the various business rules, such as ordering
new titles, declining an order in case of insufficient inventory. All customers, titles and
transactional data are stored in the database server tier. We chose DS2 over other applications
since it is an open source application which others can download to easily compare our results
with their work.
Experimental Setup
To demonstrate the feasibility of our technique, we need to create a repository of log files. We
generate a large number of log files based on various simulated runs of the application. For each
log file we ensure that we produce other relevant log files. Once we have these log files, we can
pick each log file and use our technique to retrieve other relevant log files. We can then measure
the precision and recall of our technique.
Since the DS2 application is a benchmarking application that is not intended for production
deployment, it is not designed to generate execution logs. So for the purpose of our case study,

63
we instrumented the application code to generate logs for execution events. The main operational
features in the DS2 application are: Create Account, Login, Search the Store, Add to Cart and
Checkout. We instrumented the code so that each of these operational features would generate a
balanced number of execution events (four events each). So we have 20 different execution
events in total.
We applied different synthetic workloads and collected the resulting execution log files. Table 6
lists the log files we collected. Each column in the table is a workload parameter, whose unique
value makes operational features exercised in corresponding proportion, leading to unique
execution logs. New Customer Percentage parameter identifies percent of the order cycles that
would exercise the Create Account feature. Its value can be between 0 and 100, its typical value
is 20. Average Number of Searches per Order identifies the number of times the Search operation
should be performed in an order cycle, its typical value is 5 in the application. The remaining two
parameters Average Number of Items Returned in each Search and Average Number of Items per
Order are fairly self-explanatory. To create our repository of logs, we conduct load sessions with
three different settings for each of the parameters – the typical value for the parameter and a value
on either side of the typical value – for each of these parameters, while keeping the other
parameters at their typical value. The resulting list of operational profiles is presented in Table 6,
in which each row is a unique log file.
Since we aim to retrieve relevant log files with similar operational profile, we reran all the load
sessions of Table 6 three times each. Thus, for each log file our technique for similar operational
profile should return the three log files corresponding for the three reruns.

64
Table 6: List of Log Files Tested for Retrieval
New Customer Percentage
Average Number of Searches per
Order
Average Number of Items Returned
in each Search
Average Number of Items per
Order
F1 100 5 5 5
F2 50 5 5 5
F3 20 5 5 5
F4 0 5 5 5
F5 20 1 5 5
F6 20 10 5 5
F7 20 5 1 5
F8 20 5 10 5
F9 20 5 5 1
F10 20 5 5 10
To test the performance of our technique for signature profile based retrieval, we need log files
with similar signature events, as well as log files with different signature events. We obtained log
files with signature events by introducing known problems in the DS2 application code, and
sporadically invoking those problem paths in a controlled fashion using the load generator. For
instance, we changed the application code to submit an ill-formatted SQL command to the
database if a purchase order has more than 25 items, resulting in an exception event in the
execution log. To sporadically invoke this problem path, we configure the load generator to create
less than 0.5% of all the purchase orders with more than 25 items.
We introduce same sporadic problem events in operationally different log files listed in the Table
6. That is, similar problem events are added to groups of log files as {F1, F2, F3, F4}, {F2, F3,
F4, F5}, {F3, F4, F5, F6}, and likewise. Hence the expected retrieval results from the technique
are the log files having similar signature events, irrespective of the similarity in the operational

65
events. That is, the expected result set for F3 are F1, F2, F4, F5; expected result set for F4 are F2,
F3, F5, F6; and likewise.
Experiment Results
Using our technique, we could correctly retrieve the relevant operational profile and relevant
signature profile with 100% precision and 100% recall using both the K-L divergence and cosine
distance metrics.
5.2 Case Study on an Industrial Application
Our second application is a multithreaded enterprise application deployed at many organizations
worldwide. The application provides rich enterprise communication features, such as email and
calendar synchronization. With more than 700 unique execution events (compare to 20 unique
execution events in DS2 application), it provides a base for a fairly complex experiment setup.
5.2.1 Studying Retrieval by Operational Profile
The Application
We studied the effectiveness of our technique on many different experiments. In the subsections
5.2.1.1 to 5.2.1.5, we present these experiments. Although these experiments do not cover all
possible real world operational profile comparison situations, we believe they represent the
breadth of it. Table 7 summarizes results of all the experiments. We discuss each of the
experiments in the following subsections.
Experimental Setup and Results
5.2.1.1 Single Feature Group
In this experiment, we use log files of workloads with a single feature group of the application. A
feature group is a set of related operational features of the application. For example, an enterprise
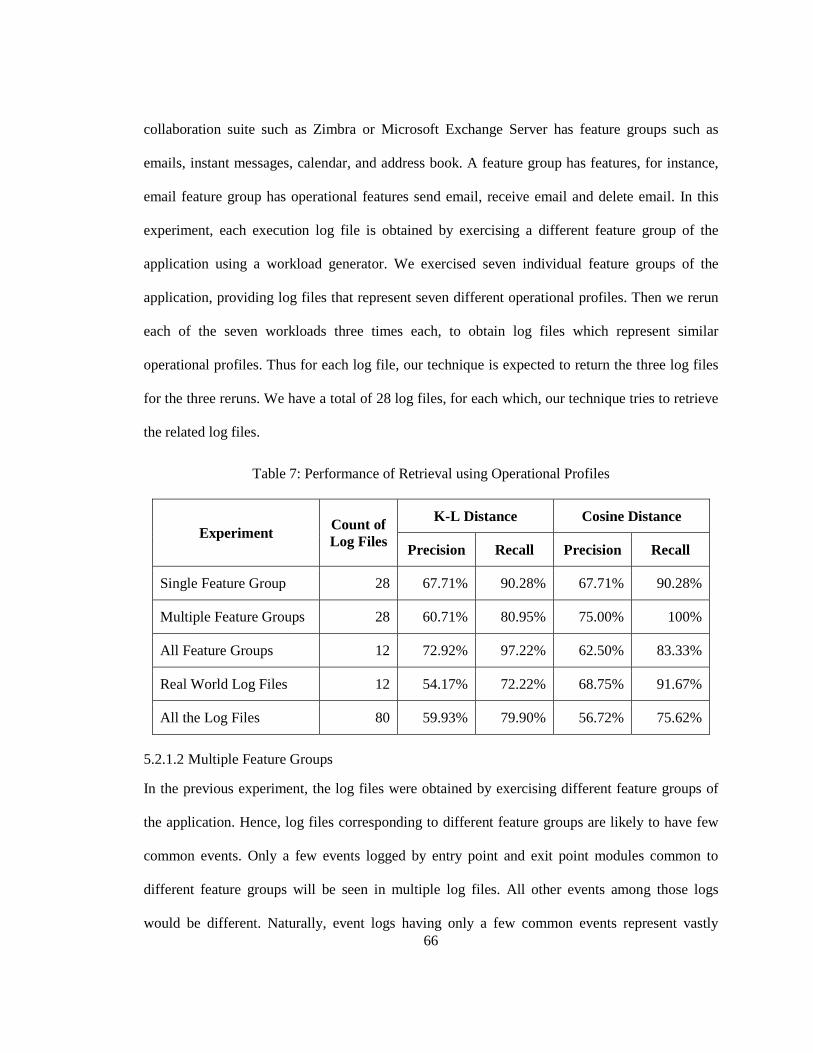
66
collaboration suite such as Zimbra or Microsoft Exchange Server has feature groups such as
emails, instant messages, calendar, and address book. A feature group has features, for instance,
email feature group has operational features send email, receive email and delete email. In this
experiment, each execution log file is obtained by exercising a different feature group of the
application using a workload generator. We exercised seven individual feature groups of the
application, providing log files that represent seven different operational profiles. Then we rerun
each of the seven workloads three times each, to obtain log files which represent similar
operational profiles. Thus for each log file, our technique is expected to return the three log files
for the three reruns. We have a total of 28 log files, for each which, our technique tries to retrieve
the related log files.
Table 7: Performance of Retrieval using Operational Profiles
Experiment Count of Log Files
K-L Distance Cosine Distance
Precision Recall Precision Recall
Single Feature Group 28 67.71% 90.28% 67.71% 90.28%
Multiple Feature Groups 28 60.71% 80.95% 75.00% 100%
All Feature Groups 12 72.92% 97.22% 62.50% 83.33%
Real World Log Files 12 54.17% 72.22% 68.75% 91.67%
All the Log Files 80 59.93% 79.90% 56.72% 75.62%
5.2.1.2 Multiple Feature Groups
In the previous experiment, the log files were obtained by exercising different feature groups of
the application. Hence, log files corresponding to different feature groups are likely to have few
common events. Only a few events logged by entry point and exit point modules common to
different feature groups will be seen in multiple log files. All other events among those logs
would be different. Naturally, event logs having only a few common events represent vastly

67
different distributions. It is possible to believe that this bias can result in seeing higher
effectiveness of our technique, which is unlikely to exist in real world. Hence, we conduct this
experiment, having incremental addition of feature groups to the log files.
We start this experiment with exercising a single feature group of the application using the
workload generator, and collect the log files. For subsequent log files, we keep adding the feature
groups one by one to the list of exercised feature groups. Thus, we build a repository of seven log
files which represent operational profiles with incremental feature groups exercised in those
profiles. Now we rerun those workloads three times each. Thus we have a pool of 28 log files for
each which, our technique tries to retrieve the related log files. Now we apply our technique to
retrieve the relevant log files. For each log file, the expected relevant log files are its three
siblings from the three reruns, followed by the neighboring log files in which one less and one
more feature group was exercised.
5.2.1.3 All Feature Groups
In the previous experiment, each log file had a mix of feature groups exercised in it. However,
because the feature groups were exercised incrementally, it is obvious that each log file would
exhibit successively more events. Thus the log files are likely to have different set of events. The
set of distributions which have different set of events are likely to show greater distance,
compared to the set of distributions with common events. It is arguable that this can result in
seeing higher effectiveness of our technique in such situations, which are unlikely to exist in real
world. Hence, we conduct this experiment with real world operational profiles.
The log files in this experiment have all the events in common, but differ only in the frequencies
of those events. We conduct multiple load sessions on the application, and exercise all the feature
groups. We make the load sessions to differ only in the intensities of exercising the feature

68
groups. We conduct three load sessions with varying intensities of the seven operational features.
Then we rerun each of the seven load sessions three times each, to obtain log files which
represent similar operational profiles. For each of the 12 log files, the expected relevant log files
are its three siblings from the three reruns.
5.2.1.4 Real World Log Files
In the previous experiment, each log file had a mix of operational features exercised in it.
However, because the operational features were exercised incrementally, it is obvious that each
log file would exhibit successively more events. Thus the log files are likely to have different set
of events. The set of distributions which have different set of events are likely to show greater
distance, compared to the set of distributions with common events. It is arguable that this can
result in seeing higher effectiveness of our technique in such situations, which are unlikely to
exist in real world. Hence, we conduct this experiment with real world operational profiles.
We apply our technique on execution logs from three deployments of the application. However,
we do not know the expected result set, unlike the previous two experiments. So we divide each
log file in four segments, for which relevant log files are being retrieved. Assuming that usage
pattern for any field deployment will not change to a great extent in short duration, we expect that
our technique should retrieve the three segments of the same log file for each of the 12 log file
segments.
5.2.1.5 Combining all the Log Files
In this final experiment for operational profiles, we compare together all the log files generated in
all the previous experiments. As a result, we have some log files that exhibit different operational
feature, some exhibiting incremental addition of operational features, and some have same
operational features, but different intensities. This experiment includes all possible scenarios and

69
a large pool of log files to be compared. It represents the most intense test of accuracy of our
technique. In total, we have 80 different log files profiles – collection of all the log files listed in
experiments discussed in sections 5.2.1.1 to 5.2.1.4. For each log file, the expected relevant log
files are same as described in those sections.
5.2.2 Studying Retrieval by Signature Profile
Experiment Setup
The experiment setup for studying signature profile retrieval needs log files with similar signature
events, as well as log files with different signature events. The startup events are a set of known
signature events in the log files of the application under study. The startup events are logged by
the application at the application startup. The startup events log the state of the environment, such
as list of processes running in the system, system uptime, and configuration parameter values. To
use the startup events as signature events of the log files, we split each of the log files in four
segments. Hence the first segment of each log file contains the startup events, while the
subsequent three segments do not have those. For each first segment of each log file, the expected
relevant log files are the first segments of other log files. For each the first segments, the
remaining segments of the same log file are likely to be operationally similar, but we do not
expect those in the result set as we are trying to retrieve log files based on similar signature
profile.
Experiment Results
We took all the log files from the previous study on the operational profile, except the reruns.
Thus we have 20 log files, which are divided in four segments each. We applied signature profile
based retrieval technique on the first segment of each of the log files. Our technique correctly

70
retrieved the first segment of other logs with 100% precision and 100% recall, even though the
first segment is likely to be operationally closer to the other three segments of the same log.
5.3 Chapter Summary
In this chapter we discussed a list of key case studies that we performed. These studies exercise
our technique in different possible real world and in-the-lab scenarios. We chose an open-source
application and instrumented it to provide us execution logs, so that we can control and enact
different possible real-life logging scenarios. Then we also conduct similar tests on a globally
deployed industrial application. Our tests show promising results – retrieval of related
engagement reports at high precision and high recall, i.e. minimal number of false-positives and
maximum number of related reports successfully retrieved from the repository. In the next
chapter we critically discuss the results.

71
Chapter 6
Results and Limitations
Chapter 3 discussed our framework for building capacity calculators. Chapter 3 also presented
case study of applying our framework for the DS2 test application. Chapter 4 provided the details
of our technique on customer support for capacity planning related issues. Chapter 5 provided
case studies for our technique using the DS2 test application and a widely deployed commercial
application. In this chapter we critically discuss the results and limitations of our framework and
technique.
6.1 Framework for Building Capacity Calculators
The proposed framework is based on our research and experience in measurement based
modeling of two applications: the Dell DS2 application and another large enterprise application.
These applications are complex enterprise applications but they may not represent the entire class
of enterprise applications. Additional steps and limitations may be discovered while applying the
framework to other applications.
We integrated research from other researchers to automate various steps in our framework.
However, limited research was available in a few of the steps, so we employed heuristics in those
steps. One of the key benefits of our framework is that it directs researchers to focus on these
areas. Moreover the encoding of those heuristics in the framework ensures that the repetitive
tasks corresponding to those heuristics are well-documented and could be later revisited by
practitioners.
Some of the dynamic analysis activities are currently not automated in the framework and a
performance analyst must conduct these activities manually. This is our first attempt at building

72
this framework, which can be extended further with research work focusing on each of the
following points.
• Adjusting the performance tests to precisely determine various key operational points or
objects, e.g. knee capacity and bottleneck resources. Unless the tests are carefully designed,
the built model can be inaccurate near such operational points.
• Adjusting the performance testing period and lengths of ramp-up and cool-down periods.
This mainly involves determining how long the application takes to reach steady state
condition and how many data points we need in each test, to be confident enough about the
input data and analysis results.
6.2 Technique for Customer Support on Capacity Planning
The case studies discussed in chapter 7 demonstrate the performance of our technique. We
achieved perfect results for the DS2 application due to the simplicity of the application and
balanced instrumentation of all the operational features of the application. For the industrial
application, our technique for operational profile performed well with the K-L divergence metric,
and marginally better with the cosine distance metric. We believe the inaccuracies in the results
for the industrial application stem from these complexities of real world applications:
1. Real world applications often log a large number of events which do not correspond
directly to a particular operational feature, such as idle time events, server health check
events, and startup and shutdown events. Moreover, there can be an imbalance of such
events, which can lead to inaccuracies in the result of our technique. For instance, if the
application generates the health check events more frequently while in idle time, this is
an example of imbalance.

73
F1E2
E1
F2E4
E3
E6
E5
F3E8
E7
E10
E9
400
F1E2
E1
F2E4
E3
E6
E5
F3E8
E7
E10
E9
F1E2
E1
F2E4
E3
E6
E5
F3E8
E7
E10
E9
E12
E11
E12
E11
E12
E11
OP1 OP2 OP3
400
200
400
450
200
400
400
220
Figure 15: Example of Imbalance in Event Logging
2. Another root cause of inaccuracies in the industrial application can stem from the
imbalance in the number of events per feature. As the exact event-to-feature mapping is
not known, our technique cannot detect such issues. Figure 15 shows a small example of
highly imbalanced event logging, wherein feature F1 and F2 generates two events each,
whereas feature F3 generates eight events. With the frequencies of executions as shown
in circles below each feature in the figure, it is visible that OP1 is closer to OP2
compared to OP3, because F3 was executed twenty more times in OP2 than OP1,
whereas F2 was executed fifty more times in OP3 than OP2. However, because of the
imbalance in event logging, our technique will show the divergences as
DKL(OP1,OP2)=3.31 and DKL(OP1,OP3)=2.56, which does not reflect the fact. Our
technique cannot detect such issues because the exact event-to-feature mapping is not
74
known to our technique. One simple way to handle such wide imbalances is to create
meta-events which group co-occurring events together. These meta-events can be used
for measuring the distance between event distributions. For the example in Figure 15,
events E1 and E2 would be considered one event M1, E3 and E4 would be considered
one event M2, and E5 to E12 would be considered one event M3 since each group of
event is occurring an equal number of times. The M1-M3 events would be used for
measuring the distance between event distributions instead of the E-type events.
Empirical research studies should be evaluated to determine whether they are measuring what
they were designed to assess. In particular, we should examine if our finding that a given log file
is more relevant to a particular log file compared to others is valid and applicable in general; or if
it is due to any flaws in our experimental design. Four types of tests are used [52]: construct
validity, internal validity, external validity, and reliability.
Construct Validity: Construct validity is concerned with the meaningfulness of the
measurements – Do the measurements quantify what we really intend to measure? We claim that
locating related execution logs attached to customer engagement report will help support analysts
in resolving problems sooner. We have not validated this claim, but based on our experience,
locating a relevant case is usually of great value and provides many starting points if not the
needed final solution.
Precision and recall metrics do not capture the internal rank among the retrieved operational
profiles. For example, consider that our technique retrieved OP2, OP3 and OP4 (in that order) but
the actual rank of closeness among these three is OP3, OP2 and OP4 (in that order). The precision
and recall metrics do not seem to reflect such unfairness in retrieving OP3 first instead of OP2.
In our experiments, we did not observe such unfairness. Furthermore, we assume that all the
75
related engagement reports retrieved by our technique are useful to the analyst working on a new
customer engagement.
Internal Validity: Internal validity deals with the concern that there may be other plausible
reasons to explain our results – Can we show that there is a cause and effect relation between
differences in operational profiles and ranking of those by our technique? We assume here that
execution logs capture the operational profile and signature profile of an application. We believe
this is a valid assumption; however, the presence of wide imbalances in event logging, as
discussed above, can invalidate our assumption. Moreover, our case study uses logs from the
same version of an application. We did not test our technique on the execution logs of different
versions. We believe limitations might be observed if there are large changes in the type of
logged events.
External Validity: External validity tackles the issue of the generalization of the results of our
study – Can we generalize our results to other software applications? Although we applied our
technique on a small test application and a complex enterprise application developed by a large
number of practitioners, we only looked at two applications. Therefore our results may not
generalize to other types of applications.
Reliability: Reliability refers to the degree to which someone analyzing the data would reach the
similar results as us. We believe that the reliability of our technique is high. Practitioners and
researchers can easily run the similar tests on their applications (or the DS2 application) to
produce findings specific to these applications, and compare those to our findings.

76
6.3 Chapter Summary
We presented a critical view of the results and limitations our work in this chapter. Our work
seeks to support performance engineering and capacity planning related activities during the
verification and maintenance SDLC phases.
Our framework seeks to bring together difference research and automate the capacity calculator
building process. While the work is implemented in practice, it is still a work in progress. The
performance tests need to be carefully designed, and may be required to be adjusted during the
process to exercise certain important operational points, such as knee capacity and bottleneck
resources. Also, not all steps are automated yet. We have not yet determined precise way to
automatically prune the warm-up and cool-down periods.
Limitations with our customer support technique include noise resulting from events that do not
map to any operational features. Though, we did not find significant effect of such noise events in
our tests with the two applications that we chose to experiment with. Imbalance caused by some
operations logging too many events, while other operations remaining silent may also lead to
impact the accuracy of the technique. Such imbalance can be eliminated by detecting and
replacing co-occurring events with a single meta-event.
77
Chapter 7
Conclusion
7.1 Major Topics Addressed
In chapter 1 we introduce capacity planning and support efforts in practice. Customers of large
scale enterprise applications need to determine the hardware capacity to procure in order to obtain
the desired performance in terms of response time and throughput. To enable capacity planning at
customer site, performance analysts of the vendors need to continuously build and update
capacity calculators for applications. Such capacity calculators are based on measurement based
performance modeling of the application. After deployment, customers often engage the software
vendor when they run into performance and capacity related issues. Continuous customer
engagements allow the software vendors to build a rich knowledgebase – a customer engagement
repository, which has valuable information related to problems and solutions, which can be
immensely helpful in future engagements.
Chapter 1 also discusses the challenges being faced in capacity planning and support, which
provides the motivation for our work. Building of a capacity calculator requires running a large
number of performance tests on the application. Performance testing is often the last step on
already delayed product cycle; hence time is of essence while running the performance tests.
Risks of errors are pretty high because of the manual process of running performance tests. To
alleviate the situation, revelation of performance bugs or mis-configurations of the application
settings result in rerunning of the whole test suite. Challenges in customer support for capacity
issues are also abound. Analysts have to depend on their experience and understanding of the
system to link symptoms to possible solutions. Knowledge from an engagement is often archived

78
in a customer engagement report, but no systematic techniques exist to retrieve that knowledge,
except for applying basic keyword search.
We discuss major related work in chapter 2. We discuss eminent research work related to
capacity planning and performance modeling. We also discuss research works that target specific
steps in our framework for building capacity calculators. Then we present research works from
event correlation domain, as those are related to our log-based technique to retrieve relevant
customer engagement reports. Then research works related to mining of customer engagement
reports are presented. Lastly, we present related research in retrieval of operational profile and
signature profile.
Chapter 3 provides details of our framework for building capacity calculators. We discuss major
steps of test enumeration, test reduction, environment setup, test execution, test transition, test
analysis and model building. We also present estimated efforts required to customize the
framework from one application to another, one version to another, and one build to another.
In chapter 4, we discuss our technique for customer support for capacity planning. In that, we
discuss how we convert log lines to event distributions, how we identify signature events, and
how we compare event distributions to rank the distributions and associated customer
engagement reports according to its similarity to a give event distribution. We also discuss how
we measure the performance of our technique using precision and recall metrics.
In chapter 5, we discuss the case studies of our customer support technique. We discuss one case
study on an open source large test application: Dell DVD Store, and another case study on a
globally deployed large industrial application. We present our results in operational profile based
retrieval, as well as signature profile based retrieval.

79
We discuss the strengths and limitations of our work in chapter 6. We also discuss the manual
steps involved in our framework, and the sources of errors that affect the results of our technique.
7.2 Major Thesis Contributions
We presented a framework for building capacity calculators for enterprise applications using
measurement based performance modeling. The need for such a framework is felt from the
current challenges in performance modeling practices in industry. These models are produced
through a labor intensive and error prone process which always occurs at the end of already late
release schedules. The contributions of our framework are as follows:
1. It automates the building of measurement based performance models.
2. It works on measurement based performance modeling of large enterprise applications, as
demonstrated by the case studies on the Dell DVD store application and another larger
enterprise application.
3. It brings together various venues of research to support analysts in their day-to-day
activities. Using our framework researchers can explore contributing and fitting their own
research work into the proposed framework. Moreover, analysts can compare various
tools and techniques using the structure of our framework.
4. It is highly customizable to work for a different build, a different version, a different
platform or a different application. Limited efforts are involved in customizing our
framework for other applications and other platforms.
The customer engagement repository contains rich information about symptom, issues, root
causes, workarounds, and resolutions from previous engagements. Retrieval of relevant reports
helps support analysts resolve client issues quicker and better. We presented a technique to

80
analyze the execution logs from the customer engagement repository and retrieve the relevant
execution logs and corresponding customer engagement reports. The contributions of our
technique are as follows:
1. It retrieves relevant reports from customer engagement repository based on similar
operational profile and signature profile. As demonstrated by case studies, it retrieves
such relevant reports with high precision and high recall.
2. It can be applied immediately on an application, since the execution logs of most
applications are readily available and are usually archived in the customer engagement
repository. Our technique can equally aid in remote issue resolution by identifying
relevant engagement reports and recommending resolution steps.
3. It requires no code changes, nor does it require any data collection from customers.
Hence it can be easily adopted by companies and does not depend on a particular
software application, version, build, or platform.
4. It also allows comparing load testing and stress testing execution logs with the customer
execution logs to verify and ensure that the workload being used in load testing and stress
testing is close to real-world customer workloads.
7.3 Future Research
Our work in this thesis seeks to automate, optimize and enhance the performance engineering
activities during verification and maintenance phases of the software development life cycle.
Specifically, we proposed a framework to automate and speed up the performance measurement
and model building process, and a technique to retrieve relevant reports from customer
engagement repository to help support analysts troubleshoot customer deployments. Our

81
technique to retrieve relevant reports from the customer engagement repository is also useful to
ensure that the workload used in load testing and stress testing is close to customer workloads.
However, challenges in performance engineering and capacity planning are many and far from
over. Significant challenges remain in load testing and stress testing, which we plan to address. In
particular, load tests execution needs online analysis of multiple performance counters to
determine:
a) The time point when the system reaches steady state
b) The time points when the test has run long enough for one to be statistically confident
about the average performance
c) whether the performance during a load test is similar to previous load tests
d) instabilities, such as memory leaks, and processor and disk contention
More work is required to unify and automate the processes for performance modeling across the
industry. More attention is required from academia on the use of measurement based techniques,
which have wider acceptance in the industry, compared to other analytical and simulation based
techniques. We intend to continue research work seeking automation of more steps in our
framework for building capacity calculators.
We wish to apply our technique for customer support on other software applications to generalize
our findings across different types of software applications. We also intend to apply and improve
data mining and log correlation techniques in order to improve the retrieval of relevant reports
from a customer engagement repository. We plan to develop techniques to correlate multiple
performance counters from system resources, such as disk, processor, memory, thread pool, and
connection pool, in order to identify bottlenecks in a customer’s environment.

82
7.4 Commercialization
Our framework for building capacity calculators has been developed and is in use at our industrial
research partner, Research In Motion. Practitioners can borrow ideas from our research work to
develop and customize similar framework for their capacity planning of their applications.
We have shown that our technique for customer support for capacity planning successfully
retrieves relevant customer engagement reports with high precision and recall. Measuring the
financial value of our work is difficult, because the financial returns to the software vendor
depend on several factors, such as the number of customers, the face value of the software, and
the use of appropriate software development methodologies. However, we argue that the
customer satisfaction resulting from applying our work in performance engineering of software
applications is invaluable. To commercialize our work, more work is required to combine it with
more features to be able to sell it as a product. Our technique can definitely be added as a feature
in some of the existing commercial log management tools, such as LogLogic [26] and Sensage
[39]. Some of the features available in such commercial log management tools include log
archival, SQL-like querying on the logs, automated analysis to ensure the absence of security
breach, and a number of methods for business intelligence using log analysis.

83
Bibliography
[1] Andrews, J. H. Testing using log file analysis: tools, methods, and issues., 1998. Proceedings of the 13th IEEE International Conference on Automated Software Engineering, (1998), 157-166.
[2] Apache Logging Services Project: log4j, log4cxx and log4net. http://logging.apache.org
[3] Avritzer, A. and Weyuker, E. J. The Role of Modeling in the Performance Testing of E-Commerce Applications. IEEE Transactions on Software Engineering, 30, 12 (2004), 1072-1083.
[4] Courtois, M. and Woodside, M. Using regression splines for software performance analysis. WOSP '00: Proceedings of the 2nd international workshop on Software and performance. (Ottawa, Ontario, Canada). ACM, New York, NY, USA, 2000, 105-114.
[5] Cover, T. M. and Thomas, J. A. Elements of information theory. Wiley-Interscience, New York, NY, USA, 1991.
[6] Cronk, R. N., Callahan, P. H. and Bernstein, L. Rule-based expert systems for network management and operations: an introduction. Network, IEEE, 2, 5; presented (1988), 7-21.
[7] Directive 2006/24/EC of the European Parliament and of the Council. http://eur-lex.europa.eu/LexUriServ/LexUriServ.do?uri=CELEX:32006L0024:EN:HTML
[8] Elbaum, S. and Narla, S. A methodology for operational profile refinement. Proceedings of the Annual Reliability and Maintainability Symposium. 2001. 142-149.
[9] Goldsmith, S. F., Aiken, A. S. and Wilkerson, D. S. Measuring empirical computational complexity. ESEC-FSE '07: Proceedings of the 6th joint meeting of the European software engineering conference and the ACM SIGSOFT symposium on The foundations of software engineering. (Dubrovnik, Croatia). ACM, New York, NY, USA, 2007, 395-404.
[10] Gunther, N. J. Guerrilla Capacity Planning: a Tactical Approach to Planning for Highly Scalable Applications and Services. Springer-Verlag New York, Inc., 2006.
[11] HamouLhadj, A. and Lethbridge, T. C. A survey of trace exploration tools and techniques. CASCON '04: Proceedings of the 2004 conference of the Centre for

84
Advanced Studies on Collaborative research. (Markham, Ontario, Canada). IBM Press, 2004, 42-55.
[12] Hui, S. C. and Jha, G. Data mining for customer service support. Inf. Manage., 38, 1 (2000), 1-13.
[13] Israr, T. A., Lau, D. H., Franks, G. and Woodside, M. Automatic generation of layered queuing software performance models from commonly available traces. WOSP '05: Proceedings of the 5th international workshop on Software and performance. (Palma, Illes Balears, Spain). ACM, New York, NY, USA, 2005, 147-158.
[14] Jaffe, D., Muirhead T. The Open Source DVD Store Application.
[15] Jaffe, D. and Muirhead, T. The Open Source DVD Store Application.
[16] Jain, R. The art of computer systems performance analysis: Techniques for Experimental Design, Measurement, Simulation, and Modeling. John Wiley & Sons, 1991.
[17] Jakobson, G. and Weissman, M. Real-time telecommunication network management: extending event correlation with temporal constraints. Proceedings of the fourth international symposium on Integrated network management IV. Chapman & Hall, Ltd, London, UK, UK, 1995, 290-301.
[18] JUnit testing framework. http://www.junit.org
[19] JUnitPerf: JUnit test decorators to measure the performance and scalability of functionality contained within existing JUnit tests. http://www.clarkware.com/software/JUnitPerf.html
[20] Juran, J. M., Godfrey A. B. Juran’s Quality Handbook. McGraw-Hill Professional, 1988.
[21] Kounev, S. and Buchmann, A. SimQPN: a tool and methodology for analyzing queueing Petri net models by means of simulation. Perform.Eval., 63, 4 (2006), 364-394.
[22] Kounev, S. and Buchmann, A. Performance Modeling and Evaluation of Large-Scale J2EE Applications. 29th Int. Conf. on Resource Management and Performance Evaluation of Enterprise Computing Systems. (Dallas, Texas, December 7-12, 2003).
85
[23] Lewis, L. A case-based reasoning approach to the management of faults in communications networks. Proceedings of the Ninth Conference on Artificial Intelligence for Applications, 1993. (1993), 114-120.
[24] Liu, T., Kumaran, S. and Luo, Z. Layered Queueing Models for Enterprise JavaBean Applications. EDOC '01: Proceedings of the 5th IEEE International Conference on Enterprise Distributed Object Computing. IEEE Computer Society, Washington, DC, USA, 2001, 174.
[25] HP LoadRunner Softwar: integrated software performance testing tools. https://h10078.www1.hp.com/cda/hpms/display/main/hpms_content.jsp?zn=bto&cp=1-11-126-17%5E8_4000_100__
[26] LogLogic Enterprise Log Management and Intelligence Platform. http://www.loglogic.com/
[27] Mania D., Murphy J. Framework for predicting the performance of component-based systems. IEEE 10th International Conference on Software, Telecommunications and Computer Networks. (Italy, October 2002).
[28] Menascé, D. A., Almeida, V. A. F., Fonseca, R. and Mendes, M. A. A methodology for workload characterization of E-commerce sites. EC '99: Proceedings of the 1st ACM conference on Electronic commerce. (Denver, Colorado, United States. ACM, New York, NY, USA, 1999, 119-128.
[29] Microsoft Exchange Server messaging and collaborative software. http://www.microsoft.com/exchange/default.mspx
[30] Muirhead T., Jaffe, D. Migrating enterprise databases from Sun servers to the Dell PowerEdge 2850 running Microsoft Windows Server 2003.
[31] Pentakalos, O. and Friedman, M. Windows 2000 performance guide: help for Windows 2000 administrators. O'Reilly & Associates, Inc, Sebastopol, CA, USA, 2002.
[32] The R project for statistical computing. http://www.r-project.org/
[33] Ramanujam, S., Yamany, H. E. and Capretz, M. A. M. An Agent Oriented Approach to Operational Profile Management. International Journal of Intelligent Technology, 1, 4 (2006).

86
[34] Research In Motion. BlackBerry Enterprise Server for Microsoft Exchange version 4.1 performance benchmarking. http://www.blackberry.com/knowledgecenterpublic/livelink.exe/fetch/2000/8067/645045/7963/7965/1180408/Performance_Benchmarking_Guide.pdf?nodeid=1367404&vernum=0
[35] Research In Motion. Capacity calculator for BlackBerry Enterprise Server 4.1 for Microsoft Exchange. http://www.blackberry.com/select/toolkit/dls/BlackBerry_Enterprise_Server_Version_4.1.0_for_Microsoft_Exchange_Capacity_Calculator.xls
[36] Roberts, D. C. and Grossman, D. A. Modifying the software development life cycle to include software performance assurance. WESCANEX 97: Communications, Power and Computing. Conference Proceedings. , IEEE, (1997), 100-104.
[37] Rothermel, G. and Harrold, M. J. A safe, efficient regression test selection technique. ACM Trans.Softw.Eng.Methodol., 6, 2 (1997), 173-210.
[38] Sankarasetty, J., Mobley, K., Foster, L., Hammer, T. and Calderone, T. Software performance in the real world: personal lessons from the performance trauma team. WOSP '07: Proceedings of the 6th international workshop on Software and performance. (Buenes Aires, Argentina). ACM, New York, NY, USA, 2007, 201-208.
[39] Sensage Log Data Warehouse for security, compliance and systems management. http://www.sensage.com
[40] Sim, S. E. Supporting multiple program comprehension strategies during software maintenance. Masters Thesis, University of Toronto, 1998.
[41] Smith, C. U., Llad\'o, C. M., Cortellessa, V., Marco, A. D. and Williams, L. G. From UML models to software performance results: an SPE process based on XML interchange formats. WOSP '05: Proceedings of the 5th international workshop on Software and performance. (Palma, Illes Balears, Spain, ). ACM, New York, NY, USA, 2005, 87-98.
[42] Sopitkamol, M. and Menascé, D. A. A method for evaluating the impact of software configuration parameters on e-commerce sites. WOSP '05: Proceedings of the 5th international workshop on Software and performance. (Palma, Illes Balears, Spain). ACM, New York, NY, USA, 2005, 53-64.
[43] SOX. Summary of Sarbanes-Oxley Act of 2002. http://frwebgate.access.gpo.gov/cgi-bin/getdoc.cgi?dbname=107_cong_bills&docid=f:h3763enr.tst.pdf

87
[44] Tan, P., Steinbach, M. and Kumar, V. Introduction to Data Mining, Addison-Wesley Longman Publishing Co., Inc, Boston, MA, USA, 2005.
[45] Thomas, B. The concept of dynamic analysis. ESEC/FSE-7: Proceedings of the 7th European software engineering conference held jointly with the 7th ACM SIGSOFT international symposium on Foundations of software engineering. (Toulouse, France, ). Springer-Verlag, London, UK, 1999, 216-234.
[46] WebLOAD load testing stress testing tool. http://www.webload.org/
[47] Weimer, W. and Necula, G. C. Mining Temporal Specifications for Error Detection. TACAS 2005: Eleventh International Conference on Tools and Algorithms for the Construction and Analysis of Systems. (April 4-8, 2005).
[48] Woodside, M., Franks, G. and Petriu, D. C. The Future of Software Performance Engineering. FOSE '07: 2007 Future of Software Engineering. IEEE Computer Society, Washington, DC, USA, 2007, 171-187.
[49] Xie, T., Marinov, D. and Notkin, D. Rostra: A Framework for Detecting Redundant Object-Oriented Unit Tests. ASE '04: Proceedings of the 19th IEEE international conference on Automated software engineering. IEEE Computer Society, Washington, DC, USA, 2004, 196-205.
[50] Yang, J., Evans, D., Bhardwaj, D., Bhat, T. and Das, M. Perracotta: mining temporal API rules from imperfect traces. ICSE '06: Proceedings of the 28th international conference on Software engineering. (Shanghai, China, ). ACM, New York, NY, USA, 2006, 282-291.
[51] Yilmaz, C., Krishna, A. S., Memon, A., Porter, A., Schmidt, D. C., Gokhale, A. and Natarajan, B. Main effects screening: a distributed continuous quality assurance process for monitoring performance degradation in evolving software systems. ICSE '05: Proceedings of the 27th international conference on Software engineering. (St. Louis, MO, USA, ). ACM, New York, NY, USA, 2005, 293-302.
[52] Yin, R. K. Case Study Research: Design and Methods. Sage Publications, Thousand Oaks, CA, 1994.
[53] Jiang, Z. M., Hassan, A. E., Hamann, G., Flora, P. An automated approach for abstracting execution logs to execution events. Journal of Software Maintenance and Evolution: Research and Practice, 20, 4 (2008), 249-267.
[54] Zimbra Collaboration Suite. http://www.zimbra.com/products
[55] Zoeteweij, P., Abreu, R. and J.C. van Gemund, A. Software Fault Diagnosis. Springer, 19th IFIP International Conference on Testing of Communicating

88
Systems and 7th International Workshop on Formal Approaches to Testing of Software, 2007. (Tallinn, Estonia, June 26-29).
[56] Thakkar, D., Hassan, A. E., Hamann, G., Flora, P. A framework for measurement based performance modeling. Proceedings of the 7th International Workshop on Software and Performance. WOSP 2008, Princeton, NJ, USA, June 23-26, 2008, 55-66.
[57] Thakkar, D., Jiang, Z. M., Hassan, A. E., Hamann, G., Flora, P. Retrieving relevant reports from a customer engagement repository. Proceedings of the 24th IEEE International Conference on Software Maintenance. ICSM 2008, September 28 - October 4, 2008, Beijing, China, 117-126.
Related Documents