Automated Calculation of Infarct Transmurality E Heiberg, H Engblom, M Ugander, H Arheden Department of Clinical Physiology, Lund University, Sweden Abstract The aim of this study was to develop an algorithm to automatically calculate infarct transmurality based on a non dichotomous infarct classification, and to compare with manual delineation. Global transmurality as calculated by the computer algorithm were significantly smaller than the consensus delineation of three observers (p<0.05). On a regional basis in 6 sectors of each slice the variability of the three observers compared to consensus delineation was 17%, 15%, and 20%. The variability of the automated algorithm was 16%. In conclusion, weighted calculation of transmurality gave smaller global transmurality compared to consensus delineation, but did had the same variability on a regional basis. 1. Introduction Infarct size and transmurality are important determinants of prognosis after myocardial infarction [1]. Infarct size can be measured by using contrast delayed enhancement MRI (DE-MRI). There have been many approaches to automatically calculate infarcted myocardium from DE-MRI [2-8]. A common denominator of all these methods is that they all try to determine an image intensity threshold above which pixels are treated as completely hyperenhanced. Instead we have proposed an approach where pixels are not dichotomously classified as hyperenhanced or not [9]. In this approach each pixel that is classified as hyperenhanced after myocardial infarction is weighted with the pixel intensity to compensate for partial volume effects. Partial volume effects may cause one image pixel to be partially hyperenhanced or gray. Although partial volume effects have been suggested as a potential source of error in DE-MRI [10-12] to our knowledge no one has up until now incorporated a compensation for partial volume effects when designing automated methods for quantification of infarct size. 2. Aim The aim of the study was to extend the previously proposed weighted algorithm to be able to calculate infarct transmurality, and compare these results with manual delineation. 3. Methods For the previously developed automated infarct quantification algorithm [9], each pixel is assigned an infarct percentage. In order to assess infarct transmurality the following two steps are required. 3.1 Region of hyperenhancement The first step in the process is manual delineation of both endocardium and epicardium. This process can also be made semi-automatically [13]. The algorithm applied to find the region of hyperenhancement is based on finding a threshold between hyperenhanced and normal viable myocardium based from number of standard deviations from remote. This is then combined with a 3D post processing method that restricts the hyperenhanced region to be spatial contiguous both in the in plane and through plane direction [14]. The number of used standard deviations from remote myocardium was optimized and calibrated by comparing the result of the algorithm on in vivo images with high resolution ex vivo images in 8 pigs as a reference standard [9]. 3.2 Calculation of infarct transmurality To calculate infarct transmurality the infarct percentage was integrated along radial spikes of the myocardium. The complete algorithm was implemented in the freely available software Segment (http://segment.heiberg.se ). ISSN 0276-6574 165 Computers in Cardiology 2007;34:165-168.

Welcome message from author
This document is posted to help you gain knowledge. Please leave a comment to let me know what you think about it! Share it to your friends and learn new things together.
Transcript
Automated Calculation of Infarct Transmurality
E Heiberg, H Engblom, M Ugander, H Arheden
Department of Clinical Physiology, Lund University, Sweden
Abstract
The aim of this study was to develop an algorithm to
automatically calculate infarct transmurality based on a
non dichotomous infarct classification, and to compare
with manual delineation.
Global transmurality as calculated by the computer
algorithm were significantly smaller than the consensus
delineation of three observers (p<0.05).
On a regional basis in 6 sectors of each slice the
variability of the three observers compared to consensus
delineation was 17%, 15%, and 20%. The variability of
the automated algorithm was 16%.
In conclusion, weighted calculation of transmurality
gave smaller global transmurality compared to consensus
delineation, but did had the same variability on a
regional basis.
1. Introduction
Infarct size and transmurality are important
determinants of prognosis after myocardial infarction [1].
Infarct size can be measured by using contrast delayed
enhancement MRI (DE-MRI). There have been many
approaches to automatically calculate infarcted
myocardium from DE-MRI [2-8]. A common
denominator of all these methods is that they all try to
determine an image intensity threshold above which
pixels are treated as completely hyperenhanced. Instead
we have proposed an approach where pixels are not
dichotomously classified as hyperenhanced or not [9]. In
this approach each pixel that is classified as
hyperenhanced after myocardial infarction is weighted
with the pixel intensity to compensate for partial volume
effects. Partial volume effects may cause one image pixel
to be partially hyperenhanced or gray. Although partial
volume effects have been suggested as a potential source
of error in DE-MRI [10-12] to our knowledge no one has
up until now incorporated a compensation for partial
volume effects when designing automated methods for
quantification of infarct size.
2. Aim
The aim of the study was to extend the previously
proposed weighted algorithm to be able to calculate
infarct transmurality, and compare these results with
manual delineation.
3. Methods
For the previously developed automated infarct
quantification algorithm [9], each pixel is assigned an
infarct percentage. In order to assess infarct transmurality
the following two steps are required.
3.1 Region of hyperenhancement
The first step in the process is manual delineation of
both endocardium and epicardium. This process can also
be made semi-automatically [13]. The algorithm applied
to find the region of hyperenhancement is based on
finding a threshold between hyperenhanced and normal
viable myocardium based from number of standard
deviations from remote. This is then combined with a 3D
post processing method that restricts the hyperenhanced
region to be spatial contiguous both in the in plane and
through plane direction [14]. The number of used
standard deviations from remote myocardium was
optimized and calibrated by comparing the result of the
algorithm on in vivo images with high resolution ex vivo
images in 8 pigs as a reference standard [9].
3.2 Calculation of infarct transmurality
To calculate infarct transmurality the infarct
percentage was integrated along radial spikes of the
myocardium. The complete algorithm was implemented
in the freely available software Segment
(http://segment.heiberg.se).
ISSN 0276−6574 165 Computers in Cardiology 2007;34:165−168.
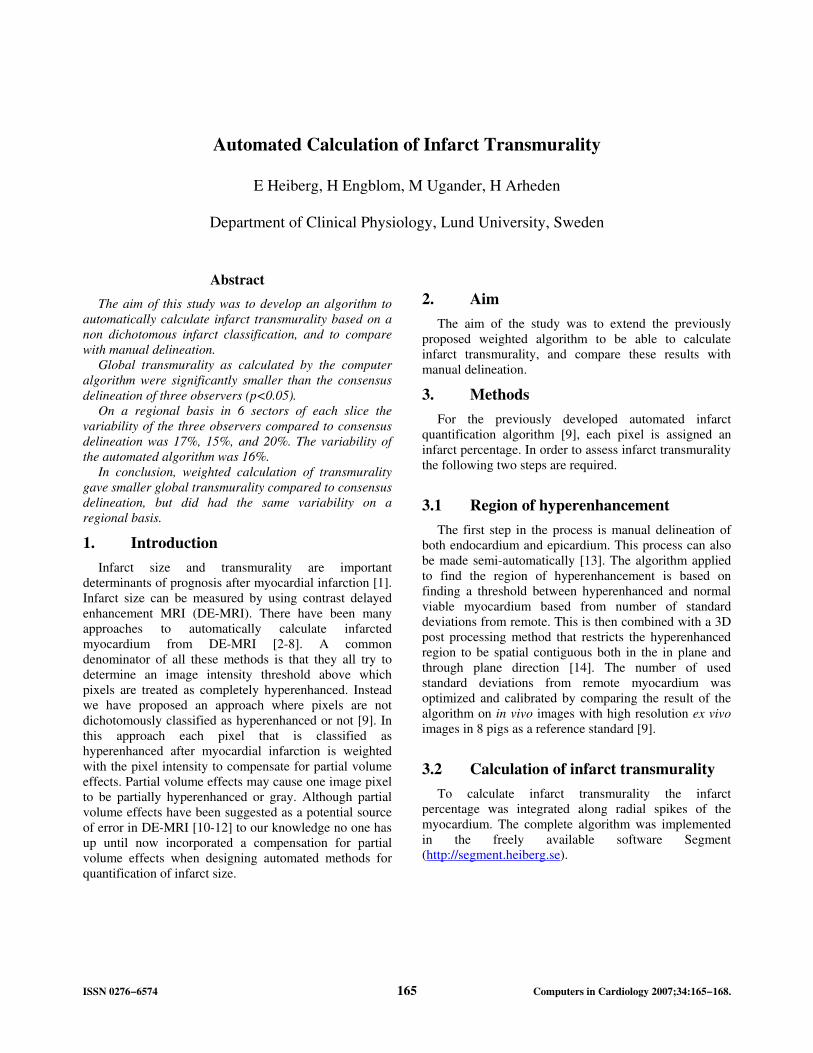
An illustration of the user interface is shown in Figure 1
below.
Figure 1. Screenshot of the freely available software.
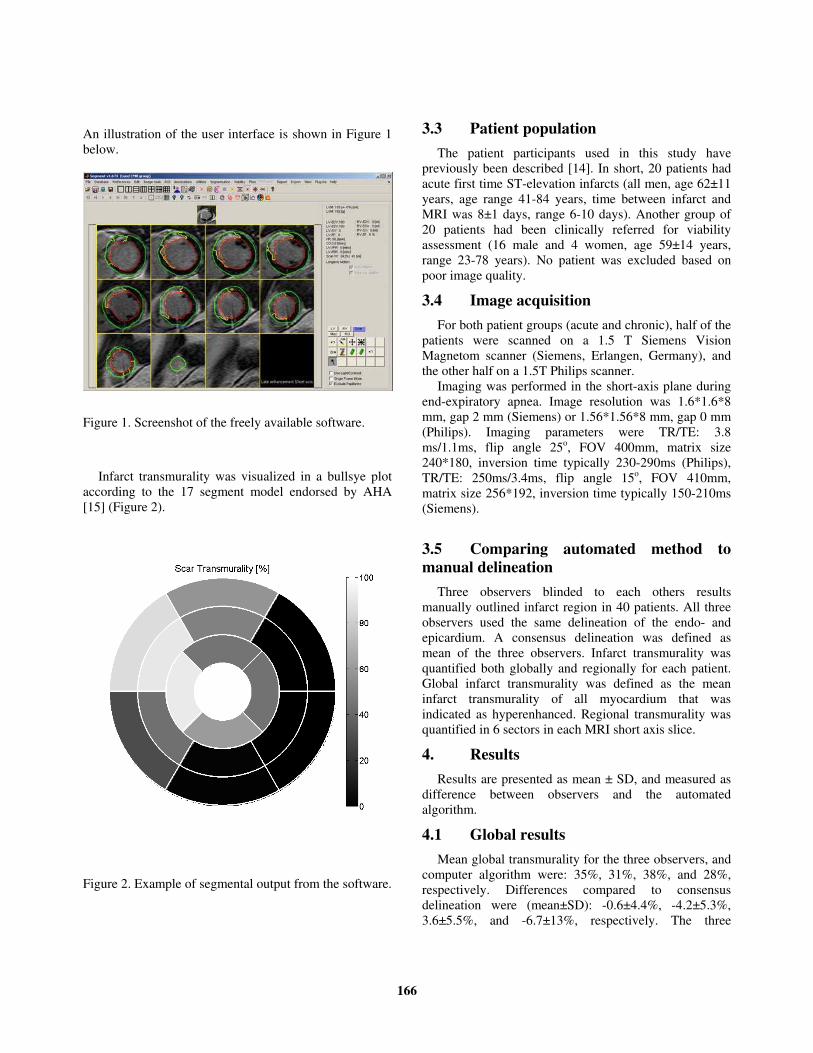
Infarct transmurality was visualized in a bullsye plot
according to the 17 segment model endorsed by AHA
[15] (Figure 2).
Figure 2. Example of segmental output from the software.
3.3 Patient population
The patient participants used in this study have
previously been described [14]. In short, 20 patients had
acute first time ST-elevation infarcts (all men, age 62±11
years, age range 41-84 years, time between infarct and
MRI was 8±1 days, range 6-10 days). Another group of
20 patients had been clinically referred for viability
assessment (16 male and 4 women, age 59±14 years,
range 23-78 years). No patient was excluded based on
poor image quality.
3.4 Image acquisition
For both patient groups (acute and chronic), half of the
patients were scanned on a 1.5 T Siemens Vision
Magnetom scanner (Siemens, Erlangen, Germany), and
the other half on a 1.5T Philips scanner.
Imaging was performed in the short-axis plane during
end-expiratory apnea. Image resolution was 1.6*1.6*8
mm, gap 2 mm (Siemens) or 1.56*1.56*8 mm, gap 0 mm
(Philips). Imaging parameters were TR/TE: 3.8
ms/1.1ms, flip angle 25o, FOV 400mm, matrix size
240*180, inversion time typically 230-290ms (Philips),
TR/TE: 250ms/3.4ms, flip angle 15o, FOV 410mm,
matrix size 256*192, inversion time typically 150-210ms
(Siemens).
3.5 Comparing automated method to
manual delineation
Three observers blinded to each others results
manually outlined infarct region in 40 patients. All three
observers used the same delineation of the endo- and
epicardium. A consensus delineation was defined as
mean of the three observers. Infarct transmurality was
quantified both globally and regionally for each patient.
Global infarct transmurality was defined as the mean
infarct transmurality of all myocardium that was
indicated as hyperenhanced. Regional transmurality was
quantified in 6 sectors in each MRI short axis slice.
4. Results
Results are presented as mean ± SD, and measured as
difference between observers and the automated
algorithm.
4.1 Global results
Mean global transmurality for the three observers, and
computer algorithm were: 35%, 31%, 38%, and 28%,
respectively. Differences compared to consensus
delineation were (mean±SD): -0.6±4.4%, -4.2±5.3%,
3.6±5.5%, and -6.7±13%, respectively. The three
166
observers were not statistically different from each other
(one-way ANOVA, p=0.18). Transmurality as calculated
by the computer algorithm were significantly smaller
than the consensus delineation (p<0.05).
4.2 Regional results
For the three observers, and the computer algorithm
the mean transmurality in infarcted sectors were: 44%,
31%, 49%, and 30%, respectively. Number of infarcted
sectors were: 962, 1324, 789, and 1449. The differences
compared to consensus delineation were for the three
observers 6.7%, 2%, and -9%. The difference compared
to consensus delineation for the computer algorithm was
3.2%. The variabilities of the three observers compared to
consensus delineation were 17%, 15%, and 20%,
respectively. The variability of the computer algorithm
compared to consensus delineation was 16%.
The three observers differed significantly from each
other (one-way ANOVA, p<0.01). The computer
algorithm was significantly different from consensus
(p<0.01).
4. Discussion and conclusions
Quantification of infarct transmurality is difficult since
the left ventricular wall is relatively thin compared to the
pixel resolution. As an example, in a normal ventricle the
wall is about 12 mm thick, given a pixel resolution of 1.5
mm one single pixel difference will give a difference in
transmurality of 13%. Therefore using a weighted
approach to calculate transmurality has the potential to
reduce the variability since it works on a sub-pixel level.
On a global level the automated algorithm showed lower
infarct transmurality compared to manual delineation. On
the regional scale the variability is substantial between
the three observers, indicating that regional assessment of
infarct transmurality is difficult unless the sectors are
sufficiently large to average out the some of the
variability.
Weighted calculation of infarct size shows smaller
variability compared to dichotomous approaches [9].
Further studies are merited in order to determine if this
also applies for weighted calculation of transmurality as
proposed in this study.
In conclusion, weighted calculation of transmurality
gave smaller global transmurality compared to consensus
delineation, but did had the same variability on a regional
basis as manual delineation.
Acknowledgements
The authors would like to express their appreciation to
Dr. Jan Engvall, Linköping University hospital for being
one of the three observers.
This work was supported in part by the Swedish
Research Council, the Swedish Heart and Lung
Foundation, the Faculty of Medicine at Lund University,
and the Region of Scania.
Address for correspondence
Einar Heiberg
Department of Clinical Physiology
Lund University Hospital
221 85 Lund, Sweden
References
[1] Kim RJ, Wu E, Rafael A, Chen EL, Parker MA, Simonetti
O, et al. The use of contrast-enhanced magnetic resonance
imaging to identify reversible myocardial dysfunction. N
Engl J Med. 2000 Nov 16;343(20):1445-53.
[2] Setser RM, Bexell DG, O'Donnell TP, Stillman AE, Lieber
ML, Schoenhagen P, et al. Quantitative assessment of
myocardial scar in delayed enhancement magnetic
resonance imaging. J Magn Reson Imaging. 2003
Oct;18(4):434-41.
[3] Amado LC, Gerber BL, Gupta SN, Rettmann DW, Szarf
G, Schock R, et al. Accurate and objective infarct sizing by
contrast-enhanced magnetic resonance imaging in a canine
myocardial infarction model. J Am Coll Cardiol. 2004 Dec
21;44(12):2383-9.
[4] Positano V, Pingitore A, Giorgetti A, Favilli B, Santarelli
MF, Landini L, et al. A fast and effective method to assess
myocardial necrosis by means of contrast magnetic
resonance imaging. J Cardiovasc Magn Reson.
2005;7(2):487-94.
[5] Schuijf JD, Kaandorp TA, Lamb HJ, van der Geest RJ,
Viergever EP, van der Wall EE, et al. Quantification of
myocardial infarct size and transmurality by contrast-
enhanced magnetic resonance imaging in men. Am J
Cardiol. 2004 Aug 1;94(3):284-8.
[6] Bondarenko O, Beek AM, Hofman MB, Kuhl HP, Twisk
JW, van Dockum WG, et al. Standardizing the definition
of hyperenhancement in the quantitative assessment of
infarct size and myocardial viability using delayed
contrast-enhanced CMR. J Cardiovasc Magn Reson.
2005;7(2):481-5.
[7] Heiberg E, Engblom H, Engvall J, Hedström E, Ugander
M, Arheden H. Automated quantification of delayed
contrast-enhanced MR images. SCMR; 2006; Miami;
2006.
167
[8] Hsu LY, Natanzon A, Kellman P, Hirsch GA, Aletras AH,
Arai AE. Quantitative myocardial infarction on delayed
enhancement MRI. Part I: Animal validation of an
automated feature analysis and combined thresholding
infarct sizing algorithm. J Magn Reson Imaging. 2006
Mar;23(3):298-308.
[9] Heiberg E, Ugander M, Engblom H, Götberg M,
Olivecrona G, Erlinge D, et al. Accurate and automated
quantification of myocardial infarction from delayed
enhancement MRI by accounting for partial volume
effects. Radiology. In press.
[10] Goldman MR, Brady TJ, Pykett IL, Burt CT, Buonanno
FS, Kistler JP, et al. Quantification of experimental
myocardial infarction using nuclear magnetic resonance
imaging and paramagnetic ion contrast enhancement in
excised canine hearts. Circulation. 1982 Nov;66(5):1012-6.
[11] Kim RJ, Fieno DS, Parrish TB, Harris K, Chen EL,
Simonetti O, et al. Relationship of MRI delayed contrast
enhancement to irreversible injury, infarct age, and
contractile function. Circulation. 1999 Nov
9;100(19):1992-2002.
[12] Judd RM, Lugo-Olivieri CH, Arai M, Kondo T, Croisille
P, Lima JA, et al. Physiological basis of myocardial
contrast enhancement in fast magnetic resonance images of
2-day-old reperfused canine infarcts. Circulation. 1995 Oct
1;92(7):1902-10.
[13] Heiberg E, Wigström L, Carlsson M, Bolger AF, Karlsson
M. Time Resolved Three-dimensional Automated
Segmentation of the Left Ventricle. IEEE Computers in
Cardiology 2005; 2005; Lyon, France: IEEE; 2005. p. 599-
602.
[14] Heiberg E, Engblom H, Engvall J, Hedstrom E, Ugander
M, Arheden H. Semi-automatic quantification of
myocardial infarction from delayed contrast enhanced
magnetic resonance imaging. Scand Cardiovasc J. 2005
Oct;39(5):267-75.
[15] Cerqueira MD, Weissman NJ, Dilsizian V, Jacobs AK,
Kaul S, Laskey WK, et al. Standardized myocardial
segmentation and nomenclature for tomographic imaging
of the heart: a statement for healthcare professionals from
the Cardiac Imaging Committee of the Council on Clinical
Cardiology of the American Heart Association.
Circulation. 2002 Jan 29;105(4):539-42.
168
Related Documents