Vol.:(0123456789) Discover Materials (2021) 1:16 | https://doi.org/10.1007/s43939-021-00015-x 1 3 Discover Materials Research Autofluorescence of stingray skeletal cartilage: hyperspectral imaging as a tool for histological characterization Júlia Chaumel 1 · María Marsal 2 · Adrián Gómez‑Sánchez 3 · Michael Blumer 4 · Emilio J. Gualda 2 · Anna de Juan 3 · Pablo Loza‑Alvarez 2 · Mason N. Dean 5 Received: 26 August 2020 / Accepted: 8 July 2021 © The Author(s) 2021 OPEN Abstract Tessellated cartilage is a distinctive composite tissue forming the bulk of the skeleton of cartilaginous fishes (e.g. sharks and rays), built from unmineralized cartilage covered at the surface by a thin layer of mineralized tiles called tesserae. The finescale structure and composition of elasmobranch tessellated cartilage has largely been investigated with electron microscopy, micro-computed tomography and histology, but many aspects of tissue structure and composition remain uncharacterized. In our study, we demonstrate that the tessellated cartilage of a stingray exhibits a strong and diverse autofluorescence, a native property of the tissue which can be harnessed as an effective label-free imaging technique. The autofluorescence signal was excited using a broad range of wavelengths in confocal and light sheet microscopy, comparing several sample preparations (fresh; demineralized and paraffin-embedded; non-demineralized and plastic- embedded) and imaging the tissue at different scales. Autofluorescence varied with sample preparation with the signal in both plastic- and paraffin-embedded samples strong enough to allow visualization of finescale (≥ 1 μm) cellular and matrix structures, such as cell nuclei and current and former mineralization fronts, identifiable by globular mineralized tissue. A defined pericellular matrix (PCM) surrounding chondrocytes was also discernible, described here for the first time in elasmobranchs. The presence of a PCM suggests similarities with mammalian cartilage regarding how chondro- cytes interact with their environment, the PCM in mammals acting as a transducer for biomechanical and biochemical signals. A posterior analysis of hyperspectral images by an MCR-ALS unmixing algorithm allowed identification of several distinct fluorescence signatures associated to specific regions in the tissue. Some fluorescence signatures identified could be correlated with collagen type II, the most abundant structural molecule of cartilage. Other fluorescence signatures, however, remained unidentified, spotlighting tissue regions that deserve deeper characterization and suggesting the presence of molecules still unidentified in elasmobranch skeletal cartilage. Our results show that autofluorescence can be a powerful exploratory imaging tool for characterizing less-studied skeletal tissues, such as tessellated cartilage. The images obtained are largely comparable with more commonly used techniques, but without the need for complicated sample preparations or external staining reagents standard in histology and electron microscopy (TEM, SEM). María Marsal and Adrián Gómez-Sánchez contributed equally to this work Supplementary Information The online version contains supplementary material available at https://doi.org/10.1007/s43939-021- 00015-x. * Júlia Chaumel, [email protected] | 1 Department of Biomaterials, Max Planck Institute of Colloids and Interfaces, Am Mühlenberg, 14476 Potsdam, Germany. 2 ICFO - Institute of Photonic Sciences, The Barcelona Institute of Science and Technology, Castelldefels, Spain. 3 Department of Chemical Engineering and Analytical Chemistry, University of Barcelona, Barcelona, Spain. 4 Division of Clinical and Functional Anatomy, Medical University of Innsbruck, Innsbruck, Austria. 5 Department of Infectious Diseases & Public Health, City University of Hong Kong, 5/F, Block 1, To Yuen Building 31, To Yuen Street, Tat Chee Avenue, Kowloon, Hong Kong.

Welcome message from author
This document is posted to help you gain knowledge. Please leave a comment to let me know what you think about it! Share it to your friends and learn new things together.
Transcript
Vol.:(0123456789)
Discover Materials (2021) 1:16 | https://doi.org/10.1007/s43939-021-00015-x
1 3
Discover Materials
Research
Autofluorescence of stingray skeletal cartilage: hyperspectral imaging as a tool for histological characterization
Júlia Chaumel1 · María Marsal2 · Adrián Gómez‑Sánchez3 · Michael Blumer4 · Emilio J. Gualda2 · Anna de Juan3 · Pablo Loza‑Alvarez2 · Mason N. Dean5
Received: 26 August 2020 / Accepted: 8 July 2021
© The Author(s) 2021 OPEN
AbstractTessellated cartilage is a distinctive composite tissue forming the bulk of the skeleton of cartilaginous fishes (e.g. sharks and rays), built from unmineralized cartilage covered at the surface by a thin layer of mineralized tiles called tesserae. The finescale structure and composition of elasmobranch tessellated cartilage has largely been investigated with electron microscopy, micro-computed tomography and histology, but many aspects of tissue structure and composition remain uncharacterized. In our study, we demonstrate that the tessellated cartilage of a stingray exhibits a strong and diverse autofluorescence, a native property of the tissue which can be harnessed as an effective label-free imaging technique. The autofluorescence signal was excited using a broad range of wavelengths in confocal and light sheet microscopy, comparing several sample preparations (fresh; demineralized and paraffin-embedded; non-demineralized and plastic-embedded) and imaging the tissue at different scales. Autofluorescence varied with sample preparation with the signal in both plastic- and paraffin-embedded samples strong enough to allow visualization of finescale (≥ 1 μm) cellular and matrix structures, such as cell nuclei and current and former mineralization fronts, identifiable by globular mineralized tissue. A defined pericellular matrix (PCM) surrounding chondrocytes was also discernible, described here for the first time in elasmobranchs. The presence of a PCM suggests similarities with mammalian cartilage regarding how chondro-cytes interact with their environment, the PCM in mammals acting as a transducer for biomechanical and biochemical signals. A posterior analysis of hyperspectral images by an MCR-ALS unmixing algorithm allowed identification of several distinct fluorescence signatures associated to specific regions in the tissue. Some fluorescence signatures identified could be correlated with collagen type II, the most abundant structural molecule of cartilage. Other fluorescence signatures, however, remained unidentified, spotlighting tissue regions that deserve deeper characterization and suggesting the presence of molecules still unidentified in elasmobranch skeletal cartilage. Our results show that autofluorescence can be a powerful exploratory imaging tool for characterizing less-studied skeletal tissues, such as tessellated cartilage. The images obtained are largely comparable with more commonly used techniques, but without the need for complicated sample preparations or external staining reagents standard in histology and electron microscopy (TEM, SEM).
María Marsal and Adrián Gómez-Sánchez contributed equally to this work
Supplementary Information The online version contains supplementary material available at https:// doi. org/ 10. 1007/ s43939- 021- 00015-x.
* Júlia Chaumel, [email protected] | 1Department of Biomaterials, Max Planck Institute of Colloids and Interfaces, Am Mühlenberg, 14476 Potsdam, Germany. 2ICFO - Institute of Photonic Sciences, The Barcelona Institute of Science and Technology, Castelldefels, Spain. 3Department of Chemical Engineering and Analytical Chemistry, University of Barcelona, Barcelona, Spain. 4Division of Clinical and Functional Anatomy, Medical University of Innsbruck, Innsbruck, Austria. 5Department of Infectious Diseases & Public Health, City University of Hong Kong, 5/F, Block 1, To Yuen Building 31, To Yuen Street, Tat Chee Avenue, Kowloon, Hong Kong.
Vol:.(1234567890)
Research Discover Materials (2021) 1:16 | https://doi.org/10.1007/s43939-021-00015-x
1 3
Keywords Tessellated cartilage · Autofluorescence · Hyperspectral imaging · Confocal microscopy · Light sheet fluorescence microscopy
AbbreviationsAF AutofluorescencePCM Pericellular matrixECM Extracellular matrixUC Unmineralized cartilageMCR-ALS Multivariate Curve Resolution Alternating Least SquaresEEM Excitation–EmissionWLL White Light LaserBSEM Backscatter electron microscopyEDTA Ethylenediaminetetraacetic acidPFA ParaformaldehydePMMA Polymethyl methacrylate
1 Introduction
Cartilage is a viscoelastic and resilient connective tissue essential to the mechanics and growth of the skeleton of verte-brates. Its gel-like extracellular matrix is composed of water and contains embedded cells (chondrocytes) interspersed within a network of mainly collagen type II fibers and proteoglycans [1, 2]. Variation in the organization, proportion, and composition of extracellular matrix components is reflected in the structural morphology of the tissue, affecting its mechanical properties and its physiological functions [3, 4]. Examinations of cartilage tissue morphology, therefore, have provided great insights into the biomechanics, function and growth of cartilage. Most of this research has focused on mammals, where cartilage (as in most vertebrates) forms the greater part of the embryonic skeleton, providing a tissue scaffold that guides the growth of and eventually gives way to bone [1]. Cartilage is far less predominant in the adult skeleton of most vertebrates, but still performs diverse roles including load-bearing (intervertebral fibrocartilage); shaping of resilient structures like noses, ears and ribs (elastic cartilage); and reduction of frictional forces between bones (articular hyaline cartilage).
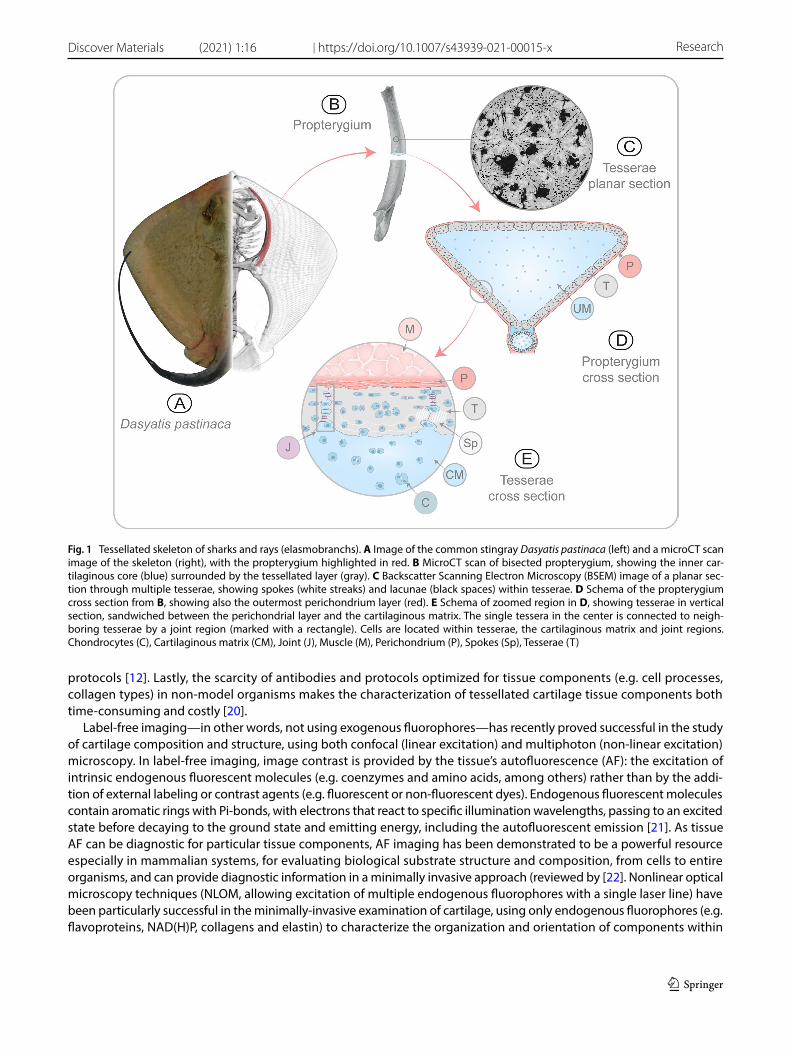
Cartilage is, also, far more diverse and ancient than typically appreciated. It is present even in invertebrate taxa [5, 6] and forms an extremely large proportion of the adult skeleton of several fish groups, particularly the clade of sharks and rays (elasmobranch fishes) [7] (Fig. 1). The tissue composition and the cell type of elasmobranch cartilage appear to be similar to the hyaline cartilage in mammalian joints [8–11 and references therein]. However, elasmobranch cartilage performs many functions more akin to those of bone than mammalian hyaline cartilage: providing skeletal shape, body support, and locations for muscle attachment. This multi-functionality is believed to be due to a unique structural fea-ture of elasmobranch cartilage, wherein the skeleton mineralizes only at the surface, forming an ensheathing layer of mineralized tiles called tesserae (Fig. 1B–E).
The mechanical performance of tessellated cartilage is thought to be related largely to the structure and arrangement of its different tissue components, in particular the associations of soft (unmineralized) and hard (mineralized) materials [12–15]. However, the difficulties associated with characterizing the complex structural arrangements of these hetero-geneous tissues has limited the definition of clear composition-form-function rules for tessellates cartilage. In particular, the close association of mineralized and unmineralized tissues, in complex structural arrangements at both large and fine scales, has challenged common visualization techniques, such as conventional microscopy, immuno-histological stainings and electron microscopy [8, 16]. For example, the mineralized matrix of tesserae is perforated by numerous small cavities called lacunae, containing living chondrocytes surrounded by a thin layer of unmineralized matrix, with adjacent lacunae linked by short, matrix-filled passages [17, 18] (Fig. 1C–E). This arrangement results in several tissue type transitions over small spatial scales (1–10 µm), also challenging proper fixation and sectioning of these regions. The lateral margins of tesserae also present a heterogeneous mixture of tissues, associated with the joint region between neighbouring tesserae, which comprises a complex combination of unmineralized matrix, fibers and cells [8] (Fig. 1E). Additionally, the high water content of the unmineralized cartilage, contrasted with the extremely low water content (high mineral content) of some regions in tesserae (e.g. the hypermineralized ‘spokes’ reinforcing contact zones, Fig. 1C, E; [19]) makes tessellated cartilage prone to differential swelling and cracking during standard fixation and dehydration
Vol.:(0123456789)
Discover Materials (2021) 1:16 | https://doi.org/10.1007/s43939-021-00015-x Research
1 3
protocols [12]. Lastly, the scarcity of antibodies and protocols optimized for tissue components (e.g. cell processes, collagen types) in non-model organisms makes the characterization of tessellated cartilage tissue components both time-consuming and costly [20].
Label-free imaging—in other words, not using exogenous fluorophores—has recently proved successful in the study of cartilage composition and structure, using both confocal (linear excitation) and multiphoton (non-linear excitation) microscopy. In label-free imaging, image contrast is provided by the tissue’s autofluorescence (AF): the excitation of intrinsic endogenous fluorescent molecules (e.g. coenzymes and amino acids, among others) rather than by the addi-tion of external labeling or contrast agents (e.g. fluorescent or non-fluorescent dyes). Endogenous fluorescent molecules contain aromatic rings with Pi-bonds, with electrons that react to specific illumination wavelengths, passing to an excited state before decaying to the ground state and emitting energy, including the autofluorescent emission [21]. As tissue AF can be diagnostic for particular tissue components, AF imaging has been demonstrated to be a powerful resource especially in mammalian systems, for evaluating biological substrate structure and composition, from cells to entire organisms, and can provide diagnostic information in a minimally invasive approach (reviewed by [22]. Nonlinear optical microscopy techniques (NLOM, allowing excitation of multiple endogenous fluorophores with a single laser line) have been particularly successful in the minimally-invasive examination of cartilage, using only endogenous fluorophores (e.g. flavoproteins, NAD(H)P, collagens and elastin) to characterize the organization and orientation of components within
Fig. 1 Tessellated skeleton of sharks and rays (elasmobranchs). A Image of the common stingray Dasyatis pastinaca (left) and a microCT scan image of the skeleton (right), with the propterygium highlighted in red. B MicroCT scan of bisected propterygium, showing the inner car-tilaginous core (blue) surrounded by the tessellated layer (gray). C Backscatter Scanning Electron Microscopy (BSEM) image of a planar sec-tion through multiple tesserae, showing spokes (white streaks) and lacunae (black spaces) within tesserae. D Schema of the propterygium cross section from B, showing also the outermost perichondrium layer (red). E Schema of zoomed region in D, showing tesserae in vertical section, sandwiched between the perichondrial layer and the cartilaginous matrix. The single tessera in the center is connected to neigh-boring tesserae by a joint region (marked with a rectangle). Cells are located within tesserae, the cartilaginous matrix and joint regions. Chondrocytes (C), Cartilaginous matrix (CM), Joint (J), Muscle (M), Perichondrium (P), Spokes (Sp), Tesserae (T)

Vol:.(1234567890)
Research Discover Materials (2021) 1:16 | https://doi.org/10.1007/s43939-021-00015-x
1 3
the tissue [23, 24]. By comparison, linear excitation techniques have been less used to study cartilage, although they offer broader excitation and emission spectra than NLOM.
In this study, we explore the efficacy of linear, one-photon excitation methods in the imaging of tessellated cartilage, examining also whether these effects are altered by standard sample preparation techniques. AF imaging techniques have never been applied as a tool to study this tissue, however there is some evidence that particular regions of tesserae exhibit a characteristic AF [11]. Previous studies have shown that tesserae have distinct and consistent structural fea-tures and, thus, can be considered as a useful and repeatable unit of study, particularly since every skeletal cross-section contains multiple sectioned tesserae for examination [18, 25]. Additionally, since tesserae have been shown to grow by accreting mineralized material on all their edges and do not appear to remodel their tissue at all, every tessera contains a permanent structural record of its growth [25–27]. Here, using common imaging techniques (e.g. histology, electron microscopy and microCT) and recent ultrastructural characterizations of tesserae as reference, we demonstrate that specific tissue components have consistent and characteristic AF signals, using confocal laser scanning microscopy of thin sections and light sheet microscopy of larger sample blocks to provide a more macroscopic perspective. In the pro-cess, we explore the potential of AF imaging for ultrastructural examination of elasmobranch skeletal tissue, especially to clarify aspects of fibrous tissue architecture.
2 Methods/Experimental
2.1 Specimens and sample preparation
Skeletal samples were collected in May 2019 from two common stingrays (Dasyatis pastinaca: Dasyatidae, Batoidea), a male of 21.3 cm disc width (DW) and a female of 32.7 cm DW. Specimens were by-catch captures from trammel net fish-ery in Alicante and Valencia (Valencian Community, Spain), respectively. Samples were harvested from both specimens less than 1 h after death.
We compared tissue autofluorescence (see below) for three sample preparation types that have been used previously in the study of tessellated cartilage (Fig. 2A): (1) “thawed samples”: non-fixed, non-demineralized and non-embedded; (2) “paraffin samples”: fixed, demineralized and paraffin-embedded; and (3) “PMMA samples”: fixed, non-demineralized and embedded in plastic (PMMA). For the thawed samples, the whole head of the second specimen was frozen and sent to the Institute of Photonic Sciences’ facilities (Castelldefels, Spain), where all imaging was performed. Immediately prior to imaging, the head was partially thawed in cool water and a scalpel was used to remove thin slices (~ 0.5–1.0 mm) of the propterygium (largest skeletal piece supporting the wing). Slices were mounted for confocal imaging on a glass bottom MatTek dish in solidified 1%, low-melting agarose, to maintain position and reduce dehydration.
Samples for paraffin and PMMA were obtained from the first animal specimen. The propterygium was cut in small pieces and fixed with 4% PFA in PBS 0.1 M at the harbor and within 20 min of the animal’s death to avoid tissue degrada-tion. Samples were kept in the fixative at 4 °C overnight and stored in PBS 0.1 M at 4 °C before processing for paraffin embedding, PMMA embedding or clearing for SPIM imaging (see next section).
For paraffin embedding, fixed samples were rinsed in PBS, decalcified with ethylenediaminetetraacetic acid (EDTA) at 20 wt-% concentration with pH 7.4 for one week, dehydrated with a graded isopropanol and xylene series, and embed-ded in paraffin using a routine histological infiltration processor (Miles Scientific Inc., Naperville, IL, USA). Serial vertical sections of 15 µm were made on a HM 355 S microtome (Microm, Walldorf, Germany), and mounted on SuperFrost®Plus slides.
For PMMA (Polymethylmethacrylate) embedding, fixed samples were dehydrated through increasing ethanol concen-tration (70%, 80%, 96%, 100%), then maintained in xylol for 3 h, and finally embedded in PMMA (Morphisto Technovit® 9100) using the reagents and protocol provided by the manufacturer. All embedding steps were performed at 4 °C. Once the embedding media was polymerized, samples were microtomed in 10 µm slices, deplastified using 2-methoxyethyl acetate, and mounted on DakoFlex® slides.
To compare AF images with those obtained using more traditional methods and to facilitate location of structures of interest, tessellated cartilage samples were also examined using histology and backscatter electron microscopy (BSEM). The sample preparation protocols for each technique can be found in section 1 of Supplementary Materials.
Vol.:(0123456789)
Discover Materials (2021) 1:16 | https://doi.org/10.1007/s43939-021-00015-x Research
1 3
2.2 Confocal imaging of thawed, paraffin and PMMA samples
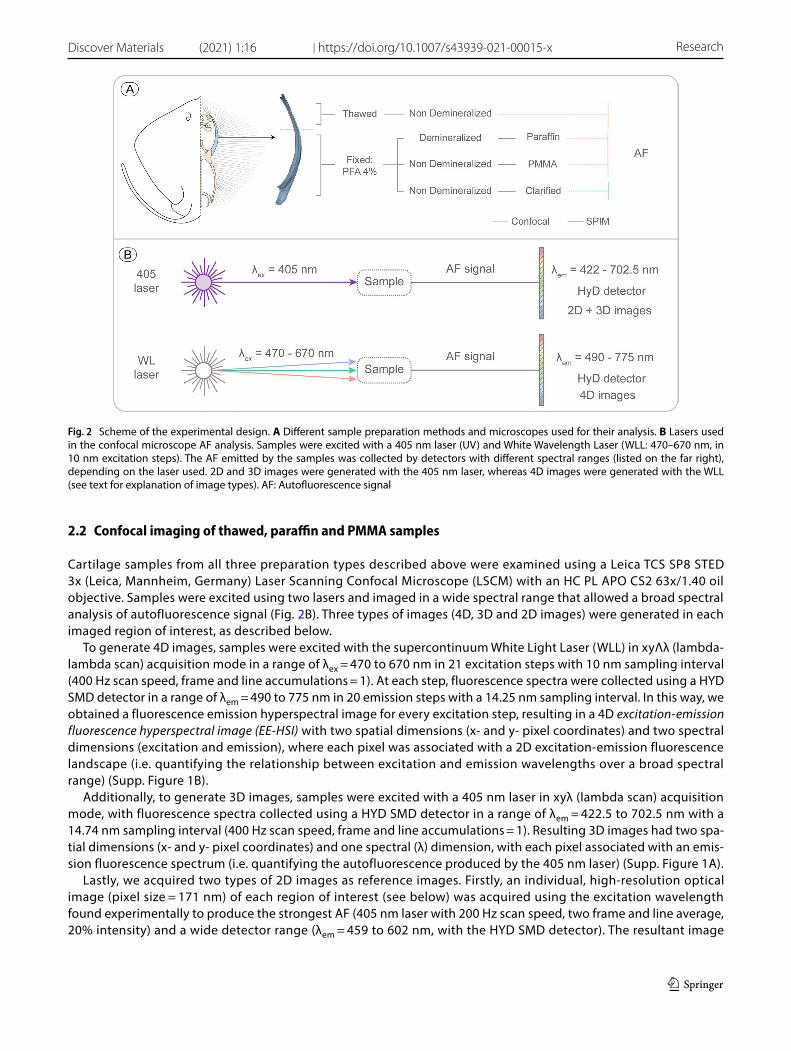
Cartilage samples from all three preparation types described above were examined using a Leica TCS SP8 STED 3x (Leica, Mannheim, Germany) Laser Scanning Confocal Microscope (LSCM) with an HC PL APO CS2 63x/1.40 oil objective. Samples were excited using two lasers and imaged in a wide spectral range that allowed a broad spectral analysis of autofluorescence signal (Fig. 2B). Three types of images (4D, 3D and 2D images) were generated in each imaged region of interest, as described below.
To generate 4D images, samples were excited with the supercontinuum White Light Laser (WLL) in xyΛλ (lambda-lambda scan) acquisition mode in a range of λex = 470 to 670 nm in 21 excitation steps with 10 nm sampling interval (400 Hz scan speed, frame and line accumulations = 1). At each step, fluorescence spectra were collected using a HYD SMD detector in a range of λem = 490 to 775 nm in 20 emission steps with a 14.25 nm sampling interval. In this way, we obtained a fluorescence emission hyperspectral image for every excitation step, resulting in a 4D excitation-emission fluorescence hyperspectral image (EE-HSI) with two spatial dimensions (x- and y- pixel coordinates) and two spectral dimensions (excitation and emission), where each pixel was associated with a 2D excitation-emission fluorescence landscape (i.e. quantifying the relationship between excitation and emission wavelengths over a broad spectral range) (Supp. Figure 1B).
Additionally, to generate 3D images, samples were excited with a 405 nm laser in xyλ (lambda scan) acquisition mode, with fluorescence spectra collected using a HYD SMD detector in a range of λem = 422.5 to 702.5 nm with a 14.74 nm sampling interval (400 Hz scan speed, frame and line accumulations = 1). Resulting 3D images had two spa-tial dimensions (x- and y- pixel coordinates) and one spectral (λ) dimension, with each pixel associated with an emis-sion fluorescence spectrum (i.e. quantifying the autofluorescence produced by the 405 nm laser) (Supp. Figure 1A).
Lastly, we acquired two types of 2D images as reference images. Firstly, an individual, high-resolution optical image (pixel size = 171 nm) of each region of interest (see below) was acquired using the excitation wavelength found experimentally to produce the strongest AF (405 nm laser with 200 Hz scan speed, two frame and line average, 20% intensity) and a wide detector range (λem = 459 to 602 nm, with the HYD SMD detector). The resultant image
Fig. 2 Scheme of the experimental design. A Different sample preparation methods and microscopes used for their analysis. B Lasers used in the confocal microscope AF analysis. Samples were excited with a 405 nm laser (UV) and White Wavelength Laser (WLL: 470–670 nm, in 10 nm excitation steps). The AF emitted by the samples was collected by detectors with different spectral ranges (listed on the far right), depending on the laser used. 2D and 3D images were generated with the 405 nm laser, whereas 4D images were generated with the WLL (see text for explanation of image types). AF: Autofluorescence signal
Vol:.(1234567890)
Research Discover Materials (2021) 1:16 | https://doi.org/10.1007/s43939-021-00015-x
1 3
was two-dimensional, with x- and y-pixel coordinates and an integrated global AF value assigned to each pixel. In order to prevent loss of signal by bleaching and longer dwell-times, analyses were always performed in the following order: WLL lambda-lambda scan, followed by the 405 nm lambda scan, and then 405 nm high-resolution images. Additionally, 2D transmitted light images were acquired simultaneously with the confocal images using the same illumination beam, to ensure that images were in registration.
2D, 3D and 4D images were acquired in three specific regions of interest (ROIs): the tesserae, the joints, and the unmineralized cartilage. Additional 2D, 3D and 4D images were made of the embedding media (paraffin, PMMA) without samples, to determine if these media contributed any AF. We replicated the analyses of each ROI type three times for each sample preparation type (i.e. for PMMA, paraffin and thawed samples, scanning three different tesserae, joints, and unmineralized cartilage regions each).
It was challenging in all sample preparations to find a flat region of interest for high magnification imaging (63), espe-cially at the interface between tesserae and unmineralized cartilage. Unembedded thawed samples were particularly difficult to prepare and image. As this tissue was not embedded, non-uniform sections were cut manually by razor blade and therefore were not uniform. Also, evaporation of water from the tissue (e.g. the unmineralized cartilage, which has a high water content) caused large shifts in the position and morphology of the tissue, making imaging almost impossible at high magnification. Thus, the images of thawed tissue were only taken at magnification of 10x, with the exception of one tessera sectioned flat enough to be imaged at 63x.
2.3 Analysis of hyperspectral images. Underlying image analysis model and unmixing procedure
Unlike 2D images, where features can be interpreted directly by their global fluorescence intensity, 3D and 4D images require dedicated data treatments by unmixing methods to disentangle the contributions of the distinct fluorescence signatures in a sample. Indeed, natural fluorophores can exist in different concentrations and locations within an ana-lysed tissue, which can result in spatially complex variation and/or mixing (co-localization) of fluorescence signals, often hindering the interpretation of results. The ability to unmix multivariate signals in fluorescence images is particularly important for 3D images and, most importantly, for 4D images, which have the most potential to detect and distinguish biological regions with distinct fluorescence signatures, due to the wider excitation range used and because differences in both excitation and emission characteristics are considered.
The unmixing algorithm used in this work is Multivariate Curve Resolution-Alternating Least Squares (MCR-ALS), apt for single 3D and 4D images, but also for the treatment of several related images analysed together (multiset analysis) [28, 29, 80, 81]. The results provided by MCR-ALS are distinct fluorescence signatures (emission spectra or excitation/emis-sion fluorescence landscapes for 3D and 4D images, respectively), from either an individual fluorophore (e.g. collagens, elastin, flavins) or a mixture of fluorophores found consistently together (e.g. in a particular tissue type). The resultant distribution maps produced by the MCR-ALS show the spatial distribution of the fluorescence signatures in the 3D/4D source images and therefore their associations with tissues and other biological entities [30]. In this work, all MCR-ALS analyses were performed using in-house implemented routines, programmed in the MATLAB environment (v. 2019) [31]. A detailed description of the function and output of the MCR-ALS is outlined in Section 2 of Supplementary Materials.
2.4 Light sheet microscopy of fixed samples
To examine tessellated cartilage in larger samples without the need for thin sectioning, we also employed light-sheet fluorescence microscopy (LSFM), also known as Single-Plane Illumination microscopy (SPIM) [32], using AF as a contrast mechanism. In contrast to the point-laser illumination of the confocal microscope, SPIM relies on the creation of an illumination plane, with the laser beam shaped into a rectangle and focused in a thin “sheet of light” using a cylindrical lens [32, 33]. The uniqueness of its optical configuration, with uncoupled perpendicular illumination and detection axis, combined with fast camera-based detection, allows acquisition of 3D images of samples at unprecedented speeds.
We analyzed the AF signal of D. pastinaca tessellated cartilage using a custom made SPIM microscope [34]. The custom microscope achieves magnifications between 2× and 4× (field of view 6.65 × 6.65 mm2 and 3.33 × 3.33 mm2, respec-tively), allowing the imaging of samples several millimeters thick. This can be combined with image stitching to allow volumetric imaging of samples several centimeters thick in each linear dimension. In our study, the examined samples were thick cubes of propterygium (5–6 mm thick), fixed as described in the previous section. To facilitate the imaging of larger sample blocks of tessellated cartilage, samples needed to be clarified (i.e. rendered transparent) to equalize the refractive index throughout the tissue block. No protocols exist for clarification of tessellated cartilage; we used ECi (ethyl

Vol.:(0123456789)
Discover Materials (2021) 1:16 | https://doi.org/10.1007/s43939-021-00015-x Research
1 3
cinnamate), which has proved effective for clearing hard tissues in calvaria and long bones [e.g. 35], while also being fast, affordable and non-toxic. For clearing, fixed transverse sections were dehydrated with an ethanol series (pH 9.0) 50–70–100% (2X), 12 h per step, at 4ºC. After dehydration, samples were transferred to ECi (W243000 Sigma-Aldrich) and incubated while gently shaking at room temperature until they became transparent. The excitation and emission spectra used in SPIM made it compatible with our analyses made with confocal. Samples were excited with several excitation wavelengths (λex = 405, 488 and 561 nm) and the emitted fluorescence collected with filters of 482/25, 520/50 nm and 593 long pass, respectively.
3 Results
3.1 General observations of AF signal
Using AF, it was possible to obtain high resolution optical images of different tissue features of tessellated cartilage, including both mineralized (tesserae) and unmineralized elements (perichondrium, cells, the unmineralized cartilage matrix), although the degree of detail in the images varied with sample preparation (see below). The 405 excitation laser with a broad spectrum of acquired emission wavelengths (459–602 nm) produced the clearest imaging results with the strongest signal, comparable to other techniques commonly used to image tessellated cartilage, such as histology and BSEM (Fig. 3).
3.2 Effects of sample preparation
The structures and tissues visible from their AF in tessellated cartilage differed among PMMA samples, paraffin samples, and non-embedded thawed samples (Figs. 4, 5). Examination of the AF signal of the embedding media themselves, showed negligible AF (PMMA) or none at all (paraffin), and so did not contribute to tissue AF signals. The discernibility of particular tessellated cartilage features is discussed in detail in the following section, but some general effects of sample preparation are worth noting.
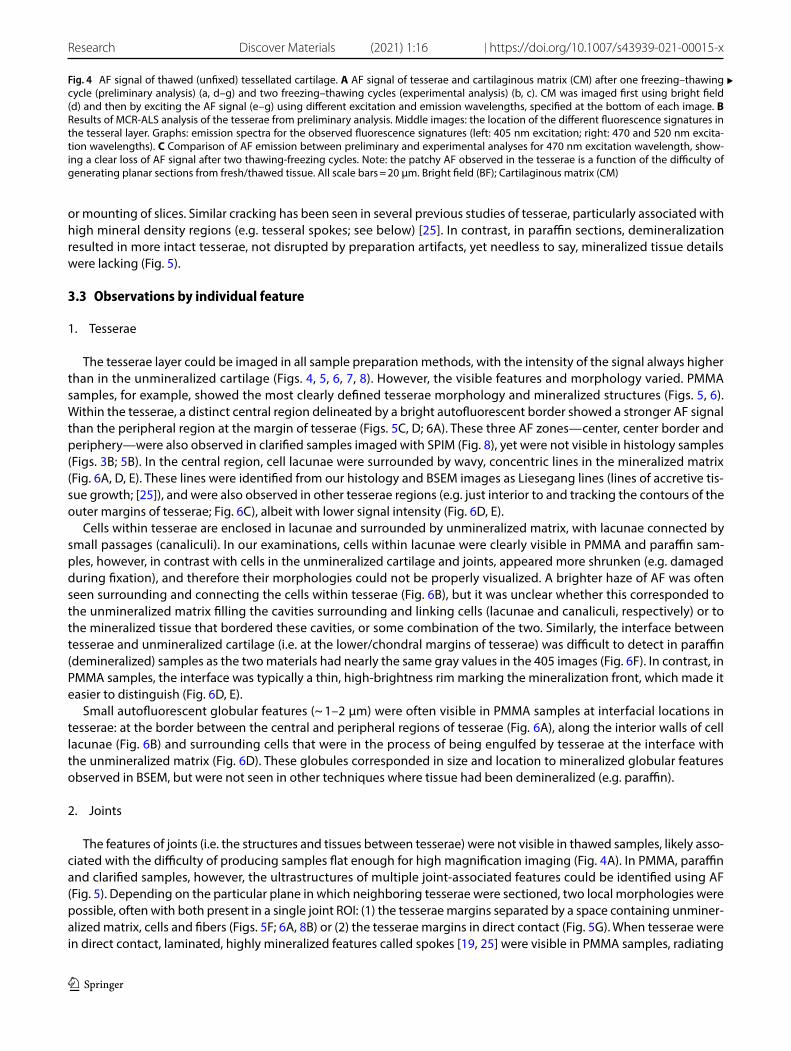
For unembedded thawed samples, the propterygium was thawed a first time to perform a preliminary test of the sectioning and imaging methods, and then a second time months later for the final experimental analysis. The prelimi-nary images showed AF signal in perichondrium, tesserae, and unmineralized cartilage (both cells and matrix) (Fig. 4Aa, [d–g], C). In contrast, in the later experimental analysis, only a weak AF signal was visible in the tesserae, being entirely lost in the soft tissues (Fig. 4A[b, c], C).
PMMA samples were non-demineralized and more cleanly sectioned than thawed samples and therefore showed both hard and soft tissues in conditions perhaps closest to their native configurations (Figs. 5, 6, 7). Tesserae in PMMA samples, however, often exhibited cracks (Figs. 5D; 6A), making it difficult to obtain large, intact regions of the tesserae layer. The cracks were produced during the preparation of the samples, probably during microtome cutting, oven-curing,
Fig. 3 Comparison of different imaging techniques for tessellated cartilage. A Image of unstained sample acquired using transmitted light (confocal microscope, 10× objective). B LM image of a demineralized sample, stained with Hematoxylin–Eosin. The zoomed circles in B and C show chondrocytes in the cartilaginous matrix. C Backscatter Scanning Electron Microscopy image showing mineral density varia-tion in mineralized regions of the tissue, but no information in non-mineralized areas. The zoomed circle shows a higher magnification of spokes laminae, highly mineralized bands located at the contact region of two tesserae. D AF image, excited with the 405 nm laser (confocal microscope, 10× objective). All images correspond in scale with A. Chondrocytes (C), Cartilaginous matrix (CM), Joint (J), Perichondrium (P), Spokes (Sp)
Vol:.(1234567890)
Research Discover Materials (2021) 1:16 | https://doi.org/10.1007/s43939-021-00015-x
1 3
or mounting of slices. Similar cracking has been seen in several previous studies of tesserae, particularly associated with high mineral density regions (e.g. tesseral spokes; see below) [25]. In contrast, in paraffin sections, demineralization resulted in more intact tesserae, not disrupted by preparation artifacts, yet needless to say, mineralized tissue details were lacking (Fig. 5).
3.3 Observations by individual feature
1. Tesserae
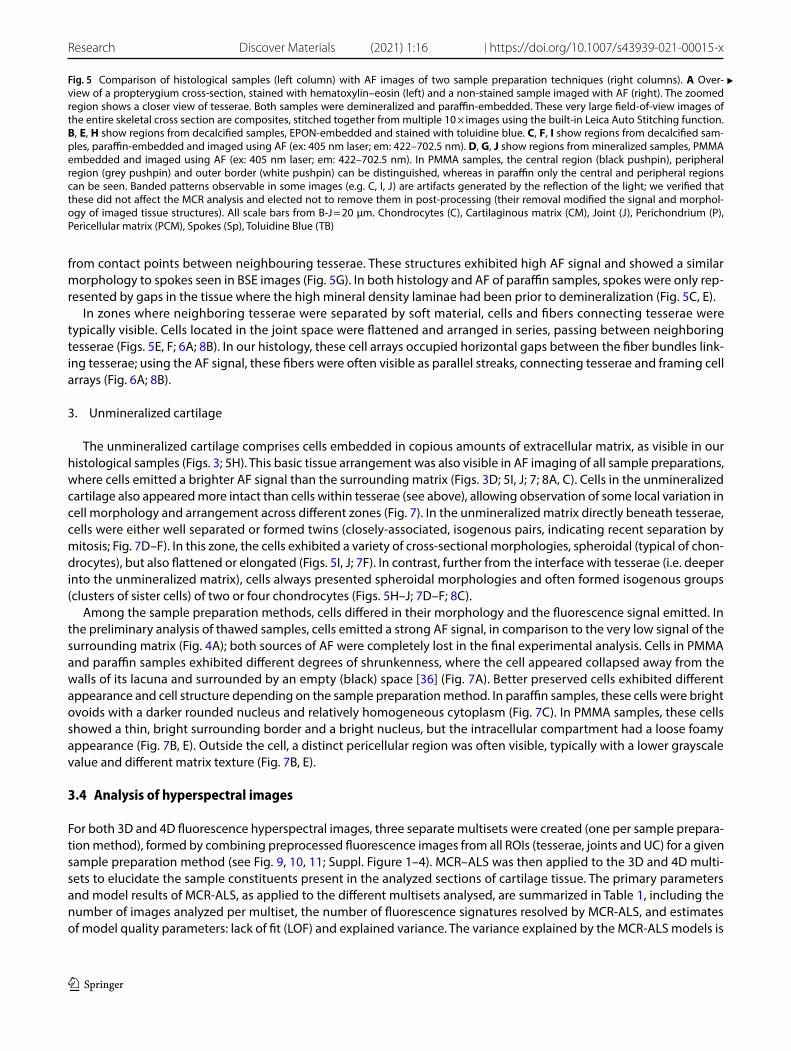
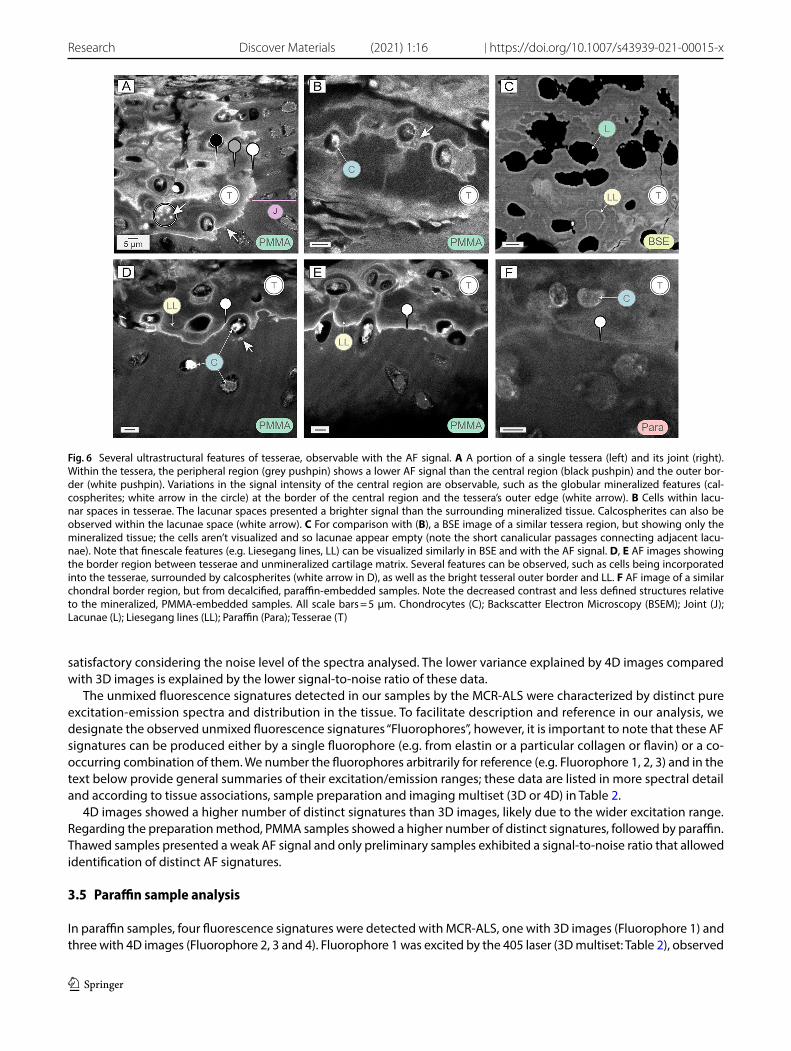
The tesserae layer could be imaged in all sample preparation methods, with the intensity of the signal always higher than in the unmineralized cartilage (Figs. 4, 5, 6, 7, 8). However, the visible features and morphology varied. PMMA samples, for example, showed the most clearly defined tesserae morphology and mineralized structures (Figs. 5, 6). Within the tesserae, a distinct central region delineated by a bright autofluorescent border showed a stronger AF signal than the peripheral region at the margin of tesserae (Figs. 5C, D; 6A). These three AF zones—center, center border and periphery—were also observed in clarified samples imaged with SPIM (Fig. 8), yet were not visible in histology samples (Figs. 3B; 5B). In the central region, cell lacunae were surrounded by wavy, concentric lines in the mineralized matrix (Fig. 6A, D, E). These lines were identified from our histology and BSEM images as Liesegang lines (lines of accretive tis-sue growth; [25]), and were also observed in other tesserae regions (e.g. just interior to and tracking the contours of the outer margins of tesserae; Fig. 6C), albeit with lower signal intensity (Fig. 6D, E).
Cells within tesserae are enclosed in lacunae and surrounded by unmineralized matrix, with lacunae connected by small passages (canaliculi). In our examinations, cells within lacunae were clearly visible in PMMA and paraffin sam-ples, however, in contrast with cells in the unmineralized cartilage and joints, appeared more shrunken (e.g. damaged during fixation), and therefore their morphologies could not be properly visualized. A brighter haze of AF was often seen surrounding and connecting the cells within tesserae (Fig. 6B), but it was unclear whether this corresponded to the unmineralized matrix filling the cavities surrounding and linking cells (lacunae and canaliculi, respectively) or to the mineralized tissue that bordered these cavities, or some combination of the two. Similarly, the interface between tesserae and unmineralized cartilage (i.e. at the lower/chondral margins of tesserae) was difficult to detect in paraffin (demineralized) samples as the two materials had nearly the same gray values in the 405 images (Fig. 6F). In contrast, in PMMA samples, the interface was typically a thin, high-brightness rim marking the mineralization front, which made it easier to distinguish (Fig. 6D, E).
Small autofluorescent globular features (~ 1–2 µm) were often visible in PMMA samples at interfacial locations in tesserae: at the border between the central and peripheral regions of tesserae (Fig. 6A), along the interior walls of cell lacunae (Fig. 6B) and surrounding cells that were in the process of being engulfed by tesserae at the interface with the unmineralized matrix (Fig. 6D). These globules corresponded in size and location to mineralized globular features observed in BSEM, but were not seen in other techniques where tissue had been demineralized (e.g. paraffin).
2. Joints
The features of joints (i.e. the structures and tissues between tesserae) were not visible in thawed samples, likely asso-ciated with the difficulty of producing samples flat enough for high magnification imaging (Fig. 4A). In PMMA, paraffin and clarified samples, however, the ultrastructures of multiple joint-associated features could be identified using AF (Fig. 5). Depending on the particular plane in which neighboring tesserae were sectioned, two local morphologies were possible, often with both present in a single joint ROI: (1) the tesserae margins separated by a space containing unminer-alized matrix, cells and fibers (Figs. 5F; 6A, 8B) or (2) the tesserae margins in direct contact (Fig. 5G). When tesserae were in direct contact, laminated, highly mineralized features called spokes [19, 25] were visible in PMMA samples, radiating
Fig. 4 AF signal of thawed (unfixed) tessellated cartilage. A AF signal of tesserae and cartilaginous matrix (CM) after one freezing–thawing cycle (preliminary analysis) (a, d–g) and two freezing–thawing cycles (experimental analysis) (b, c). CM was imaged first using bright field (d) and then by exciting the AF signal (e–g) using different excitation and emission wavelengths, specified at the bottom of each image. B Results of MCR-ALS analysis of the tesserae from preliminary analysis. Middle images: the location of the different fluorescence signatures in the tesseral layer. Graphs: emission spectra for the observed fluorescence signatures (left: 405 nm excitation; right: 470 and 520 nm excita-tion wavelengths). C Comparison of AF emission between preliminary and experimental analyses for 470 nm excitation wavelength, show-ing a clear loss of AF signal after two thawing-freezing cycles. Note: the patchy AF observed in the tesserae is a function of the difficulty of generating planar sections from fresh/thawed tissue. All scale bars = 20 μm. Bright field (BF); Cartilaginous matrix (CM)
▸

Vol.:(0123456789)
Discover Materials (2021) 1:16 | https://doi.org/10.1007/s43939-021-00015-x Research
1 3
Vol:.(1234567890)
Research Discover Materials (2021) 1:16 | https://doi.org/10.1007/s43939-021-00015-x
1 3
from contact points between neighbouring tesserae. These structures exhibited high AF signal and showed a similar morphology to spokes seen in BSE images (Fig. 5G). In both histology and AF of paraffin samples, spokes were only rep-resented by gaps in the tissue where the high mineral density laminae had been prior to demineralization (Fig. 5C, E).
In zones where neighboring tesserae were separated by soft material, cells and fibers connecting tesserae were typically visible. Cells located in the joint space were flattened and arranged in series, passing between neighboring tesserae (Figs. 5E, F; 6A; 8B). In our histology, these cell arrays occupied horizontal gaps between the fiber bundles link-ing tesserae; using the AF signal, these fibers were often visible as parallel streaks, connecting tesserae and framing cell arrays (Fig. 6A; 8B).
3. Unmineralized cartilage
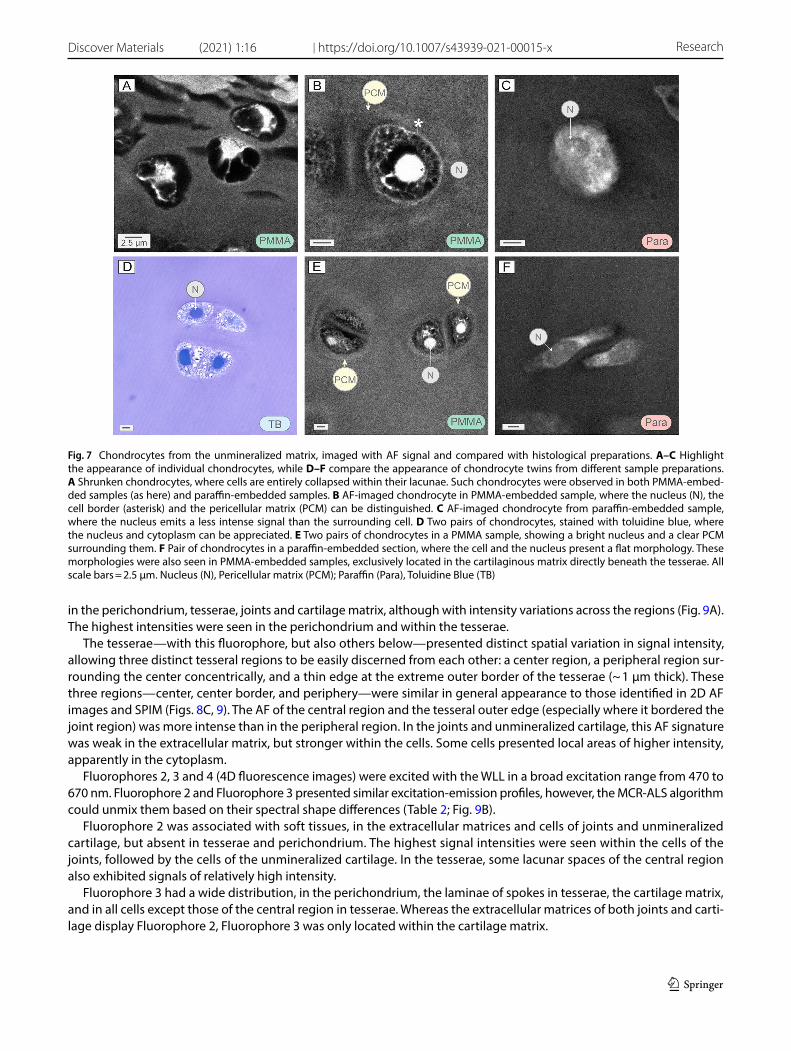
The unmineralized cartilage comprises cells embedded in copious amounts of extracellular matrix, as visible in our histological samples (Figs. 3; 5H). This basic tissue arrangement was also visible in AF imaging of all sample preparations, where cells emitted a brighter AF signal than the surrounding matrix (Figs. 3D; 5I, J; 7; 8A, C). Cells in the unmineralized cartilage also appeared more intact than cells within tesserae (see above), allowing observation of some local variation in cell morphology and arrangement across different zones (Fig. 7). In the unmineralized matrix directly beneath tesserae, cells were either well separated or formed twins (closely-associated, isogenous pairs, indicating recent separation by mitosis; Fig. 7D–F). In this zone, the cells exhibited a variety of cross-sectional morphologies, spheroidal (typical of chon-drocytes), but also flattened or elongated (Figs. 5I, J; 7F). In contrast, further from the interface with tesserae (i.e. deeper into the unmineralized matrix), cells always presented spheroidal morphologies and often formed isogenous groups (clusters of sister cells) of two or four chondrocytes (Figs. 5H–J; 7D–F; 8C).
Among the sample preparation methods, cells differed in their morphology and the fluorescence signal emitted. In the preliminary analysis of thawed samples, cells emitted a strong AF signal, in comparison to the very low signal of the surrounding matrix (Fig. 4A); both sources of AF were completely lost in the final experimental analysis. Cells in PMMA and paraffin samples exhibited different degrees of shrunkenness, where the cell appeared collapsed away from the walls of its lacuna and surrounded by an empty (black) space [36] (Fig. 7A). Better preserved cells exhibited different appearance and cell structure depending on the sample preparation method. In paraffin samples, these cells were bright ovoids with a darker rounded nucleus and relatively homogeneous cytoplasm (Fig. 7C). In PMMA samples, these cells showed a thin, bright surrounding border and a bright nucleus, but the intracellular compartment had a loose foamy appearance (Fig. 7B, E). Outside the cell, a distinct pericellular region was often visible, typically with a lower grayscale value and different matrix texture (Fig. 7B, E).
3.4 Analysis of hyperspectral images
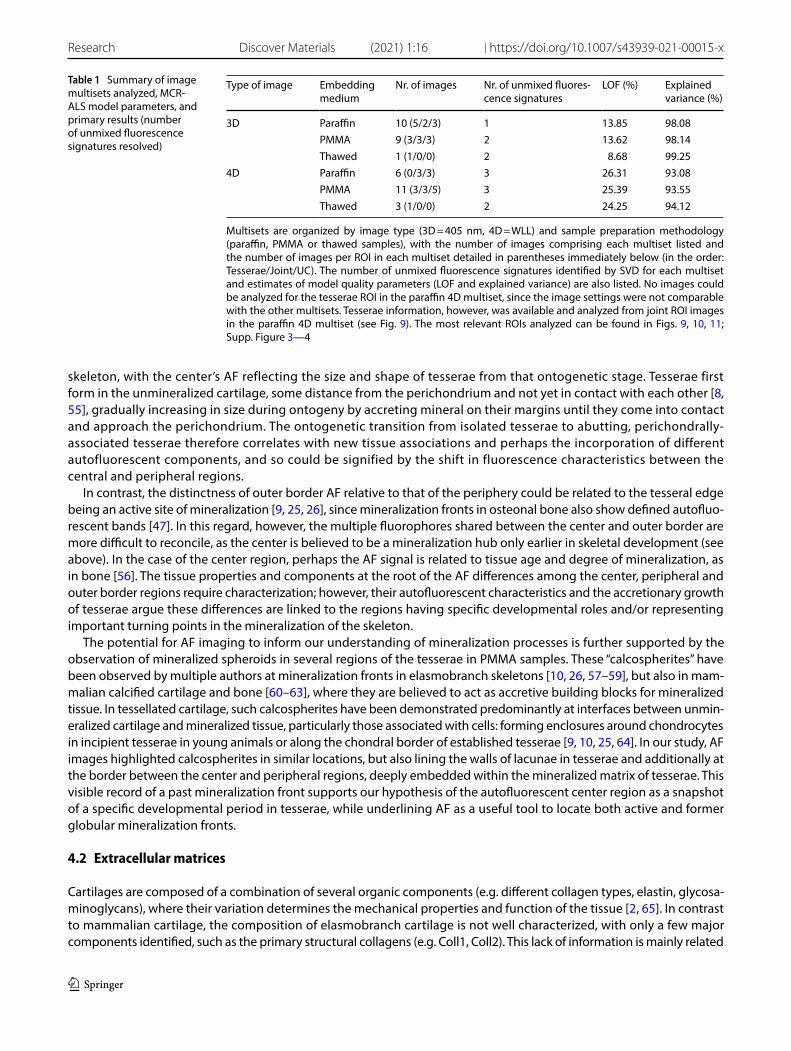
For both 3D and 4D fluorescence hyperspectral images, three separate multisets were created (one per sample prepara-tion method), formed by combining preprocessed fluorescence images from all ROIs (tesserae, joints and UC) for a given sample preparation method (see Fig. 9, 10, 11; Suppl. Figure 1–4). MCR–ALS was then applied to the 3D and 4D multi-sets to elucidate the sample constituents present in the analyzed sections of cartilage tissue. The primary parameters and model results of MCR-ALS, as applied to the different multisets analysed, are summarized in Table 1, including the number of images analyzed per multiset, the number of fluorescence signatures resolved by MCR-ALS, and estimates of model quality parameters: lack of fit (LOF) and explained variance. The variance explained by the MCR-ALS models is
Fig. 5 Comparison of histological samples (left column) with AF images of two sample preparation techniques (right columns). A Over-view of a propterygium cross-section, stained with hematoxylin–eosin (left) and a non-stained sample imaged with AF (right). The zoomed region shows a closer view of tesserae. Both samples were demineralized and paraffin-embedded. These very large field-of-view images of the entire skeletal cross section are composites, stitched together from multiple 10 × images using the built-in Leica Auto Stitching function. B, E, H show regions from decalcified samples, EPON-embedded and stained with toluidine blue. C, F, I show regions from decalcified sam-ples, paraffin-embedded and imaged using AF (ex: 405 nm laser; em: 422–702.5 nm). D, G, J show regions from mineralized samples, PMMA embedded and imaged using AF (ex: 405 nm laser; em: 422–702.5 nm). In PMMA samples, the central region (black pushpin), peripheral region (grey pushpin) and outer border (white pushpin) can be distinguished, whereas in paraffin only the central and peripheral regions can be seen. Banded patterns observable in some images (e.g. C, I, J) are artifacts generated by the reflection of the light; we verified that these did not affect the MCR analysis and elected not to remove them in post-processing (their removal modified the signal and morphol-ogy of imaged tissue structures). All scale bars from B-J = 20 μm. Chondrocytes (C), Cartilaginous matrix (CM), Joint (J), Perichondrium (P), Pericellular matrix (PCM), Spokes (Sp), Toluidine Blue (TB)
▸

Vol.:(0123456789)
Discover Materials (2021) 1:16 | https://doi.org/10.1007/s43939-021-00015-x Research
1 3
Vol:.(1234567890)
Research Discover Materials (2021) 1:16 | https://doi.org/10.1007/s43939-021-00015-x
1 3
satisfactory considering the noise level of the spectra analysed. The lower variance explained by 4D images compared with 3D images is explained by the lower signal-to-noise ratio of these data.
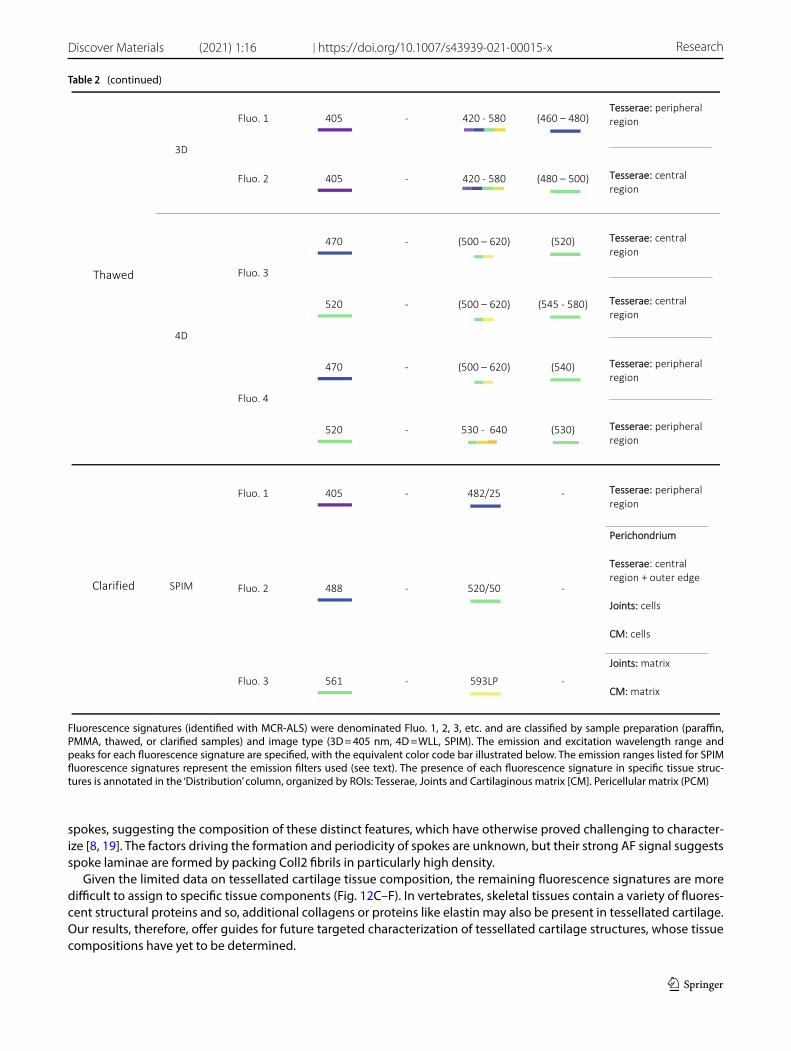
The unmixed fluorescence signatures detected in our samples by the MCR-ALS were characterized by distinct pure excitation-emission spectra and distribution in the tissue. To facilitate description and reference in our analysis, we designate the observed unmixed fluorescence signatures “Fluorophores”, however, it is important to note that these AF signatures can be produced either by a single fluorophore (e.g. from elastin or a particular collagen or flavin) or a co-occurring combination of them. We number the fluorophores arbitrarily for reference (e.g. Fluorophore 1, 2, 3) and in the text below provide general summaries of their excitation/emission ranges; these data are listed in more spectral detail and according to tissue associations, sample preparation and imaging multiset (3D or 4D) in Table 2.
4D images showed a higher number of distinct signatures than 3D images, likely due to the wider excitation range. Regarding the preparation method, PMMA samples showed a higher number of distinct signatures, followed by paraffin. Thawed samples presented a weak AF signal and only preliminary samples exhibited a signal-to-noise ratio that allowed identification of distinct AF signatures.
3.5 Paraffin sample analysis
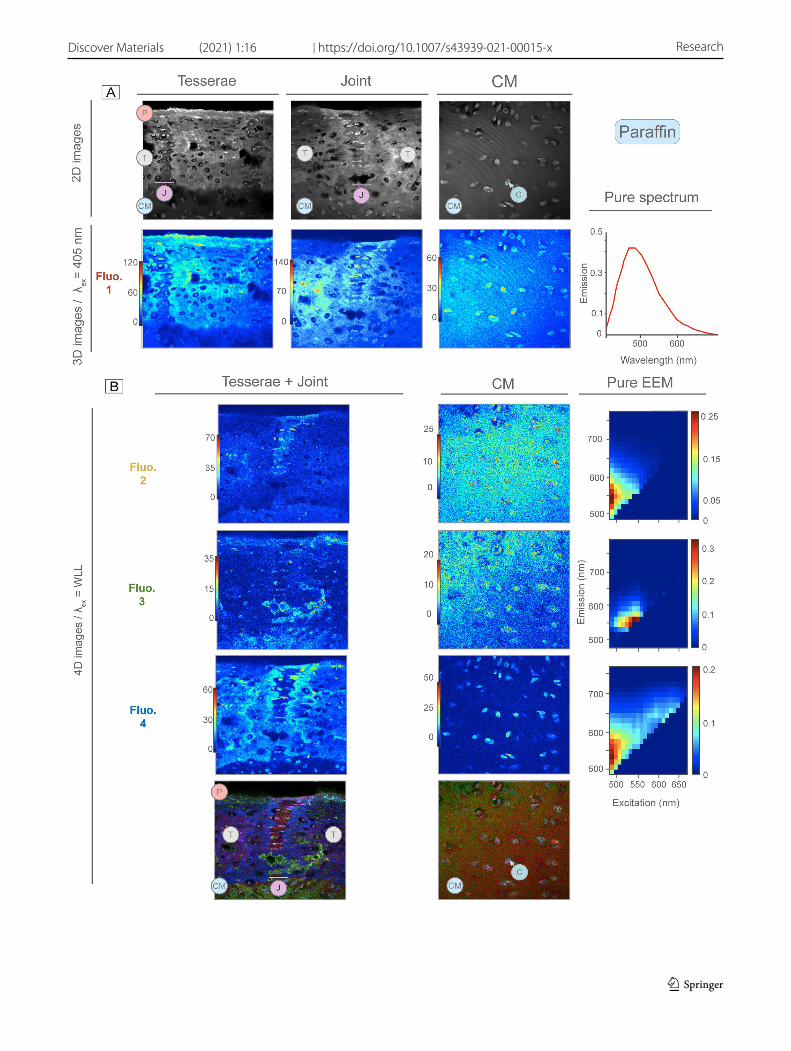
In paraffin samples, four fluorescence signatures were detected with MCR-ALS, one with 3D images (Fluorophore 1) and three with 4D images (Fluorophore 2, 3 and 4). Fluorophore 1 was excited by the 405 laser (3D multiset: Table 2), observed
Fig. 6 Several ultrastructural features of tesserae, observable with the AF signal. A A portion of a single tessera (left) and its joint (right). Within the tessera, the peripheral region (grey pushpin) shows a lower AF signal than the central region (black pushpin) and the outer bor-der (white pushpin). Variations in the signal intensity of the central region are observable, such as the globular mineralized features (cal-cospherites; white arrow in the circle) at the border of the central region and the tessera’s outer edge (white arrow). B Cells within lacu-nar spaces in tesserae. The lacunar spaces presented a brighter signal than the surrounding mineralized tissue. Calcospherites can also be observed within the lacunae space (white arrow). C For comparison with (B), a BSE image of a similar tessera region, but showing only the mineralized tissue; the cells aren’t visualized and so lacunae appear empty (note the short canalicular passages connecting adjacent lacu-nae). Note that finescale features (e.g. Liesegang lines, LL) can be visualized similarly in BSE and with the AF signal. D, E AF images showing the border region between tesserae and unmineralized cartilage matrix. Several features can be observed, such as cells being incorporated into the tesserae, surrounded by calcospherites (white arrow in D), as well as the bright tesseral outer border and LL. F AF image of a similar chondral border region, but from decalcified, paraffin-embedded samples. Note the decreased contrast and less defined structures relative to the mineralized, PMMA-embedded samples. All scale bars = 5 μm. Chondrocytes (C); Backscatter Electron Microscopy (BSEM); Joint (J); Lacunae (L); Liesegang lines (LL); Paraffin (Para); Tesserae (T)
Vol.:(0123456789)
Discover Materials (2021) 1:16 | https://doi.org/10.1007/s43939-021-00015-x Research
1 3
in the perichondrium, tesserae, joints and cartilage matrix, although with intensity variations across the regions (Fig. 9A). The highest intensities were seen in the perichondrium and within the tesserae.
The tesserae—with this fluorophore, but also others below—presented distinct spatial variation in signal intensity, allowing three distinct tesseral regions to be easily discerned from each other: a center region, a peripheral region sur-rounding the center concentrically, and a thin edge at the extreme outer border of the tesserae (~ 1 μm thick). These three regions—center, center border, and periphery—were similar in general appearance to those identified in 2D AF images and SPIM (Figs. 8C, 9). The AF of the central region and the tesseral outer edge (especially where it bordered the joint region) was more intense than in the peripheral region. In the joints and unmineralized cartilage, this AF signature was weak in the extracellular matrix, but stronger within the cells. Some cells presented local areas of higher intensity, apparently in the cytoplasm.
Fluorophores 2, 3 and 4 (4D fluorescence images) were excited with the WLL in a broad excitation range from 470 to 670 nm. Fluorophore 2 and Fluorophore 3 presented similar excitation-emission profiles, however, the MCR-ALS algorithm could unmix them based on their spectral shape differences (Table 2; Fig. 9B).
Fluorophore 2 was associated with soft tissues, in the extracellular matrices and cells of joints and unmineralized cartilage, but absent in tesserae and perichondrium. The highest signal intensities were seen within the cells of the joints, followed by the cells of the unmineralized cartilage. In the tesserae, some lacunar spaces of the central region also exhibited signals of relatively high intensity.
Fluorophore 3 had a wide distribution, in the perichondrium, the laminae of spokes in tesserae, the cartilage matrix, and in all cells except those of the central region in tesserae. Whereas the extracellular matrices of both joints and carti-lage display Fluorophore 2, Fluorophore 3 was only located within the cartilage matrix.
Fig. 7 Chondrocytes from the unmineralized matrix, imaged with AF signal and compared with histological preparations. A–C Highlight the appearance of individual chondrocytes, while D–F compare the appearance of chondrocyte twins from different sample preparations. A Shrunken chondrocytes, where cells are entirely collapsed within their lacunae. Such chondrocytes were observed in both PMMA-embed-ded samples (as here) and paraffin-embedded samples. B AF-imaged chondrocyte in PMMA-embedded sample, where the nucleus (N), the cell border (asterisk) and the pericellular matrix (PCM) can be distinguished. C AF-imaged chondrocyte from paraffin-embedded sample, where the nucleus emits a less intense signal than the surrounding cell. D Two pairs of chondrocytes, stained with toluidine blue, where the nucleus and cytoplasm can be appreciated. E Two pairs of chondrocytes in a PMMA sample, showing a bright nucleus and a clear PCM surrounding them. F Pair of chondrocytes in a paraffin-embedded section, where the cell and the nucleus present a flat morphology. These morphologies were also seen in PMMA-embedded samples, exclusively located in the cartilaginous matrix directly beneath the tesserae. All scale bars = 2.5 μm. Nucleus (N), Pericellular matrix (PCM); Paraffin (Para), Toluidine Blue (TB)
Vol:.(1234567890)
Research Discover Materials (2021) 1:16 | https://doi.org/10.1007/s43939-021-00015-x
1 3
Fluorophore 4 was the only fluorescence signature in this multiset located in the mineralized tissue of tesserae: in the border between the central and peripheral regions of the tesserae and in the outer edge surrounding the tesserae. Fluorophore 4 was also located within the cells of all regions (tesserae, joints and unmineralized cartilage). Although Fluorophores 2, 3 and 4 of this multiset were localized in cells, Fluorophore 4 showed the highest cellular AF and was absent in the extracellular matrices of the joints and unmineralized cartilage.
3.6 PMMA sample analysis
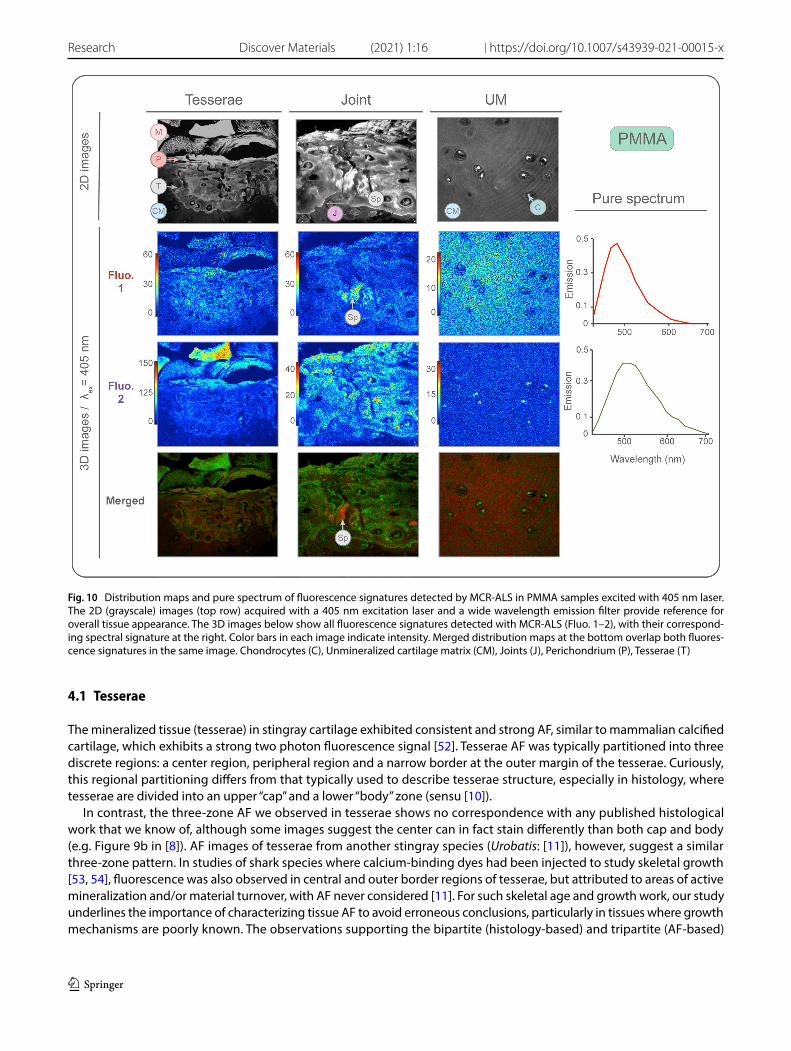
In PMMA samples, five fluorescence signatures were detected with MCR-ALS, two in 3D images (Fluorophores 1 and 2) and three in 4D images (Fluorophores 3, 4 and 5). Fluorophores 1 and 2 were excited by the 405 laser, (Table 2; Fig. 10). Fluorophore 1 was homogeneously distributed in the mineralized matrix of the tesserae, and in the extracellular matrix of the joints and unmineralized cartilage, but absent in all cells. Within the tesserae, this fluorescence signature was more intense in the laminae of spokes. The localization within the tissue of this fluorophore correlates with the distribution pattern of Coll2 observed in IHC (Supp. Figure 5). Fluorophore 2 had an intense signal in the muscles, perichondrium, center region and outer edge of the tesserae and in the cells within the joints and cartilage.
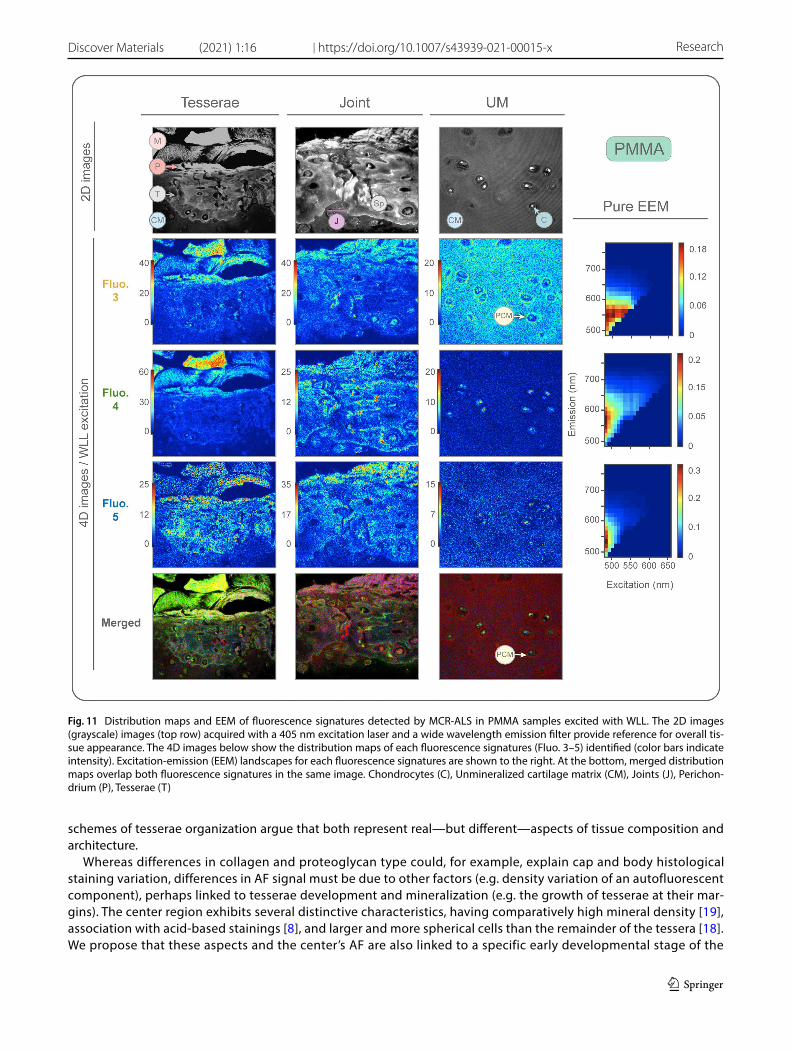
Fluorophores 3, 4 and 5 were excited with the WLL (4D images) in a broad excitation range from 470 to 670 nm (Table 2, Fig. 11). Fluorophore 3 was most intense in muscle, perichondrium, and spokes’ laminae, exhibiting lower intensities within the cells and extracellular matrix of the unmineralized cartilage. In the extracellular matrix, this fluorescence signa-ture had a homogeneous distribution, albeit forming higher intensity halos immediately surrounding cells. Fluorophore 3 was lacking in joints and the majority of tesserae cells.
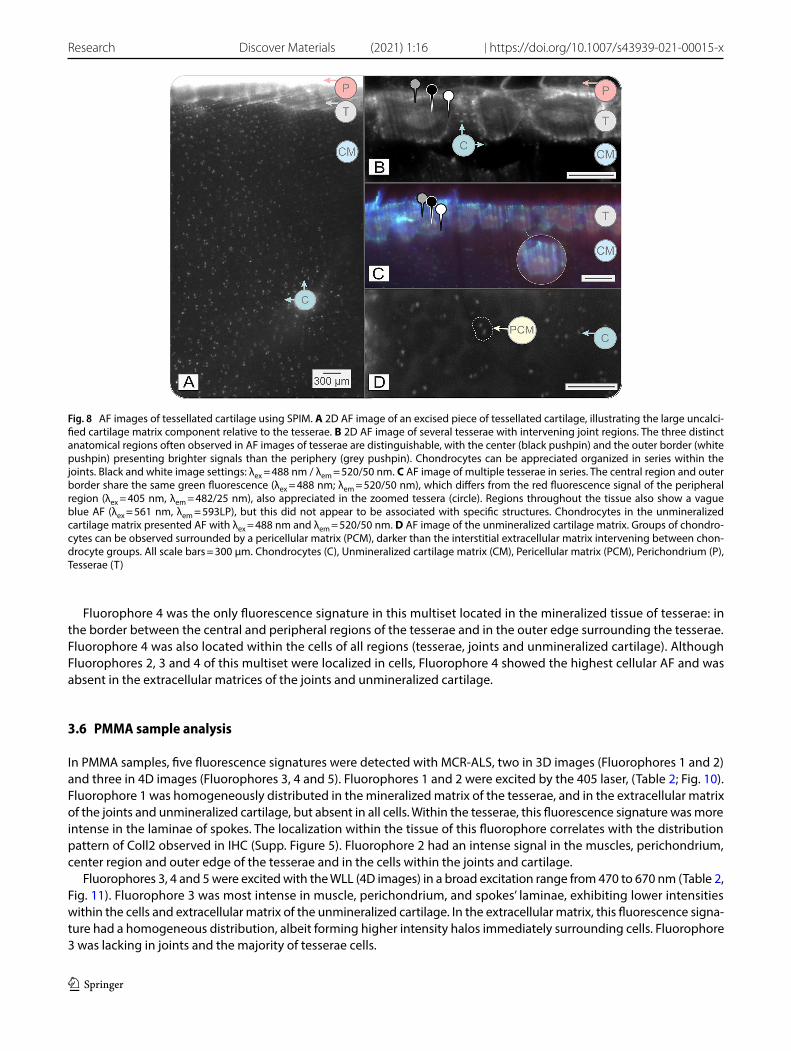
Fig. 8 AF images of tessellated cartilage using SPIM. A 2D AF image of an excised piece of tessellated cartilage, illustrating the large uncalci-fied cartilage matrix component relative to the tesserae. B 2D AF image of several tesserae with intervening joint regions. The three distinct anatomical regions often observed in AF images of tesserae are distinguishable, with the center (black pushpin) and the outer border (white pushpin) presenting brighter signals than the periphery (grey pushpin). Chondrocytes can be appreciated organized in series within the joints. Black and white image settings: λex = 488 nm / λem = 520/50 nm. C AF image of multiple tesserae in series. The central region and outer border share the same green fluorescence (λex = 488 nm; λem = 520/50 nm), which differs from the red fluorescence signal of the peripheral region (λex = 405 nm, λem = 482/25 nm), also appreciated in the zoomed tessera (circle). Regions throughout the tissue also show a vague blue AF (λex = 561 nm, λem = 593LP), but this did not appear to be associated with specific structures. Chondrocytes in the unmineralized cartilage matrix presented AF with λex = 488 nm and λem = 520/50 nm. D AF image of the unmineralized cartilage matrix. Groups of chondro-cytes can be observed surrounded by a pericellular matrix (PCM), darker than the interstitial extracellular matrix intervening between chon-drocyte groups. All scale bars = 300 µm. Chondrocytes (C), Unmineralized cartilage matrix (CM), Pericellular matrix (PCM), Perichondrium (P), Tesserae (T)
Vol.:(0123456789)
Discover Materials (2021) 1:16 | https://doi.org/10.1007/s43939-021-00015-x Research
1 3
Fluorophore 4 had the highest intensity in muscle. It was also present in the perichondrium, in the border between central and peripheral regions in tesserae, and in the outer edge of tesserae. In the unmineralized cartilage, it was only present within the cells, being completely absent in the extracellular matrix. Fluorophore 5 was most intense in the muscle and perichondrium, in the center, center border and outer edge of the tesserae and, to a lesser degree, in the unmineralized cartilage matrix. A weak signal could be seen within the cells of the unmineralized cartilage, but was absent in the rest of the cells.
Consolidating the information from all fluorescence signatures observed in PMMA samples, it can be noted that the cells differ in signal according to their location: cells of the unmineralized matrix present a combination of Fluorophores 3, 4 and 5, whereas cells of the joints and tesserae exhibit only Fluorophore 4, and Fluorophore 3 dominates in cells of the tesserae body zone.
3.7 Thawed samples analysis
For comparison of the AF signals of preliminary and experimental thawed samples, the different instrumental settings (e.g. bandwidth and pixel size) of the two experiments were standardized by binning to unify pixel size and by selecting only common spectral excitation wavelengths (470 and 520 nm). For both of these excitation wavelengths, the AF found in preliminary samples was nearly absent in the experimental thawed samples (Fig. 4C).
In contrast, the MCR-ALS analysis of preliminary thawed samples excited by the 405 nm laser (3D multiset) and by the 470 and 520 nm lasers (4D multiset) allowed tissue features to be distinguished. Following binning of the hyperspectral images by a factor of seven to increase spectral quality (increasing pixel size from 1.06 μm to 7.44 μm), two different fluo-rescence signatures were detectable, excited by the 405 nm laser (Fig. 4B, Table 2). Fluorophore 1 was generally located in the peripheral region of tesserae, whereas Fluorophore 2 was constrained largely to the central region. In this case, we excited the tissue with individual 470 and 520 nm lasers instead of a broader range, but this was still considered as a single excitation range. With these excitation wavelengths, two fluorescence signatures (Fluorophore 3 and 4) with dif-ferent emission spectra were associated with each excitation wavelength (Table 2, Fig. 4B). Both fluorescence signatures were associated with the tesserae, presenting distinct spatial locations; Fluorophore 3 was generally associated with the peripheral region of the tesserae, whereas the Fluorophore 4 was associated with the central region. The detection of fluorescence signals in thawed samples indicates the presence of natural fluorophores associated with distinct spatial locations of the tissue.
3.8 Tissue AF imaging at larger scales
In thick samples imaged by SPIM, muscle, cells, tesserae and perichondrium all emitted distinct AF signals, which dif-fered in their excitation and emission wavelengths. The strongest excitation/emission pairings for each tissue are listed in Table 2. The perichondrium was the tissue with the strongest AF (Fluorophore 2; Fig. 8A), and needed to be saturated in image post-processing to allow other features to be visualized.
Tesserae were clearly visible beneath the perichondrium (Fig. 8A–D), exhibiting three spatially distinct regions, similar to those described above for PMMA samples, with distinctive AF wavelengths and intensities. The peripheral region of tesserae showed AF in the 482/25 nm filter window when excited with the 405 nm laser (Fluorophore 1, red in Fig. 8C). This region was encapsulated by a thin outer border delineating the edge of tesserae (~ 15–30 μm), which emitted a very localized AF signal in the 520/50 window (Fluorophore 2, green in Fig. 8C), when illuminated with a 488 nm excitation laser. The center region of tesserae emitted a signal with the same intensity and wavelength as the outer edge, forming a small, hazy autofluorescent region approximately the same cross-sectional shape as the tessera (in vertical and planar sections).
The unmineralized matrix emitted AF in the 593LP window when excited with the 561 nm laser (Fluorophore 3—dark blue in Fig. 8C), with low signal intensity in comparison with the cells and tesserae. However, even with low signal strength, local intensity differences could be appreciated. In particular, individual cells and cell groups were haloed by a zone of AF of lower intensity than that of the bulk cartilaginous matrix. Cells within the cartilaginous matrix and joints exhibited a strong AF (Fluorophore 2), whereas those within tesserae exhibited no visible signal. Although the resolution was not high enough to distinguish cellular form or structures (e.g. nucleus) to any degree, it was possible to visualize the large-scale, 3D arrangements of cells within the unmineralized matrix. For example, cells located directly beneath the tesserae tended to be isolated, yet with increasing distance into the cartilaginous core, tended to be organized into groups of two and then four.

Vol:.(1234567890)
Research Discover Materials (2021) 1:16 | https://doi.org/10.1007/s43939-021-00015-x
1 3
4 Discussion
All major structural components of tessellated cartilage are autofluorescent, sensitive to a broad range of excitation wave-lengths (405–600 nm). In particular, these components strongly reacted when excited with UV (405 nm), emitting a diversity of tissue-specific green-yellow AF (i.e. within the 480–580 mm range). We show that it is possible to image both soft and hard tissue elements of tessellated cartilage by exciting tissue AF with confocal and SPIM microscopes, resolving tissue compo-nents at a broad range of size scales, from millimeter- down to subcellular spatial resolution (1 μm).
1. Effect of preparation methods (PMMA, paraffin and thawed) on AF
The specific fluorescence signatures we observed—although all within the excitation/emission ranges mentioned in the previous paragraph—were not consistent among the different sample preparations studied, differing in the number of fluorescence signatures detected, their spectral features, and where they were expressed. The reasons for these differences are unclear, but variation in autofluorescence is known to be linked to multiple aspects of sample preparation, as well as tis-sue composition. For example, the loss of AF in thawed samples could be related to the destructive influence of freezing and thawing on cartilage, which causes disruption of chondrocytes [37, 38] and proteolytic degradation of fibers (e.g. collagens, actin) in the extracellular matrix [39–41]. The AF signatures evident in preliminary thawed samples of tesserae, however, are promising for future research, indicating that neither embedding media nor fluorescent markers are required for the study of this tissue. Cryosectioning of samples should facilitate AF imaging bywill ensuring more uniform slices resulting in more features in-plane.
With regard to embedded samples, the spectral differences between paraffin and PMMA multisets were not due to fixative effects, as both were fixed following the same protocol. Additionally, although tissue fixation with aldehydes (PFA, glutaraldehyde) can induce tissue AF due to the formation of chemical ring structures, the AF generated by PFA is generally low and hardly detectable with spectroscopy [42, 43]. Paraffin samples presenting fewer fluorophores could be related to the demineralization process. Decalcification using EDTA has been demonstrated to increase AF or produce changes in fluo-rophores location and/or spectra during mineral removal [44–46]. On the other hand, the capacity for AF from the mineral itself—carbonated apatite in tesserae, as well as in mammalian calcified cartilage and bone [40]—is still under debate, with several studies arguing that it is not autofluorescent [44–49]. It should be noted though that apatite AF has previously only been investigated at lower excitation-emission wavelengths than those used in this study and should be explored. Addi-tionally, several studies have demonstrated that high temperatures can quench tissue AF and, in our study, paraffin embed-ding was carried out at higher temperatures (60ºC) than PMMA (4ºC). Lastly, we are confident that AF differences among preparation types were not due to the embedding media themselves: we verified that both paraffin and PMMA exhibited negligible AF (the latter supported by other studies; e.g. [50, 51]) and moreover, the embedding media were removed from sections prior to imaging.
2. Tissue biology insights from AF imaging
Our demonstration of tissue-specific AF in tessellated cartilage opens new opportunities for high-resolution optical imag-ing and characterization of this tissue. This is particularly true for PMMA samples, which resulted in the highest quality images of tessellated cartilage, with well-defined mineralized and non-mineralized structures (e.g. mineralization fronts, Liesegang lines, spokes, cell nuclei), many not seen in other preparation methods.
Fig. 9 Distribution maps and EEM of fluorescence signatures detected by MCR-ALS in decalcified, paraffin embedded samples. A 2D (gray-scale) images acquired with 405 nm and wide wavelength emission filter provide reference for overall tissue appearance. The 3D images below show the single detected fluorescence signatures, excited with the 405 nm laser (Fluo. 1). The fluorescence signature’s spectral sig-nature is shown to the right. B 4D images, excited with the WLL, showing three detected fluorescence signatures (Fluo. 2–4); color bars indicate intensity. Merged distribution maps at the bottom overlap all fluorescence signatures in the same image. Excitation-emission (EEM) landscapes for each fluorescence signature are shown to the right. Chondrocytes (C), Unmineralized cartilage matrix (CM), Joints (J), Pericel-lular matrix (PCM), Perichondrium (P), Tesserae (T)
▸
Vol.:(0123456789)
Discover Materials (2021) 1:16 | https://doi.org/10.1007/s43939-021-00015-x Research
1 3
Vol:.(1234567890)
Research Discover Materials (2021) 1:16 | https://doi.org/10.1007/s43939-021-00015-x
1 3
4.1 Tesserae
The mineralized tissue (tesserae) in stingray cartilage exhibited consistent and strong AF, similar to mammalian calcified cartilage, which exhibits a strong two photon fluorescence signal [52]. Tesserae AF was typically partitioned into three discrete regions: a center region, peripheral region and a narrow border at the outer margin of the tesserae. Curiously, this regional partitioning differs from that typically used to describe tesserae structure, especially in histology, where tesserae are divided into an upper “cap” and a lower “body” zone (sensu [10]).
In contrast, the three-zone AF we observed in tesserae shows no correspondence with any published histological work that we know of, although some images suggest the center can in fact stain differently than both cap and body (e.g. Figure 9b in [8]). AF images of tesserae from another stingray species (Urobatis: [11]), however, suggest a similar three-zone pattern. In studies of shark species where calcium-binding dyes had been injected to study skeletal growth [53, 54], fluorescence was also observed in central and outer border regions of tesserae, but attributed to areas of active mineralization and/or material turnover, with AF never considered [11]. For such skeletal age and growth work, our study underlines the importance of characterizing tissue AF to avoid erroneous conclusions, particularly in tissues where growth mechanisms are poorly known. The observations supporting the bipartite (histology-based) and tripartite (AF-based)
Fig. 10 Distribution maps and pure spectrum of fluorescence signatures detected by MCR-ALS in PMMA samples excited with 405 nm laser. The 2D (grayscale) images (top row) acquired with a 405 nm excitation laser and a wide wavelength emission filter provide reference for overall tissue appearance. The 3D images below show all fluorescence signatures detected with MCR-ALS (Fluo. 1–2), with their correspond-ing spectral signature at the right. Color bars in each image indicate intensity. Merged distribution maps at the bottom overlap both fluores-cence signatures in the same image. Chondrocytes (C), Unmineralized cartilage matrix (CM), Joints (J), Perichondrium (P), Tesserae (T)
Vol.:(0123456789)
Discover Materials (2021) 1:16 | https://doi.org/10.1007/s43939-021-00015-x Research
1 3
schemes of tesserae organization argue that both represent real—but different—aspects of tissue composition and architecture.
Whereas differences in collagen and proteoglycan type could, for example, explain cap and body histological staining variation, differences in AF signal must be due to other factors (e.g. density variation of an autofluorescent component), perhaps linked to tesserae development and mineralization (e.g. the growth of tesserae at their mar-gins). The center region exhibits several distinctive characteristics, having comparatively high mineral density [19], association with acid-based stainings [8], and larger and more spherical cells than the remainder of the tessera [18]. We propose that these aspects and the center’s AF are also linked to a specific early developmental stage of the
Fig. 11 Distribution maps and EEM of fluorescence signatures detected by MCR-ALS in PMMA samples excited with WLL. The 2D images (grayscale) images (top row) acquired with a 405 nm excitation laser and a wide wavelength emission filter provide reference for overall tis-sue appearance. The 4D images below show the distribution maps of each fluorescence signatures (Fluo. 3–5) identified (color bars indicate intensity). Excitation-emission (EEM) landscapes for each fluorescence signatures are shown to the right. At the bottom, merged distribution maps overlap both fluorescence signatures in the same image. Chondrocytes (C), Unmineralized cartilage matrix (CM), Joints (J), Perichon-drium (P), Tesserae (T)
Vol:.(1234567890)
Research Discover Materials (2021) 1:16 | https://doi.org/10.1007/s43939-021-00015-x
1 3
skeleton, with the center’s AF reflecting the size and shape of tesserae from that ontogenetic stage. Tesserae first form in the unmineralized cartilage, some distance from the perichondrium and not yet in contact with each other [8, 55], gradually increasing in size during ontogeny by accreting mineral on their margins until they come into contact and approach the perichondrium. The ontogenetic transition from isolated tesserae to abutting, perichondrally-associated tesserae therefore correlates with new tissue associations and perhaps the incorporation of different autofluorescent components, and so could be signified by the shift in fluorescence characteristics between the central and peripheral regions.
In contrast, the distinctness of outer border AF relative to that of the periphery could be related to the tesseral edge being an active site of mineralization [9, 25, 26], since mineralization fronts in osteonal bone also show defined autofluo-rescent bands [47]. In this regard, however, the multiple fluorophores shared between the center and outer border are more difficult to reconcile, as the center is believed to be a mineralization hub only earlier in skeletal development (see above). In the case of the center region, perhaps the AF signal is related to tissue age and degree of mineralization, as in bone [56]. The tissue properties and components at the root of the AF differences among the center, peripheral and outer border regions require characterization; however, their autofluorescent characteristics and the accretionary growth of tesserae argue these differences are linked to the regions having specific developmental roles and/or representing important turning points in the mineralization of the skeleton.
The potential for AF imaging to inform our understanding of mineralization processes is further supported by the observation of mineralized spheroids in several regions of the tesserae in PMMA samples. These “calcospherites” have been observed by multiple authors at mineralization fronts in elasmobranch skeletons [10, 26, 57–59], but also in mam-malian calcified cartilage and bone [60–63], where they are believed to act as accretive building blocks for mineralized tissue. In tessellated cartilage, such calcospherites have been demonstrated predominantly at interfaces between unmin-eralized cartilage and mineralized tissue, particularly those associated with cells: forming enclosures around chondrocytes in incipient tesserae in young animals or along the chondral border of established tesserae [9, 10, 25, 64]. In our study, AF images highlighted calcospherites in similar locations, but also lining the walls of lacunae in tesserae and additionally at the border between the center and peripheral regions, deeply embedded within the mineralized matrix of tesserae. This visible record of a past mineralization front supports our hypothesis of the autofluorescent center region as a snapshot of a specific developmental period in tesserae, while underlining AF as a useful tool to locate both active and former globular mineralization fronts.
4.2 Extracellular matrices
Cartilages are composed of a combination of several organic components (e.g. different collagen types, elastin, glycosa-minoglycans), where their variation determines the mechanical properties and function of the tissue [2, 65]. In contrast to mammalian cartilage, the composition of elasmobranch cartilage is not well characterized, with only a few major components identified, such as the primary structural collagens (e.g. Coll1, Coll2). This lack of information is mainly related
Table 1 Summary of image multisets analyzed, MCR-ALS model parameters, and primary results (number of unmixed fluorescence signatures resolved)
Multisets are organized by image type (3D = 405 nm, 4D = WLL) and sample preparation methodology (paraffin, PMMA or thawed samples), with the number of images comprising each multiset listed and the number of images per ROI in each multiset detailed in parentheses immediately below (in the order: Tesserae/Joint/UC). The number of unmixed fluorescence signatures identified by SVD for each multiset and estimates of model quality parameters (LOF and explained variance) are also listed. No images could be analyzed for the tesserae ROI in the paraffin 4D multiset, since the image settings were not comparable with the other multisets. Tesserae information, however, was available and analyzed from joint ROI images in the paraffin 4D multiset (see Fig. 9). The most relevant ROIs analyzed can be found in Figs. 9, 10, 11; Supp. Figure 3—4
Type of image Embedding medium
Nr. of images Nr. of unmixed fluores-cence signatures
LOF (%) Explained variance (%)
3D Paraffin 10 (5/2/3) 1 13.85 98.08PMMA 9 (3/3/3) 2 13.62 98.14Thawed 1 (1/0/0) 2 8.68 99.25
4D Paraffin 6 (0/3/3) 3 26.31 93.08PMMA 11 (3/3/5) 3 25.39 93.55Thawed 3 (1/0/0) 2 24.25 94.12

Vol.:(0123456789)
Discover Materials (2021) 1:16 | https://doi.org/10.1007/s43939-021-00015-x Research
1 3
to the difficulty in identifying tissue components unequivocally, as their identification requires protocols that are either time-consuming/costly (e.g. development of elasmobranch-specific antibodies) or involve steps that can even hamper component identification or ultrastructural investigation (e.g. degradation of surrounding matrices). In comparing our AF data to existing information on tessellated cartilage structure and composition and our own data from other imaging modalities (histology, BSEM), we propose likely sources for some observed fluorophores, particularly those associated with tissues of known collagen composition.
Coll1 and Coll2 are well-known fluorophores in skeletal tissue [2]. In the elasmobranch skeleton, Coll1 is known to be present in both muscles and perichondrium [8]. Among the diverse fluorophores we observed associated with both the perichondrium and muscle (Table 2), the one with the highest intensity is likely associated with Coll1, having also a similar spectral profile of Coll1 in other taxa [4, 63–65] (Fig. 12A). Surprisingly, this fluorophore was also associated with chondrocytes of the unmineralized matrix, which are not known to express Coll1 [66, 67]
Additionally we propose, based on correspondence with immunostained samples, that the two fluorescent signals associated with the extracellular matrix (ECM) of joints and uncalcified cartilage represent or are linked to Coll2 (Fig. 12B). This collagen, in addition to being autofluorescent [41, 68], is indeed a primary component of the ECM of joints, unmin-eralized cartilage and tesserae [8, 66, 69] (see also Supp. Figure 5). The specific distribution of these putative “Coll2 fluo-rophores” raises several interesting points relevant to growth and patterning of tessellated cartilage. First, the relatively homogeneous signal of the two fluorophores, seen throughout the ECM of joints, uncalcified cartilage and tesserae, supports the hypothesis that tesserae arise in and are predominantly composed of Coll2, despite some local variation of other materials (e.g. the mineral in tesserae or the Coll1 Sharpey’s fibers that insert into the cap from the perichondrium). Additionally, the localization of these two fluorophores in the tesserae indicates a potential advantage of AF imaging of tesserae over immunohistochemistry, where Coll2 antibody reactivity in tesserae was only possible after stringent digestion techniques [8]. Lastly, one of the “Coll2 fluorophores” presented an extremely high signal in the laminae of
Table 2 Summary of excitation and emission wavelengths of each fluorescence signature and their tissue associations

Vol:.(1234567890)
Research Discover Materials (2021) 1:16 | https://doi.org/10.1007/s43939-021-00015-x
1 3
Table 2 (continued)
Vol.:(0123456789)
Discover Materials (2021) 1:16 | https://doi.org/10.1007/s43939-021-00015-x Research
1 3
spokes, suggesting the composition of these distinct features, which have otherwise proved challenging to character-ize [8, 19]. The factors driving the formation and periodicity of spokes are unknown, but their strong AF signal suggests spoke laminae are formed by packing Coll2 fibrils in particularly high density.
Given the limited data on tessellated cartilage tissue composition, the remaining fluorescence signatures are more difficult to assign to specific tissue components (Fig. 12C–F). In vertebrates, skeletal tissues contain a variety of fluores-cent structural proteins and so, additional collagens or proteins like elastin may also be present in tessellated cartilage. Our results, therefore, offer guides for future targeted characterization of tessellated cartilage structures, whose tissue compositions have yet to be determined.
Table 2 (continued)
Fluorescence signatures (identified with MCR-ALS) were denominated Fluo. 1, 2, 3, etc. and are classified by sample preparation (paraffin, PMMA, thawed, or clarified samples) and image type (3D = 405 nm, 4D = WLL, SPIM). The emission and excitation wavelength range and peaks for each fluorescence signature are specified, with the equivalent color code bar illustrated below. The emission ranges listed for SPIM fluorescence signatures represent the emission filters used (see text). The presence of each fluorescence signature in specific tissue struc-tures is annotated in the ‘Distribution’ column, organized by ROIs: Tesserae, Joints and Cartilaginous matrix [CM]. Pericellular matrix (PCM)

Vol:.(1234567890)
Research Discover Materials (2021) 1:16 | https://doi.org/10.1007/s43939-021-00015-x
1 3
4.3 Cells
The AF signal provided information on cellular morphology, for example, demonstrating a clear pericellular matrix (PCM) region, a narrow tissue zone haloing chondrocytes in the unmineralized cartilage. In mammalian cartilage, the PCM acts as an interface between the cells and their environment and is crucial in determining how chondrocytes interact both mechanically and physicochemically with the surrounding matrix [70–72]. A factor in mediating these behaviors is the distinct composition of the PCM which, for example, has a higher proteoglycan content than the surrounding cartilage and is composed uniquely of collagen type VI [73, 74]. Indeed, the proteoglycan aggrecan is considered a potential source of pericellular AF in two-photon fluorescence microscopy (TPF) [75, 76]. Despite its importance in mammalian cartilage, a defined PCM has never been described in elasmobranchs, neither with histology nor electron microscopy. Although we cannot yet identify the source of PCM AF, its defined signal in elasmobranch cartilage suggests it may have distinct compositional, architectural and/or mechanical characteristics, as in mammalian cartilage.
Fig. 12 Summary of the tessellated cartilage fluorescence signatures localized in this study, classified according to EEM, tissue location, and potential source. Each fluorescence signature’s tissue associations are summarized visually in a color-coded tesserae schematic (see Fig. 1). Fluorescence signatures are listed according to assigned numbers from Table 2, their sample preparation, and imaging modality (e.g. Fluo. 2, PMMA, 4D) and excitation (Ex) and emission (Em) values listed are the peak wavelengths associated with the strongest signal for that fluorescence signature. A Fluorescence signatures associated potentially with Coll1 (in perichondrium and muscle). In contrast, the AF source associated with the border of the tesserae center (arrow), peripheral regions, the outer tesseral border (arrowhead) and the cells are unknown. B Several fluorescence signatures likely related with Coll2, based on comparisons with immunostaining. The source of the AF in the pericellular matrix (PCM; Fluo. 1, PMMA, 4D) is unknown (in mammal cartilage, the PCM is comprised of collagen type VI). C Unknown fluorescence signatures distributed in muscle, perichondrium tesserae and matrix of joints and unmineralized cartilage, but absent in cells. D Unknown fluorescence signatures observed in muscle, perichondrium, center-periphery border, and the outer margin of tesserae (arrow and arrowhead in A), and within cells. E The source of this fluorescence signature is unknown, found in tesserae and cells. F Unknown fluo-rescence signature in tesserae and all cells. Pericellular matrix (PCM), Collagen type I (Coll1), Collagen type II (Coll2)
Vol.:(0123456789)
Discover Materials (2021) 1:16 | https://doi.org/10.1007/s43939-021-00015-x Research
1 3
Despite fluorophores having different tissue associations, nearly all fluorophores observed were associated with chon-drocytes. Cell AF is typically due to NADH, FAD+ (flavins) and lipofuscins (lipopigments), cytoplasmic components with distinct spectral profiles [22, 77–79]. Among these components, flavins are the only ones with a spectral signature located within the spectral ranges in this study (λex = 440–470 nm / λem = 480–540 nm; [22]), whereas the other autofluorescent cellular components are associated with lower excitation wavelengths (< 405 nm). Although the source(s) of cellular AF cannot be identified in this study, we note that chondrocytes emitted different signals depending on their location in the tissue. This may be indicative of cells’ production of different components and, ultimately, variation in cell function. This hypothesis is supported by the cells in the upper part of the joint emitting a brighter AF signal than other cells, reinforcing the recent findings of Marconi et al. [67], where joint cells exhibited higher production of Coll2.
5 Conclusions
Tessellated cartilage contains a diversity of fluorophores that emit a native AF signal which, particularly after fixation, embedding and sectioning, is strong enough to image the tissue at a level of detail rivaling backscatter electron microscopy and histology. The AF signal was affected by sample preparation, which should be more deeply explored to clarify how tissue architectures and composition are distorted through common investigation techniques. Images of samples prepared for PMMA showed exceptional preservation of tissue morphology, especially mineralized parts, even allowing identification of active and former mineralization fronts through the localization of calcospherites. AF in tessellated cartilage is mainly emitted in the green–yellow region of the spectrum (480–580 nm), excited with a broad range of wavelengths (405–600 nm), but reacting most strongly to 405 nm excitation (UV). Several fluoro-phores could be associated with Coll1 and Coll2, the main structural collagens of tessellated cartilage; the diverse and specific distributions of other unidentified fluorophores, however, suggest the presence of additional collagens and/or other autofluorescent molecules yet to be characterized in elasmobranch cartilage. The localization of the varied fluorescent signatures allowed description of several tissue morphologies, including a novel organizational scheme of three concentric autofluorescent regions in tesserae and a pericellular matrix surrounding chondrocytes. Tissue AF is therefore demonstrated to be a powerful diagnostic tool to image tessellated cartilage that, with further studies and standardized methods, will allow us to generate composition maps without the need of more demand-ing preparation techniques.
Acknowledgements We would like to acknowledge Alex Campos, Nuria Serna, Susana Calles, Jaime Penadés-Suay, Asociación LAMNA, Javier Guallart, the fishermen of Santa Pola Antonio Bonmatí and Javier Bonmatí for providing the stingray samples, and Mélanie Debiais-Thibaud, Farshid Guilak, Jessica Mansfield, Peter Winlove, Mónica Marro and Marina Cunquero for helpful discussion. We also thank Frauke Leitner for her endless patience in arranging the logistics of the multi-national collaboration.
Authors’ contributions JC was responsible for experiment design, sample preparation, data collection and analysis, made the majority of manu-script figures, and wrote the manuscript. MM was involved in experiment design, sample preparation and data collection with the confocal microscope and wrote for the corresponding sections of the manuscript. AGS and AJ were involved in autofluorescence signal analysis with MCR-ALS and wrote and generated figures for the corresponding manuscript sections. MB was involved in experiment design, was respon-sible for the preparation of paraffin samples and histological stainings and wrote the corresponding manuscript sections. EJG collected the light-sheet microscopy (SPIM) data and wrote for the corresponding sections of the manuscript. PL-A was involved in experiment design and provided access to the Super Resolution Light Microscopy facilities at ICFO. MND supervised the project, was involved in experiment design, participated in data collection and analysis, and wrote the manuscript. All authors edited the manuscript and approved its submission. All authors read and approved the final manuscript.
Funding This project was funded by a CORBEL Open Call for Research Projects grant to MND and JC, funded through the European Union’s Horizon 2020 research and innovation programme under grant agreement No 654248. This funding was used to pay the trips and stays in Barcelona for MND and JC during the experiments at ICFO, the sample shipments and reagents for fixation. AJ and AG-S received funding from the Spanish government through the grant PID 2019-107186B-IOO. This project funded material and personal resources devoted to experimental and data analysis developments linked to hyperspectral image analysis. MM, EJG and PL received funding from Fundació Privada Cellex, Fundación Mig-Puig, from Generalitat de Catalunya through the CERCA program and from the Spanish Ministry of Economy and Competitiveness through the “Severo Ochoa” program for Centres of Excellence in R&D (CEX2019-000910-S) and from Laserlab-Europe EU-H2020 (871124) which partially funded general lab resources including consumables and maintenance of the used equipment. EJG received personnel funding from Ramón y Cajal program (RYC-2015-17935), supporting material and personal resources devoted to experimental developments linked to light-sheet fluorescence microscopy.
Data availability and code availability https:// doi. org/ 10. 17617/3. 4h
Vol:.(1234567890)
Research Discover Materials (2021) 1:16 | https://doi.org/10.1007/s43939-021-00015-x
1 3
Declarations
Ethics approval and consent to participate This study did not involve any experiment on living animals. All experiments were obtained from fisheries by-catch and therefore did not require the approval of an ethic committee.
Consent to publish This study did not involve any experiment with patients and, therefore, did not require any consent to publish.
Competing interests The authors declare no competing interests.
Open Access This article is licensed under a Creative Commons Attribution 4.0 International License, which permits use, sharing, adapta-tion, distribution and reproduction in any medium or format, as long as you give appropriate credit to the original author(s) and the source, provide a link to the Creative Commons licence, and indicate if changes were made. The images or other third party material in this article are included in the article’s Creative Commons licence, unless indicated otherwise in a credit line to the material. If material is not included in the article’s Creative Commons licence and your intended use is not permitted by statutory regulation or exceeds the permitted use, you will need to obtain permission directly from the copyright holder. To view a copy of this licence, visit http:// creat iveco mmons. org/ licen ses/ by/4. 0/.
References
1. Hall BK. Bones and cartilage: developmental and evolutionary skeletal biology. San Diego: Elsevier Academic Press; 2005. 2. Pawlina W, Ross MH. Histology: a text and atlas: with correlated cell and molecular biology. Philadelphia: Lippincott Williams & Wilkins;
2018. 3. Hall BK, Newman SA. Cartilage molecular aspects. Boca Raton: CRC Press; 1991. 4. Bianco P, Cancedda FD, Riminucci M, Cancedda R. Bone formation via cartilage models: the “borderline” chondrocyte. Matrix Biol.
1998;17:185–92. 5. Cole AG, Hall BK. Cartilage is a metazoan tissue; integrating data from nonvertebrate sources. Acta Zool. 2004;85:69–80. 6. Zhang G, Cohn MJ. Hagfish and lancelet fibrillar collagens reveal that type II collagen-based cartilage evolved in stem vertebrates. Proc
Natl Acad Sci. 2006;103:16829–33. 7. Dean MN. Chapter 03052 - Cartilaginous Fish Skeletal Tissues. Amsterdam: Elsevier Ltd.; 2017. 8. Seidel R, Blumer M, Pechriggl E-J, Lyons K, Hall BK, Fratzl P, et al. Calcified cartilage or bone? Collagens in the tessellated endoskeletons
of cartilaginous fish (sharks and rays). J Struct Biol. 2017;200:54–71. 9. Dean MN, Mull CG, Gorb SN, Summers AP. Ontogeny of the tessellated skeleton: insight from the skeletal growth of the round stingray
Urobatis halleri. J Anat. 2009;215:227–39. 10. Kemp N, Westrin SK. Ultrastructure of calcified cartilage in the endoskeletal tesserae of sharks. J Morphol. 1979;160:75–101. 11. Dean MN, Ekstrom L, Monsonego-Ornan E, Ballantyne J, Witten PE, Riley C, et al. Mineral homeostasis and regulation of mineralization
processes in the skeletons of sharks, rays and relatives (Elasmobranchii). Semin Cell Dev Biol. 2015;46:51–67. 12. Jayasankar AK, Seidel R, Hosny A, Weaver JC, Fratzl P, Chen J, et al. Multi-scale modeling and mechanical performance characteriza-
tion of stingray skeleton-inspired tessellations. J Mech Phys Solids. 2020;138:103906. 13. Liu X, Dean MN, Youssefpour H, Summers AP, Earthman JC. Stress relaxation behavior of tessellated cartilage from the jaws of blue
sharks. J Mech Behav Biomed Mater. 2014;29:68–80. 14. Liu X, Dean MN, Summers AP, Earthman JC. Composite model of the shark’s skeleton in bending: a novel architecture for biomimetic
design of functional compression bias. Mater Sci Eng C. 2010;30:1077–84. 15. Seidel R, Jayasankar AK, Shahar R, Dean MN. The multiscale architectures of fish bone and tessellated cartilage and their relation to
function. In: Estrin Y, Bréchet Y, Dunlop J, Fratzl P, editors. Architectured materials in nature and Engineering. 2019. pp. 329–53. 16. Dean MN, Gorb S, Summers AP. A cryoSEM method for preservation and visualization of calcified shark cartilage (and other stubborn
heterogeneous skeletal tissues). Micros Today. 2008;16:48–50. 17. Dean MN, Socha JJ, Hall BK, Summers AP. Canaliculi in the tessellated skeleton of cartilaginous fishes. J Appl Ichthyol. 2010;26:263–7. 18. Chaumel J, Schotte M, Bizzarro JJ, Zaslansky P, Fratzl P, Baum D, et al. Co-aligned chondrocytes: zonal morphological variation and
structured arrangement of cell lacunae in tessellated cartilage. Bone. 2020;134:115264. 19. Seidel R, Roschger A, Li L, Zhang Q, Yin J, Yang T, et al. Mechanical properties of stingray tesserae: high-resolution correlative analysis
of mineral density and indentation moduli in tessellated cartilage. Acta Biomater. 2019;96:421–35. 20. Debiais-Thibaud M. The evolution of endoskeletal mineralisation in Chondrichthyan Fish. In: Johanson Z, Underwood C, Richter M,
editors. Evolution and Development of Fishes. Cambridge: Cambridge University Press; 2018. p. 110–25. 21. Lakowicz JR. Principles of fluorescence spectroscopy. Berlin: Springer Science & Business Media; 2013. 22. Croce AC, Bottiroli G. Autofluorescence spectroscopy and imaging: a tool for biomedical research and diagnosis. Eur J Histochem.
2014;58:2461. 23. Zipfel WR, Williams RM, Christie R, Nikitin AY, Hyman BT, Webb WW. Live tissue intrinsic emission microscopy using multiphoton-
excited native fluorescence and second harmonic generation. Proc Natl Acad Sci U S A. 2003;100:7075–80. 24. Mansfield JC, Peter Winlove C, Moger J, Matcher SJ. Collagen fiber arrangement in normal and diseased cartilage studied by polariza-
tion sensitive nonlinear microscopy. J Biomed Opt. 2008;13: 044020. https:// doi. org/ 10. 1117/1. 29503 18. 25. Seidel R, Lyons K, Blumer M, Zaslansky P, Fratzl P, Weaver JC, et al. Ultrastructural and developmental features of the tessellated
endoskeleton of elasmobranchs (sharks and rays). J Anat. 2016;229:681–702. 26. Omelon S, Georgiou J, Variola F, Dean MN. Colocation and role of polyphosphates and alkaline phosphatase in apatite biomineraliza-
tion of elasmobranch tesserae. Acta Biomater. 2014;10:3899–910. 27. Ashhurst D. The cartilaginous skeleton of an elasmobranch fish does not heal. Matrix Biol. 2004;23:15–22.
Vol.:(0123456789)
Discover Materials (2021) 1:16 | https://doi.org/10.1007/s43939-021-00015-x Research
1 3
28. de Juan A. Multivariate curve resolution for hyperspectral image analysis. Data Handl Sci Technol. 2020;32:115–50. https:// doi. org/ 10. 1016/ b978-0- 444- 63977-6. 00007-9.
29. de Juan A, Piqueras S, Maeder M, Hancewicz T, Duponchel L, et al. Chemometric tools for image analysis. Infrared Raman Spectrosc Imaging. 2014. https:// doi. org/ 10. 1002/ 97835 27678 136. ch2.
30. Gómez-Sánchez A, Marro M, Marsal M, Loza-Alvarez P, de Juan A. 3D and 4D image fusion: coping with differences in spectroscopic modes among hyperspectral images. Anal Chem. 2020;92:9591–602. https:// doi. org/ 10. 1021/ acs. analc hem. 0c007 80.
31. Jaumot J, de Juan A, Tauler R. MCR-ALS GUI 2.0: New features and applications. Chemometr Intell Lab Syst. 2015;140:1–12. https:// doi. org/ 10. 1016/j. chemo lab. 2014. 10. 003.
32. Huisken J, Swoger J, Del Bene F, Wittbrodt J, Stelzer EHK. Optical sectioning deep inside live embryos by selective plane illumination microscopy. Science. 2004;305:1007–9.
33. Olarte OE, Andilla J, Gualda EJ, Loza-Alvarez P. Light-sheet microscopy: a tutorial. Adv Opt Photon, AOP. 2018;10:111–79. 34. Stefaniuk M, Gualda EJ, Pawlowska M, Legutko D, Matryba P, Koza P, et al. Light-sheet microscopy imaging of a whole cleared rat
brain with Thy1-GFP transgene. Sci Rep. 2016;6:28209. 35. Klingberg A, Hasenberg A, Ludwig-Portugall I, Medyukhina A, Männ L, Brenzel A, et al. Fully automated evaluation of total glomerular
number and capillary tuft size in nephritic kidneys using lightsheet microscopy. J Am Soc Nephrol. 2017;28:452–9. 36. Hunziker EB, Lippuner K, Shintani N. How best to preserve and reveal the structural intricacies of cartilaginous tissue. Matrix Biol.
2014;39:33–43. 37. Muldrew K, Hurtig M, Novak K, Schachar N, McGann LE. Localization of freezing injury in articular cartilage. Cryobiology. 1994;31:31–8. 38. Muldrew K, Novak K, Yang H, Zernicke R, Schachar NS, McGann LE. Cryobiology of articular cartilage: ice morphology and recovery
of chondrocytes. Cryobiology. 2000;40:102–9. 39. Szarko M, Muldrew K, Bertram JE. Freeze-thaw treatment effects on the dynamic mechanical properties of articular cartilage. BMC
Musculoskelet Disord. 2010;11:231. 40. Peters AE, Comerford EJ, Macaulay S, Bates KT, Akhtar R. Micromechanical properties of canine femoral articular cartilage following
multiple freeze-thaw cycles. J Mech Behav Biomed Mater. 2017;71:114–21. 41. Manning HB, Nickdel MB, Yamamoto K, Lagarto JL, Kelly DJ, Talbot CB, et al. Detection of cartilage matrix degradation by autofluo-
rescence lifetime. Matrix Biol. 2013;32:32–8. 42. Leischner U, Schierloh A, Zieglgänsberger W, Dodt H-U. Formalin-induced fluorescence reveals cell shape and morphology in biologi-
cal tissue samples. PLoS One. 2010;5:e10391. 43. Collins JS, Goldsmith TH. Spectral properties of fluorescence induced by glutaraldehyde fixation. J Histochem Cytochem.
1981;29:411–4. 44. Capasso L, D’Anastasio R, Guarnieri S, Viciano J, Mariggiò M. Bone natural autofluorescence and confocal laser scanning microscopy: pre-
liminary results of a novel useful tool to distinguish between forensic and ancient human skeletal remains. Forensic Sci Int. 2017;272:87–96. 45. Bachman CH, Ellis EH. Fluorescence of bone. Nature. 1965;206:1328–31. 46. Valiev RR, Kalugina YN, Cherepanov VN. Theoretical investigation of fluorescence properties of EDTA and DTPA substituted tetraphenyl-
porphyrin molecules. Spectrochim Acta A Mol Biomol Spectrosc. 2012;99:122–5. 47. Prentice AI. Autofluorescence of bone tissues. J Clin Pathol. 1967;20:717–9. 48. Armstrong WG, Horsley HJ. Isolation of fluorescent components from ox-bone human dentine and gelatin. Nature. 1966;211:981. 49. Laifer LI, O’Brien KM, Stetz ML, Gindi GR, Garrand TJ, Deckelbaum LI. Biochemical basis for the difference between normal and athero-
sclerotic arterial fluorescence. Circulation. 1989;80:1893–901. 50. Hawkins KR, Yager P. Nonlinear decrease of background fluorescence in polymer thin-films–a survey of materials and how they can
complicate fluorescence detection in μTAS. Lab Chip. 2003;3:248–52. 51. Araujo GR, Pollmann T, Ulrich A. Photoluminescence response of acrylic (PMMA) and polytetrafluoroethylene (PTFE) to ultraviolet light.
Eur Phys J C. 2019;79:653. 52. Mansfield JC, Peter WC. A multi-modal multiphoton investigation of microstructure in the deep zone and calcified cartilage. J Anat.
2012;220:405–16. 53. Boyne PJ. Study of the chronologic development and eruption of teeth in elasmobranchs. J Dent Res. 1970;49:556–60. 54. Applegate SP. A survey of shark hard parts. In: Gilbert PW, Matthewson RF, Rail DP, editors. Sharks, Skates and Rays. 1967. p. 37–67. 55. Eames BF, Allen N, Young J, Kaplan A, Helms JA, Schneider RA. Skeletogenesis in the swell shark Cephaloscyllium ventriosum. J Anat.
2007;210:542–54. 56. Fauch L, Palander A, Dekker H, Schulten EA, Koistinen A, Kullaa A, et al. Narrowband-autofluorescence imaging for bone analysis. Biomed
Opt Express. 2019;10:2367–82. 57. Ørvig T. Histologic studies of Placoderms and fossil Elasmobranchs. I: The endoskeleton, with remarks on the hard tissues of lower ver-
tebrates in general. Arkiv för Zoologi. 1951;2:321–454. 58. Seidel R, Blumer M, Zaslansky P, Knötel D, Huber DR, Weaver JC, et al. Ultrastructural, material and crystallographic description of endo-
phytic masses - A possible damage response in shark and ray tessellated calcified cartilage. J Struct Biol. 2017;198:5–18. 59. Takagi M, Parmley RT, Denys FR, Yagasaki H, Toda Y. Ultrastructural cytochemistry of proteoglycans associated with calcification of shark
cartilage. Anat Rec. 1984;208:149–58. 60. Gorski JP. Biomineralization of bone: a fresh view of the roles of non-collagenous proteins. Front Biosci. 2011;16:2598–621. 61. Omelon SJ, Grynpas MD. Relationships between polyphosphate chemistry, biochemistry and apatite biomineralization. Chem Rev.
2008;108:4694–715. 62. Reznikov N, Steele JAM, Fratzl P, Stevens MM. A materials science vision of extracellular matrix mineralization. Nat Rev Mater. 2016;1:16041. 63. Ali SY, Yousuf Ali S, Wisby A. Mitochondrial granules of chondrocytes in cryosections of growth cartilage. Am J Anat. 1975;144:243–8.
https:// doi. org/ 10. 1002/ aja. 10014 40209. 64. Peignoux-Deville J, Lallier F, Vidal B. Evidence for the presence of osseous tissue in dogfish vertebrae. Cell Tissue Res. 1982;222:605–14. 65. Hall BK. Bones and cartilage. Cambridge: Academic Press; 2014.
Vol:.(1234567890)
Research Discover Materials (2021) 1:16 | https://doi.org/10.1007/s43939-021-00015-x
1 3
66. Enault S, Muñoz DN, Silva WTAF, Borday-Birraux V, Bonade M, Oulion S, et al. Molecular footprinting of skeletal tissues in the catshark Scyliorhinus canicula and the clawed frog Xenopus tropicalis identifies conserved and derived features of vertebrate calcification. Front Genet. 2015;6:1–14.
67. Marconi A, Hancock-Ronemus A, Andrew Gillis J. Adult chondrogenesis and spontaneous cartilage repair in the skate, Leucoraja erinacea. eLife. 2020. https:// doi. org/ 10. 7554/ elife. 53414.
68. Makarov MS, Storozheva MV, Borovkova NV. Collagen Fiber Autofluorescence Level in Evaluating the Biological Properties of Tissue Grafts. Coвpeмeнныe тexнoлoгии в мeдицинe. 2017;9 2 (eng). https:// cyber lenin ka. ru/ artic le/n/ colla gen- fiber- autofl uore scence- level- in- evalu ating- the- biolo gical- prope rties- of- tissue- grafts. Accessed 22 Jul 2020.
69. Egerbacher M, Helmreich M, Mayrhofer E, Böck P. Mineralisation of the hyaline cartilage in the small-spotted dogfish Scyliorhinus canicula L. Scr Med. 2006;79:199–212.
70. Guilak F, Alexopoulos LG, Upton ML, Youn I, Choi JB, Cao L, et al. The pericellular matrix as a transducer of biomechanical and biochemical signals in articular cartilage. Ann N Y Acad Sci. 2006;1068:498–512.
71. Poole CA, Flint MH, Beaumont BW. Chondrons in cartilage: ultrastructural analysis of the pericellular microenvironment in adult human articular cartilages. J Orthop Res. 1987;5:509–22.
72. Chen C, Tambe DT, Deng L, Yang L. Biomechanical properties and mechanobiology of the articular chondrocyte. Am J Physiol Cell Physiol. 2013;305:C1202–8.
73. Wilusz RE, Sanchez-Adams J, Guilak F. The structure and function of the pericellular matrix of articular cartilage. Matrix Biol. 2014;39:25–32. 74. Poole CA, Ayad S, Gilbert RT. Chondrons from articular cartilage. V. Immunohistochemical evaluation of type VI collagen organisation in
isolated chondrons by light, confocal and electron microscopy. J Cell Sci. 1992;103(Pt 4):1101–10. 75. Mansfield JC, Peter Winlove C, Knapp K, Matcher SJ. Imaging articular cartilage using second harmonic generation microscopy. Multipho-
ton Microsc Biomed Sci VI. 2006. https:// doi. org/ 10. 1117/ 12. 643830. 76. Yeh AT, Hammer-Wilson MJ, Van Sickle DC, Benton HP, Zoumi A, Tromberg BJ, et al. Nonlinear optical microscopy of articular cartilage.
Osteoarthr Cartil. 2005;13:345–52. 77. Surre J, Saint-Ruf C, Collin V, Orenga S, Ramjeet M, Matic I. Strong increase in the autofluorescence of cells signals struggle for survival.
Sci Rep. 2018. https:// doi. org/ 10. 1038/ s41598- 018- 30623-2. 78. Jahn K, Buschmann V, Hille C. Simultaneous fluorescence and phosphorescence lifetime imaging microscopy in living cells. Sci Rep. 2015.
https:// doi. org/ 10. 1038/ srep1 4334. 79. Andersson H, Baechi T, Hoechl M, Richter C. Autofluorescence of living cells. J Microsc. 2002;191:1–7. https:// doi. org/ 10. 1046/j. 1365- 2818.
1998. 00347.x. 80. Tauler R. Multivariate curve resolution applied to second order data. Chemometrics Intellig Lab Syst. 1995;30:133–46. 81. Tauler R, Maeder M, de Juan A. Multiset data analysis: extended multivariate curve resolution. Compr Chemometr. 2020. https:// doi. org/
10. 1016/ b978-0- 12- 409547- 2. 14702-x. 82. Golub GH, Van Loan CF. Matrix computations. Baltimore: JHU Press; 2012. 83. Windig W, Guilment J. Interactive self-modeling mixture analysis. Anal Chem. 1991;63:1425–32.
Publisher’s Note Springer Nature remains neutral with regard to jurisdictional claims in published maps and institutional affiliations.
Related Documents