Autofluorescence Characteristics of Normal Foveas and Reconstruction of Foveal Autofluorescence from Limited Data Subsets R. Theodore Smith, Jan P. Koniarek, Jackie Chan, Takayuki Nagasaki, Janet R. Sparrow, and Kevin Langton Department of Ophthalmology, Columbia University, New York, New York. Abstract Purpose—To develop mathematical and geometric models of the nonuniform autofluorescence (AF) patterns of foveas of normal subjects and to reconstruct these models from limited subsets of data. Methods—Confocal scanning laser ophthalmoscope (cSLO) AF fundus images of normal maculae were obtained from both eyes of 10 middle-aged subjects. They were filtered and contrast enhanced, to obtain elliptical isobars of equal gray levels (GLs) and determine the isobars’ resolutions, eccentricities, and angles of orientation. The original image data were fit with a mathematical model of elliptic quadratic polynomials in two equal zones: the center and the remaining annulus. Results—The AF images segmented into nested concentric GL isobars with GLs that increased radially from the least-fluorescent center. The mean isobar resolution was 31 ± 7 μm. The geometric eccentricity of the ellipses increased from 0.42 ± 0.12 centrally to 0.52 ± 0.14 peripherally (P = 0.0005), with mean axes of orientation peripherally 97.12 ± 15.46°. The model fits to the complete image data had mean absolute normalized errors ranging from 3.6% ± 3.7% to 7.3% ± 7.1%. The model fits to small subsets (1% to 2% of total image data) had mean absolute errors ranging from 3.7% ± 3.8% to 7.3% ± 7.2%. Conclusions—Normal AF fundus images show finely resolved, concentric, elliptical foveal patterns consistent with the anatomic distribution of fluorescent lipofuscin, light-attenuating macular pigment (MP), cone photopigment, and retinal pigment epithelial (RPE) pigment in the fovea. A two- zone, elliptic, quadratic polynomial model can accurately model foveal data. This model may be useful for image analysis and for automated segmentation of pathology. There is increasingly strong interest in noninvasive analysis of retinal disease, especially as related to age-related macular degeneration (AMD), the leading cause of vision impairment and blindness in the Western world. 1,2 One of the major methods of such analysis is through the use of the confocal laser scanning ophthalmoscope (cSLO), which in its autofluorescence (AF) mode can record the complex signal predominantly from autofluorescent lipofuscin granules in the RPE. 3-9 These fluoresce strongly in response to 488-nm laser light, and abnormalities of their distribution are leading indicators of the severity of AMD. 10-13 Copyright © Association for Research in Vision and Ophthalmology Corresponding author: R. Theodore Smith, Columbia University, 635 W 165 Street, Suite 314, New York, NY 10032; [email protected].. Disclosure: R.T. Smith, None; J.P. Koniarek, None; J. Chan, None; T. Nagasaki, None; J.R. Sparrow, None; K. Langton, None NIH Public Access Author Manuscript Invest Ophthalmol Vis Sci. Author manuscript; available in PMC 2009 September 30. Published in final edited form as: Invest Ophthalmol Vis Sci. 2005 August ; 46(8): 2940–2946. doi:10.1167/iovs.04-0778. NIH-PA Author Manuscript NIH-PA Author Manuscript NIH-PA Author Manuscript

Welcome message from author
This document is posted to help you gain knowledge. Please leave a comment to let me know what you think about it! Share it to your friends and learn new things together.
Transcript
Autofluorescence Characteristics of Normal Foveas andReconstruction of Foveal Autofluorescence from Limited DataSubsets
R. Theodore Smith, Jan P. Koniarek, Jackie Chan, Takayuki Nagasaki, Janet R. Sparrow, andKevin LangtonDepartment of Ophthalmology, Columbia University, New York, New York.
AbstractPurpose—To develop mathematical and geometric models of the nonuniform autofluorescence(AF) patterns of foveas of normal subjects and to reconstruct these models from limited subsets ofdata.
Methods—Confocal scanning laser ophthalmoscope (cSLO) AF fundus images of normal maculaewere obtained from both eyes of 10 middle-aged subjects. They were filtered and contrast enhanced,to obtain elliptical isobars of equal gray levels (GLs) and determine the isobars’ resolutions,eccentricities, and angles of orientation. The original image data were fit with a mathematical modelof elliptic quadratic polynomials in two equal zones: the center and the remaining annulus.
Results—The AF images segmented into nested concentric GL isobars with GLs that increasedradially from the least-fluorescent center. The mean isobar resolution was 31 ± 7 μm. The geometriceccentricity of the ellipses increased from 0.42 ± 0.12 centrally to 0.52 ± 0.14 peripherally (P =0.0005), with mean axes of orientation peripherally 97.12 ± 15.46°. The model fits to the completeimage data had mean absolute normalized errors ranging from 3.6% ± 3.7% to 7.3% ± 7.1%. Themodel fits to small subsets (1% to 2% of total image data) had mean absolute errors ranging from3.7% ± 3.8% to 7.3% ± 7.2%.
Conclusions—Normal AF fundus images show finely resolved, concentric, elliptical fovealpatterns consistent with the anatomic distribution of fluorescent lipofuscin, light-attenuating macularpigment (MP), cone photopigment, and retinal pigment epithelial (RPE) pigment in the fovea. A two-zone, elliptic, quadratic polynomial model can accurately model foveal data. This model may beuseful for image analysis and for automated segmentation of pathology.
There is increasingly strong interest in noninvasive analysis of retinal disease, especially asrelated to age-related macular degeneration (AMD), the leading cause of vision impairmentand blindness in the Western world.1,2 One of the major methods of such analysis is throughthe use of the confocal laser scanning ophthalmoscope (cSLO), which in its autofluorescence(AF) mode can record the complex signal predominantly from autofluorescent lipofuscingranules in the RPE.3-9 These fluoresce strongly in response to 488-nm laser light, andabnormalities of their distribution are leading indicators of the severity of AMD.10-13
Copyright © Association for Research in Vision and OphthalmologyCorresponding author: R. Theodore Smith, Columbia University, 635 W 165 Street, Suite 314, New York, NY 10032;[email protected]: R.T. Smith, None; J.P. Koniarek, None; J. Chan, None; T. Nagasaki, None; J.R. Sparrow, None; K. Langton, None
NIH Public AccessAuthor ManuscriptInvest Ophthalmol Vis Sci. Author manuscript; available in PMC 2009 September 30.
Published in final edited form as:Invest Ophthalmol Vis Sci. 2005 August ; 46(8): 2940–2946. doi:10.1167/iovs.04-0778.
NIH
-PA Author Manuscript
NIH
-PA Author Manuscript
NIH
-PA Author Manuscript
However, these images are not determined by the AF of lipofuscin alone, a fact that complicatestheir interpretation. One complicating factor is the absorption of the 488-nm light by themacular pigment (MP), especially the carotenoids lutein and zeaxanthin.14,15 This absorptionis greatest in the center of the macula, which on fundus photographs and under visualobservation is characterized by strong yellow color.16 There is similar absorption of the 488-nm light by melanin granules in the RPE,17 which also have greater density centrally. Finally,photopigments, particularly cone photopigments in the fovea, will attenuate the signal if theyare not completely bleached.
AF images obtained with the SLO from normal retinas display characteristic nonuniform,elliptical patterns centered on the macula. These patterns are darker in the center, indicatinglower fluorescence (hypofluorescence) resulting from greater light absorption by theattenuating pigments, and are lighter (hyperfluorescent) peripherally. Depending on theirappearance, they have been classified by one group of investigators,18 as belonging to foursubtypes (phenotypes) based on relative size and intensities of the hypo- and hyperfluorescentregions. To complicate the matter further, the overall patterns are not permanent, but changewith age. AF increases in older individuals, with increased lipofuscin at the posterior pole, atleast to age 70,19,20 whereas the measured ratio of foveal AF to maximum AF intensity hasbeen reported not to vary with age.3 Quantification of these patterns has so far been lackingand is needed to make progress in assessment of retinal disease.
At present, in the clinical setting, lesions of AMD are manually graded on fundus photographsby trained graders who use semiquantitative scales.21-26 Clinical evaluations of increased AFand decreased AF lesions are likewise qualitative in character.27 Manual grading has severaldrawbacks, such as poor repeatability and extensive and time-consuming training necessaryfor adequate proficiency. Because of these drawbacks, there has been a great deal of interestin developing automated digital techniques for quantification of macular disease.28-33 Accuratemathematical models of normal images could form the basis for such techniques.
As an initial step in this direction, the two-dimensional structure of normal foveal AF imageswas examined in two distinctly different but related ways. In the first, a pattern of gray-level(GL) isobars in the actual image data was determined by applying standard image-processingtechniques of filtering and contrast enhancement. The resultant patterns, which were found tobe approximately concentric and elliptical, were then analyzed to determine geometricproperties of eccentricity, axis of orientation, and resolution. This was followed by the secondstep, the development of a mathematical model that could accurately represent the image data.Because the first analysis showed approximate elliptical contours in the data, the model chosenwas based on quadratic polynomial functions, which mathematically generate precise ellipticalcontours in two dimensions. The mathematical model was then tested for accuracy of fit to realimage data as well as data reconstruction from small data subsets.
MethodsSubjects and Image Acquisition
We examined both eyes of 10 normal white and Hispanic middle-aged subjects 32 to 64 yearsof age (seven women aged 32, 36, 50, 53, 56, 62, and 64 years, and three men aged 36, 56 and59 years). All subjects had normal results in dilated retina examinations. Slit lamp examinationswere performed to ensure that no lens opacities were present that would result in abnormalabsorption of laser light by the crystalline lens. Informed consent was obtained from allsubjects, and the study was performed with institutional review board approval and accordingto the tenets of the Declaration of Helsinki. After pupillary dilation, fundus AF images wererecorded with a cSLO (model HRA/HRA2; Heidelberg Engineering, Dossenheim, Germany).This instrument uses blue laser light at 488 nm for illumination and a barrier filter at 500 nm
Smith et al. Page 2
Invest Ophthalmol Vis Sci. Author manuscript; available in PMC 2009 September 30.
NIH
-PA Author Manuscript
NIH
-PA Author Manuscript
NIH
-PA Author Manuscript
to limit the captured light to autofluorescent structures. The radiant power through the pupil is180 μW, giving a retinal irradiance of 227 μW/cm2 for a 30° square field. The time foracquisition was approximately 15 to 30 seconds, as would be normal in the clinical setting. Aswill be discussed, cone photopigment bleaching was incomplete after this exposure.
The AF images consisted of bit-mapped laser scans, 512 × 512 pixels in size, centered on themacula. The gain setting was the same for each scan. Each image was the average of three tosix raw scans automatically composed by the SLO software. The scans were registeredprecisely and summed to increase the signal-to-noise ratio, and then a histogram stretch wasapplied to yield images that could be visualized directly (the “normalized” scan). Thesestretches were close to, but not strictly, linear transformations, and the stretch factor variedbetween images depending on the dynamic range of the raw scans.
Image PreprocessingAll images had a scale of approximately 15 μm per pixel. For processing and analysis theimages were imported into image-analysis software (Photoshop 5.5; Adobe Systems Inc., SanJose, CA) as bit-mapped files consisting of 256 GLs for each pixel. Local image variation wasevaluated by calculating the image standard deviations in small (240 × 240-μm) boxes. Wefound that, on this small scale, the images were all somewhat noisier than those reported byvon Ruckmann et al.5 After a Gaussian filter of 36-μm radius was applied to the entire image,the standard deviations in such boxes were no more than five GLs, similar to the imagesanalyzed by von Ruckmann et al.5 This filter had no noticeable effect on larger image featuresor isobar patterns, as defined later. The image was then cropped to a 100 pixels square (1500-μm2) centered on the point of lowest foveal fluorescence, and the fovea was defined as theenclosed circle 1500 μm in diameter. All subsequent analyses were performed on thesepreprocessed foveal images. A typical image of the area of interest is shown in Figure 1.
Image AnalysisLine Scans—For the 20 eyes, GLs were recorded from horizontal and vertical line scans of100-pixel length and 1-pixel width through the center of the fovea. These data were normalizedby subtracting the lowest GL (foveal center) from each scan. The means of the 10 horizontaland vertical scan data of the right eyes were computed at each point to give mean right eyehorizontal and vertical scans. Mean left eye horizontal and vertical scans were computedsimilarly. We also separately normalized the original line scan data by dividing by the lowestGL from each scan. A separate set of mean normalized right eye and left eye scans was likewisecalculated. For each of these scans, the central minimum was unity and the peripheral maximumwas the peak-to-trough (peripheral maximum/foveal minimum) ratio. Normalization bydivision largely removed the effect of the histogram stretch on the scan profile introduced bythe HRA software, to the extent that it was linear.
Isobar Pattern Generation—Pattern generation is shown in Figure 2 in two typical normalpatients. The preprocessed foveal images are shown on Figures 2A and 2D. The foveal datawere then further filtered (Gaussian blur, 180-μm radius) to establish a regular shading patternof GL isobars, each isobar having a single GL. This filter radius was determined empiricallyto provide the most useful patterns for analysis. In practice, the fovea then segmented into 20to 30 GL isobars, each separated from its neighbor by 1 unit step and each becomingprogressively more hyperfluorescent (lighter) from the center to the periphery. This pattern ofisobars could now be studied without further digital manipulation. However, since unit stepsof GL are imperceptible to the human eye, a contrast-enhancing histogram stretch (the “AutoLevels” feature in Photoshop) was applied to make the patterns clear to the human observer,as well as for illustration (Figs. 2B, 2E). Once contrast enhanced, the isobars were geometricallyunchanged as sets, but neighboring isobars were separated by several units of GL. It is important
Smith et al. Page 3
Invest Ophthalmol Vis Sci. Author manuscript; available in PMC 2009 September 30.
NIH
-PA Author Manuscript
NIH
-PA Author Manuscript
NIH
-PA Author Manuscript
to note that, after this step, absolute GLs are not meaningful. Some characteristic individualisobars, still too fine to be discernible in these illustrations, are highlighted for emphasis inFigures 2C and 2F.
Our purpose was to find the best geometric description of the isobars from our data. Inparticular, we wanted to determine whether they followed the overall oval geometry of theclinically apparent luteal and RPE pigment distribution and the fluorescent lipofuscin. Hence,we postulated that theoretical isobar patterns are concentric ellipses with GLs increasingradially from the hypofluorescent center. We anticipated that the real patterns would be neitherprecisely elliptical nor strictly concentric, but very close to both, unless retinal vessels or focalabnormalities impinged on them.
Determination of Isobar Resolution and EccentricitiesThe gradient of GLs in the foveal region is described quantitatively as the isobar resolution, ameasure defined as the radius of the fovea, nominally 750 μm, divided by the number of isobarsin the foveal pattern. This definition is the equivalent to the average width of an isobar, andhence is a measure of how finely the isobars divide the fovea.
For each image, two isobars were selected for eccentricity measurement. The first, or inner,was chosen to have approximately a 500-μm diameter (for example, the inner isobars in Figs.2C, 2F). The second, or outer, was the largest complete isobar in the pattern. The major andminor axes, orientations, and eccentricities of the two isobars were calculated with themathematical morphology software from an image-analysis toolkit (MatLab, ver. 5.5; theMathWorks, Natick, MA). This software calculates a best-fit bounding ellipse for any object,together with these associated geometric quantities for that ellipse, but does not provide ameasure of goodness of fit. We therefore elected to illustrate the geometric quantities andgoodness of fit in four characteristic examples (Fig. 3). It was immediately apparent that theinner isobars were all nearly circular and therefore lacked meaningful angular orientation. Theangular orientations of the major axes of the outer isobars were recorded.
The Mathematical ModelWe constructed models of foveal AF in two subregions: an inner region of 750 μm in diameterand the outer annulus of 1500 μm outer diameter. Two regions were chosen because, from theappearance of the AF patterns, it was obvious that a steeper gradient of AF existed in the innerregion and a less steep gradient in the outer region. The data in each region were fit with aquadratic polynomial, and the transition between the regions was smoothed with a radial splinefunction. Average absolute errors and standard deviations were calculated as a percentage ofthe total gray-scale range of the preprocessed foveal data. These data had noise reduced by asmall-scale filter, as described, but are not the large-scale filtered data used to generate theisobars. The complexity of the data is evident in Figure 4, which shows an example of fittingthe model to a particular foveal image (Figs. 4A, 4B), using the model to reconstruct the imagedata from a uniform grid subset of this data (Figs. 4C, 4D), and using the model to reconstructthe image data from a nonuniform grid subset of the data (Figs. 4E, 4F).
Specifically, the preprocessed AF GLs were considered to be functions of their pixelcoordinates (x, y) in the x–y plane. The general quadratic has the following form:
(1)
For each image, a unique quadratic in two variables was fit by custom software (developed inMathematica 5.0; Wolfram Research Inc., Champaign, IL), applying least-squares methods to
Smith et al. Page 4
Invest Ophthalmol Vis Sci. Author manuscript; available in PMC 2009 September 30.
NIH
-PA Author Manuscript
NIH
-PA Author Manuscript
NIH
-PA Author Manuscript
the AF data set in each subregion to optimize the six coefficients (a, b, c, d, e, constant). Thus,a quadratic, q1, was fit to the data in the inner region and a second quadratic, q2, to the data inthe annulus (for a total of 12 coefficients). To create a smooth fit at the boundary of the tworegions, we used a sigmoidal radial cubic spline function to interpolate the quadratics. Anexample of a foveal AF image and the associated contour graph of the smooth model fit to thisfoveal data are displayed in Figures 4A and 4B.
The accuracy of each model fit to the AF data was determined as follows: the absolute valuesof the errors at each (x, y) point in two dimensions were treated as a single data set E. We thencalculated the mean and SD of E and scaled these results by dividing by the net GL range ofthe original data to give the mean error ± SD as a percentage of the data range.
To determine whether the model could reconstruct the foveal image data from a limited amountof data, such as from images containing pathology that obscures part of the background, a gridof evenly spaced pixel data was taken from the two regions (as in Fig. 4C). It comprised 1.1%of the pixels in the annulus and 1.7% of the pixels in the inner disc. The two-zone quadraticmodel was fit for each image to this grid of data. The resultant model, shown for a particularimage in Figure 4D, was then compared to the complete AF data set and errors calculated asbefore.
We also selected a random subset of data points from the two regions (Fig. 4E). It comprised1.1% of the pixels in the annulus and 2.1% of the pixels in the inner disc. The two-zonequadratic model was again fit for each image to this data subset. The resultant model, shownfor a particular image in Figure 4F, was then compared with the complete AF data set anderrors calculated as before.
ResultsThe GL isobars in AF scans of 20 normal retinas from 10 individuals formed a set of concentric,approximately elliptical annuli, with the GL of fluorescence increasing outward along anyradius from the least-fluorescent central disc. The annular isobars were all complete (withoccasional discontinuities limited to a few pixels) until the boundary of the foveal region wasreached, when they became partial annuli and ultimately progressively hyperfluorescent arcs(see Fig. 2B). The isobars were more circular centrally and became more elliptical toward theperiphery of the fovea, with the geometric eccentricity of the patterns increasing from 0.42 ±0.12 centrally to 0.52 ± 0.14 peripherally (P = 0.0005). The axes of orientation of the outerellipses clustered around 90°. The mean axis of orientation was 97 ± 15°, with 17 of 20 within90 ± 30°. The average foveal isobar resolution was 31 ± 7 μm (range, 21– 47 μm). The isobarresolutions centrally were even finer, usually ∼15 μm (1 pixel) in width. We did not find anymajor differences in the patterns themselves or their isobar resolutions when analyzedaccording to age, race, or sex in this small sample.
The AF range (difference between the maximum and the minimum GL) varied from 30 to 82(mean, 74 ± 11). The minimum AF, by definition, was always at the foveal center. The arcs ofhighest fluorescence were always in the temporal quadrant. This finding was confirmedquantitatively by vertical and horizontal line scans of 10 left and 10 right eyes. When the linescans were normalized by subtracting the lowest GL, the mean GL temporally for left eyes wasgreater than nasally, inferiorly, or superiorly for all radii greater than 510 μm (at or above the0.05 significance level, by two-tailed t-test). A similar finding of elevated mean GLs temporallyheld for right eyes, with radii greater than 585 μm. When the line scans were renormalized bydividing by the lowest GL, the results were almost identical. The mean GL ratio temporally inthe left eyes was significantly higher than nasally with radii greater than 515 μm, and in righteyes, with radii greater than 600 μm. There were no significant differences between GL ratios
Smith et al. Page 5
Invest Ophthalmol Vis Sci. Author manuscript; available in PMC 2009 September 30.
NIH
-PA Author Manuscript
NIH
-PA Author Manuscript
NIH
-PA Author Manuscript
superiorly and inferiorly in the left or right eyes, or between left eyes temporally comparedwith right eyes. In our 20 eyes, the maximum GL ratios were always temporal and ranged from1.2 to 2.6 (mean, 1.72 ± 0.37). The means of 10 horizontal and vertical line scans, normalizedby division, through the foveas of left and right eyes are shown in Figure 5.
The patterns generated by the model fit to subsets of data are also strikingly similar to thenormal foveal patterns (compare Figs. 2B and 4B). Despite the simplicity of the modelcompared with the complexity of the raw data, the mean absolute errors of the fits for eachsubject (as defined in the mathematical model in Methods) were only small percentages of thenet gray-scale ranges. For example, in Figure 4, the mean absolute error of the model for thisimage was 3.4 GLs (normalized to 4.2% of the net image range of 80). The model fits to thecomplete image data for all subjects had mean absolute normalized errors ranging from thoseof the best-fit image, 3.6% ± 3.7%, to those of the worst-fit image, 7.3% ± 7.1%. The modelfits to the grid subsets of image data had mean absolute errors ranging from 3.7% ± 3.8% to7.3% ± 7.2%, and from random data subsets the range was 3.2% ± 3.4% to 9.1% ± 9.2%.
DiscussionWe have demonstrated that the geometry of normal AF images in the fovea exhibits a set ofconcentric elliptical isobars of isofluorescence, with the GL of fluorescence increasing outwardalong any radius from the least-fluorescent, darker center. The elliptically shaped patterns inthe image data tended to be more circular centrally and more vertically elongated peripherally.The highest GLs were always temporal, consistent with the findings of Delori et al.19 A simplenoise filter and contrast enhancement revealed geometry of convex GL isobars, with isobarresolutions averaging 30 μm in the periphery, but in the central foveal area closer to single-pixel resolution (15 μm).
A model of foveal AF data was constructed from a set of two quadratic polynomials. For eachimage, the coefficients (12 in all) of the quadratics were individually determined by least-squares methods, and accurate fits were obtained in all cases. The robustness of the model wasattested by the fact that it could also be used to reconstruct foveal data from small grid subsetsof data (or randomly chosen subsets of data) comprising less than 2% of the entire image, withaverage errors 3% to 7% of net image range (slightly more in the random case). In practice, ina pathologic situation one would generally have access to a much larger subset of normalbackground for reconstruction, and so these data represent an extreme test of the model.Further, the fact that such small fractions of image data yielded such similar and accurate modelreconstructions suggests that the AF signal itself, when devoid of noise, has a similarunderlying geometric simplicity which can be captured by knowing its values at a small numberof points. Likewise, the extraordinary geometric regularity and precise isobar resolutions ofthe foveal AF patterns demonstrated in the current study suggest that the normal spatialvariations of luteal, RPE, and cone pigment—the main absorbers of blue light in the fovea—and lipofuscin itself, the source of the AF signal, have similar circular to elliptic regularity andequally fine resolution.
These AF patterns are in fact consistent with the known anatomic distributions of thesepigments. The MP is a mixture of the carotenoids lutein and zeaxanthin and has a wellcharacterized optical density spectrum, with peak absorption at 457.8 nm.14 The distributionof this pigment peaks centrally and tapers radially. Its anatomic density drops to half-maximumwithin a diameter of 500 to 600 μm, reaches a quarter-maximum at a diameter of approximately1000 μm, and from there tapers slowly outward to a low constant level.34 There is considerablevariation in the central optical density (compared with an eccentric reference point) of MP,reported to range from 0.21 to 0.77 (median 0.53) density units in one group of seven normalsubjects at the peak absorption.14 Another group found an MP density of 0.0 to 0.64 (mean,
Smith et al. Page 6
Invest Ophthalmol Vis Sci. Author manuscript; available in PMC 2009 September 30.
NIH
-PA Author Manuscript
NIH
-PA Author Manuscript
NIH
-PA Author Manuscript
0.32 ± 0.24) in 34 normal control subjects aged 20 to 65 years.35 Because the relative opticaldensity of macular pigment at 488 nm is approximately 0.8, the corresponding central opticaldensities of the former subjects would range from 0.17 to 0.62 (median, 0.42) density units,and in the latter from 0.0 to 0.51 (mean, 0.25). If we estimate the densities at 750-μm radiusto be a quarter of these values,34 then the change in density from the center to 750 μm wouldrange from 0.13 to 0.47 (median, 0.32) in the former group, and from 0.0 to 0.38 (mean, 0.19)in the latter. The corresponding AF images would thus have central minima deeper by factorsranging from 1.3 to 3.0 (median, 2.1) or from 1.0 to 2.4 (mean, ∼1.5).
Photoreceptor photopigments are incompletely bleached after an approximate 15- to 30-secondexposure to the HRA in AF mode (retinal irradiance, 227 μW/cm2) and thus contribute to thepatterns obtained in clinical image acquisition. The main contribution is from cones (37%bleached at 15 seconds, 56% at 30 seconds), rather than rods (density 0.3 at 12°, negligiblecentrally, 78% bleached after 15 seconds).36 With a cone density of 0.8 density units centrallyat the absorption peak of 550 nm, one can calculate (for cone absorption at 488 nm equal to0.49 relative to 550 nm) that the optical density of cone photopigment to 488 nm centrally after15 to 30 seconds is 0.25 to 0.17 density units. The cone density at the foveal periphery(approximately 2.5°), by two-way density measurements, is approximately 0.25,37 and so thechange in optical density from center to periphery is approximately 0.55 density units. Afterbleaching and correction for absorption at 488 nm, the difference in optical density betweencenter and periphery would thus range from 0.17 (15 seconds) to 0.12 (30 seconds). Thesedensity differences would give deeper minima (ratio of peak to trough) in measured AF at thecenter relative to the periphery by factors of 1.5 and 1.3, respectively, and a greater gradientcentrally than if bleaching were complete. For rods, the corresponding optical densitymaximum would be 0.06 density units at 12° to 15° from the fovea, negligible in the foveaitself. The cone bleaching in clinical settings is thus likely to be somewhat variable andnecessarily incomplete, because, even after 90 seconds of exposure, the cone bleachingplateaus at 78%. This yields a deeper central minimum in AF by a factor of 1.15. If the conesare contributing a factor of 1.3 to 1.5 and if MP contributes factors between 1.0 and 2.4, as justcalculated according to Davies and Morland,35 one would expect the peripheral fovea to centralAF peak-to-trough ratios on the HRA to vary between 1.3 and 3.6 in these subjects. In our 10subjects, these ratios ranged from 1.2 to 2.6 (mean, 1.72 ± 0.37), a range that is quite consistent.The peak-to-trough ratios expected from the data of Bone et al.14 would be somewhat higher(1.7– 4.5).
Lipofuscin has a minimum centrally and tends to increase to the foveal edge in both verticaland horizontal meridians.19 This distribution pattern also contributes to centralhypofluorescence. The melanin in RPE has a broad absorbance across the visible spectrum andalso has highest density centrally.38
Other reflectors and absorbers that may affect the observed pattern include the retinal nervefiber layer (RNFL) and the lens. The cutoff filter used to measure AF blocks the reflectanceof the RNFL at 488 nm. Because the RNFL has no known AF, its contribution to the observedAF should be minimal. To eliminate suppression of AF by the lens, we used only eyes thatwere clear of cataract. Lens absorption, in any case, may be expected to reduce the range andresolution of the pattern but not its geometry. Intrinsic lens AF is eliminated by the confocalimage acquisition. There was no significant difference in any of the parameters between themen and women or as function of age in this middle-aged population.
In summary, the precise foveal AF patterns we described appear to be some combination ofcone photopigment and luteal pigment optical density maps superimposed on the intrinsiclipofuscin-derived AF signal. The mathematical model we developed herein accuratelyrepresented the original scan data in this complex circumstance. The model was also robust,
Smith et al. Page 7
Invest Ophthalmol Vis Sci. Author manuscript; available in PMC 2009 September 30.
NIH
-PA Author Manuscript
NIH
-PA Author Manuscript
NIH
-PA Author Manuscript
in that it could reconstruct the original scan data from very limited data subsets, hence couldbe useful for analysis of AF images from diseased maculas, much in the manner of what hasbeen done for drusen by using fundus photographs.39,40 For example, fovealhyperfluorescence,20,27 embedded in the darker central pattern, could be delineated andquantified more accurately than is possible at present.
To our knowledge, this is the first detailed two-dimensional description of this geometry fromAF images. A significant benefit of our analysis is that it is achieved with a commerciallyavailable cSLO and inexpensive commercial imaging software run on a desktop computer andlends itself to dissemination for standardized analysis of foveal images.
AcknowledgmentsSupported by a grant from The New York Community Trust (RTS), National Eye Institute Grant EY12951 (JRS), andunrestricted funds from Research to Prevent Blindness.
References1. Friedman DS, O’Colmain BJ, Munoz B, et al. Prevalence of age-related macular degeneration in the
United States. Arch Ophthalmol 2004;122:564–572. [PubMed: 15078675]2. Klein R, Peto T, Bird AC, Vannewkirk MR. The epidemiology of age-related macular degeneration.
Am J Ophthalmol 2004;137:486–495. [PubMed: 15013873]3. von Ruckmann A, Fitzke FW, Bird AC. Distribution of fundus autofluorescence with a scanning laser
ophthalmoscope [comment]. Br J Ophthalmol 1995;79:407–412. [PubMed: 7612549]4. von Ruckmann A, Fitzke FW, Bird AC. In vivo fundus autofluorescence in macular dystrophies. Arch
Ophthalmol 1997;115:609–615. [PubMed: 9152128]5. von Ruckmann A, Fitzke FW, Bird AC. Fundus autofluorescence in age-related macular disease imaged
with a laser scanning ophthalmoscope. Invest Ophthalmol Vis Sci 1997;38:478–486. [PubMed:9040481]
6. von Ruckmann A, Fitzke FW, Bird AC. Distribution of pigment epithelium autofluorescence in retinaldisease state recorded in vivo and its change over time. Graefes Arch Clin Exp Ophthalmol1999;237:1–9. [PubMed: 9951634]
7. Holz FG, Bellman C, Staudt S, Schutt F, Volcker HE. Fundus autofluorescence and development ofgeographic atrophy in age-related macular degeneration. Invest Ophthalmol Vis Sci 2001;42:1051–1056. [PubMed: 11274085]
8. Delori FC, Goger DG, Dorey CK. Age-related accumulation and spatial distribution of lipofuscin inRPE of normal subjects. Invest Ophthalmol Vis Sci 2001;42:1855–1866. [PubMed: 11431454]
9. Delori FC, Dorey CK, Staurenghi G, Arend O, Goger DG, Weiter JJ. In vivo fluorescence of the ocularfundus exhibits retinal pigment epithelium lipofuscin characteristics. Invest Ophthalmol Vis Sci1995;36:718–729. [PubMed: 7890502]
10. Delori FC, Fleckner MR, Goger DG, Weiter JJ, Dorey CK. Autofluorescence distribution associatedwith drusen in age-related macular degeneration. Invest Ophthalmol Vis Sci 2000;41:496–504.[PubMed: 10670481]
11. Marmorstein AD, Marmorstein LY, Sakaguchi H, Hollyfield JG. Spectral profiling ofautofluorescence associated with lipofuscin, Bruch’s membrane, and sub-RPE deposits in normaland AMD eyes. Invest Ophthalmol Vis Sci 2002;43:2435–2441. [PubMed: 12091448]
12. Spaide RF. Fundus autofluorescence and age-related macular degeneration. Ophthalmology2003;110:392–399. [PubMed: 12578786]
13. Lois N, Halfyard AS, Bird AC, Fitzke FW. Quantitative evaluation of fundus autofluorescence imaged“in vivo” in eyes with retinal disease. Br J Ophthalmol 2000;84:741–745. [PubMed: 10873986]
14. Bone RA, Landrum JT, Cains A. Optical density spectra of the macular pigment in vivo and in vitro.Vision Res 1992;84:105–110. [PubMed: 1502795]
15. Handelman GJ, Snodderly DM, Adler AJ, Russett MD, Dratz EA. Measurement of carotenoids inhuman and monkey retinas. Methods Enzymol 1992;213:220–230. [PubMed: 1435304]
Smith et al. Page 8
Invest Ophthalmol Vis Sci. Author manuscript; available in PMC 2009 September 30.
NIH
-PA Author Manuscript
NIH
-PA Author Manuscript
NIH
-PA Author Manuscript
16. Gellerman W, Bernstein PS. Noninvasive detection of macular pigments in the human eye. J BiomedOpt 2004;9:75–85. [PubMed: 14715058]
17. Bindewald A, Jorzik JJ, Loesch A, Schutt F, Holz FG. Visualization of retinal pigment epithelial cellsin vivo using digital high-resolution confocal scanning laser ophthalmoscopy. Am J Ophthalmol2004;137:556–558. [PubMed: 15013882]
18. Trieschmann M, Spital G, Lommatzsch A, et al. Macular pigment: quantitative analysis ofautofluorescence images. Graefes Arch Clin Exp Ophthalmol 2003;241:1006–1012. [PubMed:14618343]
19. Delori FC, Goger DG, Dorey CK. Age-related accumulation and spatial distribution of lipofuscin inRPE of normal subjects. Invest Ophthalmol Vis Sci 2001;42:1855–1866. [PubMed: 11431454]
20. von Ruckmann A, Fitzke FW, Bird AC. Fundus autofluorescence in age-related macular diseaseimaged with a laser scanning ophthalmoscope. Invest Ophthalmol Vis Sci 1997;38:478–486.[PubMed: 9040481]
21. Bressler SB, Bressler NM, Seddon JM, Gragoudas ES, Jacobson LP. Interobserver and intraobserverreliability in the clinical classification of drusen. Retina 1988;2:102–108. [PubMed: 3420310]
22. Bird AC, Bressler NM, Bressler SB, et al. An international classification and grading system for age-related maculopathy and age-related macular degeneration. The International ARM EpidemiologicalStudy Group. Surv Ophthalmol 1995;39:367–374. [PubMed: 7604360]
23. Klein R, Davis MD, Magli YL, Segal P, Klein BE, Hubbard L. The Wisconsin age-relatedmaculopathy grading system. Ophthalmology 1991;98:1128–1134. [PubMed: 1843453]
24. Age-Related Eye Disease Study Research G. A randomized, placebo-controlled, clinical trial of high-dose supplementation with vitamins C and E, beta carotene, and zinc for age-related maculardegeneration and vision loss: AREDS report no. 8. Arch Ophthalmol 2001;119:1417–1436.[PubMed: 11594942]
25. Bressler NM, Bressler SB, Fine SL. Age-related macular degeneration. Surv Ophthalmol1988;32:375–413. [PubMed: 2457955]
26. Sunness JS, Bressler NM, Tian Y, Alexander J, Applegate CA. Measuring geographic atrophy inadvanced age-related macular degeneration. Invest Ophthalmol Vis Sci 1999;40:1761–1769.[PubMed: 10393046]
27. Lois N, Owens SL, Coco R, Hopkins J, Fitzke FW, Bird AC. Fundus autofluorescence in patientswith age-related macular degeneration and high risk of visual loss. Am J Ophthalmol 2002;133:341–349. [PubMed: 11860971]
28. Shin DS, Javornik NB, Berger JW. Computer-assisted, interactive fundus image processing formacular drusen quantitation. Ophthalmology 1999;106:1119–1125. [PubMed: 10366080]
29. Sebag M, Peli E, Lahav M. Image analysis of changes in drusen area. Acta Ophthalmol 1991;69:603–610. [PubMed: 1776413]
30. Morgan WH, Cooper RL, Constable IJ, Eikelboom RH. Automated extraction and quantification ofmacular drusen from fundal photographs. Aust NZ J Ophthalmol 1994;22:7–12.
31. Kirkpatrick JN, Spencer T, Manivannan A, Sharp PF, Forrester JV. Quantitative image analysis ofmacular drusen from fundus photographs and scanning laser ophthalmoscope images. Eye1995;9:48–55. [PubMed: 7713250]
32. Peli E, Lahav M. Drusen measurement from fundus photographs using computer image analysis.Ophthalmology 1986;93:1575–1580. [PubMed: 3808617]
33. Goldbaum MH, Katz NP, Nelson MR, Haff LR. The discrimination of similarly colored objects incomputer images of the ocular fundus. Invest Ophthalmol Vis Sci 1990;31:617–623. [PubMed:2186008]
34. Snodderly DM, Auran JD, Delori FC. The macular pigment. II. Spatial distribution in primate retinas.Invest Ophthalmol Vis Sci 1984;25:674–685. [PubMed: 6724837]
35. Davies NP, Morland AB. Color matching in diabetes: optical density of the crystalline lens andmacular pigments. Invest Ophthalmol Vis Sci 2002;43:281–289. [PubMed: 11773043]
36. Rushton WAH, Henry GH. Bleaching and regeneration of cone pigments in man. Vision Res1968;8:617–631. [PubMed: 5729910]
37. Elsner AE, Burns SA, Webb RH. Mapping cone photopigment optical density. J Opt Soc Am1993;10:52–58.
Smith et al. Page 9
Invest Ophthalmol Vis Sci. Author manuscript; available in PMC 2009 September 30.
NIH
-PA Author Manuscript
NIH
-PA Author Manuscript
NIH
-PA Author Manuscript

38. Weiter JJ, Delori FC, Wing GL, Fitch KA. Retinal pigment epithelial lipofuscin and melanin andchoroidal melanin in human eyes. Invest Ophthalmol Vis Sci 1986;27:145–152. [PubMed: 3943941]
39. Smith RT, Nagasaki T, Sparrow JR, et al. A method of drusen measurement based on the geometryof fundus reflectance. Biomed Eng 2003;2:10.
40. Smith RT, Nagasaki T, Sparrow JR, Barbazetto I, Koniarek JP, Bickmann LJ. Photographic patternsin macular images: representation by a mathematical model. J Biomed Opt 2004;9:162–172.[PubMed: 14715069]
Smith et al. Page 10
Invest Ophthalmol Vis Sci. Author manuscript; available in PMC 2009 September 30.
NIH
-PA Author Manuscript
NIH
-PA Author Manuscript
NIH
-PA Author Manuscript
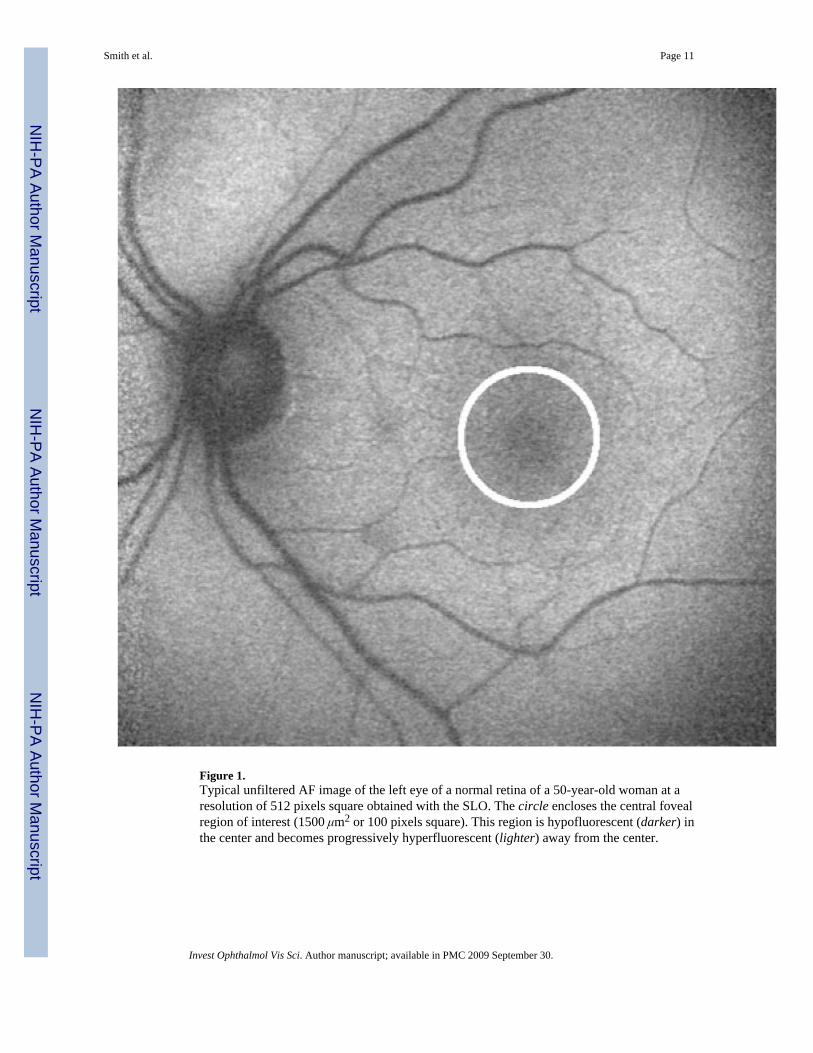
Figure 1.Typical unfiltered AF image of the left eye of a normal retina of a 50-year-old woman at aresolution of 512 pixels square obtained with the SLO. The circle encloses the central fovealregion of interest (1500 μm2 or 100 pixels square). This region is hypofluorescent (darker) inthe center and becomes progressively hyperfluorescent (lighter) away from the center.
Smith et al. Page 11
Invest Ophthalmol Vis Sci. Author manuscript; available in PMC 2009 September 30.
NIH
-PA Author Manuscript
NIH
-PA Author Manuscript
NIH
-PA Author Manuscript
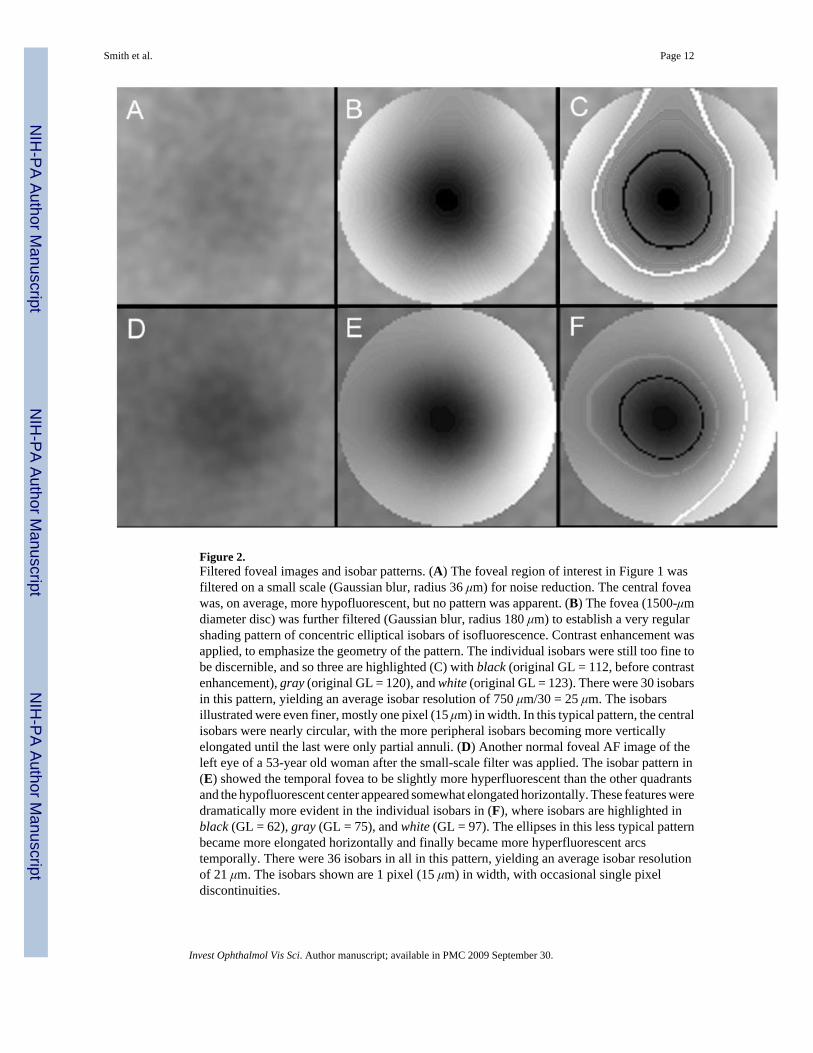
Figure 2.Filtered foveal images and isobar patterns. (A) The foveal region of interest in Figure 1 wasfiltered on a small scale (Gaussian blur, radius 36 μm) for noise reduction. The central foveawas, on average, more hypofluorescent, but no pattern was apparent. (B) The fovea (1500-μmdiameter disc) was further filtered (Gaussian blur, radius 180 μm) to establish a very regularshading pattern of concentric elliptical isobars of isofluorescence. Contrast enhancement wasapplied, to emphasize the geometry of the pattern. The individual isobars were still too fine tobe discernible, and so three are highlighted (C) with black (original GL = 112, before contrastenhancement), gray (original GL = 120), and white (original GL = 123). There were 30 isobarsin this pattern, yielding an average isobar resolution of 750 μm/30 = 25 μm. The isobarsillustrated were even finer, mostly one pixel (15 μm) in width. In this typical pattern, the centralisobars were nearly circular, with the more peripheral isobars becoming more verticallyelongated until the last were only partial annuli. (D) Another normal foveal AF image of theleft eye of a 53-year old woman after the small-scale filter was applied. The isobar pattern in(E) showed the temporal fovea to be slightly more hyperfluorescent than the other quadrantsand the hypofluorescent center appeared somewhat elongated horizontally. These features weredramatically more evident in the individual isobars in (F), where isobars are highlighted inblack (GL = 62), gray (GL = 75), and white (GL = 97). The ellipses in this less typical patternbecame more elongated horizontally and finally became more hyperfluorescent arcstemporally. There were 36 isobars in all in this pattern, yielding an average isobar resolutionof 21 μm. The isobars shown are 1 pixel (15 μm) in width, with occasional single pixeldiscontinuities.
Smith et al. Page 12
Invest Ophthalmol Vis Sci. Author manuscript; available in PMC 2009 September 30.
NIH
-PA Author Manuscript
NIH
-PA Author Manuscript
NIH
-PA Author Manuscript
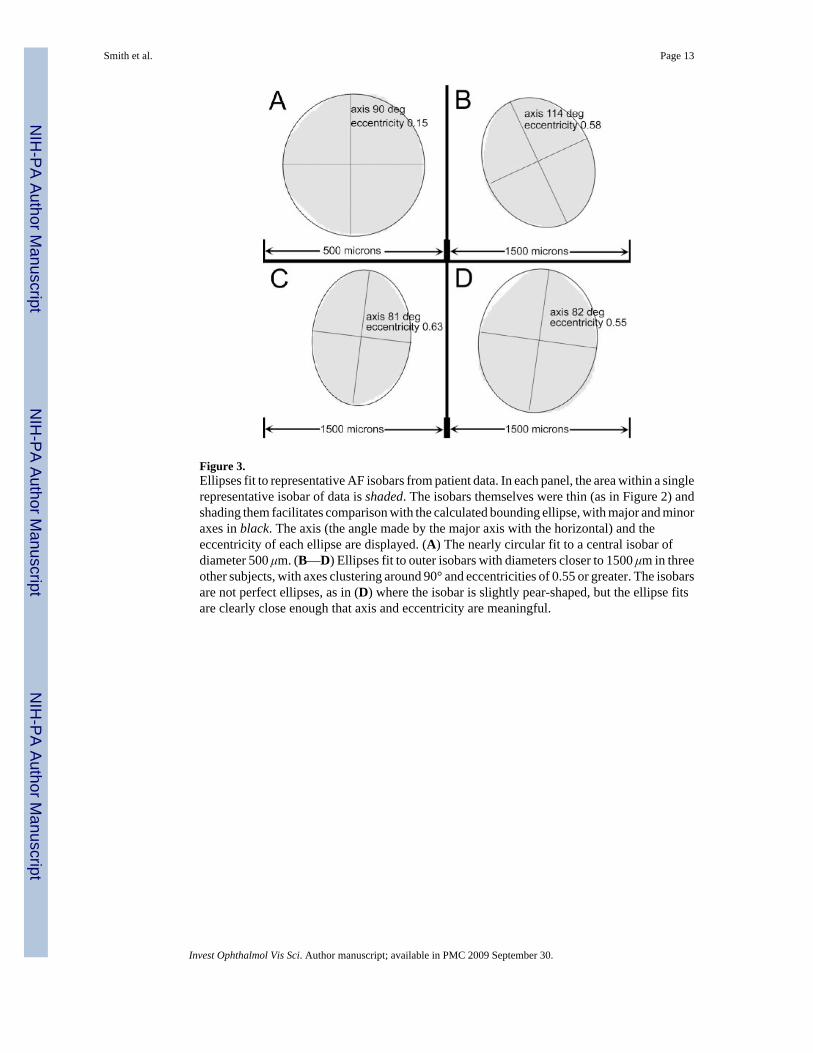
Figure 3.Ellipses fit to representative AF isobars from patient data. In each panel, the area within a singlerepresentative isobar of data is shaded. The isobars themselves were thin (as in Figure 2) andshading them facilitates comparison with the calculated bounding ellipse, with major and minoraxes in black. The axis (the angle made by the major axis with the horizontal) and theeccentricity of each ellipse are displayed. (A) The nearly circular fit to a central isobar ofdiameter 500 μm. (B—D) Ellipses fit to outer isobars with diameters closer to 1500 μm in threeother subjects, with axes clustering around 90° and eccentricities of 0.55 or greater. The isobarsare not perfect ellipses, as in (D) where the isobar is slightly pear-shaped, but the ellipse fitsare clearly close enough that axis and eccentricity are meaningful.
Smith et al. Page 13
Invest Ophthalmol Vis Sci. Author manuscript; available in PMC 2009 September 30.
NIH
-PA Author Manuscript
NIH
-PA Author Manuscript
NIH
-PA Author Manuscript
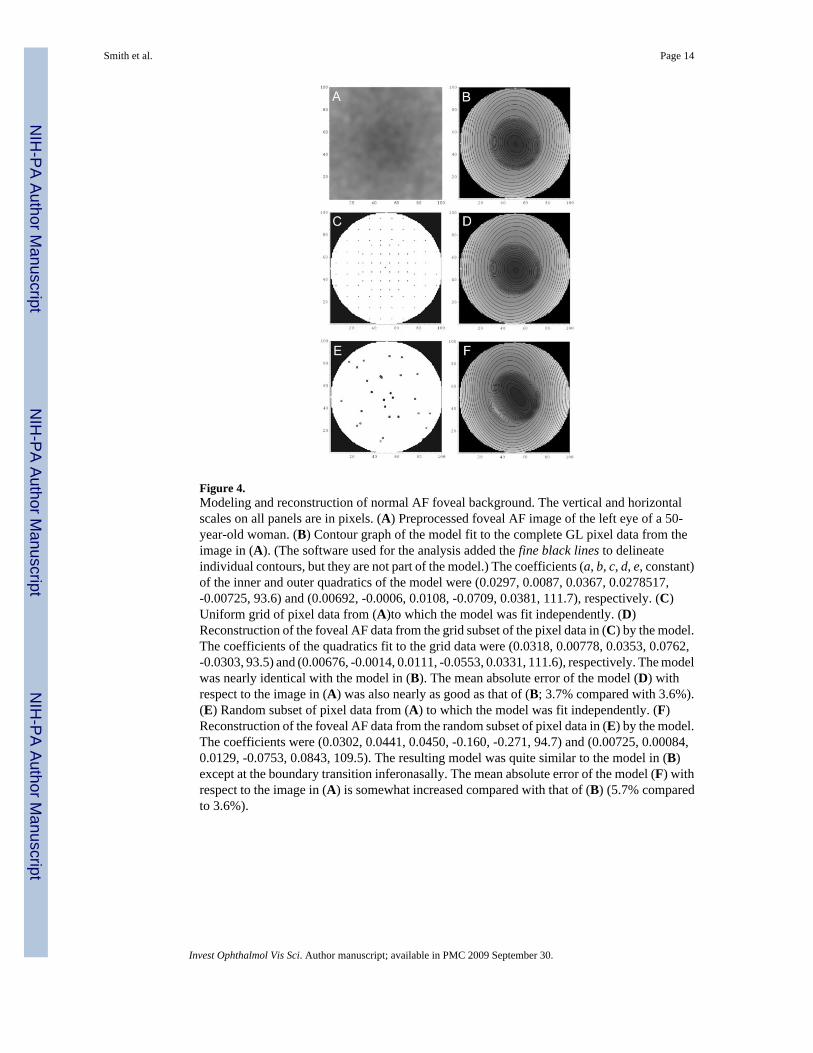
Figure 4.Modeling and reconstruction of normal AF foveal background. The vertical and horizontalscales on all panels are in pixels. (A) Preprocessed foveal AF image of the left eye of a 50-year-old woman. (B) Contour graph of the model fit to the complete GL pixel data from theimage in (A). (The software used for the analysis added the fine black lines to delineateindividual contours, but they are not part of the model.) The coefficients (a, b, c, d, e, constant)of the inner and outer quadratics of the model were (0.0297, 0.0087, 0.0367, 0.0278517,-0.00725, 93.6) and (0.00692, -0.0006, 0.0108, -0.0709, 0.0381, 111.7), respectively. (C)Uniform grid of pixel data from (A)to which the model was fit independently. (D)Reconstruction of the foveal AF data from the grid subset of the pixel data in (C) by the model.The coefficients of the quadratics fit to the grid data were (0.0318, 0.00778, 0.0353, 0.0762,-0.0303, 93.5) and (0.00676, -0.0014, 0.0111, -0.0553, 0.0331, 111.6), respectively. The modelwas nearly identical with the model in (B). The mean absolute error of the model (D) withrespect to the image in (A) was also nearly as good as that of (B; 3.7% compared with 3.6%).(E) Random subset of pixel data from (A) to which the model was fit independently. (F)Reconstruction of the foveal AF data from the random subset of pixel data in (E) by the model.The coefficients were (0.0302, 0.0441, 0.0450, -0.160, -0.271, 94.7) and (0.00725, 0.00084,0.0129, -0.0753, 0.0843, 109.5). The resulting model was quite similar to the model in (B)except at the boundary transition inferonasally. The mean absolute error of the model (F) withrespect to the image in (A) is somewhat increased compared with that of (B) (5.7% comparedto 3.6%).
Smith et al. Page 14
Invest Ophthalmol Vis Sci. Author manuscript; available in PMC 2009 September 30.
NIH
-PA Author Manuscript
NIH
-PA Author Manuscript
NIH
-PA Author Manuscript
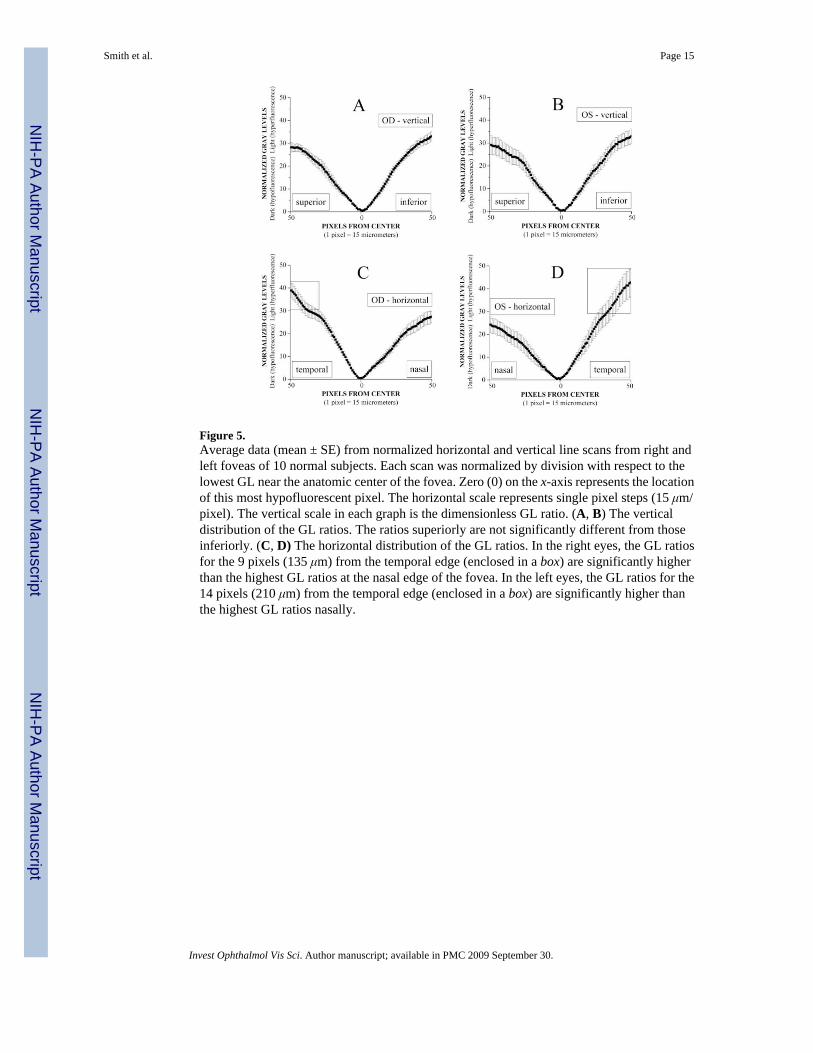
Figure 5.Average data (mean ± SE) from normalized horizontal and vertical line scans from right andleft foveas of 10 normal subjects. Each scan was normalized by division with respect to thelowest GL near the anatomic center of the fovea. Zero (0) on the x-axis represents the locationof this most hypofluorescent pixel. The horizontal scale represents single pixel steps (15 μm/pixel). The vertical scale in each graph is the dimensionless GL ratio. (A, B) The verticaldistribution of the GL ratios. The ratios superiorly are not significantly different from thoseinferiorly. (C, D) The horizontal distribution of the GL ratios. In the right eyes, the GL ratiosfor the 9 pixels (135 μm) from the temporal edge (enclosed in a box) are significantly higherthan the highest GL ratios at the nasal edge of the fovea. In the left eyes, the GL ratios for the14 pixels (210 μm) from the temporal edge (enclosed in a box) are significantly higher thanthe highest GL ratios nasally.
Smith et al. Page 15
Invest Ophthalmol Vis Sci. Author manuscript; available in PMC 2009 September 30.
NIH
-PA Author Manuscript
NIH
-PA Author Manuscript
NIH
-PA Author Manuscript
Related Documents