This document was downloaded on May 04, 2015 at 23:15:45 Author(s) Cheak, Seck Fai Title Detecting near-UV and near-IR wavelengths with the FOVEON image sensor Publisher Monterey California. Naval Postgraduate School Issue Date 2004-12 URL http://hdl.handle.net/10945/1284

Welcome message from author
This document is posted to help you gain knowledge. Please leave a comment to let me know what you think about it! Share it to your friends and learn new things together.
Transcript

This document was downloaded on May 04, 2015 at 23:15:45
Author(s) Cheak, Seck Fai
Title Detecting near-UV and near-IR wavelengths with the FOVEON image sensor
Publisher Monterey California. Naval Postgraduate School
Issue Date 2004-12
URL http://hdl.handle.net/10945/1284
NAVAL POSTGRADUATE
SCHOOL
MONTEREY, CALIFORNIA
THESIS
DETECTING NEAR-UV AND NEAR-IR
WAVELENGTHS WITH THE FOVEON IMAGE SENSOR
by
Cheak Seck Fai
December 2004
Thesis Advisor : Gamani Karunasiri
Co-Advisor : Richard C. Olsen
Approved for public release: distribution is unlimited

THIS PAGE IS INTENTIONALLY LEFT BLANK.

i
REPORT DOCUMENTATION PAGE Form Approved OMB No. Public reporting burden for this collection of information is estimated to average 1 hour per response, including the time for reviewing instruction, searching existing data sources, gathering and maintaining the data needed, and completing and reviewing the collection of information. Send comments regarding this burden estimate or any other aspect of this collection of information, including suggestions for reducing this burden, to Washington headquarters Services, Directorate for Information Operations and Reports, 1215 Jefferson Davis Highway, Suite 1204, Arlington, VA 22202-4302, and to the Office of Management and Budget, Paperwork Reduction Project (0704-0188) Washington DC 20503. 1. AGENCY USE ONLY (Leave blank)
2. REPORT DATE December 2004
3. REPORT TYPE AND DATES COVERED Master’s Thesis
4. TITLE AND SUBTITLE: Title (Mix case letters) Detecting Near-UV and Near-IR Wavelengths with the FOVEON Image Sensor.
6. AUTHOR(S) Seck Fai, Cheak, MAJ, Singapore Armed Forces
5. FUNDING NUMBERS
7. PERFORMING ORGANIZATION NAME(S) AND ADDRESS(ES) Naval Postgraduate School Monterey, CA 93943-5000
8. PERFORMING ORGANIZATION REPORT NUMBER
9. SPONSORING / MONITORING AGENCY NAME(S) AND ADDRESS(ES) N/A
10. SPONSORING / MONITORING AGENCY REPORT NUMBER
11. SUPPLEMENTARY NOTES The views expressed in this thesis are those of the authors and do not reflect the official policy or position of any Department of Defense or the U.S. Government. 12a. DISTRIBUTION / AVAILABILITY STATEMENT Approved for public release : distribution is unlimited.
12b. DISTRIBUTION CODE
13. ABSTRACT (maximum 200 words) Traditionally, digital imaging systems rely on the use of dedicated photodetectors to capture specific wavelengths in the visible spectrum. These photodetectors, which are commonly made of silicon, are arranged as arrays to capture the red, green and blue wavelengths. The signal captured by the individual photodetectors must then be interpolated and integrated to obtain the closest color match and the finest possible resolution with reference to the actual object. The use of spatially separated detectors to sense primary colors reduces the resolution by a factor of three compared to black and white imaging. The FOVEON detector technology greatly improves the color and resolution of the image through its vertically arranged, triple well photodetector. This is achieved by exploiting the variation of absorption coefficient of silicon with wavelength in the visible spectrum. Hence, in a silicon detector, the shorter wavelength (e.g. blue) would be mainly absorbed at a shallow depth. A longer wavelength (e.g. red) would penetrate the material deeper than the shorter wavelengths and be primarily absorbed at a greater depth. By producing a layered silicon detector, all three primary colour wavelengths of red, green and blue can be captured simultaneously. This thesis aims to study the FOVEON camera’s ability to image light from the near Infrared (NIR) to the Ultra-Violet (UV) range of the electromagnetic spectrum. The imaged obtained using a set of bandpass filters show that the camera has response both in the UV as well as NIR regions.
15. NUMBER OF PAGES 79
14. SUBJECT TERMS: Silicon, Photodetector, FOVEON, CMOS, CCD, Detectivity, Responsivity, Triple-well, Color Perception, Metamerism, Image resolution, Atmospheric absorption, Spectral reflectance, Digital Imaging 16. PRICE CODE
17. SECURITY CLASSIFICATION OF REPORT
Unclassified
18. SECURITY CLASSIFICATION OF THIS PAGE
Unclassified
19. SECURITY CLASSIFICATION OF ABSTRACT
Unclassified
20. LIMITATION OF ABSTRACT
UL NSN 7540-01-280-5500 Standard Form 298 (Rev. 2-89) Prescribed by ANSI Std. 239-18

ii
THIS PAGE IS INTENTIONALLY LEFT BLANK.

iii
Approved for public release: distribution is unlimited
DETECTING NEAR-UV AND NEAR-IR WAVELENGTHS WITH THE FOVEON IMAGE SENSOR
Seck Fai, Cheak
Major, Singapore Armed Forces BSc (Hons), MEng, University of Manchester, UK, 1999
Submitted in partial fulfillment of the
requirements for the degree of
MASTER OF SCIENCE IN COMBAT SYSTEMS TECHNOLOGY
from the
NAVAL POSTGRADUATE SCHOOL December 2004
Author : Cheak, Seck Fai Approved by : Gamani Karunasiri Thesis Advisor Richard Christopher Olsen Co-Advisor James Luscombe Chairman, Department of Physics

iv
THIS PAGE IS INTENTIONALLY LEFT BLANK.
v
ABSTRACT Traditionally, digital imaging systems rely on the use of dedicated
photodetectors to capture specific wavelengths in the visible spectrum. These
photodetectors, which are commonly made of silicon, are arranged as arrays to
capture the red, green and blue wavelengths. The signal captured by the individual
photodetectors must then be interpolated and integrated to obtain the closest color
match and the finest possible resolution with reference to the actual object. The use
of spatially separated detectors to sense primary colors reduces the resolution by a
factor of three compared to black and white imaging. The FOVEON detector
technology greatly improves the color and resolution of the image through its
vertically arranged, triple well photodetector. This is achieved by exploiting the
variation of absorption coefficient of silicon with wavelength in the visible spectrum.
Hence, in a silicon detector, the shorter wavelength (e.g. blue) would be mainly
absorbed at a shallow depth. A longer wavelength (e.g. red) would penetrate the
material deeper than the shorter wavelengths and be primarily absorbed at a greater
depth. By producing a layered silicon detector, all three primary colour wavelengths
of red, green and blue can be captured simultaneously. This thesis aims to study
the FOVEON camera’s ability to image light from the near Infrared (NIR) to the Ultra-
Violet (UV) range of the electromagnetic spectrum. The imaged obtained using a
set of bandpass filters show that the camera has response both in the UV as well as
NIR regions.

vi
THIS PAGE IS INTENTIONALLY LEFT BLANK.

vii
TABLE OF CONTENTS I. INTRODUCTION.................................................................................................. 1
A. TECHNICAL BACKGROUND................................................................... 1 B. STRUCTURE OF THESIS......................................................................... 6 C. SYSTEM OVERVIEW................................................................................ 7
1. General .......................................................................................... 7 2. Characterization of the FOVEON Image Sensor ........................ 8 3. Near-UV and Near-IR Imaging with the FOVEON Camera ....... 10
II. CHARACTERIZATION OF THE FOVEON DETECTOR ARRAY...................... 13 A. GENERAL............................................................................................... 13 B. EQUIPMENT AND SOFTWARE SET-UP ............................................... 13
1. Hardware Set-Up......................................................................... 13 2. Software Set-Up.......................................................................... 19 3. Results......................................................................................... 24
III. MULTISPECTRAL IMAGING WITH THE FOVEON IMAGE SENSOR ............. 33 A. GENERAL............................................................................................... 33 B. NEAR-UV AND NEAR-IR IMAGING ....................................................... 33
1. Color Perception and Digital Imaging....................................... 33 2. Outdoor Imaging......................................................................... 36 2. Imaging near-UV and near-IR wavelengths .............................. 40
IV. DISCUSSION AND RECOMMENDATIONS...................................................... 47 A. NEAR-UV AND NEAR-IR IMAGING ....................................................... 47 B. FURTHER DEVELOPMENT AND POSSIBILE APPLICATIONS............ 48
1. Further Development Possibilities in the Design of Triple-Well Image Sensors.................................................................... 48
2. Automated Multi-spectral Imaging and Other Applications.... 49 V. CONCLUSION................................................................................................... 51 APPENDIX I – UV-035D (S/NO. 7309) CALIBRATION CHART.................................. 53 APPENDIX II – TRANSMISSION CURVES OF HOYA FILTERS ................................ 55 LIST OF REFERENCES............................................................................................... 57 INITIAL DISTRIBUTION LIST ...................................................................................... 61

viii
THIS PAGE IS INTENTIONALLY LEFT BLANK.

ix
LIST OF TABLES
Table 1. List of Equipment used in the camera characterization and imaging.... 8 Table 2. Experimental Settings used for Calibrating Monochromator Light
Output. ............................................................................................... 17 Table 3. Experiment parameters for measuring the HVDUO-5M responsivity.. 19 Table 4. Responsivity Values of Calibrated UV-035D Photodiode (S/N 7309). 53

x
THIS PAGE IS INTENTIONALLY LEFT BLANK.

xi
LIST OF FIGURES Figure 1. Band Diagram of a PN Junction Photodetector adapted from [2]....................2 Figure 2. Absorption Depth of Silicon with Wavelength. The photodetectors used in
FOVEON camera are located at the three depths of 0.2 µm, 0.8 µm and 3 µm [4]. ...................................................................................................................3
Figure 3. Schematic showing the three p-n junctions in a FOVEON pixel [3].................4 Figure 4. Comparison of FOVEON Detector Technology (above) with Conventional
Silicon Photodetector Arrays arranged in the Bayer pattern (below) [1]..........5 Figure 5. Block Diagram of Hardware Set-up ...............................................................14 Figure 6. The Oriel Monochromator System used in the Measurement. ......................15 Figure 7. Schematic diagram of monochromatic light beam focused on the detector (left)
and spread over detector (right). ...................................................................16 Figure 8. The UDT UV-350D Photodiode mounted on the optical bench.....................17 Figure 9. The HanVision HVDUO-5M Camera (left) [8] and the internal FOVEON X3
Image Sensor (right) [4].................................................................................18 Figure 10. Block Diagram of Software Linkages and some Key Functions. ...................20 Figure 11. Screenshot of LabView Monochromator Control Program. ...........................20 Figure 12. Screenshots of the HCCT software showing the interfaces for adjusting
various image capture settings for the HVDUO-5M camera. ........................21 Figure 13. Screenshot of the NEGUS software showing the line profile function...........23 Figure 14. Image of a monochrome light at 650 nm wavelength showing the contribution
from the red, green and blue signals. ............................................................24 Figure 15. Calibrated Intensity of the Monochromator output vs Wavelength. ...............25 Figure 16. Image of 1000 nm wavelength monochromatic light. Since most of the signal
at this wavelength comes from the bottom sensor, the software assigns it red color...............................................................................................................26
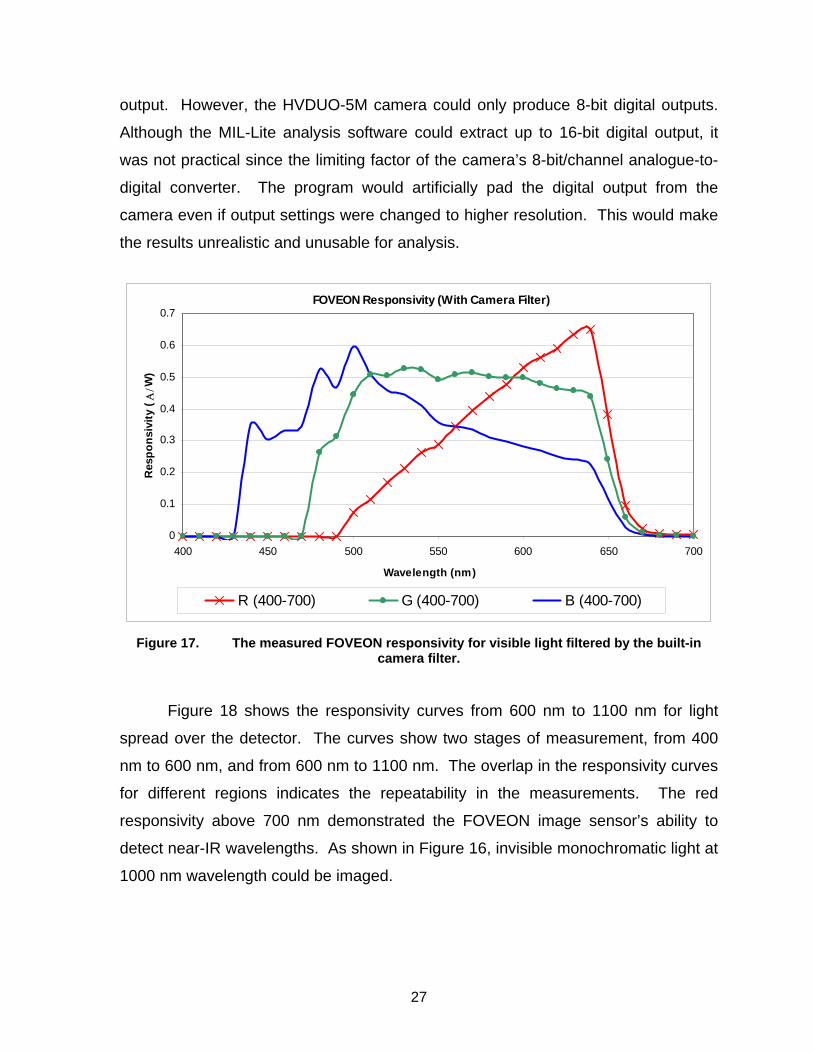
Figure 17. The measured FOVEON responsivity for visible light filtered by the built-in camera filter...................................................................................................27
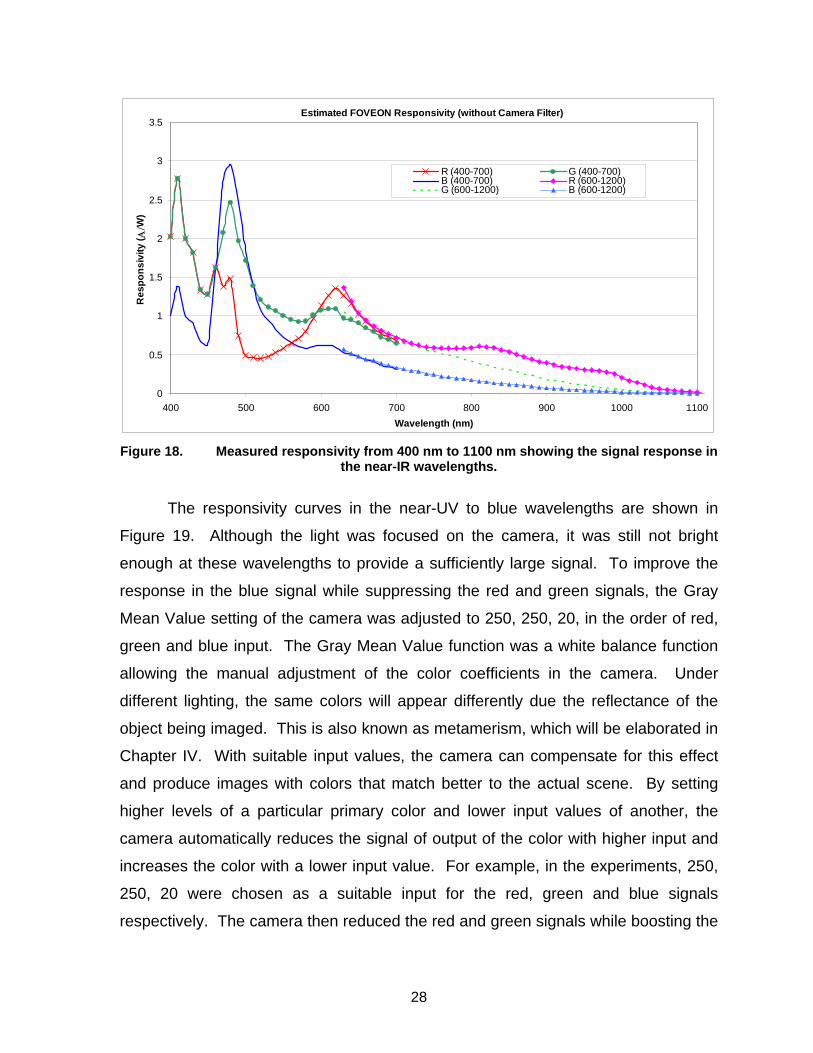
Figure 18. Measured responsivity from 400 nm to 1100 nm showing the signal response in the near-IR wavelengths............................................................................28
Figure 19. Measured blue responsivity with 250, 250, 20 Gray Mean Value setting enabled..........................................................................................................29
Figure 20. Imaged captured for near-UV light at 200 nm with Gray Mean Value of 250, 250, 20 camera setting. The blue color indicates the detection of near-UV by the “blue” detector. ........................................................................................30
Figure 21. The relationship between the Gray Mean Value input at 250, 250, x setting and the blue output signal. ............................................................................31
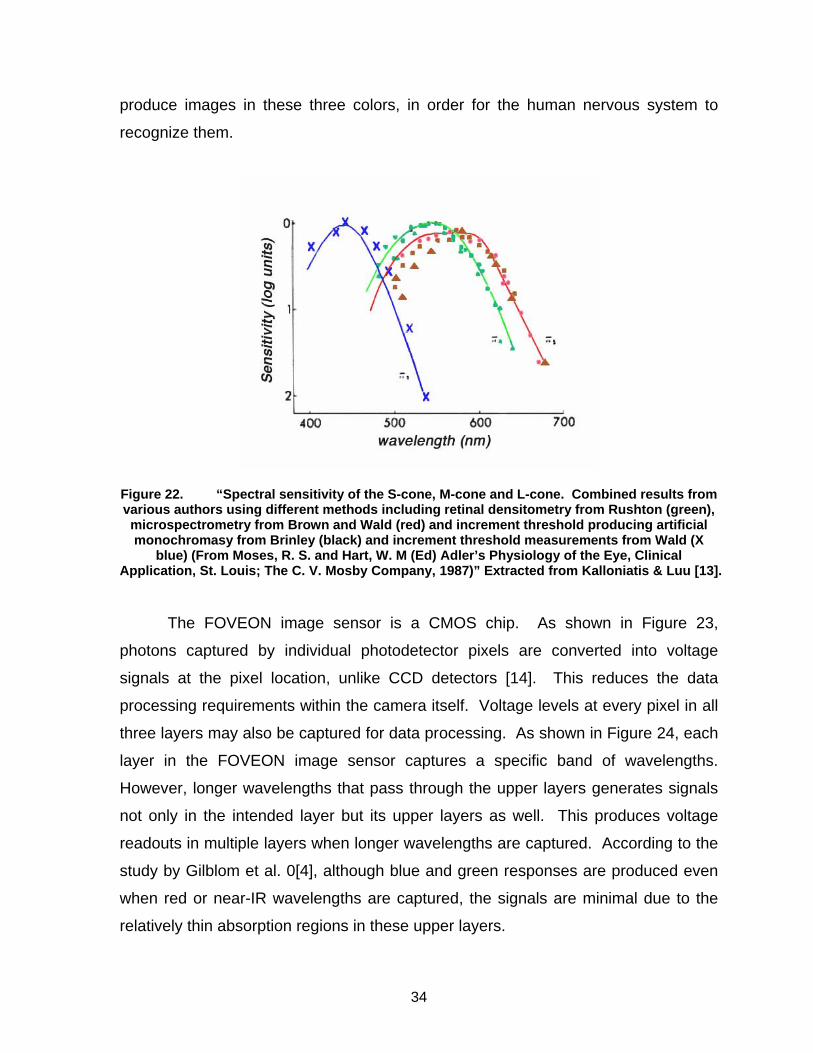
Figure 22. “Spectral sensitivity of the S-cone, M-cone and L-cone. Combined results from various authors using different methods including retinal densitometry from Rushton (green), microspectrometry from Brown and Wald (red) and increment threshold producing artificial monochromasy from Brinley (black) and increment threshold measurements from Wald (X blue) (From Moses, R. S. and Hart, W. M (Ed) Adler’s Physiology of the Eye, Clinical Application, St. Louis; The C. V. Mosby Company, 1987)” Extracted from Kalloniatis & Luu [13]. ...............................................................................................................34
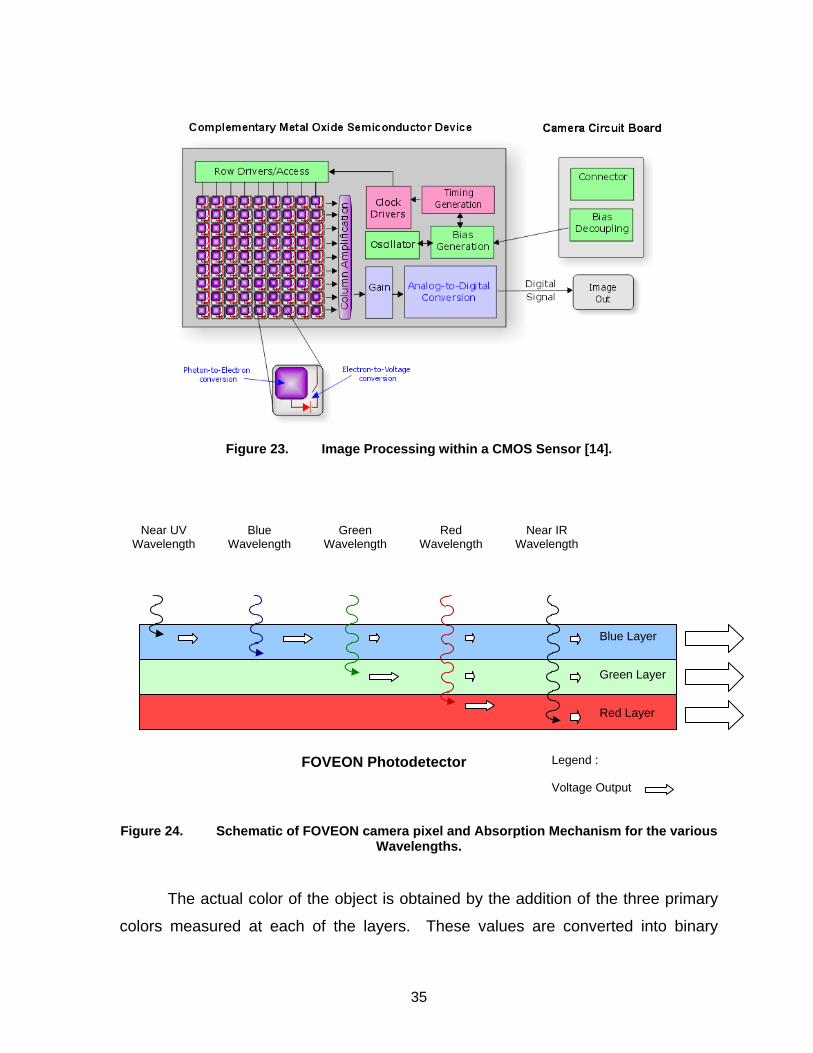
Figure 23. Image Processing within a CMOS Sensor [14]. ............................................35 Figure 24. Schematic of FOVEON camera pixel and Absorption Mechanism for the
various Wavelengths. ....................................................................................35

xii
Figure 25. HVDUO-10M Camera Block Diagram (Similar to the HVDUO-5M Camera used for this Thesis) [12]. ..............................................................................36
Figure 26. Image of downtown Monterey captured with the camera filter (400 nm to 660 nm) affixed. The zoomed-in image of a car is shown. ..................................37
Figure 27. Spectral Response of the FOVEON camera. Each curve represents the response curve of each layer according to its color [12]. ..............................38
Figure 28. The contribution of the various molecules to atmospheric absorption [15]....39 Figure 29. Comparison of the Spectral Reflectance of various Construction Materials
and Vegetation [16]. ......................................................................................40 Figure 30. Image of downtown Monterey captured with U325C filter (240 nm to 400 nm)
(top) and the same scene in its blue channel (bottom)..................................41 Figure 31. Image of downtown Monterey captured with U360 filter (320 nm to 400 nm).
......................................................................................................................41 Figure 32. Image of Monterey Bay captured with U325C filter (240 nm to 400 nm).......42 Figure 33. Image of downtown Monterey captured with L38 filter (370 nm to 2800 nm).
......................................................................................................................43 Figure 34. Image of downtown Monterey captured with IR85 filter (850 nm to 2800 nm).
......................................................................................................................43 Figure 35. Image of Monterey Bay captured with IR85 filter (850 nm to 2800 nm) (left)
and the same scene showing its red channel (right). ....................................44 Figure 36. The rear of a passing jet captured with the IR85 filter (850 nm to 2800 nm).44 Figure 37. Set-up of a camouflage uniform (circled) in the midst of vegetation showing
the image captured in visible light (left) and the UV image (right). ................45 Figure 38. The UV image of the camouflage uniform set-up presented in its respective
red (left), green (center) and blue (left) channels. Notice the best contrast is in the blue channel. .......................................................................................45
Figure 39. The center to center distances between pixels are constant in a hexagonal arrangement but not in a rectangular pattern [19]. ........................................49
Figure 40. Calibrated Responsivity Chart of the UV-035D Photodiode (S/N 7309)........54 Figure 41. Transmission curve of HOYA U325C filter. ...................................................55 Figure 42. Transmission curve of HOYA U360 filter. ......................................................55 Figure 43. Transmission curve of HOYA L38 filter. ........................................................55 Figure 44. Transmission curve of HOYA IR85 filter. .......................................................56

xiii
SYMBOLS
)(λrefS Current measurement by the reference detector (µA)
)(λreftR Responsivity of the reference detector (A/W)
)(λrefP Radiant power detected by the reference detector (mW)
)(λI Intensity of light detected by the reference detector (W/m2)
)(λrefA Area of the reference detector array (m2)
)(det λS Current measurement of the FOVEON detector (µA)
)(det λR Responsivity of the FOVEON detector (A/W)
)(det λP Radiant power detected by the FOVEON detector (mW)
)(det λA Area of the reference FOVEON array (m2)

xiv
THIS PAGE IS INTENTIONALLY LEFT BLANK.
xv
ACKNOWLEDGEMENTS
The author would like to extend his appreciation for the support and guidance
received during the course of the thesis research. First, the guidance and patience
given by Professor Gamani Karunasiri and Professor Richard Olsen were invaluable.
Their advice has not only provided the author with a better understanding and
appreciation of the optoelectronics and digital imaging, it has broadened the author’s
appreciation for scientific research and the hard work and imagination it requires.
Second, the author would like to thank Mr. Dave Gilblom from Alternative Vision
Corporation for his advice and contribution to the research. His willingness to share
his expertise on the FOVEON image sensor has greatly eased the author’s learning
curve on the subject. Third, the technical assistance and sharing from MAJ Yeo
Hwee Tiong is greatly appreciated. It has reduced the possible countless hours of
trial and error in learning how to operate the lab equipment. Finally, the author
would like to thank his wife Joyce. She has helped him keep his focus on the
research and her understanding, support and love has been his motivation through
the long hours. On the whole, it has been a thoroughly enriching and worthwhile
experience.

xvi
THIS PAGE IS INTENTIONALLY LEFT BLANK.

1
I. INTRODUCTION
Imaging systems capable of discriminating spectral bands from the ultra-violet
(UV) to the IR are increasingly important in the military. A comparison of the
reflectance in the red and near infrared (NIR) wavelengths allows vegetation health
to be determined. This principle also allows camouflage to be distinguished from
surrounding vegetation by the judicious consideration of the spectral reflectance at
various wavelengths. Other uses are also emerging with the maturity of spectral
technology. Presently, there is an important need for imaging systems to have good
spectral fidelity but yet be inexpensive. Current standard imaging systems (color
focal planes) are poorly suited for such applications. A triple-well photodetector
focal plane array, marketed as the FOVEON image sensor, was introduced into
commercial availability in 2000. Compared to conventional photodetector arrays that
only detect a relatively broad band of wavelengths, the FOVEON image sensor is
able to discriminate three different visible wavelengths of light (blue, green and red)
on each individual pixel. The purpose of this thesis was to study the ability of the
triple-well FOVEON camera to image light from the NIR to the UV wavelengths from
200 nm to 1100 nm. This was achieved by measuring the signal outputs at each of
the three detectors (red, green and blue) in the FOVEON camera for the range of
wavelengths mentioned above.
A. TECHNICAL BACKGROUND The semiconductor photodetectors have become a critical component in
many modern sensing and imaging devices, such as compact disc players, digital
cameras and video cameras. Photodetectors may be broadly separated into
photoconductors and photodiodes. Photoconductors work on the principle of
exciting electrons from the valence band to the conduction band when photon
energy is greater than the bandgap of the material. Under an external bias, these
electrons produce a current in the material which is converted into a voltage signal
by measurement devices or into a binary code by microchips within the image
sensor. The binary codes represent image information such as color and brightness.

2
Photodiodes consist of a p-n junction where the built-in electric field can generate
either a photocurrent or a voltage depending on the mode pf operation as illustrated
in Figure 1. A reverse bias is usually applied to the photodiode to increase the
depletion layer width that results in a higher responsivity. The disadvantage of these
single-layered conventional photodetectors is that a specific band of wavelengths
may be detected without the spectral information, depending on the bandgap of the
semiconductor, Eg. Therefore, in the area of color imaging, different detectors are
required to capture the three primary colors of the visible spectrum. This is achieved
by placing micro-filters in front of the photodetectors to ensure selective wavelengths
are captured. These detectors are often arranged in the form of a Bayer array
pattern [1]. Each detector acts as an image pixel and represents the intensity of one
of the primary colors that make up the input image. In order to accurately reproduce
the actual image, various signal processing techniques are required to integrate as
well as interpolate the pixilated signals. The techniques aim to reproduce the correct
color match and image brightness, as well as to provide as high a resolution as
possible. One of the disadvantages of this approach is the loss of spatial resolution
since three spatially separated detectors needed for capturing the color information.
Many different materials may be used to produce photodetectors, including Silicon
(Si), Gallium Arsenide (GaAs) and Indium Antimonite (InSb); however, Si is primarily
used for visible light detection due the possibility of monolithic integration of signal
processing electronics. [2]
Figure 1. Band Diagram of a PN Junction Photodetector adapted from [2].
eVj ECn
EF
ECp
EF
-
-
-
+
+
+ EVn
EVp
+
-
Legend:
Holes
Electrons

3
To circumvent the drawbacks posed by single-layered detectors, FOVEON
developed a triple-well photodetector which can sense the three primary colors in
the same pixel. This is achieved by making use of the intrinsic characteristic of
silicon to absorb different wavelengths of light according to its thickness. The
absorption depth of Si with wavelength is shown in Figure 2. Shorter wavelengths
(blue) would be absorbed by a thin layer of silicon near the surface whilst longer
wavelengths (green and red) would pass through the surface layer of silicon and be
absorbed only in the underlying layers. Stacking three p-n photodetectors at
different depths, as shown in Figure 3, allow the collection of signals from different
wavelengths in the same pixel. Each layer of silicon is doped with different levels of
n and p type dopants to form the p-n junctions. With the application of a small
reverse bias voltage, each layer acts as one end of a PN junction to the next. This
produces higher sensitivity and allows easy signal readout. According to the US
patent report for the FOVEON image sensor [3], this idea was not totally novel since
there have been previous attempts to use layered or stacked photodetectors to
perform this function. These designs were, however, extremely expensive as a
commercial product and complicated to manufacture and assemble. It was largely
due to the recent advances in Complimentary Metal-Oxide Semiconductor (CMOS)
fabrication techniques that the FOVEON detector technology could be produced with
commercial viability.
Figure 2. Absorption Depth of Silicon with Wavelength. The photodetectors used in FOVEON camera are located at the three depths of 0.2 µm, 0.8 µm and 3 µm [4].

4
Figure 3. Schematic showing the three p-n junctions in a FOVEON pixel [3].
According to FOVEON Inc. press releases, its patented photodetector is able
to achieve color resolutions three times higher than conventional photodetectors
arranged in the Bayer pattern [4]. Since every pixel of the image is detected by a
single photodetector, the FOVEON detector is able to capture three wavelengths
coming from the image, rather than a single wavelength, producing brighter images
and better color representation of the image scene. Conventional photodetector
technology would not only lose image brightness but require complex image post-
processing techniques such as interpolation to obtain a close color match.
According to reviews and articles published on the World Wide Web, the quality of
digital images captured by the FOVEON photodetector may even be comparable to
the photo-emulsion films used in traditional color photography [5]. The CMOS
design of the image sensor also allows processing to be performed at the pixel,
reducing the size required of the image sensor. It also allows pixels to be grouped
together in high frame rate, low resolution applications [6]. At the time of writing, the
FOVEON detector technology has been employed in a number of commercial digital

5
cameras with positive feedback. Judging from the lack of published literature except
one [7], it is assumed that not many attempts have been made to expand the
detection spectrum of the FOVEON detector to include both the near-UV and near-
IR ends of the visible spectrum.
Figure 4. Comparison of FOVEON Detector Technology (above) with Conventional Silicon Photodetector Arrays arranged in the Bayer pattern (below) [1].
There are many potential applications for the FOVEON image sensor. The
military employs numerous imaging systems in the various services for observation,
surveillance, targeting, navigation and tracking purposes. The accuracy and validity
of the analyses derived from these systems are crucial to the success of military
operations and the reduction of mistakes and unnecessary loss of life. Hence, by
employing the FOVEON detector technology in its image analysis and surveillance
6
activities, the military stands to benefit from its higher resolution and more accurate
imaging capabilities. A high level of detail in images allows for better intelligence
collection and precision strike planning. The technology employed for intruder
detection and other target acquisition systems that rely on high image detail may
also be further improved with the FOVEON photodetector. Further benefit may be
derived by the extended detection spectrum to include UV and near IR wavelengths.
Applications that will stand to gain from this research include night vision sighting
equipment and target tracking systems, both applications employing the advantages
of operating in the near IR wavelengths. Near-UV imaging applications include anti-
camouflage applications as well as applications to reduce image blooming caused
by high intensity background lighting.
B. STRUCTURE OF THESIS This report documents the background theory and experimental procedures
employed to achieve the goal of the thesis. It is divided into five chapters. The first
chapter introduces the theoretical background behind photodetectors and outlines
the structure of the research. The second chapter explains the characterization
procedures of the FOVEON detector in detail. The third chapter discusses the
images captured in the near-IR and near-UV wavelengths as well as the theory
behind the perception of color and color image processing. The fourth chapter
discusses the findings from the thesis and various proposals for further study. The
final chapter concludes. The various appendices present detailed findings of this
thesis as well as detailed equipment specifications used in the course of thesis
research.
In the course of this report, the term “FOVEON detector” or “FOVEON image
sensor” will be used to mean the entire FOVEON detector array installed in the
HanVision camera, unless otherwise stated. The term “camera” or “HanVision
camera” will be used to mean the HanVision HVDUO-5M camera purchased for the
thesis research. The term “monochromator” refers to the photodetector
characterization system set up in the Naval Postgraduate School Sensor Research

7
Lab (SRL). The term “invisible” is a generic reference to the near-UV and near-IR
wavelength regions that are the focus of study in this thesis.
C. SYSTEM OVERVIEW 1. General For the purpose of this thesis, the HanVision HVDUO-5M camera, fitted with
a FOVEON X3 image sensor, was used. It has 8-bit digital output for each of the
colors and is capable of recording images in the range of wavelengths of interest. It
is packaged with a number of software applications to control the various modes and
functions of the camera, as well as to perform image analysis. Additional
information on the camera may be obtained from the HanVision company website [8].
The thesis research involved the characterization of the FOVEON detector array in
the camera and subsequently, capturing images in the near-UV and near-IR
wavelengths. In the characterization phase, the responsivity of the FOVEON
detector array as a function of wavelength was measured using a monochromator
and a calibrated photodiode. Next, images were captured using the camera and
suitable optical filters before undertaking further post-processing development. The
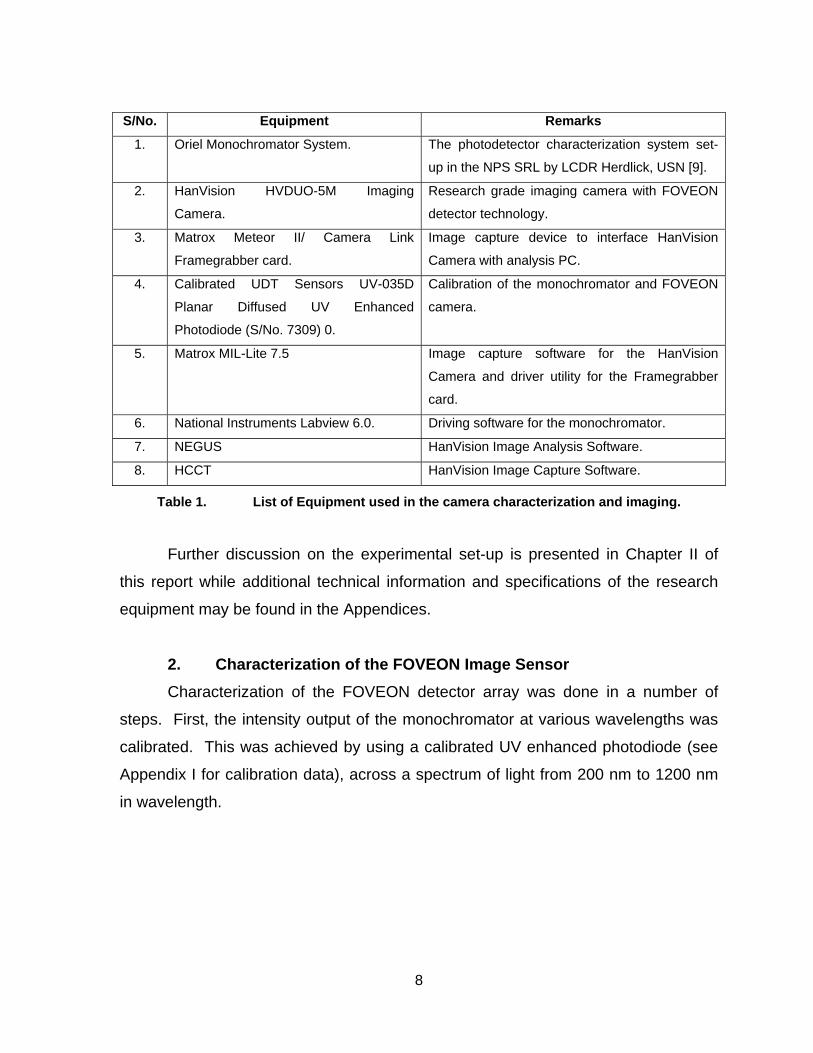
equipment and software products required for this purpose are summarized in Table
1.
8
S/No. Equipment Remarks
1. Oriel Monochromator System. The photodetector characterization system set-
up in the NPS SRL by LCDR Herdlick, USN [9].
2. HanVision HVDUO-5M Imaging
Camera.
Research grade imaging camera with FOVEON
detector technology.
3. Matrox Meteor II/ Camera Link
Framegrabber card.
Image capture device to interface HanVision
Camera with analysis PC.
4. Calibrated UDT Sensors UV-035D
Planar Diffused UV Enhanced
Photodiode (S/No. 7309) 0.
Calibration of the monochromator and FOVEON
camera.
5. Matrox MIL-Lite 7.5 Image capture software for the HanVision
Camera and driver utility for the Framegrabber
card.
6. National Instruments Labview 6.0. Driving software for the monochromator.
7. NEGUS HanVision Image Analysis Software.
8. HCCT HanVision Image Capture Software.
Table 1. List of Equipment used in the camera characterization and imaging.
Further discussion on the experimental set-up is presented in Chapter II of
this report while additional technical information and specifications of the research
equipment may be found in the Appendices.
2. Characterization of the FOVEON Image Sensor Characterization of the FOVEON detector array was done in a number of
steps. First, the intensity output of the monochromator at various wavelengths was
calibrated. This was achieved by using a calibrated UV enhanced photodiode (see
Appendix I for calibration data), across a spectrum of light from 200 nm to 1200 nm
in wavelength.

9
If the responsivity of the calibrated detector is Rref(λ) and power incident on
the detector is Pref(λ) then the measured current signal Sref(λ) can be calculated as
follows :
)()()( λλλ refrefref PRS ×= -------------------- (1)
Thus, the power incident on the photodetector is given by
)()(
)(λλ
λref
refref R
SP =
-------------------- (2)
The intensity of the light incident on the photodiode can be calculated using
the calibrated detector area (I(λ)) as:
)()(
)(λλ
λref
ref
AP
I =
)()(
)(λλ
λ
refref
ref
RAS×
= -------------------- (3)
Next, the HanVision Camera was coupled to a computer using the Matrox
Meteor II/Camera Link Framegrabber and the signal output from the different
detector layers of the FOVEON camera was recorded. The signal response of the
FOVEON detector was retrieved and analysed using the two software applications
provided by HanVision. The HCCT software, provided by the camera manufacturer,
was used for sending image capture commands to the camera, as well as applying
the various exposure and color compensation settings. Images captured were
transferred to the NEGUS software to extract the red, green and blue signal
responses from the image sensor. The raw voltage measurements from the
individual pixel photodetectors were converted into a digital binary code by the
image processing electronics within the camera. These 8-bit digital data,
represented the 0 to 255 monochrome values for each color. These values were
then normalized to obtain the responsivity curves of the image sensor. The process
of measurement was similar to the calibration of the monochromator power using the
10
calibrated photodetector. Multiple measurements were performed to study the
effects of the camera’s exposure time and other settings on the responsivity
measurements.
The responsivities of the three detectors at each pixel Rdet(λ) can be obtained
the measured signal (Sdet(λ)) and area of the detector (Adet(λ)) as follows :
)()()()( detdetdet λλλλ RAIS ××= -------------------- (4)
)()()(
)()(
det
detdet
λλλ
λλA
AP
SR
ref
ref=
⎟⎟⎠
⎞⎜⎜⎝
⎛=
)()(
)()(
)(
det
det
λλ
λλ
λ
refref
ref
AA
RS
S
-------------------- (5)
In the course of the research, it was found that there were certain limitations
in the dynamic range of the camera especially when the signal strength is weak for
UV and NIR wavelengths. Hence, different camera settings and focusing optics
were used to enhance the signal strength. Care was taken to ensure that these
parameters, such as lamp current and focusing of the light source for the photodiode
and camera measurements were compatible for different experiment scenarios.
These limitations will be discussed in detail in the following chapters of this report.
3. Near-UV and Near-IR Imaging with the FOVEON Camera
Although, the FOVEON image sensor is designed primarily to capture visible
light (450 – 700 nm), it is also able to detect near-UV and near-IR wavelengths as
well. According to studies performed by Gilblom and Yoo [7], the FOVEON detector
captures near-UV photons in the top layer of the photodetector, in the region
designed to capture blue light. It also states that near-IR wavelengths would pass
through all three layers, due to its longer wavelength, and produced detection
signals primarily in the bottom layer. This particular characteristic of the image

11
sensor was essential in the image capture of near-UV and near-IR wavelengths.
Image capture and analysis are further elaborated in Chapter III of this report.

12
THIS PAGE IS INTENTIONALLY LEFT BLANK.

13
II. CHARACTERIZATION OF THE FOVEON DETECTOR ARRAY
A. GENERAL
Responsivity describes the current or voltage produced by the photodiode
when light of a given power impinges on it. Responsivity varies for different
wavelengths and normally peaks around the bandgap energy of a photodiode [2].
The first step in the thesis was to determine the responsivity of the FOVEON
detector array as a function of wavelength. The responsivities of the three
photodiodes associated with each pixel showed the sensitivity of the detector to
various wavelengths of light. This was achieved by first calibrating the
monochromator using a factory calibrated UV enhanced photodiode. The signal
responses of the three photodetectors were measured next. From Equation 5, their
responsivities for various wavelengths were calculated. Due to the low power output
of the monochromator at near-UV and violet wavelengths, the blue gain of the
camera was increased, whilst suppressing the red and green response of the
detector. This provided higher signal output at those wavelengths. This chapter
presents the experimental set-up and measurement procedures adopted.
B. EQUIPMENT AND SOFTWARE SET-UP 1. Hardware Set-Up
The hardware set-up for the spectral measurement was straightforward and
primarily involved the Oriel Monochromator system assembled by LCDR Herdlick [9],
as well as the installation of the Matrox Meteor II Framegrabber card to control the
HanVision camera. Without any major adjustments to the layout of the system, the
photodiode and the camera were mounted in the same location on the optical table
for the monochromator light intensity measurements and the camera
characterization, respectively. This is shown in Figure 5 and Figure 6. While slight
adjustments were made to focus the light onto the detector arrays, their position
remained relatively close and may be assumed to be the same. The technical and
operating details of the Oriel monochromator have been well documented in

14
Herdlick’s thesis [9] and will not be covered in this report. The photodiode selected
to calibrate the light intensity output of the monochromator was the UDT UV
enhanced UV-035D Photodiode (see Figure 8), chosen due to its sensitivity in the
UV range. It was factory calibrated from 200 nm to 1100 nm wavelength range (See
Appendix I for more information). The calibrated photodiode was connected to one
of the lock-in amplifiers which read the photocurrent generated by the photodiode.
From the measurements, it was found that the monochromator output had extremely
low intensities in the near-UV and violet-blue region (from 200 nm to 400 nm) of the
spectrum. It was necessary to focus the light from the monochromator to increase
the intensity of light incident on the calibrated photodiode and the camera. Note that
the focused light is incident only the middle section of the FOVEON array.
Figure 5. Block Diagram of Hardware Set-up
Lock-in Amplifier
Optical Chopper Controller
Analysis PC
Optical Chopper Optical
Filter Box
Parabolic Mirror
Flat Mirror
Mounting position of photodiode and
camera Enlarged Diagram of Mounting Position
UV-035D Photodiode
HVDUO-5M Camera
Monochromator IR & QTH Lamps
- +
Power Supply
Camera MDR-26P output to Frame-grabber in PC
RS-232 Sync
Monochromatic Light Beam
Electrical Connection
Source Lighting
Incoming focused light

15
Figure 6. The Oriel Monochromator System used in the Measurement.
There was an initial attempt to apply a reverse bias voltage to the calibrated
photodetector but it was found that the output signal was beyond the lock-in amplifier
range. The photodiode was still able to detect the light input extremely well without
the bias. This was verified by comparing the resulting responsivity curve with
information contained in its product brochure [10]. As such, the calibration
proceeded without any external bias in the photodiode. Due to the high sensitivity of
the photodiode and the maximum detection limits of the lock-in amplifier, the output
slit width of the monochromator was adjusted to 0.5 mm. The current in the
monochromator light source was set to either 7 A out of maximum 8.33 A. The
lower current setting was used primarily for the measurements beyond 400 nm in
order to prevent saturation of the signal on the camera or the photodiode. The
higher lamp current setting provided more power when measuring the shorter
wavelengths (less than 400 nm) of light. Due to the limitations in the measurement
Lock-in Amplifiers
Analysis PC Light SourceMonochromator
Parabolic Mirrors
Location of Calibrated Photodiode and Camera

16
equipment, care was taken to prevent signal overloading yet attempting to maintain
sufficient signal strength for the measurement. As such, the calibration of the
monochromator light intensity was done with multiple settings in order to select the
optimal result set for analysis. Another measure adopted to prevent overloading
was the focusing of the monochromatic light on the detectors. Measurements were
taken with the tightly focused light on the detector as well as spread over the
detector area as illustrated in Figure 7. Optical filters were used to filter the
monochromator light source in order to minimize the second order effects from the
gratings. In addition, the effects of the room lighting were also studied by performing
the calibration both with the room lighting on and another time with it switched off. In
both cases, the results show negligible differences. Data with the same experiment
parameters were used in the calculation of the responsivity values. A summary of
the experiment parameters for the calibration of the monochromator light intensity
using the photodiode is shown in Table 2.
Figure 7. Schematic diagram of monochromatic light beam focused on the detector (left) and spread over detector (right).
Light focused to a slit Light spread
over detector

17
Parameter Value Parameter Value
Optical Chopper Frequency 152 Hz Photodiode Bias Voltage Nil
Photodiode Peak Wavelength 970 nm Photodiode Detector Array Area 5.8 x 5.8
mm2
Monochromator Illuminator Current
Output
7 A Monochromator Output Slit Width 0.5 mm
Minimum Monochromator Output
Wavelength
200 nm Maximum Monochromator Output
Wavelength
1100 nm
Monochromator Output Wavelength
Interval
10 nm Time Interval between signal
recording
5 s
Measurement Range 1 (no filter
used)
200 to
500 nm
Scale on Lock-in Amplifier (Current
setting 106 V/A)
30 mV
(light
spread),
300 mV
(light
focused)
Measurement Range 2 (420 nm filter
used, light spread over detector and
light focused)
400 to
700 nm
Scale on Lock-in Amplifier (Current
setting 106 V/A)
3 V
Measurement Range 3 (620 nm filter
used, light spread over detector and
light focused)
600 to
1200 nm
Scale on Lock-in Amplifier (Current
setting 106 V/A)
3 V
Table 2. Experimental Settings used for Calibrating Monochromator Light Output.
Figure 8. The UDT UV-350D Photodiode mounted on the optical bench.

18
The responsivity of the FOVEON camera was measured next. Although the
HVDUO-5M camera only had 1.51 million individual photodetector elements, it had a
total color resolution of 4.53 megapixels due to its triple layered structure. It has a
24-bit digital output (8-bits for each color) and is able to capture both still and video
images. The camera had flexible exposure settings and other image control
features that were useful for the purpose of the research. For image capturing, the
camera was connected to a PC. The lens of the camera is transparent to near UV
wavelengths.
Figure 9. The HanVision HVDUO-5M Camera (left) [8] and the internal FOVEON X3 Image Sensor (right) [4].
No major changes were made to the hardware set-up from the first stage
except that the camera was placed in the position of the photodiode and connected
to the PC by means of a RS-422 cable via the framegrabber. The same routines
were conducted with the monochromator scanning wavelengths from 200 nm to
1100 nm. The digital signal readouts were recorded from the line profile tool in the
NEGUS application. Since the optical chopper was not employed, the calibration of
the camera was performed in a darkened environment to minimize the signal due to
room lighting. Although similar procedures were followed, the camera
measurements were performed in multiple stages to adjust for the effects of
exposure time and other camera settings during the responsivity measurement.
Measurements were also taken with the built-in camera filter (400 to 660 nm) on and

19
subsequently removing it. The Table 3 summarizes the experimental settings for
measuring the camera responsivity. Further details about the camera software
settings are discussed in the following section.
Camera Experiment Setting S/No.
Lamp Current
(A)
Wavelength Range (nm)
Monochromator Filter (nm)
Gray Mean Value
Exposure Timing
(ms)
Focusing of Monochromatic
Light
1. 8.33 200-500 None None 12.5 Focused Slit
2. 8.33 200-500 None -10, -10, 20 25 Focused Slit
3. 8.33 200-500 None -10, -10, 20 12.5 Focused Slit
4. 7.0 400-700 420 None 12.5 Spread over
detector
5. 7.0 600-1200 620 None 12.5 Spread
Table 3. Experiment parameters for measuring the HVDUO-5M responsivity.
2. Software Set-Up
There were two main programs that were used to run the experiment. The
first was the existing LabView program compiled by Herdlick [9] to operate the entire
monochromator system. It primarily controlled the monochromator and recorded of
the voltage readouts from the lock-in amplifiers.
20
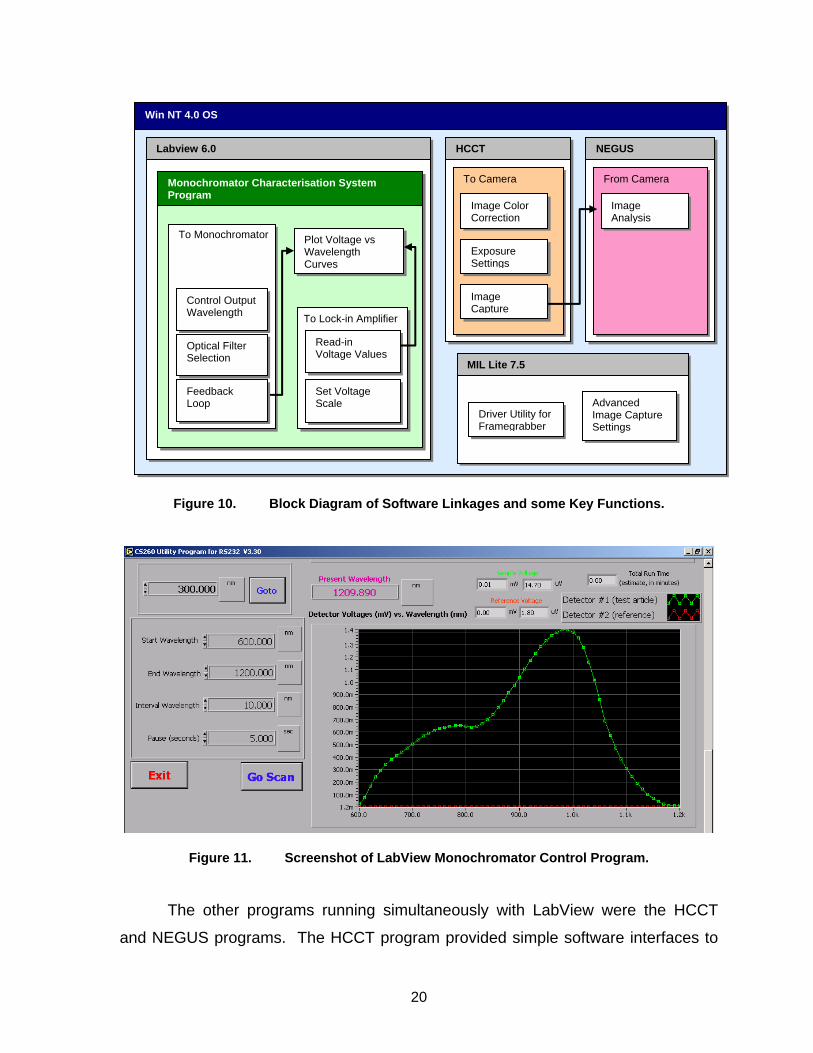
Figure 10. Block Diagram of Software Linkages and some Key Functions.
Figure 11. Screenshot of LabView Monochromator Control Program.
The other programs running simultaneously with LabView were the HCCT
and NEGUS programs. The HCCT program provided simple software interfaces to
HCCT
MIL Lite 7.5
Win NT 4.0 OS
Monochromator Characterisation System Program
Labview 6.0
Control Output Wavelength
Optical Filter Selection
Set Voltage Scale
Read-in Voltage Values
To Lock-in Amplifier
Plot Voltage vs Wavelength Curves
NEGUS
Feedback Loop
To Camera
Driver Utility for Framegrabber
Image Color Correction
Image Capture
Exposure Settings
From Camera
Image Analysis
Advanced Image Capture Settings
To Monochromator

21
adjust the color compensation, exposure time, shutter and other settings for the
HVDUO-5M camera [11]. Built into the camera was an image processing chip that
translated signals generated by the three photodetector layers into sRGB color data
for subsequent display. Depending on the color compensation settings, this
translation may produce images with varying hue adjustments. Therefore, in order
to obtain the most accurate color captured by the camera, it was necessary to
disable the camera’s color adjustment function by setting the color settings to “unit”.
To improve the signal measured in the shorter wavelengths (200 nm to 400 nm), the
exposure time for the camera was increased and the Gray Mean Value was adjusted.
The Gray Mean Value setting allows for the manual compensation of the individual
red, green and blue signal outputs from the camera. This function was used to
improve the detector response in the blue layer when capturing near-UV and violet
light. In order for the image sensor to capture equal amounts of light at every pixel
line, the shutter setting was set to rolling shutter.
Figure 12. Screenshots of the HCCT software showing the interfaces for adjusting various image capture settings for the HVDUO-5M camera.
22
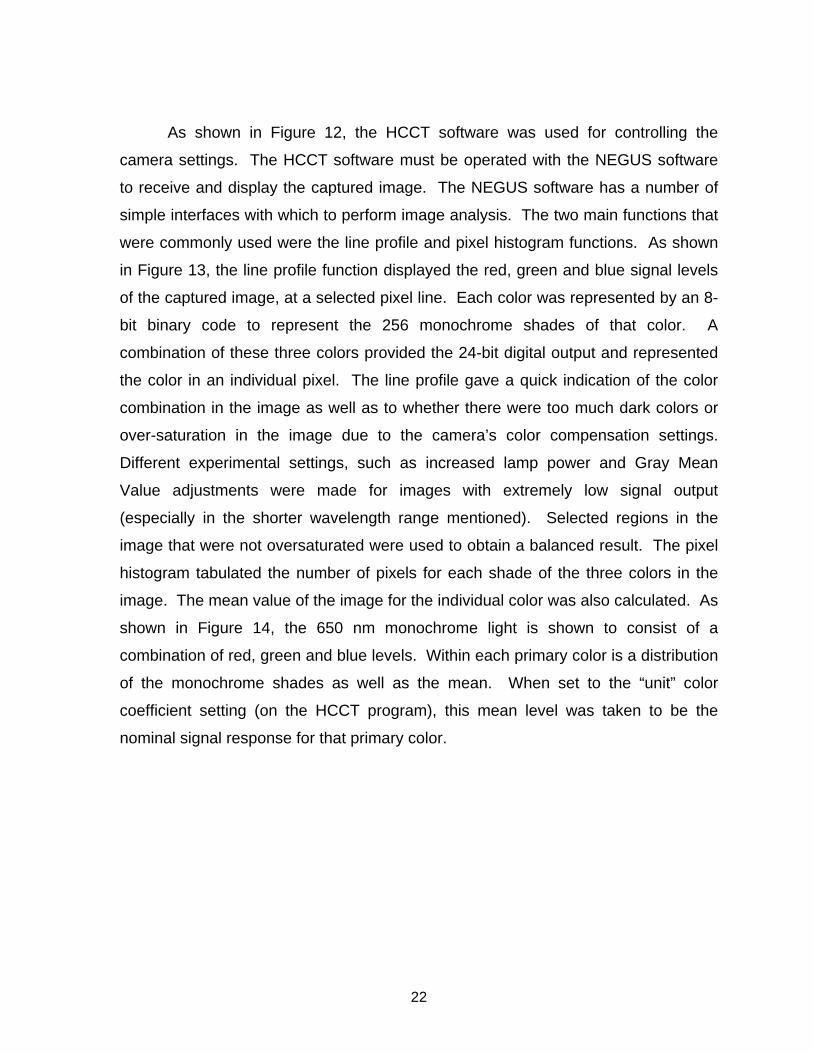
As shown in Figure 12, the HCCT software was used for controlling the
camera settings. The HCCT software must be operated with the NEGUS software
to receive and display the captured image. The NEGUS software has a number of
simple interfaces with which to perform image analysis. The two main functions that
were commonly used were the line profile and pixel histogram functions. As shown
in Figure 13, the line profile function displayed the red, green and blue signal levels
of the captured image, at a selected pixel line. Each color was represented by an 8-
bit binary code to represent the 256 monochrome shades of that color. A
combination of these three colors provided the 24-bit digital output and represented
the color in an individual pixel. The line profile gave a quick indication of the color
combination in the image as well as to whether there were too much dark colors or
over-saturation in the image due to the camera’s color compensation settings.
Different experimental settings, such as increased lamp power and Gray Mean
Value adjustments were made for images with extremely low signal output
(especially in the shorter wavelength range mentioned). Selected regions in the
image that were not oversaturated were used to obtain a balanced result. The pixel
histogram tabulated the number of pixels for each shade of the three colors in the
image. The mean value of the image for the individual color was also calculated. As
shown in Figure 14, the 650 nm monochrome light is shown to consist of a
combination of red, green and blue levels. Within each primary color is a distribution
of the monochrome shades as well as the mean. When set to the “unit” color
coefficient setting (on the HCCT program), this mean level was taken to be the
nominal signal response for that primary color.

23
Figure 13. Screenshot of the NEGUS software showing the line profile function.
Line of Interest
Line profile of the selected pixel line. Note the combination of red, green and blue signals making up the displayed color.

24
Figure 14. Image of a monochrome light at 650 nm wavelength showing the contribution
from the red, green and blue signals.
3. Results
From the approach described in the previous chapter, the intensity of the
monochromator was found to be as shown in Figure 15. The curves from different
wavelength regions generally show continuity and overlap. As mentioned, the
calibration measurement had to be done in stages with suitable optical filters applied
to remove the contribution from second order effects. The results from each stage
are represented by each of the curves. The sharp drop-off at 1100 nm was due to
the long wavelength cutoff of the photodiode due to bandgap of silicon (1.12 eV at
300 K). It can be seen that intensity of the output of the monochromator varies with
wavelength. It has peak intensity at approximately 1000 nm for a lamp current of 7
A. It is particularly weak in the near-UV and violet-blue regions of 200 nm to 400 nm.

25
This characteristic posed some challenges for the responsivity measurements for
the camera. Due to the low light intensity at this region, the exposure time for the
camera had to be set at 25 ms and Gray Mean Value adjustments made to the
camera to capture more light. This caused over-saturation of the image sensor for
the green and red signals beyond 400 nm. The Gray Mean Value function available
in the HCCT software was used to reduce the red and green signals and boost the
blue response. Multiple measurements were taken with different camera settings,
as summarized in Table 3, to plot the camera response curve.
Calibrated Intensity of Lamp vs Wavelength
0
0.01
0.02
0.03
0.04
0.05
0.06
0.07
0.08
0.09
200 300 400 500 600 700 800 900 1000 1100 1200
Wavelength (nm)
Inte
nsity
( µW
/mm
2 )
200 to 500 Calibrated 400 to 700 Calibrated 600 to 1200 Calibrated
Figure 15. Calibrated Intensity of the Monochromator output vs Wavelength.
As mentioned, the measurements were taken with the monochromatic light
spread over the calibrated detector, and a second setting with light focused on the
detector. Similar settings were also used during the characterization of the camera.
As the near-IR photons are captured in the red layer, the resultant image is
artificially colored by the camera image processor to display it in a reddish color. For

26
the second case with focused light, the entire area of the image was analysed as the
signals were not oversaturated even with the Gray Mean Value adjustment.
Figure 16. Image of 1000 nm wavelength monochromatic light. Since most of the signal at
this wavelength comes from the bottom sensor, the software assigns it red color.
Numerous measurements were taken with camera in various configurations.
This was to study the effects each setting had on the results as well as to select the
most suitable result for analysis. It was important that the captured images were not
over-compensated by the camera’s internal image processor, yet had a sufficient
range of signal response. The most suitable experimental set-up was with the
monochromator light source current set at 7 A for light spread over the detector and
at 8.33 A for light focused. The camera exposure setting was at 25 ms and the
monochromator slit widths at 0.5 mm. Figure 17 shows the estimated FOVEON
responsivity in the visible region (with the camera filter in place). The response
curves are similar to that generated by FOVEON [12]. The undulating profiles of the
curves are due to the insufficient dynamic range of the camera. The 8-bit digital
output for each color was not sufficient to provide the required signal resolution
needed to plot smoother curves. The lock-in amplifiers had an analog measurement
range from less than 3 mV to more than 3 V which is equivalent to a 10-bit digital
27
output. However, the HVDUO-5M camera could only produce 8-bit digital outputs.
Although the MIL-Lite analysis software could extract up to 16-bit digital output, it
was not practical since the limiting factor of the camera’s 8-bit/channel analogue-to-
digital converter. The program would artificially pad the digital output from the
camera even if output settings were changed to higher resolution. This would make
the results unrealistic and unusable for analysis.
FOVEON Responsivity (With Camera Filter)
0
0.1
0.2
0.3
0.4
0.5
0.6
0.7
400 450 500 550 600 650 700
Wavelength (nm)
Res
pons
ivity
(Α/W
)
R (400-700) G (400-700) B (400-700)
Figure 17. The measured FOVEON responsivity for visible light filtered by the built-in camera filter.
Figure 18 shows the responsivity curves from 600 nm to 1100 nm for light
spread over the detector. The curves show two stages of measurement, from 400
nm to 600 nm, and from 600 nm to 1100 nm. The overlap in the responsivity curves
for different regions indicates the repeatability in the measurements. The red
responsivity above 700 nm demonstrated the FOVEON image sensor’s ability to
detect near-IR wavelengths. As shown in Figure 16, invisible monochromatic light at
1000 nm wavelength could be imaged.
28
Estimated FOVEON Responsivity (without Camera Filter)
0
0.5
1
1.5
2
2.5
3
3.5
400 500 600 700 800 900 1000 1100Wavelength (nm)
Res
pons
ivity
( Α/W
)
R (400-700) G (400-700)B (400-700) R (600-1200)G (600-1200) B (600-1200)
Figure 18. Measured responsivity from 400 nm to 1100 nm showing the signal response in
the near-IR wavelengths.
The responsivity curves in the near-UV to blue wavelengths are shown in
Figure 19. Although the light was focused on the camera, it was still not bright
enough at these wavelengths to provide a sufficiently large signal. To improve the
response in the blue signal while suppressing the red and green signals, the Gray
Mean Value setting of the camera was adjusted to 250, 250, 20, in the order of red,
green and blue input. The Gray Mean Value function was a white balance function
allowing the manual adjustment of the color coefficients in the camera. Under
different lighting, the same colors will appear differently due the reflectance of the
object being imaged. This is also known as metamerism, which will be elaborated in
Chapter IV. With suitable input values, the camera can compensate for this effect
and produce images with colors that match better to the actual scene. By setting
higher levels of a particular primary color and lower input values of another, the
camera automatically reduces the signal of output of the color with higher input and
increases the color with a lower input value. For example, in the experiments, 250,
250, 20 were chosen as a suitable input for the red, green and blue signals
respectively. The camera then reduced the red and green signals while boosting the

29
blue output. For the near-UV imaging, this worked to increase the very weak blue
response and reduce the red and green signals largely caused by noise in the
system. Near-UV signals captured in the blue layer were amplified in this manner to
produce the image shown in Figure 20.
Estimated FOVEON Responsivity
0
0.5
1
1.5
2
2.5
3
200 250 300 350 400 450 500
Wavelength (nm)
Res
pons
ivity
(Α/W
)
Figure 19. Measured blue responsivity with 250, 250, 20 Gray Mean Value setting enabled.

30
Figure 20. Imaged captured for near-UV light at 200 nm with Gray Mean Value of 250, 250, 20 camera setting. The blue color indicates the detection of near-UV by the “blue” detector.
The relationship between the Gray Mean Value adjustments and the blue
output signal was studied for the 250, 250, x setting used in the experiment. The red
and green inputs were fixed to a value of 250 each while the blue input was
increased from a value of 1 to 250. Preliminary results have shown to be non-linear
as shown in Figure 21. More experiments are necessary to provide conclusive
results, which are beyond the scope of this report. Hence, due to this uncertainty,
the near-UV curves were not normalized and plotted with the curves for the visible
and near-IR measurements. Nevertheless, the results showed that the Gray Mean
Value function could be used as a software gain to image low intensity light at
wavelengths below 400 nm.

31
Blue Response for 250, 250, 20 Gray Mean Value Setting
05
101520253035404550
20 70 120 170 220
Blue Gray Mean Value Input
Blu
e Si
gnal
Out
put
Figure 21. The relationship between the Gray Mean Value input at 250, 250, x setting and the blue output signal.

32
THIS PAGE IS INTENTIONALLY LEFT BLANK.

33
III. MULTISPECTRAL IMAGING WITH THE FOVEON IMAGE SENSOR
A. GENERAL
Traditional color imaging systems employ photodetector arrays arranged in
the Bayer pattern capture images with dedicated blue, green and red detectors.
Other sensors such as the Triple Charged Coupled Devices (CCD) systems split the
incoming light into the three primary colors before recombination. As illustrated in
Figure 4, the FOVEON image sensor is captures images with the same triple-well
detector at every pixel location without the need for image interpolation and complex
device assembly. However, to produce visible images that are illuminated by non-
visible light requires image post-processing. This chapter discusses the theoretical
background behind color perception and digital imaging in the HanVision camera as
well as some of the outdoor images captured in the near-UV and near-IR
wavelengths.
B. NEAR-UV AND NEAR-IR IMAGING 1. Color Perception and Digital Imaging There are two main image receptors in the human eye. The rod light sensors
are extremely sensitive to changes in light levels and are therefore responsible for
detecting motion, our peripheral vision and for our ability to see in the dark. They
are however, not sensitive to color. The cone sensors on the other hand are
sensitive to color and are responsible for our visual acuity. From Kalloniatis and
Luu’s [13] website, there are three types of cones in our eyes and they detect in the
blue (S-cone), green (M-cone) and red (L-cone) wavelengths. They have a range of
spectral sensitivities and are represented by tristimulus (or color matching) functions
as shown in Figure 22. As presented in Gilblom, Yoo and Ventura’s paper on color
imaging [4], the goal of imaging systems is to produce images that match these
tristimulus curves as closely as possible. This will produce images that are
perceived to be most accurately matched to the actual image scene. The FOVEON
image sensor and other conventional photodetector arrays employ this concept to
34
produce images in these three colors, in order for the human nervous system to
recognize them.
Figure 22. “Spectral sensitivity of the S-cone, M-cone and L-cone. Combined results from various authors using different methods including retinal densitometry from Rushton (green), microspectrometry from Brown and Wald (red) and increment threshold producing artificial monochromasy from Brinley (black) and increment threshold measurements from Wald (X
blue) (From Moses, R. S. and Hart, W. M (Ed) Adler’s Physiology of the Eye, Clinical Application, St. Louis; The C. V. Mosby Company, 1987)” Extracted from Kalloniatis & Luu [13].
The FOVEON image sensor is a CMOS chip. As shown in Figure 23,
photons captured by individual photodetector pixels are converted into voltage
signals at the pixel location, unlike CCD detectors [14]. This reduces the data
processing requirements within the camera itself. Voltage levels at every pixel in all
three layers may also be captured for data processing. As shown in Figure 24, each
layer in the FOVEON image sensor captures a specific band of wavelengths.
However, longer wavelengths that pass through the upper layers generates signals
not only in the intended layer but its upper layers as well. This produces voltage
readouts in multiple layers when longer wavelengths are captured. According to the
study by Gilblom et al. 0 [4], although blue and green responses are produced even
when red or near-IR wavelengths are captured, the signals are minimal due to the
relatively thin absorption regions in these upper layers.
35
Figure 23. Image Processing within a CMOS Sensor [14].
Figure 24. Schematic of FOVEON camera pixel and Absorption Mechanism for the various Wavelengths.
The actual color of the object is obtained by the addition of the three primary
colors measured at each of the layers. These values are converted into binary
Blue Layer
Green Layer
Red Layer
FOVEON Photodetector Legend : Voltage Output
Near UV Wavelength
Blue Wavelength
Green Wavelength
Red Wavelength
Near IR Wavelength

36
codes and sent to the PC to be displayed as color images. To adjust the image
color for various lighting conditions, various color settings programmed into the
camera. These color settings adjust the blue, green and red responses of the image
sensor to produce colors that match the image scene as closely as possible. For
special applications such as this work, the response settings for all three layers are
set to unity and the Gray Mean Value function may be used to manually adjust the
white balance of the image. Figure 25 show the block diagram of a HVDUO-10M
camera which is almost similar to the HVDUO-5M model used for this thesis. The
specifications for both cameras are the same with the exception of lesser dynamic
range and a physically smaller detector array installed in the latter model.
Figure 25. HVDUO-10M Camera Block Diagram (Similar to the HVDUO-5M Camera used for this Thesis) [12].
2. Outdoor Imaging
Numerous outdoor scenes were captured with the HVDUO-5M camera for
analysis. The camera set-up consisted of the HVDUO-5M connected to the PC.
Images of downtown Monterey and Pacific Grove (Figure 26), approximately 2 km
away, were captured from the roof of Spanagel Hall in the Naval Postgraduate
School. Other image scenes include the Monterey Bay and passing aircraft arriving
and leaving the Monterey Peninsular Airport. An optical filter rack was placed in
front of the camera to mount the various filters used in the experiment. The four
optical filters used in the experiment were the HOYA U325C, U360, L38 and IR85

37
filters. The U325C is a UV transmission filter and allows the transmission of
wavelengths from approximately 240 nm to 400 nm. It also allows some
transmission in the near-IR region from 690 nm to 1100 nm, although this has
marginal effect on the captured image. The U360 filter is a narrowband blue pass
filter with range from 320 nm to 400 nm. The L38 is a sharp-cut filter allowing the
transmission of visible and IR light from 370 nm to 2800 nm. Finally, the IR85 filter
allows the transmission of IR light from 850 nm to 2800 nm. Their respective
transmission curves were obtained from the HOYA filters company website [ref
http://www.hoyafilters.com] and are reproduced in Appendix II of this report.
The effects of various optical filters on the images can be seen in the
following sections of this report. The camera was set to “unit” color setting, hence
no color compensation was applied to the images. The camera’s own filter (400 nm
to 660 nm) was removed when the HOYA filters were affixed. As the FOVEON
image sensor is able to detect all three colors on a single pixel, the camera is able to
have higher image resolution despite having relatively lesser number of pixels (only
1.5 megapixels physically). As shown in Figure 26, the camera is able to capture
the image of a car from 2 km away. This achieved by sharpening the image with the
NEGUS image analysis software.
Figure 26. Image of downtown Monterey captured with the camera filter (400 nm to 660 nm) affixed. The zoomed-in image of a car is shown.
38
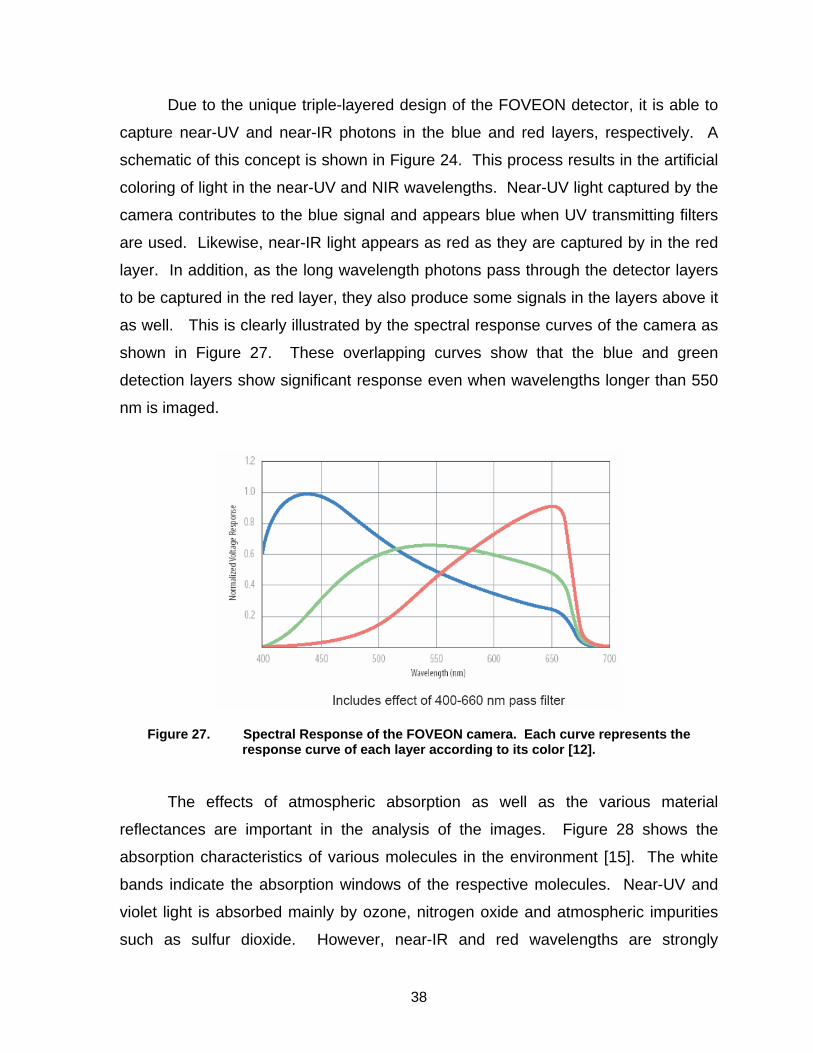
Due to the unique triple-layered design of the FOVEON detector, it is able to
capture near-UV and near-IR photons in the blue and red layers, respectively. A
schematic of this concept is shown in Figure 24. This process results in the artificial
coloring of light in the near-UV and NIR wavelengths. Near-UV light captured by the
camera contributes to the blue signal and appears blue when UV transmitting filters
are used. Likewise, near-IR light appears as red as they are captured by in the red
layer. In addition, as the long wavelength photons pass through the detector layers
to be captured in the red layer, they also produce some signals in the layers above it
as well. This is clearly illustrated by the spectral response curves of the camera as
shown in Figure 27. These overlapping curves show that the blue and green
detection layers show significant response even when wavelengths longer than 550
nm is imaged.
Figure 27. Spectral Response of the FOVEON camera. Each curve represents the response curve of each layer according to its color [12].
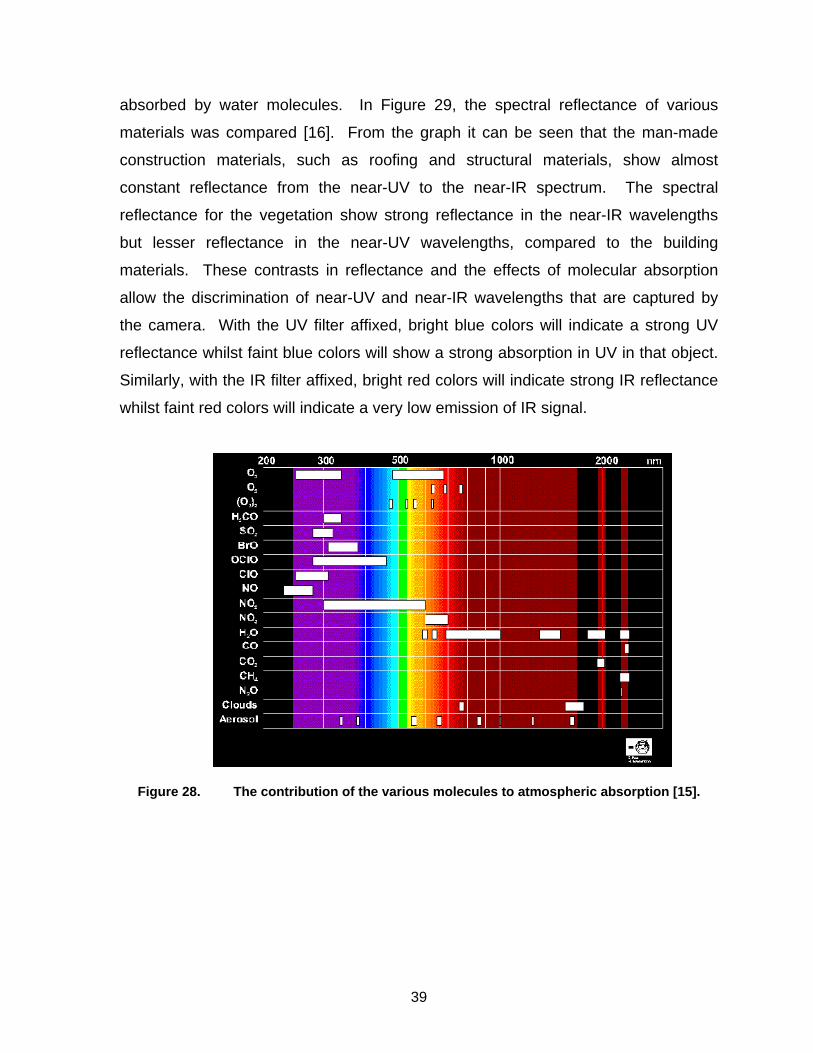
The effects of atmospheric absorption as well as the various material
reflectances are important in the analysis of the images. Figure 28 shows the
absorption characteristics of various molecules in the environment [15]. The white
bands indicate the absorption windows of the respective molecules. Near-UV and
violet light is absorbed mainly by ozone, nitrogen oxide and atmospheric impurities
such as sulfur dioxide. However, near-IR and red wavelengths are strongly
39
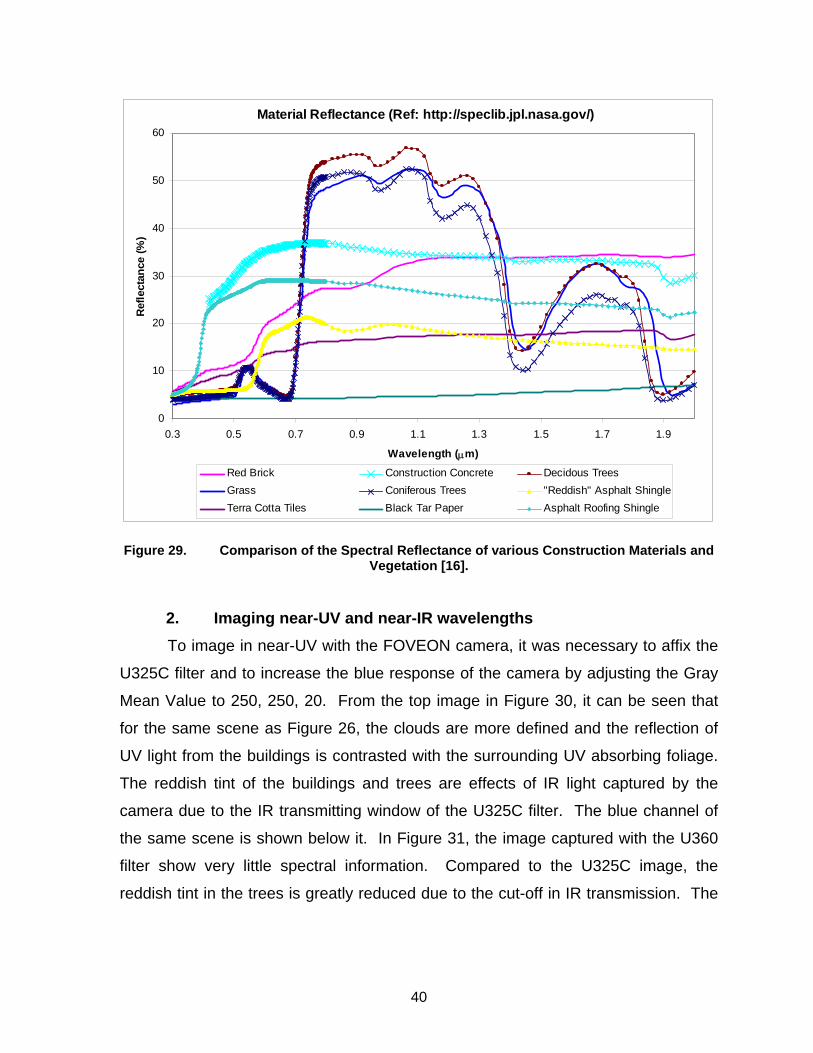
absorbed by water molecules. In Figure 29, the spectral reflectance of various
materials was compared [16]. From the graph it can be seen that the man-made
construction materials, such as roofing and structural materials, show almost
constant reflectance from the near-UV to the near-IR spectrum. The spectral
reflectance for the vegetation show strong reflectance in the near-IR wavelengths
but lesser reflectance in the near-UV wavelengths, compared to the building
materials. These contrasts in reflectance and the effects of molecular absorption
allow the discrimination of near-UV and near-IR wavelengths that are captured by
the camera. With the UV filter affixed, bright blue colors will indicate a strong UV
reflectance whilst faint blue colors will show a strong absorption in UV in that object.
Similarly, with the IR filter affixed, bright red colors will indicate strong IR reflectance
whilst faint red colors will indicate a very low emission of IR signal.
Figure 28. The contribution of the various molecules to atmospheric absorption [15].
40
Material Reflectance (Ref: http://speclib.jpl.nasa.gov/)
0
10
20
30
40
50
60
0.3 0.5 0.7 0.9 1.1 1.3 1.5 1.7 1.9
Wavelength (µm)
Ref
lect
ance
(%)
Red Brick Construction Concrete Decidous TreesGrass Coniferous Trees "Reddish" Asphalt ShingleTerra Cotta Tiles Black Tar Paper Asphalt Roofing Shingle
Figure 29. Comparison of the Spectral Reflectance of various Construction Materials and Vegetation [16].
2. Imaging near-UV and near-IR wavelengths To image in near-UV with the FOVEON camera, it was necessary to affix the
U325C filter and to increase the blue response of the camera by adjusting the Gray
Mean Value to 250, 250, 20. From the top image in Figure 30, it can be seen that
for the same scene as Figure 26, the clouds are more defined and the reflection of
UV light from the buildings is contrasted with the surrounding UV absorbing foliage.
The reddish tint of the buildings and trees are effects of IR light captured by the
camera due to the IR transmitting window of the U325C filter. The blue channel of
the same scene is shown below it. In Figure 31, the image captured with the U360
filter show very little spectral information. Compared to the U325C image, the
reddish tint in the trees is greatly reduced due to the cut-off in IR transmission. The

41
contrasts in the clouds, buildings and trees have also been reduced due to the cut-
off in near-UV transmission.
Figure 30. Image of downtown Monterey captured with U325C filter (240 nm to 400 nm) (top) and the same scene in its blue channel (bottom).
Figure 31. Image of downtown Monterey captured with U360 filter (320 nm to 400 nm).

42
With the sun shining from behind the camera, images of Monterey Bay were
captured with the U325C and U360 filters. From Figure 32, high near-UV reflection
off the surface of the sea can be contrasted with the low near-UV reflection from the
buildings and the trees. In addition, sailing boats can be easily distinguished against
the color of the sea.
Figure 32. Image of Monterey Bay captured with U325C filter (240 nm to 400 nm).
Near-IR wavelengths were captured with the L38 and IR85 filters. From
Figure 33, the L38 filter allows the transmission of both visible and near-IR
wavelengths. There is noticeable absence in the blue signal but high IR reflectance
from the trees and the houses is clearly visible. From Figure 34, the high contrast
between the clouds and the sky can be seen clearly with the IR85 filter. However,
compared to the previous figure, there is not much contrast between the houses and
the trees due to similar near-IR reflectance from these objects.
43
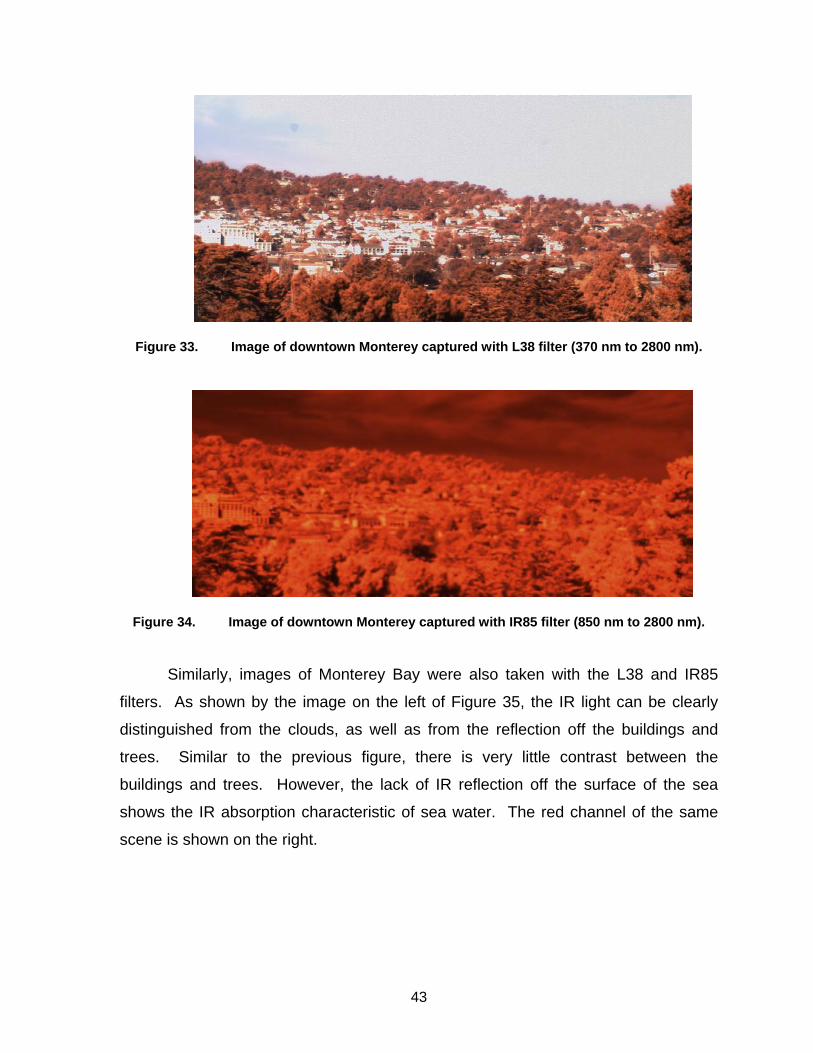
Figure 33. Image of downtown Monterey captured with L38 filter (370 nm to 2800 nm).
Figure 34. Image of downtown Monterey captured with IR85 filter (850 nm to 2800 nm).
Similarly, images of Monterey Bay were also taken with the L38 and IR85
filters. As shown by the image on the left of Figure 35, the IR light can be clearly
distinguished from the clouds, as well as from the reflection off the buildings and
trees. Similar to the previous figure, there is very little contrast between the
buildings and trees. However, the lack of IR reflection off the surface of the sea
shows the IR absorption characteristic of sea water. The red channel of the same
scene is shown on the right.

44
Figure 35. Image of Monterey Bay captured with IR85 filter (850 nm to 2800 nm) (left) and the same scene showing its red channel (right).
Other images including passing aircraft were also imaged with the camera.
From Figure 36, the outline of the aircraft as well as the IR reflection off its body can
be clearly seen. It was found that the aircraft was difficult to locate in visible light,
without the IR filter, even on a clear day. At the same distance from the observer,
the aircraft is not well contrasted against the surrounding sky in a visible image.
With the IR filter applied, the glare from the sky is greatly reduced providing high
contrast between the aircraft and its surroundings. Due to the high resolution of the
camera, it is also able to capture very fine image details even in a monochrome
color such as red.
Figure 36. The rear of a passing jet captured with the IR85 filter (850 nm to 2800 nm).
In Figure 37, a camouflage uniform was set up in the midst of some
vegetation. With the camera’s visible filter (400 nm to 660 nm) on, the scenery looks
green and there is not much contrast between the uniform and its surroundings.

45
Hence even in the day, the shape of the uniform is not easily detected. With the
camera filter removed and the UV325C filter on, the image is illuminated more with
the sun’s UV light and the silhouette of the uniform appears more clearly than the
first picture (circled). Figure 38 shows the same scene in its respective red, green
and blue channels. Notice that the blue channel gives the best contrast, allowing the
uniform to be identified easily.
Figure 37. Set-up of a camouflage uniform (circled) in the midst of vegetation showing the image captured in visible light (left) and the UV image (right).
Figure 38. The UV image of the camouflage uniform set-up presented in its respective red (left), green (center) and blue (left) channels. Notice the best contrast is in the blue channel.

46
THIS PAGE IS INTENTIONALLY LEFT BLANK.
47
IV. DISCUSSION AND RECOMMENDATIONS
A. NEAR-UV AND NEAR-IR IMAGING
From the discussions and the figures presented in the previous chapter, there
are many advantages of the FOVEON camera. Due to its spectral responsivity in
the near-UV and near IR wavelengths, it can be easily configured for imaging in
these wavelengths using external filters. The detection of UV and IR wavelengths in
the blue and red layers of the image sensor allows these wavelengths to be
artificially colored. Color coefficients may translate these wavelengths into
representative colors, other than red or blue. In addition, the brightness or contrast
of the image captured in visible light may be enhanced by the presence of near-UV
or near-IR illumination. One of the limitations of employing near-UV and near-IR
imaging is in the atmospheric attenuation effects. As shown in Figure 28, molecules
and impurities present in the environment may scatter or absorb bands of near-UV
and near-IR light. Such interactions reduce the intensity of these wavelengths and
limit the effective range of operations. Spectral reflectances of various materials
also play a role in contrasting the objects imaged in these wavelengths. However,
these features can be used for identification of various objects if the spectral
information can be extracted.
Presently, there are many applications that involve the use of near-UV and
near-IR wavelengths for imaging. These include defense related applications such
as missile seekers designed with solar-blind capabilities. Due to the different
reflectance of near-UV light, animal conservationists have also employed near-UV
imaging to spot endangered polar bears in the arctic environment that is practically
uniform in contrast and color. Forestry departments also employ the use of near-IR
imaging to monitor forest fires and de-forestation. The success of these civilian
applications may lead to equally successful applications for the military especially in
the areas of intelligence operations. With the appropriate optical filters and data
processing software, the use of the triple-well image sensor for such purposes may

48
improve performance. The following section discusses some of these potential
applications.
B. FURTHER DEVELOPMENT AND POSSIBILE APPLICATIONS
1. Further Development Possibilities in the Design of Triple-Well Image Sensors
While the FOVEON detector has surpassed conventional digital imaging
sensors in performance and has shown that triple-well photodetection may be the
next standard in digital imaging, there are a number of potential areas for research.
With the advances in material engineering and the better understanding of the
human color perception, it is possible to push the boundaries of triple-well
photodetector technology even further. In the area of material research, other
intrinsic or extrinsic materials may be developed with similar or a greater range of
absorption depths. Materials with a greater range of absorption depths may even
allow the development of multi-layered photodetectors that are able to capture not
just three but more wavelengths including the near-UV and near-IR wavelengths.
This development is possible with the growing advancement in semi-conductor
manufacturing processes. Similarly, as there are still a number of inconsistencies
with the theory of trichromatic vision and its opposing theories [17], it may be
worthwhile to develop photodetectors with spectral sensitivities in more wavelength
parameters than just the tristimulus curves. An achromatic detector that detects
black and white will definitely compliment the imaging performance of the present
FOVEON technology very well.
Present studies have proven that the FOVEON detector is able to perform
basic imaging in the near-UV and near-IR wavelengths. However, more work is
required in the image post-processing stage to convert data captured in these
wavelengths into useful and intuitive information for the human operator. In addition,
the resolution of the triple-well photodetector needs to be explored both for remote
sensing applications as well as microscopy. In a bid to provide higher resolution
imaging capabilities, there has been much study into the effects of sensor shape and
the arrangement of the various individual detectors. The article by Qi and Synder
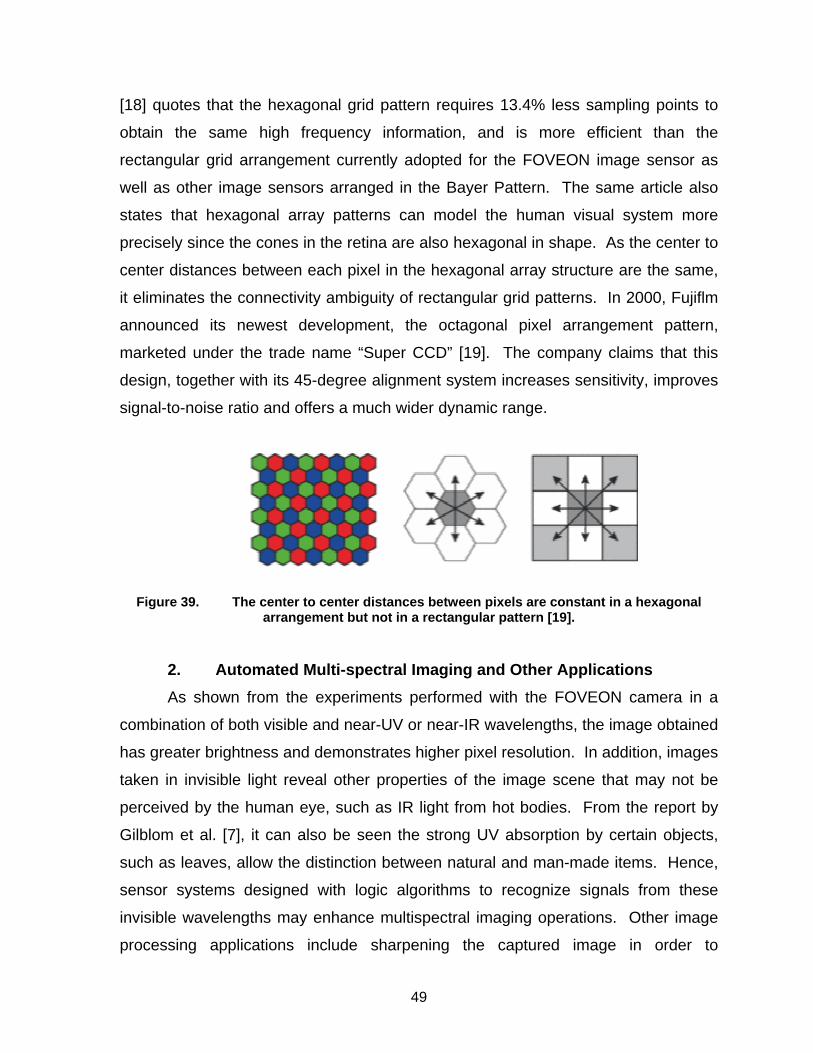
49
[18] quotes that the hexagonal grid pattern requires 13.4% less sampling points to
obtain the same high frequency information, and is more efficient than the
rectangular grid arrangement currently adopted for the FOVEON image sensor as
well as other image sensors arranged in the Bayer Pattern. The same article also
states that hexagonal array patterns can model the human visual system more
precisely since the cones in the retina are also hexagonal in shape. As the center to
center distances between each pixel in the hexagonal array structure are the same,
it eliminates the connectivity ambiguity of rectangular grid patterns. In 2000, Fujiflm
announced its newest development, the octagonal pixel arrangement pattern,
marketed under the trade name “Super CCD” [19]. The company claims that this
design, together with its 45-degree alignment system increases sensitivity, improves
signal-to-noise ratio and offers a much wider dynamic range.
Figure 39. The center to center distances between pixels are constant in a hexagonal arrangement but not in a rectangular pattern [19].
2. Automated Multi-spectral Imaging and Other Applications As shown from the experiments performed with the FOVEON camera in a
combination of both visible and near-UV or near-IR wavelengths, the image obtained
has greater brightness and demonstrates higher pixel resolution. In addition, images
taken in invisible light reveal other properties of the image scene that may not be
perceived by the human eye, such as IR light from hot bodies. From the report by
Gilblom et al. [7], it can also be seen the strong UV absorption by certain objects,
such as leaves, allow the distinction between natural and man-made items. Hence,
sensor systems designed with logic algorithms to recognize signals from these
invisible wavelengths may enhance multispectral imaging operations. Other image
processing applications include sharpening the captured image in order to

50
distinguish the finer details before processing the image with edge detection
algorithms to provide higher contrast between the subject and the surrounding
features. Present multi-spectral imaging techniques also include fusing images
captured in different wavelengths together. Some of the potential military
applications include the detection of armored vehicles in foliage as well as other
counter-camouflage applications. Compared to a Foliage Penetration Radar, a
CMOS chip that is able to perform multi-spectral imaging has much potential in man-
portable target designation and surveillance operations.
Other areas of potential development for the FOVEON image sensor include
improvement in the responsivity especially for near-UV light as well as near-IR
imaging for night vision applications.

51
V. CONCLUSION
While the aim of the thesis was achieved, there were a number of limitations
in the thesis research that may be improved for future studies. Due to the time
available and the scope of this thesis, it was not able to integrate the camera to
other image analysis applications and image capture devices such as laptop
framegrabber cards. With the camera operating with laptops, more outdoor
sceneries and applications may be explored. In the course of characterizing the
camera, it was also found that the dynamic range of the HVDUO-5M was insufficient
to provide higher resolution results. The FOVEON image sensor outputs digital
signals instead of analog signals due to its CMOS design. For subsequent studies,
the use of cameras with larger dynamic range, preferably 10-bits or more per color,
would be able to provide better results. As the internal color compensation
coefficients of the camera were not know, it was not possible to correlate the effects
of the gain settings with the output response in the three colors.
Despite these limitations, this thesis has been successful in conducting a
preliminary study in the characteristics and the performance of the FOVEON image
sensor. In the course of the research, the Photodetector Characterization System
was calibrated and the responsivity of the FOVEON image sensor was measured
from 200 nm to 1200 nm. Near-IR and near-UV images were also captured with the
aid of various optical filters for image analysis. These images were found to be of
high resolution and capable of distinguishing man-made objects from surrounding
vegetation when imaged with invisible light. Through the course of the research, a
number of topics were explored including the physics behind digital imaging devices
as well as the human perception of color. The advantages of the image sensor and
areas with potential for further development and applications were also discussed.
There is much potential for triple-well photodetectors as digital imaging
devices in the military. Its high spatial and color resolution allows them to be very
suitable for intelligence gathering and surveillance applications. The ability to image

52
near-UV and near-IR wavelengths gives an added edge in the area of multi-spectral
imaging. Due to its CMOS construction, it is small in size and cheaper to mass
produce than CCDs. This is advantageous in man-portability and large-scale
equipping considerations. These are just some of the worthy considerations in favor
of triple-well photodetectors replacing conventional photodetectors in both civilian
and military applications.
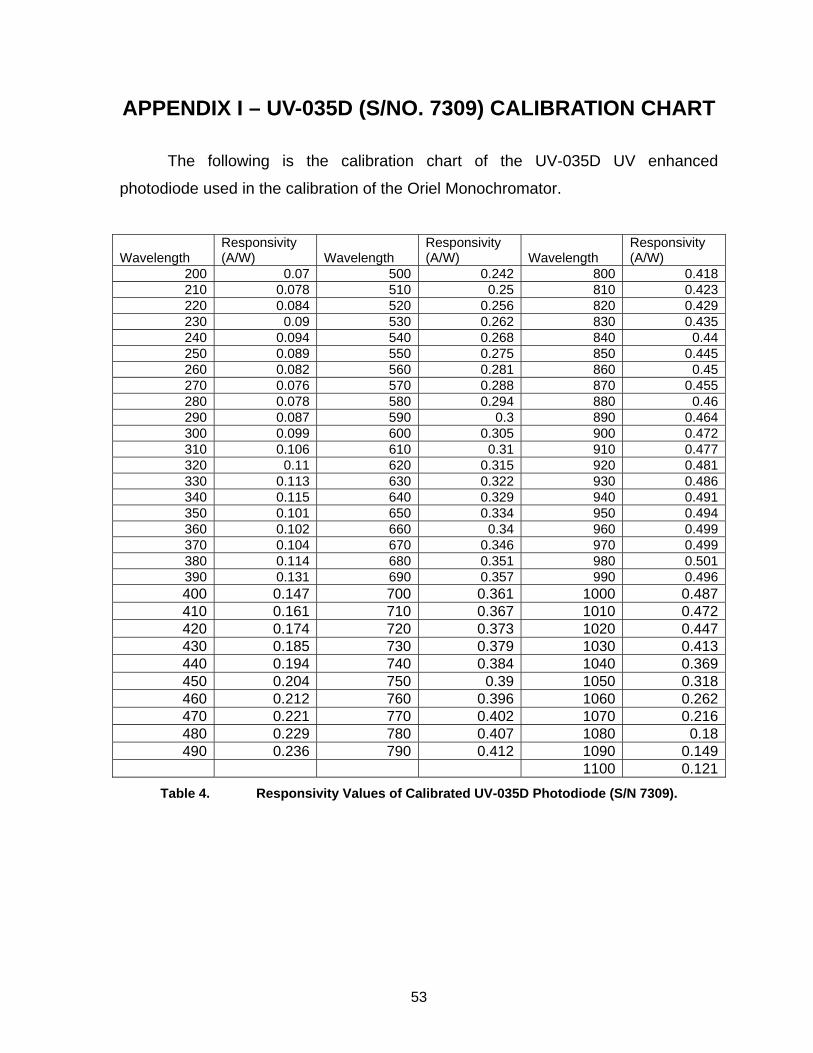
53
APPENDIX I – UV-035D (S/NO. 7309) CALIBRATION CHART
The following is the calibration chart of the UV-035D UV enhanced
photodiode used in the calibration of the Oriel Monochromator.
Wavelength Responsivity (A/W) Wavelength
Responsivity (A/W) Wavelength
Responsivity (A/W)
200 0.07 500 0.242 800 0.418210 0.078 510 0.25 810 0.423220 0.084 520 0.256 820 0.429230 0.09 530 0.262 830 0.435240 0.094 540 0.268 840 0.44250 0.089 550 0.275 850 0.445260 0.082 560 0.281 860 0.45270 0.076 570 0.288 870 0.455280 0.078 580 0.294 880 0.46290 0.087 590 0.3 890 0.464300 0.099 600 0.305 900 0.472310 0.106 610 0.31 910 0.477320 0.11 620 0.315 920 0.481330 0.113 630 0.322 930 0.486340 0.115 640 0.329 940 0.491350 0.101 650 0.334 950 0.494360 0.102 660 0.34 960 0.499370 0.104 670 0.346 970 0.499380 0.114 680 0.351 980 0.501390 0.131 690 0.357 990 0.496400 0.147 700 0.361 1000 0.487410 0.161 710 0.367 1010 0.472420 0.174 720 0.373 1020 0.447430 0.185 730 0.379 1030 0.413440 0.194 740 0.384 1040 0.369450 0.204 750 0.39 1050 0.318460 0.212 760 0.396 1060 0.262470 0.221 770 0.402 1070 0.216480 0.229 780 0.407 1080 0.18490 0.236 790 0.412 1090 0.149
1100 0.121
Table 4. Responsivity Values of Calibrated UV-035D Photodiode (S/N 7309).
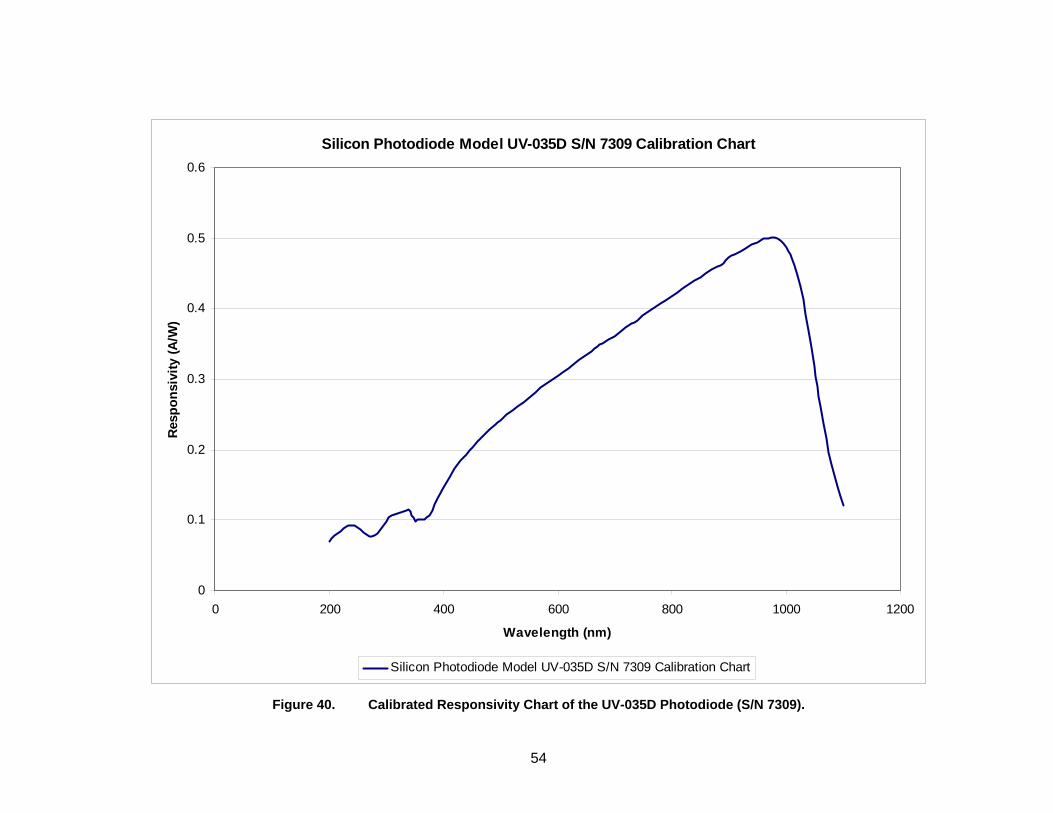
54
Silicon Photodiode Model UV-035D S/N 7309 Calibration Chart
0
0.1
0.2
0.3
0.4
0.5
0.6
0 200 400 600 800 1000 1200
Wavelength (nm)
Res
pons
ivity
(A/W
)
Silicon Photodiode Model UV-035D S/N 7309 Calibration Chart
Figure 40. Calibrated Responsivity Chart of the UV-035D Photodiode (S/N 7309).
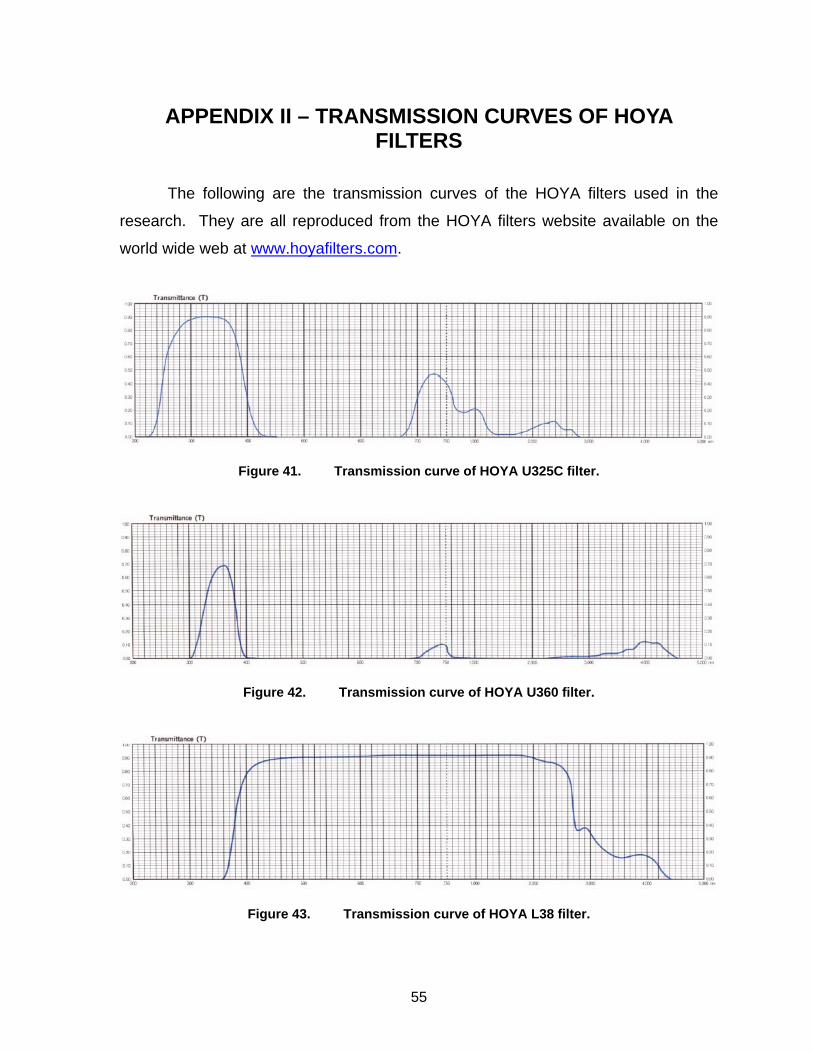
55
APPENDIX II – TRANSMISSION CURVES OF HOYA FILTERS
The following are the transmission curves of the HOYA filters used in the
research. They are all reproduced from the HOYA filters website available on the
world wide web at www.hoyafilters.com.
Figure 41. Transmission curve of HOYA U325C filter.
Figure 42. Transmission curve of HOYA U360 filter.
Figure 43. Transmission curve of HOYA L38 filter.
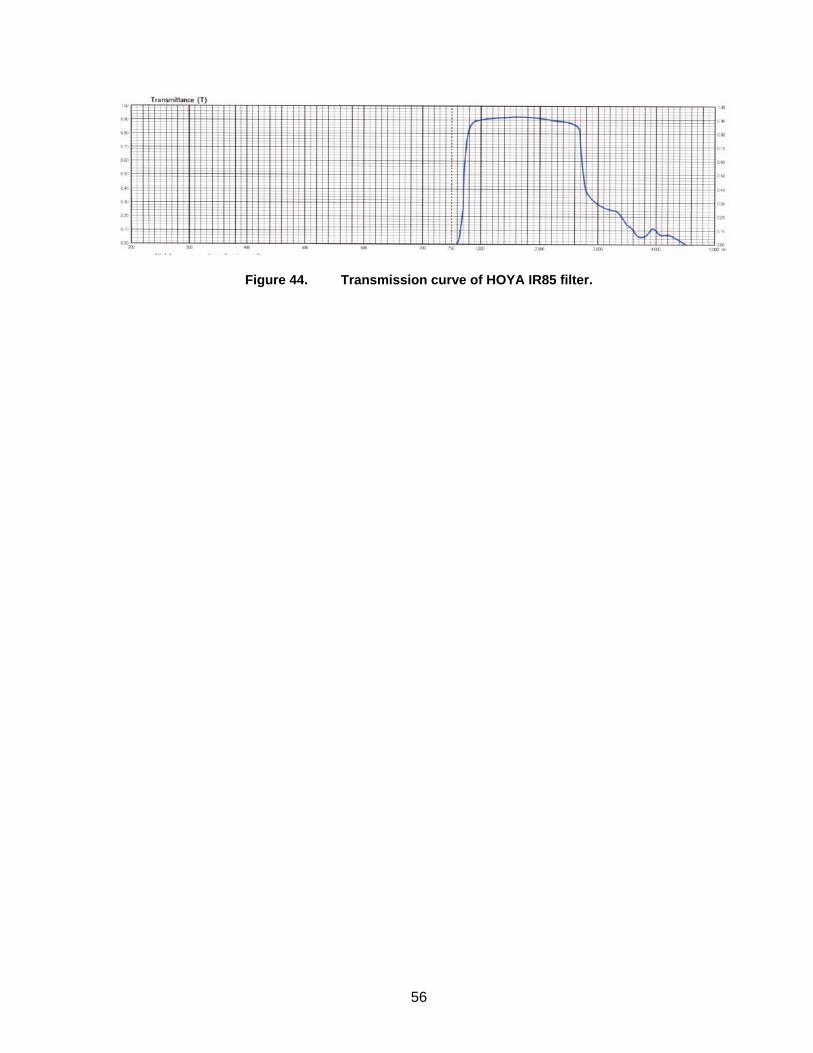
56
Figure 44. Transmission curve of HOYA IR85 filter.

57
LIST OF REFERENCES
[1] FOVEON Inc. (2004) FOVEON - Why X3 is Better; available from World Wide
Web @http://www.foveon.com/X3_better.html, cited Jul 2004.
[2] Rogers, A. (1997) Essentials of Optoelectronics with Applications, London:
Chapman and Hall.
[3] Merrill, R. B. Color Separation in an Active Pixel Cell Imaging Array Using a
Triple-Well Structure, United States Patent No. 5965875, Oct 12 1999.
[4] Gilblom, D. L., Yoo, S.K. & Ventura, P. (2003) Operation and Performance of
a Color Image Sensor with Layered Photodiodes, SPIE, Vol. 5074; available from
World Wide Wed @http://www.alt-vision.com/documents/5074-35.pdf, cited Aug
2004.
[5] Tomkins, M. R. FOVEON: New CMOS sensor captures triple the data
(2002);available from World Wide Web @http://www.imaging-
resource.com/EVENTS/PMAS02/1013470528.html, cited Nov 2004.
[6] Hynes, S. The X Factor, Professional Photographer Feb 2003 Pg 59-63;
available from World Wide Web
@www.totaldp.com/articles_download.cfm?action=download_
sample&id=54&site=PP&sh=1&mh=50, cited Nov 2004.
[7] Gilblom, D. L. & Yoo, S. K. (2004) Infrared and Ultraviolet Imaging with a
CMOS Sensor having Layered Photodiodes, SPIE/ISA Electronic Imaging 2004;
available from World Wide Web @http://www.alt-vision.com/documents/5301A-
25.pdf, cited Aug 2004.
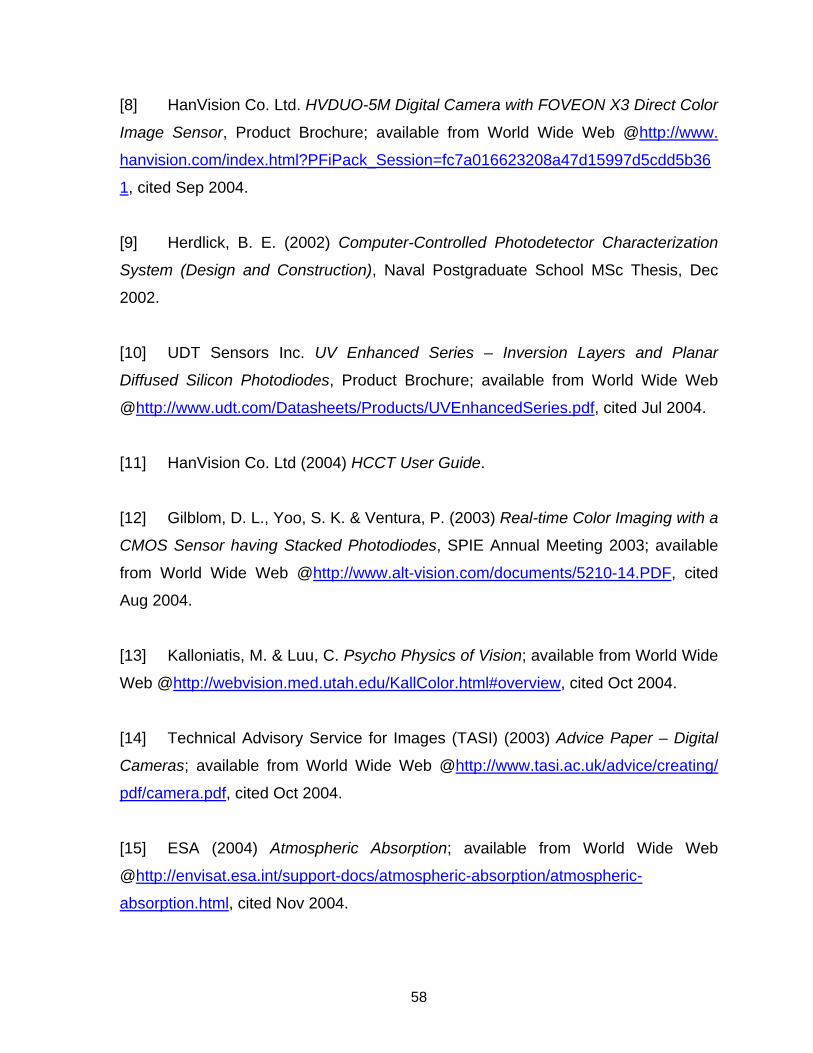
58
[8] HanVision Co. Ltd. HVDUO-5M Digital Camera with FOVEON X3 Direct Color
Image Sensor, Product Brochure; available from World Wide Web @http://www.
hanvision.com/index.html?PFiPack_Session=fc7a016623208a47d15997d5cdd5b36
1, cited Sep 2004.
[9] Herdlick, B. E. (2002) Computer-Controlled Photodetector Characterization
System (Design and Construction), Naval Postgraduate School MSc Thesis, Dec
2002.
[10] UDT Sensors Inc. UV Enhanced Series – Inversion Layers and Planar
Diffused Silicon Photodiodes, Product Brochure; available from World Wide Web
@http://www.udt.com/Datasheets/Products/UVEnhancedSeries.pdf, cited Jul 2004.
[11] HanVision Co. Ltd (2004) HCCT User Guide.
[12] Gilblom, D. L., Yoo, S. K. & Ventura, P. (2003) Real-time Color Imaging with a
CMOS Sensor having Stacked Photodiodes, SPIE Annual Meeting 2003; available
from World Wide Web @http://www.alt-vision.com/documents/5210-14.PDF, cited
Aug 2004.
[13] Kalloniatis, M. & Luu, C. Psycho Physics of Vision; available from World Wide
Web @http://webvision.med.utah.edu/KallColor.html#overview, cited Oct 2004.
[14] Technical Advisory Service for Images (TASI) (2003) Advice Paper – Digital
Cameras; available from World Wide Web @http://www.tasi.ac.uk/advice/creating/
pdf/camera.pdf, cited Oct 2004.
[15] ESA (2004) Atmospheric Absorption; available from World Wide Web
@http://envisat.esa.int/support-docs/atmospheric-absorption/atmospheric-
absorption.html, cited Nov 2004.
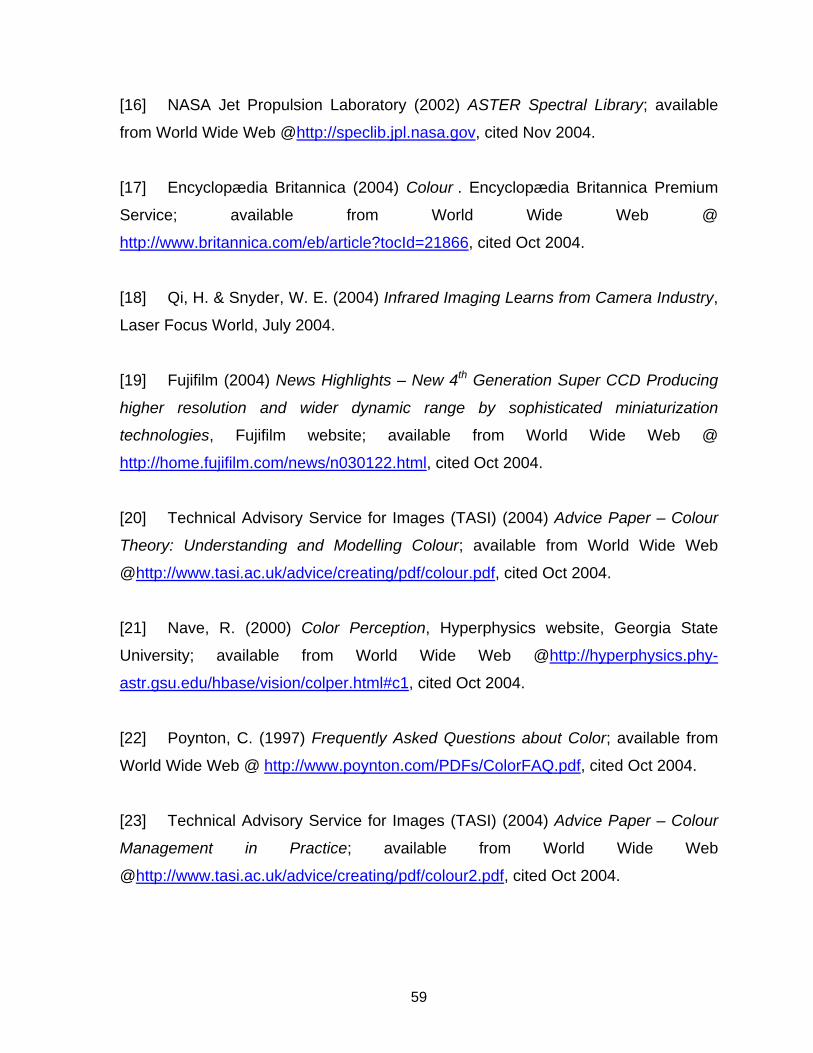
59
[16] NASA Jet Propulsion Laboratory (2002) ASTER Spectral Library; available
from World Wide Web @http://speclib.jpl.nasa.gov, cited Nov 2004.
[17] Encyclopædia Britannica (2004) Colour . Encyclopædia Britannica Premium
Service; available from World Wide Web @
http://www.britannica.com/eb/article?tocId=21866, cited Oct 2004.
[18] Qi, H. & Snyder, W. E. (2004) Infrared Imaging Learns from Camera Industry,
Laser Focus World, July 2004.
[19] Fujifilm (2004) News Highlights – New 4th Generation Super CCD Producing
higher resolution and wider dynamic range by sophisticated miniaturization
technologies, Fujifilm website; available from World Wide Web @
http://home.fujifilm.com/news/n030122.html, cited Oct 2004.
[20] Technical Advisory Service for Images (TASI) (2004) Advice Paper – Colour
Theory: Understanding and Modelling Colour; available from World Wide Web
@http://www.tasi.ac.uk/advice/creating/pdf/colour.pdf, cited Oct 2004.
[21] Nave, R. (2000) Color Perception, Hyperphysics website, Georgia State
University; available from World Wide Web @http://hyperphysics.phy-
astr.gsu.edu/hbase/vision/colper.html#c1, cited Oct 2004.
[22] Poynton, C. (1997) Frequently Asked Questions about Color; available from
World Wide Web @ http://www.poynton.com/PDFs/ColorFAQ.pdf, cited Oct 2004.
[23] Technical Advisory Service for Images (TASI) (2004) Advice Paper – Colour
Management in Practice; available from World Wide Web
@http://www.tasi.ac.uk/advice/creating/pdf/colour2.pdf, cited Oct 2004.

60
[24] Scott, E. & Bewley, H. (1997) Color Vision – Human Perception of Different
Wavelengths of Light; available from World Wide Web @http://www.photo.net/photo/
edscott/vis00010.htm, cited Oct 2004.
[25] HunterLab (1997) Application Notes – Metamerism Index; available from
World Wide Web @http://www.hunterlab.com/appnotes/an03_97.pdf, cited Oct 2004.
[26] HunterLab (2000) Application Notes – Color Inconsistency; available from
World Wide Web @http://www.hunterlab.com/appnotes/an11_00.pdf, cited Oct 2004.
[27] H Cho Ed. (2003) Opto-Mechatronic Systems Handbook – Techniques and
Applications, CRC Press.
[28] Matrox Electronic Systems Ltd. (2000) Matrox Intellicam ver 2.07- User Guide.
[29] Lyon, R. F. & Hubel, P. M. Eyeing the Camera: Into the Next Century,
IS&T/SID Tenth Color Imaging Conference; available from World Wide Web
@http://www.foveon.com/docs/Century.pdf, cited Aug 2004.

61
INITIAL DISTRIBUTION LIST 1. Defense Technical Information Center
Fort Belvoir, Virginia 2. Dudley Knox Library Naval Postgraduate School Monterey, CA 3. Professor Gamani Karunsiri Naval Postgraduate School Monterey, CA 4. Professor Richard Christopher Olsen Naval Postgraduate School Monterey, CA 5. Professor James Luscombe Naval Postgraduate School Monterey, CA
Related Documents