fisheries statistics August 2011 2010 Australian Australian Bureau of Agricultural and Resource Economics and Sciences Australian Government

Welcome message from author
This document is posted to help you gain knowledge. Please leave a comment to let me know what you think about it! Share it to your friends and learn new things together.
Transcript
fisheries statistics
August 2011
2010
Australian
Australian Bureau of Agricultural and Resource Economics and Sciences
Australian Government

© ABARES 2011
This work is copyright. The Copyright Act 1968 permits fair dealing for study, research, news reporting, criticism or review. Selected passages, tables or diagrams may be reproduced for such purposes provided acknowledgment of the source is included. Major extracts or the entire document may not be reproduced by any process without the written permission of the Executive Director, ABARE–BRS.
The Australian Government acting through Australian Bureau of Agricultural and Resource Economics – Bureau of Rural Sciences has exercised due care and skill in the preparation and compilation of the information and data set out in this publication. Notwithstanding, the Australian Bureau of Agricultural and Resource Economics – Bureau of Rural Sciences, its employees and advisers disclaim all liability, including liability for negligence, for any loss, damage, injury, expense or cost incurred by any person as a result of accessing, using or relying upon any of the information or data set out in this publication to the maximum extent permitted by law.
ISSN 1037-6879
ABARES 2011, Australian fisheries statistics 2010, Canberra, August.
Australian Bureau of Agricultural and Resource Economics and Sciences Postal address GPO Box 1563 Canberra ACT 2601 Australia Switchboard +61 2 6272 2010 Facsimile +61 2 6272 2001 Email [email protected] Web abares.gov.au
ABARES project 43060
Fisheries Research and Development Corporation PO Box 222 Deakin West ACT 2000 Telephone +61 2 6285 0400 Facsimile +61 0 6285 4421 Internet www.frdc.com.au
Acknowledgments Thuy Pham and Robert New prepared this report. The assistance of state fisheries departments and the Australian Fisheries Management Authority, researchers and various industry representatives is gratefully acknowledged. The Australian Bureau of Statistics supplied the trade data.
Australian fisheries statistics 2010 is supported by funding from the Fisheries Research and Development Corporation.
Note to readerThe data is accurate at the time of publication but updates may subsequently be available on state websites until they can be incorporated into the following year’s publication. A wider data set is available on request.

iii
Foreword Australian fisheries statistics is an annual report that has been in publication since 1991. It provides annual updates of fisheries production and trade data and serves as an important source of information for the fishing and aquaculture industry, fisheries managers, policy-makers and researchers. The estimates of the gross value of production provided in the report are used for a range of purposes; for example, to determine Commonwealth, state and territory fisheries research funding arrangements each year.
The current report contains data on the volume and value of production from state and Commonwealth commercial fisheries, and on the volume and value of Australian fisheries trade, by destination, source and product. Profiles of Commonwealth and state commercial fisheries and state aquaculture for 2008–09 and 2009–10 are also provided. These cover selected species, fishing methods and number of licence holders. Additional information is also provided on the recreational fishing sector and Indigenous fishing sector.
Australian fisheries statistics is part of a suite of ABARES publications that provide a comprehensive account of historical trends in, and the outlook for, Australian fisheries. Australian commodity statistics provides a historical series of production and trade statistics for fisheries and a range of other commodities. Australian commodities includes forecasts for major fisheries commodities, which are updated each quarter. Detailed analysis of the economic performance of selected Commonwealth fisheries is provided in the annual Australian fisheries survey report. An assessment of the economic performance of all fisheries managed by the Australian Fisheries Management Authority is provided in the annual Fishery status reports.
Phillip Glyde Executive Director August 2011

iviv
Inquiries Inquiries regarding Commonwealth and state information should be directed to the respective coordinators of fisheries statistics shown below.
New South Wales
David Makin (Wild sector) Industry & Investment New South Wales Ph: (02) 9527 8556 Fax: (02) 9527 8560
Janine Sakker (Aquaculture) Industry & Investment New South Wales Ph: (02) 4916 3847 Fax: (02) 4981 9074
Victoria
Paula Baker and Monique Nelis Fisheries Victoria, Department of Primary Industries Ph: (03) 5258 0243 / (03) 5258 0284 Fax: (03) 5258 4553
Queensland
Lew Williams (Wild sector) Fisheries Queensland, Department of Employment Economic Development and Innovation Ph: (07) 3225 2550 Fax: (07) 3224 2805
Max Wingfield (Aquaculture) Fisheries Queensland, Department of Employment Economic Development and Innovation Ph: (07) 3400 2039 Fax: (07) 3408 3535
Western Australia
Eva Lai and Mark Cliff Western Australian Department of Fisheries Ph: (08) 9203 0136 Fax: (08) 9203 0199
South Australia
Angelo Tsolos (Wild sector) South Australian Research and Development Institute (SARDI) Ph: (08) 8207 5414 Fax: (08) 8207 5415

vv
In quir ie s
Emmanuelle Sloan and Stephen Madigan (Aquaculture) Department of Primary Industries and Resources South Australia (PIRSA) Ph: (08) 8226 3483 / (08) 8226 2214 Fax: (08) 8226 0330
Tasmania
Steve Withers Department of Primary Industries, Parks, Water and Environment, Tasmania Ph: (03) 6233 3543 Fax: (03) 6233 7965
Northern Territory
Maree Apostoles NT FisheriesDepartment of Resources (DoR) Ph: (08) 8999 2305 Fax: (08) 8999 2057
Commonwealth
Thim Skousen and Selvy Coundjidapadam Australian Fisheries Management Authority (AFMA) Ph: (02) 6225 5350 / (02) 6225 5391 Fax: (02) 6225 5441
Ganesan Radhakrishnan and Heidi Prislan Licensing & Quota Management Australian Fisheries Management Authority (AFMA) Ph: 1300 723 621 Fax: (02) 6225 5300

vi
Definitions and explanations
Aquaculture production is the live weight quantity of product produced and marketed by aquaculturists.
Aquaculture value is the assessed value received by aquaculturists on the basis of an ‘at farm gate’ equivalent, for product marketed.
Export quantity data are supplied by the Australian Bureau of Statistics on the basis of the net product weight (excluding packaging) exported. Exports are identified by the Australian Bureau of Statistics according to source state or territory, not state or territory in which the product was caught or farmed.
Export value data are supplied by the Australian Bureau of Statistics, and are valued on a free on board (fob) basis at the Australian port of export. The costs of freight, insurance and other distributive services beyond the Australian customs border are not included.
Import quantity data are supplied by the Australian Bureau of Statistics on the basis of the net product weight (excluding packaging) imported.
Import value data are supplied by the Australian Bureau of Statistics on the basis of product cost. Imports are valued on a customs value for duty basis that is identical to a free on board (fob) basis. The customs value for duty is the price actually paid at the port of origin, including inland freight and insurance costs incurred in delivering the product(s) to the port of origin. The freight and insurance costs of delivering the product(s) to the Australian port of destination are excluded.
Production quantity is a measure of the quantity of fish product landed by a fishery, usually on the basis of catch records.
Production value is the assessed value at the point of landing for the quantity produced and excludes transport and marketing costs.
Products consist of fisheries products marketed for human consumption plus non-edible fisheries products.
Real terms/real prices are historical or future prices adjusted to reflect changes to the purchasing power of money (most commonly measured by the consumer price index).
Re-imports (included in merchandise import statistics) are goods originally exported, which are subsequently imported in either the same condition in which they were exported, or

vii
D e f ini tio ns a n d e x p l a n a tio ns
after undergoing repair or minor operations which leave them essentially unchanged. Minor operations include blending, packaging, bottling, cleaning and sorting.
‘Reals’ and rounding ’Real’ 2009–10 dollars or ‘real terms’ refer to conversion of nominal dollar values to take account of inflation. Comparison from year to year is expressed in nominal terms unless stated otherwise. Small discrepancies in totals are generally caused by the rounding components. A dash (–) is used to denote a nil or negligible amount.
Seafood is any fish or other aquatic plant or animal intended for human consumption; it excludes non-edible fisheries products.
Southern bluefin tuna sold from aquaculture farms in South Australia is reported at its market value (that is, at the farm gate aquaculture value). However, the input value of those tuna is also included as a production output from the Commonwealth’s Southern Bluefin Tuna Fishery. To avoid double counting, the input value is netted out of Australian totals.
Note on jurisdictionsAustralian fisheries are defined as those fisheries falling within the Australian Exclusive Economic Zone, which extends to 200 nautical miles from coastal baselines. To simplify jurisdiction, boundaries have been developed handing over management responsibility to the state, Northern Territory and/or Commonwealth governments. Each state/Northern Territory jurisdiction has responsibility for fisheries that lie within its internal waters (for example, river, lake and estuarine fisheries) and, where applicable, adjacent fisheries within a three nautical mile boundary from the coastline. The Commonwealth has jurisdiction for fisheries that lie between three and 200 nautical miles of the coastline. When a particular fishery falls within two or more jurisdictions, an Offshore Constitutional Settlement arrangement is generally developed and responsibility is passed to one jurisdiction.
Abbreviations and symbols
$’000 thousand dollars (Australian)
$b billion dollars (Australian)
$m million dollars (Australian)
a aquaculture
AFZ Australian Fishing Zone
fob free on board
kg kilogram
kt kilotonne
na not available
nei not elsewhere included
t tonne
w wild-catch
viii
ContentsForeword iii
Inquiries iv
Definitions and explanations vi
Production 1
Fast facts 1Production by species group 2Production by jurisdiction 8Production by sector 16
Trade 20
Fast facts 20Exports and imports 21Exports by commodity 22Exports by destination 25Exports by state 26Imports by commodity 27Imports by source 29
Employment 32
Fast facts 32
Recreational and charter fishing 34
Australia-wide 34New South Wales 35Victoria 36Queensland 36Western Australia 37South Australia 37Tasmania 38Northern Territory 38Australian Capital Territory 39

ix
Customary fishing 40
Profile of Australian fisheries in 2008–09 and 2009–10 43
Commonwealth 43New South Wales 45Victoria 46Queensland 47Western Australia 48South Australia 49Tasmania 50Northern Territory 51
References 52

1
Production
Fast facts
In 2009–10• The total volume of Australian fisheries production increased by 2 per cent (3615 tonnes) to
241 123 tonnes (table 1).
• The gross value of Australian fisheries production decreased by 2 per cent ($35.4 million) to $2.18 billion.
• Tasmania accounted for the largest share of gross value of production (26 per cent), followed by South Australia (18 per cent) and Western Australia (17 per cent). Commonwealth fisheries accounted for 15 per cent of gross value of production.
• The gross value of aquaculture production (including southern bluefin tuna wild-catch input to the South Australian tuna farming sector) increased marginally by $3.8 million to $870.4 million, and accounted for 40 per cent of the gross value of Australian fisheries production. The volume of aquaculture production was 73 542 tonnes, accounting for 30 per cent of total Australian fisheries production.
• The value of farmed salmonids rose by 13 per cent to $369.1 million in 2009–10. Farmed salmonids continues to be the largest aquaculture species group produced, and also the most valuable fisheries product in Australia. Salmonids accounted for 42 per cent of the total value of Australian aquaculture production and 17 per cent of the total value of fisheries production.
• In volume terms, the largest species produced is Australian sardines. However Australian sardines are a relatively low value product, mainly for use as baitfish.
• The value of production for the wild-catch sector decreased by 3 per cent, to $1.34 billion. The volume of production decreased slightly by 1 per cent to 171 512 tonnes.
Since 2000–01• The total annual volume of fisheries production has increased by 9541 tonnes (4 per cent),
while the annual real gross value of production has fallen by $996.6 million (31 per cent).
• The majority of the decline in value occurred over the period 2000–01 to 2004–05. Since 2004–05, the real gross value of production decreased by 10 per cent, representing a slowing in the rate of decline.
• The decrease in production volume since 2000–01 has been driven predominantly by lower production of tuna and rock lobster. Production of prawns, crabs and squid also declined over the period.
• Driving the fall in production value has been the decline in the gross value of production of tuna, prawns, rock lobster and abalone. The combined value of these four species has fallen by 50 per cent in real terms over this period, with their combined contribution to total Australian fisheries production falling from 62 per cent to 46 per cent.

2
Production by species groupThe gross volume and value of Australian fisheries production by species group is presented in tables 3–5. Production and value summaries are also presented in table 2 (wild-catch sector), tables 7–14 (individual jurisdictions) and tables 15–17 (aquaculture sector).
The volume of Australian fisheries production varied over the period 2000–01 to 2009–10 (figure 1). The total volume of production increased from 231 582 tonnes in 2000–01 to 275 972 tonnes in 2003–04, and peaked at 279 099 tonnes in 2004–05. After falling considerably in 2005–06, the volume of Australian fisheries production has declined gradually at a rate of 1 per cent on average from 2006–07 to 2008–09, reaching 237 508 tonnes in 2008–09. In 2009–10, the volume of Australian fisheries production improved, increasing by 2 per cent (3615 tonnes) compared with 2008–09, to 241 123 tonnes.
Australian sardines accounted for the highest individual catch by volume in 2009–10 (40 737 tonnes, accounting for 17 per cent), followed by salmonids (31 915 tonnes, 13 per cent), prawns (27 034 tonnes, 11 per cent), oysters (14 807 tonnes, 6 per cent) and tuna (10 957 tonnes, 5 per cent).
Since 2000–01, the real gross value of Australian fisheries production has fallen by 31 per cent, and was $2.18 billion in 2009–10 (figure 2), with the majority of the decline occurring in the period to 2004–05. In general, from 2000–01 to 2009–10, the production value of crustaceans and molluscs has fallen considerably, by 41 per cent ($527 million) and 40 per cent ($291.9 million), respectively. The production value of finfish has also fallen in real terms, but by a lesser amount, $130.6 million or 12 per cent over the same period. Since 2004–05, the real gross value of Australian fisheries production has declined by an average of 2 per cent a year.
Top five, by volume in 2009–10 Top five, by value in 2009–10(wild-catch and aquaculture: tables 2 and 17) (wild-catch and aquaculture: tables 2 and 17)
Australian sardine 40 737 tonnes Salmonids $369.1 millionSalmonids 31 915 tonnes Rock lobster $368.8 millionPrawns 27 034 tonnes Prawns $324.1 millionOyster 14 807 tonnes Abalone $173.6 millionTuna 10 957 tonnes Tuna $125.3 million
Volume of Australian �sheriesproduction
other
oysters
Australian sardine
abalone
rock lobster
prawns
salmonids
tuna
100
kt
50
150
200
300
250
1
2008
–09
2009
–10p
2007
–08
2006
–07
2005
–06
2004
–05
2003
–04
2002
–03
2001
–02
2000
–01
p Preliminary
Pro du c tio n

3
At the species group level, the decline in real value was largely driven by decreases in the value of rock lobster, prawns, abalone and tuna (figure 3). The combined value of these species groups halved in real terms from $1.98 billion in 2000–01 to $991.9 million in 2009–10. This represents a decline of $986.8 million in the real value of those species groups over the period. In the period since 2004–05, the decline in total value was partially offset by a significant increase in the value of salmonids exports, which increased at an average rate of 17 per cent a year, to reach $369.1 million in 2009–10.
The declining values of key species groups have been driven by falls in unit prices, with the exception of rock lobster (figure 4). Since production of these species is export-oriented, prices are strongly influenced by exchange rate movements. The strength of the Australian dollar against the currencies of major trading partners, particularly the United States and Japan, has reduced the competitiveness of Australian fisheries exports in recent years (box 1). Prices for rock lobster have been
Real gross value of Australian�sheries production a2
molluscs
crustaceans
fish
2008
–09
2009
–10p
2007
–08
2006
–07
2005
–06
2004
–05
2003
–04
2002
–03
2001
–02
2000
–01
a Excludes other nei. p Preliminary
2009–10$b
0.5
1.0
1.5
2.0
2.5
3.0
3.5
Real unit prices for key species
abalone
rock lobster
tuna
2009–10$/kg
4
prawns
salmonids
10
20
30
40
50
60
70
2008
–09
2009
–10p
2007
–08
2006
–07
2005
–06
2004
–05
2003
–04
2002
–03
2001
–02
2000
–01
p Preliminary
Real value of Australian�sheries production, by key species
rock lobster
prawns
tuna
abalone
salmonids
Australian sardine
2009–10$m
3
100
200
300
400
500
600
700
2008
–09
2009
–10p
2007
–08
2006
–07
2005
–06
2004
–05
2003
–04
2002
–03
2001
–02
2000
–01
p Preliminary
Pro du c tio n

4
increasing since 2003–04 despite exchange rate movements, owing to increased demand for rock lobster on international markets and lower supply from key producers.
The product composition of the gross value of production of Australian fisheries has not changed substantially over the past few years. The top five fisheries products (by value) still comprise rock lobster, prawn, salmonids, abalone and tuna. Rock lobster has frequently ranked as Australia’s most valuable species group over the past decade. However, salmonids surpassed rock lobster to be Australia’s most valuable fisheries product in 2009–10, at $369.1 million, representing 17 per cent of the gross value of fisheries production. This was followed by rock lobster ($368.8 million, 17 per cent), prawn ($324.1 million, 15 per cent), abalone ($173.6 million, 8 per cent) and tuna ($125.3 million, 6 per cent) (figure 5).
Rock lobster
Key jurisdictions: Western Australia (wild-catch (w)), South Australia (w) and Tasmania (w)In 2009–10, the value of rock lobster production decreased by 11 per cent ($46 million) to $368.8 million, following a 21 per cent decrease in the volume of rock lobster production. Rock lobsters are caught mainly in Western Australia, South Australia and Tasmania.
In 2009–10, rock lobster production decreased by 2575 tonnes to 9628 tonnes as a result of lower production in Western Australia, South Australia and Tasmania, which collectively accounted for 91 per cent of the Australian total volume of rock lobster production. The decline was mainly attributable to the significant decreases in production in Western Australia and South Australia. In 2009–10, rock lobster production from these two states combined fell by 21 per cent (1946 tonnes) from 2008–09 to a total of 7501 tonnes.
Value of Australian �sheries production, by product5
2009–10p
2008–09
tuna salmonids
barramundisharks
prawnsrock lobster
crabsabalonescallops
edible oysters
pearl oysters
$m 200100 300 400 500
p Preliminary
Pro du c tio n
5
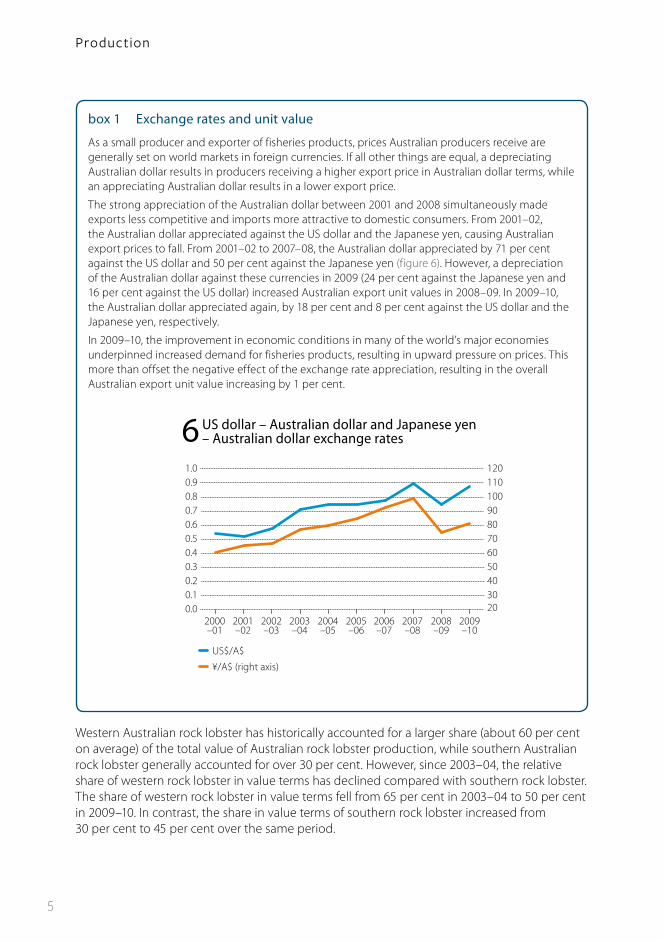
Western Australian rock lobster has historically accounted for a larger share (about 60 per cent on average) of the total value of Australian rock lobster production, while southern Australian rock lobster generally accounted for over 30 per cent. However, since 2003–04, the relative share of western rock lobster in value terms has declined compared with southern rock lobster. The share of western rock lobster in value terms fell from 65 per cent in 2003–04 to 50 per cent in 2009–10. In contrast, the share in value terms of southern rock lobster increased from 30 per cent to 45 per cent over the same period.
box 1 Exchange rates and unit value
As a small producer and exporter of fisheries products, prices Australian producers receive are generally set on world markets in foreign currencies. If all other things are equal, a depreciating Australian dollar results in producers receiving a higher export price in Australian dollar terms, while an appreciating Australian dollar results in a lower export price.
The strong appreciation of the Australian dollar between 2001 and 2008 simultaneously made exports less competitive and imports more attractive to domestic consumers. From 2001–02, the Australian dollar appreciated against the US dollar and the Japanese yen, causing Australian export prices to fall. From 2001–02 to 2007–08, the Australian dollar appreciated by 71 per cent against the US dollar and 50 per cent against the Japanese yen (figure 6). However, a depreciation of the Australian dollar against these currencies in 2009 (24 per cent against the Japanese yen and 16 per cent against the US dollar) increased Australian export unit values in 2008–09. In 2009–10, the Australian dollar appreciated again, by 18 per cent and 8 per cent against the US dollar and the Japanese yen, respectively.
In 2009–10, the improvement in economic conditions in many of the world’s major economies underpinned increased demand for fisheries products, resulting in upward pressure on prices. This more than offset the negative effect of the exchange rate appreciation, resulting in the overall Australian export unit value increasing by 1 per cent.
US dollar – Australian dollar and Japanese yen– Australian dollar exchange rates
US$/A$
¥/A$ (right axis)
6
0.00.10.20.30.40.50.60.70.80.91.0
2030405060708090100110120
2008–09
2009–10
2007–08
2006–07
2005–06
2004–05
2003–04
2002–03
2001–02
2000–01
Pro du c tio n
6
Between 2008–09 and 2009–10, catches of both species declined. Although western rock lobster catch fell by 22 per cent (1690 tonnes), its value of production fell by only 4 per cent because of a 23 per cent increase in the average beach price. Southern rock lobster catch fell by a lesser amount, 365 tonnes (10 per cent). Combined with a 4 per cent decrease in its average beach price, this resulted in the value of southern rock lobster production falling by 14 per cent ($26.2 million) in 2009–10. Production of southern rock lobster and western rock lobster contributed $165.5 million and $184.1 million, respectively, to the total value of Australian rock lobster production in 2009–10.
SalmonidsKey jurisdictions: Tasmania (aquaculture (a))Since the start of salmon farming in 1998, salmonids production has increased significantly. Australian salmonids production has increased over the last 10 years from 14 673 tonnes in 2000–01 to 31 915 tonnes in 2009–10. This reflects a 117 per cent growth in the volume of Australian salmonids production over the period. Most of this is attributable to the strong growth of production in Tasmania, which accounts for over 95 per cent of Australia’s salmonids production over this period. In 2009–10, Australian salmonids production increased by 6 per cent (1879 tonnes) compared with 2008–09, and surpassed rock lobster to be Australia’s most valuable species group.
Most of Australia’s salmonids production occurs in Tasmania. In 2009–10, Tasmania produced 30 950 tonnes of salmonids, accounting for 97 per cent of Australian total salmonids production. The remaining 965 tonnes were produced in New South Wales and Victoria.
The value of salmonids production rose by 13 per cent ($43 million) in 2009–10 to $369.1 million. This increase was driven mainly by a 14 per cent ($43.2 million) increase in the value of Tasmanian salmonids production, with Tasmania’s total production accounting for 98 per cent of the total value.
Tasmanian producers supply most of their salmonids to the domestic market. A key factor contributing to the rapid growth in recent years has been a strong focus on marketing salmon to Australian consumers. Additionally, the sector’s strong growth has been supported by research and development, which has allowed the sector to adopt improved feeding techniques and apply better disease control measures.
PrawnsKey jurisdictions: Queensland (w, a), Western Australia (w), South Australia (w) and Commonwealth (w)In 2009–10, the gross value of Australian prawn production rose by 12 per cent ($34.1 million) to $324.1 million, following a 12 per cent (2848 tonnes) increase in the volume of production to 27 034 tonnes. Driving this was a 35 per cent increase in the production volume of aquaculture prawns (mostly in Queensland) to 5381 tonnes, valued at $77.5 million. This value was $20.6 million higher than the previous year.
Pro du c tio n

7
In 2009–10, production of wild-caught prawns rose by 7 per cent (1452 tonnes) to 21 653 tonnes, valued at $246.6 million, which was $13.4 million higher than 2008–09. This was driven mainly by increases in wild-caught prawn production in Queensland and the Commonwealth prawn fisheries production, together increasing by $20.3 million. These increases offset decreases in the value of wild-caught prawn production in New South Wales, falling by $3.8 million.
In 2009–10, the value of prawn production (both wild-caught and aquaculture) in Queensland increased by $27.9 million (22 per cent) to $155.9 million; its production volume increasing by 21 per cent. The value of prawn production in Commonwealth fisheries also increased, by $12.9 million (16 per cent) as a result of a 10 per cent (704 tonnes) increase in production volume. This increase is largely attributable to a 15 per cent (942 tonnes) increase in the volume of prawn production in the Northern Prawn Fishery. In value terms, Northern Prawn Fishery production rose by 21 per cent ($15.2 million) to $88.2 million.
AbaloneKey jurisdictions: Tasmania (w, a), Victoria (w, a) and South Australia (w, a)In 2009–10, the volume of abalone production fell by 11 per cent, from 5612 tonnes in 2008–09 to 4981 tonnes, with decreases occurring in both wild-catch and aquaculture production. The value of abalone production also declined, by 8 per cent ($14.9 million) to $173.6 million. This comprised decreases in the production value of wild-caught and aquaculture abalone, by $7.3 million and $7.6 million, respectively.
Most of the decrease in abalone production in 2009–10 occurred in Tasmania, which fell by 15 per cent in volume terms and accounted for 52 per cent of Australia’s total volume of abalone production. It is important to note that this decline in Australia’s total production volume and value could be partly because production volume and value of aquaculture abalone in Victoria were not reported due to confidentiality requirements.
A large proportion of abalone is exported, mostly to Hong Kong, China and Japan. Therefore, exchange rate movements have a significant effect on abalone exports, which in turn affect domestic and export prices. From 2000–01 to 2009–10, following appreciation of the Australian dollar, abalone average unit prices fell by 44 per cent in real terms. As a result, the total value of production in real terms decreased by 51 per cent ($182.5 million) over the same period.
TunaKey jurisdictions: South Australia (a) and Commonwealth (w)In 2009–10, the value of tuna production fell by 33 per cent ($61.8 million) to $125.3 million (excludes southern bluefin tuna wild-catch input to the South Australian tuna farming sector). This was the result of a 20 per cent (2742 tonnes) decrease in production volume to 10 957 tonnes. Lower volumes of both wild-caught and aquaculture tuna production contributed to the fall in production. In 2009–10, the volume of wild-caught tuna production fell by 23 per cent while aquaculture tuna production fell by 17 per cent compared with 2008–09.
Pro du c tio n

8
The value of wild-caught tuna production decreased by 21 per cent ($15.2 million) to $58.5 million in 2009–10. This was mainly the result of reduced production volume and average unit value of wild-caught tuna; particularly tuna catches in the Eastern Tuna and Billfish Fishery. In 2009–10, the volume of tuna catches in the Eastern Tuna and Billfish Fishery declined by 14 per cent (563 tonnes), resulting in its value falling by 28 per cent ($7.6 million).
Following a 17 per cent decline in production volume, the value of farmed tuna (solely southern bluefin tuna) decreased by $55.6 million to $102.2 million in 2009–10. Despite this fall, farmed tuna still accounted for about 82 per cent of Australian tuna production in value terms.
A large proportion of Australia’s tuna production is exported, mostly to the Japanese sashimi market. Therefore, prices are dependent on the exchange rate between the Australian dollar and the Japanese yen and demand from the Japanese market. An appreciation of the Australian dollar in 2009–10 resulted in lower Australian export prices for most tuna species.
Production by jurisdictionThe gross volume and value of Australian fisheries production by jurisdiction and location of catch is given in tables 3 to 6. Production and value summaries for each jurisdiction are given in tables 7 to 14.
In 2009–10, Tasmania had the largest gross value of production ($563.8 million), accounting for 25 per cent of total fisheries production, followed by South Australia ($394.4 million, 18 per cent) and Western Australia ($367.7 million, 17 per cent) (figure 7). Commonwealth-managed fisheries accounted for 14 per cent ($316.7 million) of the gross value of production.
By location of catch—where Commonwealth catch is distributed to the states according to where it was caught—Tasmania accounted for the largest share (27 per cent), followed by Western Australia (21 per cent), South Australia (19 per cent) and Queensland (17 per cent) (figure 8).
New South Wales 6 New South Wales 6
Victoria 5 Victoria 3
Queensland 12 Queensland 15
Western Australia 23 Western Australia 17
South Australia 20 South Australia 18
Tasmania 12 Tasmania 25
Northern Territory 3 Northern Territory 2
Commonwealth 19 Commonwealth 14
2000–01 % %2009–10p
Shares in gross value of production, by jurisdiction7
p Preliminary
Pro du c tio n

9
A substantial shift in the contribution of individual state fishery production to total Australian fisheries production has been evident in recent years (figure 8). Tasmania’s share of Australian fisheries gross value of production has more than doubled from 12 per cent in 2000–01 to 25 per cent in 2009–10. South Australia’s share of the gross value of production increased from 17 per cent to 21 per cent between 2000–01 and 2008–09. This reflects the strong growth in aquaculture production in these states during this period. However, this share reduced to 18 per cent in 2009–10 as a result of a significant decline in southern bluefin tuna production. In contrast, Western Australia’s share declined from 23 per cent to 17 per cent over the same period, reflecting declines in both wild-caught and aquaculture production. The share of Commonwealth fisheries production also fell from 19 per cent to 14 per cent in real value terms over the same period.
New South Wales (table 7)Key species groups: oysters (a), prawns (w), sea mullet (w) and rock lobster (w)In 2009–10, the gross value of New South Wales fisheries production was $132.9 million, of which the wild-catch sector accounted for $80.5 million or 61 per cent. The aquaculture sector, which was valued at $52.4 million, accounted for 39 per cent. Compared with 2008–09, the gross value of fisheries production rose by 4 per cent ($5.1 million) in 2009–10, following a 4 per cent increase in average unit values. In contrast, the total volume of fisheries production remained relatively stable, decreasing slightly to 19 138 tonnes in 2009–10 (from 19 221 tonnes in 2008–09).
In 2009–10, the New South Wales wild-catch sector produced 13 422 tonnes of seafood, which was a decrease of 3 per cent (384 tonnes) compared with 2008–09. Despite this decline, the value of wild-catch production increased by 2 per cent ($1.4 million).
The most valuable wild-caught fisheries product in New South Wales is prawns. On average, it has accounted for 20 per cent of the total value of wild-catch production over the past five years. In 2009–10, the sector harvested 1101 tonnes of prawns, worth $13.6 million. A large proportion of the catch is typically made up of school prawns. This species accounted for 54 per cent (600 tonnes) of the total volume of production of wild-caught prawns in 2009–10, and contributed $4.1 million to the total value of production of the wild-catch sector. King prawns accounted for a smaller proportion of the catch (42 per cent or 466 tonnes), but contributed about $9.2 million.
Value of Australian �sheriesproduction, by jurisdiction,2009–10p
8
$m
jurisdiction
location of catch
100
200
300
400
500
600
other
Commonwealth
NT
Tas
SA
WA
Qld
Vic
NSW
p Preliminary
Pro du c tio n
10
The New South Wales wild-catch sector also comprised a wide range of finfish species in 2009–10, including mullet (3182 tonnes, valued at $8 million), school whiting (839 tonnes, $2.8 million), bream (231 tonnes, $2.7 million), snapper (260 tonnes, $2.7 million) and Australian salmon (541 tonnes, $0.9 million). Despite a significant increase (by 80 per cent or 1415 tonnes) in the volume of mullet, the volume of production of wild-caught finfish decreased slightly by 1 per cent (116 tonnes) to 11 214 tonnes compared with 2008–09. This was a result of decreases in the production volume for most finfish species, such as Australian salmon and school whiting. Despite this, the value of wild-caught finfish increased by 5 per cent ($2.2 million) to $46.5 million in 2009–10 as a result of a 6 per cent increase in the average unit value.
The New South Wales aquaculture sector produced 5716 tonnes of seafood in 2009–10, which represents an increase of 6 per cent (301 tonnes) compared with 2008–09. This increase was largely driven by a 6 per cent (270 tonnes) increase in the volume of mollusc production to 5026 tonnes. Edible oyster production accounted for 99 per cent (4960 tonnes) of this tonnage and was valued at $43 million. Compared with 2008–09, the value of farmed oyster production rose by $3 million (7 per cent). The value of finfish production also increased, by $0.3 million (6 per cent) to $5 million in 2009–10 compared with 2008–09. This was a result of a 7 per cent increase in the average unit value. This resulted in the value of aquaculture production rising by 8 per cent ($3.7 million) to $52.4 million.
Other aquaculture products included prawns (165 tonnes, valued at $2.4 million), silver perch (194 tonnes, $2.3 million), barramundi (86 tonnes, $1 million) and trout (150 tonnes, $1.6 million). These products combined accounted for 10 per cent and 14 per cent of the total volume and value of New South Wales aquaculture production, respectively, in 2009–10.
Victoria (table 8)Key species groups: abalone (w, a), rock lobster (w) and trout (a)In 2009–10, the gross value of Victorian fisheries production was estimated to be $58.1 million. The wild-catch sector, which was valued at $47.8 million, accounted for 82 per cent of this total value. The aquaculture sector was valued at $10.3 million and accounted for 18 per cent. Compared with 2008–09, the gross value of fisheries production fell by 17 per cent ($11.7 million) in 2009–10, following a 1 per cent decrease in the total volume of production and a 16 per cent decrease in the average unit price. This decline could also partly be because production volume and value of wild-caught scallops and aquaculture abalone were not reported because of confidentiality requirements (fewer than five licence holders).
The Victorian wild-catch sector produced 4638 tonnes of seafood in 2009–10, with wild-catch production valued at $47.8 million. This was $6.5 million (12 per cent) lower than 2008–09. A 17 per cent ($4.6 million) decrease in the production value of wild-caught abalone contributed to this fall. Rock lobster production—one of the key wild-caught species groups—remained stable at 274 tonnes in 2009–10, valued at $14.4 million. Other key products in the wild-catch sector included King George whiting ($2.1 million, 4 per cent of wild-catch production value), prawns ($0.9 million, 2 per cent), Australian sardines ($0.8 million, 2 per cent) and crabs ($0.7 million, 2 per cent).
Pro du c tio n
11
The value of Victorian aquaculture production fell by 33 per cent ($5.2 million) to $10.3 million in 2009–10. This could be partly because abalone production was not reported in the total aquaculture production because of confidentiality requirements. Abalone accounted for a large proportion (about 29 per cent) of Victorian aquaculture production in value terms over the last five years. There were insufficient data for eels and yabbies. For individual species groups, salmonids production fell by 7 per cent (62 tonnes) to 815 tonnes in 2009–10, and was valued at $5.1 million. The value of mussel production rose by 48 per cent ($0.6 million) to about $2 million as a result of a 27 per cent increase in its production volume. The value of warm-water finfish also increased, by 51 per cent ($1.1 million) to $3.2 million.
Queensland (table 9)Key species groups: prawns (w, a), coral trout (w), crabs (w) and barramundi (a)The gross value of Queensland fisheries production increased by 6 per cent ($17.1 million) in 2009–10 to $323.7 million; wild-catch production accounted for $222.5 million, or 69 per cent, of this value. The aquaculture sector made up the remaining $101.2 million, or 31 per cent. In volume terms, total fisheries production in Queensland increased by 4 per cent (1423 tonnes) to 33 356 tonnes.
In 2009–10, the Queensland wild-catch sector produced 25 562 tonnes of seafood, which was a slight increase of 1 per cent (149 tonnes) compared with 2008–09. This increase was largely the result of increases in the volume of wild-caught prawns and scallops, which accounted for 28 per cent (7052 tonnes) and 11 per cent (2920 tonnes) of total wild-catch production, respectively. In 2009–10, the volume of wild-caught prawn production rose by 12 per cent (738 tonnes), most of which was attributed to a 21 per cent (638 tonnes) increase in king prawn production, compared with 2008–09. Scallop production also increased, by 10 per cent (260 tonnes) to 2920 tonnes compared with 2008–09.
In 2009–10, Queensland’s wild-catch production value decreased slightly by $0.5 million to $222.5 million. This was mainly attributed to a decrease in the production value of fish products, particularly barramundi, coral trout, shark and grey mackerel, together accounting for 21 per cent ($47.1 million) of the total wild-catch production value. The largest fall in production value was coral trout, by $5.5 million, resulting from a 15 per cent (167 tonnes) decrease in the volume of production. The value of barramundi production fell by 8 per cent ($0.8 million) as a result of an 8 per cent (91 tonnes) decline in its volume of production. Declines in the production values of shark and grey mackerel, by $1.4 million and $0.7 million, respectively, also contributed. In contrast, the value of wild-caught prawns, which accounted for 36 per cent of the wild-catch production value, rose by 10 per cent ($7.4 million) to $80.8 million. The value of scallops also increased, by 10 per cent ($0.9 million) to $10.3 million in 2009–10.
Aquaculture production in Queensland rose by 20 per cent (1274 tonnes) in 2009–10 to 7794 tonnes, of which farmed prawns accounted for 67 per cent, while farmed barramundi accounted for 31 per cent. In value terms, aquaculture production increased by 21 per cent ($17.7 million) to $101.2 million, mainly because of significant increases in production of aquaculture prawns. A 37 per cent (1395 tonnes) increase in production volume in 2009–10
Pro du c tio n

12
resulted in the value of aquaculture prawn production increasing by 38 per cent ($20.5 million) to $75.1 million, making up 74 per cent of the total value of aquaculture production in Queensland in 2009–10. In contrast, the value of farmed barramundi decreased by $0.7 million to $20.7 million, while the volume of production remained stable at 2405 tonnes. Other key products in the Queensland aquaculture sector in 2009–10 included silver perch, jade perch, redclaw, oysters and aquarium fish. Together, these products contributed $3.5 million (3 per cent) to the total value of Queensland’s aquaculture sector.
Western Australia (table 10)Key species groups: rock lobster (w), pearls (a) and prawns (w)The gross value of Western Australian fisheries production was $367.7 million in 2009–10. Compared with 2008–09, this represents a fall of 6 per cent ($25.1 million). The total value of fisheries production in Western Australia included $271.9 million of wild-catch production (74 per cent of the state’s total fisheries production value) and $95.8 million of aquaculture production (26 per cent), which includes pearl production. The total volume of fisheries production also fell by 10 per cent (2722 tonnes) to 24 263 tonnes in 2009–10.
In volume terms, wild-catch production in Western Australia totalled 23 156 tonnes in 2009–10. This followed a decrease of 2788 tonnes or 11 per cent relative to 2008–09. A key component of this catch was 5947 tonnes of rock lobster, 22 per cent (1690 tonnes) lower than the 7637 tonnes caught in 2008–09. Wild-caught scallop production also fell, by 29 per cent (1054 tonnes) to 2525 tonnes.
The fall in volume in wild-catch production was also linked to a decline in value of 7 per cent. This was mainly caused by decreases in the value of rock lobster, abalone and scallops, as these species groups accounted for 74 per cent of the total value of Western Australian wild-catch production in 2009–10. The value of rock lobster production fell by 4 per cent ($7.6 million) to $184.1 million, and the value of wild-caught abalone production fell by 18 per cent ($2 million) to $9.2 million. The value of scallop production fell by $4.7 million to $9.1 million given a 29 per cent (1054 tonnes) decrease in production volume. The value of wild-caught prawn production also fell, by 2 per cent ($0.6 million) to $27.9 million. Together, these declines resulted in a $19.5 million decline in value for Western Australian wild-catch production between 2008–09 and 2009–10. Other notable changes included a 4 per cent ($1.4 million) decrease in the value of finfish species production to $31.2 million in 2009–10. This decline can be attributed to decreases in the production value of tropical snappers, shark, Australian salmon, whiting and Spanish mackerel, together accounting for 49 per cent of wild-caught fish production.
Aquaculture production in Western Australia also declined in 2009–10 in value terms, falling by 6 per cent ($5.6 million) to $95.8 million. This fall was mainly the result of a $4.5 million decrease in the value of pearls, which is the most valuable aquaculture product in the state and contributed around 89 per cent ($85.5 million) of aquaculture production value in 2009–10. The edible seafood component of Western Australia’s aquaculture sector accounted for 11 per cent of its total aquaculture production value in 2009–10. It decreased from $11.4 million in 2008–09 to $10.3 million in 2009–10. This was caused by decreases in the value of most edible aquaculture species.
Pro du c tio n

13
In volume terms, the aquaculture sector produced 1107 tonnes of edible seafood. Key edible aquaculture species groups produced in 2009–10 included fish (508 tonnes, valued at $5.3 million), yabbies (41 tonnes, $0.8 million), marron (53 tonnes, $1.4 million) and mussels (505 tonnes, $1.9 million). These products combined accounted for 10 per cent ($9.4 million) of the total value of Western Australian aquaculture production in 2009–10.
South Australia (table 11)Key species groups: southern bluefin tuna (a), rock lobster (w), prawns (w), abalone (w) and oysters (a)The gross value of fisheries production in South Australia fell by 15 per cent ($70.8 million) between 2008–09 and 2009–10 to $394.4 million. The wild-catch sector accounted for the largest proportion of this value, making up $201.4 million or 51 per cent of the state’s total production value. Aquaculture production was valued lower, at $193 million, accounting for the remaining 49 per cent of the state’s total fisheries value. The total production volume increased by 14 per cent (8103 tonnes) to 67 739 tonnes in 2009–10.
Wild-catch production in South Australia increased by 24 per cent (8984 tonnes) in volume terms to 47 189 tonnes. However, in value terms, wild-catch production fell by 8 per cent ($17.9 million) between 2008–09 and 2009–10, following decreases in the values of rock lobster, prawns and abalone, which accounted for 72 per cent of the total wild-catch value of South Australian production in 2009–10.
The most valuable wild-caught fisheries product in South Australia is rock lobster. Rock lobster accounted for 43 per cent of the total value of wild-catch production in the state in 2009–10. A 14 per cent decrease in the production volume and a 5 per cent decrease in the average unit value resulted in the production value of rock lobster falling by 18 per cent ($18.9 million) to $85.8 million in 2009–10.
The production value of other key species groups, particularly prawns and abalone, also fell, by a total of $5.1 million as a result of falling average unit values for both species groups. In 2009–10, the production value of prawns and abalone was $31.1 million and $28.1 million, respectively. These two species groups accounted for 29 per cent of the total production value in the wild-catch sector.
Farmed production of southern bluefin tuna makes up the major share of the value of fisheries production in South Australia. The majority of southern bluefin tuna in Australia is caught by Commonwealth-endorsed vessels in the Great Australian Bight, for delivery to aquaculture farms off Port Lincoln in South Australia for fattening. Almost all farmed tuna is exported to Japan. In 2009–10, the value of farmed southern bluefin tuna production fell by 35 per cent ($55.6 million) to $102.2 million. This followed a 17 per cent (1502 tonnes) decrease in volume as a result of a reduction in the southern bluefin tuna national catch allocation.
Despite this fall, southern bluefin tuna still accounted for 35 per cent and 53 per cent of South Australian aquaculture production and value, respectively. These declines in southern bluefin tuna production were the main cause of a 21 per cent ($52.8 million) fall in the total value of aquaculture production in South Australia in 2009–10.
Pro du c tio n

14
Other key changes in South Australian aquaculture production in 2009–10 included increases in the value of oyster and abalone production compared with 2008–09, by $2.8 million (9 per cent) and $2.2 million (27 per cent), respectively. As well, the production value of other aquaculture products decreased by $2.3 million (5 per cent) in 2009–10.
Tasmania (table 12)Key species groups: salmonids (a), abalone (w) and rock lobster (w)In 2009–10, the gross value of Tasmanian fisheries production increased by 7 per cent ($36.8 million) relative to 2008–09, to $563.8 million. The total volume of production also rose by 2 per cent (637 tonnes) to reach 41 837 tonnes in 2009–10. In value terms, the wild-catch sector accounted for 30 per cent ($171.6 million) of the state’s total production and the aquaculture sector accounted for the remaining 70 per cent ($392.2 million).
In volume terms, Tasmania’s wild-catch production decreased by 16 per cent (1149 tonnes) between 2008–09 and 2009–10 to 6013 tonnes. Wild-catch production also decreased in value, by 3 per cent ($4.7 million) from $176.3 million in 2008–09 to $171.6 million in 2009–10, driven mainly by a decrease in the value of production of wild-caught rock lobster. Rock lobster accounted for 38 per cent ($65.2 million) of the total value of Tasmanian wild-catch production in 2009–10. This resulted from a 10 per cent ($7.3 million) decrease in value compared with 2008–09, an 8 per cent decrease in catch and a 3 per cent decrease in average unit prices. In contrast, the value of abalone production rose by 3 per cent ($2.4 million) to $97 million in 2009–10, with the volume of production (2443 tonnes) accounting for 41 per cent of the total volume of Tasmanian wild-catch production.
Tasmanian aquaculture production increased by 1787 tonnes (5 per cent) between 2008–09 and 2009–10 to 35 824 tonnes. A large proportion of Tasmania’s aquaculture production consists of salmonids, which have accounted for, on average, 85 per cent of the total volume and 89 per cent of the total value of Tasmanian aquaculture production over the past 10 years. The volume of salmonids production rose in 2009–10 by 7 per cent (1934 tonnes) to 30 950 tonnes. This was equivalent to 86 per cent of the total volume of aquaculture production in Tasmania. The value of salmonids production also rose, by 14 per cent ($43.2 million) to $362.4 million in 2009–10.
Another key Tasmanian aquaculture product is edible oysters. It accounted for around 10 per cent of the state’s aquaculture production volume in 2009–10 and contributed $21.2 million (5 per cent) toward Tasmania’s gross value of production. The remainder of Tasmania’s aquaculture production is composed of mussels (982 tonnes, valued at $3.4 million) and abalone (170 tonnes, $5.1 million). These two products accounted for $8.5 million (2 per cent) of Tasmania’s gross value of fisheries production in 2009–10.
Pro du c tio n

15
Northern Territory (table 13)Key species groups: pearls (a), gold band snapper (w), crabs (w), barramundi (w, a) and mackerel (w)Fisheries production in the Northern Territory was valued at $56.7 million in 2009–10 following a 4 per cent ($2.1 million) increase compared with 2008–09. Wild-catch production was valued at $31.2 million and accounted for 55 per cent of the Northern Territory’s total production value. The aquaculture sector was valued at $25.5 million and accounted for 45 per cent. The volume of production increased by 1 per cent (50 tonnes) between 2008–09 and 2009–10.
In 2009–10, the Northern Territory wild-catch sector harvested a total of 4901 tonnes of seafood, 649 tonnes (12 per cent) lower than in 2008–09. The value of wild-catch production also declined, by 7 per cent ($2.5 million) to $31.2 million. This fall was driven mainly by decreases in the value of fish production, including gold band snapper, snapper, sharks and threadfin salmon, which collectively accounted for 28 per cent of the total wild-catch value. In 2009–10, the total value of these products fell by 13 per cent ($1.3 million) to $8.7 million. A 9 per cent ($1 million) decline in the value of crab production to $9.3 million also contributed to the fall in the value of wild-catch production.
In 2009–10, the value of Northern Territory aquaculture production rose by 22 per cent ($4.6 million) to $25.5 million. Of this total, farmed barramundi accounted for 23 per cent ($5.8 million) and 699 tonnes of farmed barramundi was produced. The remaining $19.7 million consisted of pearls ($19 million) and aquarium production ($0.7 million).
Commonwealth (table 14)Key species groups: prawns (w), tuna (w) and sharks (w)In 2009–10, the gross value of production of Commonwealth-managed fisheries increased by 1 per cent ($2 million) to $316.7 million compared with 2008–09. The increase in value was primarily the result of an 11 per cent increase in the average unit value of species caught in Commonwealth fisheries, which more than offset a 9 per cent decrease in production volume. The reduction in production volume was attributed to decreases in catches in the main sectors of the Southern and Eastern Scalefish and Shark Fishery, such as the Commonwealth Trawl Sector, the Commonwealth Gillnet, Hook and Trap Sectors and the Commonwealth Great Australian Bight Sector. The fall in catches in the Eastern Tuna and Billfish Fishery and the Southern Bluefin Tuna Fishery also contributed.
In 2009–10, the Northern Prawn Fishery remained the most valuable Commonwealth-managed fishery, with the gross value of production rising by 20 per cent ($14.8 million) to $88.8 million. This was the result of a 14 per cent increase in catch volume and a 5 per cent increase in average unit value. The increase in production volume was driven by a 15 per cent increase in prawn catches compared with 2008–09, including tiger, banana and endeavour prawns. The increase in average unit value was driven mainly by a 15 per cent increase in banana prawn prices.
Pro du c tio n
16
The Commonwealth Trawl Sector of the Southern and Eastern Scalefish and Shark Fishery is the second most valuable Commonwealth-managed fishery. In 2009–10, the sector was valued at $56.7 million, increasing by 1 per cent ($0.8 million) compared with 2008–09. A 12 per cent increase in average unit values was mostly offset by a 9 per cent decrease in the volume of production. Blue grenadier, tiger flathead and silver warehou continue to dominate production in this sector. In 2009–10, these species collectively accounted for 53 per cent of production volume and 59 per cent ($33.4 million) of the sector’s total production value.
The third most valuable Commonwealth fishery is the Southern Bluefin Tuna Fishery. In 2009, the Commission for the Conservation of southern bluefin tuna reduced Australia’s total allowable catch by 20 per cent, leaving a quota of 8030 tonnes for the two years 2010 and 2011 (Wilson et al. 2010). This translated to a 19 per cent (938 tonnes) reduction in the total catch of southern bluefin tuna for farming to 4124 tonnes in 2009–10, relative to 2008–09. As a result, the gross value of production of the fishery fell by 16 per cent ($7.2 million) to $38.1 million in 2009–10.
Prawns, which were valued at $92.2 million, remained the most valuable product caught in Commonwealth-managed fisheries in 2009–10, followed by tuna ($58.4 million). Together these products accounted for 48 per cent of the gross value of Commonwealth fisheries production in 2009–10. Other valuable species included flathead ($15.9 million), blue grenadier ($16.3 million), broadbill swordfish ($8.8 million) and ling ($4.7 million), which collectively accounted for 14 per cent of Commonwealth fisheries’ gross value of production.
Production by sectorThe gross volume and value of Australian production, by sector, is given in table 1. Production and value summaries for each sector are given in table 2 (wild-catch sector) and tables 15 to 17 (aquaculture sector).
In 2009–10, the total volume of Australian fisheries production increased by 2 per cent (3615 tonnes) to 241 123 tonnes. This increase was mainly the result of higher production in the aquaculture sector, which rose by 5 per cent (3449 tonnes), offset by a 1 per cent (921 tonnes) decrease in the production volume of the wild-catch sector.
The gross value of Australian fisheries production fell by 2 per cent ($35.4 million) from $2.21 billion in 2008–09 to $2.18 billion in 2009–10. The gross value of wild-catch production fell by $48.2 million to $1.34 billion, while the gross value of aquaculture production fell by $3.8 million to $870.4 million.
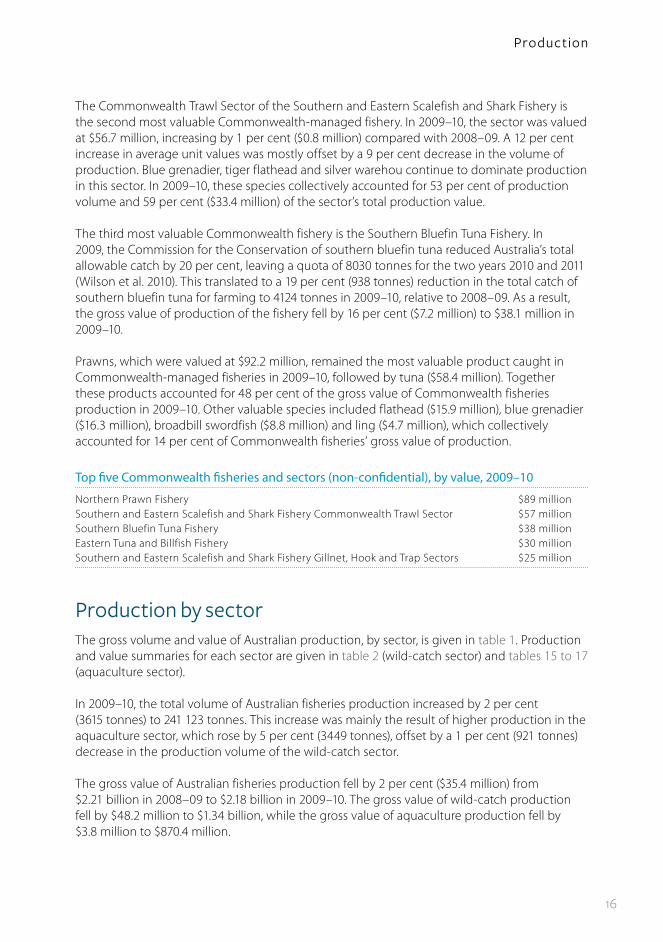
Top five Commonwealth fisheries and sectors (non-confidential), by value, 2009–10
Northern Prawn Fishery $89 millionSouthern and Eastern Scalefish and Shark Fishery Commonwealth Trawl Sector $57 millionSouthern Bluefin Tuna Fishery $38 millionEastern Tuna and Billfish Fishery $30 millionSouthern and Eastern Scalefish and Shark Fishery Gillnet, Hook and Trap Sectors $25 million
Pro du c tio n

17
From 2000–01 to 2009–10, the value of state wild-catch production decreased by $700 million (41 per cent) in real terms (figure 9). The value of aquaculture production decreased to a lesser extent, by $40.2 million (4 per cent), over the same period. The value of Commonwealth fisheries production also declined, by $297.5 million (48 per cent) from $614.3 million in 2000–01 to $316.7 million in 2009–10.
Wild-catch (table 2)Key species groups: prawns, rock lobster, tuna and abaloneIn 2009–10, the total production volume of the wild-catch sector declined by 921 tonnes (1 per cent) to 171 512 tonnes. Declines in production volumes occurred across crustacean and mollusc groups, declining by 2 per cent and 5 per cent, respectively. Fish production increased (557 tonnes) between 2008–09 and 2009–10 to reach 118 943 tonnes.
In value terms, the gross value of wild-catch production fell by 3 per cent ($48.2 million) to $1.34 billion in 2009–10, driven by a 3 per cent decrease in the average unit value for product landed by the sector (figure 10).
The value of fish production fell by 4 per cent ($18.2 million) to $446.7 million in 2009–10. Declines in production volumes for high-valued products, such as tuna and coral trout, were key drivers behind the decrease in the value of wild-caught fish production. This resulted in the value of production for tuna and coral trout declining by 21 per cent ($15.2 million) and 16 per cent ($6.1 million), respectively; a decrease in production volume and value for sharks, by 19 per cent (1631 tonnes, $6.7 million), also contributed. In contrast, the production value for Australian sardine increased by 26 per cent ($5.5 million) to $26.3 million in 2009–10 as a result of a 29 per cent (9079 tonnes) increase in its production volume. The production value for mullet also increased by $3.3 million (30 per cent) as a result of a 33 per cent (1375 tonnes) increase in production volume between 2008–09 and 2009–10.
The value of mollusc production fell by $9.4 million (4 per cent) to $205.6 million between 2008–09 and 2009–10. Abalone and scallop production accounted for 89 per cent of this value. Despite a 5 per cent increase in the average unit value, the value of wild-caught abalone fell by 4 per cent ($7.3 million). A 9 per cent decrease in the production volume was a key driver. The value of scallop production, which accounted for 13 per cent of total mollusc production, also fell by 1 per cent ($0.4 million) to $25.8 million in 2009–10.
Real value of Australian �sheries production, by sector a
9
state wild-catch
Commonwealth wild-catch
aquaculture
2008
–09
2009
–10p
2007
–08
2006
–07
2005
–06
2004
–05
2003
–04
2002
–03
2001
–02
2000
–01
2009–10$b
1.0
1.5
0.5
2.5
2.0
3.0
3.5
a Aquaculture total has been adjusted to exclude southern bluefin tuna caught in the Commonwealth Southern Bluefin Tuna Fishery, which is input to farms in South Australia. This avoids double counting.p Preliminary
Pro du c tio n
18
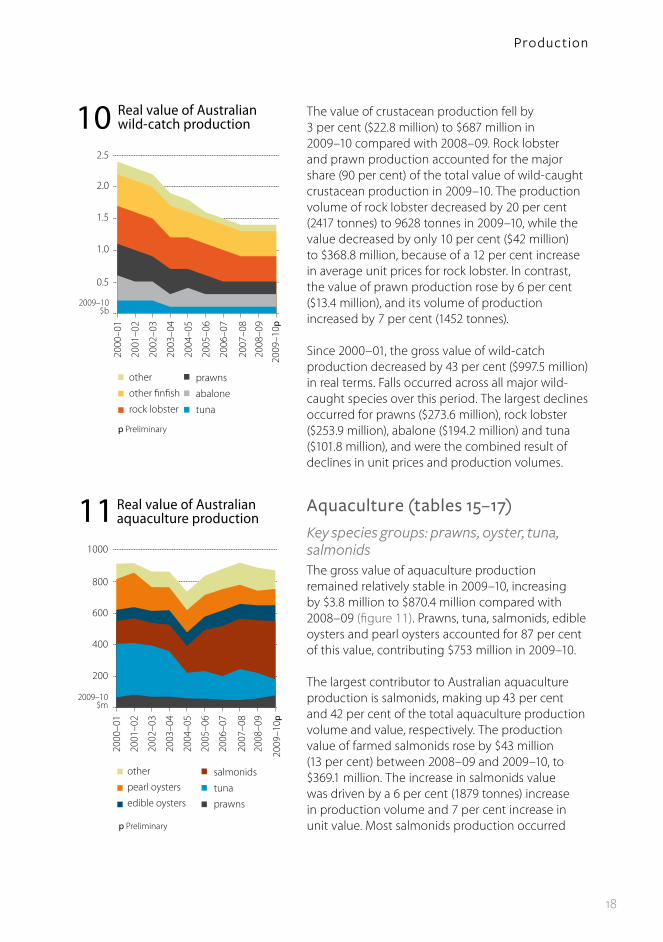
The value of crustacean production fell by 3 per cent ($22.8 million) to $687 million in 2009–10 compared with 2008–09. Rock lobster and prawn production accounted for the major share (90 per cent) of the total value of wild-caught crustacean production in 2009–10. The production volume of rock lobster decreased by 20 per cent (2417 tonnes) to 9628 tonnes in 2009–10, while the value decreased by only 10 per cent ($42 million) to $368.8 million, because of a 12 per cent increase in average unit prices for rock lobster. In contrast, the value of prawn production rose by 6 per cent ($13.4 million), and its volume of production increased by 7 per cent (1452 tonnes).
Since 2000–01, the gross value of wild-catch production decreased by 43 per cent ($997.5 million) in real terms. Falls occurred across all major wild-caught species over this period. The largest declines occurred for prawns ($273.6 million), rock lobster ($253.9 million), abalone ($194.2 million) and tuna ($101.8 million), and were the combined result of declines in unit prices and production volumes.
Aquaculture (tables 15–17)Key species groups: prawns, oyster, tuna, salmonidsThe gross value of aquaculture production remained relatively stable in 2009–10, increasing by $3.8 million to $870.4 million compared with 2008–09 (figure 11). Prawns, tuna, salmonids, edible oysters and pearl oysters accounted for 87 per cent of this value, contributing $753 million in 2009–10.
The largest contributor to Australian aquaculture production is salmonids, making up 43 per cent and 42 per cent of the total aquaculture production volume and value, respectively. The production value of farmed salmonids rose by $43 million (13 per cent) between 2008–09 and 2009–10, to $369.1 million. The increase in salmonids value was driven by a 6 per cent (1879 tonnes) increase in production volume and 7 per cent increase in unit value. Most salmonids production occurred
Real value of Australianwild-catch production10
prawns
abalone
tuna
other
other finfish
rock lobster
2008
–09
2009
–10 p
2007
–08
2006
–07
2005
–06
2004
–05
2003
–04
2002
–03
2001
–02
2000
–01
2009–10$b
1.0
0.5
1.5
2.0
2.5
p Preliminary
Real value of Australian aquaculture production11
salmonids
tuna
prawns
other
pearl oysters
edible oysters
2008
–09
2009
–10p
2007
–08
2006
–07
2005
–06
2004
–05
2003
–04
2002
–03
2001
–02
2000
–01
p Preliminary
2009–10$m
200
400
600
1000
800
Pro du c tio n

19
in Tasmania. Rapid growth of this species group in Tasmania since 2005–06 has contributed significantly to expansion of Australian salmonids production. Compared with 2004–05, the real value of Australian farmed salmonids production increased by 117 per cent ($198.9 million). The volume of production also increased considerably, by 87 per cent (14 852 tonnes) over the same period.
Farmed tuna production consists solely of farmed southern bluefin tuna from South Australia, which accounted for 12 per cent of the total value of Australian aquaculture production in 2009–10. The value of farmed tuna production fell by $55.6 million (35 per cent) between 2008–09 and 2009–10 to $102.2 million because of a 17 per cent fall in production (to 7284 tonnes) and a 22 per cent decline in average unit prices.
Aquaculture prawns accounted for 9 per cent of the total value of Australian aquaculture production in 2009–10. This species group also increased in value by $20.6 million (36 per cent) between 2008–09 and 2009–10 because of a 35 per cent increase in production volume. Most of the increase in farmed prawn production in 2009–10 occurred in Queensland where the volume of aquaculture prawn production increased by 37 per cent (1395 tonnes) to 5216 tonnes.
Since 2000–01, the gross value of aquaculture production has declined by 4 per cent ($40.2 million) in real terms, predominantly because of a $237.7 million decrease in the real value of tuna production. A decline in the value of pearl aquaculture production, by $89.4 million in real terms between 2000–01 and 2009–10, was also a key factor.
Pro du c tio n

20
Trade
Fast facts
ExportsIn 2009–10• Australian fisheries products export earnings (edible and non-edible) decreased by
18 per cent ($282.7 million) to $1.2 billion as a result of lower export unit prices following the 18 per cent appreciation of the Australian dollar against the US dollar.
• The share of export earnings derived from edible fishery products increased slightly to 79 per cent. The remainder consisted of non-edible products, predominantly pearls.
Since 2000–01• The real value of Australian fisheries product exports has fallen by 55 per cent ($1.5 billion).
• The real value of edible fisheries product exports has fallen by 55 per cent ($1.2 billion), with most of this decline attributed to crustacean and mollusc exports (down $866.3 million) and the remainder to fish product exports (down $357.9 million).
• The real value of non-edible fisheries exports has decreased by 56 per cent ($323.3 million) with almost all of this decrease accounted for by pearl exports.
• The majority of the decline in value occurred in the first half of the decade. Since 2004–05, the real value of Australian fisheries product exports has continued to decline, but at a slower pace.
ImportsIn 2009–10 • The total value of Australian imports of fisheries products (edible and non-edible) decreased
by 11 per cent ($195.1 million) to $1.5 billion, with most of this fall attributed to lower import values of non-edible fisheries products (predominantly pearl re-imports).
• Approximately 82 per cent of the Australian import value of fisheries products consisted of edible products, which declined by 3 per cent ($37.0 million) to $1.2 billion. The remainder consisted of non-edible products, predominantly pearls and fish meal.
Top five exports, by value in 2009–10 Top five export destinations in 2009–10(edible and non-edible: tables 18 and 19) (edible and non-edible: tables 24 and 25)
Rock lobster $400 million Hong Kong, China $629 millionPearls $244 million Japan $265 millionAbalone $216 million United States $64 millionTuna $118 million China $44 millionPrawns $61 million Singapore $39 million
21
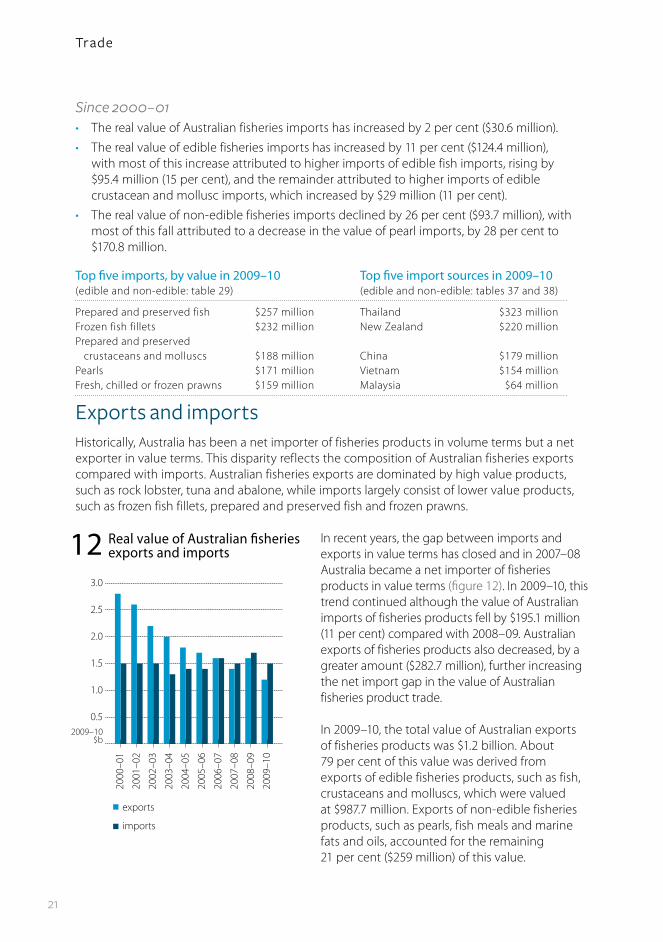
Since 2000–01• The real value of Australian fisheries imports has increased by 2 per cent ($30.6 million).
• The real value of edible fisheries imports has increased by 11 per cent ($124.4 million), with most of this increase attributed to higher imports of edible fish imports, rising by $95.4 million (15 per cent), and the remainder attributed to higher imports of edible crustacean and mollusc imports, which increased by $29 million (11 per cent).
• The real value of non-edible fisheries imports declined by 26 per cent ($93.7 million), with most of this fall attributed to a decrease in the value of pearl imports, by 28 per cent to $170.8 million.
Exports and importsHistorically, Australia has been a net importer of fisheries products in volume terms but a net exporter in value terms. This disparity reflects the composition of Australian fisheries exports compared with imports. Australian fisheries exports are dominated by high value products, such as rock lobster, tuna and abalone, while imports largely consist of lower value products, such as frozen fish fillets, prepared and preserved fish and frozen prawns.
In recent years, the gap between imports and exports in value terms has closed and in 2007–08 Australia became a net importer of fisheries products in value terms (figure 12). In 2009–10, this trend continued although the value of Australian imports of fisheries products fell by $195.1 million (11 per cent) compared with 2008–09. Australian exports of fisheries products also decreased, by a greater amount ($282.7 million), further increasing the net import gap in the value of Australian fisheries product trade.
In 2009–10, the total value of Australian exports of fisheries products was $1.2 billion. About 79 per cent of this value was derived from exports of edible fisheries products, such as fish, crustaceans and molluscs, which were valued at $987.7 million. Exports of non-edible fisheries products, such as pearls, fish meals and marine fats and oils, accounted for the remaining 21 per cent ($259 million) of this value.
Real value of Australian �sheriesexports and imports 12
2009–10$b
exports
imports
2004
–05
2006
–07
2007
–08
2008
–09
2009
–10
2005
–06
2003
–04
2002
–03
2001
–02
2000
–01
0.5
1.0
1.5
2.0
2.5
3.0
Top five imports, by value in 2009–10 Top five import sources in 2009–10(edible and non-edible: table 29) (edible and non-edible: tables 37 and 38)
Prepared and preserved fish $257 million Thailand $323 millionFrozen fish fillets $232 million New Zealand $220 millionPrepared and preserved crustaceans and molluscs $188 million China $179 millionPearls $171 million Vietnam $154 millionFresh, chilled or frozen prawns $159 million Malaysia $64 million
Tr a d e

22
In real terms, the value of Australian fisheries exports has fallen by 55 per cent ($1.5 billion) since 2000–01 to $1.2 billion, with most of the fall occurring over the period to 2004–05 (figure 12). The main factors contributing to this decline were a 38 per cent (24 739 tonnes) decrease in the volume of edible exports and falling unit export prices for most major export products, particularly prawns, tuna and abalone. The decline in unit export prices is the result, in part, of an appreciation in the Australian dollar against both the Japanese yen and US dollar over this period. Since 2004–05, the value of Australian fisheries exports decreased by 18 per cent ($282.7 million) as a result of lower export unit prices following an 18 per cent appreciation of the Australian dollar against the US dollar over the period to 2009–10.
In 2009–10, the total value of Australian fisheries imports decreased by 11 per cent ($195.1 million) to $1.5 billion, with most of the fall attributed to lower import values of non-edible fisheries products (predominantly pearl re-imports). Approximately 82 per cent of import value consisted of edible fishery products, which declined in value terms by 3 per cent ($37.0 million) to $1.2 billion driven mainly by lower import unit prices as a result of a sharp appreciation of the exchange rate.
Since 2004–05, the value of Australian fisheries imports, in real terms, has risen by 12 per cent ($156.4 million), following a decline over the period 2000–01 to 2003–04. The main factor contributing to this increase was an 11 per cent (21 227 tonnes) increase in the quantity of edible imports (excluding live products), with this increase in volume distributed between fish products and crustacean and mollusc products.
Exports by commodity (tables 18 to 20)The total export value of fisheries products (edible and non-edible) fell by 18 per cent ($282.7 million) in 2009–10 to $1.2 billion (figure 13). This was driven by a 14 per cent ($157.6 million) and 33 per cent ($125 million) decrease in the value of edible and non-edible exports, respectively. The decline in the value of edible exports was considerable across fish, crustaceans and molluscs. In 2009–10, the export value of fish products fell by $75.6 million (23 per cent), mainly caused by decreases in the export volume of tuna and salmon products. The export value of crustaceans and molluscs decreased by a greater amount—$82 million (10 per cent)—mainly as a result of declines in the export volume of rock lobster and prawns, which declined by 19 per cent (1832 tonnes) and 3 per cent (138 tonnes), respectively. An increase in the export value of abalone offset to
Real value of Australian �sheries exports13
non-edible
crustaceans and molluscs
fish
2008
–09
2009
–10
2007
–08
2006
–07
2005
–06
2004
–05
2003
–04
2002
–03
2001
–02
2000
–01
2009–10$b
1.0
0.5
1.5
2.0
3.0
2.5
Tr a d e

23
some extent the overall decline in the export value of Australian fisheries products, rising by $8 million to $216 million in 2009–10. The decline in the value of non-edible exports is a result of a 33 per cent ($122.6 million) decrease in the export value of pearls.
Rock lobster remained the most valuable export product by value in 2009–10 at $400 million—despite a decrease in export value of $62 million—followed by pearls ($244 million), abalone ($216 million), tuna ($118 million) and prawns ($61 million) (figure 14). These products together accounted for 83 per cent of the Australian total export value of fisheries products in 2009–10.
Edible fisheries productsKey products: rock lobster, abalone, tuna and prawns
Fish productsThe total export volume of fish products decreased by 19 per cent (4937 tonnes) in 2009–10 to 20 769 tonnes. The decline in volume was greatest for salmon product exports, which accounted for 18 per cent of total fish product exports in 2009–10, falling by 41 per cent (2593 tonnes). In value terms, exports of fish products fell by 23 per cent ($75.6 million) in 2009–10 to $258.4 million. The larger decrease in value terms was because much of the decline in the volume of fish exports was for tuna and salmon, which are relatively high-value fish products. In 2009–10, fish product exports accounted for just over half of total fisheries product exports by volume and 21 per cent by value, respectively. Tuna and salmon were the highest single species groups of fish product exports, together accounting for 64 per cent of fish product exports, by volume.
Tuna exports (including canned) dominated edible fish exports, accounting for 46 per cent ($118.5 million) in value terms. In 2009–10, tuna exports fell by 17 per cent (1976 tonnes)
Value of Australian �sheries exports, by key species14
2009–10
2008–09
rock lobster
prawns
abalone
scallops
pearls
tuna
$m 200100 300 400 500
Tr a d e

24
in volume terms and 33 per cent ($58.3 million) in value terms. Falls in the export value (49 per cent) and volume (25 per cent) of whole frozen tuna were the main causes of these decreases.
Salmonids exports (including prepared and preserved) accounted for a relatively smaller share of the value of edible finfish exports—10 per cent or $26.6 million. In volume terms, salmon exports accounted for 18 per cent (3687 tonnes) of edible fish exports. Exports of salmon products decreased significantly in 2009–10, by 41 per cent (2593 tonnes) in volume terms and 40 per cent ($17.5 million) in value terms. This decrease was driven mainly by a 38 per cent ($15.8 million) decline in the export of fresh or chilled whole salmon, which accounted for 97 per cent of total salmonids exports by value in 2009–10.
Exports of other fish products remained fairly stable, at $113.4 million, in 2009–10 compared with 2008–09. Increases in the export values of fresh, chilled or frozen fish products (excludes tuna and salmon), by a total of $14.9 million, have largely offset decreases in the export value of prepared and preserved fish products, and dried, salted and smoked products (excludes tuna and salmon). The export value of live fish also declined, by 13 per cent or $6 million, to $40.4 million. In total, exports of other fish products accounted for 44 per cent of total edible finfish exports.
Crustacean and mollusc productsIn 2009–10, exports of crustaceans and molluscs fell by 9 per cent (1995 tonnes) in volume terms. At the same time, the total value of crustacean and mollusc exports fell by 10 per cent ($82.1 million). Crustacean and mollusc exports accounted for 48 per cent and 74 per cent of edible export volume and value, respectively.
The major crustacean and mollusc exports were rock lobsters, prawns, crabs, abalone and scallops. Rock lobster exports accounted for 55 per cent of the total export value of crustaceans and molluscs in 2009–10. Compared with 2008–09, the export value of rock lobsters fell by 13 per cent ($62 million) to $399.7 million, driven by a 19 per cent (1832 tonnes) decrease in export volume for rock lobster. Abalone exports accounted for 30 per cent of the total value of crustacean and mollusc exports. The value of these exports rose by 4 per cent ($8.2 million) to $216.3 million in 2009–10, largely because of a 10 per cent (319 tonnes) increase in its export volume. In contrast, the value of prawn exports decreased by 25 per cent ($20.7 million) to $61.5 million. This is linked to a 23 per cent and 3 per cent (138 tonnes) decrease in the average unit prices and volume for exported prawns between 2008–09 and 2009–10, respectively. The total export value of crabs and scallops also decreased, by 13 per cent or $6.3 million. These two commodities contributed $43.3 million (6 per cent) of the total value of crustacean and molluscs exports.
Non-edible fisheries products
Key products: pearlsThe value of non-edible fisheries product exports fell by 33 per cent ($125 million) to $259 million in 2009–10. This decline was largely attributable to a $122.6 million decrease in the value of pearl exports. Pearl exports were valued at $243.9 million and were the most valuable non-edible export product, accounting for 94 per cent of the total non-edible export
Tr a d e

25
value and 20 per cent of total value of fisheries products exports in 2009–10. The remaining 6 per cent of the total export value of non-edible fisheries products included marine fats and oils, fish meal, ornamental fish and other non-edible products.
Exports by destination (tables 21 to 25)
Edible fisheries productsMain destinations: Hong Kong, JapanIn 2009–10, Australia’s major seafood export destinations were Hong Kong ($491 million), Japan ($215 million), the United States ($49 million), China ($43 million) and Singapore ($38 million) (figure 15), which together accounted for 88 per cent of the total value of Australian seafood exports in 2009–10.
Most finfish products were exported to Japan (mainly tuna and salmon), New Zealand (prepared and preserved fish), Thailand (whiting) and China (whiting). Hong Kong and Japan remained the primary markets for Australia’s exports of crustaceans and molluscs.
In 2009–10, Hong Kong remained Australia’s major export destination for edible fisheries products, accounting for 52 per cent of the total export value of edible fisheries products. Rock lobster and abalone were the main export species groups, accounting for 62 per cent and 27 per cent of the total value of exports to Hong Kong, respectively. In 2009–10, the export value of rock lobsters fell by 5 per cent ($14.5 million) to $305.8 million; while exports of abalone fell by 3 per cent ($4 million) to $131.6 million. Exports of scallops, dried, salted or smoked fish, crabs and prawns accounted for most of the remainder of the total edible fish product exports to Hong Kong.
Japan accounted for 23 per cent of the total export value of edible fisheries products in 2009–10. The
main edible fisheries products exported were tuna (whole), rock lobster, abalone and prawns, accounting for 90 per cent of the total value of edible exports to Japan. Whole tuna was the most important export product, contributing more than half ($112.2 million) of the total export value. Japan is one of Australia’s most important whole tuna export markets and accounted for 96 per cent of Australian exports of whole tuna in value terms.
Australian exports of edible �sheries products (excluding live), by destination
15
800
400
200
600
2009–10$m
1000
JapanHong KongChinese TaipeiUnited StatesSingaporeChina
2004
–05
2006
–07
2007
–08
2008
–09
2009
–10
2005
–06
2003
–04
2002
–03
2001
–02
2000
–01
Tr a d e

26
Other important export destinations in 2009–10 included the United States, Chinese Taipei, Singapore and China. Chinese Taipei and the United States are important export markets for rock lobster, accounting for 8 per cent and 7 per cent, respectively, of the volume of Australia’s rock lobster exports in 2009–10. China and Singapore are the main export markets for abalone, with 14 per cent and 12 per cent of the volume of Australian abalone exports in 2009–10, respectively. Chinese Taipei and China accounted for 26 per cent and 15 per cent of the volume of Australian crab exports in the same year, respectively.
Non-edible fisheries productsMain destinations: Hong Kong, Japan, United StatesThe key export destinations for Australian non-edible fisheries products in value terms in 2009–10 were Hong Kong ($137.8 million), Japan ($49.8 million) and the United States ($15.5 million). Together, these countries comprised 78 per cent of non-edible fisheries product exports in value terms. The major product exported to these markets was pearls, accounting for 100 per cent, 94 per cent and 76 per cent of non-edible exports to Hong Kong, Japan and the United States, respectively.
Exports by state (tables 26 to 28)In 2009–10, Western Australia surpassed South Australia to be the major exporter of edible fisheries products (valued at $266.6 million) followed by South Australia ($258.4 million), Tasmania ($182.8 million) and Queensland ($150.1 million). Together, these states accounted for 87 per cent of the total value of edible exports. The remaining share mostly came from Victoria ($87.3 million) and New South Wales ($22 million).
In 2009–10, Western Australia exported $225.2 million of rock lobster, accounting for 56 per cent of Australia’s total rock lobster export value. South Australia exported $115.7 million of fresh, chilled or frozen whole fish, with exports of southern bluefin tuna contributing 87 per cent ($100.5 million) of this value. South Australia also exported a significant amount of rock lobsters in the same year, valued at $92 million. The major export products for Tasmania in 2009–10 were abalone ($105 million) and rock lobster ($33.5 million). For Queensland, the key edible export products were prawns and live fish, together valued at $72.3 million. Queensland also exported about $20.6 million worth of rock lobsters in 2009–10.
Non-edible exports, predominantly pearls, were dominated by exports from the Northern Territory, which accounted for 61 per cent ($148.1 million) in value terms, and Western Australia, which accounted for 21 per cent ($50.5 million).
Tr a d e

27
Imports by commodity (tables 29 to 31)The total value of Australian fisheries imports fell by 11 per cent ($195.1 million) in 2009–10 to $1.5 billion. Approximately 82 per cent of this value consisted of edible products (valued at $1.2 billion). Edible imported products in 2009–10 included $751.5 million of finfish (60 per cent of total edible imports) and $494.2 million of crustaceans and molluscs (40 per cent). Non-edible products accounted for the remaining 18 per cent ($269 million) of imports in value terms and included pearls, fish meal and marine fats and oils (figure 16).
The key cause of the decrease in import value in 2009–10 was a 37 per cent ($158.1 million) decrease in the value of non-edible fisheries products. A decline in the value of finfish imports, which fell by 9 per cent ($73.2 million), was also a key factor. The major imported products in 2009–10 were prepared and preserved fish ($257.5 million), frozen fish fillets ($231.8 million), pearls ($170.8 million) and fresh, chilled or frozen prawns ($159.2 million) (figure 17).
Real value of Australian �sheries imports16
non-edible
crustaceans and molluscs
finfish
2008
–09
2009
–10
2007
–08
2006
–07
2005
–06
2004
–05
2003
–04
2002
–03
2001
–02
2000
–01
2009–10$b
0.5
1.0
1.5
2.0
Value of Australian imports of �sheries products 17
2009–10
2008–09
frozen fish fillets
prepared and preserved fish
prepared and preservedcrustaceans and molluscs
fresh, chilled andfrozen prawns
pearls
50 $m 150100 200 300250 350
Tr a d e
28
Edible fisheries productsKey products: fish (prepared and preserved, frozen fillets), prawns (fresh, chilled or frozen)Imports of edible fisheries products in 2009–10 fell by 3 per cent ($37 million) in value terms to $1.2 billion. The largest decrease in edible import value was from imports of prepared and preserved fish, which fell by $73.7 million (22 per cent), and frozen fish fillets, which fell by $7 million (3 per cent).
In 2009–10, 60 per cent ($751.5 million) of the total value of edible fisheries product imports was from finfish, while crustaceans and molluscs comprised the remaining 40 per cent ($494.2 million).
FinfishFinfish imports were valued at $751.5 million and accounted for 60 per cent of total edible imports in 2009–10. The largest categories of edible finfish imports in value terms were prepared and preserved fish ($257.5 million) and frozen fish fillets ($231.8 million).
The value of finfish imports fell by 9 per cent ($73.2 million) in 2009–10 mainly because of the lower import value of prepared and preserved fish and frozen fish fillets. Imports of these product types accounted for a total of 65 per cent of the total value of finfish imports.
Prepared and preserved fish imports fell by 22 per cent, from $331.2 million in 2008–09 to $257.5 million in 2009–10. Prepared and preserved tuna and salmon (predominantly canned)contributed $168.1 million (65 per cent) and $51.9 million (20 per cent), respectively, to the total value of prepared and preserved fish imports.
The import value of frozen fish fillets fell by 3 per cent ($7 million) to $231.8 million, because of a decrease in the average unit export price. The value of smoked, dried or salted fish product imports also fell by 8 per cent ($4 million) to $46 million.
Crustaceans and molluscsIn 2009–10, crustacean and mollusc imports rose by 8 per cent ($36.1 million) to $494.2 million. This consisted mainly of prawns ($298.7 million, including prepared and preserved), followed by fresh, chilled or frozen calamari, squid and octopus ($62 million) and fresh, chilled or frozen scallops ($33.5 million).
The increase in value was mainly driven by significant increases in the import values of prawn products, which accounted for 60 per cent of the total value of crustacean and mollusc imports. The import value of prawn products (mainly fresh, chilled or frozen prawns, and prepared and preserved prawns) rose by $28 million (10 per cent) to $298.7 million in 2009–10. This was mainly the result of a 29 per cent increase in its import volume. The import value of fresh, chilled or frozen calamari, squid and octopus also increased, but to a lesser extent, by $7.8 million (14 per cent) to $62 million. This reflected a 20 per cent increase in the average import price. The import value of fresh, chilled or frozen scallops also rose by $3.7 million (12 per cent) to $33.5 million in 2009–10.
Tr a d e

29
Imports by source (tables 32 to 38)
Edible fisheries productsKey sources: Thailand, New Zealand, China, VietnamThe major sources for Australian edible imports (excluding live products) in 2009–10 were Thailand, New Zealand, China and Vietnam (figure 18). Thailand remained the largest source by value ($322.3 million in 2009–10), accounting for 26 per cent of the total import value. New Zealand, China and Vietnam accounted for 17 per cent, 14 per cent and 12 per cent of the total edible import value, respectively.
The major import product from Thailand was prepared and preserved fish (primarily tuna), which accounted for about 55 per cent of the total value of edible fisheries products imported from Thailand in 2009–10.
The major import products from New Zealand were frozen fish fillets and fresh and chilled whole fish. In 2009–10, Australia imported $62 million of frozen fish fillets and $56.4 million of fresh and chilled whole fish from New Zealand.
The import value of edible fisheries products from Vietnam and China has increased in recent years (figures 19 and 20). The total import value from Vietnam and China increased by $96.6 million and $144.1 million, respectively, in real terms from 2000–01 to 2009–10. The main commodity imported from both countries was prawns. In 2009–10, Australian imports of fresh, chilled or frozen prawn products from China continued to increase, rising by 42 per cent ($14.6 million) to $49.1 million. This was a result of a 66 per cent ($17.2 million) increase in the value of uncooked frozen whole prawns from $26.2 million in 2008–09 to $43.4 million in 2009–10. In contrast, imports of all prawn products from Vietnam decreased by 5 per cent ($4.5 million) to $79.2 million. This reflected a 14 per cent ($4.4 million) decrease in the value of uncooked frozen whole prawns imported from Vietnam between 2008–09 and 2009–10.
Non-edible fisheries productsKey sources: Peru, Norway, New Zealand, United StatesImports of non-edible fisheries products fell by 37 per cent ($158.1 million) to $269 million in 2009–10. Imports classified as being re-imported Australian product were 57 per cent of this value and were the cause of the large decrease in 2009–10. Australian re-imports accounted for $154.2 million, nearly all of which comprised re-imported pearl products.
Real value of Australian imports of edible �sheries products (excluding live), by source
18
500
300
200
100
400
2009–10$m
600
ChinaVietnamNew ZealandThailandothers
2004
–05
2006
–07
2007
–08
2008
–09
2009
–10
2005
–06
2003
–04
2002
–03
2001
–02
2000
–01
Tr a d e
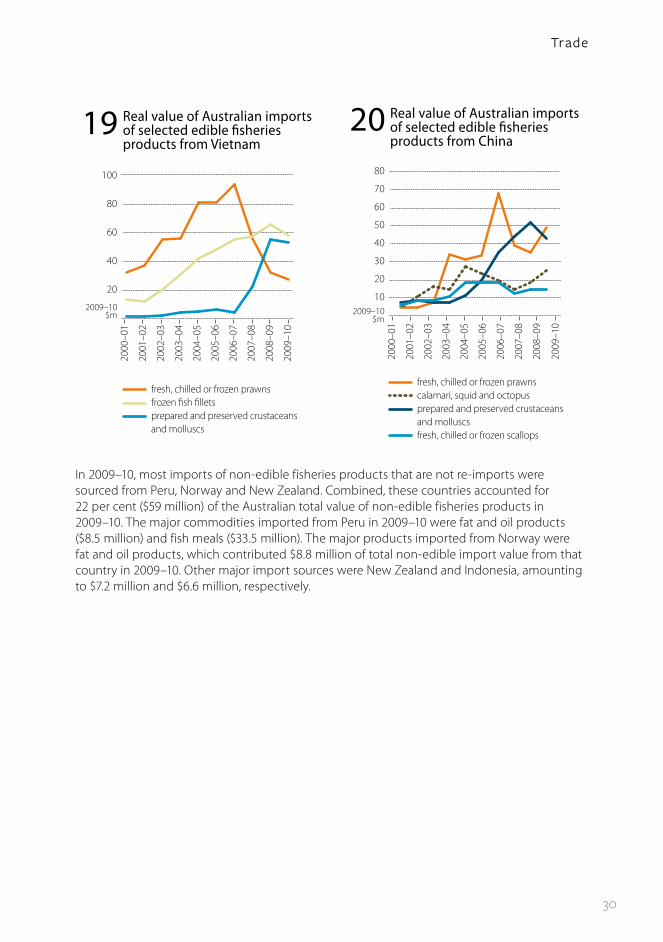
30
In 2009–10, most imports of non-edible fisheries products that are not re-imports were sourced from Peru, Norway and New Zealand. Combined, these countries accounted for 22 per cent ($59 million) of the Australian total value of non-edible fisheries products in 2009–10. The major commodities imported from Peru in 2009–10 were fat and oil products ($8.5 million) and fish meals ($33.5 million). The major products imported from Norway were fat and oil products, which contributed $8.8 million of total non-edible import value from that country in 2009–10. Other major import sources were New Zealand and Indonesia, amounting to $7.2 million and $6.6 million, respectively.
Real value of Australian imports of selected edible �sheries products from Vietnam
19
2009–10$m
fresh, chilled or frozen prawnsfrozen fish filletsprepared and preserved crustaceans and molluscs
2004
–05
2006
–07
2007
–08
2008
–09
2009
–10
2005
–06
2003
–04
2002
–03
2001
–02
2000
–01
20
40
60
80
100
Real value of Australian imports of selected edible �sheries products from China
20
2009–10$m
fresh, chilled or frozen prawnscalamari, squid and octopusprepared and preserved crustaceansand molluscsfresh, chilled or frozen scallops
2004
–05
2006
–07
2007
–08
2008
–09
2009
–10
2005
–06
2003
–04
2002
–03
2001
–02
2000
–01
10
20
30
40
50
60
70
80
Tr a d e
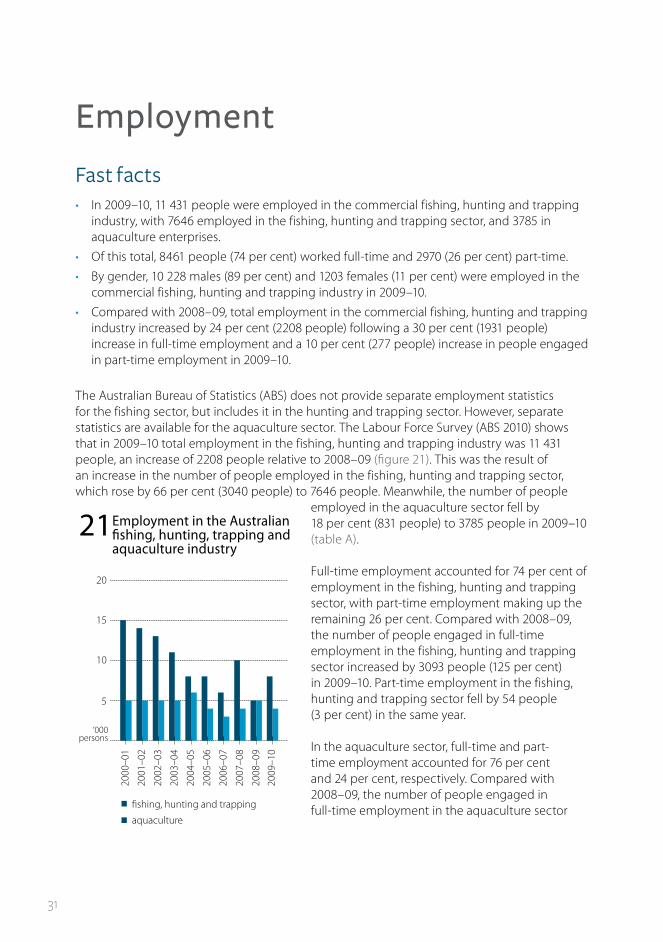
31
Employment
Fast facts• In 2009–10, 11 431 people were employed in the commercial fishing, hunting and trapping
industry, with 7646 employed in the fishing, hunting and trapping sector, and 3785 in aquaculture enterprises.
• Of this total, 8461 people (74 per cent) worked full-time and 2970 (26 per cent) part-time.
• By gender, 10 228 males (89 per cent) and 1203 females (11 per cent) were employed in the commercial fishing, hunting and trapping industry in 2009–10.
• Compared with 2008–09, total employment in the commercial fishing, hunting and trapping industry increased by 24 per cent (2208 people) following a 30 per cent (1931 people) increase in full-time employment and a 10 per cent (277 people) increase in people engaged in part-time employment in 2009–10.
The Australian Bureau of Statistics (ABS) does not provide separate employment statistics for the fishing sector, but includes it in the hunting and trapping sector. However, separate statistics are available for the aquaculture sector. The Labour Force Survey (ABS 2010) shows that in 2009–10 total employment in the fishing, hunting and trapping industry was 11 431 people, an increase of 2208 people relative to 2008–09 (figure 21). This was the result of an increase in the number of people employed in the fishing, hunting and trapping sector, which rose by 66 per cent (3040 people) to 7646 people. Meanwhile, the number of people
employed in the aquaculture sector fell by 18 per cent (831 people) to 3785 people in 2009–10 (table A).
Full-time employment accounted for 74 per cent of employment in the fishing, hunting and trapping sector, with part-time employment making up the remaining 26 per cent. Compared with 2008–09, the number of people engaged in full-time employment in the fishing, hunting and trapping sector increased by 3093 people (125 per cent) in 2009–10. Part-time employment in the fishing, hunting and trapping sector fell by 54 people (3 per cent) in the same year.
In the aquaculture sector, full-time and part-time employment accounted for 76 per cent and 24 per cent, respectively. Compared with 2008–09, the number of people engaged in full-time employment in the aquaculture sector
Employment in the Australian �shing, hunting, trapping and aquaculture industry
21
20
15
10
5
‘000persons
2004
–05
2006
–07
2007
–08
2008
–09
2009
–10
2005
–06
2003
–04
2002
–03
2001
–02
2000
–01
fishing, hunting and trapping
aquaculture
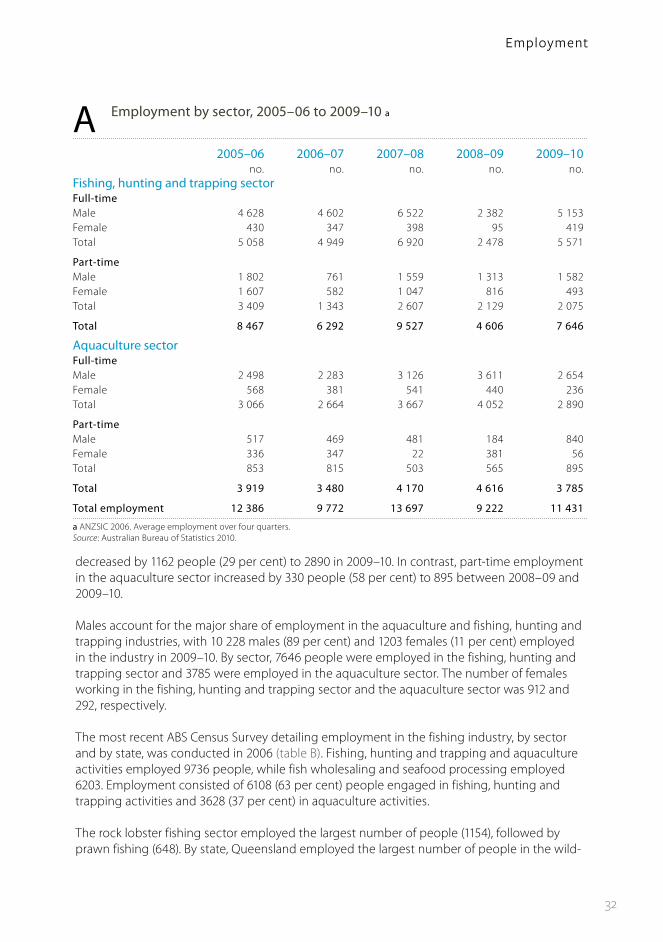
32
decreased by 1162 people (29 per cent) to 2890 in 2009–10. In contrast, part-time employment in the aquaculture sector increased by 330 people (58 per cent) to 895 between 2008–09 and 2009–10.
Males account for the major share of employment in the aquaculture and fishing, hunting and trapping industries, with 10 228 males (89 per cent) and 1203 females (11 per cent) employed in the industry in 2009–10. By sector, 7646 people were employed in the fishing, hunting and trapping sector and 3785 were employed in the aquaculture sector. The number of females working in the fishing, hunting and trapping sector and the aquaculture sector was 912 and 292, respectively.
The most recent ABS Census Survey detailing employment in the fishing industry, by sector and by state, was conducted in 2006 (table B). Fishing, hunting and trapping and aquaculture activities employed 9736 people, while fish wholesaling and seafood processing employed 6203. Employment consisted of 6108 (63 per cent) people engaged in fishing, hunting and trapping activities and 3628 (37 per cent) in aquaculture activities.
The rock lobster fishing sector employed the largest number of people (1154), followed by prawn fishing (648). By state, Queensland employed the largest number of people in the wild-
A Employment by sector, 2005–06 to 2009–10 a
2005–06 2006–07 2007–08 2008–09 2009–10 no. no. no. no. no.Fishing, hunting and trapping sector Full-time Male 4 628 4 602 6 522 2 382 5 153Female 430 347 398 95 419Total 5 058 4 949 6 920 2 478 5 571
Part-time Male 1 802 761 1 559 1 313 1 582Female 1 607 582 1 047 816 493Total 3 409 1 343 2 607 2 129 2 075
Total 8 467 6 292 9 527 4 606 7 646
Aquaculture sector Full-time Male 2 498 2 283 3 126 3 611 2 654Female 568 381 541 440 236Total 3 066 2 664 3 667 4 052 2 890
Part-time Male 517 469 481 184 840Female 336 347 22 381 56Total 853 815 503 565 895
Total 3 919 3 480 4 170 4 616 3 785
Total employment 12 386 9 772 13 697 9 222 11 431
a ANZSIC 2006. Average employment over four quarters. Source: Australian Bureau of Statistics 2010.
Emp loy m ent

33
catch fishing sector, followed by New South Wales and South Australia. Tasmania employed the largest number of people in the aquaculture sector, followed by South Australia and New South Wales.
The Fisheries Research and Development Corporation has noted several points about the ABS employment data, including that it provides a highly conservative estimate of employment in the commercial fishing industry. Employment in commercial fishing covers Commonwealth fishing employment and state fisheries and aquaculture. In the Corporation’s view, data collected by the ABS are not disaggregated in sufficient detail to be useful for planning and strategic purposes. These data tend to ‘under-report employees, including through attribution of some fishing industry activities to other industries such as transport and generalised food processing’ (FRDC 2005). Furthermore, ABS employment data do not appear to be consistent with data collected in connection with fishing vessels, fishing licences and other forms of fishing regulation. However, the latter sources are not sufficiently comprehensive to provide a substitute for ABS data. Until accurate information is available, the FRDC estimates that commercial fishing employment is between 100 000 and 110 000 (FRDC 2010). This figure includes people employed in the wild-catch, aquaculture and all post-harvest processes (including putative seafood components of transport, wholesaling, retailing and restaurants).
B Estimated employment in the Australian fishing industry, by sector in 2006 Australian Bureau of Statistics census data, August 2006 a
NSW Vic. Qld WA SA Tas. NT ACT Australia no. no. no. no. no. no. no. no. no.
Aquaculture 709 280 551 325 766 935 62 0 3 628Finfish trawling 61 52 61 23 53 25 4 0 278Line fishing 7 10 27 15 18 8 0 0 86Prawn fishing 130 4 323 93 78 0 19 0 648Rock lobster fishing 43 93 104 491 227 183 13 0 1 154Other fishing, hunting and trapping b 865 355 945 530 627 427 186 7 3 942Total 1 815 794 2 011 1 477 1 769 1 578 284 7 9 736
Fish wholesaling 1 039 859 1 037 452 460 295 43 17 4 202Seafood processing 203 259 273 357 509 385 15 0 2 001Total 1 242 1 118 1 310 809 969 680 58 17 6 203
Grand total 3 057 1 912 3 321 2 286 2 738 2 258 342 24 15 939
a ANZSIC 2006. b Includes fishing, hunting and trapping not elsewhere specified. Source: Australian Bureau of Statistics 2007.
Emp loy m ent
34
Recreational and charter fishingRecreational fishing is a popular activity that provides economic and social benefits to regional economies. The ABS (2003) estimated that more than 5 million Australians participate in recreational fishing in Australia and that the sector supports about 90 000 Australian jobs. Ridge Partners (2010) estimated that about 3.4 million Australians engage in recreational fishing each year, directly contributing an estimated additional $2.5 billion to national and regional economies.
Two main industries are dependent on the recreational fishing sector: the fishing tackle and bait industry and the recreational boating industry. Value estimates for the tackle and bait industry vary between sources. ABS (2003) estimates indicate annual industry turnover of more than $170 million. Campbell and Murphy (2005) estimate that recreational fishers spent $223 million on fishing gear and tackle and bait in the 12 months to May 2000, some of which would be attributable to second-hand purchases. In contrast, Dominion Consulting (2005) estimated that the value of retail sales in the tackle and bait industry in 2003–04 was $665 million. For the recreational boating industry, annual turnover has been estimated at around $500 million, of which 60 per cent is related to fishing (ABS 2003). A key component of expenditure on recreational fishing in Australia comes from international tourists who are estimated to spend more than $200 million on recreational fishing each year (ABS 2003).
Individual state and territory authorities are responsible for managing recreational and charter fishing in Australia. Recreational fishers are not required to report their activities to fishery management agencies. However, some states require that recreational fishers be licensed and that anglers carry their licences while fishing. State and territory governments also use controls on fish size, bag limits, gear restrictions and seasonal and area closures to regulate recreational catches. Licensing requirements and regulations vary considerably between jurisdictions and often depend on location within a jurisdiction, the fishing method used and the species targeted. Charter vessels are licensed in all states and several states have logbook programs to gather information on activities and catches.
Valuation of the recreational sector is difficult because, unlike the commercial sector in which catch is sold on markets, recreational fishers do not have to pay for fish caught when fishing recreationally and, therefore, do not reveal the associated value they gain from catching fish. Although non-market valuation techniques are available to estimate the value of recreational fisheries, these techniques are often costly to apply and potentially unreliable. Questions also arise over how comparable such recreational values are with gross value of production measures used for valuing the commercial sector. For these reasons, estimates of the economic value of recreational fishing are often not available.
Australia-wideThe National Recreational and Indigenous Fishing Survey (NRIFS) undertaken during 2000 and 2001 (Henry & Lyle 2003) was the last time recreational fishing was surveyed at the national

35
level. Commonwealth and state fishery management agencies carried out the survey over the 12 months to May 2001. The study used telephone and diary survey methods to gather information on the number of recreational fishers in each state and territory and the extent of their activities. Data collected included catch, fishing mode and location, fishing effort and expenditure.
The results from the survey indicated that 3.36 million fishers participated in recreational fishing between May 2000 and May 2001. Estimated expenditure on services and items related to recreational fishing was $1.85 billion over the survey period. New South Wales had the largest expenditure ($554 million), followed by Victoria ($396 million) and Queensland ($320 million). The annual average expenditure per fisher was highest in Victoria at $721 per fisher, followed by Western Australia ($706 per fisher) and the Northern Territory ($608 per fisher). The national average was $552 per fisher per year.
The most recent report on the recreational fishing sector was released in October 2010 by Recfish Australia (2010), Recreational fishing in Commonwealth Waters: a preliminary assessment. The report focuses on recreational fishing occurring in Commonwealth waters. The report states that in some regions in 2005–06, particularly the Narooma–Bermagui region, 47 per cent of fishing trips occurred in waters further than 3 nautical miles from shore and generated about $27 million for the local community.
New South Wales In New South Wales, a recreational fishing license is needed for all recreational fishing activities. Size and bag limits apply for many species, as do gear restrictions and area/seasonal closures. Separate recreational fishing rules apply for saltwater and freshwater fishing. Size limits, catch limits and area and seasonal closures are the primary management measures for these categories. Operators in the charter boat sector must hold a license and maintain comprehensive catch records. However, a number of categories of recreational fishing are exempt from licensing. People under the age of 18 or over the age of 60 and Indigenous people are exempt from holding a recreational fishing licence.
Industry & Investment New South Wales has collected data on gamefishing tournaments since the early 1990s (Park 2007). The program collects catch and effort data from scheduled radio reports routinely broadcast during tournaments and more detailed data from post-fishing interviews with gamefishers and tournament results.
The Department of Primary Industries conducted a survey of recreational fishers in New South Wales for two years from March 2007 (I&I NSW 2010). Preliminary results of the survey (March 2007 to February 2008) are available on the New South Wales Department of Primary Industries website. Survey results provide catch records of the 10 most common recreational species during the interview period. Statistics are available for a number of recreational fishing sites, detailing number of interviewees and their catches during the interview period.
Find more information at www.dpi.nsw.gov.au.
Re crea tio n a l a n d ch a r ter f ishin g
36
VictoriaAn all-water recreational fishing license is needed for recreational fishing activities in Victoria. However, exemptions to holding a license exist for some recreational fisheries in the state but limits and closures still apply. People under 18 years of age or 70 years of age or over are also exempt from holding a recreational fishing licence.
Fisheries Victoria ran a Statewide Angler Fishing Diary Program to collect statistics on Victorian recreational fishing for the period 1997–2003. A time series of catch rates and size composition information was generated for four key target species in four fishing regions of interest to Fisheries Victoria: snapper in Port Phillip Bay and Western Port, King George whiting in Port Phillip Bay and Western Port, black bream in the Gippsland Lakes, and trout (rainbow and brown) in the Goulburn River.
Find more information at www.new.dpi.vic.gov.au.
QueenslandRecreational fishers are not required to hold a licence to fish in Queensland waters. However, anglers must purchase a permit when they fish in certain Queensland dams. Many species have limits on the size (length) of fish that can be legally taken, including minimum size limits and also some maximum size limits. People under 18 do not need a permit.
The Queensland Department of Employment, Economic Development and Innovation’s 2009 report, Prospects for Queensland’s Primary Industries 2009–10, provides estimates of the value generated from recreational fishing activities. In 2009–10, this value was estimated at $73 million (DEEDI 2009). The value from recreational fishing activities is estimated using expenditure figures, including purchases of vessels and fishing equipment, as an indicator of the total recreational fishing value. Therefore, this value is often larger than the commercial equivalent value of fish caught.
Also provided in the report is an estimate of recreational fishing expenditure in Queensland. It was estimated to have ranged between $350 million and $420 million in 2008–09 (DEEDI 2009). Calculation of this expenditure uses an estimate of Queensland recreational fishing expenditure for 2000 (derived from the NRIFS) and adjusts it to 2008–09 dollars assuming the same economic conditions apply.
About 250 charter vessels operate in Queensland waters, catching between 13 500 and 14 000 fish a year. Expenditure related to charter fishing is estimated at about $16 million.
DEEDI has begun the Statewide Recreational Fishing Survey 2010. The survey is designed to obtain reliable estimates of recreational participation rates, statewide and regional annual catch, common species caught by recreational fishers, and regions where recreational fishing activities take place. The survey combines diary and telephone surveys to collect high-quality data over 12 months (DEEDI 2011). The final report is expected to be available in 2012.
Find more information at www.dpi.qld.gov.au.
Re crea tio n a l a n d ch a r ter f ishin g
37
Western AustraliaIn Western Australia, recreational fishing licenses are required for abalone, rock lobster, marron, net fishing and freshwater angling. Two new license categories were also introduced in 2009: a statewide Recreational Boat Fishing license and a West Coast Demersal Scalefish license. New bag limits were introduced at the same time to preserve fish stocks. Seasonal closures are used to control fishing effort for some species, and size and bag limits also apply for most species caught. Operators in the aquatic-tour industry, which includes charter fishing operators, have been required to hold a license since 2001.
Since 2 March 2010, a licence is required to undertake fishing activity using a powered vessel for line fishing, catching crabs and octopus, spear fishing, dip-netting for prawns, fishing crabs or shellfish where taken by wading or non–vessel based activities where a powered vessel is used to reach the destination. However, fishers are not required to hold a recreational fishing licence when fishing from a licensed charter vessel. A person fishing from a vessel without a motor does not require a recreational fishing licence. Indigenous fishers are not required to hold a recreational fishing licence to the extent that the person takes fish from any waters if the fish are taken for the purpose of the person or their family and not for a commercial purpose.
In January 2011, the Western Australia Department of Fisheries began the Western Australian Recreational Boat Fishing Survey 2011. A key component of the survey is tracking fishing activity by 3000 randomly selected boat fishers who will each be issued with a logbook. This survey will provide estimates of the quantity of fish retained and released for each Western Australian fishing region. Findings of the survey will be available by September 2012.
Find more information at www.fish.wa.gov.au.
South AustraliaThe Department of Primary Industries and Resources South Australia (PIRSA 2010) estimates that 236 000 South Australians participate in recreational fishing each year. Recreational fishers are not required to hold a licence to fish in South Australian waters. However, recreational fishing of rock lobster for personal use requires use of registered rock lobster pots. Minimum size limits, bag limits, vessel limits, gear restrictions and area and seasonal closures apply for many recreational species. Charter vessel operators are required to hold a charter boat fishery licence, and are also subject to these restrictions.
In 2007–08, the Department of Primary Industries and Resources conducted a recreational fishing survey that provided estimates of recreational fisher participation levels, demographics, fishing effort and catches for 12 key species (Jones 2009). The report, South Australian Recreational Fishing Survey 2007–08, is available at www.pir.sa.gov.au.
Re crea tio n a l a n d ch a r ter f ishin g

38
TasmaniaA license for salt water rod and line fishing is not required but an Inland Fisheries Licence is required for any fishing in inland waters, including some river mouths and estuaries. Recreational fishing licences are needed for collecting abalone, rock lobster, scallops and mullet when using graball net and beach seine net. Fishing using any type of set line, including dropline or longline, also requires a licence. A range of gear restrictions, bag limits, size limits, seasonal closures and area restrictions apply for abalone, rock lobster, shellfish and scalefish.
Indigenous fishers undertaking customary fishing are exempt from holding a licence but must comply with all other fisheries rules, such as gear restrictions, possession limits, size restrictions and seasons. For Indigenous ceremonial activities, permits and exemptions are available.
The Tasmanian Department of Primary Industries, Parks, Water and Environment and the Tasmanian Aquaculture and Fisheries Institute have recently released a summary of the findings of the 2007–08 Survey of Recreational Fishing in Tasmania, which was funded by the Tasmanian Fishwise Community Grants program (Lyle et al. 2009). The survey provides estimates of recreational fishing participation and catch between December 2007 and November 2008. Other surveys funded through the Tasmanian Fishwise Community Grants program include assessments of the recreational rock lobster fishery, studies of net fishing and a survey of gamefishing in Tasmania (DPIPWE 2010).
Find more information at www.dpiw.tas.gov.au.
Northern TerritoryIt has been estimated that Northern Territory residents and visitors spend nearly $35 million annually on recreational fishing, with most of this expenditure related to the purchase of vessels and vehicles and their associated running costs (Handley 2010).
Recreational fishers are not required to hold a license to fish in Northern Territory waters, although a temporary licence is needed for recreational fishing on and over Indigenous granted land and adjoining waters. Size and possession limits are the primary catch controls for recreational fishing. However, seasonal and area closures also apply for many recreational species.
The Northern Territory Government conducted a recreational fishing survey from February 2009 to March 2010 (Northern Territory Government 2009a & b). The survey provided information on the numbers of fish caught, the time taken to catch fish, fishing gear used and the location of activity. The final survey report is expected to be available in late 2011.
Find more information at www.nt.gov.au.
Re crea tio n a l a n d ch a r ter f ishin g

39
Australian Capital TerritoryRecreational fishers are not required to hold a licence to fish in the Australian Capital Territory (ACT). However, a permit is required when using any type of powered vessel for recreational fishing on Canberra’s urban lakes. The main recreational species targeted are Murray cod, golden perch, trout, redfin and carp.
ACT public waters are opened for fishing all year round and are divided into three categories: open waters, permanently closed waters and trout waters. However, bag and size limits and seasonal closures apply. Restrictions on specific fishing gear and bait used for recreational fishing purposes also apply. Enclosed traps, such as bait, minnow and yabby traps, are prohibited in ACT public waters.
Some ACT waters are permanently closed and fishing is prohibited to protect native fish species. Five fish species that are protected in the ACT are trout cod, Macquarie perch, silver perch, two-spined blackfish, and Murray River crayfish. It is required that if caught, these species must be returned to the water unharmed.
Find more information at www.environment.act.gov.au.
Re crea tio n a l a n d ch a r ter f ishin g

40
Customary fishingCustomary fishing by Indigenous people is increasingly being recognised as separate to other types of fishing. The National Indigenous Fishing Technical Working Group, established in October 2003, aims to enhance Indigenous people’s participation in protecting, sharing and using Australian fisheries (NNTT 2003). The working group formulated The Principles Communiqué on Indigenous Fishing, which was endorsed by the Australian Government in August 2005. The principles represent a commitment from stakeholders to:
• recognise customary fishing as a sector in its own right
• integrate and protect customary fishing within fisheries management frameworks
• implement strategies to engage Indigenous people in fisheries-related business
• expedite processes to increase Indigenous involvement in fisheries management and vocational training (NNTT 2005).
The National Indigenous Fishing Technical Working Group defines customary fishing as ‘fishing in accordance with relevant Indigenous laws and customs for the purpose of satisfying personal, domestic or non-commercial communal needs’ (NNTT 2004). The Torres Strait Treaty (Australian Treaty Series (1985, No 4)) is more specific, describing traditional fishing as:
the taking, by traditional inhabitants for their own or their dependants’ consumption or for use in the course of other traditional activities, of the living natural resources of the sea, seabed, estuaries and coastal tidal areas, including dugong and turtle (DFAT 1978).
Other definitions include slight variations on these. Industry & Investment New South Wales defines Indigenous fishing as:
fishing activities carried out by Aboriginal persons for the purpose of satisfying their personal, domestic or communal needs, or for educational or ceremonial purposes or other traditional purposes, and which do not have a commercial purpose’ (I&I NSW 2009).
The Western Australian Department of Fisheries defines Indigenous fishing as fishing activities applying to ‘an Aboriginal person who has a traditional connection with the area being fished’ and ‘is fishing for personal, domestic, ceremonial, educational or non-commercial needs’ (WA Fisheries 2003). Customary fishing is:
not limited to ‘traditional’ fishing gear, species or methods, but any fishing gear or methods of fishing that are destructive or threaten sustainability (whether traditional or contemporary) and the take of a threatened species must be subject to management to ensure sustainable fishing practices (WA Fisheries 2010).
Indigenous fishers do not necessarily value individual species in a similar way to the non-Indigenous commercial and recreational fishing sectors, as they have different purposes for fishing that are centred on cultural needs and values. Fish is considered an important food source, as well as an important component of many cultural, ceremonial and social events.
41
Fishing also allows communities and families to retain their independence and connection to their fishing areas and reinforce their social networks through the sharing of gathered food (Campbell & Murphy 2005). Fishing is often done opportunistically with little discarded catch.
The National Recreational and Indigenous Fishing Survey (NRIFS) conducted in 2000–01 aimed to better understand the level of fishing undertaken by the Indigenous fishing sector. The survey collected fisheries catch statistics from Indigenous people, aged five years and older, living in coastal communities across the north of Australia from Broome in Western Australia to Cairns in Queensland (excluding those living in the Torres Strait). The survey showed that an estimated 37 000 Indigenous people living in the north of Australia fished at least once during the survey year. This was equivalent to 91.7 per cent of the Indigenous population in northern Australia. It was further estimated that these individuals spent a total of 420 000 days fishing in that same year (Henry & Lyle 2003).
The NRIFS indicated that Indigenous fishers in northern Australia harvested approximately 900 000 finfish, 1.1 million molluscs, 660 000 prawns and yabbies, 180 000 crabs and lobsters and smaller numbers of other species during the survey year. The most prominent finfish species groups were mullet, catfish, perch/snapper, bream and barramundi. The most prominent non-finfish species groups were mussels, cherabin, mud crabs, prawns and oysters. Indigenous fishers also harvest a range of species that are prohibited for non-Indigenous Australians, including crocodiles, turtles and dugong.
A large proportion of Indigenous catches were taken from inshore and coastal waters, reflecting the distribution of key target species. These waters are also more accessible to traditional fishing methods (Campbell & Murphy 2005). While Indigenous fishers use similar fishing methods to recreational fishers, including lines, traps and nets, a major portion of the Indigenous catch is taken by spears and hand collection methods.
Based on the NRIFS, Henry and Lyle (2003) estimated that 186 200 Indigenous people (excluding those living in the Torres Strait) participated in non-commercial fishing during the survey year and that a total expenditure of $22.52 million was incurred by these fishers. Expenditure by Indigenous people residing in northern Australia was estimated to be $2.35 million, while the expenditure by those that resided in southern Australia was $20.6 million.
According to Campbell and Murphy (2005), fish and fishing are important parts of the education process in Indigenous communities, with information being passed on to successive generations. Fishing is considered vital for teaching and practising traditional ways. For that reason, Indigenous fishing rights and opportunities have been formally recognised by many state and territory governments and authorities.
Customary fishing by Indigenous people has been recognised as separate to other types of fishing by the law in Western Australia since 1905 (WA Fisheries 2010). The Northern Territory’s Fisheries Act 1988 exempts Indigenous people from the restrictions of bag limits, size limits, or taking protected species if they are fishing or hunting within their traditional fishing areas (Northern Territory Government 2004).
Cu s to m a r y f ishin g

42
While many exemptions are being applied to Indigenous/customary fishing, regulations are also needed to ensure such fishing is conducted in a sustainable way to protect fish stocks for future generations, and to provide potential opportunities to enhance Indigenous participation in fisheries management.
Since 1993, the Northern Territory Government has established seven committees that have aimed to provide opportunities for Indigenous groups to participate in fisheries management (NT DoR 2010). In June 2006, the Torres Strait Regional Authority established a Land and Sea Management Unit under the Land and Sea Management Strategy for the Torres Strait. This unit provides support for Torres Strait Islander and Aboriginal communities to care for land and sea resources in the Torres Strait region (TSRA 2010). The Western Australian Government drafted a new policy in December 2009 to recognise customary fishing by Indigenous people in its management activities (WA Fisheries 2010). The New South Wales Government has amended its Fisheries Management Act 1994 to formally recognise cultural fishing (I&I NSW 2009). Fisheries Victoria is developing an Aboriginal Fishing Strategy to recognise customary fishing and increase Aboriginal participation in fisheries management processes (VIC DPI 2009).
Cu s to m a r y f ishin g

43
Profile of Australian fisheries in 2008–09 and 2009–10Commonwealth
fishery species method number number
2008–09 2009–10
Northern Prawn Banana, tiger, endeavour and king prawn
Otter trawl 52 vessels 52 vessels
Torres Strait a Prawn, rock lobster, Spanish mackerel, pearl shell, trochus, finfish, sea cucumber, crab
Otter trawl, troll, hand line, free dive, hookah
345 rock lobster licences 167 mackerel 91 pearl shell 45 prawn50 sea cucumber
315 rock lobster licences130 mackerel77 pearl shell46 prawn46 sea cucumber
77 trochus 67 trochus80 crab 64 crab145 line 117 line
Commonwealth Trawl
Mixed fish species particularly ling, blue grenadier, flathead, warehou
Otter trawl, Danish seine
45 vessels 48 vessels
Commonwealth Gillnet , Hook and Trap
Mixed fish species particularly pink ling, blue eye trevalla, gummy shark
Demersal gillnet, demersal longline, dropline, trotline, trap, purse seine
79 vessels 91 vessels
Commonwealth Great Australian Bight
Deepwater flathead, bight redfish
Demersal otter, limited midwater trawl
5 vessels 5 vessels
Southern Bluefin Tuna
Southern bluefin tuna
Purse seine, pole and line, longline, trolling
50 vessels 33 vessels
Eastern Tuna and Billfish b
Yellowfin, bigeye, skipjack and albacore tuna, billfish species
Pelagic longline, purse seine, pole, trolling, rod and reel, handline
75 vessels 63 vessels
Western Tuna and Billfish
Yellowfin, bigeye, skipjack and albacore tuna, billfish species
Pole and line, purse seine, pelagic longline, troll, rod and reel, handline
92 permits 95 SFRs
Bass Strait Scallop Scallop Dredge 72 SFR holders 72 SFR holders
Small Pelagics c Blue mackerel, jack mackerel, red bait, Australian sardines
Purse seine, midwater trawl
71 permits 71 permits
continued...

44
Commonwealth
fishery species method number number
2008–09 2009–10
Southern Squid Arrow or gould’s squid
Jig 49 SFR holders 50 SFR holders
Sub Antarctic Patagonian toothfish, mackerel icefish
Trawl (demersal and midwater), longline, trial pot fishing
2 vessels 3 vessels
Patagonian toothfish
Demersal trawl
Western Deepwater Trawl
Mixed fish species Otter trawl 11 permits 11 permits
North West Slope Scampi Otter trawl 7 permits 7 permits
Coral Sea Reef fish including sharks, trochus, lobster, sea cucumber, aquarium fish, live rock.
Demersal line, trawl and fish trap, hand collection with and without breathing aparatus, hand held scoop, seine nets.
17 permits 16 permits
South Tasman Rise Orange Roughy, Oreo Dory
Deepwater demersal trawl
closed closed
a Numbers of active transferable vessel holder (TVH) and traditional inhabitant (TIB) licences in the Torres Strait with commercial fishing endorsements. b The fishery has moved from a permit fishery to Statutory Fishing Rights (SFRs). Therefore, the number of vessels is listed instead of permits for 2008–09. c Includes four permits held in the Informally Managed Fishery (ImF). Note: Number of licences as of 25 January 2011.Source: Australian Fisheries Management Authority.
Prof ile

45
New South Wales
fishery species method number number
2008–09 a 2009–10 b
Abalone Blacklip abalone (only) Diving 45 shareholdings 45 shareholdings
Rock Lobster Eastern rock lobster Trapping 108 shareholdings 107 shareholdings
Ocean Trawl Prawns, flathead and whiting
Otter board trawling 245 shareholdings 238 shareholdings
Ocean Trap and Line
Snapper, leatherjackets, bonito and spanner crabs
Fish and Spanner Crab traps, handline and dropline
374 shareholdings 365 shareholdings
Ocean Hauling Mullet, Australian sardines and Australian salmon
Hauling (seine) nets and purse seine net
284 shareholdings 286 shareholdings
Southern Fish Trawl
Flathead, whiting and squid
Otter board trawling 23 entitlements 23 entitlements
Estuary Prawn Trawl
School prawns, squid and eastern king prawns
Otter board trawling 180 shareholdings 178 shareholdings
Estuary General Mullet, bream, prawns and crabs
Mesh and hauling (seine) nets, crab and fish traps and hand gathering
623 shareholdings 616 shareholdings
Inland Yabbies and carp (only) Yabbie traps and Gillnets 26 entitlements 26 entitlements
Sea Urchin and Turban Shell
Sea Urchin and Turban Snails
Diving 37 entitlements 37 entitlements
Aquaculture c Prawns Pond culture 12 licence holders 11 licence holders
Yabbies Ponds and farm dams 87 licence holders 86 licence holders
Oysters Rack tray and stick 333 licence holders 336 licence holders
Silver perch Pond 96 licence holders 90 licence holders
Trout Ponds and raceway 27 licence holders 23 licence holders
Snapper 13 licence holders 11 licence holders
Barramundi Pond culture 7 licence holders 6 licence holders
Murray cod Pond culture 44 licence holders 40 licence holders
a As of 16 October 2009. b As of 20 October 2010. c Aquaculture licence holders may culture more than one species on their licence.Note: All New South Wales shares/entitlements are held in Fishing Businesses which may have shares and/or entitlements in one or more fisheries. The Abalone, Lobster, Ocean Trawl (Prawn and Northern Fish Trawl), Ocean Trap and Line, Ocean Hauling, Estuary General and Estuary Prawn Trawl Fisheries are share management fisheries. The Sea Urchin and Turban Shell, Southern Fish Trawl and Inland Fisheries are restricted fisheries.Source: Industry & Investment New South Wales 2010.
Prof ile
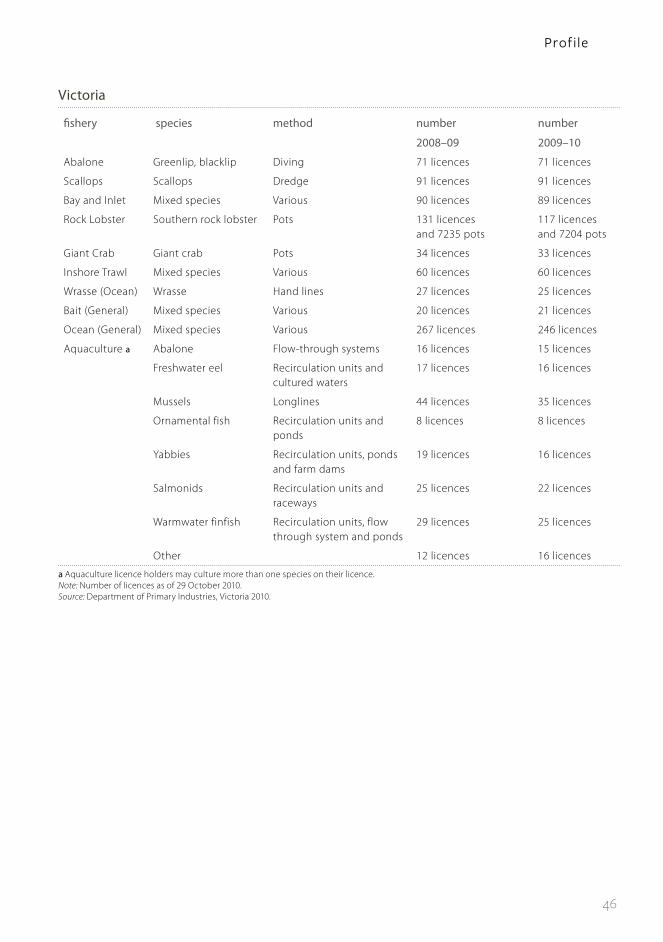
46
Victoria
fishery species method number number
2008–09 2009–10
Abalone Greenlip, blacklip Diving 71 licences 71 licences
Scallops Scallops Dredge 91 licences 91 licences
Bay and Inlet Mixed species Various 90 licences 89 licences
Rock Lobster Southern rock lobster Pots 131 licences and 7235 pots
117 licences and 7204 pots
Giant Crab Giant crab Pots 34 licences 33 licences
Inshore Trawl Mixed species Various 60 licences 60 licences
Wrasse (Ocean) Wrasse Hand lines 27 licences 25 licences
Bait (General) Mixed species Various 20 licences 21 licences
Ocean (General) Mixed species Various 267 licences 246 licences
Aquaculture a Abalone Flow-through systems 16 licences 15 licences
Freshwater eel Recirculation units and cultured waters
17 licences 16 licences
Mussels Longlines 44 licences 35 licences
Ornamental fish Recirculation units and ponds
8 licences 8 licences
Yabbies Recirculation units, ponds and farm dams
19 licences 16 licences
Salmonids Recirculation units and raceways
25 licences 22 licences
Warmwater finfish Recirculation units, flow through system and ponds
29 licences 25 licences
Other 12 licences 16 licences
a Aquaculture licence holders may culture more than one species on their licence. Note: Number of licences as of 29 October 2010.Source: Department of Primary Industries, Victoria 2010.
Prof ile
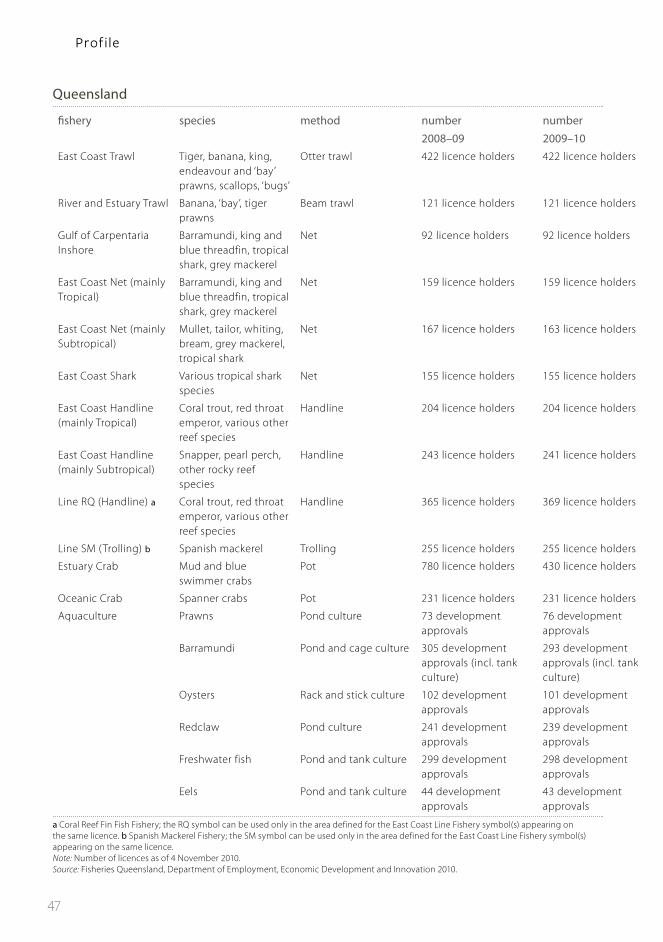
47
Queensland
fishery species method number number
2008–09 2009–10East Coast Trawl Tiger, banana, king,
endeavour and ‘bay’ prawns, scallops, ‘bugs’
Otter trawl 422 licence holders 422 licence holders
River and Estuary Trawl Banana, ‘bay’, tiger prawns
Beam trawl 121 licence holders 121 licence holders
Gulf of Carpentaria Inshore
Barramundi, king and blue threadfin, tropical shark, grey mackerel
Net 92 licence holders 92 licence holders
East Coast Net (mainly Tropical)
Barramundi, king and blue threadfin, tropical shark, grey mackerel
Net 159 licence holders 159 licence holders
East Coast Net (mainly Subtropical)
Mullet, tailor, whiting, bream, grey mackerel, tropical shark
Net 167 licence holders 163 licence holders
East Coast Shark Various tropical shark species
Net 155 licence holders 155 licence holders
East Coast Handline (mainly Tropical)
Coral trout, red throat emperor, various other reef species
Handline 204 licence holders 204 licence holders
East Coast Handline (mainly Subtropical)
Snapper, pearl perch, other rocky reef species
Handline 243 licence holders 241 licence holders
Line RQ (Handline) a Coral trout, red throat emperor, various other reef species
Handline 365 licence holders 369 licence holders
Line SM (Trolling) b Spanish mackerel Trolling 255 licence holders 255 licence holders
Estuary Crab Mud and blue swimmer crabs
Pot 780 licence holders 430 licence holders
Oceanic Crab Spanner crabs Pot 231 licence holders 231 licence holders
Aquaculture Prawns Pond culture 73 development approvals
76 development approvals
Barramundi Pond and cage culture 305 development approvals (incl. tank culture)
293 development approvals (incl. tank culture)
Oysters Rack and stick culture 102 development approvals
101 development approvals
Redclaw Pond culture 241 development approvals
239 development approvals
Freshwater fish Pond and tank culture 299 development approvals
298 development approvals
Eels Pond and tank culture 44 development approvals
43 development approvals
a Coral Reef Fin Fish Fishery; the RQ symbol can be used only in the area defined for the East Coast Line Fishery symbol(s) appearing on the same licence. b Spanish Mackerel Fishery; the SM symbol can be used only in the area defined for the East Coast Line Fishery symbol(s) appearing on the same licence. Note: Number of licences as of 4 November 2010.Source: Fisheries Queensland, Department of Employment, Economic Development and Innovation 2010.
Prof ile

48
Western Australia
fishery species method number number
2008–09 2009–10
West Coast Rock Lobster
Western rock lobster Pots 399 boats
44 235 pots
299 boats
29 260 pots
Abalone a b Greenlip, brownlip and roe’s abalone
Diving 28 licences 26 licences
Shark Bay Prawn King, tiger and endeavour prawns, scallops
Trawl 27 licences 27 licences
Exmouth Gulf Prawn
King, tiger and endeavour prawns
Trawl 16 licences 15 licences
Nickol Bay Prawn King and banana prawns Trawl 14 licences 14 licences
Shark Bay Scallop Scallops Trawl 41 licences 41 licences
27 prawn boats 27 prawn boats
14 scallop boats 14 scallop boats
Aquaculture Pearls Longlines
Yabbies Ponds and farm dams
Marron Ponds and farm dams
Mussels Longlines
a 2008–09 number of active boats; actual number of licences is 57. b 2009–10 number of active boats; actual number of licences is 54.Source: Department of Fisheries, Western Australia 2010.
Prof ile

49
South Australia
fishery species method number number2008–09 2009–10
Blue Crab Blue crab Pots 9 licence holders 9 licence holders
Central Zone Abalone Greenlip, blacklip abalone
Diving 6 licence holders 6 licence holders
Gulf St Vincent Prawn Western king prawn Trawl 10 licence holders 10 licence holders
Lakes and Coorong Freshwater finfish, marine finfish, molluscs
Netting, line fishing, handlines
36 licence holders 36 licence holders
Marine Scalefish Various finfish, crustaceans, molluscs
Netting, line fishing, handlines and traaps
335 licence holders 328 licence holders
Miscellaneous Various finfish, crustaceans, molluscs, worms
Traps, diving, etc 20 licence holders 20 licence holders
Northern Zone Rock Lobster
Southern rock lobster Pots 68 licence holders 68 licence holders
Restricted Marine Scalefish
Various finfish, crustaceans, molluscs
Netting, line fishing, handlines, traps
12 licence holders 12 licence holders
River Fishery Freshwater finfish, crustaceans
Netting, pots 6 licence holders 6 licence holders
Southern Zone Rock Lobster
Southern rock lobster Pots 181 licence holders 181 licence holders
Southern Zone Abalone
Greenlip, blacklip abalone
Diving 6 licence holders 6 licence holders
Spencer Gulf Prawn Western king prawn Trawl 39 licence holders 39 licence holders
West Coast Prawn Western king prawn Trawl 3 licence holders 3 licence holders
Western Zone Abalone
Greenlip, blacklip abalone
Diving 23 licence holders 23 licence holders
Aquaculture a Abalone Ponds, dams, recirculation systems, seacages, contained longlines and uncontained benthic structures
38 licences 29 licences
Barramundi Ponds, dams and recirculation systems
28 licences 12 licences
Yellowtail kingfish Seacages and tanks 38 licences 33 licences
Marron Ponds and dams 34 licences 18 licences
Oysters Contained racks and contained longlines
348 licences 346 licences
Golden and silver perch
Ponds, dams and recirculation systems
6 licences 8 licences
Southern bluefin tuna Seacages 38 licences 38 licences
Yabbies Ponds and dams 76 licences 48 licences
a Licences may include multiple species. In instances where species are duplicated under one licence, licences were considered for their primary culture species only. Note: Number of licences for wild-catch sector as of 4 November 2010. Number of licences for aquaculture sector as of 21 May 2010 for 2008–09 and 7 March 2011 for 2009–10.Sources: South Australian Research and Development Institute; Department of Primary Industries, South Australia 2010.
Prof ile

50
Tasmania
fishery species method number number
2008–09 2009–10
Abalone Blacklip, greenlip Diving 121 licence holders
122 licence holders
Rock Lobster Southern rock lobster
Pots 312 licence holders
312 licence holders
Giant Crab Giant crab Pots 86 licence holders 86 licence holders
Scallop Commercial, doughboy, queen
Dredge 75 licence holders 75 licence holders
Scalefish Various Netting/hooks 340 licence holders
313 licence holders
Aquaculture Atlantic salmon Cage culture 42 licence holders 43 licence holders
Pacific oysters Racking/line system
117 licence holders
113 licence holders
Mussels Longlines 23 licence holders 17 licence holders
Rainbow trout Cage culture 15 licence holders 6 licence holders
Scallops 10 licence holders 3 licence holders
Abalone Sea cages and land-based tanks
14 licence holders 9 licence holders
Note: Number of licences as of 4 November 2010.Source: Tasmanian Department of Primary Industries, Parks, Water and Environment 2010.
Prof ile
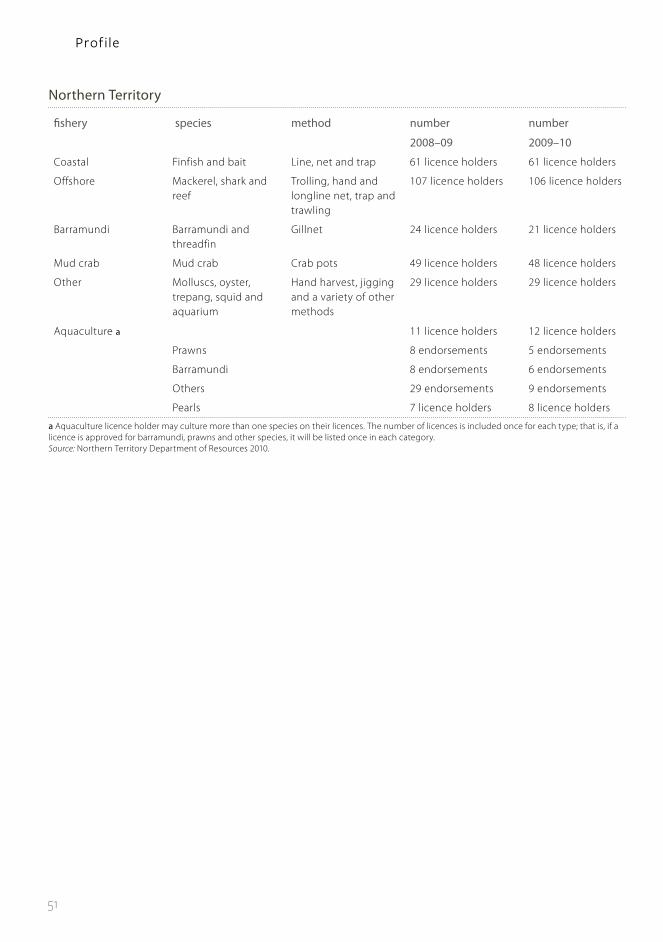
51
Northern Territory
fishery species method number number
2008–09 2009–10
Coastal Finfish and bait Line, net and trap 61 licence holders 61 licence holders
Offshore Mackerel, shark and reef
Trolling, hand and longline net, trap and trawling
107 licence holders 106 licence holders
Barramundi Barramundi and threadfin
Gillnet 24 licence holders 21 licence holders
Mud crab Mud crab Crab pots 49 licence holders 48 licence holders
Other Molluscs, oyster, trepang, squid and aquarium
Hand harvest, jigging and a variety of other methods
29 licence holders 29 licence holders
Aquaculture a 11 licence holders 12 licence holders
Prawns 8 endorsements 5 endorsements
Barramundi 8 endorsements 6 endorsements
Others 29 endorsements 9 endorsements
Pearls 7 licence holders 8 licence holders
a Aquaculture licence holder may culture more than one species on their licences. The number of licences is included once for each type; that is, if a licence is approved for barramundi, prawns and other species, it will be listed once in each category.Source: Northern Territory Department of Resources 2010.
Prof ile

52
ReferencesABS 2003, Year Book Australia 2003, cat. no. 1301.0, Australian Bureau of Statistics, Canberra.
—— 2007, Working Population Profile, 2006 Census Community Profile Series, cat. no. 2006.0, Australian Bureau of Statistics, Canberra.
—— 2010, Labour Force, Australia, Detailed, Quarterly, cat. no. 6291.0, Australian Bureau of Statistics, Canberra, August.
Campbell, D & Murphy, JJ 2005, The 2000–01 National Recreational Fishing Survey Economic Report, A Fisheries Action Program Project, Natural Heritage Trust, FRDC Project No. 99/158.
DEEDI 2009, Prospects for Queensland’s Primary Industries 2009–10, Department of Employment, Economic Development and Innovation, Fisheries Queensland.
—— 2011, Queensland’s Statewide Recreational Fishing Survey 2010, Department of Employment, Economic Development and Innovation, Queensland, available at www.dpi.qld.gov.au/28_18273.htm, accessed 11 March 2011.
DFAT 1978, Treaty between Australia and the Independent State of Papua New Guinea concerning Sovereignty and Maritime Boundaries in the area between the two Countries, including the area known as Torres Strait, and Related Matters, Australian Treaty Series 1985 No 4, Department of Foreign Affairs, Australian Government Publishing Service, Canberra.
Dominion Consulting Pty Ltd 2005, An Economic Profile of the Australian Fishing Tackle Industry, Final Report to the Australian Fishing Tackle Association, October.
FRDC 2005, Investing for tomorrow’s fish: the FRDC’s research and development plan, 2005 to 2010, Fisheries Research and Development Corporation, Canberra.
—— 2010, Working together: The National Fishing and Aquaculture RD&E Strategy 2010, Fisheries Research and Development Corporation, Canberra, for the Strategy Working Group.
Handley, AJ (ed) 2010, Fishery Status Reports 2009, Northern Territory Government Department of Resources, Fishery Report No. 104.
Henry, G & Lyle, J (eds) 2003, The National Recreational and Indigenous Fishing Survey, Department of Agriculture, Fisheries and Forestry, Canberra.
I&I NSW 2009, Cultural Fishing in NSW, Industry & Investment New South Wales, Department of Primary Industries, May.
—— 2010, Recreational Fishing Survey, available at www.dpi.nsw.gov.au/fisheries/recreational/info/survey, accessed 5 February 2010.
Jones, K 2009, South Australian Recreational Fishing Survey 2007–08, South Australian Fisheries Management Series Paper No 54, PIRSA Fisheries, Adelaide.
Lyle, JM, Tracey, SR, Stark, KE & Wotherspoon, S 2009, 2007–08 Survey of Recreational Fishing in Tasmania, Tasmanian Aquaculture and Fisheries Institute, University of Tasmania.
NNTT 2003, ‘Australia’s first Indigenous fishing rights conference draws local and international experts’, Media release, National Native Title Tribunal, 27 October 2003.

53
—— 2004, ‘Fishing principles to guide Indigenous involvement in marine management’, Media release, National Native Title Tribunal, 22 December 2004.
—— 2005, Indigenous Fishing Bulletin, National Native Title Tribunal, November.
Northern Territory Government 2004, Fishery Status Reports 2004, Department of Primary Industry, Fisheries and Mines, Fishery Report No. 82.
—— 2009a, ‘Recreational Fishing Survey begins’, Media release, 2 February 2009.
—— 2009b, Fishery Status Reports 2008, Department of Resources, Fishery Report No. 101.
NT DoR 2010, Indigenous Fishing, Northern Territory Department of Resources, available at www.nt.gov.au/d/Fisheries/index.cfm?header=Indigenous%20Fishing, accessed 17 March 2010.
Park, T 2007, NSW Gamefish Tournament Monitoring—Angling Research Tournament Monitoring Program, NSW Department of Primary Industries, Cronulla Fisheries Research Centre of Excellence, NSW.
PIRSA 2010, South Australian Recreational Fishing Guide 2009, Department of Primary Industries and Resources South Australia, available at www.pir.sa.gov.au/fisheries/recreational_fishing/recreational_fishing_guide, accessed 8 February 2010.
Recfish Australia 2010, Recreational fishing in Commonwealth Waters: a preliminary assessment, Recfish Australia, Brisbane, Australia.
Ridge Partners 2010, Overview of the Australian fishing and aquaculture industry: present and future—A report supporting the development of Working together: The National Fishing and Aquaculture RD&E Strategy, Ridge Partners, March.
TSRA 2010, Land and Sea Management Home, Torres Strait Regional Authority, Thursday Island, Queensland, available at www.tsra.gov.au/land--sea-management-home.aspx, accessed 2 July 2010.
VIC DPI 2009, ‘Developing an Aboriginal Fishing Strategy’, Aboriginal Fishing Strategy Flier, Victorian Department of Primary Industries, available at www.dpi.vic.gov.au/aboriginalfishing, accessed 17 March 2010.
WA Fisheries 2003, Aboriginal Fishing Strategy: ‘Recognising the past, fishing for the future’, draft report to the Minister for Agriculture, Forestry and Fisheries, Fisheries Management Paper No. 168, Western Australian Department of Fisheries, May.
—— 2010, Customary fishing, Western Australian Department of Fisheries, available at www.fish.wa.gov.au/docs/pub/IndigenousFisheries/index.php?0007, accessed 13 January 2010.
Wilson DT, Curtotti R & Begg GA (eds) 2010, Fishery status reports 2009: status of fish stocks and fisheries managed by the Australian Government, Australian Bureau of Agricultural and Resource Economics – Bureau of Rural Sciences, Canberra.
Re feren ce s
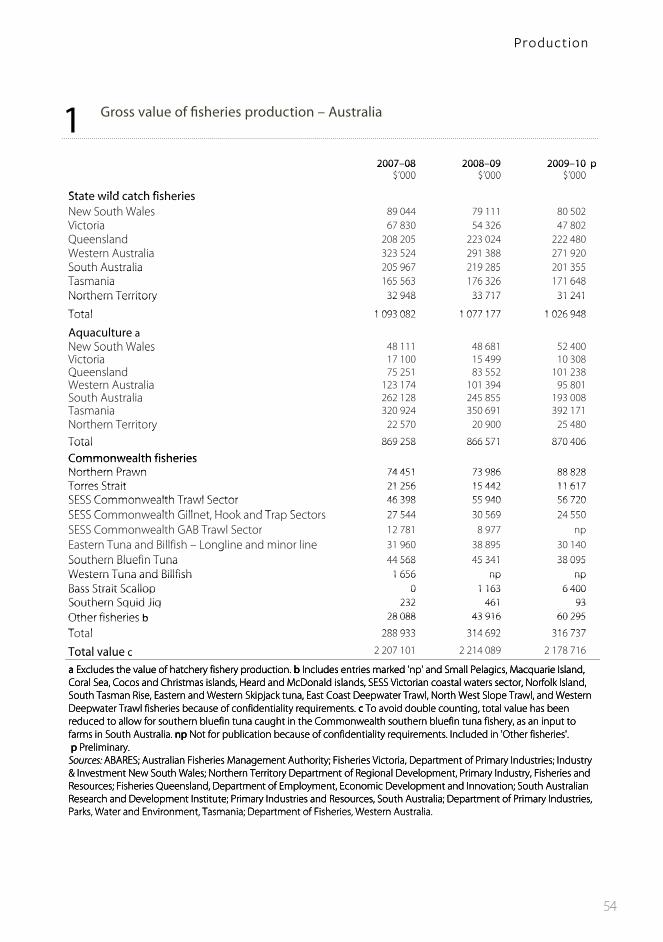
54
1 Gross value of fisheries production – Australia
1 G1 Gross value of fisheries production - Australia1 Gross value of fisheries production Australia
2007–08 2008–09 2009–10 p2007 08 2008 09 2009 10 p$’000 $’000 $’000$ 000 $ 000 $ 000
State wild catch fisheriesState wild catch fisheries N S h W lNew South Wales 89 044 79 111 80 502Victoria 67 830 54 326 47 802Queensland 208 205 223 024 222 480QWestern Australia 323 524 291 388 271 920South Australia 205 967 219 285 201 355 South Australia 05 96 9 85 0 355Tasmania 165 563 176 326 171 648Tasmania 165 563 176 326 171 648Northern Territory 32 948 33 717 31 241Northern Territory 32 948 33 717 31 241
Total 1 093 082 1 077 177 1 026 948Total 1 093 082 1 077 177 1 026 948
Aquaculture aqNew South Wales 48 111 48 681 52 400New South WalesVictoria 17 100 15 499 10 308Queensland 75 251 83 552 101 238QWestern Australia 123 174 101 394 95 801
h lSouth Australia 262 128 245 855 193 008TTasmania 320 924 350 691 392 171Northern Territory 22 570 20 900 25 480yTotal 869 258 866 571 870 406Total 869 258 866 571 870 406
Commonwealth fisheriesCommonwealth fisheries Northern Prawn 74 451 73 986 88 828Northern Prawn 74 451 73 986 88 828Torres Strait 21 256 15 442 11 617Torres Strait 21 256 15 442 11 617SESS Commonwealth Trawl Sector 46 398 55 940 56 720SESS Commonwealth Trawl Sector 46 398 55 940 56 720 SESS C lth Gill t H k d T S t 27 544 30 569 24 550SESS Commonwealth Gillnet, Hook and Trap Sectors 27 544 30 569 24 550SESS C l h GAB T l SSESS Commonwealth GAB Trawl Sector 12 781 8 977 npEastern Tuna and Billfish – Longline and minor line 31 960 38 895 30 140gSouthern Bluefin Tuna 44 568 45 341 38 095Southern Bluefin Tuna 44 568 45 341 38 095Western Tuna and Billfish 1 656 np npWestern Tuna and Billfish 1 656 np npBass Strait Scallop 0 1 163 6 400Bass Strait Scallop 0 1 163 6 400Southern Squid Jig 232 461 93Southern Squid Jig 232 461 93Other fisheries b 28 088 43 916 60 295Other fisheries b 28 088 43 916 60 295
Total 288 933 314 692 316 737Total 288 933 314 692 316 737
Total value c 2 207 101 2 214 089 2 178 716Total value ca Excludes the value of hatchery fishery production. b Includes entries marked 'np' and Small Pelagics, Macquarie Island, a Excludes the value of hatchery fishery production. b Includes entries marked 'np' and Small Pelagics, Macquarie Island, Coral Sea, Cocos and Christmas islands, Heard and McDonald islands, SESS Victorian coastal waters sector, Norfolk Island, a Excludes the value of hatchery fishery production. b Includes entries marked 'np' and Small Pelagics, Macquarie Island, Coral Sea, Cocos and Christmas islands, Heard and McDonald islands, SESS Victorian coastal waters sector, Norfolk Island, South Tasman Rise, Eastern and Western Skipjack tuna, East Coast Deepwater Trawl, North West Slope Trawl, and Western
a Excludes the value of hatchery fishery production. b Includes entries marked np and Small Pelagics, Macquarie Island, Coral Sea, Cocos and Christmas islands, Heard and McDonald islands, SESS Victorian coastal waters sector, Norfolk Island, South Tasman Rise, Eastern and Western Skipjack tuna, East Coast Deepwater Trawl, North West Slope Trawl, and Western Deepwater Trawl fisheries because of confidentiality requirements. c To avoid double counting, total value has been
Coral Sea, Cocos and Christmas islands, Heard and McDonald islands, SESS Victorian coastal waters sector, Norfolk Island, South Tasman Rise, Eastern and Western Skipjack tuna, East Coast Deepwater Trawl, North West Slope Trawl, and Western Deepwater Trawl fisheries because of confidentiality requirements. c To avoid double counting, total value has been reduced to allow for southern bluefin tuna caught in the Commonwealth southern bluefin tuna fishery, as an input to
, pj , p , p ,Deepwater Trawl fisheries because of confidentiality requirements. c To avoid double counting, total value has been reduced to allow for southern bluefin tuna caught in the Commonwealth southern bluefin tuna fishery, as an input to farms in South Australia. np Not for publication because of confidentiality requirements. Included in 'Other fisheries'.
p y q greduced to allow for southern bluefin tuna caught in the Commonwealth southern bluefin tuna fishery, as an input to farms in South Australia. np Not for publication because of confidentiality requirements. Included in 'Other fisheries'.p Preliminary.
S ABARES A li Fi h i M A h i Fi h i Vi i D f P i I d i I d
farms in South Australia. np Not for publication because of confidentiality requirements. Included in 'Other fisheries'.p Preliminary.
Sources: ABARES; Australian Fisheries Management Authority; Fisheries Victoria, Department of Primary Industries; Industry & I t t N S th W l N th T it D t t f R i l D l t P i I d t Fi h i d
p Preliminary. Sources: ABARES; Australian Fisheries Management Authority; Fisheries Victoria, Department of Primary Industries; Industry & Investment New South Wales; Northern Territory Department of Regional Development, Primary Industry, Fisheries and Resources; Fisheries Queensland Department of Employment Economic Development and Innovation; South Australian
Sources: ABARES; Australian Fisheries Management Authority; Fisheries Victoria, Department of Primary Industries; Industry & Investment New South Wales; Northern Territory Department of Regional Development, Primary Industry, Fisheries and Resources; Fisheries Queensland, Department of Employment, Economic Development and Innovation; South Australian Research and Development Institute; Primary Industries and Resources South Australia; Department of Primary Industries
& Investment New South Wales; Northern Territory Department of Regional Development, Primary Industry, Fisheries and Resources; Fisheries Queensland, Department of Employment, Economic Development and Innovation; South Australian Research and Development Institute; Primary Industries and Resources, South Australia; Department of Primary Industries, Parks Water and Environment Tasmania; Department of Fisheries Western Australia
Resources; Fisheries Queensland, Department of Employment, Economic Development and Innovation; South Australian Research and Development Institute; Primary Industries and Resources, South Australia; Department of Primary Industries, Parks, Water and Environment, Tasmania; Department of Fisheries, Western Australia.Research and Development Institute; Primary Industries and Resources, South Australia; Department of Primary Industries, Parks, Water and Environment, Tasmania; Department of Fisheries, Western Australia.
Pro du c tio n
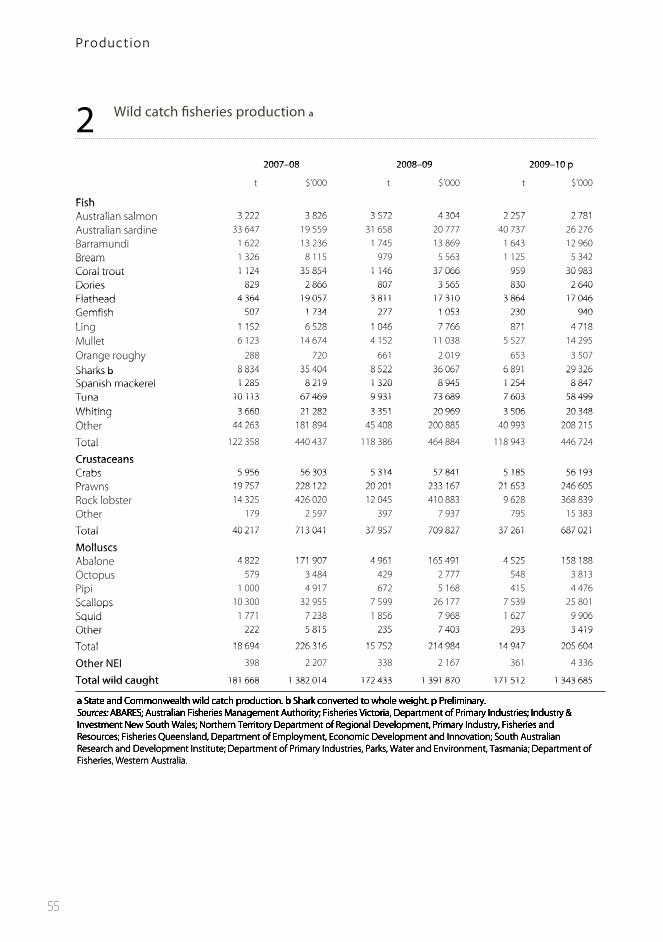
55
2 Wild catch fisheries production a
22 Wild catch fisheries production a2 Wild catch fisheries production a
2007 08 2008 09 2009 10 p2007–08 2008–09 2009–10 p
t $’000 t $’000 t $’000$ $ $
FishFishA t li l 3 222 3 826 3 572 4 304 2 257 2 781Australian salmon 3 222 3 826 3 572 4 304 2 257 2 781A li di 33 647 19 559 31 658 20 777 40 737 26 276Australian sardine 33 647 19 559 31 658 20 777 40 737 26 276Barramundi 1 622 13 236 1 745 13 869 1 643 12 960Bream 1 326 8 115 979 5 563 1 125 5 342BreamCoral trout 1 124 35 854 1 146 37 066 959 30 983Coral trout 1 124 35 854 1 146 37 066 959 30 983Dories 829 2 866 807 3 565 830 2 640Dories 829 2 866 807 3 565 830 2 640Flathead 4 364 19 057 3 811 17 310 3 864 17 046Flathead 4 364 19 057 3 811 17 310 3 864 17 046Gemfish 507 1 734 277 1 053 230 940Gemfish 507 1 734 277 1 053 230 940
Li 1 152 6 528 1 046 7 766 871 4 718Ling 1 152 6 528 1 046 7 766 871 4 718M ll 6 123 14 674 4 152 11 038 5 527 14 295Mullet 6 123 14 674 4 152 11 038 5 527 14 295
Orange roughy 288 720 661 2 019 653 3 507Orange roughySharks b 8 834 35 404 8 522 36 067 6 891 29 326Sharks b 8 834 35 404 8 522 36 067 6 891 29 326Spanish mackerel 1 285 8 219 1 320 8 945 1 254 8 847Spanish mackerel 1 285 8 219 1 320 8 945 1 254 8 847Tuna 10 113 67 469 9 931 73 689 7 603 58 499Tuna 10 113 67 469 9 931 73 689 7 603 58 499
Whiting 3 660 21 282 3 351 20 969 3 506 20 348Whiting 3 660 21 282 3 351 20 969 3 506 20 348Oth 44 263 181 894 45 408 200 885 40 993 208 215Other 44 263 181 894 45 408 200 885 40 993 208 215
Total 122 358 440 437 118 386 464 884 118 943 446 724TotalCrustaceansCrustaceansCrabs 5 956 56 303 5 314 57 841 5 185 56 193Crabs 5 956 56 303 5 314 57 841 5 185 56 193Prawns 19 757 228 122 20 201 233 167 21 653 246 605Prawns 19 757 228 122 20 201 233 167 21 653 246 605R k l b t 14 325 426 020 12 045 410 883 9 628 368 839Rock lobster 14 325 426 020 12 045 410 883 9 628 368 839
hOther 179 2 597 397 7 937 795 15 383
Total 40 217 713 041 37 957 709 827 37 261 687 021Total 40 217 713 041 37 957 709 827 37 261 687 021
MolluscsMolluscsAb l 4 822 171 907 4 961 165 491 4 525 158 188Abalone 4 822 171 907 4 961 165 491 4 525 158 188O 579 3 484 429 2 777 548 3 813Octopus 579 3 484 429 2 777 548 3 813Pipi 1 000 4 917 672 5 168 415 4 476pScallops 10 300 32 955 7 599 26 177 7 539 25 801ScallopsSquid 1 771 7 238 1 856 7 968 1 627 9 906Squid 1 771 7 238 1 856 7 968 1 627 9 906Other 222 5 815 235 7 403 293 3 419Other 222 5 815 235 7 403 293 3 419
Total 18 694 226 316 15 752 214 984 14 947 205 604Total 18 694 226 316 15 752 214 984 14 947 205 604
Other NEI 398 2 207 338 2 167 361 4 336Ot eTotal wild caught 181 668 1 382 014 172 433 1 391 870 171 512 1 343 685Total wild caught 181 668 1 382 014 172 433 1 391 870 171 512 1 343 685
a State and Commonwealth wild catch production. b Shark converted to whole weight. p Preliminary.a State and Commonwealth wild catch production. b Shark converted to whole weight. p Preliminary.Sources: ABARES; Australian Fisheries Management Authority; Fisheries Victoria, Department of Primary Industries; Industry & a State and Commonwealth wild catch production. b Shark converted to whole weight. p Preliminary.Sources: ABARES; Australian Fisheries Management Authority; Fisheries Victoria, Department of Primary Industries; Industry & Investment New South Wales; Northern Territory Department of Regional Development, Primary Industry, Fisheries and
a State and Commonwealth wild catch production. b Shark converted to whole weight. p Preliminary.Sources: ABARES; Australian Fisheries Management Authority; Fisheries Victoria, Department of Primary Industries; Industry & Investment New South Wales; Northern Territory Department of Regional Development, Primary Industry, Fisheries and
a State and Commonwealth wild catch production. b Shark converted to whole weight. p Preliminary.Sources: ABARES; Australian Fisheries Management Authority; Fisheries Victoria, Department of Primary Industries; Industry & Investment New South Wales; Northern Territory Department of Regional Development, Primary Industry, Fisheries and Resources; Fisheries Queensland, Department of Employment, Economic Development and Innovation; South Australian R h d D l t I tit t D t t f P i I d t i P k W t d E i t T i D t t f
a State and Commonwealth wild catch production. b Shark converted to whole weight. p Preliminary.Sources: ABARES; Australian Fisheries Management Authority; Fisheries Victoria, Department of Primary Industries; Industry & Investment New South Wales; Northern Territory Department of Regional Development, Primary Industry, Fisheries and Resources; Fisheries Queensland, Department of Employment, Economic Development and Innovation; South Australian Research and Development Institute; Department of Primary Industries, Parks, Water and Environment, Tasmania; Department of Fisheries Western Australia
a State and Commonwealth wild catch production. b Shark converted to whole weight. p Preliminary.Sources: ABARES; Australian Fisheries Management Authority; Fisheries Victoria, Department of Primary Industries; Industry & Investment New South Wales; Northern Territory Department of Regional Development, Primary Industry, Fisheries and Resources; Fisheries Queensland, Department of Employment, Economic Development and Innovation; South Australian Research and Development Institute; Department of Primary Industries, Parks, Water and Environment, Tasmania; Department of Fisheries, Western Australia.
a State and Commonwealth wild catch production. b Shark converted to whole weight. p Preliminary.Sources: ABARES; Australian Fisheries Management Authority; Fisheries Victoria, Department of Primary Industries; Industry & Investment New South Wales; Northern Territory Department of Regional Development, Primary Industry, Fisheries and Resources; Fisheries Queensland, Department of Employment, Economic Development and Innovation; South Australian Research and Development Institute; Department of Primary Industries, Parks, Water and Environment, Tasmania; Department of Fisheries, Western Australia.
a State and Commonwealth wild catch production. b Shark converted to whole weight. p Preliminary.Sources: ABARES; Australian Fisheries Management Authority; Fisheries Victoria, Department of Primary Industries; Industry & Investment New South Wales; Northern Territory Department of Regional Development, Primary Industry, Fisheries and Resources; Fisheries Queensland, Department of Employment, Economic Development and Innovation; South Australian Research and Development Institute; Department of Primary Industries, Parks, Water and Environment, Tasmania; Department of Fisheries, Western Australia.
Pro du c tio n

56
3 Fisheries production in 2007–08, by state – Australia a 33 Fisheries production in 2007–08, by state - Australia a3 Fisheries production in 2007 08, by state Australia a
NSW Vic Qld WA SA Tas NT C'wlth AustNSW Vic. Qld WA SA Tas. NT C wlth Aust.
Value $’000 $’000 $’000 $’000 $’000 $’000 $’000 $’000 $’000Value $’000 $’000 $’000 $’000 $’000 $’000 $’000 $’000 $’000Fi hFishTuna 0 0 0 218 186 742 0 19 67 232 210 040 bSalmonids c 1 400 7 775 0 na 0 293 134 0 0 302 310Salmonids cOther 51 401 13 625 115 732 39 283 56 232 4 362 26 093 124 527 d 431 255Other 51 401 13 625 115 732 39 283 56 232 4 362 26 093 124 527 d 431 255
Total 52 801 21 401 115 732 39 501 242 974 297 497 26 112 191 758 943 605Total 52 801 21 401 115 732 39 501 242 974 297 497 26 112 191 758 943 605
CrustaceansCrustaceansPrawns 24 049 239 99 402 28 748 35 874 0 0 84 013 272 325Prawns 24 049 239 99 402 28 748 35 874 0 0 84 013 272 325Rock lobster 5 583 13 905 21 020 218 480 91 666 65 937 0 9 428 426 020Rock lobster 5 583 13 905 21 020 218 480 91 666 65 937 0 9 428 426 020Crab 5 066 725 29 292 6 921 6 007 1 715 6 503 74 56 303Crab 5 066 725 29 292 6 921 6 007 1 715 6 503 74 56 303Other 903 130 1 097 2 690 785 0 0 1 532 7 137Other 903 130 1 097 2 690 785 0 0 1 532 7 137
Total 35 600 14 999 150 811 256 839 134 332 67 653 6 503 95 048 761 784otaMolluscsMolluscsAbalone 3 667 43 947 0 10 450 36 194 94 567 0 0 188 826Abalone 3 667 43 947 0 10 450 36 194 94 567 0 0 188 826Scallops 3 1 882 10 415 17 849 na 2 752 0 55 32 955Scallops 3 1 882 10 415 17 849 na 2 752 0 55 32 955Oysters 39 000 na 620 na 30 132 19 375 0 0 89 127Oysters 39 000 na 620 na 30 132 19 375 0 0 89 127S id 1 060 679 302 154 2 580 763 0 1 701 7 238Squid 1 060 679 302 154 2 580 763 0 1 701 7 238O hOther 3 154 2 022 1 292 119 313 7 118 3 335 333 360 136 927
Total 46 883 48 531 12 629 147 766 76 024 120 792 333 2 115 455 073Total 46 883 48 531 12 629 147 766 76 024 120 792 333 2 115 455 073
Other NEI 1 871 0 4 284 2 592 14 765 546 22 570 11 46 639Other NEI 1 871 0 4 284 2 592 14 765 546 22 570 11 46 639
Total value 137 155 84 930 283 456 446 698 468 095 486 487 55 518 288 933 e 2 207 101 b
Quantity t t t t t t t t tQuantity t t t t t t t t t
FishFishT na 0 0 0 31 9 757 0 10 10 072 14 649 bTuna 0 0 0 31 9 757 0 10 10 072 14 649 bS l d 130 1 309 0 0 24 428 0 0 25 867Salmonids c 130 1 309 0 na 0 24 428 0 0 25 867Other 13 496 3 826 14 653 10 868 35 646 1 311 5 523 32 829 d 118 152
Total 13 626 5 135 14 653 10 899 45 403 25 739 5 533 42 901 158 667Total 13 626 5 135 14 653 10 899 45 403 25 739 5 533 42 901 158 667
CrustaceansPrawns 1 931 34 7 909 2 751 2 316 0 0 7 904 22 845Prawns 1 931 34 7 909 2 751 2 316 0 0 7 904 22 845Rock lobster 122 357 775 8 989 2 309 1 433 0 339 14 325Rock lobster 122 357 775 8 989 2 309 1 433 0 339 14 325Crab 349 26 3 295 1 130 732 50 369 5 5 956Crab 349 26 3 295 1 130 732 50 369 5 5 956Other 52 21 67 122 40 0 na 101 403Other 52 21 67 122 40 0 na 101 403
lTotal 2 453 438 12 046 12 992 5 397 1 484 369 8 350 43 529
MolluscsMolluscsAbalone 109 1 385 0 287 1 057 2 487 0 0 5 326Abalone 109 1 385 0 287 1 057 2 487 0 0 5 326Scallops 1 907 2 965 4 957 na 1 461 0 9 10 300Scallops 1 907 2 965 4 957 na 1 461 0 9 10 300Oysters 4 500 0 0 na 5 448 3 588 0 0 13 536Oysters 4 500 0 0 na 5 448 3 588 0 0 13 536Squid 199 67 60 42 303 135 0 965 1 771Squid 199 67 60 42 303 135 0 965 1 771Oth 330 695 643 2 453 856 35 48 5 060Other 330 695 na 643 2 453 856 35 48 5 060
Total 5 139 3 054 3 025 5 929 9 260 8 527 35 1 023 35 992Total 5 139 3 054 3 025 5 929 9 260 8 527 35 1 023 35 992
Other NEI 69 0 121 271 1 727 100 na 4 2 291Other NEI 69 0 121 271 1 727 100 na 4 2 291
T l i 21 287 8 627 29 845 30 091 61 788 35 850 5 937 52 277 240 479 bTotal quantity 21 287 8 627 29 845 30 091 61 788 35 850 5 937 52 277 e 240 479 b
a State totals include aquaculture but exclude hatchery production. b To avoid double counting, total has been reduced to allow for southern bluefin a State totals include aquaculture but exclude hatchery production. b To avoid double counting, total has been reduced to allow for southern bluefin tuna caught in the Commonwealth southern bluefin tuna fishery, as an input to farms in South Australia. c Includes salmon and trout production.a State totals include aquaculture but exclude hatchery production. b To avoid double counting, total has been reduced to allow for southern bluefin tuna caught in the Commonwealth southern bluefin tuna fishery, as an input to farms in South Australia. c Includes salmon and trout production.d Includes fish (excluding Tuna) component of Commonwealth fisheries, plus catch from Commonwealth fisheries that cannot be disaggregated
a State totals include aquaculture but exclude hatchery production. b To avoid double counting, total has been reduced to allow for southern bluefin tuna caught in the Commonwealth southern bluefin tuna fishery, as an input to farms in South Australia. c Includes salmon and trout production.d Includes fish (excluding Tuna) component of Commonwealth fisheries, plus catch from Commonwealth fisheries that cannot be disaggregated because of confidentiality reasons. e Totals include all fisheries under Commonwealth jurisdiction. na Not available.S ABARES A li Fi h i M A h i Fi h i Vi i D f P i I d i I d & I N S h
a State totals include aquaculture but exclude hatchery production. b To avoid double counting, total has been reduced to allow for southern bluefin tuna caught in the Commonwealth southern bluefin tuna fishery, as an input to farms in South Australia. c Includes salmon and trout production.d Includes fish (excluding Tuna) component of Commonwealth fisheries, plus catch from Commonwealth fisheries that cannot be disaggregated because of confidentiality reasons. e Totals include all fisheries under Commonwealth jurisdiction. na Not available.Sources: ABARES; Australian Fisheries Management Authority; Fisheries Victoria, Department of Primary Industries; Industry & Investment New South Wales; Northern Territory Department of Regional Development Primary Industry Fisheries and Resources; Fisheries Queensland Department of
a State totals include aquaculture but exclude hatchery production. b To avoid double counting, total has been reduced to allow for southern bluefin tuna caught in the Commonwealth southern bluefin tuna fishery, as an input to farms in South Australia. c Includes salmon and trout production.d Includes fish (excluding Tuna) component of Commonwealth fisheries, plus catch from Commonwealth fisheries that cannot be disaggregated because of confidentiality reasons. e Totals include all fisheries under Commonwealth jurisdiction. na Not available.Sources: ABARES; Australian Fisheries Management Authority; Fisheries Victoria, Department of Primary Industries; Industry & Investment New South Wales; Northern Territory Department of Regional Development, Primary Industry, Fisheries and Resources; Fisheries Queensland, Department of Employment Economic Development and Innovation; South Australian Research and Development Institute; Primary Industries and Resources South
a State totals include aquaculture but exclude hatchery production. b To avoid double counting, total has been reduced to allow for southern bluefin tuna caught in the Commonwealth southern bluefin tuna fishery, as an input to farms in South Australia. c Includes salmon and trout production.d Includes fish (excluding Tuna) component of Commonwealth fisheries, plus catch from Commonwealth fisheries that cannot be disaggregated because of confidentiality reasons. e Totals include all fisheries under Commonwealth jurisdiction. na Not available.Sources: ABARES; Australian Fisheries Management Authority; Fisheries Victoria, Department of Primary Industries; Industry & Investment New South Wales; Northern Territory Department of Regional Development, Primary Industry, Fisheries and Resources; Fisheries Queensland, Department of Employment, Economic Development and Innovation; South Australian Research and Development Institute; Primary Industries and Resources, South Australia; Department of Primary Industries, Parks, Water and Environment, Tasmania; Department of Fisheries, Western Australia.
a State totals include aquaculture but exclude hatchery production. b To avoid double counting, total has been reduced to allow for southern bluefin tuna caught in the Commonwealth southern bluefin tuna fishery, as an input to farms in South Australia. c Includes salmon and trout production.d Includes fish (excluding Tuna) component of Commonwealth fisheries, plus catch from Commonwealth fisheries that cannot be disaggregated because of confidentiality reasons. e Totals include all fisheries under Commonwealth jurisdiction. na Not available.Sources: ABARES; Australian Fisheries Management Authority; Fisheries Victoria, Department of Primary Industries; Industry & Investment New South Wales; Northern Territory Department of Regional Development, Primary Industry, Fisheries and Resources; Fisheries Queensland, Department of Employment, Economic Development and Innovation; South Australian Research and Development Institute; Primary Industries and Resources, South Australia; Department of Primary Industries, Parks, Water and Environment, Tasmania; Department of Fisheries, Western Australia.
a State totals include aquaculture but exclude hatchery production. b To avoid double counting, total has been reduced to allow for southern bluefin tuna caught in the Commonwealth southern bluefin tuna fishery, as an input to farms in South Australia. c Includes salmon and trout production.d Includes fish (excluding Tuna) component of Commonwealth fisheries, plus catch from Commonwealth fisheries that cannot be disaggregated because of confidentiality reasons. e Totals include all fisheries under Commonwealth jurisdiction. na Not available.Sources: ABARES; Australian Fisheries Management Authority; Fisheries Victoria, Department of Primary Industries; Industry & Investment New South Wales; Northern Territory Department of Regional Development, Primary Industry, Fisheries and Resources; Fisheries Queensland, Department of Employment, Economic Development and Innovation; South Australian Research and Development Institute; Primary Industries and Resources, South Australia; Department of Primary Industries, Parks, Water and Environment, Tasmania; Department of Fisheries, Western Australia.
a State totals include aquaculture but exclude hatchery production. b To avoid double counting, total has been reduced to allow for southern bluefin tuna caught in the Commonwealth southern bluefin tuna fishery, as an input to farms in South Australia. c Includes salmon and trout production.d Includes fish (excluding Tuna) component of Commonwealth fisheries, plus catch from Commonwealth fisheries that cannot be disaggregated because of confidentiality reasons. e Totals include all fisheries under Commonwealth jurisdiction. na Not available.Sources: ABARES; Australian Fisheries Management Authority; Fisheries Victoria, Department of Primary Industries; Industry & Investment New South Wales; Northern Territory Department of Regional Development, Primary Industry, Fisheries and Resources; Fisheries Queensland, Department of Employment, Economic Development and Innovation; South Australian Research and Development Institute; Primary Industries and Resources, South Australia; Department of Primary Industries, Parks, Water and Environment, Tasmania; Department of Fisheries, Western Australia.
a State totals include aquaculture but exclude hatchery production. b To avoid double counting, total has been reduced to allow for southern bluefin tuna caught in the Commonwealth southern bluefin tuna fishery, as an input to farms in South Australia. c Includes salmon and trout production.d Includes fish (excluding Tuna) component of Commonwealth fisheries, plus catch from Commonwealth fisheries that cannot be disaggregated because of confidentiality reasons. e Totals include all fisheries under Commonwealth jurisdiction. na Not available.Sources: ABARES; Australian Fisheries Management Authority; Fisheries Victoria, Department of Primary Industries; Industry & Investment New South Wales; Northern Territory Department of Regional Development, Primary Industry, Fisheries and Resources; Fisheries Queensland, Department of Employment, Economic Development and Innovation; South Australian Research and Development Institute; Primary Industries and Resources, South Australia; Department of Primary Industries, Parks, Water and Environment, Tasmania; Department of Fisheries, Western Australia.
a State totals include aquaculture but exclude hatchery production. b To avoid double counting, total has been reduced to allow for southern bluefin tuna caught in the Commonwealth southern bluefin tuna fishery, as an input to farms in South Australia. c Includes salmon and trout production.d Includes fish (excluding Tuna) component of Commonwealth fisheries, plus catch from Commonwealth fisheries that cannot be disaggregated because of confidentiality reasons. e Totals include all fisheries under Commonwealth jurisdiction. na Not available.Sources: ABARES; Australian Fisheries Management Authority; Fisheries Victoria, Department of Primary Industries; Industry & Investment New South Wales; Northern Territory Department of Regional Development, Primary Industry, Fisheries and Resources; Fisheries Queensland, Department of Employment, Economic Development and Innovation; South Australian Research and Development Institute; Primary Industries and Resources, South Australia; Department of Primary Industries, Parks, Water and Environment, Tasmania; Department of Fisheries, Western Australia.
Pro du c tio n

57
4 Fisheries production in 2008–09, by state – Australia a 4 F4 Fisheries production in 2008–09, by state - Australia a4 Fisheries production in 2008 09, by state Australia a
NSW Vic. Qld WA SA Tas. NT C'wlth Aust.NSW Vic. Qld WA SA Tas. NT C wlth Aust.
Value $’000 $’000 $’000 $’000 $’000 $’000 $’000 $’000 $’000Value $ 000 $ 000 $ 000 $ 000 $ 000 $ 000 $ 000 $ 000 $ 000FishFishTuna 0 0 na 12 157 777 0 23 73 654 187 114 bTuna 0 0 na 12 157 777 0 23 73 654 187 114 bSalmonids c 1 536 5 367 0 na 0 319 175 0 0 326 078Salmonids c 1 536 5 367 0 na 0 319 175 0 0 326 078Other 47 565 12 156 116 405 38 227 69 603 4 334 27 496 147 650 d 463 437Other 47 565 12 156 116 405 38 227 69 603 4 334 27 496 147 650 d 463 437
T l 9 0 2 6 0 38 239 22 380 323 09 2 9 22 30 9 6 629Total 49 101 17 524 116 405 38 239 227 380 323 509 27 519 221 304 976 629
CrustaceansCrustaceansPrawns 19 709 220 127 928 28 533 34 289 0 0 79 323 290 002Prawns 19 709 220 127 928 28 533 34 289 0 0 79 323 290 002Rock lobster 6 677 14 405 17 117 191 695 104 702 72 524 0 7 707 414 828Rock lobster 6 677 14 405 17 117 191 695 104 702 72 524 0 7 707 414 828Crab 3 241 859 29 621 5 887 5 863 2 087 10 215 68 57 841Crab 3 241 859 29 621 5 887 5 863 2 087 10 215 68 57 841Other 1 025 296 1 121 2 375 946 0 0 2 413 8 176Other 1 025 296 1 121 2 375 946 0 0 2 413 8 176
Total 30 652 15 780 175 787 228 490 145 800 74 612 10 215 89 512 770 847Total 30 652 15 780 175 787 228 490 145 800 74 612 10 215 89 512 770 847
llMolluscsAbalone 3 098 33 179 0 11 200 38 138 102 932 0 0 188 547Scallops 2 1 026 9 345 13 883 0 757 0 1 164 26 177pOysters 40 029 0 510 0 32 231 20 218 0 0 92 988Oysters 40 029 0 510 0 32 231 20 218 0 0 92 988Squid 846 716 494 175 2 606 758 na 2 372 7 968Squid 846 716 494 175 2 606 758 na 2 372 7 968Other 1 963 1 600 0 98 366 8 094 3 560 183 327 114 093Other 1 963 1 600 0 98 366 8 094 3 560 183 327 114 093
Total 45 938 36 521 10 349 123 624 81 068 128 226 183 3 864 429 774Total 45 938 36 521 10 349 123 624 81 068 128 226 183 3 864 429 774
Other NEI 2 100 0 4 035 2 429 10 892 671 16 700 13 36 840Other NEI 2 100 0 4 035 2 429 10 892 671 16 700 13 36 840
Total value 127 792 69 825 306 576 392 782 465 140 527 017 54 617 314 692 2 214 089 bTotal value 127 792 69 825 306 576 392 782 465 140 527 017 54 617 314 692 e 2 214 089 b
Quantity t t t t t t t t tQuantityFishFishTuna 0 0 0 2 8 786 0 4 9 925 13 699 bTuna 0 0 0 2 8 786 0 4 9 925 13 699 bSalmonids c 143 877 0 na na 29 016 0 0 30 036Salmonids c 143 877 0 na na 29 016 0 0 30 036Other 11 621 3 245 14 967 10 721 35 261 2 220 5 528 32 175 d 115 738Other 11 621 3 245 14 967 10 721 35 261 2 220 5 528 32 175 d 115 738
Total 11 764 4 122 14 967 10 723 44 046 31 235 5 532 42 100 159 473Total 11 764 4 122 14 967 10 723 44 046 31 235 5 532 42 100 159 473
CrustaceansPrawns 1 788 31 10 135 2 836 2 188 0 0 7 207 24 186Rock lobster 122 276 681 7 637 1 810 1 411 0 265 12 203Rock lobsterCrab 241 26 3 222 1 007 756 57 na 6 5 314Crab 241 26 3 222 1 007 756 57 na 6 5 314Other 65 29 68 110 45 0 0 127 443Other 65 29 68 110 45 0 0 127 443
Total 2 216 362 14 106 11 590 4 799 1 468 na 7 605 42 146Total 2 216 362 14 106 11 590 4 799 1 468 na 7 605 42 146
M llMolluscsAb l 103 1 092 0 280 1 065 3 072 0 0 5 612Abalone 103 1 092 0 280 1 065 3 072 0 0 5 612S llScallops 0 403 2 660 3 579 0 362 0 594 7 599pOysters 4 690 0 na 0 5 848 3 695 0 0 14 233ySquid 131 56 99 45 281 124 0 1 120 1 856qOther 221 504 na 573 2 195 1 154 19 37 4 702Other 221 504 na 573 2 195 1 154 19 37 4 702
Total 5 145 2 055 2 759 4 477 9 389 8 407 19 1 750 34 001Total 5 145 2 055 2 759 4 477 9 389 8 407 19 1 750 34 001
Other NEI 96 0 101 195 1 402 89 na 5 1 889Other NEI 96 0 101 195 1 402 89 na 5 1 889
Total quantity 19 221 6 539 31 933 26 985 59 636 41 199 5 550 51 460 e 237 508 bq ya State totals include aquaculture but exclude hatchery production. b To avoid double counting, total has been reduced to allow for southern a State totals include aquaculture but exclude hatchery production. b To avoid double counting, total has been reduced to allow for southern bluefin tuna caught in the Commonwealth southern bluefin tuna fishery, as an input to farms in South Australia. c Includes salmon and trout a State totals include aquaculture but exclude hatchery production. b To avoid double counting, total has been reduced to allow for southern bluefin tuna caught in the Commonwealth southern bluefin tuna fishery, as an input to farms in South Australia. c Includes salmon and trout production. d Includes fish (excluding Tuna) component of Commonwealth fisheries, plus catch from Commonwealth fisheries that cannot b d d b f f d l l l d ll f h d C l h d l bl
a State totals include aquaculture but exclude hatchery production. b To avoid double counting, total has been reduced to allow for southern bluefin tuna caught in the Commonwealth southern bluefin tuna fishery, as an input to farms in South Australia. c Includes salmon and trout production. d Includes fish (excluding Tuna) component of Commonwealth fisheries, plus catch from Commonwealth fisheries that cannot be disaggregated because of confidentiality reasons. e Totals include all fisheries under Commonwealth jurisdiction. na Not available.S ABARES A t li Fi h i M t A th it Fi h i Vi t i D t t f P i I d t i I d t & I t t N
a State totals include aquaculture but exclude hatchery production. b To avoid double counting, total has been reduced to allow for southern bluefin tuna caught in the Commonwealth southern bluefin tuna fishery, as an input to farms in South Australia. c Includes salmon and trout production. d Includes fish (excluding Tuna) component of Commonwealth fisheries, plus catch from Commonwealth fisheries that cannot be disaggregated because of confidentiality reasons. e Totals include all fisheries under Commonwealth jurisdiction. na Not available.Sources: ABARES; Australian Fisheries Management Authority; Fisheries Victoria, Department of Primary Industries; Industry & Investment New South Wales; Northern Territory Department of Regional Development Primary Industry Fisheries and Resources; Fisheries Queensland
a State totals include aquaculture but exclude hatchery production. b To avoid double counting, total has been reduced to allow for southern bluefin tuna caught in the Commonwealth southern bluefin tuna fishery, as an input to farms in South Australia. c Includes salmon and trout production. d Includes fish (excluding Tuna) component of Commonwealth fisheries, plus catch from Commonwealth fisheries that cannot be disaggregated because of confidentiality reasons. e Totals include all fisheries under Commonwealth jurisdiction. na Not available.Sources: ABARES; Australian Fisheries Management Authority; Fisheries Victoria, Department of Primary Industries; Industry & Investment New South Wales; Northern Territory Department of Regional Development, Primary Industry, Fisheries and Resources; Fisheries Queensland, Department of Employment Economic Development and Innovation; South Australian Research and Development Institute; Primary
a State totals include aquaculture but exclude hatchery production. b To avoid double counting, total has been reduced to allow for southern bluefin tuna caught in the Commonwealth southern bluefin tuna fishery, as an input to farms in South Australia. c Includes salmon and trout production. d Includes fish (excluding Tuna) component of Commonwealth fisheries, plus catch from Commonwealth fisheries that cannot be disaggregated because of confidentiality reasons. e Totals include all fisheries under Commonwealth jurisdiction. na Not available.Sources: ABARES; Australian Fisheries Management Authority; Fisheries Victoria, Department of Primary Industries; Industry & Investment New South Wales; Northern Territory Department of Regional Development, Primary Industry, Fisheries and Resources; Fisheries Queensland, Department of Employment, Economic Development and Innovation; South Australian Research and Development Institute; Primary Industries and Resources, South Australia; Department of Primary Industries, Parks, Water and Environment, Tasmania; Department of
a State totals include aquaculture but exclude hatchery production. b To avoid double counting, total has been reduced to allow for southern bluefin tuna caught in the Commonwealth southern bluefin tuna fishery, as an input to farms in South Australia. c Includes salmon and trout production. d Includes fish (excluding Tuna) component of Commonwealth fisheries, plus catch from Commonwealth fisheries that cannot be disaggregated because of confidentiality reasons. e Totals include all fisheries under Commonwealth jurisdiction. na Not available.Sources: ABARES; Australian Fisheries Management Authority; Fisheries Victoria, Department of Primary Industries; Industry & Investment New South Wales; Northern Territory Department of Regional Development, Primary Industry, Fisheries and Resources; Fisheries Queensland, Department of Employment, Economic Development and Innovation; South Australian Research and Development Institute; Primary Industries and Resources, South Australia; Department of Primary Industries, Parks, Water and Environment, Tasmania; Department of Fisheries, Western Australia.
a State totals include aquaculture but exclude hatchery production. b To avoid double counting, total has been reduced to allow for southern bluefin tuna caught in the Commonwealth southern bluefin tuna fishery, as an input to farms in South Australia. c Includes salmon and trout production. d Includes fish (excluding Tuna) component of Commonwealth fisheries, plus catch from Commonwealth fisheries that cannot be disaggregated because of confidentiality reasons. e Totals include all fisheries under Commonwealth jurisdiction. na Not available.Sources: ABARES; Australian Fisheries Management Authority; Fisheries Victoria, Department of Primary Industries; Industry & Investment New South Wales; Northern Territory Department of Regional Development, Primary Industry, Fisheries and Resources; Fisheries Queensland, Department of Employment, Economic Development and Innovation; South Australian Research and Development Institute; Primary Industries and Resources, South Australia; Department of Primary Industries, Parks, Water and Environment, Tasmania; Department of Fisheries, Western Australia.
a State totals include aquaculture but exclude hatchery production. b To avoid double counting, total has been reduced to allow for southern bluefin tuna caught in the Commonwealth southern bluefin tuna fishery, as an input to farms in South Australia. c Includes salmon and trout production. d Includes fish (excluding Tuna) component of Commonwealth fisheries, plus catch from Commonwealth fisheries that cannot be disaggregated because of confidentiality reasons. e Totals include all fisheries under Commonwealth jurisdiction. na Not available.Sources: ABARES; Australian Fisheries Management Authority; Fisheries Victoria, Department of Primary Industries; Industry & Investment New South Wales; Northern Territory Department of Regional Development, Primary Industry, Fisheries and Resources; Fisheries Queensland, Department of Employment, Economic Development and Innovation; South Australian Research and Development Institute; Primary Industries and Resources, South Australia; Department of Primary Industries, Parks, Water and Environment, Tasmania; Department of Fisheries, Western Australia.
a State totals include aquaculture but exclude hatchery production. b To avoid double counting, total has been reduced to allow for southern bluefin tuna caught in the Commonwealth southern bluefin tuna fishery, as an input to farms in South Australia. c Includes salmon and trout production. d Includes fish (excluding Tuna) component of Commonwealth fisheries, plus catch from Commonwealth fisheries that cannot be disaggregated because of confidentiality reasons. e Totals include all fisheries under Commonwealth jurisdiction. na Not available.Sources: ABARES; Australian Fisheries Management Authority; Fisheries Victoria, Department of Primary Industries; Industry & Investment New South Wales; Northern Territory Department of Regional Development, Primary Industry, Fisheries and Resources; Fisheries Queensland, Department of Employment, Economic Development and Innovation; South Australian Research and Development Institute; Primary Industries and Resources, South Australia; Department of Primary Industries, Parks, Water and Environment, Tasmania; Department of Fisheries, Western Australia.
a State totals include aquaculture but exclude hatchery production. b To avoid double counting, total has been reduced to allow for southern bluefin tuna caught in the Commonwealth southern bluefin tuna fishery, as an input to farms in South Australia. c Includes salmon and trout production. d Includes fish (excluding Tuna) component of Commonwealth fisheries, plus catch from Commonwealth fisheries that cannot be disaggregated because of confidentiality reasons. e Totals include all fisheries under Commonwealth jurisdiction. na Not available.Sources: ABARES; Australian Fisheries Management Authority; Fisheries Victoria, Department of Primary Industries; Industry & Investment New South Wales; Northern Territory Department of Regional Development, Primary Industry, Fisheries and Resources; Fisheries Queensland, Department of Employment, Economic Development and Innovation; South Australian Research and Development Institute; Primary Industries and Resources, South Australia; Department of Primary Industries, Parks, Water and Environment, Tasmania; Department of Fisheries, Western Australia.
Pro du c tio nPro du c tio n

58
5 Fisheries production in 2009–10, by state – Australia a 55 Fisheries production in 2009–10, by state - Australia a5 Fisheries production in 2009 10, by state Australia a
NSW Vic Qld WA SA Tas NT C'wlth AustNSW Vic. Qld WA SA Tas. NT C wlth Aust.
Value $’000 $’000 $’000 $’000 $’000 $’000 $’000 $’000 $’000Value $’000 $’000 $’000 $’000 $’000 $’000 $’000 $’000 $’000Fi hFishT 0 0 0 32 02 3 8 30 2 299 bTuna 0 0 0 32 102 175 na 37 58 430 125 299 bSalmonids c 1 602 5 102 0 na na 362 422 0 0 369 126Other 49 924 11 659 107 555 36 682 73 692 4 920 27 506 149 014 d 460 951Other 49 924 11 659 107 555 36 682 73 692 4 920 27 506 149 014 d 460 951
Total 51 526 16 761 107 555 36 714 175 867 367 342 27 542 207 444 955 376Total 51 526 16 761 107 555 36 714 175 867 367 342 27 542 207 444 955 376
Cr staceansCrustaceansP 16 004 904 155 860 27 940 31 142 0 0 92 242 324 092Prawns 16 004 904 155 860 27 940 31 142 0 0 92 242 324 092Rock lobster 6 753 14 422 5 850 184 101 85 834 65 219 0 6 660 368 839Crab 3 977 721 28 570 6 897 4 804 1 903 9 262 59 56 193Crab 9 9 9 9 9 9Other 1 099 314 12 463 2 295 898 0 0 2 271 19 340Other 1 099 314 12 463 2 295 898 0 0 2 271 19 340
Total 27 832 16 361 202 743 221 233 122 678 67 122 9 263 101 232 768 464Total 27 832 16 361 202 743 221 233 122 678 67 122 9 263 101 232 768 464
M llMolluscsAbalone 1 904 21 919 0 9 227 38 445 102 132 0 0 173 628Scallops 4 0 10 250 9 141 na 0 0 6 407 25 801ScallopsOysters 43 000 0 520 0 35 027 21 264 0 0 99 811Oysters 43 000 0 520 0 35 027 21 264 0 0 99 811Squid 1 242 846 710 344 4 683 693 0 1 388 9 906Squid 1 242 846 710 344 4 683 693 0 1 388 9 906Other 2 796 2 223 0 89 874 7 403 4 499 19 186 249 126 231Other 2 796 2 223 0 89 874 7 403 4 499 19 186 249 126 231
T t l 48 946 24 988 11 480 108 586 85 558 128 588 19 186 8 045 435 376Total 48 946 24 988 11 480 108 586 85 558 128 588 19 186 8 045 435 376
Other NEI 4 597 0 1 940 1 188 10 260 768 730 16 19 499Other NEI 4 597 0 1 940 1 188 10 260 768 730 16 19 499
Total value 132 902 58 110 323 718 367 721 394 363 563 819 56 721 316 737 e 2 178 716 bTotal value 132 902 58 110 323 718 367 721 394 363 563 819 56 721 316 737 e 2 178 716 b
Q antit t t t t t t t t tQuantity t t t t t t t t tFi hFishTuna 0 0 0 4 7 284 0 6 7 593 10 957 bSalmonids c 150 815 0 na na 30 950 0 0 31 915Salmonids c 150 815 0 na na 30 950 0 0 31 915Other 11 494 3 386 14 335 10 445 44 697 1 820 5 573 27 986 d 119 736Other 11 494 3 386 14 335 10 445 44 697 1 820 5 573 27 986 d 119 736
Total 11 644 4 201 14 335 10 449 51 981 32 769 5 579 35 579 162 607Total 11 644 4 201 14 335 10 449 51 981 32 769 5 579 35 579 162 607
CrustaceansCrustaceansPrawns 1 266 130 12 268 2 790 2 669 0 0 7 911 27 034Prawns 1 266 130 12 268 2 790 2 669 0 0 7 911 27 034Rock lobster 122 274 159 5 947 1 554 1 302 0 270 9 628Rock lobster 122 274 159 5 947 1 554 1 302 0 270 9 628Crab 299 18 2 917 1 238 663 44 na 6 5 185Crab 299 18 2 917 1 238 663 44 na 6 5 185Other 66 39 616 103 42 0 0 112 978Other 66 39 616 103 42 0 0 112 978
lTotal 1 752 461 15 960 10 078 4 928 1 347 0 8 299 42 825
MolluscsMolluscsAbalone 73 882 0 271 1 142 2 613 0 0 4 981Abalone 73 882 0 271 1 142 2 613 0 0 4 981Scallops 0 0 2 920 2 525 na 0 0 2 094 7 539Scallops 0 0 2 920 2 525 na 0 0 2 094 7 539Oysters 4 960 0 na na 6 123 3 724 0 na 14 807Oysters 4 960 0 na na 6 123 3 724 0 na 14 807Squid 175 67 141 92 366 172 0 615 1 627Squid 175 67 141 92 366 172 0 615 1 627Oth 365 623 0 677 1 880 1 111 21 38 4 715Other 365 623 0 677 1 880 1 111 21 38 4 715
Total 5 573 1 572 3 061 3 565 9 511 7 620 21 2 746 33 670Total 5 573 1 572 3 061 3 565 9 511 7 620 21 2 746 33 670
Other NEI 168 256 0 171 1 319 101 0 6 2 021Other NEI 168 256 0 171 1 319 101 0 6 2 021
T l i 19 138 6 490 33 356 24 263 67 739 41 837 5 600 46 630 241 123 bTotal quantity 19 138 6 490 33 356 24 263 67 739 41 837 5 600 46 630 e 241 123 b
a State totals include aquaculture but exclude hatchery production. b To avoid double counting, total has been reduced to allow for a State totals include aquaculture but exclude hatchery production. b To avoid double counting, total has been reduced to allow for southern bluefin tuna caught in the Commonwealth southern bluefin tuna fishery, as an input to farms in South Australia. c Includes a State totals include aquaculture but exclude hatchery production. b To avoid double counting, total has been reduced to allow for southern bluefin tuna caught in the Commonwealth southern bluefin tuna fishery, as an input to farms in South Australia. c Includes salmon and trout production. d Includes fish (excluding Tuna) component of Commonwealth fisheries, plus catch from Commonwealth f h h b d d b f f d l l l d ll f h d C l h d
a State totals include aquaculture but exclude hatchery production. b To avoid double counting, total has been reduced to allow for southern bluefin tuna caught in the Commonwealth southern bluefin tuna fishery, as an input to farms in South Australia. c Includes salmon and trout production. d Includes fish (excluding Tuna) component of Commonwealth fisheries, plus catch from Commonwealth fisheries that cannot be disaggregated because of confidentiality reasons. e Totals include all fisheries under Commonwealth jurisdiction.
N t il bl
a State totals include aquaculture but exclude hatchery production. b To avoid double counting, total has been reduced to allow for southern bluefin tuna caught in the Commonwealth southern bluefin tuna fishery, as an input to farms in South Australia. c Includes salmon and trout production. d Includes fish (excluding Tuna) component of Commonwealth fisheries, plus catch from Commonwealth fisheries that cannot be disaggregated because of confidentiality reasons. e Totals include all fisheries under Commonwealth jurisdiction. na Not available.Sources: ABARES; Australian Fisheries Management Authority; Fisheries Victoria Department of Primary Industries; Industry & Investment
a State totals include aquaculture but exclude hatchery production. b To avoid double counting, total has been reduced to allow for southern bluefin tuna caught in the Commonwealth southern bluefin tuna fishery, as an input to farms in South Australia. c Includes salmon and trout production. d Includes fish (excluding Tuna) component of Commonwealth fisheries, plus catch from Commonwealth fisheries that cannot be disaggregated because of confidentiality reasons. e Totals include all fisheries under Commonwealth jurisdiction. na Not available.Sources: ABARES; Australian Fisheries Management Authority; Fisheries Victoria, Department of Primary Industries; Industry & Investment New South Wales; Northern Territory Department of Regional Development Primary Industry Fisheries and Resources; Fisheries
a State totals include aquaculture but exclude hatchery production. b To avoid double counting, total has been reduced to allow for southern bluefin tuna caught in the Commonwealth southern bluefin tuna fishery, as an input to farms in South Australia. c Includes salmon and trout production. d Includes fish (excluding Tuna) component of Commonwealth fisheries, plus catch from Commonwealth fisheries that cannot be disaggregated because of confidentiality reasons. e Totals include all fisheries under Commonwealth jurisdiction. na Not available.Sources: ABARES; Australian Fisheries Management Authority; Fisheries Victoria, Department of Primary Industries; Industry & Investment New South Wales; Northern Territory Department of Regional Development, Primary Industry, Fisheries and Resources; Fisheries Queensland, Department of Employment, Economic Development and Innovation; South Australian Research and Development Institute;
a State totals include aquaculture but exclude hatchery production. b To avoid double counting, total has been reduced to allow for southern bluefin tuna caught in the Commonwealth southern bluefin tuna fishery, as an input to farms in South Australia. c Includes salmon and trout production. d Includes fish (excluding Tuna) component of Commonwealth fisheries, plus catch from Commonwealth fisheries that cannot be disaggregated because of confidentiality reasons. e Totals include all fisheries under Commonwealth jurisdiction. na Not available.Sources: ABARES; Australian Fisheries Management Authority; Fisheries Victoria, Department of Primary Industries; Industry & Investment New South Wales; Northern Territory Department of Regional Development, Primary Industry, Fisheries and Resources; Fisheries Queensland, Department of Employment, Economic Development and Innovation; South Australian Research and Development Institute; Primary Industries and Resources, South Australia; Department of Primary Industries, Parks, Water and Environment, Tasmania;
a State totals include aquaculture but exclude hatchery production. b To avoid double counting, total has been reduced to allow for southern bluefin tuna caught in the Commonwealth southern bluefin tuna fishery, as an input to farms in South Australia. c Includes salmon and trout production. d Includes fish (excluding Tuna) component of Commonwealth fisheries, plus catch from Commonwealth fisheries that cannot be disaggregated because of confidentiality reasons. e Totals include all fisheries under Commonwealth jurisdiction. na Not available.Sources: ABARES; Australian Fisheries Management Authority; Fisheries Victoria, Department of Primary Industries; Industry & Investment New South Wales; Northern Territory Department of Regional Development, Primary Industry, Fisheries and Resources; Fisheries Queensland, Department of Employment, Economic Development and Innovation; South Australian Research and Development Institute; Primary Industries and Resources, South Australia; Department of Primary Industries, Parks, Water and Environment, Tasmania;
a State totals include aquaculture but exclude hatchery production. b To avoid double counting, total has been reduced to allow for southern bluefin tuna caught in the Commonwealth southern bluefin tuna fishery, as an input to farms in South Australia. c Includes salmon and trout production. d Includes fish (excluding Tuna) component of Commonwealth fisheries, plus catch from Commonwealth fisheries that cannot be disaggregated because of confidentiality reasons. e Totals include all fisheries under Commonwealth jurisdiction. na Not available.Sources: ABARES; Australian Fisheries Management Authority; Fisheries Victoria, Department of Primary Industries; Industry & Investment New South Wales; Northern Territory Department of Regional Development, Primary Industry, Fisheries and Resources; Fisheries Queensland, Department of Employment, Economic Development and Innovation; South Australian Research and Development Institute; Primary Industries and Resources, South Australia; Department of Primary Industries, Parks, Water and Environment, Tasmania; Department of Fisheries, Western Australia.
a State totals include aquaculture but exclude hatchery production. b To avoid double counting, total has been reduced to allow for southern bluefin tuna caught in the Commonwealth southern bluefin tuna fishery, as an input to farms in South Australia. c Includes salmon and trout production. d Includes fish (excluding Tuna) component of Commonwealth fisheries, plus catch from Commonwealth fisheries that cannot be disaggregated because of confidentiality reasons. e Totals include all fisheries under Commonwealth jurisdiction. na Not available.Sources: ABARES; Australian Fisheries Management Authority; Fisheries Victoria, Department of Primary Industries; Industry & Investment New South Wales; Northern Territory Department of Regional Development, Primary Industry, Fisheries and Resources; Fisheries Queensland, Department of Employment, Economic Development and Innovation; South Australian Research and Development Institute; Primary Industries and Resources, South Australia; Department of Primary Industries, Parks, Water and Environment, Tasmania; Department of Fisheries, Western Australia.
a State totals include aquaculture but exclude hatchery production. b To avoid double counting, total has been reduced to allow for southern bluefin tuna caught in the Commonwealth southern bluefin tuna fishery, as an input to farms in South Australia. c Includes salmon and trout production. d Includes fish (excluding Tuna) component of Commonwealth fisheries, plus catch from Commonwealth fisheries that cannot be disaggregated because of confidentiality reasons. e Totals include all fisheries under Commonwealth jurisdiction. na Not available.Sources: ABARES; Australian Fisheries Management Authority; Fisheries Victoria, Department of Primary Industries; Industry & Investment New South Wales; Northern Territory Department of Regional Development, Primary Industry, Fisheries and Resources; Fisheries Queensland, Department of Employment, Economic Development and Innovation; South Australian Research and Development Institute; Primary Industries and Resources, South Australia; Department of Primary Industries, Parks, Water and Environment, Tasmania; Department of Fisheries, Western Australia.
Pro du c tio nPro du c tio n

59
6 Fisheries production in 2009–10, by location of catch – Australia ap 66 Fisheries production in 2009–10, by location of catch and production - Australia ap6 Fisheries production in 2009 10, by location of catch and production Australia ap
NSW Vic Qld WA SA Tas NT Other b AustNSW Vic. Qld WA SA Tas. NT Other b Aust.
Value $’000 $’000 $’000 $’000 $’000 $’000 $’000 $’000 $’000Value $’000 $’000 $’000 $’000 $’000 $’000 $’000 $’000 $’000FishFishT 8 118 38 13 941 991 102 175 0 37 0 125 299Tuna 8 118 38 13 941 991 102 175 0 37 0 125 299S l idSalmonids 1 602 5 102 0 na na 362 422 0 0 369 126Other 63 672 51 193 118 374 39 419 86 604 25 906 27 506 48 279 460 951
Total 73 391 56 333 132 315 40 410 188 779 388 328 27 543 48 279 955 376Total 73 391 56 333 132 315 40 410 188 779 388 328 27 543 48 279 955 376
CrustaceansCrustaceansP 16 234 904 167 072 103 469 31 142 5 255 15 324 092Prawns 16 234 904 167 072 103 469 31 142 na 5 255 15 324 092R k l bRock lobster 6 753 14 422 12 510 184 101 85 834 65 219 0 0 368 839Crab 3 991 743 28 570 6 897 4 805 1 909 9 262 17 56 193Other 1 176 665 12 631 2 739 898 0 62 1 170 19 340Other 1 176 665 12 631 2 739 898 0 62 1 170 19 340
Total 28 153 16 734 220 782 297 206 122 679 67 128 14 579 1 202 768 464Total 28 153 16 734 220 782 297 206 122 679 67 128 14 579 1 202 768 464
M llMolluscsAb l 90 2 9 9 0 9 22 38 02 32 0 0 3 628Abalone 1 904 21 919 0 9 227 38 445 102 132 0 0 173 628Scallops 4 4 613 10 251 9 147 na 1 787 0 0 25 801pOysters 43 000 0 520 na 35 027 21 264 0 0 99 811Oysters 43 000 0 520 na 35 027 21 264 0 0 99 811Squid 1 712 1 379 717 374 4 828 787 2 107 9 906Squid 1 712 1 379 717 374 4 828 787 2 107 9 906Other 2 890 2 334 1 89 875 7 403 4 542 19 186 0 126 231Other 2 890 2 334 1 89 875 7 403 4 542 19 186 0 126 231
Total 49 510 30 245 11 488 108 622 85 703 130 512 19 189 107 435 376Total 49 510 30 245 11 488 108 622 85 703 130 512 19 189 107 435 376
Other NEI 4 598 4 1 943 1 188 10 260 768 730 7 19 499Other NEI 4 598 4 1 943 1 188 10 260 768 730 7 19 499
l lTotal value 155 653 103 316 366 525 447 426 407 421 586 736 62 041 49 595 2 178 716 c
Quantity t t t t t t t t tQuantity t t t t t t t t t
FishFishT 1 053 8 2 487 119 7 284 0 6 0 10 957Tuna 1 053 8 2 487 119 7 284 0 6 0 10 957Salmonids 150 815 na na na 30 950 0 0 31 915Other 15 131 12 316 16 535 11 190 47 883 5 989 5 573 5 118 119 736Other 5 3 3 6 6 535 90 883 5 989 5 5 3 5 8 9 36
Total 16 334 13 139 19 022 11 309 55 167 36 939 5 579 5 118 162 607Total 16 334 13 139 19 022 11 309 55 167 36 939 5 579 5 118 162 607
CrustaceansCrustaceansP 1 364 130 13 306 9 172 2 669 0 389 3 27 034Prawns 1 364 130 13 306 9 172 2 669 0 389 3 27 034Rock lobster 122 274 429 5 947 1 554 1 302 0 0 9 628Crab 301 20 2 917 1 238 663 45 na 1 5 185CrabOther 68 50 629 142 42 0 2 45 978Other 68 50 629 142 42 0 2 45 978
Total 1 855 475 17 280 16 498 4 928 1 347 391 50 42 825Total 1 855 475 17 280 16 498 4 928 1 347 391 50 42 825
M llMolluscsb lAbalone 73 882 0 271 1 142 2 613 0 0 4 981
Scallops 0 1 507 2 920 2 527 na 584 0 0 7 539ScallopsOysters 4 960 na 0 na 6 123 3 724 0 0 14 807Oysters 4 960 na 0 na 6 123 3 724 0 0 14 807Squid 377 321 143 103 396 217 1 69 1 627Squid 377 321 143 103 396 217 1 69 1 627Other 379 641 0 677 1 880 1 117 21 na 4 715Other 379 641 0 677 1 880 1 117 21 na 4 715
T t l 5 789 3 351 3 064 3 578 9 541 8 256 22 69 33 670Total 5 789 3 351 3 064 3 578 9 541 8 256 22 69 33 670
Other NEI 169 258 na 171 1 319 101 na 2 2 021Other NEI 169 258 na 171 1 319 101 na 2 2 021
Total quantity 24 147 17 223 39 367 31 556 70 956 46 643 5 992 5 239 241 123 cTotal quantity 24 147 17 223 39 367 31 556 70 956 46 643 5 992 5 239 241 123 c
a Commonwealth, state and territory production is allocated according to the state or territory waters in which the catch was taken. The totals include aquaculture production but exclude hatchery production b Includes Commonwealth fisheries that have been aggregated for reasons ofa Commonwealth, state and territory production is allocated according to the state or territory waters in which the catch was taken. The totals include aquaculture production but exclude hatchery production. b Includes Commonwealth fisheries that have been aggregated for reasons of confidentiality; they are, Small Pelagics, Macquarie island, Heard and McDonald islands, Coral Sea, Cocos and Christmas islands fisheries. c Totals
a Commonwealth, state and territory production is allocated according to the state or territory waters in which the catch was taken. The totals include aquaculture production but exclude hatchery production. b Includes Commonwealth fisheries that have been aggregated for reasons of confidentiality; they are, Small Pelagics, Macquarie island, Heard and McDonald islands, Coral Sea, Cocos and Christmas islands fisheries. c Totals
a Commonwealth, state and territory production is allocated according to the state or territory waters in which the catch was taken. The totals include aquaculture production but exclude hatchery production. b Includes Commonwealth fisheries that have been aggregated for reasons of confidentiality; they are, Small Pelagics, Macquarie island, Heard and McDonald islands, Coral Sea, Cocos and Christmas islands fisheries. c Totals include confidential Commonwealth landings and only sum across. p Preliminary na Not available.
a Commonwealth, state and territory production is allocated according to the state or territory waters in which the catch was taken. The totals include aquaculture production but exclude hatchery production. b Includes Commonwealth fisheries that have been aggregated for reasons of confidentiality; they are, Small Pelagics, Macquarie island, Heard and McDonald islands, Coral Sea, Cocos and Christmas islands fisheries. c Totals include confidential Commonwealth landings and only sum across. p Preliminary na Not available.Sources: ABARES; Australian Fisheries Management Authority; Fisheries Victoria, Department of Primary Industries; Industry & Investment New
a Commonwealth, state and territory production is allocated according to the state or territory waters in which the catch was taken. The totals include aquaculture production but exclude hatchery production. b Includes Commonwealth fisheries that have been aggregated for reasons of confidentiality; they are, Small Pelagics, Macquarie island, Heard and McDonald islands, Coral Sea, Cocos and Christmas islands fisheries. c Totals include confidential Commonwealth landings and only sum across. p Preliminary na Not available.Sources: ABARES; Australian Fisheries Management Authority; Fisheries Victoria, Department of Primary Industries; Industry & Investment New South Wales; Northern Territory Department of Regional Development, Primary Industry, Fisheries and Resources; Fisheries Queensland, D f E l E D l d I S h A l R h d D l I P I d
a Commonwealth, state and territory production is allocated according to the state or territory waters in which the catch was taken. The totals include aquaculture production but exclude hatchery production. b Includes Commonwealth fisheries that have been aggregated for reasons of confidentiality; they are, Small Pelagics, Macquarie island, Heard and McDonald islands, Coral Sea, Cocos and Christmas islands fisheries. c Totals include confidential Commonwealth landings and only sum across. p Preliminary na Not available.Sources: ABARES; Australian Fisheries Management Authority; Fisheries Victoria, Department of Primary Industries; Industry & Investment New South Wales; Northern Territory Department of Regional Development, Primary Industry, Fisheries and Resources; Fisheries Queensland, Department of Employment, Economic Development and Innovation; South Australian Research and Development Institute; Primary Industries and Reso rces So th A stralia Department of Primar Ind stries Parks Water and En ironment Tasmania Department of Fisheries Western
a Commonwealth, state and territory production is allocated according to the state or territory waters in which the catch was taken. The totals include aquaculture production but exclude hatchery production. b Includes Commonwealth fisheries that have been aggregated for reasons of confidentiality; they are, Small Pelagics, Macquarie island, Heard and McDonald islands, Coral Sea, Cocos and Christmas islands fisheries. c Totals include confidential Commonwealth landings and only sum across. p Preliminary na Not available.Sources: ABARES; Australian Fisheries Management Authority; Fisheries Victoria, Department of Primary Industries; Industry & Investment New South Wales; Northern Territory Department of Regional Development, Primary Industry, Fisheries and Resources; Fisheries Queensland, Department of Employment, Economic Development and Innovation; South Australian Research and Development Institute; Primary Industries and Resources, South Australia; Department of Primary Industries, Parks, Water and Environment, Tasmania; Department of Fisheries, Western Australia
a Commonwealth, state and territory production is allocated according to the state or territory waters in which the catch was taken. The totals include aquaculture production but exclude hatchery production. b Includes Commonwealth fisheries that have been aggregated for reasons of confidentiality; they are, Small Pelagics, Macquarie island, Heard and McDonald islands, Coral Sea, Cocos and Christmas islands fisheries. c Totals include confidential Commonwealth landings and only sum across. p Preliminary na Not available.Sources: ABARES; Australian Fisheries Management Authority; Fisheries Victoria, Department of Primary Industries; Industry & Investment New South Wales; Northern Territory Department of Regional Development, Primary Industry, Fisheries and Resources; Fisheries Queensland, Department of Employment, Economic Development and Innovation; South Australian Research and Development Institute; Primary Industries and Resources, South Australia; Department of Primary Industries, Parks, Water and Environment, Tasmania; Department of Fisheries, Western Australia.
a Commonwealth, state and territory production is allocated according to the state or territory waters in which the catch was taken. The totals include aquaculture production but exclude hatchery production. b Includes Commonwealth fisheries that have been aggregated for reasons of confidentiality; they are, Small Pelagics, Macquarie island, Heard and McDonald islands, Coral Sea, Cocos and Christmas islands fisheries. c Totals include confidential Commonwealth landings and only sum across. p Preliminary na Not available.Sources: ABARES; Australian Fisheries Management Authority; Fisheries Victoria, Department of Primary Industries; Industry & Investment New South Wales; Northern Territory Department of Regional Development, Primary Industry, Fisheries and Resources; Fisheries Queensland, Department of Employment, Economic Development and Innovation; South Australian Research and Development Institute; Primary Industries and Resources, South Australia; Department of Primary Industries, Parks, Water and Environment, Tasmania; Department of Fisheries, Western Australia.
a Commonwealth, state and territory production is allocated according to the state or territory waters in which the catch was taken. The totals include aquaculture production but exclude hatchery production. b Includes Commonwealth fisheries that have been aggregated for reasons of confidentiality; they are, Small Pelagics, Macquarie island, Heard and McDonald islands, Coral Sea, Cocos and Christmas islands fisheries. c Totals include confidential Commonwealth landings and only sum across. p Preliminary na Not available.Sources: ABARES; Australian Fisheries Management Authority; Fisheries Victoria, Department of Primary Industries; Industry & Investment New South Wales; Northern Territory Department of Regional Development, Primary Industry, Fisheries and Resources; Fisheries Queensland, Department of Employment, Economic Development and Innovation; South Australian Research and Development Institute; Primary Industries and Resources, South Australia; Department of Primary Industries, Parks, Water and Environment, Tasmania; Department of Fisheries, Western Australia.
Pro du c tio n

60
7 Fisheries production – New South Wales 77 Fisheries production - New South Wales7 Fisheries production New South Wales
2007 08 2008 09 2009 10 p2007–08 2008–09 2009–10 p
$’ $’ $’t $’000 t $’000 t $’000
CrustaceansCrustaceansRock lobster 122 5 583 122 6 677 122 6 753Rock lobster 122 5 583 122 6 677 122 6 753
King prawns 770 14 733 567 10 432 466 9 185King prawns 770 14 733 567 10 432 466 9 185School prawns 877 5 323 999 6 148 600 4 090School prawns 877 5 323 999 6 148 600 4 090
Oth 84 1 293 58 851 35 329Other prawns a 84 1 293 58 851 35 329C b 349 5 066 241 3 241 299 3 977Crabs 349 5 066 241 3 241 299 3 977
Other b 30 622 51 849 56 924Other bTotal c 2 231 32 619 2 038 28 197 1 577 25 257Total c 2 231 32 619 2 038 28 197 1 577 25 257
MolluscsMolluscsAb l 109 3 667 103 3 098 73 1 904Abalone 109 3 667 103 3 098 73 1 904
l f hCuttlefish 106 378 60 257 79 355Pipi 73 1 135 32 649 16 342PipiOctopus 165 1 374 96 873 169 1 527Octopus 165 1 374 96 873 169 1 527Squid 93 681 71 589 95 887Squid 93 681 71 589 95 887
Other d 72 521 27 158 114 647Other d 72 521 27 158 114 647
T t l 618 7 756 389 5 625 547 5 662Total c 618 7 756 389 5 625 547 5 662
FishFishSea mullet 3 721 8 634 1 766 4 899 3 182 8 042Sea mullet 3 721 8 634 1 766 4 899 3 182 8 042Silver trevally 134 675 99 465 91 479Silver trevally 134 675 99 465 91 479
Yellowtail kingfish 136 1 174 133 1 089 244 2 114Yellowtail kingfish 136 1 174 133 1 089 244 2 114Jack mackerel 7 7 7 9 11 15Jack mackerel 7 7 7 9 11 15Bl k d ll fi b 354 3 627 230 2 769 231 2 731Black and yellowfin bream 354 3 627 230 2 769 231 2 731A li l 1 449 2 050 1 531 2 290 541 872Australian salmon 1 449 2 050 1 531 2 290 541 872Snapper 323 3 294 244 2 567 260 2 719ppRubberlip morwong 42 191 39 205 36 190Rubberlip morwong 42 191 39 205 36 190Mulloway 48 451 36 314 40 356Mulloway 48 451 36 314 40 356
Sand whiting 168 2 162 113 1 556 89 1 231Sand whiting 168 2 162 113 1 556 89 1 231Luderick 391 692 302 659 262 550Luderick 391 692 302 659 262 550
S h l hiti 1 196 3 649 932 3 015 839 2 776School whiting 1 196 3 649 932 3 015 839 2 776
Dusky flathead 187 1 290 123 1 029 98 823yOther e 5 032 19 937 5 775 23 526 5 289 23 645Other e 5 032 19 937 5 775 23 526 5 289 23 645
Total c 13 185 47 833 11 330 44 391 11 214 46 542Total c 13 185 47 833 11 330 44 391 11 214 46 542
h 24 836 49 897 83 3 040Other NEI g 24 836 49 897 83 3 040
Total wild caught 16 058 89 044 13 806 79 111 13 422 80 502Total wild caught 16 058 89 044 13 806 79 111 13 422 80 502
Aq ac lt re hAquaculture hPrawns 200 2 700 164 2 279 165 2 400Yabbies 22 281 14 176 10 175Oysters 4 500 39 000 4 690 40 029 4 960 43 000Oysters 4 500 39 000 4 690 40 029 4 960 43 000Silver perch 200 2 250 180 1 870 194 2 336Silver perch 200 2 250 180 1 870 194 2 336Trout 130 1 400 143 1 536 150 1 602Trout 130 1 400 143 1 536 150 1 602Mussels 21 127 66 284 66 284Mussels 21 127 66 284 66 284Barramundi 111 1 318 111 1 304 86 1 046Barramundi 111 1 318 111 1 304 86 1 046Ornamentals na 390 na 557 na 557Ornamentals na 390 na 557 na 557
O h 45 645 47 646 85 1 000Other i 45 645 47 646 85 1 000
Total 5 229 48 111 5 415 48 681 5 716 52 400Total 5 229 48 111 5 415 48 681 5 716 52 400
Total production c 21 287 137 155 19 221 127 792 19 138 132 902Total production c 21 287 137 155 19 221 127 792 19 138 132 902
a Mainly includes tiger prawns, royal red prawns and greasyback prawns. b Mainly includes Balmain bugs, freshwater yabbies and a Mainly includes tiger prawns, royal red prawns and greasyback prawns. b Mainly includes Balmain bugs, freshwater yabbies and nippers. c Excludes catches in the Commonwealth and other jurisdition fisheries landed into NSW. d Mainly includes cockles, turban a Mainly includes tiger prawns, royal red prawns and greasyback prawns. b Mainly includes Balmain bugs, freshwater yabbies and nippers. c Excludes catches in the Commonwealth and other jurisdition fisheries landed into NSW. d Mainly includes cockles, turban a Mainly includes tiger prawns, royal red prawns and greasyback prawns. b Mainly includes Balmain bugs, freshwater yabbies and nippers. c Excludes catches in the Commonwealth and other jurisdition fisheries landed into NSW. d Mainly includes cockles, turban snails, whelks and mussels. e Mainly includes Australian sardines, blue mackerel, leatherjackets, flathead, bonito, yellowtail, sandy sprat,
l l b dd d l l l d b h d h h l d h h d l l d l
a Mainly includes tiger prawns, royal red prawns and greasyback prawns. b Mainly includes Balmain bugs, freshwater yabbies and nippers. c Excludes catches in the Commonwealth and other jurisdition fisheries landed into NSW. d Mainly includes cockles, turban snails, whelks and mussels. e Mainly includes Australian sardines, blue mackerel, leatherjackets, flathead, bonito, yellowtail, sandy sprat, tailor, silver biddy and eels. g Mainly includes beachworms and sea urchins. h Excludes hatchery production. i Mainly includes long-fi d l ld h M d ll d l t
a Mainly includes tiger prawns, royal red prawns and greasyback prawns. b Mainly includes Balmain bugs, freshwater yabbies and nippers. c Excludes catches in the Commonwealth and other jurisdition fisheries landed into NSW. d Mainly includes cockles, turban snails, whelks and mussels. e Mainly includes Australian sardines, blue mackerel, leatherjackets, flathead, bonito, yellowtail, sandy sprat, tailor, silver biddy and eels. g Mainly includes beachworms and sea urchins. h Excludes hatchery production. i Mainly includes long-finned eel, golden perch, Murray cod, mulloway and pearl oysters.p Preliminary na Not available
a Mainly includes tiger prawns, royal red prawns and greasyback prawns. b Mainly includes Balmain bugs, freshwater yabbies and nippers. c Excludes catches in the Commonwealth and other jurisdition fisheries landed into NSW. d Mainly includes cockles, turban snails, whelks and mussels. e Mainly includes Australian sardines, blue mackerel, leatherjackets, flathead, bonito, yellowtail, sandy sprat, tailor, silver biddy and eels. g Mainly includes beachworms and sea urchins. h Excludes hatchery production. i Mainly includes long-finned eel, golden perch, Murray cod, mulloway and pearl oysters.p Preliminary. na Not available.Source: Industry & Investment New South Wales
a Mainly includes tiger prawns, royal red prawns and greasyback prawns. b Mainly includes Balmain bugs, freshwater yabbies and nippers. c Excludes catches in the Commonwealth and other jurisdition fisheries landed into NSW. d Mainly includes cockles, turban snails, whelks and mussels. e Mainly includes Australian sardines, blue mackerel, leatherjackets, flathead, bonito, yellowtail, sandy sprat, tailor, silver biddy and eels. g Mainly includes beachworms and sea urchins. h Excludes hatchery production. i Mainly includes long-finned eel, golden perch, Murray cod, mulloway and pearl oysters.p Preliminary. na Not available.Source: Industry & Investment New South Wales.
a Mainly includes tiger prawns, royal red prawns and greasyback prawns. b Mainly includes Balmain bugs, freshwater yabbies and nippers. c Excludes catches in the Commonwealth and other jurisdition fisheries landed into NSW. d Mainly includes cockles, turban snails, whelks and mussels. e Mainly includes Australian sardines, blue mackerel, leatherjackets, flathead, bonito, yellowtail, sandy sprat, tailor, silver biddy and eels. g Mainly includes beachworms and sea urchins. h Excludes hatchery production. i Mainly includes long-finned eel, golden perch, Murray cod, mulloway and pearl oysters.p Preliminary. na Not available.Source: Industry & Investment New South Wales.
a Mainly includes tiger prawns, royal red prawns and greasyback prawns. b Mainly includes Balmain bugs, freshwater yabbies and nippers. c Excludes catches in the Commonwealth and other jurisdition fisheries landed into NSW. d Mainly includes cockles, turban snails, whelks and mussels. e Mainly includes Australian sardines, blue mackerel, leatherjackets, flathead, bonito, yellowtail, sandy sprat, tailor, silver biddy and eels. g Mainly includes beachworms and sea urchins. h Excludes hatchery production. i Mainly includes long-finned eel, golden perch, Murray cod, mulloway and pearl oysters.p Preliminary. na Not available.Source: Industry & Investment New South Wales.
a Mainly includes tiger prawns, royal red prawns and greasyback prawns. b Mainly includes Balmain bugs, freshwater yabbies and nippers. c Excludes catches in the Commonwealth and other jurisdition fisheries landed into NSW. d Mainly includes cockles, turban snails, whelks and mussels. e Mainly includes Australian sardines, blue mackerel, leatherjackets, flathead, bonito, yellowtail, sandy sprat, tailor, silver biddy and eels. g Mainly includes beachworms and sea urchins. h Excludes hatchery production. i Mainly includes long-finned eel, golden perch, Murray cod, mulloway and pearl oysters.p Preliminary. na Not available.Source: Industry & Investment New South Wales.
Pro du c tio n
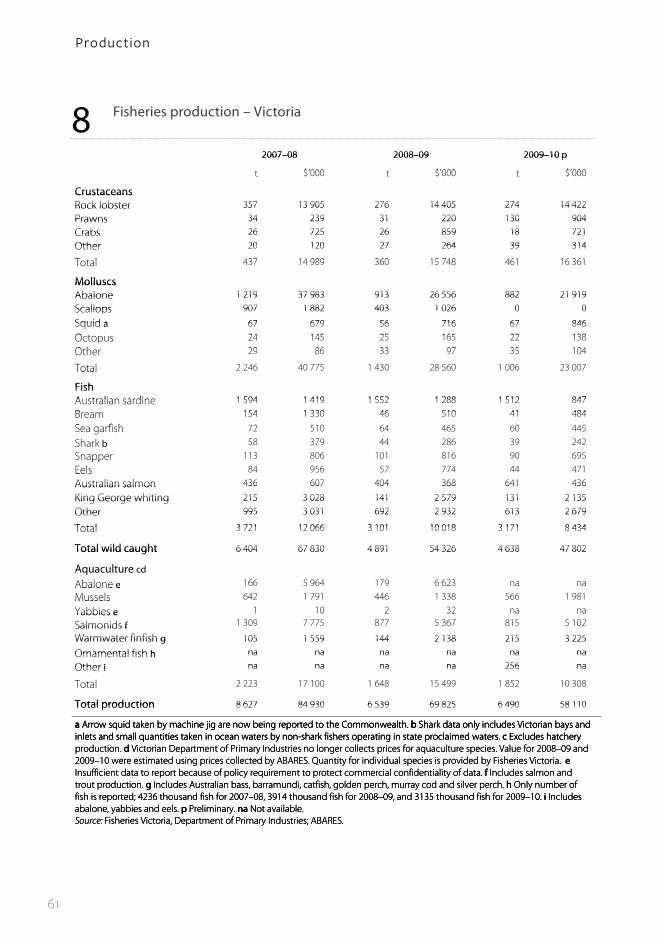
61
8 Fisheries production – Victoria 8 F8 Fisheries production - Victoria8 Fisheries production Victoria
2007–08 2008–09 2009–10 p2007–08 2008–09 2009–10 p
$’000 $’000 $’000t $’000 t $’000 t $’000
CrustaceansCrustaceansRock lobster 357 13 905 276 14 405 274 14 422Rock lobster 357 13 905 276 14 405 274 14 422Prawns 34 239 31 220 130 904Prawns 34 239 31 220 130 904Crabs 26 725 26 859 18 721Crabs 26 725 26 859 18 721Other 20 120 27 264 39 314Other 20 120 27 264 39 314
T l 437 14 989 360 15 748 461 16 361Total 437 14 989 360 15 748 461 16 361
MolluscsMolluscsAbalone 1 219 37 983 913 26 556 882 21 919Abalone 1 219 37 983 913 26 556 882 21 919Scallops 907 1 882 403 1 026 0 0Scallops 907 1 882 403 1 026 0 0
Squid a 67 679 56 716 67 846Squid a 67 679 56 716 67 846O t 24 145 25 165 22 138Octopus 24 145 25 165 22 138Oth 29 86 33 97 35 104Other 29 86 33 97 35 104
Total 2 246 40 775 1 430 28 560 1 006 23 007Total
FishFishAustralian sardine 1 594 1 419 1 552 1 288 1 512 847Australian sardine 1 594 1 419 1 552 1 288 1 512 847B 154 1 330 46 510 41 484Bream 154 1 330 46 510 41 484
S fi h 2 0 6 6 60Sea garfish 72 510 64 465 60 445
Shark b 58 379 44 286 39 242Snapper 113 806 101 816 90 695ppEels 84 956 57 774 44 471EelsAustralian salmon 436 607 404 368 641 436Australian salmon 436 607 404 368 641 436
King George whiting 215 3 028 141 2 579 131 2 135King George whiting 215 3 028 141 2 579 131 2 135Other 995 3 031 692 2 932 613 2 679Other 995 3 031 692 2 932 613 2 679
Total 3 721 12 066 3 101 10 018 3 171 8 434Total 3 721 12 066 3 101 10 018 3 171 8 434
Total wild caught 6 404 67 830 4 891 54 326 4 638 47 802Total wild caught 6 404 67 830 4 891 54 326 4 638 47 802
A lAquaculture cdqAbalone e 166 5 964 179 6 623 na naAbalone eMussels 642 1 791 446 1 338 566 1 981MusselsYabbies e 1 10 2 32 na naYabbies e 1 10 2 32 na na
Salmonids f 1 309 7 775 877 5 367 815 5 102Salmonids f 1 309 7 775 877 5 367 815 5 102
Warmwater finfish g 105 1 559 144 2 138 215 3 225Warmwater finfish g 105 1 559 144 2 138 215 3 225
Ornamental fish h na na na na na naOrnamental fish h na na na na na na
Other i na na na na 256 naOther i na na na na 256 na
Total 2 223 17 100 1 648 15 499 1 852 10 308
Total production 8 627 84 930 6 539 69 825 6 490 58 110Total production 8 627 84 930 6 539 69 825 6 490 58 110
a Arrow squid taken by machine jig are now being reported to the Commonwealth. b Shark data only includes Victorian bays and a Arrow squid taken by machine jig are now being reported to the Commonwealth. b Shark data only includes Victorian bays and inlets and small quantities taken in ocean waters by non-shark fishers operating in state proclaimed waters. c Excludes hatchery a Arrow squid taken by machine jig are now being reported to the Commonwealth. b Shark data only includes Victorian bays and inlets and small quantities taken in ocean waters by non-shark fishers operating in state proclaimed waters. c Excludes hatchery a Arrow squid taken by machine jig are now being reported to the Commonwealth. b Shark data only includes Victorian bays and inlets and small quantities taken in ocean waters by non-shark fishers operating in state proclaimed waters. c Excludes hatchery production. d Victorian Department of Primary Industries no longer collects prices for aquaculture species. Value for 2008–09 and
d ll d b B R S Q f d d l d d b h
q y j g g p y yinlets and small quantities taken in ocean waters by non-shark fishers operating in state proclaimed waters. c Excludes hatchery production. d Victorian Department of Primary Industries no longer collects prices for aquaculture species. Value for 2008–09 and 2009–10 were estimated using prices collected by ABARES. Quantity for individual species is provided by Fisheries Victoria. eI ffi i t d t t t b f li i t t t t i l fid ti lit f d t f I l d l d
production. d Victorian Department of Primary Industries no longer collects prices for aquaculture species. Value for 2008–09 and 2009–10 were estimated using prices collected by ABARES. Quantity for individual species is provided by Fisheries Victoria. eInsufficient data to report because of policy requirement to protect commercial confidentiality of data. f Includes salmon and trout production g Includes Australian bass barramundi catfish golden perch murray cod and silver perch h Only number of
2009–10 were estimated using prices collected by ABARES. Quantity for individual species is provided by Fisheries Victoria. eInsufficient data to report because of policy requirement to protect commercial confidentiality of data. f Includes salmon and trout production. g Includes Australian bass, barramundi, catfish, golden perch, murray cod and silver perch. h Only number of fish is reported; 4236 thousand fish for 2007–08 3914 thousand fish for 2008–09 and 3135 thousand fish for 2009–10 i Includes
Insufficient data to report because of policy requirement to protect commercial confidentiality of data. f Includes salmon and trout production. g Includes Australian bass, barramundi, catfish, golden perch, murray cod and silver perch. h Only number of fish is reported; 4236 thousand fish for 2007–08, 3914 thousand fish for 2008–09, and 3135 thousand fish for 2009–10. i Includes abalone, yabbies and eels. p Preliminary. na Not available.
trout production. g Includes Australian bass, barramundi, catfish, golden perch, murray cod and silver perch. h Only number of fish is reported; 4236 thousand fish for 2007–08, 3914 thousand fish for 2008–09, and 3135 thousand fish for 2009–10. i Includes abalone, yabbies and eels. p Preliminary. na Not available.Source: Fisheries Victoria, Department of Primary Industries; ABARES.
fish is reported; 4236 thousand fish for 2007–08, 3914 thousand fish for 2008–09, and 3135 thousand fish for 2009–10. i Includes abalone, yabbies and eels. p Preliminary. na Not available.Source: Fisheries Victoria, Department of Primary Industries; ABARES.abalone, yabbies and eels. p Preliminary. na Not available.Source: Fisheries Victoria, Department of Primary Industries; ABARES.Sou ce: s e es cto a, epa t e t o a y dust es; S.
Pro du c tio n
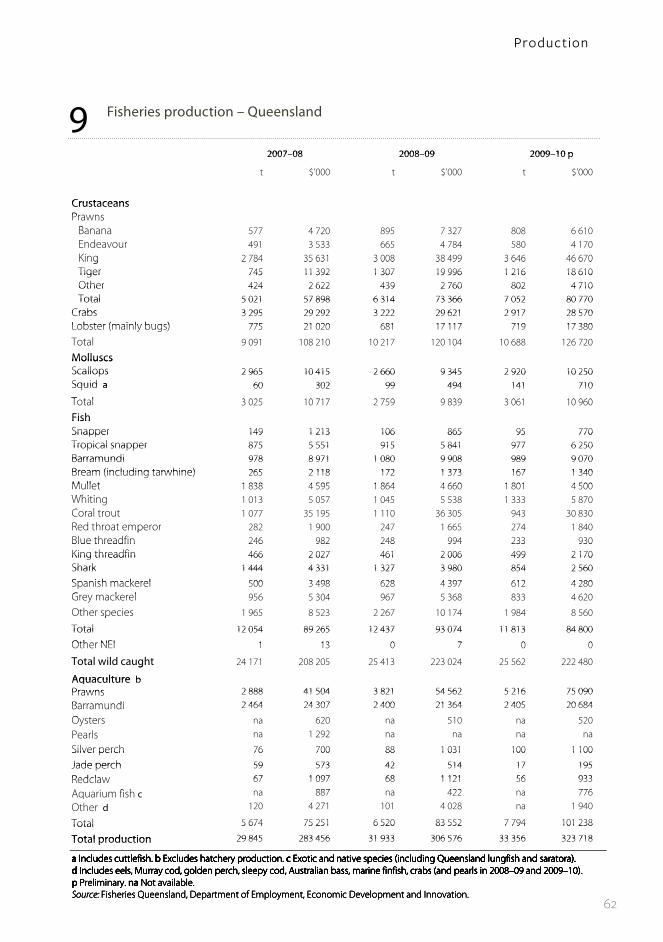
62
9 Fisheries production – Queensland 99 Fisheries production - Queensland9 Fisheries production Queensland
2007 08 2008 09 2009 10 p2007–08 2008–09 2009–10 p
t $’000 t $’000 t $’000 $ $ $
CrustaceansCrustaceansPrawnsPrawns
BBanana 577 4 720 895 7 327 808 6 610dEndeavour 491 3 533 665 4 784 580 4 170
King 2 784 35 631 3 008 38 499 3 646 46 670King 2 784 35 631 3 008 38 499 3 646 46 670Tiger 745 11 392 1 307 19 996 1 216 18 610Tiger 745 11 392 1 307 19 996 1 216 18 610Other 424 2 622 439 2 760 802 4 710Other 424 2 622 439 2 760 802 4 710Total 5 021 57 898 6 314 73 366 7 052 80 770Total 5 021 57 898 6 314 73 366 7 052 80 770
Crabs 3 295 29 292 3 222 29 621 2 917 28 570Crabs 3 295 29 292 3 222 29 621 2 917 28 570Lobster (mainly bugs) 775 21 020 681 17 117 719 17 380Lobster (mainly bugs) 775 21 020 681 17 117 719 17 380
lTotal 9 091 108 210 10 217 120 104 10 688 126 720
MolluscsMolluscsScallops 2 965 10 415 2 660 9 345 2 920 10 250Scallops 2 965 10 415 2 660 9 345 2 920 10 250Squid a 60 302 99 494 141 710Squid a 60 302 99 494 141 710
T t l 3 025 10 717 2 759 9 839 3 061 10 960Total 3 025 10 717 2 759 9 839 3 061 10 960
FishFishSnapper 149 1 213 106 865 95 770Snapper 149 1 213 106 865 95 770Tropical snapper 875 5 551 915 5 841 977 6 250Tropical snapper 875 5 551 915 5 841 977 6 250Barramundi 978 8 971 1 080 9 908 989 9 070Barramundi 978 8 971 1 080 9 908 989 9 070Bream (including tarwhine) 265 2 118 172 1 373 167 1 340Bream (including tarwhine) 265 2 118 172 1 373 167 1 340Mullet 1 838 4 595 1 864 4 660 1 801 4 500Mullet 1 838 4 595 1 864 4 660 1 801 4 500Whiti 1 013 5 057 1 045 5 538 1 333 5 870Whiting 1 013 5 057 1 045 5 538 1 333 5 870C lCoral trout 1 077 35 195 1 110 36 305 943 30 830Red throat emperor 282 1 900 247 1 665 274 1 840pBlue threadfin 246 982 248 994 233 930Blue threadfin 246 982 248 994 233 930King threadfin 466 2 027 461 2 006 499 2 170King threadfin 466 2 027 461 2 006 499 2 170Shark 1 444 4 331 1 327 3 980 854 2 560Shark 1 444 4 331 1 327 3 980 854 2 560
Spanish mackerel 500 3 498 628 4 397 612 4 280Spanish mackerel 500 3 498 628 4 397 612 4 280G k l 956 5 304 967 5 368 833 4 620Grey mackerel 956 5 304 967 5 368 833 4 620
Other species 1 965 8 523 2 267 10 174 1 984 8 560pTotal 12 054 89 265 12 437 93 074 11 813 84 800Total 12 054 89 265 12 437 93 074 11 813 84 800
Other NEI 1 13 0 7 0 0Other NEI 1 13 0 7 0 0
Total wild caught 24 171 208 205 25 413 223 024 25 562 222 480g
Aquaculture bAquaculture bPrawns 2 888 41 504 3 821 54 562 5 216 75 090Prawns 2 888 41 504 3 821 54 562 5 216 75 090Barramundi 2 464 24 307 2 400 21 364 2 405 20 684Barramundi 2 464 24 307 2 400 21 364 2 405 20 684
O 620 0 20Oysters na 620 na 510 na 520Pearls na 1 292 na na na na
Silver perch 76 700 88 1 031 100 1 100Silver perch 76 700 88 1 031 100 1 100
Jade perch 59 573 42 514 17 195Jade perch 59 573 42 514 17 195Redclaw 67 1 097 68 1 121 56 933Redclaw 67 1 097 68 1 121 56 933
A i fi h 887 422 776Aquarium fish c na 887 na 422 na 77620 2 0 028 9 0Other d 120 4 271 101 4 028 na 1 940
Total 5 674 75 251 6 520 83 552 7 794 101 238Total 5 674 75 251 6 520 83 552 7 794 101 238
Total production 29 845 283 456 31 933 306 576 33 356 323 718Total production 29 845 283 456 31 933 306 576 33 356 323 718
a Includes cuttlefish. b Excludes hatchery production. c Exotic and native species (including Queensland lungfish and saratora).a Includes cuttlefish. b Excludes hatchery production. c Exotic and native species (including Queensland lungfish and saratora).d Includes eels, Murray cod, golden perch, sleepy cod, Australian bass, marine finfish, crabs (and pearls in 2008–09 and 2009–10).a Includes cuttlefish. b Excludes hatchery production. c Exotic and native species (including Queensland lungfish and saratora).d Includes eels, Murray cod, golden perch, sleepy cod, Australian bass, marine finfish, crabs (and pearls in 2008–09 and 2009–10).a Includes cuttlefish. b Excludes hatchery production. c Exotic and native species (including Queensland lungfish and saratora).d Includes eels, Murray cod, golden perch, sleepy cod, Australian bass, marine finfish, crabs (and pearls in 2008–09 and 2009–10).p Preliminary. na Not available.S Fi h i Q l d D f E l E i D l d I i
a Includes cuttlefish. b Excludes hatchery production. c Exotic and native species (including Queensland lungfish and saratora).d Includes eels, Murray cod, golden perch, sleepy cod, Australian bass, marine finfish, crabs (and pearls in 2008–09 and 2009–10).p Preliminary. na Not available.Source: Fisheries Queensland, Department of Employment, Economic Development and Innovation.
a Includes cuttlefish. b Excludes hatchery production. c Exotic and native species (including Queensland lungfish and saratora).d Includes eels, Murray cod, golden perch, sleepy cod, Australian bass, marine finfish, crabs (and pearls in 2008–09 and 2009–10).p Preliminary. na Not available.Source: Fisheries Queensland, Department of Employment, Economic Development and Innovation.
a Includes cuttlefish. b Excludes hatchery production. c Exotic and native species (including Queensland lungfish and saratora).d Includes eels, Murray cod, golden perch, sleepy cod, Australian bass, marine finfish, crabs (and pearls in 2008–09 and 2009–10).p Preliminary. na Not available.Source: Fisheries Queensland, Department of Employment, Economic Development and Innovation.
a Includes cuttlefish. b Excludes hatchery production. c Exotic and native species (including Queensland lungfish and saratora).d Includes eels, Murray cod, golden perch, sleepy cod, Australian bass, marine finfish, crabs (and pearls in 2008–09 and 2009–10).p Preliminary. na Not available.Source: Fisheries Queensland, Department of Employment, Economic Development and Innovation.
Pro du c tio n

63
10 Fisheries production – Western Australia 1010 Fisheries production - Western Australia10 Fisheries production Western Australia
2007 08 2008 09 2009 10 p2007–08 2008–09 2009–10 p
t $’000 t $’000 t $’000$ $ $
CrustaceansCrustaceansRock lobster 8 989 218 480 7 637 191 695 5 947 184 101Rock lobster 8 989 218 480 7 637 191 695 5 947 184 101P 2 751 28 748 2 836 28 533 2 790 27 940Prawns 2 751 28 748 2 836 28 533 2 790 27 940C bCrabs 1 130 6 921 1 007 5 887 1 238 6 897Other 10 98 13 131 9 95
Total 12 880 254 247 11 493 226 246 9 984 219 033Total 12 880 254 247 11 493 226 246 9 984 219 033
llMolluscsAbalone 287 10 450 280 11 200 271 9 227ba o eScallops 4 957 17 849 3 579 13 883 2 525 9 141Scallops 4 957 17 849 3 579 13 883 2 525 9 141Squid 42 154 45 175 92 344Squid 42 154 45 175 92 344
Other a 162 5 014 140 6 747 172 2 513Other a 162 5 014 140 6 747 172 2 513
T t l 5 448 33 467 4 044 32 005 3 060 21 225Total 5 448 33 467 4 044 32 005 3 060 21 225
FishFishTuna 31 218 2 12 4 32Tuna 31 218 2 12 4 32Shark 1 756 5 067 1 572 4 301 1 194 3 707Shark 1 756 5 067 1 572 4 301 1 194 3 707Sharkfin na 1 109 na 1 002 na 721Sharkfin na 1 109 na 1 002 na 721Australian salmon 685 294 986 424 341 147Australian salmon 685 294 986 424 341 147C bbl 69 406 93 549 93 546Cobbler 69 406 93 549 93 546Sil bbl 140 370 76 203 58 154Silver cobbler 140 370 76 203 58 154WA dh fi h 117 1 599 85 1 161 81 1 082WA dhufish 117 1 599 85 1 161 81 1 082Spanish mackerel 321 1 937 312 1 886 295 1 783pSea mullet 259 572 245 539 274 604Sea mulletYelloweye mullet 34 50 25 36 30 45Yelloweye mullet 34 50 25 36 30 45Australian sardine 1 835 1 651 2 108 1 898 2 651 2 386Australian sardine 1 835 1 651 2 108 1 898 2 651 2 386
Australian herring 285 113 182 72 213 85Australian herring 285 113 182 72 213 85
Whiting 145 732 179 909 152 722Whiting 145 732 179 909 152 722B 123 534 103 461 111 534Breams 123 534 103 461 111 534Emperors 578 2 121 418 1 474 420 1 519pPink snapper 471 2 339 425 2 108 445 2 205Pink snapperRockcods 351 1 619 324 1 480 311 1 412Rockcods 351 1 619 324 1 480 311 1 412Tropical snappers 1 693 9 439 1 696 9 713 1 564 8 825Tropical snappers 1 693 9 439 1 696 9 713 1 564 8 825Other 1 609 4 826 1 381 4 323 1 704 4 641Other 1 609 4 826 1 381 4 323 1 704 4 641
T t l 10 502 34 996 10 212 32 551 9 941 31 150Total 10 502 34 996 10 212 32 551 9 941 31 150
Other NEI b 271 814 195 586 171 512Other NEI b 8 95 586 5
T t l ild ht 29 101 323 524 25 944 291 388 23 156 271 920Total wild caught 29 101 323 524 25 944 291 388 23 156 271 920
Aquaculture cAquaculture cPearls na 113 000 na 90 000 na 85 500Pearls na 113 000 na 90 000 na 85 500Y bbi 61 1 060 44 811 41 761Yabbies 61 1 060 44 811 41 761M 51 1 532 53 1 433 53 1 439Marron 51 1 532 53 1 433 53 1 439Mussels 481 1 299 433 1 619 505 1 861Fish 397 4 264 511 5 446 508 5 327FishGold fish / koi carp na 241 na 242 na 237Gold fish / koi carp na 241 na 242 na 237Ornamental na 237 na 277 na 231Ornamental na 237 na 277 na 231
Other d na 1 541 na 1 566 na 445Other d na 1 541 na 1 566 na 445
T t l 990 123 174 1 041 101 394 1 107 95 801Total 990 123 174 1 041 101 394 1 107 95 801
Total production 30 091 446 698 26 985 392 782 24 263 367 721Total production 30 091 446 698 26 985 392 782 24 263 367 721
Notes: Historical valuation of Western Australia's wild harvested pearl shells were based on limited data. An external review has Notes: Historical valuation of Western Australia's wild harvested pearl shells were based on limited data. An external review has provided more accurate data on the value of shell harvested and the value of mother of pearl and pearl meat realised at the end Notes: Historical valuation of Western Australia's wild harvested pearl shells were based on limited data. An external review has provided more accurate data on the value of shell harvested and the value of mother of pearl and pearl meat realised at the end of the aquaculture process. Future valuation of pearl shells will be based on the principles developed from the review. a Value i l d l h ll k i l di h k f ' h f l' d b I l d b h d hi
Notes: Historical valuation of Western Australia's wild harvested pearl shells were based on limited data. An external review has provided more accurate data on the value of shell harvested and the value of mother of pearl and pearl meat realised at the end of the aquaculture process. Future valuation of pearl shells will be based on the principles developed from the review. a Value i l d l h ll k i l di h k f ' h f l' d b I l d b h d hi
Notes: Historical valuation of Western Australia's wild harvested pearl shells were based on limited data. An external review has provided more accurate data on the value of shell harvested and the value of mother of pearl and pearl meat realised at the end of the aquaculture process. Future valuation of pearl shells will be based on the principles developed from the review. a Value includes pearl oyster shells taken, including those taken for 'mother of pearl', and octopuses. b Includes beche de mer, sea urchins and others previously reported under molluscs other c Aquaculture excludes algae production for betacarotene and hatchery
Notes: Historical valuation of Western Australia's wild harvested pearl shells were based on limited data. An external review has provided more accurate data on the value of shell harvested and the value of mother of pearl and pearl meat realised at the end of the aquaculture process. Future valuation of pearl shells will be based on the principles developed from the review. a Value includes pearl oyster shells taken, including those taken for 'mother of pearl', and octopuses. b Includes beche de mer, sea urchins and others previously reported under molluscs other. c Aquaculture excludes algae production for betacarotene and hatchery production Some quantity data not available because of confidentiality restrictions d Includes other molluscs and crustaceans
Notes: Historical valuation of Western Australia's wild harvested pearl shells were based on limited data. An external review has provided more accurate data on the value of shell harvested and the value of mother of pearl and pearl meat realised at the end of the aquaculture process. Future valuation of pearl shells will be based on the principles developed from the review. a Value includes pearl oyster shells taken, including those taken for 'mother of pearl', and octopuses. b Includes beche de mer, sea urchins and others previously reported under molluscs other. c Aquaculture excludes algae production for betacarotene and hatchery production. Some quantity data not available because of confidentiality restrictions. d Includes other molluscs and crustaceans. p Preliminary na Not available
Notes: Historical valuation of Western Australia's wild harvested pearl shells were based on limited data. An external review has provided more accurate data on the value of shell harvested and the value of mother of pearl and pearl meat realised at the end of the aquaculture process. Future valuation of pearl shells will be based on the principles developed from the review. a Value includes pearl oyster shells taken, including those taken for 'mother of pearl', and octopuses. b Includes beche de mer, sea urchins and others previously reported under molluscs other. c Aquaculture excludes algae production for betacarotene and hatchery production. Some quantity data not available because of confidentiality restrictions. d Includes other molluscs and crustaceans. p Preliminary. na Not available.Sources: Department of Fisheries, Western Australia.
Notes: Historical valuation of Western Australia's wild harvested pearl shells were based on limited data. An external review has provided more accurate data on the value of shell harvested and the value of mother of pearl and pearl meat realised at the end of the aquaculture process. Future valuation of pearl shells will be based on the principles developed from the review. a Value includes pearl oyster shells taken, including those taken for 'mother of pearl', and octopuses. b Includes beche de mer, sea urchins and others previously reported under molluscs other. c Aquaculture excludes algae production for betacarotene and hatchery production. Some quantity data not available because of confidentiality restrictions. d Includes other molluscs and crustaceans. p Preliminary. na Not available.Sources: Department of Fisheries, Western Australia.
Notes: Historical valuation of Western Australia's wild harvested pearl shells were based on limited data. An external review has provided more accurate data on the value of shell harvested and the value of mother of pearl and pearl meat realised at the end of the aquaculture process. Future valuation of pearl shells will be based on the principles developed from the review. a Value includes pearl oyster shells taken, including those taken for 'mother of pearl', and octopuses. b Includes beche de mer, sea urchins and others previously reported under molluscs other. c Aquaculture excludes algae production for betacarotene and hatchery production. Some quantity data not available because of confidentiality restrictions. d Includes other molluscs and crustaceans. p Preliminary. na Not available.Sources: Department of Fisheries, Western Australia.
Pro du c tio n
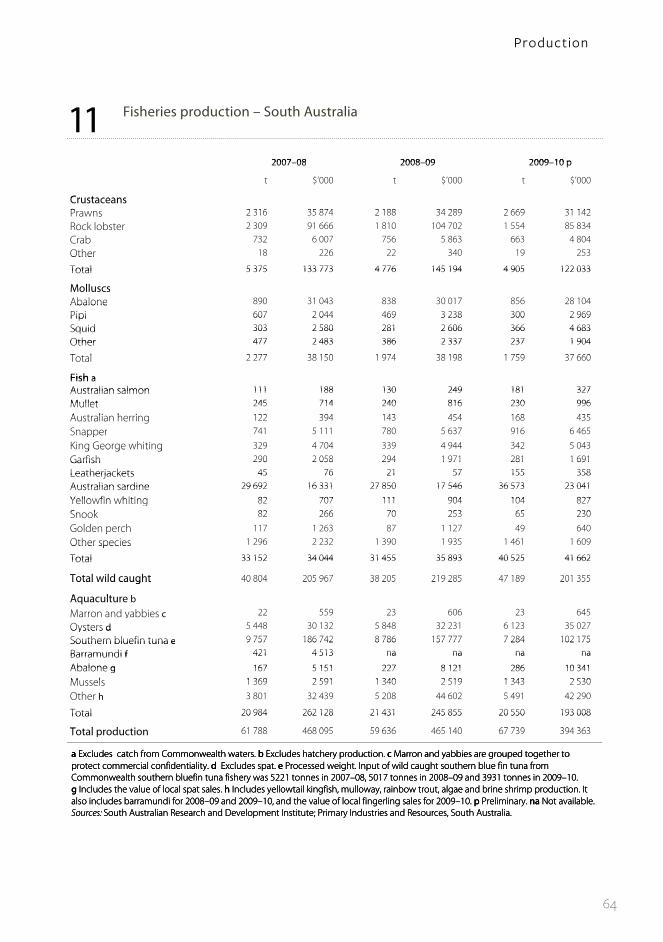
64
11 Fisheries production – South Australia 1111 Fisheries production - South Australia11 Fisheries production South Australia
2007 08 2008 09 2009 10 p2007–08 2008–09 2009–10 p
t $’000 t $’000 t $’000$ $ $
CrustaceansCrustaceansP 2 316 35 874 2 188 34 289 2 669 31 142Prawns 2 316 35 874 2 188 34 289 2 669 31 142R k l b 2 309 91 666 1 810 104 702 1 554 85 834Rock lobster 2 309 91 666 1 810 104 702 1 554 85 834Crab 732 6 007 756 5 863 663 4 804Other 18 226 22 340 19 253OtherTotal 5 375 133 773 4 776 145 194 4 905 122 033Total 5 375 133 773 4 776 145 194 4 905 122 033
MolluscsAbalone 890 31 043 838 30 017 856 28 104Abalone 9Pipi 607 2 044 469 3 238 300 2 969Pipi 607 2 044 469 3 238 300 2 969Squid 303 2 580 281 2 606 366 4 683Squid 303 2 580 281 2 606 366 4 683Other 477 2 483 386 2 337 237 1 904Other 477 2 483 386 2 337 237 1 904
T l 2 277 38 150 1 974 38 198 1 759 37 660Total 2 277 38 150 1 974 38 198 1 759 37 660
Fish aFish aAustralian salmon 111 188 130 249 181 327Australian salmon 111 188 130 249 181 327Mullet 245 714 240 816 230 996Mullet 245 714 240 816 230 996
A t li h i 122 394 143 454 168 435Australian herring 122 394 143 454 168 435Snapper 741 5 111 780 5 637 916 6 465ppKing George whiting 329 4 704 339 4 944 342 5 043King George whitingGarfish 290 2 058 294 1 971 281 1 691Garfish 290 2 058 294 1 971 281 1 691Leatherjackets 45 76 21 57 155 358Leatherjackets 45 76 21 57 155 358Australian sardine 29 692 16 331 27 850 17 546 36 573 23 041Australian sardine 29 692 16 331 27 850 17 546 36 573 23 041
Yellowfin whiting 82 707 111 904 104 827Yellowfin whiting 82 707 111 904 104 827S k 82 266 70 253 65 230Snook 82 266 70 253 65 230
Golden perch 117 1 263 87 1 127 49 640pOther species 1 296 2 232 1 390 1 935 1 461 1 609Other speciesTotal 33 152 34 044 31 455 35 893 40 525 41 662Total 33 152 34 044 31 455 35 893 40 525 41 662
Total wild caught 40 804 205 967 38 205 219 285 47 189 201 355Total wild caught 40 804 205 967 38 205 219 285 47 189 201 355
A lt bAquaculture bMarron and yabbies c 22 559 23 606 23 645yOysters d 5 448 30 132 5 848 32 231 6 123 35 027Oysters dSouthern bluefin tuna e 9 757 186 742 8 786 157 777 7 284 102 175Southern bluefin tuna e 9 757 186 742 8 786 157 777 7 284 102 175
Barramundi f 421 4 513 na na na naBarramundi f 421 4 513 na na na na
Abalone g 167 5 151 227 8 121 286 10 341Abalone g 167 5 151 227 8 121 286 10 341Mussels 1 369 2 591 1 340 2 519 1 343 2 530Mussels 1 369 2 591 1 340 2 519 1 343 2 530
O hOther h 3 801 32 439 5 208 44 602 5 491 42 290
Total 20 984 262 128 21 431 245 855 20 550 193 008Total 20 984 262 128 21 431 245 855 20 550 193 008
T t l d ti 61 788 468 095 59 636 465 140 67 739 394 363Total production 61 788 468 095 59 636 465 140 67 739 394 363
a Excludes catch from Commonwealth waters b Excludes hatchery production c Marron and yabbies are grouped together toa Excludes catch from Commonwealth waters. b Excludes hatchery production. c Marron and yabbies are grouped together to protect commercial confidentiality. d Excludes spat. e Processed weight. Input of wild caught southern blue fin tuna from a Excludes catch from Commonwealth waters. b Excludes hatchery production. c Marron and yabbies are grouped together to protect commercial confidentiality. d Excludes spat. e Processed weight. Input of wild caught southern blue fin tuna from Commonwealth southern bluefin tuna fishery was 5221 tonnes in 2007–08, 5017 tonnes in 2008–09 and 3931 tonnes in 2009–10.
a Excludes catch from Commonwealth waters. b Excludes hatchery production. c Marron and yabbies are grouped together to protect commercial confidentiality. d Excludes spat. e Processed weight. Input of wild caught southern blue fin tuna from Commonwealth southern bluefin tuna fishery was 5221 tonnes in 2007–08, 5017 tonnes in 2008–09 and 3931 tonnes in 2009–10. g Includes the value of local spat sales. h Includes yellowtail kingfish, mulloway, rainbow trout, algae and brine shrimp production. It
protect commercial confidentiality. d Excludes spat. e Processed weight. Input of wild caught southern blue fin tuna from Commonwealth southern bluefin tuna fishery was 5221 tonnes in 2007–08, 5017 tonnes in 2008–09 and 3931 tonnes in 2009–10. g Includes the value of local spat sales. h Includes yellowtail kingfish, mulloway, rainbow trout, algae and brine shrimp production. It also includes barramundi for 2008–09 and 2009–10, and the value of local fingerling sales for 2009–10. p Preliminary. na Not available.S S h A li R h d D l I i P i I d i d R S h A li
y ,g Includes the value of local spat sales. h Includes yellowtail kingfish, mulloway, rainbow trout, algae and brine shrimp production. It also includes barramundi for 2008–09 and 2009–10, and the value of local fingerling sales for 2009–10. p Preliminary. na Not available.Sources: South Australian Research and Development Institute; Primary Industries and Resources, South Australia.also includes barramundi for 2008–09 and 2009–10, and the value of local fingerling sales for 2009–10. p Preliminary. na Not available.Sources: South Australian Research and Development Institute; Primary Industries and Resources, South Australia.Sources: South Australian Research and Development Institute; Primary Industries and Resources, South Australia.
Pro du c tio n
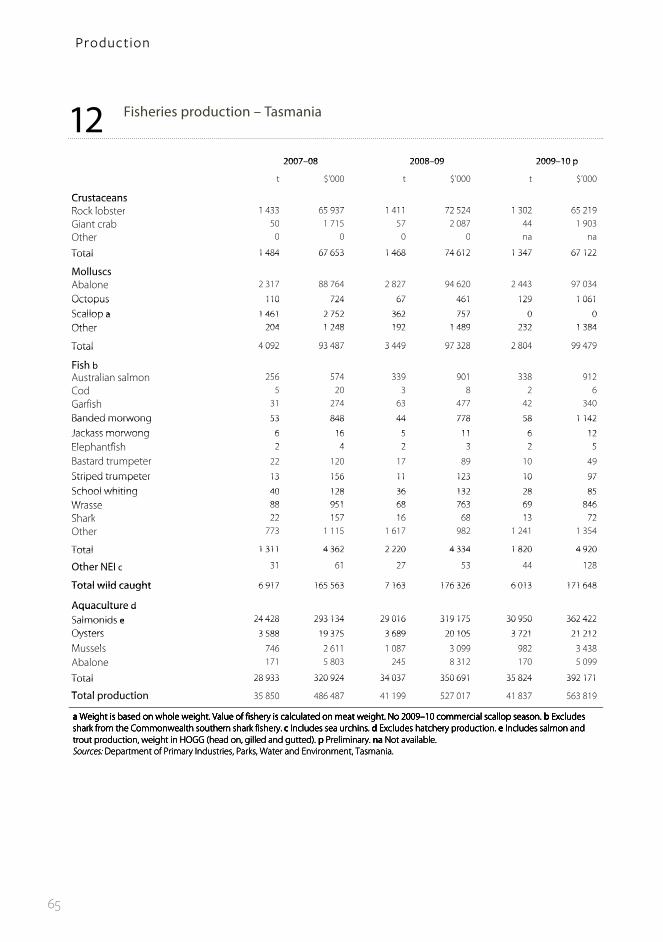
65
12 Fisheries production – Tasmania 1212 Fisheries production - Tasmania12 Fisheries production Tasmania
2007 08 2008 09 2009 10 p2007–08 2008–09 2009–10 p
t $’000 t $’000 t $’000$ $ $
CrustaceansCrustaceansR k l b t 1 433 65 937 1 411 72 524 1 302 65 219Rock lobster 1 433 65 937 1 411 72 524 1 302 65 219Gi b 50 1 715 57 2 087 44 1 903Giant crab 50 1 715 57 2 087 44 1 903Other 0 0 0 0 na na
Total 1 484 67 653 1 468 74 612 1 347 67 122Total 1 484 67 653 1 468 74 612 1 347 67 122
M llMolluscsAbalone 2 317 88 764 2 827 94 620 2 443 97 034
Octopus 110 724 67 461 129 1 061Octopus 110 724 67 461 129 1 061
Scallop a 1 461 2 752 362 757 0 0Scallop a 1 461 2 752 362 757 0 0Other 204 1 248 192 1 489 232 1 384Other 204 1 248 192 1 489 232 1 384
Total 4 092 93 487 3 449 97 328 2 804 99 479Total 4 092 93 487 3 449 97 328 2 804 99 479
Fi h bFish bA li l 256 574 339 901 338 912Australian salmon 256 574 339 901 338 912Cod 5 20 3 8 2 6Garfish 31 274 63 477 42 340GarfishBanded morwong 53 848 44 778 58 1 142Banded morwong 53 848 44 778 58 1 142
Jackass morwong 6 16 5 11 6 12Jackass morwong 6 16 5 11 6 12El h tfi h 2 4 2 3 2 5Elephantfish 2 4 2 3 2 5
Bastard trumpeter 22 120 17 89 10 49pStriped trumpeter 13 156 11 123 10 97Striped trumpeter 13 156 11 123 10 97
School whiting 40 128 36 132 28 85School whiting 40 128 36 132 28 85Wrasse 88 951 68 763 69 846Wrasse 88 951 68 763 69 846Sh k 22 157 16 68 13 72Shark 22 157 16 68 13 72O h 773 1 115 1 617 982 1 241 1 354Other 773 1 115 1 617 982 1 241 1 354
Total 1 311 4 362 2 220 4 334 1 820 4 920Total 1 311 4 362 2 220 4 334 1 820 4 920
O h NEI 31 61 27 53 44 128Other NEI c 31 61 27 53 44 128
Total wild caught 6 917 165 563 7 163 176 326 6 013 171 648Total wild caught 6 917 165 563 7 163 176 326 6 013 171 648
Aquaculture dAquaculture dSalmonids e 24 428 293 134 29 016 319 175 30 950 362 422Salmonids e 24 428 293 134 29 016 319 175 30 950 362 422
Oysters 3 588 19 375 3 689 20 105 3 721 21 212Oysters 3 588 19 375 3 689 20 105 3 721 21 212
M l 746 2 611 1 087 3 099 982 3 438Mussels 746 2 611 1 087 3 099 982 3 438Abalone 171 5 803 245 8 312 170 5 099
Total 28 933 320 924 34 037 350 691 35 824 392 171Total 28 933 320 924 34 037 350 691 35 824 392 171
T t l d ti 35 850 486 487 41 199 527 017 41 837 563 819Total production 35 850 486 487 41 199 527 017 41 837 563 819
a Weight is based on whole weight. Value of fishery is calculated on meat weight. No 2009–10 commercial scallop season. b Excludes a Weight is based on whole weight. Value of fishery is calculated on meat weight. No 2009–10 commercial scallop season. b Excludes shark from the Commonwealth southern shark fishery. c Includes sea urchins. d Excludes hatchery production. e Includes salmon and a Weight is based on whole weight. Value of fishery is calculated on meat weight. No 2009–10 commercial scallop season. b Excludes shark from the Commonwealth southern shark fishery. c Includes sea urchins. d Excludes hatchery production. e Includes salmon and trout production, weight in HOGG (head on, gilled and gutted). p Preliminary. na Not available.
a Weight is based on whole weight. Value of fishery is calculated on meat weight. No 2009–10 commercial scallop season. b Excludes shark from the Commonwealth southern shark fishery. c Includes sea urchins. d Excludes hatchery production. e Includes salmon and trout production, weight in HOGG (head on, gilled and gutted). p Preliminary. na Not available.Sources: Department of Primary Industries, Parks, Water and Environment, Tasmania.
a Weight is based on whole weight. Value of fishery is calculated on meat weight. No 2009–10 commercial scallop season. b Excludes shark from the Commonwealth southern shark fishery. c Includes sea urchins. d Excludes hatchery production. e Includes salmon and trout production, weight in HOGG (head on, gilled and gutted). p Preliminary. na Not available.Sources: Department of Primary Industries, Parks, Water and Environment, Tasmania.
a Weight is based on whole weight. Value of fishery is calculated on meat weight. No 2009–10 commercial scallop season. b Excludes shark from the Commonwealth southern shark fishery. c Includes sea urchins. d Excludes hatchery production. e Includes salmon and trout production, weight in HOGG (head on, gilled and gutted). p Preliminary. na Not available.Sources: Department of Primary Industries, Parks, Water and Environment, Tasmania.
Pro du c tio n

66
13 Fisheries production – Northern Territory 1313 Fisheries production - Northern Territory13 Fisheries production Northern Territory
2007 08 2008 09 2009 10 p2007–08 2008–09 2009–10 p
t $’000 t $’000 t $’000 $ $ $
CrustaceansCrustaceansC b 369 6 503 na 10 215 na 9 262Crab 369 6 503 na 10 215 na 9 262
Total 369 6 503 na 10 215 na 9 263Total
MolluscsMolluscsOth 35 333 19 183 21 206Other 35 333 19 183 21 206
Total 35 333 19 183 21 206Total 35 333 9 83 06
FishFishT 10 19 4 23 6 37Tuna 10 19 4 23 6 37Sh k 92 6 200 9 38 9Shark 924 1 416 1 200 1 195 738 955Snapper 405 1 763 359 1 625 300 1 375ppBarramundi 644 4 265 665 3 961 654 3 890Barramundi 644 4 265 665 3 961 654 3 890Threadfin salmon 341 1 131 336 982 280 812Threadfin salmon 341 1 131 336 982 280 812Jewfish (mulloway) 222 501 225 517 215 487Jewfish (mulloway) 222 501 225 517 215 487Emperor 103 591 123 630 111 600Emperor 103 591 123 630 111 600Cod 41 227 49 174 70 245Cod 41 227 49 174 70 245Mackerel 613 3 302 671 3 381 693 3 297Mackerel 613 3 302 671 3 381 693 3 297G ldb d 1 128 8 135 797 6 227 707 5 549Goldband snapper 1 128 8 135 797 6 227 707 5 549Sea perch 9 36 1 104 4 605 1 104 4 525pOther 1 093 4 727 0 0 0 0OtherTotal 5 533 26 112 5 532 23 319 4 880 21 772Total 5 533 26 112 5 532 23 319 4 880 21 772
Total wild caught 5 937 32 948 5 550 33 717 4 901 31 241g
Aquaculture aAquaculture aBarramundi na na na 4 200 699 5 770Barramundi na na na 4 200 699 5 770Pearls na na na na na 18 980Pearls na na na na na 18 980
Oth b na 22 570 na 16 700 na 730Other b na 22 570 na 16 700 na 730
T t l 22 570 20 900 699 25 480Total na 22 570 na 20 900 699 25 480
Total production 5 937 55 518 5 550 54 617 5 600 56 721Total production 5 937 55 518 5 550 54 617 5 600 56 721
a These values are based on derived estimates from a limited number of operators. Excludes hatchery production. Quantities not a These values are based on derived estimates from a limited number of operators. Excludes hatchery production. Quantities not available because of confidentiality restrictions. b Includes aquarium production. p Preliminary. na Not available.a These values are based on derived estimates from a limited number of operators. Excludes hatchery production. Quantities not available because of confidentiality restrictions. b Includes aquarium production. p Preliminary. na Not available.Source: Northern Territory Department of Regional Development, Primary Industry, Fisheries and Resources.
a These values are based on derived estimates from a limited number of operators. Excludes hatchery production. Quantities not available because of confidentiality restrictions. b Includes aquarium production. p Preliminary. na Not available.Source: Northern Territory Department of Regional Development, Primary Industry, Fisheries and Resources.
a These values are based on derived estimates from a limited number of operators. Excludes hatchery production. Quantities not available because of confidentiality restrictions. b Includes aquarium production. p Preliminary. na Not available.Source: Northern Territory Department of Regional Development, Primary Industry, Fisheries and Resources.
a These values are based on derived estimates from a limited number of operators. Excludes hatchery production. Quantities not available because of confidentiality restrictions. b Includes aquarium production. p Preliminary. na Not available.Source: Northern Territory Department of Regional Development, Primary Industry, Fisheries and Resources.
a These values are based on derived estimates from a limited number of operators. Excludes hatchery production. Quantities not available because of confidentiality restrictions. b Includes aquarium production. p Preliminary. na Not available.Source: Northern Territory Department of Regional Development, Primary Industry, Fisheries and Resources.
Pro du c tio n

67
14 Fisheries production – Commonwealth 1414 Fisheries production - Commonwealth14 Fisheries production Commonwealth
2007 08 2008 09 2009 10 p2007–08 2008–09 2009–10 p
t $’000 t $’000 t $’000$ $ $
Northern PrawnNorthern PrawnPrawnPrawn
Tiger 1 235 22 880 1 024 24 152 1 274 25 996Tiger 1 235 22 880 1 024 24 152 1 274 25 996B 5 380 48 658 5 214 46 493 5 771 59 287Banana 5 380 48 658 5 214 46 493 5 771 59 287Endeavour 201 1 881 218 2 314 355 2 875
King 20 246 7 93 6 60King 20 246 7 93 6 60Other prawns 1 13 2 15 1 8Other prawns 1 13 2 15 1 8Total prawns 6 837 73 679 6 465 73 067 7 407 88 226Total prawns 6 837 73 679 6 465 73 067 7 407 88 226
Other species 67 771 64 919 58 602Other species 67 771 64 919 58 602
l 6 90 6 29 3 986 6 88 828Total 6 904 74 451 6 529 73 986 7 465 88 828
Torres StraitTorres StraitPrawnPrawn
Tiger 469 6 559 395 4 446 278 2 919Tiger 469 6 559 395 4 446 278 2 919Endeavour 418 2 719 254 1 370 102 611Endeavour 418 2 719 254 1 370 102 611
Ki 44 507 26 258 9 124King 44 507 26 258 9 124gOther prawns 32 299 1 5 13 115pOther a 25 362 23 370 13 117Other aTotal 989 10 445 699 6 449 414 3 888Total 989 10 445 699 6 449 414 3 888
T l k l bTropical rock lobster 339 9 428 265 7 707 270 6 660pSpanish mackerelSpanish mackerel
Spanish mackerel 109 674 70 455 82 892Spanish mackerel 109 674 70 455 82 892Other species 2 2 1 5 0 1Other species 2 2 1 5 0 1Total 111 676 71 460 82 893Total 111 676 71 460 82 893
R f Li b 53 707 43 826 18 176Reef Line b 53 707 43 826 18 176
Total 1 492 21 256 1 079 15 442 784 11 617Total
SESS Commonwealth Trawl Sector cSESS Commonwealth Trawl Sector cOrange roughy 239 597 583 1 783 562 3 028Orange roughy 239 597 583 1 783 562 3 028
Bl dBlue grenadier 3 505 10 725 3 964 14 787 3 460 16 261gTiger flathead 3 000 12 181 2 805 11 781 2 789 13 723Tiger flathead 3 000 12 181 2 805 11 781 2 789 13 723Redfish 224 527 194 691 185 1 038Redfish 224 527 194 691 185 1 038Blue warehou 203 573 164 595 93 222Blue warehou 203 573 164 595 93 222Silver warehou 1 774 3 016 1 628 3 743 1 249 3 372Silver warehou 1 774 3 016 1 628 3 743 1 249 3 372
S h l hiti 389 906 360 1 101 404 1 371School whiting 389 906 360 1 101 404 1 371
Jackass morwong 645 1 470 542 1 360 403 1 572gLing 761 4 268 611 4 169 558 3 016LingGemfish 170 581 201 863 146 638Gemfish 170 581 201 863 146 638Silver trevally 94 316 131 552 203 1 035Silver trevally 94 316 131 552 203 1 035Mirror dory 441 1 115 445 1 604 531 1 306Mirror dory 441 1 115 445 1 604 531 1 306
Royal red prawn 98 234 65 175 97 225Royal red prawn 98 234 65 175 97 225O h 194 486 178 535 175 1 173Ocean perch 194 486 178 535 175 1 173John dory 98 572 134 763 88 601yBlue eye trevalla 40 298 41 293 41 363Blue eye trevallaGummy shark 122 688 141 988 114 717Gummy shark 122 688 141 988 114 717School shark 17 80 22 133 26 136School shark 17 80 22 133 26 136Saw shark 150 349 158 480 134 302Saw shark 150 349 158 480 134 302Elephant fish 44 68 46 73 66 118Elephant fish 44 68 46 73 66 118Other 3 002 7 347 3 038 9 471 2 696 6 503Other 3 002 7 347 3 038 9 471 2 696 6 503
Total 15 211 46 398 15 449 55 940 14 023 56 720
ContinuedContinued
Pro du c tio n

68
1414 Fisheries production - Commonwealth continued14 Fisheries production Commonwealth continued
2007 08 2008 09 2009 10 p2007–08 2008–09 2009–10 p
t $’000 t $’000 t $’000$ $ $
SESS Common ealth Gillnet Hook and Trap SectorsSESS Commonwealth Gillnet, Hook and Trap Sectors cl llBlue eye trevalla 384 2 978 401 3 275 407 3 460y
Blue warehou 1 3 2 7 4 9ue a e ouLing 375 2 177 432 3 583 312 1 697Ling 375 2 177 432 3 583 312 1 697Gummy shark 2 649 16 901 2 415 18 116 2 170 15 193Gummy shark 2 649 16 901 2 415 18 116 2 170 15 193School shark 380 2 229 331 2 210 279 1 436School shark 380 2 229 331 2 210 279 1 436Saw shark 197 460 177 630 130 293Saw shark 197 460 177 630 130 293Elephant fish 82 125 97 243 92 165Elephant fish 82 125 97 243 92 165Oth h k 171 319 206 320 281 377Other shark 171 319 206 320 281 377
hOther species 545 2 352 446 2 184 440 1 920pTotal 4 785 27 544 4 509 30 569 4 116 24 550Total 4 785 27 544 4 509 30 569 4 116 24 550
SESS C lth GAB T l S tSESS Commonwealth GAB Trawl Sector cOrange roughy 49 122 79 236 np npOrange roughy 49 122 79 236 np npDeepwater flathead 1 035 4 977 813 4 063 np npDeepwater flathead 1 035 4 977 813 4 063 np np
Bight redfish 808 2 755 682 2 387 np npBight redfish 808 2 755 682 2 387 np npLeather jacket 219 312 186 371 np npLeather jacket 219 312 186 371 np np
Angel shark 221 293 141 234Angel shark 221 293 141 234 np npB fi h 86 298 42 167Boarfish 86 298 42 167 np np
Jackass morwong 126 288 73 218 np npJackass morwong p pSquid 108 290 57 123 np npSquid 108 290 57 123 np npKnifejaw 58 88 45 113 np npKnifejaw 58 88 45 113 np npGemfish 311 1 065 55 131 np npGemfish 311 1 065 55 131 np np
Blue grenadier 54 165 4 12 np npBlue grenadier 54 165 4 12 np npQ 46 116 28 76 np npQueen snapper 46 116 28 76 np npSil h 16 28 1 4Silver warehou 16 28 1 4 np npSchool shark 2 9 2 11 np npp p
Gummy shark 77 411 52 311 np npGummy shark 77 411 52 311 np npSaw shark 37 86 37 106 np npSaw shark 37 86 37 106 np npElephant fish 2 4 1 3 np npElephant fish 2 4 1 3 np npOther 457 1 476 209 412 np npOther 457 1 476 209 412 np np
T l 3 713 12 781 2 505 8 977Total 3 713 12 781 2 505 8 977 np np
ContinuedContinued
14 Fisheries production – Commonwealth continued
Pro du c tio n
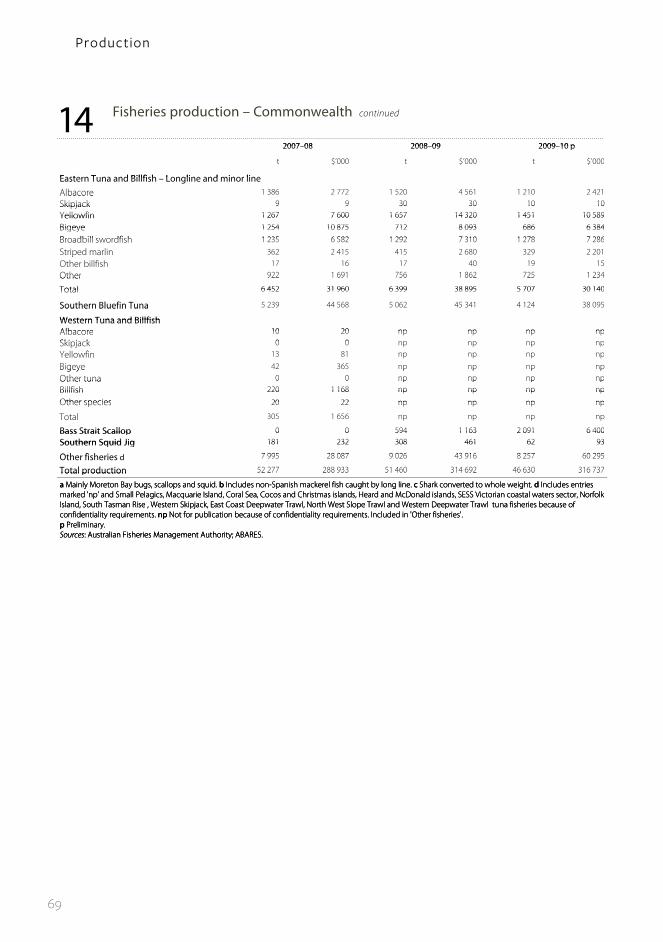
69
1414 Fisheries production - Commonwealth continued14 Fisheries production Commonwealth continued
2007 08 2008 09 2009 10 p2007–08 2008–09 2009–10 p
t $’000 t $’000 t $’000$ $ $
Eastern T na and Billfish Longline and minor lineEastern Tuna and Billfish – Longline and minor lineAlbacore 1 386 2 772 1 520 4 561 1 210 2 421Albacore Skipjack 9 9 30 30 10 10Skipjack 9 9 30 30 10 10Yellowfin 1 267 7 600 1 657 14 320 1 451 10 589Yellowfin 1 267 7 600 1 657 14 320 1 451 10 589
Bigeye 1 254 10 875 712 8 093 686 6 384Bigeye 1 254 10 875 712 8 093 686 6 384
Broadbill swordfish 1 235 6 582 1 292 7 310 1 278 7 286Broadbill swordfish 1 235 6 582 1 292 7 310 1 278 7 286
S i d liStriped marlin 362 2 415 415 2 680 329 2 201pOther billfish 17 16 17 40 19 15Ot e b sOther 922 1 691 756 1 862 725 1 234Other 922 1 691 756 1 862 725 1 234
Total 6 452 31 960 6 399 38 895 5 707 30 140Total 6 452 31 960 6 399 38 895 5 707 30 140
Southern Bluefin Tuna 5 239 44 568 5 062 45 341 4 124 38 095Southern Bluefin Tuna
Western Tuna and BillfishWestern Tuna and BillfishAlbacore 10 20 np np np npAlbacore 10 20 np np np npSki j k 0 0 np np np npSkipjack 0 0 np np np npY ll fi 13 81Yellowfin 13 81 np np np np
Bigeye 42 365 np np np npB geye p p p pOther tuna 0 0 np np np npOther tuna 0 0 np np np npBillfish 220 1 168 np np np npBillfish 220 1 168 np np np np
Other species 20 22 np np np npOther species 20 22 np np np np
Total 305 1 656 np np np np
Bass Strait Scallop 0 0 594 1 163 2 091 6 400Bass Strait Scallop 0 0 594 1 163 2 091 6 400
Southern Squid Jig 181 232 308 461 62 93Southern Squid Jig 181 232 308 461 62 93
O h fi h i 7 995 28 087 9 026 43 916 8 257 60 295Other fisheries d 7 995 28 087 9 026 43 916 8 257 60 295
Total production 52 277 288 933 51 460 314 692 46 630 316 737Total production 52 277 288 933 51 460 314 692 46 630 316 737
a Mainly Moreton Bay bugs, scallops and squid. b Includes non-Spanish mackerel fish caught by long line. c Shark converted to whole weight. d Includes entries a Mainly Moreton Bay bugs, scallops and squid. b Includes non-Spanish mackerel fish caught by long line. c Shark converted to whole weight. d Includes entries marked 'np' and Small Pelagics, Macquarie Island, Coral Sea, Cocos and Christmas islands, Heard and McDonald islands, SESS Victorian coastal waters sector, Norfolk a Mainly Moreton Bay bugs, scallops and squid. b Includes non-Spanish mackerel fish caught by long line. c Shark converted to whole weight. d Includes entries marked 'np' and Small Pelagics, Macquarie Island, Coral Sea, Cocos and Christmas islands, Heard and McDonald islands, SESS Victorian coastal waters sector, Norfolk Island, South Tasman Rise , Western Skipjack, East Coast Deepwater Trawl, North West Slope Trawl and Western Deepwater Trawl tuna fisheries because of
fid i li i N f bli i b f fid i li i I l d d i 'O h fi h i '
y y g , p q p g y g gmarked 'np' and Small Pelagics, Macquarie Island, Coral Sea, Cocos and Christmas islands, Heard and McDonald islands, SESS Victorian coastal waters sector, Norfolk Island, South Tasman Rise , Western Skipjack, East Coast Deepwater Trawl, North West Slope Trawl and Western Deepwater Trawl tuna fisheries because of confidentiality requirements. np Not for publication because of confidentiality requirements. Included in 'Other fisheries'.p Preliminary
Island, South Tasman Rise , Western Skipjack, East Coast Deepwater Trawl, North West Slope Trawl and Western Deepwater Trawl tuna fisheries because of confidentiality requirements. np Not for publication because of confidentiality requirements. Included in 'Other fisheries'.p Preliminary. Sources: Australian Fisheries Management Authority; ABARES
confidentiality requirements. np Not for publication because of confidentiality requirements. Included in 'Other fisheries'.p Preliminary. Sources: Australian Fisheries Management Authority; ABARES.p Preliminary. Sources: Australian Fisheries Management Authority; ABARES.Sources: Australian Fisheries Management Authority; ABARES.
14 Fisheries production – Commonwealth continued
Pro du c tio n

70
15 Aquaculture production in 2007–08, by state – Australia a
15 Aquaculture production in 2007–08, by state - Australia a
NSW Vic. Qld WA SA Tas. NT Aust.
Value $’000 $’000 $’000 $’000 $’000 $’000 $’000 $’000FishSalmonids b 1 400 7 775 na na na 293 134 na 302 310Tuna na na na na 186 742 na na 186 742Silver perch 2 250 na 700 na na na na 2 950Barramundi 1 318 na 24 307 na 4 513 na na 30 138
Other c na 1 559 1 460 4 505 17 674 na na 25 199Total 4 968 9 335 26 467 4 505 208 930 293 134 na 547 339
CrustaceansPrawn 2 700 na 41 504 na na na na 44 204Yabbies 281 10 na 1 060 na na na 1 351Marron na na na 1 532 559 na na 2 091Redclaw na na 1 097 na na na na 1 097Total 2 981 10 42 601 2 592 559 na na 48 743
MolluscsEdible oysters 39 000 na 620 na 30 132 19 375 na 89 127
Pearl oysters d na na 1 292 113 000 na na na 114 292Abalone na 5 964 na na 5 151 5 803 na 16 919Mussels 127 1 791 na 1 299 2 591 2 611 na 8 419
Other e na na na na na na na naTotal 39 127 7 756 1 912 114 299 37 874 27 789 na 228 757
Other NEI f 1 035 na 4 271 1 778 14 765 na 22 570 44 419
Total value 48 111 17 100 75 251 123 174 262 128 320 924 22 570 869 258
Quantity t t t t t t t t
FishSalmonids b 130 1 309 na na na 24 428 na 25 867Tuna na na na na 9 757 na na 9 757Silver perch 200 na 76 na na na na 276Barramundi 111 na 2 464 na 421 na na 2 996
Other c na 105 59 397 2 074 na na 2 635Total 441 1 414 2 599 397 12 251 24 428 na 41 530
CrustaceansPrawn 200 na 2 888 na na na na 3 088Yabbies 22 1 na 61 na na na 84Marron na na na 51 22 na na 73Redclaw na na 67 na na na na 67Total 222 1 2 955 112 22 na na 3 312
MolluscsEdible oysters 4 500 na na na 5 448 3 588 na 13 536Pearl oysters na na na na na na na naAbalone na 166 na na 167 171 na 504Mussels 21 642 na 481 1 369 746 na 3 259
Other e na na na na na na na naTotal 4 521 808 na 481 6 983 4 505 na 17 298
Other NEI f 45 na 120 na 1 727 na na 1 892
Total quantity 5 229 2 223 5 674 990 20 984 28 933 na 64 032
a Excludes hatchery production, crocodiles, microalgae and aquarium worms. b Includes salmon and trout production. c Includes eels, other native fish and aquarium fish. d Total value of pearl production will be an underestimate as it excludes the value of production in NT which remains confidential. e Includes scallops and giant clams. f Includes aquaculture production not elsewhere specified because of confidentiality restrictions. In Victoria, this includes abalone, warmwater finfish, ornamental fish, othershellfish, shrimps and aquatic worms. Total only sums across. na Not available.Sources: ABARES; Fisheries Queensland, Department of Employment, Economic Development and Innovation; Fisheries Victoria, Department of Primary Industries; Industry & Investment New South Wales; Northern Territory Department of Regional Development Primary Industry Fisheries and Resources; Primary Industries and Resources South Australia; Department of Primary
a Excludes hatchery production, crocodiles, microalgae and aquarium worms. b Includes salmon and trout production. c Includes eels, other native fish and aquarium fish. d Total value of pearl production will be an underestimate as it excludes the value of production in NT which remains confidential. e Includes scallops and giant clams. f Includes aquaculture production not elsewhere specified because of confidentiality restrictions. In Victoria, this includes abalone, warmwater finfish, ornamental fish, othershellfish, shrimps and aquatic worms. Total only sums across. na Not available.Sources: ABARES; Fisheries Queensland, Department of Employment, Economic Development and Innovation; Fisheries Victoria, Department of Primary Industries; Industry & Investment New South Wales; Northern Territory Department of Regional Development, Primary Industry, Fisheries and Resources; Primary Industries and Resources, South Australia; Department of PrimaryIndustries, Parks, Water and Environment, Tasmania; Department of Fisheries, Western Australia.
Pro du c tio n
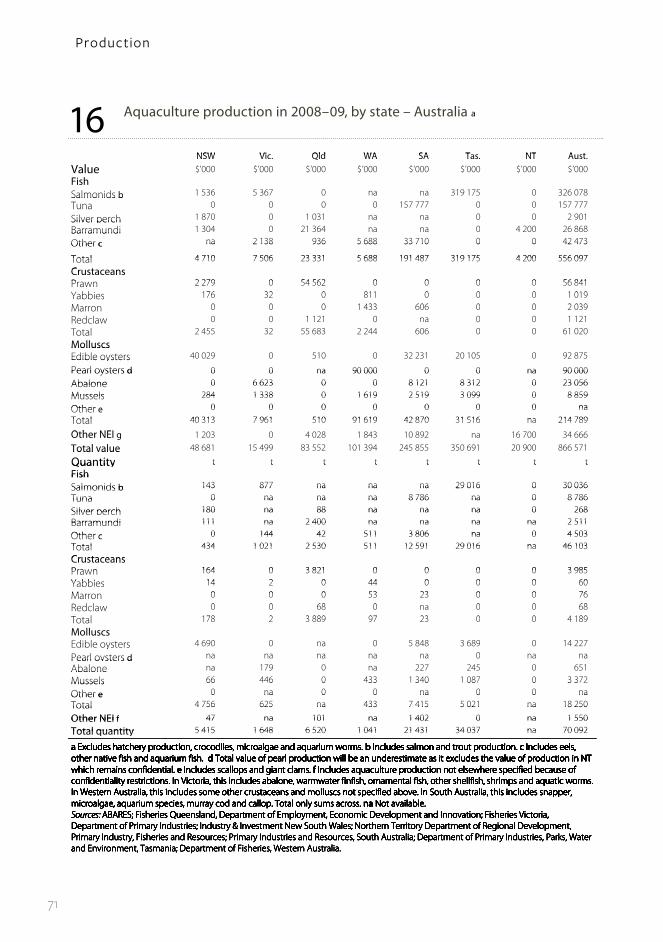
71
16 Aquaculture production in 2008–09, by state – Australia a
1616 Aquaculture production in 2008–09, by state - Australia a16 Aquaculture production in 2008 09, by state Australia aNSW Vi Qld WA SA T NT A tNSW Vic. Qld WA SA Tas. NT Aust.
V l $ $ $ $ $ $ $ $Value $’000 $’000 $’000 $’000 $’000 $’000 $’000 $’000FishSalmonids b 1 536 5 367 0 na na 319 175 0 326 078Salmonids bTuna 0 0 0 0 157 777 0 0 157 777Tuna Silver perch 1 870 0 1 031 na na 0 0 2 901Silver perchBarramundi 1 304 0 21 364 na na 0 4 200 26 868Barramundi Other c na 2 138 936 5 688 33 710 0 0 42 473Other c na 2 138 936 5 688 33 710 0 0 42 473
Total 4 710 7 506 23 331 5 688 191 487 319 175 4 200 556 097Total 4 710 7 506 23 331 5 688 191 487 319 175 4 200 556 097C tCrustaceansP 2 279 0 54 562 0 0 0 0 56 841Prawn 2 279 0 54 562 0 0 0 0 56 841Y bbi 176 32 0 811 0 0 0 1 019Yabbies 176 32 0 811 0 0 0 1 019M 0 0 0 1 433 606 0 0 2 039Marron 0 0 0 1 433 606 0 0 2 039Redclaw 0 0 1 121 0 na 0 0 1 121Total 2 455 32 55 683 2 244 606 0 0 61 020MolluscsMolluscsEdible oysters 40 029 0 510 0 32 231 20 105 0 92 875Edible oystersPearl oysters d 0 0 na 90 000 0 0 na 90 000Pearl oysters d 0 0 na 90 000 0 0 na 90 000Abalone 0 6 623 0 0 8 121 8 312 0 23 056Abalone 0 6 623 0 0 8 121 8 312 0 23 056Mussels 284 1 338 0 1 619 2 519 3 099 0 8 859Mussels 284 1 338 0 1 619 2 519 3 099 0 8 859
Other e 0 0 0 0 0 0 0 naOther e 0 0 0 0 0 0 0 naTotal 40 313 7 961 510 91 619 42 870 31 516 na 214 789Total 40 313 7 961 510 91 619 42 870 31 516 na 214 789
O h NEIOther NEI g 1 203 0 4 028 1 843 10 892 na 16 700 34 666
Total value 48 681 15 499 83 552 101 394 245 855 350 691 20 900 866 571Total valueQuantity t t t t t t t tQuantity t t t t t t t tFishFishSalmonids b 143 877 na na na 29 016 0 30 036Salmonids b 143 877 na na na 29 016 0 30 036Tuna 0 na na na 8 786 na 0 8 786Tuna 0 na na na 8 786 na 0 8 786
Silver perch 180 na 88 na na na 0 268Silver perch 180 na 88 na na na 0 268Barramundi 111 na 2 400 na na na na 2 511Barramundi 111 na 2 400 na na na na 2 511
Other c 0 144 42 511 3 806 na 0 4 503Other c 0 144 42 511 3 806 na 0 4 503Total 434 1 021 2 530 511 12 591 29 016 na 46 103Total 434 1 021 2 530 511 12 591 29 016 na 46 103CrustaceansCrustaceansPrawn 164 0 3 821 0 0 0 0 3 985Prawn 164 0 3 821 0 0 0 0 3 985Y bbi 14 2 0 44 0 0 0 60Yabbies 14 2 0 44 0 0 0 60M 0 0 0 53 23 0 0 76Marron 0 0 0 53 23 0 0 76R d l 0 0 68 0 0 0 68Redclaw 0 0 68 0 na 0 0 68T l 178 2 3 889 97 23 0 0 4 189Total 178 2 3 889 97 23 0 0 4 189MolluscsEdible oysters 4 690 0 na 0 5 848 3 689 0 14 227yPearl oysters d na na na na na 0 na naPearl oysters dAbalone na 179 0 na 227 245 0 651AbaloneMussels 66 446 0 433 1 340 1 087 0 3 372Mussels 66 6 0 33 3 0 08 0 3 3
Other e 0 na 0 0 na 0 0 naOther e 0 na 0 0 na 0 0 naTotal 4 756 625 na 433 7 415 5 021 na 18 250Total 4 756 625 na 433 7 415 5 021 na 18 250
Other NEI f 47 na 101 na 1 402 0 na 1 550Other NEI f 47 na 101 na 1 402 0 na 1 550Total quantity 5 415 1 648 6 520 1 041 21 431 34 037 na 70 092Total quantity 5 415 1 648 6 520 1 041 21 431 34 037 na 70 092
a Excludes hatchery production, crocodiles, microalgae and aquarium worms. b Includes salmon and trout production. c Includes eels, a Excludes hatchery production, crocodiles, microalgae and aquarium worms. b Includes salmon and trout production. c Includes eels, other native fish and aquarium fish. d Total value of pearl production will be an underestimate as it excludes the value of production in NT a Excludes hatchery production, crocodiles, microalgae and aquarium worms. b Includes salmon and trout production. c Includes eels, other native fish and aquarium fish. d Total value of pearl production will be an underestimate as it excludes the value of production in NT which remains confidential. e Includes scallops and giant clams. f Includes aquaculture production not elsewhere specified because of
fid i li i i I Vi i hi i l d b l fi fi h l fi h h h llfi h h i d i
a Excludes hatchery production, crocodiles, microalgae and aquarium worms. b Includes salmon and trout production. c Includes eels, other native fish and aquarium fish. d Total value of pearl production will be an underestimate as it excludes the value of production in NT which remains confidential. e Includes scallops and giant clams. f Includes aquaculture production not elsewhere specified because of confidentiality restrictions. In Victoria, this includes abalone, warmwater finfish, ornamental fish, other shellfish, shrimps and aquatic worms. In Western Australia this includes some other crustaceans and molluscs not specified above In South Australia this includes snapper
a Excludes hatchery production, crocodiles, microalgae and aquarium worms. b Includes salmon and trout production. c Includes eels, other native fish and aquarium fish. d Total value of pearl production will be an underestimate as it excludes the value of production in NT which remains confidential. e Includes scallops and giant clams. f Includes aquaculture production not elsewhere specified because of confidentiality restrictions. In Victoria, this includes abalone, warmwater finfish, ornamental fish, other shellfish, shrimps and aquatic worms. In Western Australia this includes some other crustaceans and molluscs not specified above In South Australia this includes snapper
a Excludes hatchery production, crocodiles, microalgae and aquarium worms. b Includes salmon and trout production. c Includes eels, other native fish and aquarium fish. d Total value of pearl production will be an underestimate as it excludes the value of production in NT which remains confidential. e Includes scallops and giant clams. f Includes aquaculture production not elsewhere specified because of confidentiality restrictions. In Victoria, this includes abalone, warmwater finfish, ornamental fish, other shellfish, shrimps and aquatic worms. In Western Australia, this includes some other crustaceans and molluscs not specified above. In South Australia, this includes snapper, microalgae aquarium species murray cod and callop Total only sums across na Not available
a Excludes hatchery production, crocodiles, microalgae and aquarium worms. b Includes salmon and trout production. c Includes eels, other native fish and aquarium fish. d Total value of pearl production will be an underestimate as it excludes the value of production in NT which remains confidential. e Includes scallops and giant clams. f Includes aquaculture production not elsewhere specified because of confidentiality restrictions. In Victoria, this includes abalone, warmwater finfish, ornamental fish, other shellfish, shrimps and aquatic worms. In Western Australia, this includes some other crustaceans and molluscs not specified above. In South Australia, this includes snapper, microalgae, aquarium species, murray cod and callop. Total only sums across. na Not available.Sources: ABARES; Fisheries Queensland Department of Employment Economic Development and Innovation; Fisheries Victoria
a Excludes hatchery production, crocodiles, microalgae and aquarium worms. b Includes salmon and trout production. c Includes eels, other native fish and aquarium fish. d Total value of pearl production will be an underestimate as it excludes the value of production in NT which remains confidential. e Includes scallops and giant clams. f Includes aquaculture production not elsewhere specified because of confidentiality restrictions. In Victoria, this includes abalone, warmwater finfish, ornamental fish, other shellfish, shrimps and aquatic worms. In Western Australia, this includes some other crustaceans and molluscs not specified above. In South Australia, this includes snapper, microalgae, aquarium species, murray cod and callop. Total only sums across. na Not available.Sources: ABARES; Fisheries Queensland, Department of Employment, Economic Development and Innovation; Fisheries Victoria, Department of Primary Industries; Industry & Investment New South Wales; Northern Territory Department of Regional Development,
a Excludes hatchery production, crocodiles, microalgae and aquarium worms. b Includes salmon and trout production. c Includes eels, other native fish and aquarium fish. d Total value of pearl production will be an underestimate as it excludes the value of production in NT which remains confidential. e Includes scallops and giant clams. f Includes aquaculture production not elsewhere specified because of confidentiality restrictions. In Victoria, this includes abalone, warmwater finfish, ornamental fish, other shellfish, shrimps and aquatic worms. In Western Australia, this includes some other crustaceans and molluscs not specified above. In South Australia, this includes snapper, microalgae, aquarium species, murray cod and callop. Total only sums across. na Not available.Sources: ABARES; Fisheries Queensland, Department of Employment, Economic Development and Innovation; Fisheries Victoria, Department of Primary Industries; Industry & Investment New South Wales; Northern Territory Department of Regional Development, Primary Industry, Fisheries and Resources; Primary Industries and Resources, South Australia; Department of Primary Industries, Parks, Water
a Excludes hatchery production, crocodiles, microalgae and aquarium worms. b Includes salmon and trout production. c Includes eels, other native fish and aquarium fish. d Total value of pearl production will be an underestimate as it excludes the value of production in NT which remains confidential. e Includes scallops and giant clams. f Includes aquaculture production not elsewhere specified because of confidentiality restrictions. In Victoria, this includes abalone, warmwater finfish, ornamental fish, other shellfish, shrimps and aquatic worms. In Western Australia, this includes some other crustaceans and molluscs not specified above. In South Australia, this includes snapper, microalgae, aquarium species, murray cod and callop. Total only sums across. na Not available.Sources: ABARES; Fisheries Queensland, Department of Employment, Economic Development and Innovation; Fisheries Victoria, Department of Primary Industries; Industry & Investment New South Wales; Northern Territory Department of Regional Development, Primary Industry, Fisheries and Resources; Primary Industries and Resources, South Australia; Department of Primary Industries, Parks, Water and Environment, Tasmania; Department of Fisheries, Western Australia.
a Excludes hatchery production, crocodiles, microalgae and aquarium worms. b Includes salmon and trout production. c Includes eels, other native fish and aquarium fish. d Total value of pearl production will be an underestimate as it excludes the value of production in NT which remains confidential. e Includes scallops and giant clams. f Includes aquaculture production not elsewhere specified because of confidentiality restrictions. In Victoria, this includes abalone, warmwater finfish, ornamental fish, other shellfish, shrimps and aquatic worms. In Western Australia, this includes some other crustaceans and molluscs not specified above. In South Australia, this includes snapper, microalgae, aquarium species, murray cod and callop. Total only sums across. na Not available.Sources: ABARES; Fisheries Queensland, Department of Employment, Economic Development and Innovation; Fisheries Victoria, Department of Primary Industries; Industry & Investment New South Wales; Northern Territory Department of Regional Development, Primary Industry, Fisheries and Resources; Primary Industries and Resources, South Australia; Department of Primary Industries, Parks, Water and Environment, Tasmania; Department of Fisheries, Western Australia.
a Excludes hatchery production, crocodiles, microalgae and aquarium worms. b Includes salmon and trout production. c Includes eels, other native fish and aquarium fish. d Total value of pearl production will be an underestimate as it excludes the value of production in NT which remains confidential. e Includes scallops and giant clams. f Includes aquaculture production not elsewhere specified because of confidentiality restrictions. In Victoria, this includes abalone, warmwater finfish, ornamental fish, other shellfish, shrimps and aquatic worms. In Western Australia, this includes some other crustaceans and molluscs not specified above. In South Australia, this includes snapper, microalgae, aquarium species, murray cod and callop. Total only sums across. na Not available.Sources: ABARES; Fisheries Queensland, Department of Employment, Economic Development and Innovation; Fisheries Victoria, Department of Primary Industries; Industry & Investment New South Wales; Northern Territory Department of Regional Development, Primary Industry, Fisheries and Resources; Primary Industries and Resources, South Australia; Department of Primary Industries, Parks, Water and Environment, Tasmania; Department of Fisheries, Western Australia.
a Excludes hatchery production, crocodiles, microalgae and aquarium worms. b Includes salmon and trout production. c Includes eels, other native fish and aquarium fish. d Total value of pearl production will be an underestimate as it excludes the value of production in NT which remains confidential. e Includes scallops and giant clams. f Includes aquaculture production not elsewhere specified because of confidentiality restrictions. In Victoria, this includes abalone, warmwater finfish, ornamental fish, other shellfish, shrimps and aquatic worms. In Western Australia, this includes some other crustaceans and molluscs not specified above. In South Australia, this includes snapper, microalgae, aquarium species, murray cod and callop. Total only sums across. na Not available.Sources: ABARES; Fisheries Queensland, Department of Employment, Economic Development and Innovation; Fisheries Victoria, Department of Primary Industries; Industry & Investment New South Wales; Northern Territory Department of Regional Development, Primary Industry, Fisheries and Resources; Primary Industries and Resources, South Australia; Department of Primary Industries, Parks, Water and Environment, Tasmania; Department of Fisheries, Western Australia.
a Excludes hatchery production, crocodiles, microalgae and aquarium worms. b Includes salmon and trout production. c Includes eels, other native fish and aquarium fish. d Total value of pearl production will be an underestimate as it excludes the value of production in NT which remains confidential. e Includes scallops and giant clams. f Includes aquaculture production not elsewhere specified because of confidentiality restrictions. In Victoria, this includes abalone, warmwater finfish, ornamental fish, other shellfish, shrimps and aquatic worms. In Western Australia, this includes some other crustaceans and molluscs not specified above. In South Australia, this includes snapper, microalgae, aquarium species, murray cod and callop. Total only sums across. na Not available.Sources: ABARES; Fisheries Queensland, Department of Employment, Economic Development and Innovation; Fisheries Victoria, Department of Primary Industries; Industry & Investment New South Wales; Northern Territory Department of Regional Development, Primary Industry, Fisheries and Resources; Primary Industries and Resources, South Australia; Department of Primary Industries, Parks, Water and Environment, Tasmania; Department of Fisheries, Western Australia.
a Excludes hatchery production, crocodiles, microalgae and aquarium worms. b Includes salmon and trout production. c Includes eels, other native fish and aquarium fish. d Total value of pearl production will be an underestimate as it excludes the value of production in NT which remains confidential. e Includes scallops and giant clams. f Includes aquaculture production not elsewhere specified because of confidentiality restrictions. In Victoria, this includes abalone, warmwater finfish, ornamental fish, other shellfish, shrimps and aquatic worms. In Western Australia, this includes some other crustaceans and molluscs not specified above. In South Australia, this includes snapper, microalgae, aquarium species, murray cod and callop. Total only sums across. na Not available.Sources: ABARES; Fisheries Queensland, Department of Employment, Economic Development and Innovation; Fisheries Victoria, Department of Primary Industries; Industry & Investment New South Wales; Northern Territory Department of Regional Development, Primary Industry, Fisheries and Resources; Primary Industries and Resources, South Australia; Department of Primary Industries, Parks, Water and Environment, Tasmania; Department of Fisheries, Western Australia.
a Excludes hatchery production, crocodiles, microalgae and aquarium worms. b Includes salmon and trout production. c Includes eels, other native fish and aquarium fish. d Total value of pearl production will be an underestimate as it excludes the value of production in NT which remains confidential. e Includes scallops and giant clams. f Includes aquaculture production not elsewhere specified because of confidentiality restrictions. In Victoria, this includes abalone, warmwater finfish, ornamental fish, other shellfish, shrimps and aquatic worms. In Western Australia, this includes some other crustaceans and molluscs not specified above. In South Australia, this includes snapper, microalgae, aquarium species, murray cod and callop. Total only sums across. na Not available.Sources: ABARES; Fisheries Queensland, Department of Employment, Economic Development and Innovation; Fisheries Victoria, Department of Primary Industries; Industry & Investment New South Wales; Northern Territory Department of Regional Development, Primary Industry, Fisheries and Resources; Primary Industries and Resources, South Australia; Department of Primary Industries, Parks, Water and Environment, Tasmania; Department of Fisheries, Western Australia.
Pro du c tio n

72
17 Aquaculture production in 2009–10, by state – Australia ap
1717 Aquaculture production in 2009–10, by state - Australia ap17 Aquaculture production in 2009 10, by state Australia ap
NSW Vi Qld WA SA T NT A tNSW Vic. Qld WA SA Tas. NT Aust.V l $ $ $ $ $ $ $ $Value $’000 $’000 $’000 $’000 $’000 $’000 $’000 $’000FishSalmonids b 1 602 5 102 0 na na 362 422 0 369 126Salmonids bTuna 0 0 0 0 102 175 0 0 102 175Tuna Silver perch 2 336 0 1 100 na na 0 0 3 436Silver perchBarramundi 1 046 0 20 684 na na 0 5 770 27 500Barramundi Other c 0 3 225 971 5 564 32 030 0 0 41 790Other c 0 3 225 971 5 564 32 030 0 0 41 790
Total 4 984 8 327 22 755 5 564 134 205 362 422 5 770 544 027Total 4 984 8 327 22 755 5 564 134 205 362 422 5 770 544 027CrustaceansCrustaceansPrawn 2 400 0 75 090 0 na 0 0 77 490Prawn 2 400 0 75 090 0 na 0 0 77 490Yabbies 175 0 0 761 na 0 0 936Yabbies 175 0 0 761 na 0 0 936Marron 0 0 0 1 439 645 0 0 2 084Marron 0 0 0 1 439 645 0 0 2 084R d l 0 0 933 na na 0 0 933Redclaw 0 0 933 na na 0 0 933T l 2 575 0 76 023 2 200 645 0 0 81 443Total 2 575 0 76 023 2 200 645 0 0 81 443M llMolluscs
3 000 0 20 0 3 02 2 2 2 0 99 9Edible oysters 43 000 0 520 0 35 027 21 212 0 99 759yPearl oysters d 0 0 0 85 500 0 0 18 980 104 480Pearl oysters dAbalone 0 0 0 0 10 341 5 099 0 15 440Abalone 0 0 0 0 10 341 5 099 0 15 440Mussels 284 1 981 0 1 861 2 530 3 438 0 10 094Mussels 284 1 981 0 1 861 2 530 3 438 0 10 094
Other e 0 0 0 0 0 0 0 naOther e 0 0 0 0 0 0 0 naTotal 43 284 1 981 520 87 361 47 898 29 749 18 980 229 773Total 43 284 1 981 520 87 361 47 898 29 749 18 980 229 773
Other NEI g 1 557 0 1 940 676 10 260 0 730 15 163Other NEI g 1 557 0 1 940 676 10 260 0 730 15 163
T t l l 52 400 10 308 101 238 95 801 193 008 392 171 25 480 870 406Total value 52 400 10 308 101 238 95 801 193 008 392 171 25 480 870 406
Quantity t t t t t t t tQ yFishSalmonids b 150 815 0 na na 30 950 0 31 915Salmonids bTuna 0 0 0 na 7 284 0 0 7 284Tuna Silver perch 194 0 100 na na 0 0 294Silver perch 194 0 100 na na 0 0 294Barramundi 86 0 2 405 na na 0 699 3 190Barramundi 86 0 2 405 na na 0 699 3 190
Other c 0 215 17 508 4 172 0 0 4 912Other c 0 215 17 508 4 172 0 0 4 912Total 430 1 030 2 522 508 11 456 30 950 699 47 595Total 430 1 030 2 522 508 11 456 30 950 699 47 595CrustaceansCrustaceansPrawn 165 0 5 216 na 0 0 0 5 381Prawn 165 0 5 216 na 0 0 0 5 381Yabbies 10 0 0 41 0 0 0 51Yabbies 10 0 0 41 0 0 0 51Marron 0 0 0 53 23 0 0 76Marron 0 0 0 53 23 0 0 76Redclaw 0 0 56 na 0 0 0 56Redclaw 0 0 56 na 0 0 0 56Total 175 0 5 272 94 23 0 0 5 564Total 175 0 5 272 94 23 0 0 5 564MolluscsMolluscsEdibl t 4 960 0 na 0 6 123 3 721 0 14 804Edible oysters 4 960 0 na 0 6 123 3 721 0 14 804
P l 0 0 0 0Pearl oysters d 0 0 0 na na 0 na nab l 0 0 0 0 286 170 0 456Abalone 0 0 0 0 286 170 0 456
Mussels 66 566 0 505 1 343 982 0 3 462
Other e 0 0 0 0 na 0 0 naOther eTotal 5 026 566 na 505 7 752 4 874 na 18 723TotalOther NEI f 85 256 na na 1 319 0 na 1 660Other NEI f 85 256 na na 1 319 0 na 1 660Total quantity 5 716 1 852 7 794 1 107 20 550 35 824 699 73 542Total quantity 5 716 1 852 7 794 1 107 20 550 35 824 699 73 542
a Excludes hatchery production crocodiles microalgae and aquarium worms b Includes salmon and trout production c Includes eelsa Excludes hatchery production, crocodiles, microalgae and aquarium worms. b Includes salmon and trout production. c Includes eels, other native fish and aquarium fish. d Total value of pearl production will be an underestimate as it excludes the value of production in a Excludes hatchery production, crocodiles, microalgae and aquarium worms. b Includes salmon and trout production. c Includes eels, other native fish and aquarium fish. d Total value of pearl production will be an underestimate as it excludes the value of production in NT which remains confidential. e Includes scallops and giant clams. f Includes aquaculture production not elsewhere specified because of
a Excludes hatchery production, crocodiles, microalgae and aquarium worms. b Includes salmon and trout production. c Includes eels, other native fish and aquarium fish. d Total value of pearl production will be an underestimate as it excludes the value of production in NT which remains confidential. e Includes scallops and giant clams. f Includes aquaculture production not elsewhere specified because of confidentiality restrictions. In Victoria, this includes abalone, warmwater finfish, ornamental fish, other shellfish, shrimps and aquatic
a Excludes hatchery production, crocodiles, microalgae and aquarium worms. b Includes salmon and trout production. c Includes eels, other native fish and aquarium fish. d Total value of pearl production will be an underestimate as it excludes the value of production in NT which remains confidential. e Includes scallops and giant clams. f Includes aquaculture production not elsewhere specified because of confidentiality restrictions. In Victoria, this includes abalone, warmwater finfish, ornamental fish, other shellfish, shrimps and aquatic worms. In Western Australia, this includes some other crustaceans and molluscs not specified above. In South Australia, this includes
i l i i d d ll T l l P li i N il bl
a Excludes hatchery production, crocodiles, microalgae and aquarium worms. b Includes salmon and trout production. c Includes eels, other native fish and aquarium fish. d Total value of pearl production will be an underestimate as it excludes the value of production in NT which remains confidential. e Includes scallops and giant clams. f Includes aquaculture production not elsewhere specified because of confidentiality restrictions. In Victoria, this includes abalone, warmwater finfish, ornamental fish, other shellfish, shrimps and aquatic worms. In Western Australia, this includes some other crustaceans and molluscs not specified above. In South Australia, this includes snapper, microalgae, aquarium species, murray cod and callop. Total only sums across. p Preliminary. na Not available.Sources ABARES Fisheries Queensland Department of Employment Economic Development and Innovation Fisheries Victoria
a Excludes hatchery production, crocodiles, microalgae and aquarium worms. b Includes salmon and trout production. c Includes eels, other native fish and aquarium fish. d Total value of pearl production will be an underestimate as it excludes the value of production in NT which remains confidential. e Includes scallops and giant clams. f Includes aquaculture production not elsewhere specified because of confidentiality restrictions. In Victoria, this includes abalone, warmwater finfish, ornamental fish, other shellfish, shrimps and aquatic worms. In Western Australia, this includes some other crustaceans and molluscs not specified above. In South Australia, this includes snapper, microalgae, aquarium species, murray cod and callop. Total only sums across. p Preliminary. na Not available.Sources: ABARES; Fisheries Queensland, Department of Employment, Economic Development and Innovation; Fisheries Victoria, Department of Primary Industries; Industry & Investment New South Wales; Northern Territory Department of Regional Development
a Excludes hatchery production, crocodiles, microalgae and aquarium worms. b Includes salmon and trout production. c Includes eels, other native fish and aquarium fish. d Total value of pearl production will be an underestimate as it excludes the value of production in NT which remains confidential. e Includes scallops and giant clams. f Includes aquaculture production not elsewhere specified because of confidentiality restrictions. In Victoria, this includes abalone, warmwater finfish, ornamental fish, other shellfish, shrimps and aquatic worms. In Western Australia, this includes some other crustaceans and molluscs not specified above. In South Australia, this includes snapper, microalgae, aquarium species, murray cod and callop. Total only sums across. p Preliminary. na Not available.Sources: ABARES; Fisheries Queensland, Department of Employment, Economic Development and Innovation; Fisheries Victoria, Department of Primary Industries; Industry & Investment New South Wales; Northern Territory Department of Regional Development, Primary Industry Fisheries and Resources; Primary Industries and Resources South Australia; Department of Primary Industries Parks
a Excludes hatchery production, crocodiles, microalgae and aquarium worms. b Includes salmon and trout production. c Includes eels, other native fish and aquarium fish. d Total value of pearl production will be an underestimate as it excludes the value of production in NT which remains confidential. e Includes scallops and giant clams. f Includes aquaculture production not elsewhere specified because of confidentiality restrictions. In Victoria, this includes abalone, warmwater finfish, ornamental fish, other shellfish, shrimps and aquatic worms. In Western Australia, this includes some other crustaceans and molluscs not specified above. In South Australia, this includes snapper, microalgae, aquarium species, murray cod and callop. Total only sums across. p Preliminary. na Not available.Sources: ABARES; Fisheries Queensland, Department of Employment, Economic Development and Innovation; Fisheries Victoria, Department of Primary Industries; Industry & Investment New South Wales; Northern Territory Department of Regional Development, Primary Industry, Fisheries and Resources; Primary Industries and Resources, South Australia; Department of Primary Industries, Parks, Water and Environment, Tasmania; Department of Fisheries, Western Australia.
a Excludes hatchery production, crocodiles, microalgae and aquarium worms. b Includes salmon and trout production. c Includes eels, other native fish and aquarium fish. d Total value of pearl production will be an underestimate as it excludes the value of production in NT which remains confidential. e Includes scallops and giant clams. f Includes aquaculture production not elsewhere specified because of confidentiality restrictions. In Victoria, this includes abalone, warmwater finfish, ornamental fish, other shellfish, shrimps and aquatic worms. In Western Australia, this includes some other crustaceans and molluscs not specified above. In South Australia, this includes snapper, microalgae, aquarium species, murray cod and callop. Total only sums across. p Preliminary. na Not available.Sources: ABARES; Fisheries Queensland, Department of Employment, Economic Development and Innovation; Fisheries Victoria, Department of Primary Industries; Industry & Investment New South Wales; Northern Territory Department of Regional Development, Primary Industry, Fisheries and Resources; Primary Industries and Resources, South Australia; Department of Primary Industries, Parks, Water and Environment, Tasmania; Department of Fisheries, Western Australia.
a Excludes hatchery production, crocodiles, microalgae and aquarium worms. b Includes salmon and trout production. c Includes eels, other native fish and aquarium fish. d Total value of pearl production will be an underestimate as it excludes the value of production in NT which remains confidential. e Includes scallops and giant clams. f Includes aquaculture production not elsewhere specified because of confidentiality restrictions. In Victoria, this includes abalone, warmwater finfish, ornamental fish, other shellfish, shrimps and aquatic worms. In Western Australia, this includes some other crustaceans and molluscs not specified above. In South Australia, this includes snapper, microalgae, aquarium species, murray cod and callop. Total only sums across. p Preliminary. na Not available.Sources: ABARES; Fisheries Queensland, Department of Employment, Economic Development and Innovation; Fisheries Victoria, Department of Primary Industries; Industry & Investment New South Wales; Northern Territory Department of Regional Development, Primary Industry, Fisheries and Resources; Primary Industries and Resources, South Australia; Department of Primary Industries, Parks, Water and Environment, Tasmania; Department of Fisheries, Western Australia.
a Excludes hatchery production, crocodiles, microalgae and aquarium worms. b Includes salmon and trout production. c Includes eels, other native fish and aquarium fish. d Total value of pearl production will be an underestimate as it excludes the value of production in NT which remains confidential. e Includes scallops and giant clams. f Includes aquaculture production not elsewhere specified because of confidentiality restrictions. In Victoria, this includes abalone, warmwater finfish, ornamental fish, other shellfish, shrimps and aquatic worms. In Western Australia, this includes some other crustaceans and molluscs not specified above. In South Australia, this includes snapper, microalgae, aquarium species, murray cod and callop. Total only sums across. p Preliminary. na Not available.Sources: ABARES; Fisheries Queensland, Department of Employment, Economic Development and Innovation; Fisheries Victoria, Department of Primary Industries; Industry & Investment New South Wales; Northern Territory Department of Regional Development, Primary Industry, Fisheries and Resources; Primary Industries and Resources, South Australia; Department of Primary Industries, Parks, Water and Environment, Tasmania; Department of Fisheries, Western Australia.
a Excludes hatchery production, crocodiles, microalgae and aquarium worms. b Includes salmon and trout production. c Includes eels, other native fish and aquarium fish. d Total value of pearl production will be an underestimate as it excludes the value of production in NT which remains confidential. e Includes scallops and giant clams. f Includes aquaculture production not elsewhere specified because of confidentiality restrictions. In Victoria, this includes abalone, warmwater finfish, ornamental fish, other shellfish, shrimps and aquatic worms. In Western Australia, this includes some other crustaceans and molluscs not specified above. In South Australia, this includes snapper, microalgae, aquarium species, murray cod and callop. Total only sums across. p Preliminary. na Not available.Sources: ABARES; Fisheries Queensland, Department of Employment, Economic Development and Innovation; Fisheries Victoria, Department of Primary Industries; Industry & Investment New South Wales; Northern Territory Department of Regional Development, Primary Industry, Fisheries and Resources; Primary Industries and Resources, South Australia; Department of Primary Industries, Parks, Water and Environment, Tasmania; Department of Fisheries, Western Australia.
a Excludes hatchery production, crocodiles, microalgae and aquarium worms. b Includes salmon and trout production. c Includes eels, other native fish and aquarium fish. d Total value of pearl production will be an underestimate as it excludes the value of production in NT which remains confidential. e Includes scallops and giant clams. f Includes aquaculture production not elsewhere specified because of confidentiality restrictions. In Victoria, this includes abalone, warmwater finfish, ornamental fish, other shellfish, shrimps and aquatic worms. In Western Australia, this includes some other crustaceans and molluscs not specified above. In South Australia, this includes snapper, microalgae, aquarium species, murray cod and callop. Total only sums across. p Preliminary. na Not available.Sources: ABARES; Fisheries Queensland, Department of Employment, Economic Development and Innovation; Fisheries Victoria, Department of Primary Industries; Industry & Investment New South Wales; Northern Territory Department of Regional Development, Primary Industry, Fisheries and Resources; Primary Industries and Resources, South Australia; Department of Primary Industries, Parks, Water and Environment, Tasmania; Department of Fisheries, Western Australia.
a Excludes hatchery production, crocodiles, microalgae and aquarium worms. b Includes salmon and trout production. c Includes eels, other native fish and aquarium fish. d Total value of pearl production will be an underestimate as it excludes the value of production in NT which remains confidential. e Includes scallops and giant clams. f Includes aquaculture production not elsewhere specified because of confidentiality restrictions. In Victoria, this includes abalone, warmwater finfish, ornamental fish, other shellfish, shrimps and aquatic worms. In Western Australia, this includes some other crustaceans and molluscs not specified above. In South Australia, this includes snapper, microalgae, aquarium species, murray cod and callop. Total only sums across. p Preliminary. na Not available.Sources: ABARES; Fisheries Queensland, Department of Employment, Economic Development and Innovation; Fisheries Victoria, Department of Primary Industries; Industry & Investment New South Wales; Northern Territory Department of Regional Development, Primary Industry, Fisheries and Resources; Primary Industries and Resources, South Australia; Department of Primary Industries, Parks, Water and Environment, Tasmania; Department of Fisheries, Western Australia.
Pro du c tio n

73
18 Exports of fisheries products – Australia 1818 Exports of fisheries products - Australia18 Exports of fisheries products Australia
2007 08 2008 09 2009 102007–08 2008–09 2009–10
t $’000 t $’000 t $’000$ $ $
EdiblEdiblehFish
Live na 42 827 na 46 483 na 40 435Live na 42 827 na 46 483 na 40 435Fresh, chilled or frozenFresh, chilled or frozen
WholeWhole Tuna a 12 075 202 340 11 301 175 452 9 322 117 013 Tuna a 12 075 202 340 11 301 175 452 9 322 117 013Other 6 338 36 584 10 528 71 428 8 388 56 549 Other 6 338 36 584 10 528 71 428 8 388 56 549
Fillets 1 016 5 695 497 4 820 1 025 10 298Fillets 1 016 5 695 497 4 820 1 025 10 298P d d d 1 972 12 560 2 400 9 785 659 5 558Prepared and preserved 1 972 12 560 2 400 9 785 659 5 558D i d l d d k dDried, salted and smoked 176 16 641 190 17 211 175 13 055Other fish products 838 8 149 790 8 812 1 201 15 488p
Total fish b 22 414 324 795 25 707 333 992 20 769 258 396Total fish b 22 414 324 795 25 707 333 992 20 769 258 396
Crustaceans and molluscsRock lobster 9 496 400 864 9 561 461 701 7 729 399 682Rock lobster 9 496 400 864 9 561 461 701 7 729 399 682Prawns 4 916 68 624 4 797 82 180 4 659 61 461Prawns 4 916 68 624 4 797 82 180 4 659 61 461Abalone 3 580 217 218 3 320 208 185 3 639 216 373Abalone 3 580 217 218 3 320 208 185 3 639 216 373Scallops 1 128 27 838 1 137 33 254 1 089 29 508Scallops 1 128 27 838 1 137 33 254 1 089 29 508Oysters 228 2 133 346 3 278 320 3 138Oysters 228 2 133 346 3 278 320 3 138Crabs 1 414 15 701 1 324 16 370 1 079 13 801Crabs 1 414 15 701 1 324 16 370 1 079 13 801O hOther 822 8 243 709 6 390 684 5 338
Total 21 584 740 620 21 194 811 356 19 198 729 302Total 21 584 740 620 21 194 811 356 19 198 729 302
T l dibl 43 998 1 065 415 46 901 1 145 348 39 968 987 698Total edible b 43 998 1 065 415 46 901 1 145 348 39 968 987 698
Non-edibleNon-edibleMarine fats and oils na 5 474 na 5 031 na 4 810Marine fats and oils na 5 474 na 5 031 na 4 810Fi h l 974 1 313 2 117Fish meal na 974 na 1 313 na 2 117
Pearls c na 264 026 na 366 445 na 243 879Ornamental fish na 1 950 na 3 397 na 2 685Other non-edible na 3 854 na 7 828 na 5 483Other non edible na 3 854 na 7 828 na 5 483
Total non-edible na 276 277 na 384 014 na 258 974Total non-edible na 276 277 na 384 014 na 258 974
Total fisheries products na 1 341 692 na 1 529 362 na 1 246 672Total fisheries products
a Exports of tuna landed in Australia. b Excludes live tonnage but includes live value. c Includes items temporarily exported and re-imported a Exports of tuna landed in Australia. b Excludes live tonnage but includes live value. c Includes items temporarily exported and re-imported (see table 29). na Not available.a Exports of tuna landed in Australia. b Excludes live tonnage but includes live value. c Includes items temporarily exported and re-imported (see table 29). na Not available.Source: ABS, International Trade, Australia, cat. no. 5465.0, Canberra.
a Exports of tuna landed in Australia. b Excludes live tonnage but includes live value. c Includes items temporarily exported and re imported (see table 29). na Not available.Source: ABS, International Trade, Australia, cat. no. 5465.0, Canberra.( )Source: ABS, International Trade, Australia, cat. no. 5465.0, Canberra.
E x p o r t s

74
19 Exports of fish – Australia 1919 Exports of fish - Australia19 Exports of fish Australia
2007 08 2008 09 2009 102007–08 2008–09 2009–10
t $’000 t $’000 t $’000$ $ $
TTuna aWh lWhole
F h hill d 3 234 43 907 4 036 63 258 3 909 59 309Fresh or chilled 3 234 43 907 4 036 63 258 3 909 59 309Frozen 8 840 158 433 7 264 112 194 5 413 57 704
Prepared and preserved 499 3 857 219 1 329 223 1 439p pOther 0 2 1 27 2 42Other 0 2 1 27 2 42
Total 12 574 206 200 11 522 176 808 9 547 118 494Total 12 574 206 200 11 522 176 808 9 547 118 494
Salmon Salmon WholeWhole
Fresh or chilled 2 194 15 741 5 899 41 555 3 620 25 736Fresh or chilled 2 194 15 741 5 899 41 555 3 620 25 736Frozen 71 615 375 1 758 63 282Frozen 71 615 375 1 758 63 282
Smoked 38 641 40 726 37 531Smoked 38 641 40 726 37 531Prepared and preserved 472 2 543 5 62 3 32Prepared and preserved 472 2 543 5 62 3 32
Total 2 775 19 540 6 320 44 101 3 724 26 581Total 2 775 19 540 6 320 44 101 3 724 26 581
O h fi hOther fishLive na 42 827 na 46 483 na 40 435LiveWholeWhole
Fresh or chilled 1 211 11 929 1 813 21 136 2 297 23 589Fresh or chilled 1 211 11 929 1 813 21 136 2 297 23 589FrozenFrozen
Whiting 1 291 2 960 1 359 3 364 1 305 3 396 Whiting 1 291 2 960 1 359 3 364 1 305 3 396Other 1 570 5 339 1 081 3 614 1 103 3 546 Other 1 570 5 339 1 081 3 614 1 103 3 546
FillFilletsFresh or chilled 772 3 310 64 912 108 1 791Frozen 244 2 384 433 3 908 916 8 507Frozen
Other (fresh, chilled or frozen) 715 6 443 706 6 908 1 127 13 937Other (fresh, chilled or frozen) 715 6 443 706 6 908 1 127 13 937Prepared and preserved 1 001 6 160 2 175 8 393 433 4 087Prepared and preserved 1 001 6 160 2 175 8 393 433 4 087Dried salted and smoked 138 16 000 150 16 486 137 12 524Dried, salted and smoked 138 16 000 150 16 486 137 12 524Other 123 1 703 83 1 876 72 1 509Other 123 1 703 83 1 876 72 1 509
7 065 99 056 7 865 113 082 7 499 113 321Total b 7 065 99 056 7 865 113 082 7 499 113 321
Total fish b 22 414 324 795 25 707 333 992 20 769 258 396Total fish b 22 414 324 795 25 707 333 992 20 769 258 396
a Exports of tuna landed in Australia. b Excludes live tonnage but includes live value. na Not available.a Exports of tuna landed in Australia. b Excludes live tonnage but includes live value. na Not available.Source: ABS, International Trade, Australia, cat. no. 5465.0, Canberra.a Exports of tuna landed in Australia. b Excludes live tonnage but includes live value. na Not available.Source: ABS, International Trade, Australia, cat. no. 5465.0, Canberra.a Exports of tuna landed in Australia. b Excludes live tonnage but includes live value. na Not available.Source: ABS, International Trade, Australia, cat. no. 5465.0, Canberra.a Exports of tuna landed in Australia. b Excludes live tonnage but includes live value. na Not available.Source: ABS, International Trade, Australia, cat. no. 5465.0, Canberra.
E x p o r t s

75
20 Exports of crustaceans and molluscs – Australia 2020 Exports of crustaceans and molluscs - Australia20 Exports of crustaceans and molluscs Australia
2007 08 2008 09 2009 102007–08 2008–09 2009–10
t $’000 t $’000 t $’000$ $ $
Rock lobsterRock lobsterWholeWhole
Li f h hill d 5 884 264 643 6 701 354 090 5 968 325 715Live, fresh or chilled 5 884 264 643 6 701 354 090 5 968 325 715FFrozen 512 16 185 398 12 484 345 14 104Cooked 1 704 52 504 1 255 38 520 641 23 321
Tails (fresh, chilled or frozen) 1 034 63 378 816 52 646 550 34 547Tails (fresh, chilled or frozen) 1 034 63 378 816 52 646 550 34 547Other 362 4 153 392 3 960 224 1 995Other 362 4 153 392 3 960 224 1 995
Total 9 496 400 864 9 561 461 701 7 729 399 682Total 9 496 400 864 9 561 461 701 7 729 399 682
PrawnsPrawnsHeadless 435 5 803 466 7 502 491 4 678Headless 435 5 803 466 7 502 491 4 678Whole 3 869 56 100 3 990 70 680 3 764 53 124Whole 3 869 56 100 3 990 70 680 3 764 53 124Other 611 6 721 340 3 998 404 3 660Other 611 6 721 340 3 998 404 3 660
T lTotal 4 916 68 624 4 797 82 180 4 659 61 461
CrabsCrabsFresh frozen or cooked 1 410 15 663 1 317 16 257 1 048 13 500Fresh, frozen or cooked 1 410 15 663 1 317 16 257 1 048 13 500Other 4 38 7 113 31 301Other 4 38 7 113 31 301
Total 1 414 15 701 1 324 16 370 1 079 13 801Total 1 414 15 701 1 324 16 370 1 079 13 801
AbaloneAbaloneF h hill d fFresh, chilled or frozen 2 148 124 187 2 139 118 896 2 189 133 282Prepared and preserved 1 432 93 031 1 181 89 289 1 449 83 091p p
Total 3 580 217 218 3 320 208 185 3 639 216 373Total 3 580 217 218 3 320 208 185 3 639 216 373
ScallopsScallopsFresh, chilled or frozen 1 127 27 809 1 137 33 252 1 087 29 499Fresh, chilled or frozen 1 127 27 809 1 137 33 252 1 087 29 499Other 0 29 0 1 2 10Other 0 29 0 1 2 10
T t l 1 128 27 838 1 137 33 254 1 089 29 508Total 1 128 27 838 1 137 33 254 1 089 29 508
Other 1 050 10 375 1 056 9 668 1 004 8 477Other 1 050 10 375 1 056 9 668 1 004 8 477
Total crustaceans and molluscs 21 584 740 620 21 194 811 356 19 198 729 302
Source: ABS International Trade Australia cat no 5465 0 CanberraSource: ABS, International Trade, Australia, cat. no. 5465.0, Canberra.Source: ABS, International Trade, Australia, cat. no. 5465.0, Canberra.Source: ABS, International Trade, Australia, cat. no. 5465.0, Canberra.
E x p o r t s

76
21 Exports of edible fish, by destination – Australia 2121 Exports of major edible fish products, by destination - Australia21 Exports of major edible fish products, by destination Australia
2007 08 2008 09 2009 102007–08 2008–09 2009–10
t $’000 t $’000 t $’000$ $ $
TTuna a
Fresh or chilled (whole)Fresh or chilled (whole)France 1 13 5 141 2 24France 1 13 5 141 2 24Japan 2 518 39 103 3 471 58 628 3 625 56 557Japan 2 518 39 103 3 471 58 628 3 625 56 557Samoa 257 694 19 45 0 0Samoa 257 694 19 45 0 0United States 219 2 384 254 2 517 200 2 014United States 219 2 384 254 2 517 200 2 014Vietnam 94 241 0 0 0 0Vietnam 94 241 0 0 0 0Other 145 1 473 287 1 926 82 715Other 145 1 473 287 1 926 82 715
Total 3 234 43 907 4 036 63 258 3 909 59 309Total
Frozen (whole)Frozen (whole)Japan 8 389 157 255 6 429 109 812 4 684 55 728Japan 8 389 157 255 6 429 109 812 4 684 55 728S 389 1 013 369 1 038 0 0Samoa 389 1 013 369 1 038 0 0Thailand 0 0 246 634 441 1 138United States 1 2 11 34 0 4United StatesOther 62 164 209 677 288 834Other 62 164 209 677 288 834
Total 8 840 158 433 7 264 112 194 5 413 57 704Total 8 840 158 433 7 264 112 194 5 413 57 704
SalmonSalmonFresh or chilled (whole)Fresh or chilled (whole)Hong Kong China 90 644 1 195 8 376 511 3 379Hong Kong, China 90 644 1 195 8 376 511 3 379I d i 399 2 192 620 2 964 578 3 307Indonesia 399 2 192 620 2 964 578 3 307J 1 143 9 237 1 060 11 292 1 243 10 852Japan 1 143 9 237 1 060 11 292 1 243 10 852pSingapore 39 242 691 3 302 314 1 904SingaporeThailand 69 461 139 805 83 570Thailand 69 461 139 805 83 570United Arab Emirates 58 441 76 614 36 289United Arab Emirates 58 441 76 614 36 289United States 63 480 171 1 354 117 872United States 63 480 171 1 354 117 872Other 333 2 044 1 947 12 849 737 4 565Other 333 2 044 1 947 12 849 737 4 565
lTotal 2 194 15 741 5 899 41 555 3 620 25 736
Frozen (whole)Frozen (whole)Egypt 0 0 0 0 0 0Egypt 0 0 0 0 0 0Fiji 30 22 1 10 0 0Fiji 30 22 1 10 0 0
Hong Kong, China 0 3 145 642 1 9g g,Indonesia 2 33 26 193 1 11IndonesiaJapan 1 22 7 12 8 22Japan 1 22 7 12 8 22New Zealand 0 8 2 22 1 20New Zealand 0 8 2 22 1 20Thailand 1 18 29 159 19 115Thailand 1 18 29 159 19 115Other 38 510 167 720 34 104Other 38 510 167 720 34 104
lTotal 71 615 375 1 758 63 282
WhitingWhitingF ( h l )Frozen (whole)China 582 1 511 630 1 701 492 1 372
Hong Kong, China 0 0 0 0 0 0Hong Kong, China 0 0 0 0 0 0Japan 0 0 0 0 0 0Japan 0 0 0 0 0 0Samoa 17 52 0 0 0 0Samoa 17 52 0 0 0 0
Singapore 0 0 0 0 0 0Singapore 0 0 0 0 0 0Thailand 692 1 397 729 1 663 777 1 928Thailand 692 1 397 729 1 663 777 1 928Oth 0 0 0 0 36 96Other 0 0 0 0 36 96
Total 1 291 2 960 1 359 3 364 1 305 3 396Total 1 291 2 960 1 359 3 364 1 305 3 396
ContinuedContinued
E x p o r t s

77
21 Exports of edible fish, by destination – Australia continued 2121 Exports of major edible fish products, by destination - Australia contiuned21 Exports of major edible fish products, by destination Australia contiuned
2007 08 2008 09 2009 102007–08 2008–09 2009–10
t $’000 t $’000 t $’000$ $ $
Prepared and preservedPrepared and preservedT naTunaN Z l dNew Zealand 371 1 999 148 892 199 1 285United States 7 59 2 3 0 0Other 121 1 799 70 435 24 154Other 121 1 799 70 435 24 154
Total 499 3 857 219 1 329 223 1 439Total 499 3 857 219 1 329 223 1 439
SalmonSalmonN Z l dNew Zealand 453 2 373 1 10 1 10
dUnited States 5 46 0 0 0 0Other 14 124 4 52 2 22Other 14 124 4 52 2 22
Total 472 2 543 5 62 3 32Total 472 2 543 5 62 3 32
O h f hOther fishNew Zealand 568 2 020 1 724 4 597 82 801Singapore 69 359 43 180 0 47Singapore 69 359 43 180 0 47Other 363 3 781 408 3 616 350 3 239Other 363 3 781 408 3 616 350 3 239
Total 1 001 6 160 2 175 8 393 433 4 087Total 1 001 6 160 2 175 8 393 433 4 087
a Exports of tuna landed in Australia.a Exports of tuna landed in Australia.Source: ABS, International Trade, Australia, cat. no. 5465.0, Canberra.a Exports of tuna landed in Australia.Source: ABS, International Trade, Australia, cat. no. 5465.0, Canberra.a Exports of tuna landed in Australia.Source: ABS, International Trade, Australia, cat. no. 5465.0, Canberra.a Exports of tuna landed in Australia.Source: ABS, International Trade, Australia, cat. no. 5465.0, Canberra.
E x p o r t s

78
22 Exports of crustaceans, by destination – Australia 2222 Exports of crustaceans, by destination - Australia22 Exports of crustaceans, by destination Australia
2007 08 2008 09 2009 102007–08 2008–09 2009–10
t $’000 t $’000 t $’000$ $ $
R k l b tRock lobsterh lWhole
Live, fresh or chilled Live, fresh or chilled China 123 5 648 12 696 1 28China 123 5 648 12 696 1 28Chinese Taipei 197 7 300 242 9 060 108 4 490Chinese Taipei 197 7 300 242 9 060 108 4 490France 68 2 587 69 2 550 59 2 173France 68 2 587 69 2 550 59 2 173Hong Kong China 4 870 223 202 5 806 316 841 5 424 299 983Hong Kong, China 4 870 223 202 5 806 316 841 5 424 299 983Japan 540 22 013 520 22 042 329 16 370Japan 540 22 013 520 22 042 329 16 370M l i 15 736 10 631 11 736Malaysia 15 736 10 631 11 736SiSingapore 22 1 119 21 1 228 12 736g pUnited Arab Emirates 12 510 11 582 9 501United States 12 592 5 230 13 589United States 12 592 5 230 13 589Other 25 936 4 229 2 109Other 25 936 4 229 2 109
Total 5 884 264 643 6 701 354 090 5 968 325 715Total 5 884 264 643 6 701 354 090 5 968 325 715
Frozen Frozen China 16 521 2 58 0 8China 16 521 2 58 0 8Chinese Taipei 60 1 647 58 1 432 53 1 885Chinese Taipei 60 1 647 58 1 432 53 1 885Greece 0 0 0 0 0 0Greece 0 0 0 0 0 0Hong Kong China 45 1 102 87 2 731 119 4 780Hong Kong, China 45 1 102 87 2 731 119 4 780Japan 354 11 562 205 6 620 137 6 026Japan 354 11 562 205 6 620 137 6 026M iti 16 501 9 297 9 246Mauritius 16 501 9 297 9 246
d dUnited Kingdom 9 327 15 605 8 271gOther 14 525 21 742 20 887
Total 512 16 185 398 12 484 345 14 104Total 512 16 185 398 12 484 345 14 104
k dCookedChina 55 1 790 0 0 0 0C a 55 90 0 0 0 0Chinese Taipei 815 23 357 783 23 177 420 15 470Chinese Taipei 815 23 357 783 23 177 420 15 470Hong Kong, China 219 7 350 11 435 5 180Hong Kong, China 219 7 350 11 435 5 180Japan 339 10 819 202 6 237 113 4 174Japan 339 10 819 202 6 237 113 4 174Singapore 180 5 563 102 3 074 44 1 727Singapore 180 5 563 102 3 074 44 1 727Other 96 3 626 156 5 598 59 1 771Other 96 3 626 156 5 598 59 1 771
Total 1 704 52 504 1 255 38 520 641 23 321
TailsTailsFresh chilled or frozenFresh, chilled or frozen
F 10 770 44 2 674 29 1 257France 10 770 44 2 674 29 1 257H K ChiHong Kong, China 16 933 5 269 5 211g gJapan 26 1 411 39 1 941 17 1 270pUnited Kingdom 6 420 0 4 0 0United Kingdom 6 420 0 4 0 0United States 954 58 580 722 47 349 490 31 020United States 954 58 580 722 47 349 490 31 020Other 21 1 263 7 411 10 789Other 21 1 263 7 411 10 789
Total 1 034 63 378 816 52 646 550 34 547Total 1 034 63 378 816 52 646 550 34 547
OtherOtherFrance 12 570 21 863 6 259France 12 570 21 863 6 259Japan 249 2 257 260 1 396 180 903Japan 249 2 257 260 1 396 180 903United Kingom 17 680 9 366 0 0United Kingom 17 680 9 366 0 0U i d SUnited States 7 205 1 54 1 49Other 77 441 100 1 281 37 784
Total 362 4 153 392 3 960 224 1 995Total 362 4 153 392 3 960 224 1 995
Total rock lobster 9 496 400 864 9 561 461 701 7 729 399 682Total rock lobster 9 496 400 864 9 561 461 701 7 729 399 682
ContinuedContinued
E x p o r t s

79
22 Exports of crustaceans, by destination – Australia continued 2222 Exports of crustaceans, by destination - Australia continued22 Exports of crustaceans, by destination Australia continued
2007–08 2008–09 2009–102007–08 2008–09 2009–10t $’000 t $’000 t $’000t $’000 t $’000 t $’000
PPrawnsHeadlessHeadlessGreece 0 0 0 0 0 0Greece 0 0 0 0 0 0Japan 66 1 549 106 2 790 19 439Japan 66 1 549 106 2 790 19 439Malaysia 81 1 032 183 2 213 48 513Malaysia 81 1 032 183 2 213 48 513New Zealand 3 60 4 66 35 337New Zealand 3 60 4 66 35 337United States 0 0 0 2 2 48United States 0 0 0 2 2 48Vi t 138 1 136 9 115 6 49Vietnam 138 1 136 9 115 6 49Oth 148 2 026 165 2 316 381 3 291Other 148 2 026 165 2 316 381 3 291
Total 435 5 803 466 7 502 491 4 678
WholeWholeChina 430 4 145 608 6 400 543 5 207China 430 4 145 608 6 400 543 5 207Greece 185 3 611 37 482 21 350Greece 185 3 611 37 482 21 350Hong Kong China 425 5 959 625 10 197 518 6 450Hong Kong, China 425 5 959 625 10 197 518 6 450Italy 18 179 0 0 0 0Italy 18 179 0 0 0 0JJapan 1 702 29 888 1 923 43 595 1 821 30 918
lPortugal 0 0 0 0 0 0gSpain 331 3 424 288 2 657 142 1 613Spain 331 3 424 288 2 657 142 1 613Thailand 105 1 093 113 2 019 48 654Thailand 105 1 093 113 2 019 48 654United States 7 86 9 96 9 180United States 7 86 9 96 9 180Vietnam 317 3 868 64 827 161 2 209Vietnam 317 3 868 64 827 161 2 209Other 349 3 847 321 4 407 501 5 543Other 349 3 847 321 4 407 501 5 543
T t l 3 869 56 100 3 990 70 680 3 764 53 124Total 3 869 56 100 3 990 70 680 3 764 53 124
OtherOtherFrance 0 0 0 0 0 0France 0 0 0 0 0 0Germany 14 323 15 461 4 92Germany 14 323 15 461 4 92Hong Kong China 2 47 19 205 40 401Hong Kong, China 2 47 19 205 40 401New Zealand 45 603 36 309 4 48New Zealand 45 603 36 309 4 48Singapore 25 222 25 261 0 6Singapore 25 222 25 261 0 6Oth 26 26 2 2 62 3 3Other 526 5 526 245 2 762 357 3 114Total 611 6 721 340 3 998 404 3 660
Total prawns 4 916 68 624 4 797 82 180 4 659 61 461Total prawns 4 916 68 624 4 797 82 180 4 659 61 461
CrabsCrabsFresh frozen or cookedFresh, frozen or cookedChina 212 4 218 213 4 142 167 4 268China 212 4 218 213 4 142 167 4 268Chi T i i 582 3 914 548 4 378 286 2 000Chinese Taipei 582 3 914 548 4 378 286 2 000H K ChiHong Kong, China 243 3 059 240 3 237 192 2 833g gJapan 190 1 696 182 1 923 183 1 899pSingapore 24 745 16 627 17 669Singapore 24 745 16 627 17 669United States 23 482 22 666 16 340United States 23 482 22 666 16 340Other 136 1 549 96 1 283 188 1 490Other 136 1 549 96 1 283 188 1 490
Total 1 410 15 663 1 317 16 257 1 048 13 500Total 1 410 15 663 1 317 16 257 1 048 13 500Other crabs 4 38 7 113 31 301Other crabs 4 38 7 113 31 301
l bTotal crabs 1 414 15 701 1 324 16 370 1 079 13 801
Other crustaceansOther crustaceansChina 1 29 0 16 0 0China 1 29 0 16 0 0Chinese Taipei 0 0 3 80 0 0Chinese Taipei 0 0 3 80 0 0Hong Kong China 45 2 063 14 703 8 457Hong Kong, China 45 2 063 14 703 8 457Japan 1 51 1 50 5 83Japan 1 51 1 50 5 83Other 39 888 18 663 32 1 188Other 39 888 18 663 32 1 188
lTotal 86 3 031 37 1 511 45 1 728Total crustaceans 15 912 488 219 15 718 561 761 13 512 476 672Total crustaceans 15 912 488 219 15 718 561 761 13 512 476 672
Source: ABS International Trade Australia cat no 5465 0 CanberraSource: ABS, International Trade, Australia, cat. no. 5465.0, Canberra.Source: ABS, International Trade, Australia, cat. no. 5465.0, Canberra.Source: ABS, International Trade, Australia, cat. no. 5465.0, Canberra.
E x p o r t s

80
23 Exports of molluscs, by destination – Australia 2323 Exports of molluscs, by destination - Australia23 Exports of molluscs, by destination Australia
2006-07 2007-08 2008-092006-07 2007-08 2008-09
t $’000 t $’000 t $’000t $’000 t $’000 t $’000
AbaloneAbaloneFresh chilled or frozenFresh, chilled or frozen Canada 12 1 588 14 1 723 9 1 218Canada 12 1 588 14 1 723 9 1 218China 271 14 255 111 5 736 210 10 512China 271 14 255 111 5 736 210 10 512
Chi T i iChinese Taipei 44 2 301 34 1 483 31 1 457
Hong Kong, China 1 492 94 240 1 545 89 809 1 604 88 393Hong Kong, ChinaJapan 391 24 057 381 21 978 258 15 278Japan 391 24 057 381 21 978 258 15 278
Singapore 15 1 121 23 1 409 11 748Singapore 15 1 121 23 1 409 11 748Oth 16 1 479 41 2 049 15 1 291Other 16 1 479 41 2 049 15 1 291
Total 2 241 139 041 2 148 124 187 2 139 118 896Total
Prepared and preservedPrepared and preservedChi T i i 134 7 836 66 3 971 43 3 252Chinese Taipei 134 7 836 66 3 971 43 3 252
Hong Kong, China 883 54 819 732 49 462 593 47 224g g,Japan 229 16 546 183 12 096 127 8 683Japan 229 16 546 183 12 096 127 8 683
Singapore 324 20 861 339 20 309 321 22 610Singapore 324 20 861 339 20 309 321 22 610United States 39 3 174 41 2 608 27 2 072United States 39 3 174 41 2 608 27 2 072O h 61 3 750 70 4 585 70 5 448Other 61 3 750 70 4 585 70 5 448
Total 1 670 106 987 1 432 93 031 1 181 89 289Total 9 9 9 9
Total abalone 3 911 246 028 3 580 217 218 3 320 208 185Total abalone 3 911 246 028 3 580 217 218 3 320 208 185
S llScallopspFresh, chilled or frozenFresh, chilled or frozenChina 24 445 26 611 26 627China 24 445 26 611 26 627France 187 4 551 0 0 0 0France 187 4 551 0 0 0 0
Hong Kong China 799 21 042 736 18 461 730 21 796Hong Kong, China 799 21 042 736 18 461 730 21 796
M l i 47 1 130 86 1 909 70 1 927Malaysia 47 1 130 86 1 909 70 1 927
Singapore 274 7 278 254 6 225 284 8 360Singapore 8 5 6 5 8 8 360Other 70 967 25 603 27 543Other 70 967 25 603 27 543
Total 1 401 35 414 1 127 27 809 1 137 33 252Total 1 401 35 414 1 127 27 809 1 137 33 252
O h llOther scallops 0 3 0 29 0 1p
Total scallops 1 401 35 417 1 128 27 838 1 137 33 254Total scallops 1 401 35 417 1 128 27 838 1 137 33 254
Other molluscsOther molluscsC d 118 609 33 94 65 506Canada 118 609 33 94 65 506Chi 347 657 110 90 89 166China 347 657 110 90 89 166Chinese Taipei 8 102 26 250 1 18pHong Kong, China 660 8 193 473 3 529 442 3 197Hong Kong, China 660 8 193 473 3 529 442 3 197
Japan 57 842 157 1 574 190 2 723Japan 57 842 157 1 574 190 2 723
Singapore 24 558 80 951 124 928Singapore 24 558 80 951 124 928
M lMalaysia 0 0 0 108 5 41yOther 255 1 084 85 749 104 578OtherTotal 1 468 12 045 964 7 344 1 019 8 156Total 1 468 12 045 964 7 344 1 019 8 156
Total molluscs 6 780 293 489 5 672 252 401 5 476 249 595Total molluscs 6 780 293 489 5 672 252 401 5 476 249 595
Source:ABS, International Trade,Australia, cat no 5465 0, CanberraSource:ABS, International Trade,Australia, cat. no. 5465.0, Canberra.Source:ABS, International Trade,Australia, cat. no. 5465.0, Canberra.Source:ABS, International Trade,Australia, cat. no. 5465.0, Canberra.Source:ABS, International Trade,Australia, cat. no. 5465.0, Canberra.
E x p o r t s

81
24 Exports of fisheries products, by destination – Australia 2424 Exports fisheries products, by destination - Australia24 Exports fisheries products, by destination Australia
2007 08 2008 09 2009 102007–08 2008–09 2009–10
t $’000 t $’000 t $’000$ $ $
Edible (e cl ding li e)Edible (excluding live)C dCanada 88 3 364 97 2 860 78 2 879China 1 849 26 089 2 575 29 796 2 204 43 498Chinese Taipei 2 140 44 739 2 989 53 744 1 529 32 512Chinese Taipei 2 140 44 739 2 989 53 744 1 529 32 512France 300 7 518 519 12 946 415 6 659France 300 7 518 519 12 946 415 6 659Greece 186 3 651 45 714 29 468Greece 186 3 651 45 714 29 468Hong Kong China 10 059 425 795 12 113 525 286 10 752 490 745Hong Kong, China 10 059 425 795 12 113 525 286 10 752 490 745Indonesia 557 3 882 730 4 557 962 6 801Indonesia 557 3 882 730 4 557 962 6 801Italy 60 1 010 184 2 229 313 3 523Italy 60 1 010 184 2 229 313 3 523J 16 652 328 252 15 599 302 258 13 489 215 472Japan 16 652 328 252 15 599 302 258 13 489 215 472M l iMalaysia 378 7 977 784 12 545 570 9 015yNew Zealand 2 453 12 590 2 176 9 154 1 525 16 845Portugal 0 0 18 218 1 9Portugal 0 0 18 218 1 9Singapore 1 255 40 398 1 815 43 713 1 322 37 533Singapore 1 255 40 398 1 815 43 713 1 322 37 533Spain 431 4 130 545 4 207 263 2 120Spain 431 4 130 545 4 207 263 2 120Thailand 1 293 7 675 1 506 7 328 1 937 8 995Thailand 1 293 7 675 1 506 7 328 1 937 8 995United Kingdom 73 2 204 79 1 489 61 924United Kingdom 73 2 204 79 1 489 61 924United States 1 774 72 135 1 927 64 403 1 755 48 949United States 1 774 72 135 1 927 64 403 1 755 48 949Vi t 885 7 718 451 3 249 647 4 305Vietnam 885 7 718 451 3 249 647 4 305O hOther 3 562 23 461 2 748 18 168 2 115 16 010
Total 43 998 1 022 588 46 901 1 098 865 39 968 947 263Total 43 998 1 022 588 46 901 1 098 865 39 968 947 263
N diblNonediblehChina na 800 na 1 360 na 646
Chinese Taipei na 84 na 712 na 421C ese a pe a 8 a aFrance na 7 336 na 547 na 1 580France na 7 336 na 547 na 1 580Germany na 3 719 na 3 132 na 834Germany na 3 719 na 3 132 na 834Hong Kong China na 128 093 na 200 989 na 137 763Hong Kong, China na 128 093 na 200 989 na 137 763Indonesia na 974 na 224 na 129Indonesia na 974 na 224 na 129Italy na 1 304 na 3 033 na 1 027Italy na 1 304 na 3 033 na 1 027Japan 53 333 64 284 49 836Japan na 53 333 na 64 284 na 49 836K R fKorea, Rep. of na 1 009 na 1 019 na 1 018New Zealand na 2 287 na 1 836 na 2 531Singapore na 2 446 na 825 na 1 878Singapore na 2 446 na 825 na 1 878Spain na 3 092 na 969 na 248Spain na 3 092 na 969 na 248Thailand na 3 623 na 1 414 na 1 993Thailand na 3 623 na 1 414 na 1 993United Arab Emirates na 4 053 na 17 693 na 3 480United Arab Emirates na 4 053 na 17 693 na 3 480United Kingdom na 1 209 na 2 772 na 725United Kingdom na 1 209 na 2 772 na 725United States na 24 225 na 22 151 na 15 466United States na 24 225 na 22 151 na 15 466Vi t 1 271 572 1 155Vietnam na 1 271 na 572 na 1 155O hOther na 37 420 na 60 483 na 38 243
Total na 276 277 na 384 014 na 258 974Total na 276 277 na 384 014 na 258 974
T t l t 1 298 865 1 482 878 1 206 237Total exports na 1 298 865 na 1 482 878 na 1 206 237
na Not available.na Not available.Source: ABS, International Trade, Australia, cat. no. 5465.0, Canberra.na Not available.Source: ABS, International Trade, Australia, cat. no. 5465.0, Canberra.na Not available.Source: ABS, International Trade, Australia, cat. no. 5465.0, Canberra.
E x p o r t s

82
25 Exports of seafood to selected countries, by product – Australia a 2525 Exports of seafood to selected countries, by product - Australia a25 Exports of seafood to selected countries, by product Australia a
2007 08 2008 09 2009 102007–08 2008–09 2009–10
t $’000 t $’000 t $’000$ $ $
Hong Kong ChinaHong Kong, ChinaDried salted or smoked fish 104 13 537 139 15 737 124 11 602Dried, salted or smoked fish 104 13 537 139 15 737 124 11 602Oth fi h 539 6 490 1 672 13 066 815 7 261Other fish 539 6 490 1 672 13 066 815 7 261R k l bRock lobster 5 182 232 680 5 933 320 357 5 573 305 848Prawns 462 6 708 745 11 574 866 9 605Crabs 243 3 059 240 3 240 192 2 836Crabs 243 3 059 240 3 240 192 2 836Abalone 2 276 139 271 2 197 135 616 2 112 131 590Abalone 2 276 139 271 2 197 135 616 2 112 131 590Scallops 736 18 461 730 21 796 667 18 644Scallops 736 18 461 730 21 796 667 18 644Other 518 5 591 456 3 899 403 3 359Other 518 5 591 456 3 899 403 3 359
T lTotal 10 059 425 795 12 113 525 286 10 752 490 745
JapanJapanTuna (whole) 10 907 196 358 9 901 168 441 8 310 112 284Tuna (whole) 10 907 196 358 9 901 168 441 8 310 112 284Fillets 32 317 5 125 65 446Fillets 32 317 5 125 65 446Dried salted or smoked fish 14 297 1 0 1 43Dried, salted or smoked fish 14 297 1 0 1 43O h fi hOther fish 1 488 13 975 1 676 20 317 1 858 18 164Rock lobster 1 508 48 062 1 226 38 236 776 28 743Prawns 1 792 31 848 2 033 46 477 1 843 31 406Prawns 1 792 31 848 2 033 46 477 1 843 31 406Crabs 190 1 696 182 1 923 183 1 899Crabs 190 1 696 182 1 923 183 1 899Abalone 563 34 074 385 23 962 395 21 730Abalone 563 34 074 385 23 962 395 21 730Scallops 0 0 0 4 0 0Scallops 0 0 0 4 0 0Other 158 1 625 191 2 773 59 756Other 158 1 625 191 2 773 59 756
T lTotal 16 652 328 252 15 599 302 258 13 489 215 472
SingaporeSingaporeTuna (whole) 14 329 0 3 2 47Tuna (whole) 14 329 0 3 2 47Fillets 8 132 65 416 12 144Fillets 8 132 65 416 12 144D i d lt d k d fi h 2 261 2 355 5 576Dried, salted or smoked fish 2 261 2 355 5 576P d d d f hPrepared and preserved fish 73 382 47 227 0 47p pOther fish 134 1 437 777 4 268 418 3 009Rock lobster 212 7 097 137 4 731 59 2 581Rock lobster 212 7 097 137 4 731 59 2 581Prawns 89 952 28 310 3 41Prawns 89 952 28 310 3 41Crabs 24 745 16 627 17 669Crabs 24 745 16 627 17 669Abalone 362 21 718 331 23 358 419 21 518Abalone 362 21 718 331 23 358 419 21 518Scallops 255 6 253 284 8 360 293 8 118Scallops 255 6 253 284 8 360 293 8 118Other 83 1 094 126 1 058 95 782Other 83 1 094 126 1 058 95 782
Total 1 255 40 398 1 815 43 713 1 322 37 533Total 1 255 40 398 1 815 43 713 1 322 37 533
C i dContinued
E x p o r t s
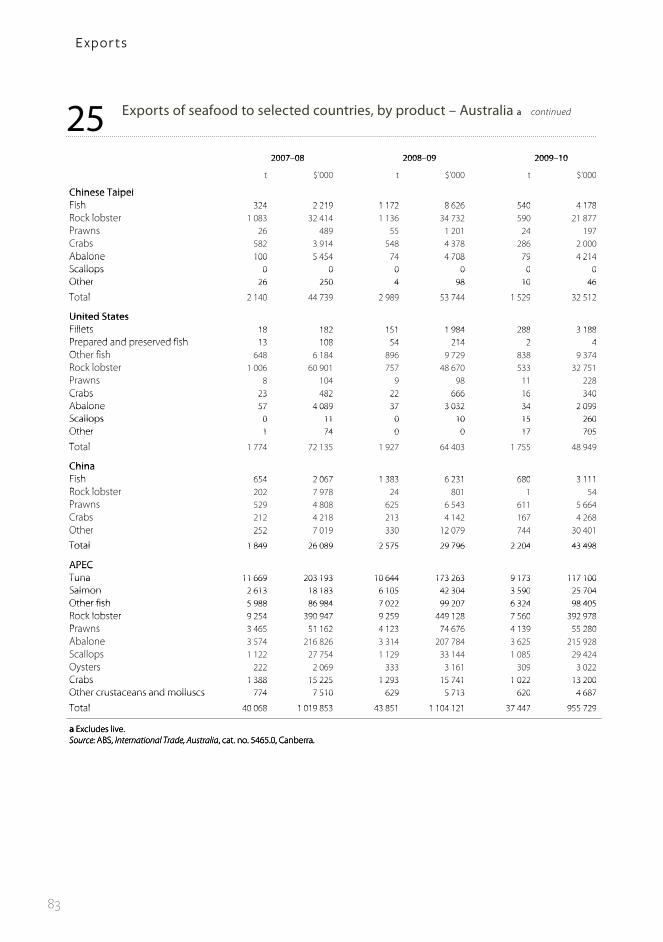
83
2525 Exports of seafood to selected countries, by product - Australia a continued25 Exports of seafood to selected countries, by product Australia a continued
2007 08 2008 09 2009 102007–08 2008–09 2009–10
t $’000 t $’000 t $’000$ $ $
Chinese TaipeiChinese TaipeiFish 324 2 219 1 172 8 626 540 4 178Fish 324 2 219 1 172 8 626 540 4 178R k l b t 1 083 32 414 1 136 34 732 590 21 877Rock lobster 1 083 32 414 1 136 34 732 590 21 877PPrawns 26 489 55 1 201 24 197Crabs 582 3 914 548 4 378 286 2 000Abalone 100 5 454 74 4 708 79 4 214Abalone 100 5 454 74 4 708 79 4 214Scallops 0 0 0 0 0 0Scallops 0 0 0 0 0 0Other 26 250 4 98 10 46Other 26 250 4 98 10 46
Total 2 140 44 739 2 989 53 744 1 529 32 512Total 2 140 44 739 2 989 53 744 1 529 32 512
United StatesUnited StatesFillets 18 182 151 1 984 288 3 188Fillets 18 182 151 1 984 288 3 188Prepared and preserved fish 13 108 54 214 2 4Prepared and preserved fish 13 108 54 214 2 4Oth fi h 648 6 184 896 9 729 838 9 374Other fish 648 6 184 896 9 729 838 9 374R k l bRock lobster 1 006 60 901 757 48 670 533 32 751Prawns 8 104 9 98 11 228Crabs 23 482 22 666 16 340Crabs 23 482 22 666 16 340Abalone 57 4 089 37 3 032 34 2 099Abalone 57 4 089 37 3 032 34 2 099Scallops 0 11 0 10 15 260Scallops 0 11 0 10 15 260Other 1 74 0 0 17 705Other 1 74 0 0 17 705
T t l 2 3 92 6 03 8 9 9Total 1 774 72 135 1 927 64 403 1 755 48 949
ChinaChinaFish 654 2 067 1 383 6 231 680 3 111Fish 654 2 067 1 383 6 231 680 3 111R k l b t 202 7 978 24 801 1 54Rock lobster 202 7 978 24 801 1 54PPrawns 529 4 808 625 6 543 611 5 664Crabs 212 4 218 213 4 142 167 4 268Other 252 7 019 330 12 079 744 30 401Other 252 7 019 330 12 079 744 30 401
Total 1 849 26 089 2 575 29 796 2 204 43 498Total 1 849 26 089 2 575 29 796 2 204 43 498
APECAPECTuna 11 669 203 193 10 644 173 263 9 173 117 100Tuna 11 669 203 193 10 644 173 263 9 173 117 100Salmon 2 613 18 183 6 105 42 304 3 590 25 704Salmon 2 613 18 183 6 105 42 304 3 590 25 704Other fish 5 988 86 984 7 022 99 207 6 324 98 405Other fish 5 988 86 984 7 022 99 207 6 324 98 405Rock lobster 9 254 390 947 9 259 449 128 7 560 392 978Rock lobster 9 254 390 947 9 259 449 128 7 560 392 978Prawns 3 465 51 162 4 123 74 676 4 139 55 280Prawns 3 465 51 162 4 123 74 676 4 139 55 280Ab lAbalone 3 574 216 826 3 314 207 784 3 625 215 928Scallops 1 122 27 754 1 129 33 144 1 085 29 424pOysters 222 2 069 333 3 161 309 3 022Oysters 222 2 069 333 3 161 309 3 022Crabs 1 388 15 225 1 293 15 741 1 022 13 200Crabs 1 388 15 225 1 293 15 741 1 022 13 200Other crustaceans and molluscs 774 7 510 629 5 713 620 4 687Other crustaceans and molluscs 774 7 510 629 5 713 620 4 687
Total 40 068 1 019 853 43 851 1 104 121 37 447 955 729Total 40 068 1 019 853 43 851 1 104 121 37 447 955 729
a Excludes livea Excludes live.Source: ABS, International Trade, Australia, cat. no. 5465.0, Canberra.a Excludes live.Source: ABS, International Trade, Australia, cat. no. 5465.0, Canberra.a Excludes live.Source: ABS, International Trade, Australia, cat. no. 5465.0, Canberra.Source: ABS, International Trade, Australia, cat. no. 5465.0, Canberra.
25 Exports of seafood to selected countries, by product – Australia a continued
E x p o r t s

84
26 Seafood exports in 2007–08, by state – Australia a 2626 Seafood exports in 2007–08, by state - Australia a26 Seafood exports in 2007 08, by state Australia a
NSW Vic Qld WA SA Tas NT Aust bNSW Vic. Qld WA SA Tas. NT Aust. b
V lValue $’000 $’000 $’000 $’000 $’000 $’000 $’000 $’000
Fish Fish Live 962 1 517 40 029 3 0 317 0 42 827Live 962 1 517 40 029 3 0 317 0 42 827Fresh, chilled or frozenFresh, chilled or frozen
Whole 4 588 1 158 18 011 835 193 010 16 665 209 238 924Whole 4 588 1 158 18 011 835 193 010 16 665 209 238 924Fillets 299 400 163 2 1 339 2 890 0 5 695Fillets 299 400 163 2 1 339 2 890 0 5 695
Other 4 964 7 740 17 291 1 146 248 761 139 37 350Other 4 964 7 740 17 291 1 146 248 761 139 37 350
Total fish 10 813 10 815 75 494 1 987 194 598 20 632 348 324 795
Crustaceans and molluscsCrustaceans and molluscsR k l b t 6 6 20 6 22 9 683 33 3 0 00 86Rock lobster 4 616 17 477 20 651 227 411 94 683 33 355 0 400 864Prawns 4 888 133 37 387 13 355 1 764 0 0 68 624Abalone 3 317 67 814 1 404 7 080 45 410 91 400 0 217 218Abalone 3 317 67 814 1 404 7 080 45 410 91 400 0 217 218Scallops 487 40 15 330 11 502 352 0 0 27 838Scallops 487 40 15 330 11 502 352 0 0 27 838Oysters 74 69 0 10 1 220 712 0 2 133Oysters 74 69 0 10 1 220 712 0 2 133Crabs 32 1 901 8 649 4 151 471 406 0 15 701Crabs 32 1 901 8 649 4 151 471 406 0 15 701Other 334 3 464 1 892 994 164 538 0 8 243Other 334 3 464 1 892 994 164 538 0 8 243
T lTotal 13 748 90 898 85 312 264 502 144 065 126 412 0 740 620
Total value 24 562 101 713 160 806 266 489 338 663 147 045 348 1 065 415Total value 24 562 101 713 160 806 266 489 338 663 147 045 348 1 065 415
Quantity t t t t t t t tQuantity t t t t t t t t
FishFish Live na na na na na na na naLive na na na na na na na naFresh chilled or frozenFresh, chilled or frozen
Whole 810 155 3 253 134 10 261 2 309 31 18 413Whole 810 155 3 253 134 10 261 2 309 31 18 413Fill t 29 38 33 0 75 752 0 1 016Fillets 29 38 33 0 75 752 0 1 016
O hOther 664 1 003 378 332 24 57 1 2 986
Total fish 1 503 1 195 3 664 466 10 360 3 119 32 22 414Total fish 1 503 1 195 3 664 466 10 360 3 119 32 22 414
C d llCrustaceans and molluscsk l bRock lobster 90 379 407 6 060 1 877 623 0 9 496
Prawns 298 11 2 357 979 97 0 0 4 916a s 98 35 9 9 9 0 0 9 6Abalone 65 1 149 11 78 578 1 679 0 3 580Abalone 65 1 149 11 78 578 1 679 0 3 580Scallops 18 1 610 475 15 0 0 1 128Scallops 18 1 610 475 15 0 0 1 128Oysters 8 7 0 1 139 66 0 228Oysters 8 7 0 1 139 66 0 228Crabs 1 44 1 088 252 10 9 0 1 414Crabs 1 44 1 088 252 10 9 0 1 414Other 13 459 171 29 18 33 0 822Other 13 459 171 29 18 33 0 822
Total 494 2 050 4 643 7 874 2 733 2 409 0 21 584
Total quantity 1 997 3 246 8 307 8 340 13 093 5 527 32 43 998Total quantity 1 997 3 246 8 307 8 340 13 093 5 527 32 43 998
a State totals include Commonwealth fisheries exports. Exports are identified according to source state or territory, not state or territory in a State totals include Commonwealth fisheries exports. Exports are identified according to source state or territory, not state or territory in which the product was caught or farmed. b Includes Australian Capital Territory. na Not available.a State totals include Commonwealth fisheries exports. Exports are identified according to source state or territory, not state or territory in which the product was caught or farmed. b Includes Australian Capital Territory. na Not available.Source: ABS, International Trade, Australia, cat. no. 5465.0, Canberra.
a State totals include Commonwealth fisheries exports. Exports are identified according to source state or territory, not state or territory in which the product was caught or farmed. b Includes Australian Capital Territory. na Not available.Source: ABS, International Trade, Australia, cat. no. 5465.0, Canberra.
a State totals include Commonwealth fisheries exports. Exports are identified according to source state or territory, not state or territory in which the product was caught or farmed. b Includes Australian Capital Territory. na Not available.Source: ABS, International Trade, Australia, cat. no. 5465.0, Canberra.
a State totals include Commonwealth fisheries exports. Exports are identified according to source state or territory, not state or territory in which the product was caught or farmed. b Includes Australian Capital Territory. na Not available.Source: ABS, International Trade, Australia, cat. no. 5465.0, Canberra.
a State totals include Commonwealth fisheries exports. Exports are identified according to source state or territory, not state or territory in which the product was caught or farmed. b Includes Australian Capital Territory. na Not available.Source: ABS, International Trade, Australia, cat. no. 5465.0, Canberra.
E x p o r t s

85
27 Seafood exports in 2008–09, by state – Australia a 2727 Seafood exports in 2008–09, by state - Australia a27 Seafood exports in 2008 09, by state Australia a
NSW Vic Qld WA SA Tas NT Aust bNSW Vic. Qld WA SA Tas. NT Aust. b
V lValue $’000 $’000 $’000 $’000 $’000 $’000 $’000 $’000
Fish Fish Live 720 1 027 44 094 0 36 552 0 46 483Live 720 1 027 44 094 0 36 552 0 46 483Fresh, chilled or frozenFresh, chilled or frozen
Whole 5 252 1 078 22 226 935 169 544 44 941 96 246 880Whole 5 252 1 078 22 226 935 169 544 44 941 96 246 880Fillets 131 1 108 346 5 1 285 1 308 0 4 820Fillets 131 1 108 346 5 1 285 1 308 0 4 820
Other 4 448 7 667 18 368 698 85 860 180 35 808Other 4 448 7 667 18 368 698 85 860 180 35 808
Total fish 10 551 10 880 85 034 1 639 170 949 47 662 276 333 992
Crustaceans and molluscsCrustaceans and molluscsRock lobster 7 649 23 583 18 997 250 756 113 785 44 787 0 461 701Rock lobster 7 649 23 583 18 997 250 756 113 785 44 787 0 461 701P 8 180 12 45 871 19 569 585 0 0 82 180Prawns 8 180 12 45 871 19 569 585 0 0 82 180Ab lAbalone 2 664 56 930 2 707 8 866 41 377 94 665 0 208 185Scallops 177 0 15 279 16 642 918 0 0 33 254pOysters 93 36 1 310 2 305 420 0 3 278Oysters 93 36 1 310 2 305 420 0 3 278Crabs 57 2 122 9 608 3 617 206 424 0 16 370Crabs 57 2 122 9 608 3 617 206 424 0 16 370Other 176 2 506 1 723 813 418 391 0 6 390Other 176 2 506 1 723 813 418 391 0 6 390
Total 18 995 85 189 94 184 300 574 159 594 140 687 0 811 356Total 18 995 85 189 94 184 300 574 159 594 140 687 0 811 356
Total value 29 545 96 069 179 218 302 213 330 544 188 348 276 1 145 348Total value 29 545 96 069 179 218 302 213 330 544 188 348 276 1 145 348
Quantity t t t t t t t tQuantity t t t t t t t t
FishFish Live na na na na na na na naLive na na na na na na na naFresh chilled or frozenFresh, chilled or frozen
Whole 823 152 3 643 179 9 705 6 415 23 21 829Whole 823 152 3 643 179 9 705 6 415 23 21 829Fillets 13 113 31 5 72 159 0 497Fillets 13 113 31 5 72 159 0 497
Oth 579 1 650 282 248 9 151 3 3 380Other 579 1 650 282 248 9 151 3 3 380
Total fish 1 415 1 915 3 957 431 9 786 6 726 26 25 707Total fish 1 415 1 915 3 957 431 9 786 6 726 26 25 707
C t d llCrustaceans and molluscsR k l b t 114 359 348 6 415 1 596 687 0 9 561Rock lobster 114 359 348 6 415 1 596 687 0 9 561PPrawns 461 1 2 500 1 086 51 0 0 4 797Abalone 51 866 21 92 441 1 836 0 3 320Scallops 4 0 458 619 38 0 0 1 137Scallops 4 0 458 619 38 0 0 1 137Oysters 11 3 0 17 255 48 0 346Oysters 11 3 0 17 255 48 0 346Crabs 4 37 1 016 189 3 7 0 1 324Crabs 4 37 1 016 189 3 7 0 1 324Other 25 356 147 35 78 29 0 709Other 25 356 147 35 78 29 0 709
T t l 6 0 622 90 8 2 62 2 606 0 2 9Total 670 1 622 4 490 8 454 2 462 2 606 0 21 194
Total quantity 2 085 3 536 8 447 8 885 12 248 9 332 26 46 901Total quantity 2 085 3 536 8 447 8 885 12 248 9 332 26 46 901
a State totals include Commonwealth fisheries exports. Exports are identified according to source state or territory, not state or territory in a State totals include Commonwealth fisheries exports. Exports are identified according to source state or territory, not state or territory in which the product was caught or farmed. b Includes Australian Capital Territory. na Not available.a State totals include Commonwealth fisheries exports. Exports are identified according to source state or territory, not state or territory in which the product was caught or farmed. b Includes Australian Capital Territory. na Not available.a State totals include Commonwealth fisheries exports. Exports are identified according to source state or territory, not state or territory in which the product was caught or farmed. b Includes Australian Capital Territory. na Not available.Source: ABS, International Trade, Australia, cat. no. 5465.0, Canberra.
a State totals include Commonwealth fisheries exports. Exports are identified according to source state or territory, not state or territory in which the product was caught or farmed. b Includes Australian Capital Territory. na Not available.Source: ABS, International Trade, Australia, cat. no. 5465.0, Canberra.
a State totals include Commonwealth fisheries exports. Exports are identified according to source state or territory, not state or territory in which the product was caught or farmed. b Includes Australian Capital Territory. na Not available.Source: ABS, International Trade, Australia, cat. no. 5465.0, Canberra.
a State totals include Commonwealth fisheries exports. Exports are identified according to source state or territory, not state or territory in which the product was caught or farmed. b Includes Australian Capital Territory. na Not available.Source: ABS, International Trade, Australia, cat. no. 5465.0, Canberra.
a State totals include Commonwealth fisheries exports. Exports are identified according to source state or territory, not state or territory in which the product was caught or farmed. b Includes Australian Capital Territory. na Not available.Source: ABS, International Trade, Australia, cat. no. 5465.0, Canberra.
E x p o r t s

86
28 Seafood exports in 2009–10, by state – Australia a 2828 Seafood exports in 2009–10, by state - Australia a28 Seafood exports in 2009 10, by state Australia a
NSW Vic Qld WA SA Tas NT Aust bNSW Vic. Qld WA SA Tas. NT Aust. b
V lValue $’000 $’000 $’000 $’000 $’000 $’000 $’000 $’000
Fish Fish Live 955 504 38 640 7 0 329 0 40 435Live 955 504 38 640 7 0 329 0 40 435Fresh, chilled or frozenFresh, chilled or frozen
Whole 6 427 1 100 18 672 2 373 115 694 28 027 12 173 562Whole 6 427 1 100 18 672 2 373 115 694 28 027 12 173 562Fillets 119 563 601 83 3 398 5 067 0 10 298Fillets 119 563 601 83 3 398 5 067 0 10 298
Other 2 406 6 064 12 548 594 135 9 678 0 34 101Other 2 406 6 064 12 548 594 135 9 678 0 34 101
Total fish 9 907 8 232 70 461 3 057 119 228 43 101 12 258 396
Crustaceans and molluscsCrustaceans and molluscsRock lobster 5 275 21 916 20 554 225 192 91 965 33 503 0 399 682Rock lobster 5 275 21 916 20 554 225 192 91 965 33 503 0 399 682P 4 645 83 33 694 10 453 101 0 0 61 461Prawns 4 645 83 33 694 10 453 101 0 0 61 461Ab lAbalone 1 978 54 548 1 797 9 188 43 856 104 965 0 216 373Scallops 77 136 14 995 13 771 1 7 0 29 508pOysters 60 68 3 9 2 132 254 3 3 138Oysters 60 68 3 9 2 132 254 3 3 138Crabs 17 1 595 6 919 3 811 461 448 0 13 801Crabs 17 1 595 6 919 3 811 461 448 0 13 801Other 43 767 1 666 1 100 665 497 0 5 338Other 43 767 1 666 1 100 665 497 0 5 338
Total 12 097 79 113 79 629 263 523 139 181 139 673 3 729 302Total 12 097 79 113 79 629 263 523 139 181 139 673 3 729 302
Total value 22 005 87 345 150 090 266 581 258 409 182 775 15 987 698Total value 22 005 87 345 150 090 266 581 258 409 182 775 15 987 698
Quantity t t t t t t t tQuantity t t t t t t t t
FishFish Live na na na na na na na naLive na na na na na na na naFresh chilled or frozenFresh, chilled or frozen
Whole 853 149 3 608 393 8 415 4 001 1 17 710Whole 853 149 3 608 393 8 415 4 001 1 17 710Fillets 11 39 40 10 174 677 0 1 025Fillets 11 39 40 10 174 677 0 1 025
Oth 104 420 178 138 4 727 0 2 035Other 104 420 178 138 4 727 0 2 035
Total fish 968 608 3 826 541 8 594 5 405 1 20 769Total fish 968 608 3 826 541 8 594 5 405 1 20 769
C t d llCrustaceans and molluscsR k l b t 83 350 405 4 953 1 380 527 0 7 729Rock lobster 83 350 405 4 953 1 380 527 0 7 729PPrawns 313 7 2 177 768 7 0 0 4 659Abalone 44 984 18 145 543 1 898 0 3 639Scallops 3 11 532 502 0 1 0 1 089Scallops 3 11 532 502 0 1 0 1 089Oysters 7 5 0 1 217 26 0 320Oysters 7 5 0 1 217 26 0 320Crabs 1 29 709 268 7 7 0 1 079Crabs 1 29 709 268 7 7 0 1 079Other 3 266 168 31 95 14 0 684Other 3 266 168 31 95 14 0 684
T t l 3 6 2 009 6 66 2 2 9 2 3 0 9 98Total 453 1 652 4 009 6 667 2 249 2 473 0 19 198
Total quantity 1 422 2 260 7 834 7 208 10 843 7 878 1 39 968Total quantity 1 422 2 260 7 834 7 208 10 843 7 878 1 39 968
a State totals include Commonwealth fisheries exports. Exports are identified according to source state or territory, not state or territory in a State totals include Commonwealth fisheries exports. Exports are identified according to source state or territory, not state or territory in which the product was caught or farmed. b Includes Australian Capital Territory. na Not available.a State totals include Commonwealth fisheries exports. Exports are identified according to source state or territory, not state or territory in which the product was caught or farmed. b Includes Australian Capital Territory. na Not available.a State totals include Commonwealth fisheries exports. Exports are identified according to source state or territory, not state or territory in which the product was caught or farmed. b Includes Australian Capital Territory. na Not available.Source: ABS, International Trade, Australia, cat. no. 5465.0, Canberra.
a State totals include Commonwealth fisheries exports. Exports are identified according to source state or territory, not state or territory in which the product was caught or farmed. b Includes Australian Capital Territory. na Not available.Source: ABS, International Trade, Australia, cat. no. 5465.0, Canberra.
a State totals include Commonwealth fisheries exports. Exports are identified according to source state or territory, not state or territory in which the product was caught or farmed. b Includes Australian Capital Territory. na Not available.Source: ABS, International Trade, Australia, cat. no. 5465.0, Canberra.
a State totals include Commonwealth fisheries exports. Exports are identified according to source state or territory, not state or territory in which the product was caught or farmed. b Includes Australian Capital Territory. na Not available.Source: ABS, International Trade, Australia, cat. no. 5465.0, Canberra.
a State totals include Commonwealth fisheries exports. Exports are identified according to source state or territory, not state or territory in which the product was caught or farmed. b Includes Australian Capital Territory. na Not available.Source: ABS, International Trade, Australia, cat. no. 5465.0, Canberra.
E x p o r t s

87
29 Imports of fisheries products – Australia 2929 Imports of fisheries products - Australia29 Imports of fisheries products Australia
2007 08 2008 09 2009 102007–08 2008–09 2009–10
t $’000 t $’000 t $’000$ $ $
EdiblEdiblehFish
Live fish na 0 na 0 na 18Live fish na 0 na 0 na 18Fresh, chilled or frozenFresh, chilled or frozen
Fresh or chilled whole 6 881 52 358 7 218 55 099 8 001 60 063Fresh or chilled whole 6 881 52 358 7 218 55 099 8 001 60 063Frozen whole 6 258 22 403 5 816 22 316 6 030 22 099Frozen whole 6 258 22 403 5 816 22 316 6 030 22 099Fresh or chilled fillets 701 6 975 699 7 331 929 8 869Fresh or chilled fillets 701 6 975 699 7 331 929 8 869Frozen fillets 43 308 227 783 40 769 238 866 42 969 231 818Frozen fillets 43 308 227 783 40 769 238 866 42 969 231 818Oth 4 765 15 494 2 790 13 285 3 564 19 263Other 4 765 15 494 2 790 13 285 3 564 19 263
P d d d fi hPrepared and preserved fish a 53 557 257 466 54 132 331 171 54 135 257 484Smoked, dried or salted fish 3 755 45 056 3 690 49 971 3 553 45 980,Other fish preparations 17 852 87 467 18 445 106 578 21 219 105 867Other fish preparations 17 852 87 467 18 445 106 578 21 219 105 867
Total b 137 079 715 002 133 558 824 617 140 399 751 461Total b 137 079 715 002 133 558 824 617 140 399 751 461
Crustaceans and molluscsFresh, chilled or frozen cFresh, chilled or frozen c
Prawns 18 731 166 646 12 828 135 011 17 728 159 154Prawns 18 731 166 646 12 828 135 011 17 728 159 154Lobster 792 14 120 429 9 208 658 11 163Lobster 792 14 120 429 9 208 658 11 163Scallops 2 460 28 081 2 170 29 889 2 810 33 542Scallops 2 460 28 081 2 170 29 889 2 810 33 542Oysters 726 7 270 811 8 867 826 8 696Oysters 726 7 270 811 8 867 826 8 696Mussels 2 194 8 990 2 783 12 007 2 433 9 295Mussels 2 194 8 990 2 783 12 007 2 433 9 295Oth 17 449 62 553 19 182 75 436 18 374 81 901Other 17 449 62 553 19 182 75 436 18 374 81 901
P d d dPrepared and preserved a 18 824 128 147 21 484 185 124 24 032 188 040p pExtracts and pastes 0 0 0 0 0 0pOther 197 1 406 212 2 549 297 2 428Other 197 1 406 212 2 549 297 2 428
Total 61 373 417 214 59 899 458 091 67 160 494 218Total 61 373 417 214 59 899 458 091 67 160 494 218
Total edible b 198 452 1 132 217 193 458 1 282 709 207 559 1 245 679Total edible b 98 5 3 93 58 8 09 0 559 5 6 9
N diblNon-ediblePearls d na 166 353 na 320 569 na 170 841Pearls dFish meal na 41 176 na 41 907 na 51 897Fish meal na 41 176 na 41 907 na 51 897Ornamental fish na 5 434 na 5 817 na 4 604Ornamental fish na 5 434 na 5 817 na 4 604Marine fats and oils na 27 098 na 33 921 na 26 756Marine fats and oils na 27 098 na 33 921 na 26 756Other marine products na 25 604 na 24 879 na 14 930Other marine products na 25 604 na 24 879 na 14 930
T t l dibl 265 665 427 092 269 028Total non-edible na 265 665 na 427 092 na 269 028
Total fisheries products na 1 397 882 na 1 709 801 na 1 514 707Total fisheries products na 1 397 882 na 1 709 801 na 1 514 707
a Predominantly canned. b Excludes live tonnage, but includes live value. c Includes dried and salted. d As indicated in table 18, mostly re-a Predominantly canned. b Excludes live tonnage, but includes live value. c Includes dried and salted. d As indicated in table 18, mostly re-imports.a Predominantly canned. b Excludes live tonnage, but includes live value. c Includes dried and salted. d As indicated in table 18, mostly re-imports.na Not available.S ABS I i l T d A li 5465 0 C b
y g , , yimports.na Not available.S ABS I i l T d A li 5465 0 C b
y g , , yimports.na Not available.Source: ABS, International Trade, Australia, cat. no. 5465.0, Canberra.na Not available.Source: ABS, International Trade, Australia, cat. no. 5465.0, Canberra.
Imp o r t s

88
30 Imports of fish – Australia 3030 Imports of fish - Australia30 Imports of fish Australia
2007 08 2008 09 2009 102007–08 2008–09 2009–10
t $’000 t $’000 t $’000t $’000 t $’000 t $’000
SalmonSalmonSmoked 1 327 24 643 1 500 28 471 1 462 26 450Smoked 1 327 24 643 1 500 28 471 1 462 26 450WholeWhole
Frozen 65 795 6 48 77 1 065Frozen 65 795 6 48 77 1 065Fresh or chilled 748 6 947 583 5 543 796 6 307Fresh or chilled 748 6 947 583 5 543 796 6 307
P d d d 8 038 46 402 8 795 65 817 7 438 51 913Prepared and preserved a 8 038 46 402 8 795 65 817 7 438 51 913
lTotal 10 178 78 788 10 883 99 879 9 773 85 735
HakeHakeFrozenFrozen
Fillets 5 741 29 967 5 744 30 997 5 426 26 085Fillets 5 741 29 967 5 744 30 997 5 426 26 085Whole 0 0 1 7 4 30Whole 0 0 1 7 4 30Mince 1 068 2 048 0 0 2 10Mince 1 068 2 048 0 0 2 10
T t l 6 810 32 015 5 745 31 005 5 432 26 125Total 6 810 32 015 5 745 31 005 5 432 26 125
TunaWholeWhole
Fresh or chilled 209 1 501 120 990 146 1 151Fresh or chilled 209 1 501 120 990 146 1 151Frozen 30 135 11 143 1 49Frozen 30 135 11 143 1 49
Prepared and preserved a 38 528 172 434 37 886 222 147 39 770 168 136Prepared and preserved a 38 528 172 434 37 886 222 147 39 770 168 136
Total 38 767 174 070 38 017 223 280 39 916 169 336Total 38 767 174 070 38 017 223 280 39 916 169 336
O h fi hOther fishLive na 0 na 0 na 18Fresh or chilled whole 5 924 43 909 6 515 48 566 7 059 52 605Fresh or chilled wholeFrozen whole 6 163 21 472 5 798 22 117 5 948 20 955Frozen whole 6 163 21 472 5 798 22 117 5 948 20 955Fresh or chilled fillets 701 6 975 699 7 331 929 8 869Fresh or chilled fillets 701 6 975 699 7 331 929 8 869Frozen fillets 37 566 197 816 35 025 207 869 37 542 205 733Frozen fillets 37 566 197 816 35 025 207 869 37 542 205 733
Other fresh chilled or frozen products 3 697 13 446 2 790 13 285 3 562 19 253Other fresh, chilled or frozen products 3 697 13 446 2 790 13 285 3 562 19 253
O h d d d fi hOther prepared and preserved fish aHerrings 798 3 764 730 3 895 799 3 980gSardines 4 080 21 083 4 389 22 845 3 884 17 393Sardines 4 080 21 083 4 389 22 845 3 884 17 393
Anchovy 967 9 247 782 9 986 897 9 946Anchovy 967 9 247 782 9 986 897 9 946Mackerel 906 3 102 1 311 4 882 1 030 3 947Mackerel 906 3 102 1 311 4 882 1 030 3 947Other 240 1 434 240 1 600 317 2 170Other 240 1 434 240 1 600 317 2 170
Total 6 991 38 630 7 451 43 208 6 927 37 435otaSmokedSmoked
Herrings 68 385 80 442 89 491Herrings 68 385 80 442 89 491Liver and roes 14 229 7 166 15 287Liver and roes 14 229 7 166 15 287Other 1 384 10 285 1 282 11 287 1 086 9 946Other 1 384 10 285 1 282 11 287 1 086 9 946
Total 1 465 10 899 1 369 11 895 1 190 10 725
Dried 690 7 876 634 8 322 683 7 422Dried 690 7 876 634 8 322 683 7 422Salted 273 1 639 188 1 283 217 1 383Salted 273 1 639 188 1 283 217 1 383
Other fish preparationsOther fish preparationsFish meal 117 153 16 188 24 255Fish meal 117 153 16 188 24 255
hb ll f h kFishballs, fishcake, sausages 4 021 14 493 4 268 19 794 4 606 18 899gCaviar and pastes 113 2 426 126 2 623 106 2 133Caviar and pastes 113 2 426 126 2 623 106 2 133Other 13 602 70 395 14 035 83 974 16 483 84 580Other 13 602 70 395 14 035 83 974 16 483 84 580
Total 17 852 87 467 18 445 106 578 21 219 105 867Total 17 852 87 467 18 445 106 578 21 219 105 867
Total other fish b 81 324 430 129 78 913 470 454 85 277 470 265
Total fish b 137 079 715 002 133 558 824 617 140 399 751 461Total fish b 137 079 715 002 133 558 824 617 140 399 751 461
a Predominantly canned b Excludes live tonnage but includes live value na Not availablea Predominantly canned. b Excludes live tonnage but includes live value. na Not available.Source: ABS, International Trade, Australia, cat. no. 5465.0, Canberra.a Predominantly canned. b Excludes live tonnage but includes live value. na Not available.Source: ABS, International Trade, Australia, cat. no. 5465.0, Canberra.a Predominantly canned. b Excludes live tonnage but includes live value. na Not available.Source: ABS, International Trade, Australia, cat. no. 5465.0, Canberra.
Imp o r t s

89
31 Imports of crustaceans and molluscs – Australia 3131 Imports of crustaceans and molluscs - Australia31 Imports of crustaceans and molluscs Australia
2007 08 2008 09 2009 102007–08 2008–09 2009–10
t $’000 t $’000 t $’000$ $ $
Prepared and preservedPrepared and preservedCrabs 488 4 853 356 3 933 501 4 482Crabs 488 4 853 356 3 933 501 4 482P 11 087 83 530 13 908 135 715 16 731 139 524Prawns 11 087 83 530 13 908 135 715 16 731 139 524S k d llSmoked molluscs 798 4 884 688 5 692 832 5 856Other molluscs 6 616 36 074 6 641 40 878 6 144 39 367Extracts and pastes 0 0 0 0 0 0Extracts and pastes 0 0 0 0 0 0Other preserved 33 213 103 1 455 121 1 239Other preserved 33 213 103 1 455 121 1 239
Total 19 022 129 554 21 696 187 673 24 329 190 468Total 19 022 129 554 21 696 187 673 24 329 190 468
OtherOtherPrawnsPrawns
Fresh chilled or frozen 18 730 166 630 12 823 134 959 17 723 159 091Fresh, chilled or frozen 18 730 166 630 12 823 134 959 17 723 159 091Other 1 16 5 52 6 63Other 1 16 5 52 6 63
Lobster 792 14 120 429 9 208 658 11 163Lobster 792 14 120 429 9 208 658 11 163Scallops 2 460 28 081 2 170 29 889 2 810 33 542Scallops 2 460 28 081 2 170 29 889 2 810 33 542OOysters 726 7 270 811 8 867 826 8 696yMussels 2 194 8 990 2 783 12 007 2 433 9 295Crabs 591 5 468 624 7 411 720 7 882Crabs 591 5 468 624 7 411 720 7 882Calamari, squid and octopus 15 603 45 576 16 829 54 286 15 966 62 036Calamari, squid and octopus 15 603 45 576 16 829 54 286 15 966 62 036Other 1 255 11 510 1 730 13 739 1 688 11 982Other 1 255 11 510 1 730 13 739 1 688 11 982
Total 42 351 287 661 38 203 270 418 42 831 303 750Total 42 351 287 661 38 203 270 418 42 831 303 750
Total crustaceans and molluscs 61 373 417 214 59 899 458 091 67 160 494 218Total crustaceans and molluscs 61 373 417 214 59 899 458 091 67 160 494 218
Source: ABS International Trade Australia cat no 5465 0 CanberraSource: ABS, International Trade, Australia, cat. no. 5465.0, Canberra.Source: ABS, International Trade, Australia, cat. no. 5465.0, Canberra.Source: ABS, International Trade, Australia, cat. no. 5465.0, Canberra.
Imp o r t s
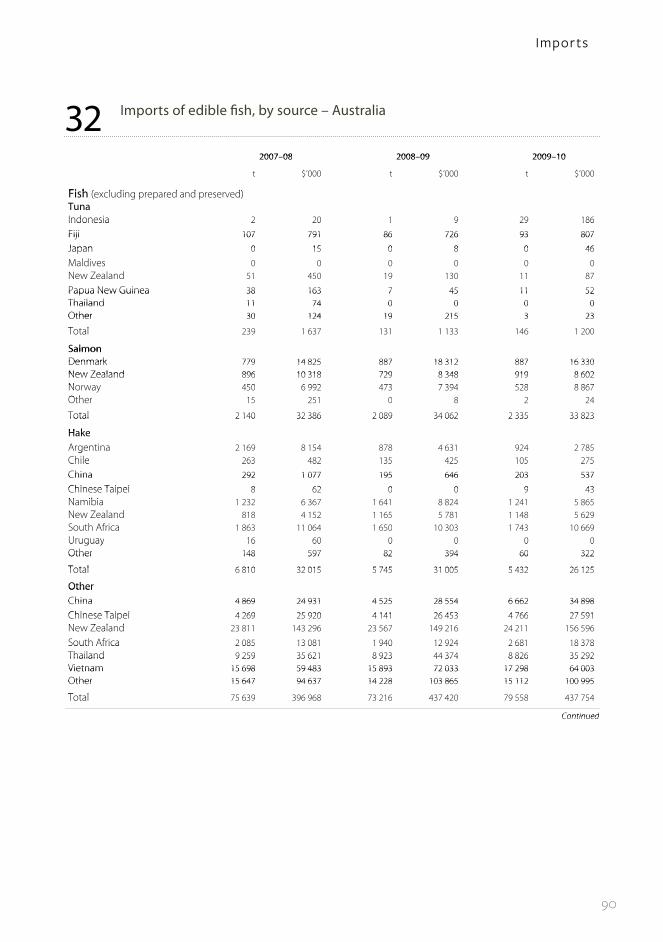
90
32 Imports of edible fish, by source – Australia 3232 Imports of edible fish, by source - Australia32 Imports of edible fish, by source Australia
2007 08 2008 09 2009 102007–08 2008–09 2009–10
t $’000 t $’000 t $’000$ $ $
Fi h ( l di d d d)Fish (excluding prepared and preserved)TunaIndonesia 2 20 1 9 29 186Indonesia 2 20 1 9 29 186
Fiji 107 791 86 726 93 807Fiji 107 791 86 726 93 807
Japan 0 15 0 8 0 46Japan 0 15 0 8 0 46
M ldiMaldives 0 0 0 0 0 0New Zealand 51 450 19 130 11 87
Papua New Guinea 38 163 7 45 11 52Papua New Guinea 38 163 7 45 11 52Thailand 11 74 0 0 0 0Thailand 11 74 0 0 0 0Other 30 124 19 215 3 23Other 30 124 19 215 3 23
T t l 239 63 3 33 6 200Total 239 1 637 131 1 133 146 1 200
SalmonSalmonDenmark 779 14 825 887 18 312 887 16 330Denmark 779 14 825 887 18 312 887 16 330New Zealand 896 10 318 729 8 348 919 8 602New Zealand 896 10 318 729 8 348 919 8 602Norway 450 6 992 473 7 394 528 8 867Norway 450 6 992 473 7 394 528 8 867O hOther 15 251 0 8 2 24
Total 2 140 32 386 2 089 34 062 2 335 33 823Total 2 140 32 386 2 089 34 062 2 335 33 823
HakeHakeArgentina 2 169 8 154 878 4 631 924 2 785gChile 263 482 135 425 105 275Chile 263 482 135 425 105 275
China 292 1 077 195 646 203 537China 292 1 077 195 646 203 537
Chinese Taipei 8 62 0 0 9 43Chinese Taipei 8 62 0 0 9 43N ibi 1 232 6 367 1 641 8 824 1 241 5 865Namibia 1 232 6 367 1 641 8 824 1 241 5 865N Z l dNew Zealand 818 4 152 1 165 5 781 1 148 5 629South Africa 1 863 11 064 1 650 10 303 1 743 10 669Uruguay 16 60 0 0 0 0Uruguay 16 60 0 0 0 0Other 148 597 82 394 60 322Other 148 597 82 394 60 322
Total 6 810 32 015 5 745 31 005 5 432 26 125Total 6 810 32 015 5 745 31 005 5 432 26 125
OtherOtherChina 4 869 24 931 4 525 28 554 6 662 34 898China 4 869 24 931 4 525 28 554 6 662 34 898
Chinese Taipei 4 269 25 920 4 141 26 453 4 766 27 591Chinese Taipei 4 269 25 920 4 141 26 453 4 766 27 591N Z l d 23 811 143 296 23 567 149 216 24 211 156 596New Zealand 23 811 143 296 23 567 149 216 24 211 156 596
South Africa 2 085 13 081 1 940 12 924 2 681 18 378South Africa 2 085 13 081 1 940 12 924 2 681 18 378Thailand 9 259 35 621 8 923 44 374 8 826 35 292Thailand 9 259 35 621 8 923 44 374 8 826 35 292Vietnam 15 698 59 483 15 893 72 033 17 298 64 003Vietnam 15 698 59 483 15 893 72 033 17 298 64 003Other 15 647 94 637 14 228 103 865 15 112 100 995Other 15 647 94 637 14 228 103 865 15 112 100 995
T lTotal 75 639 396 968 73 216 437 420 79 558 437 754
ContinuedContinued
Imp o r t s
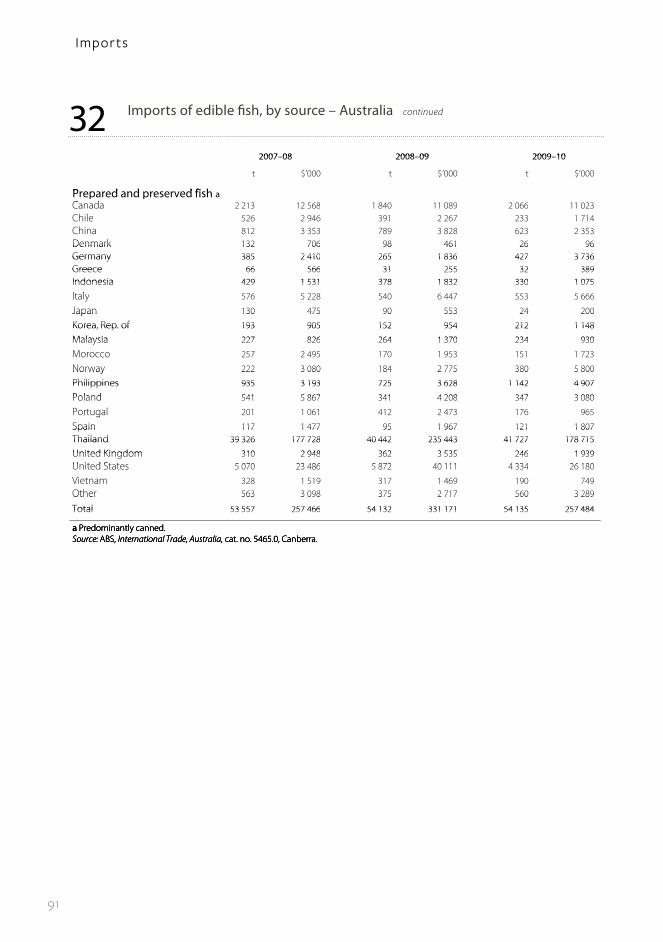
91
3232 Imports of edible fish, by source - Australia continued32 Imports of edible fish, by source Australia continued
2007 08 2008 09 2009 102007–08 2008–09 2009–10
t $’000 t $’000 t $’000$ $ $
P d d d fi hPrepared and preserved fish aC dCanada 2 213 12 568 1 840 11 089 2 066 11 023Chile 526 2 946 391 2 267 233 1 714China 812 3 353 789 3 828 623 2 353China 812 3 353 789 3 828 623 2 353Denmark 132 706 98 461 26 96Denmark 132 706 98 461 26 96Germany 385 2 410 265 1 836 427 3 736Germany 385 2 410 265 1 836 427 3 736Greece 66 566 31 255 32 389Greece 66 566 31 255 32 389Indonesia 429 1 531 378 1 832 330 1 075Indonesia 429 1 531 378 1 832 330 1 075
It l 576 5 228 540 6 447 553 5 666Italy 576 5 228 540 6 447 553 5 666
Japan 130 475 90 553 24 200Japan 130 475 90 553 24 200
Korea, Rep. of 193 905 152 954 212 1 148Korea, Rep. of 193 905 152 954 212 1 148
Malaysia 227 826 264 1 370 234 930Malaysia 227 826 264 1 370 234 930
MMorocco 257 2 495 170 1 953 151 1 723
Norway 222 3 080 184 2 775 380 5 800Norway 222 3 080 184 2 775 380 5 800
Philippines 935 3 193 725 3 628 1 142 4 907Philippines 935 3 193 725 3 628 1 142 4 907
Poland 541 5 867 341 4 208 347 3 080Poland 541 5 867 341 4 208 347 3 080
lPortugal 201 1 061 412 2 473 176 965gSpain 117 1 477 95 1 967 121 1 807Spain 117 1 477 95 1 967 121 1 807Thailand 39 326 177 728 40 442 235 443 41 727 178 715Thailand 39 326 177 728 40 442 235 443 41 727 178 715
United Kingdom 310 2 948 362 3 535 246 1 939United Kingdom 310 2 948 362 3 535 246 1 939United States 5 070 23 486 5 872 40 111 4 334 26 180United States 5 070 23 486 5 872 40 111 4 334 26 180
Vietnam 328 1 519 317 1 469 190 749Other 563 3 098 375 2 717 560 3 289Other 563 3 098 375 2 717 560 3 289
Total 53 557 257 466 54 132 331 171 54 135 257 484Total 53 557 257 466 54 132 331 171 54 135 257 484
a Predominantly canned. a Predominantly canned. Source: ABS, International Trade, Australia, cat. no. 5465.0, Canberra.a Predominantly canned. Source: ABS, International Trade, Australia, cat. no. 5465.0, Canberra.a Predominantly canned. Source: ABS, International Trade, Australia, cat. no. 5465.0, Canberra.
ySource: ABS, International Trade, Australia, cat. no. 5465.0, Canberra.
32 Imports of edible fish, by source – Australia continued
Imp o r t s
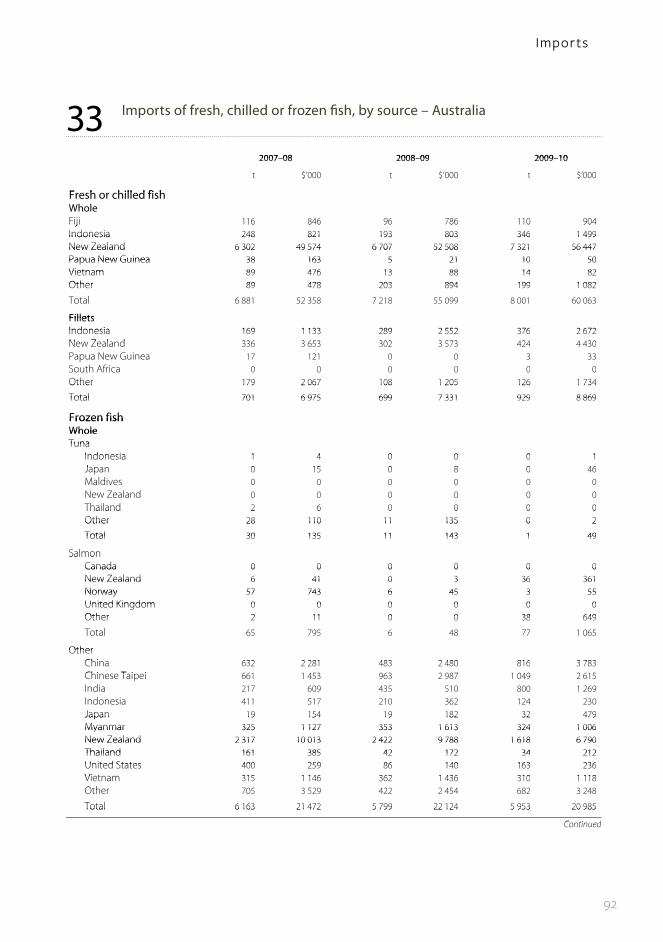
92
33 Imports of fresh, chilled or frozen fish, by source – Australia 3333 Imports of fresh, chilled or frozen fish, by source - Australia33 Imports of fresh, chilled or frozen fish, by source Australia
2007 08 2008 09 2009 102007–08 2008–09 2009–10
t $’000 t $’000 t $’000$ $ $
F h hill d fi hFresh or chilled fishh lWhole
Fiji 116 846 96 786 110 904Fiji 116 846 96 786 110 904Indonesia 248 821 193 803 346 1 499Indonesia 248 821 193 803 346 1 499New Zealand 6 302 49 574 6 707 52 508 7 321 56 447New Zealand 6 302 49 574 6 707 52 508 7 321 56 447Papua New Guinea 38 163 5 21 10 50Papua New Guinea 38 163 5 21 10 50Vietnam 89 476 13 88 14 82Vietnam 89 476 13 88 14 82Other 89 478 203 894 199 1 082Other 89 478 203 894 199 1 082
Total 6 881 52 358 7 218 55 099 8 001 60 063
FilletsFilletsIndonesia 169 1 133 289 2 552 376 2 672Indonesia 169 1 133 289 2 552 376 2 672N Z l d 336 3 653 302 3 573 424 4 430New Zealand 336 3 653 302 3 573 424 4 430P N G iPapua New Guinea 17 121 0 0 3 33pSouth Africa 0 0 0 0 0 0Other 179 2 067 108 1 205 126 1 734Other 179 2 067 108 1 205 126 1 734
Total 701 6 975 699 7 331 929 8 869Total 701 6 975 699 7 331 929 8 869
Frozen fishFrozen fishWholeWholeTunaTuna
Indonesia 1 4 0 0 0 1Indonesia 1 4 0 0 0 1Japan 0 15 0 8 0 46Japan 0 15 0 8 0 46M ldiMaldives 0 0 0 0 0 0New Zealand 0 0 0 0 0 0Thailand 2 6 0 0 0 0Thailand 2 6 0 0 0 0Other 28 110 11 135 0 2Other 28 110 11 135 0 2
Total 30 135 11 143 1 49Total 30 135 11 143 1 49
SalmonSalmonCanada 0 0 0 0 0 0Canada 0 0 0 0 0 0New Zealand 6 41 0 3 36 361New Zealand 6 41 0 3 36 361Norway 57 743 6 45 3 55Norway 57 743 6 45 3 55United Kingdom 0 0 0 0 0 0United Kingdom 0 0 0 0 0 0Other 2 11 0 0 38 649Other 2 11 0 0 38 649
Total 65 795 6 48 77 1 065
OtherOtherChina 632 2 281 483 2 480 816 3 783China 632 2 281 483 2 480 816 3 783Chi T i i 661 1 453 963 2 987 1 049 2 615Chinese Taipei 661 1 453 963 2 987 1 049 2 615I dIndia 217 609 435 510 800 1 269Indonesia 411 517 210 362 124 230Japan 19 154 19 182 32 479Japan 19 154 19 182 32 479Myanmar 325 1 127 353 1 613 324 1 006Myanmar 325 1 127 353 1 613 324 1 006New Zealand 2 317 10 013 2 422 9 788 1 618 6 790New Zealand 2 317 10 013 2 422 9 788 1 618 6 790Thailand 161 385 42 172 34 212Thailand 161 385 42 172 34 212United States 400 259 86 140 163 236United States 400 259 86 140 163 236Vietnam 315 1 146 362 1 436 310 1 118Vietnam 315 1 146 362 1 436 310 1 118O hOther 705 3 529 422 2 454 682 3 248
Total 6 163 21 472 5 799 22 124 5 953 20 985Total 6 163 21 472 5 799 22 124 5 953 20 985
C ti dContinued
Imp o r t s
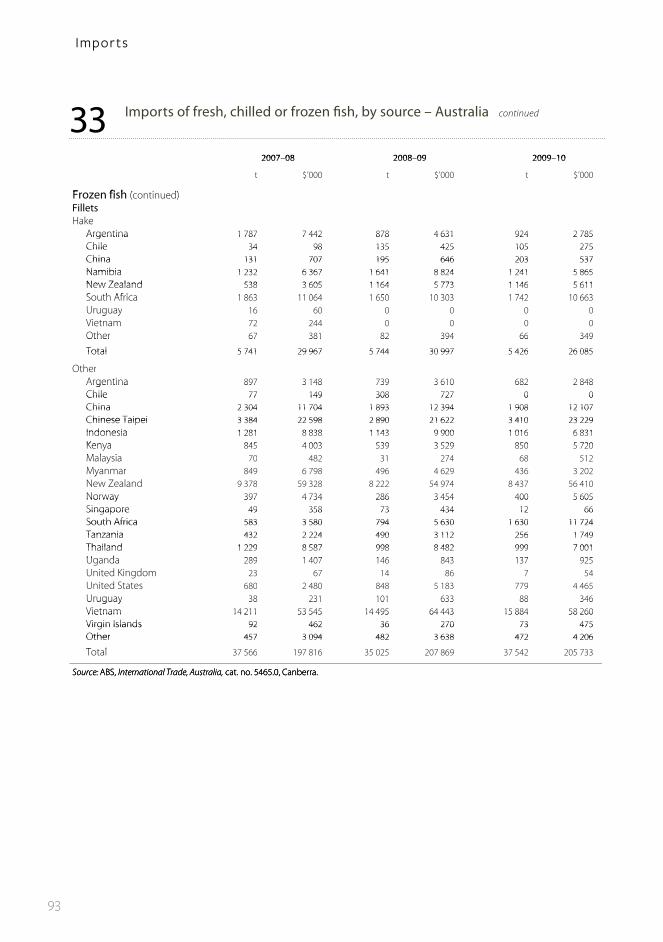
93
33 Imports of fresh, chilled or frozen fish, by source – Australia continued 3333 Imports of fresh, chilled or frozen fish, by source - Australia continued33 Imports of fresh, chilled or frozen fish, by source Australia continued
2007 08 2008 09 2009 102007–08 2008–09 2009–10
t $’000 t $’000 t $’000$ $ $
F fi h ( ti d)Frozen fish (continued)llFillets
HakeHakeArgentina 1 787 7 442 878 4 631 924 2 785Argentina 1 787 7 442 878 4 631 924 2 785Chile 34 98 135 425 105 275Chile 34 98 135 425 105 275China 131 707 195 646 203 537China 131 707 195 646 203 537Namibia 1 232 6 367 1 641 8 824 1 241 5 865Namibia 1 232 6 367 1 641 8 824 1 241 5 865New Zealand 538 3 605 1 164 5 773 1 146 5 611New Zealand 538 3 605 1 164 5 773 1 146 5 611S th Af i 1 863 11 064 1 650 10 303 1 742 10 663South Africa 1 863 11 064 1 650 10 303 1 742 10 663UUruguay 16 60 0 0 0 0g yVietnam 72 244 0 0 0 0Other 67 381 82 394 66 349Other 67 381 82 394 66 349
Total 5 741 29 967 5 744 30 997 5 426 26 085Total 5 741 29 967 5 744 30 997 5 426 26 085
OtherArgentina 897 3 148 739 3 610 682 2 848Argentina 897 3 148 739 3 610 682 2 848Chile 77 149 308 727 0 0Chile 77 149 308 727 0 0China 2 304 11 704 1 893 12 394 1 908 12 107China 2 304 11 704 1 893 12 394 1 908 12 107Chinese Taipei 3 384 22 598 2 890 21 622 3 410 23 229Chinese Taipei 3 384 22 598 2 890 21 622 3 410 23 229Indonesia 1 281 8 838 1 143 9 900 1 016 6 831Indonesia 1 281 8 838 1 143 9 900 1 016 6 831Kenya 845 4 003 539 3 529 850 5 720Kenya 845 4 003 539 3 529 850 5 720M l i 70 482 31 274 68 512Malaysia 70 482 31 274 68 512Myanmar 849 6 798 496 4 629 436 3 202yNew Zealand 9 378 59 328 8 222 54 974 8 437 56 410Norway 397 4 734 286 3 454 400 5 605Norway 397 4 734 286 3 454 400 5 605Singapore 49 358 73 434 12 66Singapore 49 358 73 434 12 66South Africa 583 3 580 794 5 630 1 630 11 724South Africa 583 3 580 794 5 630 1 630 11 724Tanzania 432 2 224 490 3 112 256 1 749Tanzania 432 2 224 490 3 112 256 1 749Thailand 1 229 8 587 998 8 482 999 7 001Thailand 1 229 8 587 998 8 482 999 7 001Uganda 289 1 407 146 843 137 925Uganda 289 1 407 146 843 137 925U i d Ki dUnited Kingdom 23 67 14 86 7 54United States 680 2 480 848 5 183 779 4 465Uruguay 38 231 101 633 88 346Uruguay 38 231 101 633 88 346Vietnam 14 211 53 545 14 495 64 443 15 884 58 260Vietnam 14 211 53 545 14 495 64 443 15 884 58 260Virgin Islands 92 462 36 270 73 475Virgin Islands 92 462 36 270 73 475Other 457 3 094 482 3 638 472 4 206Other 457 3 094 482 3 638 472 4 206
T t l 37 566 197 816 35 025 207 869 37 542 205 733Total 37 566 197 816 35 025 207 869 37 542 205 733
Source: ABS, International Trade, Australia, cat. no. 5465.0, Canberra.Source: ABS, International Trade, Australia, cat. no. 5465.0, Canberra.Source: ABS, International Trade, Australia, cat. no. 5465.0, Canberra.
Imp o r t s
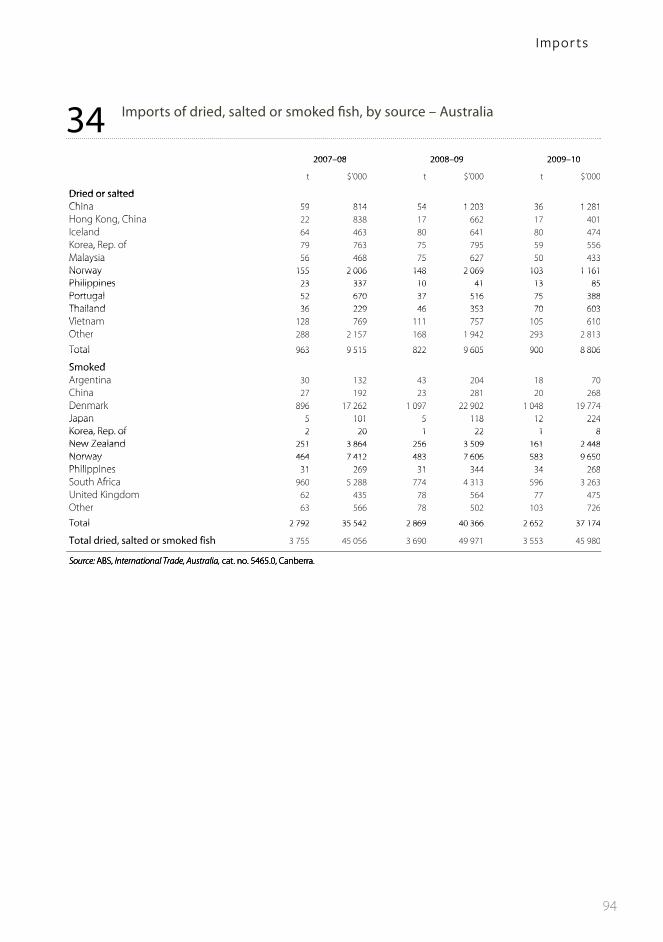
94
34 Imports of dried, salted or smoked fish, by source – Australia 3434 Imports of dried, salted or smoked fish, by source - Australia34 Imports of dried, salted or smoked fish, by source Australia
2007 08 2008 09 2009 102007–08 2008–09 2009–10
t $’000 t $’000 t $’000$ $ $
Dried or saltedDried or saltedChina 59 814 54 1 203 36 1 281China 59 814 54 1 203 36 1 281H K Chi 22 838 17 662 17 401Hong Kong, China 22 838 17 662 17 401I l dIceland 64 463 80 641 80 474Korea, Rep. of 79 763 75 795 59 556, pMalaysia 56 468 75 627 50 433Malaysia 56 468 75 627 50 433Norway 155 2 006 148 2 069 103 1 161Norway 155 2 006 148 2 069 103 1 161Philippines 23 337 10 41 13 85Philippines 23 337 10 41 13 85Portugal 52 670 37 516 75 388Portugal 52 670 37 516 75 388Thailand 36 229 46 353 70 603Thailand 36 229 46 353 70 603Vietnam 128 769 111 757 105 610Vietnam 128 769 111 757 105 610O hOther 288 2 157 168 1 942 293 2 813
Total 963 9 515 822 9 605 900 8 806Total 963 9 515 822 9 605 900 8 806
SmokedSmokedA iArgentina 30 132 43 204 18 70China 27 192 23 281 20 268Denmark 896 17 262 1 097 22 902 1 048 19 774Denmark 896 17 262 1 097 22 902 1 048 19 774Japan 5 101 5 118 12 224Japan 5 101 5 118 12 224Korea, Rep. of 2 20 1 22 1 8Korea, Rep. of 2 20 1 22 1 8New Zealand 251 3 864 256 3 509 161 2 448New Zealand 251 3 864 256 3 509 161 2 448Norway 464 7 412 483 7 606 583 9 650Norway 464 7 412 483 7 606 583 9 650Philippines 31 269 31 344 34 268Philippines 31 269 31 344 34 268S th Af i 960 5 288 774 4 313 596 3 263South Africa 960 5 288 774 4 313 596 3 263U i d Ki dUnited Kingdom 62 435 78 564 77 475gOther 63 566 78 502 103 726
Total 2 792 35 542 2 869 40 366 2 652 37 174Total 2 792 35 542 2 869 40 366 2 652 37 174
T l d i d l d k d fi hTotal dried, salted or smoked fish 3 755 45 056 3 690 49 971 3 553 45 980
Source: ABS, International Trade, Australia, cat. no. 5465.0, Canberra.Source: ABS, International Trade, Australia, cat. no. 5465.0, Canberra.Source: ABS, International Trade, Australia, cat. no. 5465.0, Canberra.Source: ABS, International Trade, Australia, cat. no. 5465.0, Canberra.
Imp o r t s

95
35 Imports of prepared and preserved fish products, by source – Australia 3535 Imports of prepared and preserved fish products, by source - Australia35 Imports of prepared and preserved fish products, by source Australia
2007 08 2008 09 2009 102007–08 2008–09 2009–10
$’ $’ $’t $’000 t $’000 t $’000
Prepared and preserved fish aPrepared and preserved fish aSalmonSalmonCanada 962 6 778 560 5 762 807 6 132Canada 962 6 778 560 5 762 807 6 132Chil 261 1 923 130 924 44 349Chile 261 1 923 130 924 44 349Th l dThailand 1 112 8 630 1 596 13 432 1 678 12 518United States 4 927 22 945 5 864 40 049 4 256 25 488Other 777 6 126 644 5 649 653 7 426Other 777 6 126 644 5 649 653 7 426
Total 8 038 46 402 8 795 65 817 7 438 51 913Total 8 038 46 402 8 795 65 817 7 438 51 913
TTunaIndonesia 429 1 528 377 1 828 328 1 070Japan 1 26 19 112 2 38Japan 1 26 19 112 2 38Thailand 36 782 164 995 36 419 213 568 38 030 160 058Thailand 36 782 164 995 36 419 213 568 38 030 160 058Other 1 316 5 884 1 070 6 639 1 410 6 970Other 1 316 5 884 1 070 6 639 1 410 6 970
Total 38 528 172 434 37 886 222 147 39 770 168 136Total 38 528 172 434 37 886 222 147 39 770 168 136
HerringsgCanada 134 768 274 1 579 242 1 299Canada 134 768 274 1 579 242 1 299Denmark 76 249 91 404 25 80Denmark 76 249 91 404 25 80Germany 297 1 634 212 1 215 267 1 677Germany 297 1 634 212 1 215 267 1 677Other 290 1 114 154 696 266 924Other 290 1 114 154 696 266 924
T t l 798 3 764 730 3 895 799 3 980Total 798 3 764 730 3 895 799 3 980
SardinesSardinesCanada 1 074 4 787 1 006 3 747 1 018 3 592Canada 1 074 4 787 1 006 3 747 1 018 3 592Norway 6 83 0 0 50 659Norway 6 83 0 0 50 659Thailand 1 117 3 377 1 679 6 185 1 443 4 696Thailand 1 117 3 377 1 679 6 185 1 443 4 696United Kingdom 270 2 679 285 3 020 159 1 336United Kingdom 270 2 679 285 3 020 159 1 336Oth 1 614 10 157 1 419 9 893 1 214 7 110Other 1 614 10 157 1 419 9 893 1 214 7 110
Total 4 080 21 083 4 389 22 845 3 884 17 393
AnchoviesAnchoviesItaly 441 4 034 369 4 617 438 4 634Italy 441 4 034 369 4 617 438 4 634Morocco 256 2 492 161 1 922 151 1 723Morocco 256 2 492 161 1 922 151 1 723Spain 58 1 206 62 1 794 89 1 539Spain 58 1 206 62 1 794 89 1 539O hOther 213 1 516 189 1 653 218 2 049
Total 967 9 247 782 9 986 897 9 946Total 967 9 247 782 9 986 897 9 946
MackerelMackerelChile 146 273 112 307 48 129Chile 146 273 112 307 48 129Denmark 53 424 3 25 1 4Denmark 53 424 3 25 1 4JJapan 129 446 68 412 19 102Malaysia 75 218 117 478 54 194yNew Zealand 1 3 0 2 48 245New Zealand 1 3 0 2 48 245Thailand 279 534 718 2 058 542 1 240Thailand 279 534 718 2 058 542 1 240Other 222 1 205 293 1 600 318 2 033Other 222 1 205 293 1 600 318 2 033
Total 906 3 102 1 311 4 882 1 030 3 947Total 906 3 102 1 311 4 882 1 030 3 947
hOtherCanada 43 235 0 0 0 0Ca ada 3 35 0 0 0 0Chinese Taipei 13 152 21 341 23 299Chinese Taipei 13 152 21 341 23 299Peru 0 0 0 0 0 0Peru 0 0 0 0 0 0Sweden 1 8 0 4 0 0Sweden 1 8 0 4 0 0Other 183 1 039 218 1 256 294 1 871Other 183 1 039 218 1 256 294 1 871
T lTotal 240 1 434 240 1 600 317 2 170
Total prepared and preserved fish 53 557 257 466 54 132 331 171 54 135 257 484Total prepared and preserved fish 53 557 257 466 54 132 331 171 54 135 257 484
a Predominantly canned. a Predominantly canned. Source: ABS, International Trade, Australia, cat. no. 5465.0, Canberra.a Predominantly canned. Source: ABS, International Trade, Australia, cat. no. 5465.0, Canberra.
ySource: ABS, International Trade, Australia, cat. no. 5465.0, Canberra.
Imp o r t s

96
36 Imports of crustaceans and molluscs, by source – Australia 3636 I36 Imports of crustaceans and molluscs by source - Australia36 Imports of crustaceans and molluscs, by source - Australia
2007 08 2008 09 2009 102007–08 2008–09 2009–10t $’000 t $’000 t $’000t $ 000 t $ 000 t $ 000
CCrustaceansCrustaceansLobsterLobsterFresh chilled or frozenFresh, chilled or frozen
C b 81 2 112 55 1 595 23 452Cuba 81 2 112 55 1 595 23 452Cuba 81 2 112 55 1 595 23 452Indonesia 152 2 240 64 790 40 524Indonesia 152 2 240 64 790 40 524JJapan 0 0 0 0 0 0Japan 0 0 0 0 0 0Malaysia 23 251 22 270 18 212Malaysia 23 251 22 270 18 212yPapua New Guinea 99 4 205 73 2 829 84 2 534Papua New Guinea 99 4 205 73 2 829 84 2 534Th il dThailand 175 2 349 69 1 132 82 1 240Thailand 175 2 349 69 1 132 82 1 240Other 263 2 962 146 2 592 410 6 201Other 263 2 962 146 2 592 410 6 201
Total lobster 792 14 120 429 9 208 658 11 163Total lobster 792 14 120 429 9 208 658 11 163PPrawnsPrawnsFresh chilled or frozenFresh, chilled or frozen
hChina 5 486 36 737 3 484 34 461 5 719 49 085China 5 486 36 737 3 484 34 461 5 719 49 085Chinese Taipei 46 351 21 246 28 238Chinese Taipei 46 351 21 246 28 238pIndia 1 084 12 208 111 1 479 102 1 147India 1 084 12 208 111 1 479 102 1 147I d i 197 1 841 708 8 328 1 959 20 998Indonesia 197 1 841 708 8 328 1 959 20 998do es a 9 8 08 8 3 8 959 0 998Malaysia 1 619 17 535 1 812 20 557 2 170 18 776Malaysia 1 619 17 535 1 812 20 557 2 170 18 776MMyanmar 267 2 670 70 792 28 311Myanmar 267 2 670 70 792 28 311New Caledonia 7 88 33 489 33 514New Caledonia 7 88 33 489 33 514Saudi Arabia 327 2 394 12 191 0 0Saudi Arabia 327 2 394 12 191 0 0Singapore 3 23 26 325 0 0Singapore 3 23 26 325 0 0g pThailand 4 694 38 613 3 755 35 503 5 033 38 890Thailand 4 694 38 613 3 755 35 503 5 033 38 890Vi t 4 856 52 951 2 735 31 736 2 504 27 415Vietnam 4 856 52 951 2 735 31 736 2 504 27 415Vietnam 4 856 52 951 2 735 31 736 2 504 27 415Other 144 1 218 55 851 146 1 716Other 144 1 218 55 851 146 1 716Total 18 730 166 630 12 823 134 959 17 723 159 091Total 18 730 166 630 12 823 134 959 17 723 159 091
P d d dPrepared and preservedPrepared and preservedMalaysia 644 4 778 641 4 878 475 3 520Malaysia 644 4 778 641 4 878 475 3 520Th il dThailand 3 633 26 783 3 998 39 512 6 183 50 809Thailand 3 633 26 783 3 998 39 512 6 183 50 809Vietnam 1 964 19 033 4 810 51 994 5 519 51 810Vietnam 1 964 19 033 4 810 51 994 5 519 51 810Other 4 845 32 936 4 459 39 332 4 554 33 385Other 4 845 32 936 4 459 39 332 4 554 33 385T t l 11 087 83 530 13 908 135 715 16 731 139 524Total 11 087 83 530 13 908 135 715 16 731 139 524Total 11 087 83 530 13 908 135 715 16 731 139 524
OtherOtherChina 0 5 0 6 1 14China 0 5 0 6 1 14Malaysia 1 6 3 22 4 25Malaysia 1 6 3 22 4 25yThailand 0 3 1 18 0 7Thailand 0 3 1 18 0 7Vi t 0 0 0 0 0 0Vietnam 0 0 0 0 0 0Vietnam 0 0 0 0 0 0Other 0 3 0 6 1 16Other 0 3 0 6 1 16Total 1 16 5 52 6 63Total 1 16 5 52 6 63
T t l 29 818 250 176 26 735 270 726 34 460 298 678Total prawns 29 818 250 176 26 735 270 726 34 460 298 678ota p a s 9 8 8 50 6 6 35 0 6 3 60 98 6 8CrabsCrabs
h h ll d fFresh, chilled or frozenFresh, chilled or frozenIndonesia 155 1 108 45 437 52 410Indonesia 155 1 108 45 437 52 410Malaysia 33 197 17 174 30 215Malaysia 33 197 17 174 30 215Th il d 145 1 465 96 1 532 123 1 789Thailand 145 1 465 96 1 532 123 1 789a a d 5 65 96 53 3 89Vietnam 147 1 193 122 1 133 57 547Vietnam 147 1 193 122 1 133 57 547O hOther 110 1 505 345 4 135 459 4 920Other 110 1 505 345 4 135 459 4 920Total 591 5 468 624 7 411 720 7 882Total 591 5 468 624 7 411 720 7 882
Prepared and preservedPrepared and preservedTh il dThailand 199 1 144 155 1 178 289 1 818Thailand 199 1 144 155 1 178 289 1 818Other 289 3 709 201 2 754 212 2 664Other 289 3 709 201 2 754 212 2 664Total 488 4 853 356 3 933 501 4 482Total 488 4 853 356 3 933 501 4 482
T t l b 0 8 0 320 9 9 3 222 2 363Total crabs 1 078 10 320 979 11 344 1 222 12 363Total crabs 1 078 10 320 979 11 344 1 222 12 363
C ti dContinued
Imp o r t s

97
36 Imports of crustaceans and molluscs, by source – Australia continued 3636 Imports of crustaceans and molluscs, by source - Australia continued36 Imports of crustaceans and molluscs, by source Australia continued
2007 08 2008 09 2009 102007–08 2008–09 2009–10
t $’000 t $’000 t $’000$ $ $
M ll (f h hill d f )Molluscs (fresh, chilled or frozen)llScallopsp
Chile 126 1 241 64 911 24 372Chile 126 1 241 64 911 24 372China 1 114 11 195 1 071 13 447 1 291 14 466China 1 114 11 195 1 071 13 447 1 291 14 466Hong Kong, China 27 328 3 187 7 267Hong Kong, China 27 328 3 187 7 267Japan 720 9 766 649 10 103 662 9 472Japan 720 9 766 649 10 103 662 9 472Thailand 293 2 796 197 2 258 395 3 497Thailand 293 2 796 197 2 258 395 3 497United States 21 363 23 395 110 1 768United States 21 363 23 395 110 1 768Vi t 14 141 29 302 36 453Vietnam 14 141 29 302 36 453O hOther 144 2 252 133 2 286 285 3 247
Total 2 460 28 081 2 170 29 889 2 810 33 542Total 2 460 28 081 2 170 29 889 2 810 33 542
M lMusselsChiChina 1 11 0 0 5 12New Zealand 2 169 8 906 2 709 11 581 2 423 9 266United States 0 0 0 0 0 0United States 0 0 0 0 0 0Other 24 74 74 426 5 18Other 24 74 74 426 5 18
Total 2 194 8 990 2 783 12 007 2 433 9 295Total 2 194 8 990 2 783 12 007 2 433 9 295
Calamari, squid and octopusCalamari, squid and octopusChina 5 749 13 445 6 502 17 173 6 400 24 682China 5 749 13 445 6 502 17 173 6 400 24 682Chinese Taipei 1 911 4 349 1 491 4 778 1 592 6 663Chinese Taipei 1 911 4 349 1 491 4 778 1 592 6 663Hong Kong China 10 178 11 146 6 138Hong Kong, China 10 178 11 146 6 138India 98 424 204 679 178 539India 98 424 204 679 178 539I d iIndonesia 205 811 311 1 393 412 1 752Korea, Rep. of 283 893 384 1 044 364 1 137, pMalaysia 563 2 207 861 3 873 1 314 4 462Malaysia 563 2 207 861 3 873 1 314 4 462Myanmar 153 448 69 326 107 370Myanmar 153 448 69 326 107 370New Zealand 2 628 8 499 3 335 7 748 1 962 7 824New Zealand 2 628 8 499 3 335 7 748 1 962 7 824Singapore 25 104 4 20 12 55Singapore 25 104 4 20 12 55Thailand 1 898 8 235 1 690 9 229 1 971 8 975Thailand 1 898 8 235 1 690 9 229 1 971 8 975United States 301 543 216 498 385 726United States 301 543 216 498 385 726U 23 27 17 17 0 0Uruguay 23 27 17 17 0 0ViVietnam 1 362 4 221 1 183 5 335 1 009 3 559Other 394 1 192 551 2 027 256 1 154
Total 15 603 45 576 16 829 54 286 15 966 62 036Total 15 603 45 576 16 829 54 286 15 966 62 036
Crustaceans and molluscs (prepared and preserved) aCrustaceans and molluscs (prepared and preserved) aChina 6 845 41 635 6 502 50 849 6 067 43 119China 6 845 41 635 6 502 50 849 6 067 43 119Korea Rep of 67 449 49 416 82 667Korea, Rep. of 67 449 49 416 82 667Malaysia 2 314 15 531 2 247 16 094 2 120 14 916Malaysia 2 314 15 531 2 247 16 094 2 120 14 916New Zealand 1 888 11 174 1 879 11 225 1 894 11 761New Zealand 1 888 11 174 1 879 11 225 1 894 11 761Si 104 764 101 786 87 760Singapore 104 764 101 786 87 760Th il dThailand 4 860 31 981 5 255 46 911 7 349 56 975Vietnam 2 101 20 655 4 924 53 271 5 617 53 019Other 645 5 960 525 5 574 815 6 821Other 645 5 960 525 5 574 815 6 821
Total 18 824 128 147 21 484 185 124 24 032 188 040Total 18 824 128 147 21 484 185 124 24 032 188 040
a Predominantly prawns. a Predominantly prawns. Source: ABS, International Trade, Australia, cat. no. 5465.0, Canberra.a Predominantly prawns. Source: ABS, International Trade, Australia, cat. no. 5465.0, Canberra.a Predominantly prawns. Source: ABS, International Trade, Australia, cat. no. 5465.0, Canberra.a Predominantly prawns. Source: ABS, International Trade, Australia, cat. no. 5465.0, Canberra.
Imp o r t s
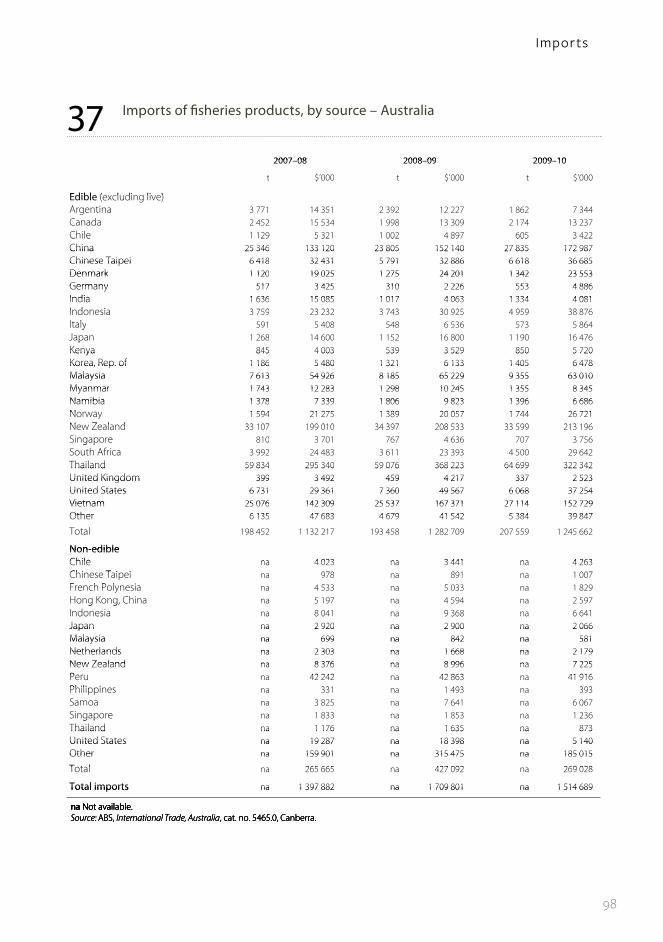
98
37 Imports of fisheries products, by source – Australia
3737 Imports of fisheries products, by source - Australia37 Imports of fisheries products, by source Australia
2007 08 2008 09 2009 102007–08 2008–09 2009–10
t $’000 t $’000 t $’000$ $ $
Edible (e cl ding li e)Edible (excluding live)A iArgentina 3 771 14 351 2 392 12 227 1 862 7 344Canada 2 452 15 534 1 998 13 309 2 174 13 237Chile 1 129 5 321 1 002 4 897 605 3 422Chile 1 129 5 321 1 002 4 897 605 3 422China 25 346 133 120 23 805 152 140 27 835 172 987China 25 346 133 120 23 805 152 140 27 835 172 987Chinese Taipei 6 418 32 431 5 791 32 886 6 618 36 685Chinese Taipei 6 418 32 431 5 791 32 886 6 618 36 685Denmark 1 120 19 025 1 275 24 201 1 342 23 553Denmark 1 120 19 025 1 275 24 201 1 342 23 553Germany 517 3 425 310 2 226 553 4 886Germany 517 3 425 310 2 226 553 4 886India 1 636 15 085 1 017 4 063 1 334 4 081India 1 636 15 085 1 017 4 063 1 334 4 081I d i 3 759 23 232 3 743 30 925 4 959 38 876Indonesia 3 759 23 232 3 743 30 925 4 959 38 876I lItaly 591 5 408 548 6 536 573 5 864yJapan 1 268 14 600 1 152 16 800 1 190 16 476pKenya 845 4 003 539 3 529 850 5 720Kenya 845 4 003 539 3 529 850 5 720Korea, Rep. of 1 186 5 480 1 321 6 133 1 405 6 478Korea, Rep. of 1 186 5 480 1 321 6 133 1 405 6 478Malaysia 7 613 54 926 8 185 65 229 9 355 63 010Malaysia 7 613 54 926 8 185 65 229 9 355 63 010Myanmar 1 743 12 283 1 298 10 245 1 355 8 345Myanmar 1 743 12 283 1 298 10 245 1 355 8 345Namibia 1 378 7 339 1 806 9 823 1 396 6 686Namibia 1 378 7 339 1 806 9 823 1 396 6 686Norway 1 594 21 275 1 389 20 057 1 744 26 721Norway 1 594 21 275 1 389 20 057 1 744 26 721N Z l d 33 107 199 010 34 397 208 533 33 599 213 196New Zealand 33 107 199 010 34 397 208 533 33 599 213 196SSingapore 810 3 701 767 4 636 707 3 756g pSouth Africa 3 992 24 483 3 611 23 393 4 500 29 642Thailand 59 834 295 340 59 076 368 223 64 699 322 342Thailand 59 834 295 340 59 076 368 223 64 699 322 342United Kingdom 399 3 492 459 4 217 337 2 523United Kingdom 399 3 492 459 4 217 337 2 523United States 6 731 29 361 7 360 49 567 6 068 37 254United States 6 731 29 361 7 360 49 567 6 068 37 254Vietnam 25 076 142 309 25 537 167 371 27 114 152 729Vietnam 25 076 142 309 25 537 167 371 27 114 152 729Other 6 135 47 683 4 679 41 542 5 384 39 847Other 6 135 47 683 4 679 41 542 5 384 39 847
Total 198 452 1 132 217 193 458 1 282 709 207 559 1 245 662
Non-edibleNon-edibleChile na 4 023 na 3 441 na 4 263Chile na 4 023 na 3 441 na 4 263Chinese Taipei 978 891 1 007Chinese Taipei na 978 na 891 na 1 007F h P l iFrench Polynesia na 4 533 na 5 033 na 1 829yHong Kong, China na 5 197 na 4 594 na 2 597g g,Indonesia na 8 041 na 9 368 na 6 641Indonesia na 8 041 na 9 368 na 6 641Japan na 2 920 na 2 900 na 2 066Japan na 2 920 na 2 900 na 2 066Malaysia na 699 na 842 na 581Malaysia na 699 na 842 na 581Netherlands na 2 303 na 1 668 na 2 179Netherlands na 2 303 na 1 668 na 2 179New Zealand na 8 376 na 8 996 na 7 225New Zealand na 8 376 na 8 996 na 7 225Peru na 42 242 na 42 863 na 41 916Peru na 42 242 na 42 863 na 41 916Phili i 331 1 493 393Philippines na 331 na 1 493 na 393SSamoa na 3 825 na 7 641 na 6 067Singapore na 1 833 na 1 853 na 1 236g pThailand na 1 176 na 1 635 na 873Thailand na 1 176 na 1 635 na 873United States na 19 287 na 18 398 na 5 140United States na 19 287 na 18 398 na 5 140Other na 159 901 na 315 475 na 185 015Other na 159 901 na 315 475 na 185 015
Total 265 665 427 092 269 028Total na 265 665 na 427 092 na 269 028
Total imports na 1 397 882 na 1 709 801 na 1 514 689Total imports na 1 397 882 na 1 709 801 na 1 514 689
na Not available. na Not available. Source: ABS, International Trade, Australia, cat. no. 5465.0, Canberra.na Not available. Source: ABS, International Trade, Australia, cat. no. 5465.0, Canberra.na Not available. Source: ABS, International Trade, Australia, cat. no. 5465.0, Canberra.na Not available. Source: ABS, International Trade, Australia, cat. no. 5465.0, Canberra.
Imp o r t s
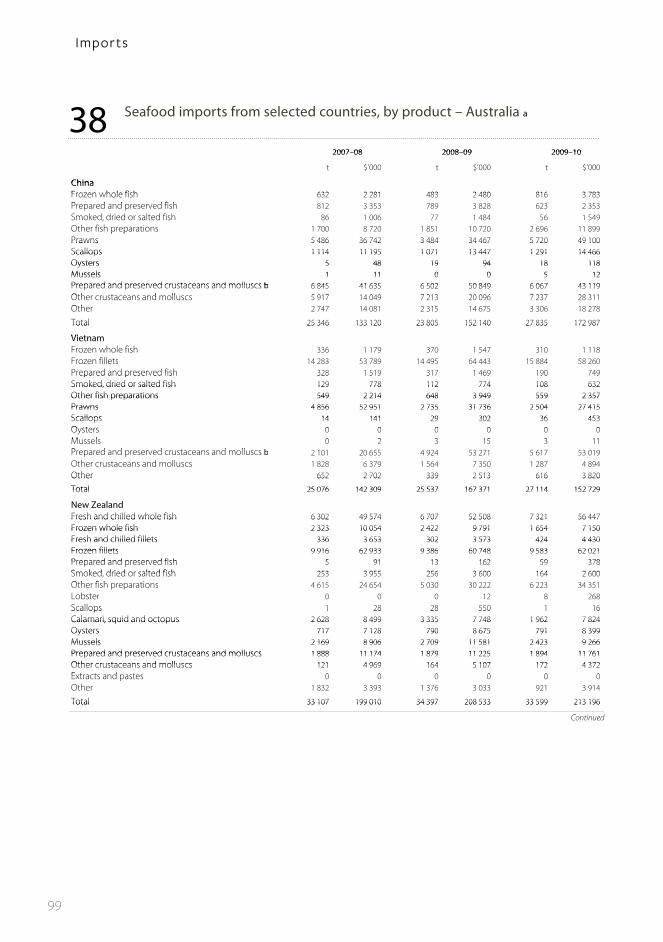
99
38 Seafood imports from selected countries, by product – Australia a 3838 Seafood imports from selected countries, by product - Australia a38 Seafood imports from selected countries, by product Australia a
2007 08 2008 09 2009 102007–08 2008–09 2009–10
t $’000 t $’000 t $’000$ $ $
ChinaChinaFrozen whole fish 632 2 281 483 2 480 816 3 783Frozen whole fish 632 2 281 483 2 480 816 3 783P d d d fi h 812 3 353 789 3 828 623 2 353Prepared and preserved fish 812 3 353 789 3 828 623 2 353S k d d d l d f hSmoked, dried or salted fish 86 1 006 77 1 484 56 1 549Other fish preparations 1 700 8 720 1 851 10 720 2 696 11 899p pPrawns 5 486 36 742 3 484 34 467 5 720 49 100Prawns 5 486 36 742 3 484 34 467 5 720 49 100Scallops 1 114 11 195 1 071 13 447 1 291 14 466Scallops 1 114 11 195 1 071 13 447 1 291 14 466Oysters 5 48 19 94 18 118Oysters 5 48 19 94 18 118Mussels 1 11 0 0 5 12Mussels 1 11 0 0 5 12Prepared and preserved crustaceans and molluscs b 6 845 41 635 6 502 50 849 6 067 43 119Prepared and preserved crustaceans and molluscs b 6 845 41 635 6 502 50 849 6 067 43 119Other crustaceans and molluscs 5 917 14 049 7 213 20 096 7 237 28 311Other crustaceans and molluscs 5 917 14 049 7 213 20 096 7 237 28 311O hOther 2 747 14 081 2 315 14 675 3 306 18 278
Total 25 346 133 120 23 805 152 140 27 835 172 987Total 25 346 133 120 23 805 152 140 27 835 172 987
VietnamVietnamF h l fi hFrozen whole fish 336 1 179 370 1 547 310 1 118Frozen fillets 14 283 53 789 14 495 64 443 15 884 58 260Prepared and preserved fish 328 1 519 317 1 469 190 749Prepared and preserved fish 328 1 519 317 1 469 190 749Smoked, dried or salted fish 129 778 112 774 108 632Smoked, dried or salted fish 129 778 112 774 108 632Other fish preparations 549 2 214 648 3 949 559 2 357Other fish preparations 549 2 214 648 3 949 559 2 357Prawns 4 856 52 951 2 735 31 736 2 504 27 415Prawns 4 856 52 951 2 735 31 736 2 504 27 415Scallops 14 141 29 302 36 453Scallops 14 141 29 302 36 453Oysters 0 0 0 0 0 0Oysters 0 0 0 0 0 0M l 0 2 3 15 3 11Mussels 0 2 3 15 3 11P d d d d ll bPrepared and preserved crustaceans and molluscs b 2 101 20 655 4 924 53 271 5 617 53 019Other crustaceans and molluscs 1 828 6 379 1 564 7 350 1 287 4 894Other 652 2 702 339 2 513 616 3 820Other 652 2 702 339 2 513 616 3 820
Total 25 076 142 309 25 537 167 371 27 114 152 729Total 25 076 142 309 25 537 167 371 27 114 152 729
New ZealandFresh and chilled whole fish 6 302 49 574 6 707 52 508 7 321 56 447Fresh and chilled whole fish 6 302 49 574 6 707 52 508 7 321 56 447Frozen whole fish 2 323 10 054 2 422 9 791 1 654 7 150Frozen whole fish 2 323 10 054 2 422 9 791 1 654 7 150Fresh and chilled fillets 336 3 653 302 3 573 424 4 430Fresh and chilled fillets 336 3 653 302 3 573 424 4 430Frozen fillets 9 916 62 933 9 386 60 748 9 583 62 021Frozen fillets 9 916 62 933 9 386 60 748 9 583 62 021Prepared and preserved fish 5 91 13 162 59 378Prepared and preserved fish 5 91 13 162 59 378Smoked dried or salted fish 253 3 955 256 3 600 164 2 600Smoked, dried or salted fish 253 3 955 256 3 600 164 2 600O h fi h iOther fish preparations 4 615 24 654 5 030 30 222 6 223 34 351Lobster 0 0 0 12 8 268Scallops 1 28 28 550 1 16Scallops 1 28 28 550 1 16Calamari, squid and octopus 2 628 8 499 3 335 7 748 1 962 7 824Calamari, squid and octopus 2 628 8 499 3 335 7 748 1 962 7 824Oysters 717 7 128 790 8 675 791 8 399Oysters 717 7 128 790 8 675 791 8 399Mussels 2 169 8 906 2 709 11 581 2 423 9 266Mussels 2 169 8 906 2 709 11 581 2 423 9 266Prepared and preserved crustaceans and molluscs 1 888 11 174 1 879 11 225 1 894 11 761Prepared and preserved crustaceans and molluscs 1 888 11 174 1 879 11 225 1 894 11 761Other crustaceans and molluscs 121 4 969 164 5 107 172 4 372Other crustaceans and molluscs 121 4 969 164 5 107 172 4 372E t t d t 0 0 0 0 0 0Extracts and pastes 0 0 0 0 0 0O hOther 1 832 3 393 1 376 3 033 921 3 914
Total 33 107 199 010 34 397 208 533 33 599 213 196Total 33 107 199 010 34 397 208 533 33 599 213 196
C i dContinued
Imp o r t s
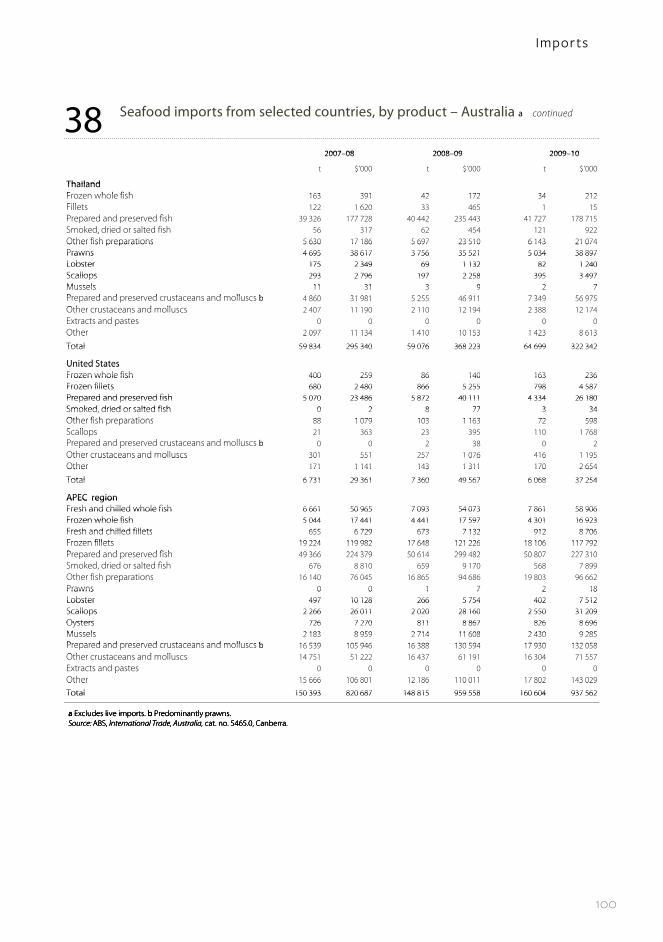
100
38 Seafood imports from selected countries, by product – Australia a continued 3838 Seafood imports from selected countries, by product - Australia a continued38 Seafood imports from selected countries, by product Australia a continued
2007 08 2008 09 2009 102007–08 2008–09 2009–10
t $’000 t $’000 t $’000$ $ $
ThailandThailandFrozen whole fish 163 391 42 172 34 212Frozen whole fish 163 391 42 172 34 212Fill t 122 1 620 33 465 1 15Fillets 122 1 620 33 465 1 15P d d d f hPrepared and preserved fish 39 326 177 728 40 442 235 443 41 727 178 715p pSmoked, dried or salted fish 56 317 62 454 121 922,Other fish preparations 5 630 17 186 5 697 23 510 6 143 21 074Other fish preparations 5 630 17 186 5 697 23 510 6 143 21 074Prawns 4 695 38 617 3 756 35 521 5 034 38 897Prawns 4 695 38 617 3 756 35 521 5 034 38 897Lobster 175 2 349 69 1 132 82 1 240Lobster 175 2 349 69 1 132 82 1 240Scallops 293 2 796 197 2 258 395 3 497Scallops 293 2 796 197 2 258 395 3 497Mussels 11 31 3 9 2 7Mussels 11 31 3 9 2 7Prepared and preserved crustaceans and molluscs b 4 860 31 981 5 255 46 911 7 349 56 975Prepared and preserved crustaceans and molluscs b 4 860 31 981 5 255 46 911 7 349 56 975O h d llOther crustaceans and molluscs 2 407 11 190 2 110 12 194 2 388 12 174Extracts and pastes 0 0 0 0 0 0pOther 2 097 11 134 1 410 10 153 1 423 8 613Other 2 097 11 134 1 410 10 153 1 423 8 613
Total 59 834 295 340 59 076 368 223 64 699 322 342Total 59 834 295 340 59 076 368 223 64 699 322 342
United StatesUnited StatesFrozen whole fish 400 259 86 140 163 236Frozen whole fish 400 259 86 140 163 236Frozen fillets 680 2 480 866 5 255 798 4 587Frozen fillets 680 2 480 866 5 255 798 4 587Prepared and preserved fish 5 070 23 486 5 872 40 111 4 334 26 180Prepared and preserved fish 5 070 23 486 5 872 40 111 4 334 26 180Smoked dried or salted fish 0 2 8 77 3 34Smoked, dried or salted fish 0 2 8 77 3 34Other fish preparations 88 1 079 103 1 163 72 598Other fish preparations 88 1 079 103 1 163 72 598S ll 21 363 23 395 110 1 768Scallops 21 363 23 395 110 1 768P d d d d llPrepared and preserved crustaceans and molluscs b 0 0 2 38 0 2p pOther crustaceans and molluscs 301 551 257 1 076 416 1 195Ot e c ustacea s a d o uscs 30 55 5 0 6 6 95Other 171 1 141 143 1 311 170 2 654Other 171 1 141 143 1 311 170 2 654
Total 6 731 29 361 7 360 49 567 6 068 37 254Total 6 731 29 361 7 360 49 567 6 068 37 254
APEC regionAPEC regionFresh and chilled whole fish 6 661 50 965 7 093 54 073 7 861 58 906Fresh and chilled whole fish 6 661 50 965 7 093 54 073 7 861 58 906Frozen whole fish 5 044 17 441 4 441 17 597 4 301 16 923Frozen whole fish 5 044 17 441 4 441 17 597 4 301 16 923Fresh and chilled fillets 655 6 729 673 7 132 912 8 706Fresh and chilled fillets 655 6 729 673 7 132 912 8 706Frozen fillets 19 224 119 982 17 648 121 226 18 106 117 792Frozen fillets 19 224 119 982 17 648 121 226 18 106 117 792P d d d fi h 49 366 224 379 50 614 299 482 50 807 227 310Prepared and preserved fish 49 366 224 379 50 614 299 482 50 807 227 310S k d d d l d f hSmoked, dried or salted fish 676 8 810 659 9 170 568 7 899Other fish preparations 16 140 76 045 16 865 94 686 19 803 96 662p pPrawns 0 0 1 7 2 18Prawns 0 0 1 7 2 18Lobster 497 10 128 266 5 754 402 7 512Lobster 497 10 128 266 5 754 402 7 512Scallops 2 266 26 011 2 020 28 160 2 550 31 209Scallops 2 266 26 011 2 020 28 160 2 550 31 209Oysters 726 7 270 811 8 867 826 8 696Oysters 726 7 270 811 8 867 826 8 696Mussels 2 183 8 959 2 714 11 608 2 430 9 285Mussels 2 183 8 959 2 714 11 608 2 430 9 285Prepared and preserved crustaceans and molluscs b 16 539 105 946 16 388 130 594 17 930 132 058Prepared and preserved crustaceans and molluscs b 16 539 105 946 16 388 130 594 17 930 132 058Oth t d llOther crustaceans and molluscs 14 751 51 222 16 437 61 191 16 304 71 557
dExtracts and pastes 0 0 0 0 0 0pOther 15 666 106 801 12 186 110 011 17 802 143 029Other 15 666 106 801 12 186 110 011 17 802 143 029
Total 150 393 820 687 148 815 959 558 160 604 937 562Total 150 393 820 687 148 815 959 558 160 604 937 562
a Excludes live imports b Predominantly prawnsa Excludes live imports. b Predominantly prawns.Source: ABS, International Trade, Australia, cat. no. 5465.0, Canberra.a Excludes live imports. b Predominantly prawns.Source: ABS, International Trade, Australia, cat. no. 5465.0, Canberra.a Excludes live imports. b Predominantly prawns.Source: ABS, International Trade, Australia, cat. no. 5465.0, Canberra.a Excludes live imports. b Predominantly prawns.Source: ABS, International Trade, Australia, cat. no. 5465.0, Canberra.Source: ABS, International Trade, Australia, cat. no. 5465.0, Canberra.
Imp o r t s
Related Documents