www.bricdata.com Australian Mining Industry Outlook – Market Opportunities and Entry Strategies, Analyses and Forecasts to 2016 Industry Forecast Report Reference code: MN0040MR Published: March 2012 BRICdata John Carpenter House 7 Carmelite Street London EC4Y 0BS United Kingdom Tel: +44 (0) 20 7936 6400 Fax: +44 (0) 20 7336 6813 www.bricdata.com

Welcome message from author
This document is posted to help you gain knowledge. Please leave a comment to let me know what you think about it! Share it to your friends and learn new things together.
Transcript
www.bricdata.com
Australian Mining Industry
Outlook – Market Opportunities
and Entry Strategies, Analyses
and Forecasts to 2016
Industry Forecast Report
Reference code: MN0040MR
Published: March 2012
BRICdata
John Carpenter House
7 Carmelite Street
London EC4Y 0BS
United Kingdom
Tel: +44 (0) 20 7936 6400
Fax: +44 (0) 20 7336 6813
www.bricdata.com
EXECUTIVE SUMMARY
Australian Mining Industry Outlook – Market Opportunities and Entry Strategies, Analyses and
Forecasts to 2016 Page 2
© BRICdata. This product is licensed and is not to be photocopied Published: March 2012
1 Executive Summary
Australia is one of the leading producers of several minerals within the global mining industry. Australia possesses
substantial deposits of a variety of minerals, including iron ore, nickel, bauxite, copper, gold, silver, uranium, diamonds,
zinc and coal. BRICdata expects that the volume of minerals produced from the Australian mining industry will increase
from XXX.X million tons in 2011 to X.X billion tons in 2016, at a compound annual growth rate (CAGR) of X.XX% over the
forecast period (2012–2016). This growth will be influenced by the relatively low value of mining in 2011, since flooding in
the country postponed mining activities. However, the growth in mining production volume will also benefit from the
completion of new mining projects across the country, most notably projects by Rio Tinto, BHP Billiton and Xstrata.
Iron ore and bauxite production volume growth
Australia’s iron ore production output is expected to record the highest growth rate, at a CAGR of X.XX% over the forecast
period, with the country’s iron ore production increasing from XXX million in 2011 to XXX.X million tons in 2016. Since iron
ore accounts for the largest proportion of around XX% of the mining industry's output value, this rising iron ore production
volume will have a positive impact on the Australian mining industry value. The growth in iron ore production will be driven
by the mining project expansion activities of BHP Billiton and Rio Tinto. BHP Billiton is expected to increase its iron ore
output in its Western Australian operations from XXX million tons per annum (mtpa) to XXXmtpa in 2014. Meanwhile, Rio
Tinto is anticipated to increase its production in its Pilbara operations from XXXmtpa to XXXmtpa in 2015.
BRICdata also expects that Australia will remain the world's largest bauxite producer by recording average annual output
growth rates of X.X% over the forecast period, to increase output from XXmtpa in 2010 to 99.7mtpa in 2016. The vast
majority of this growth is due to expansion plans at Rio Tinto's Weipa mine, the world's largest bauxite mine, which is
expected to increase production volume from XXmtpa to XXmtpa in 2013.
Changing coal dynamics
Australia’s coal production output is expected to record average annual growth rates of X.X% over the forecast period,
from XXXmtpa in 2011 to XXXmtpa in 2016. The BRICdata forecast for coal production in Australia was revised down
from XXXmtpa to XXXmtpa in 2011, due to the effects of flooding which postponed mining production in Queensland at
the start of the year. BRICdata expects there will be significant changes in the global coal production dynamics over the
forecast period, which could have a substantial impact on global shipping and infrastructure. It is anticipated that
Australia’s coal exports to China and India will reduce over the forecast period, as Indonesia plans to increase its domestic
coal consumption and Australia's taxes on carbon emissions and coal mining profits are likely to deter investment.
Meanwhile, Australia’s coal imports are expected to be replaced by the increased coal production in Southern Africa and
the US. Several coal production projects have been announced in Mozambique and South Africa, and the vast majority of
coal produced in these products will be exported as there is currently little demand for coal in the local region.
Changing regulatory environment
Australia's mining industry is one of the most attractive for investments in the world, and there are both domestic and
foreign mining companies operating in the country. Australia is expected to remain a highly attractive destination for
foreign investment, despite the proposed XX% tax on mining companies' profits in coal and iron ore production. The
proposed tax is not expected to have a significant impact on investments in the Australian mining industry, as investors
concerns regarding the tax are expected to be outweighed by the country's large mineral wealth. Moreover, the proposed
tax could be reduced as the ruling coalition only has a one seat majority, and it may be difficult to get the bill passed
through parliament without compromise. If the bill is implemented, it is expected to become effective from July 2012.
Investments announced despite proposed tax on mining
The proposed XX% tax on mining company profits has not significantly affected investments in the Australian mining
industry, since several new coal and iron ore mining projects were announced in the country after the tax was first
proposed. Xstrata and CBH Resources plan to add another XXmtpa to their coal product by 2013, while Rio Tinto and
Fortescue Metals have announced large-scale plans to increase their iron ore output by a total of XXXmtpa by 2015. Since
the announcement of the new tax, Rio Tinto has proceeded with investments worth US$X.X billion in new Australian
mining projects, and Xstrata has committed US$X.X billion in new coal mine investments. As such, the tax rise has not yet
significantly deterred investment in the Australian mining industry.
EXECUTIVE SUMMARY
Australian Mining Industry Outlook – Market Opportunities and Entry Strategies, Analyses and
Forecasts to 2016 Page 3
© BRICdata. This product is licensed and is not to be photocopied Published: March 2012
Competitive landscape
Due to its strong growth potential and high-quality infrastructure, Australia contains some of the leading companies within
the global mining industry. The multinationals operating in the Australian mining industry include Australian companies,
such as BHP Billiton and Newcrest Mining, and large foreign mining companies, such as Rio Tinto, Norilsk Nickel and
Xstrata. It is expected that Australia's mining industry will remain dominated by large miners, with the exception of coal,
which could become slightly more fragmented as Hancock Coal develops a XXmtpa Alpha coal mine project and Waratah
Coal develops a XXmtpa Galilee coal mine. These mines will begin to produce coal output from 2013. These projects are
the largest planned in the country’s coal production, which will enable the two companies to become significant coal
miners in Australia over the forecast period.
TABLE OF CONTENTS
Australian Mining Industry Outlook – Market Opportunities and Entry Strategies, Analyses and
Forecasts to 2016 Page 4
© BRICdata. This product is licensed and is not to be photocopied Published: March 2012
TABLE OF CONTENTS
1 Executive Summary ......................................................................................................................... 2 2 Mining Industry Outlook in Australia............................................................................................... 9
2.1 Mining Industry Market Size and Growth Potential .............................................................................. 9
2.2 Market Share and Production Trend Analysis by Mining Category .................................................... 10
3 Mining Industry Key Trends, Growth Drivers and Challenges ..................................................... 15
3.1 Key Trends and Growth Drivers ........................................................................................................ 15
3.2 End User Market Dynamics .............................................................................................................. 18
3.3 Macroeconomic Drivers .................................................................................................................... 21
3.6 Challenges ....................................................................................................................................... 26
4 Mining Equipment Market Size and Growth Potential .................................................................. 27 5 Regulatory Framework ................................................................................................................... 28
5.1 Regulation of Foreign Investments ................................................................................................... 28
5.2 Organization Health and Safety (OHS) Standards ............................................................................ 29
5.3 Market Entry Route .......................................................................................................................... 29
6 Benchmarking with Key Global Markets ....................................................................................... 31
6.1 Copper ............................................................................................................................................. 31
6.2 Diamond .......................................................................................................................................... 32
6.3 Iron Ore............................................................................................................................................ 33
6.4 Nickel ............................................................................................................................................... 34
6.5 Bauxite ............................................................................................................................................. 35
6.6 Gold ................................................................................................................................................. 36
7 Industry Structure and Dynamics of Coal, Metallic and Non-Metallic Mining ............................. 37
7.1 Five Forces Analysis: Coal ............................................................................................................... 37
7.1.1 Bargaining power of supplier: medium .............................................................................................. 38
7.1.2 Bargaining power of buyer: medium to high ...................................................................................... 38
7.1.3 Barrier to entry: medium ................................................................................................................... 38
7.1.4 Intensity of rivalry: medium ............................................................................................................... 38
7.1.5 Threat of substitution: medium to high .............................................................................................. 38
7.2 Five Forces Analysis: Metallic Minerals ............................................................................................ 39
7.2.1 Bargaining power of supplier: medium to high ................................................................................... 39
7.2.2 Bargaining power of buyer: low to high ............................................................................................. 40
7.2.3 Barrier to entry: medium ................................................................................................................... 40
7.2.4 Intensity of rivalry: low to medium ..................................................................................................... 40
7.2.5 Threat of substitution: low to medium................................................................................................ 41
7.3 Five Forces Analysis: Non-Metallic Minerals ..................................................................................... 42
7.3.1 Bargaining power of supplier: low to medium .................................................................................... 42
7.3.2 Bargaining power of buyer: low ......................................................................................................... 42
7.3.3 Barrier to entry: low .......................................................................................................................... 42
7.3.4 Intensity of rivalry: high ..................................................................................................................... 43
7.3.5 Threat of substitution: low ................................................................................................................. 43
7.4 Five Forces Analysis: Mining Equipment........................................................................................... 44
7.4.1 Bargaining power of supplier: low to medium .................................................................................... 44
TABLE OF CONTENTS
Australian Mining Industry Outlook – Market Opportunities and Entry Strategies, Analyses and
Forecasts to 2016 Page 5
© BRICdata. This product is licensed and is not to be photocopied Published: March 2012
7.4.2 Bargaining power of buyer: low to medium ....................................................................................... 44
7.4.3 Barrier to entry: medium ................................................................................................................... 44
7.4.4 Intensity of rivalry: medium to high .................................................................................................... 45
7.4.5 Threat of substitution: low ................................................................................................................. 45
8 Coal ................................................................................................................................................. 46
8.1 Overview of Coal Mining Category .................................................................................................... 46
8.2 Reserves, Production and Consumption ........................................................................................... 46
8.2.1 Total reserves .................................................................................................................................. 46
8.2.2 Total production ............................................................................................................................... 47
8.2.3 Total consumption ............................................................................................................................ 51
8.3 Imports and Exports ......................................................................................................................... 52
8.3.1 Coal import....................................................................................................................................... 52
8.3.2 Coal export....................................................................................................................................... 53
8.4 Top Active Projects .......................................................................................................................... 54
8.5 Key Processing Units ....................................................................................................................... 55
8.6 News and Deals ............................................................................................................................... 56
8.7 Competitive Landscape .................................................................................................................... 57
9 Iron Ore ........................................................................................................................................... 58
9.1 Overview of Iron Ore Mining Sub-Category ....................................................................................... 58
9.2 Reserves, Production and Consumption ........................................................................................... 58
9.2.1 Total reserves .................................................................................................................................. 58
9.2.2 Total production ............................................................................................................................... 59
9.2.3 Total consumption ............................................................................................................................ 63
9.3 Imports and Exports ......................................................................................................................... 64
9.3.1 Iron ore import .................................................................................................................................. 64
9.3.2 Iron ore export .................................................................................................................................. 65
9.4 Top Active Projects .......................................................................................................................... 66
9.5 Key Processing Units ....................................................................................................................... 67
9.6 News and Deals ............................................................................................................................... 68
9.7 Competitive Landscape .................................................................................................................... 69
10 Phosphate Rock ............................................................................................................................. 70
10.1 Overview of Phosphate Rock Mining Sub-Category .......................................................................... 70
10.2 Reserves, Production and Consumption ........................................................................................... 70
10.2.1 Total reserves .................................................................................................................................. 70
10.2.2 Production ........................................................................................................................................ 71
10.2.3 Consumption .................................................................................................................................... 75
10.3 Imports and Exports ......................................................................................................................... 76
10.3.1 Phosphate rock imports .................................................................................................................... 76
10.3.2 Phosphate rock export...................................................................................................................... 77
10.4 Top Active Projects .......................................................................................................................... 78
10.5 Key Processing Units ....................................................................................................................... 78
10.6 News and Deals ............................................................................................................................... 78
10.7 Competitive Landscape .................................................................................................................... 79
TABLE OF CONTENTS
Australian Mining Industry Outlook – Market Opportunities and Entry Strategies, Analyses and
Forecasts to 2016 Page 6
© BRICdata. This product is licensed and is not to be photocopied Published: March 2012
11 Salt .................................................................................................................................................. 80
11.1 Overview of Salt Mining Sub-Category ............................................................................................. 80
11.2 Reserves, Production and Consumption ........................................................................................... 81
11.2.1 Total reserves .................................................................................................................................. 81
11.2.2 Total production volume ................................................................................................................... 81
11.2.3 Total production value ...................................................................................................................... 83
11.2.4 Total consumption ............................................................................................................................ 85
11.3 Imports and Exports ......................................................................................................................... 86
11.3.1 Salt imports ...................................................................................................................................... 86
11.3.2 Salt exports ...................................................................................................................................... 87
11.4 Top Active Projects .......................................................................................................................... 88
11.5 Key Processing Units ....................................................................................................................... 88
11.6 News and Deals ............................................................................................................................... 89
11.7 Competitive Landscape .................................................................................................................... 89
12 Competitive Landscape and Strategic Insights ............................................................................ 90
12.1 Competitive Landscape: Overview .................................................................................................... 90
12.2 Key Companies ................................................................................................................................ 93
12.2.2 BHP Billiton Ltd: recent announcements and strategic initiatives ....................................................... 93
12.2.3 BHP Billiton Ltd: products ................................................................................................................. 94
12.2.5 Rio Tinto Ltd: recent announcements and strategic initiatives ........................................................... 96
12.2.6 Rio Tinto Ltd: products and services ................................................................................................. 97
12.2.7 Fortescue Metals Group Ltd (Fortescue): overview ........................................................................... 98
12.2.8 Fortescue Metals Group Ltd (Fortescue): recent announcements and strategic initiatives ................. 98
12.2.9 Fortescue Metals Group Ltd (Fortescue): products ........................................................................... 98
12.2.10 BlueScope Steel Ltd: overview ......................................................................................................... 99
12.2.11 BlueScope Steel Ltd: recent announcements and strategic initiatives................................................ 99
12.2.12 BlueScope Steel Ltd: products .......................................................................................................... 99
12.2.13 OZ Minerals: overview .................................................................................................................... 100
12.2.14 OZ Minerals Ltd: recent announcements and strategic initiatives .................................................... 100
12.2.15 Alcoa of Australia Ltd: overview ...................................................................................................... 101
12.2.16 Alcoa of Australia Ltd: recent announcements and strategic initiatives ............................................ 101
12.2.17 Alcoa of Australia Ltd: products and services .................................................................................. 101
12.2.18 Xstrata Australia: overview ............................................................................................................. 102
12.2.19 Xstrata Australia: recent announcements and strategic initiatives.................................................... 102
12.2.20 Xstrata Australia: products and services ......................................................................................... 103
13 Appendix ...................................................................................................................................... 104
13.1 About BRICdata ............................................................................................................................. 104
13.1.1 Areas of expertise .......................................................................................................................... 104
13.2 Methodology .................................................................................................................................. 105
13.3 Definitions ...................................................................................................................................... 106
13.4 Disclaimer ...................................................................................................................................... 107
TABLE OF CONTENTS
Australian Mining Industry Outlook – Market Opportunities and Entry Strategies, Analyses and
Forecasts to 2016 Page 7
© BRICdata. This product is licensed and is not to be photocopied Published: March 2012
LIST OF FIGURES
Figure 1: Australian Mining Production Volume (Million Tons), 2007–2016 ....................................................................................................... 9 Figure 2: Australian Mining Industry Production Volume by Mineral Category (% Share), 2011 and 2016 .................................................... 10 Figure 3: Australian Coal Production Volume (Million Tons), 2007–2016 ......................................................................................................... 11 Figure 4: Australian Iron Ore Production Volume (Million Tons), 2007–2016 ................................................................................................... 12 Figure 5: Australian Bauxite Production Volume (Million Tons), 2007–2016 .................................................................................................... 13 Figure 6: Australian Phosphate Rock Production Volume (Million Tons), 2007–2016 ..................................................................................... 14 Figure 7: Australian Salt Production Volume (Million Tons), 2007–2016 .......................................................................................................... 14 Figure 8: Australian Electricity Production (Billion Kilowatt Hours), 2007–2016 ............................................................................................... 18 Figure 9: Australian Automobile Production Trend (Units), 2007–2016 ............................................................................................................ 19 Figure 10: Australian Construction Net Output at Current Prices (US$ Billion), 2007–2016............................................................................ 20 Figure 11: Australian GDP at Constant Prices (US$ Billion), 2007–2016 (Base Year 1999–2000)................................................................. 21 Figure 12: Australian Inflation Rate (%), 2007–2016 ......................................................................................................................................... 22 Figure 13: Australian Manufacturing Net Output at Current Prices (US$ Billion), 2007–2016 ......................................................................... 23 Figure 14: Australian Electricity Consumption (Billion Kilowatt Hours), 2007–2016 ......................................................................................... 24 Figure 15: Australian Crude Steel Production (Million Metric Tons), 2007–2016 ............................................................................................. 25 Figure 16: Australian Mining and Construction Equipment Industry (US$ Billion), 2007–2011 ....................................................................... 27 Figure 17: Global Copper Production and Reserves in Volume Terms (% Share), 2010 ................................................................................ 31 Figure 18: Global Industrial Diamond Production and Reserves in Volume Terms (% Share), 2010 .............................................................. 32 Figure 19: Global Iron Ore Production and Reserves in Volume Terms (% Share), 2010 ............................................................................... 33 Figure 20: Global Nickel Production and Reserves in Volume Terms (% Share), 2010 .................................................................................. 34 Figure 21: Global Bauxite Production and Reserves in Volume Terms (% Share), 2010 ................................................................................ 35 Figure 22: Global Gold Production and Reserves in Volume Terms (% Share), 2010 ..................................................................................... 36 Figure 23: Australian Mining Industry Dynamics: Coal Category ...................................................................................................................... 37 Figure 24: Australian Mining Industry Dynamics: Metallic Minerals Category .................................................................................................. 39 Figure 25: Australian Mining Industry Dynamics: Non-Metallic Minerals Category .......................................................................................... 42 Figure 26: Australian Mining Industry Dynamics: Mining Equipment Industry .................................................................................................. 44 Figure 27: Australian Coal Production Volume (Million Tons), 2007–2011....................................................................................................... 47 Figure 28: Australian Coal Production Volume (Million Tons), 2012–2016....................................................................................................... 48 Figure 29: Australian Coal Production Value (AUD Billion), 2007–2011 ........................................................................................................... 49 Figure 30: Australian Coal Production Value (AUD Million), 2012–2016 .......................................................................................................... 50 Figure 31: Australian Coal Consumption Volume (Million Tons), 2007–2011 .................................................................................................. 51 Figure 32: Australian Coal Import Volume (Million Tons), 2006–2010 .............................................................................................................. 52 Figure 33: Australian Coal Export Volume (Million Tons), 2006–2010.............................................................................................................. 53 Figure 34: Australian Leading Coal Producers (% Share), 2011 ....................................................................................................................... 57 Figure 35: Australian Iron Ore Production Volume (Million Tons), 2007–2011 ................................................................................................. 59 Figure 36: Australian Iron Ore Production Volume (Million Tons), 2012–2016 ................................................................................................. 60 Figure 37: Australian Iron Ore Production Value (AUD Million), 2007–2011 .................................................................................................... 61 Figure 38: Australian Iron Ore Production Value (AUD Million), 2012–2016 .................................................................................................... 62 Figure 39: Australian Iron Ore Consumption Value (Million Tons), 2007–2016................................................................................................ 63 Figure 40: Australian Iron Ore Import Volume (Million Tons), 2006–2011 ........................................................................................................ 64 Figure 41: Australian Iron Ore Export Volume (Million Tons), 2006–2011........................................................................................................ 65 Figure 42: Australian Leading Iron Ore Producers (% Share), 2011 ................................................................................................................. 69 Figure 43: Australian Phosphate Rock Production Volume (Thousand Tons), 2007–2011 ............................................................................. 71 Figure 44: Australian Phosphate Rock Production Volume (Thousand Tons), 2012–2016 ............................................................................. 72 Figure 45: Australian Phosphate Rock Production Value (AUD Million), 2007–2011....................................................................................... 73 Figure 46: Australian Phosphate Rock Production Value (AUD Million), 2012–2016....................................................................................... 74 Figure 47: Australian Phosphate Rock Consumption Volume (Thousand Tons), 2007–2011 ......................................................................... 75 Figure 48: Australian Phosphate Rock Import Volume (Thousand Tons), 2007–2011 .................................................................................... 76 Figure 49: Australian Phosphate Rock Export Volume (Thousand Tons), 2007–2011 .................................................................................... 77 Figure 50: Australian Salt Production Operations .............................................................................................................................................. 80 Figure 51: Australian Salt Production Volume (Million Tons), 2007–2011 ........................................................................................................ 81 Figure 52: Australian Salt Production Volume (Million Tons), 2012–2016 ........................................................................................................ 82 Figure 53: Australian Salt Production Value (AUD Million), 2007–2011 ........................................................................................................... 83 Figure 54: Australian Salt Production Value (AUD Million), 2012–2016 ........................................................................................................... 84 Figure 55: Australian Salt Consumption Volume (Million Tons), 2007–2011 .................................................................................................... 85 Figure 56: Australian Salt Import Volume (Million Tons), 2007–2011 ............................................................................................................... 86 Figure 57: Australian Salt Export Volume (Million Tons), 2007–2011 ............................................................................................................... 87 Figure 58: Australian Leading Mining Companies – Revenue Comparison (US$ Million), 2007–2011 ........................................................... 91
TABLE OF CONTENTS
Australian Mining Industry Outlook – Market Opportunities and Entry Strategies, Analyses and
Forecasts to 2016 Page 8
© BRICdata. This product is licensed and is not to be photocopied Published: March 2012
LIST OF TABLES
Table 1: Investments and Announcements of Capacity Expansions by Key Australian Mining Operators in 2008–2009 .............................. 16 Table 2: Australian GDP at Constant Prices (US$ Billion), 2007–2016 (Base Year 1999–2000) .................................................................... 21 Table 3: Australian Inflation Rate (%), 2007–2016 ............................................................................................................................................ 22 Table 4: Australian Mining Industry Entry Strategy of Foreign Companies,...................................................................................................... 29 Table 5: Australian Coal Production Volume (Million Tons), 2007–2011 .......................................................................................................... 47 Table 6: Australian Coal Production Volume (Million Tons), 2012–2016 .......................................................................................................... 48 Table 7: Australian Coal Production Value (AUD Billion), 2007–2011 .............................................................................................................. 49 Table 8: Australian Coal Production Value (US$ Billion), 2007–2011............................................................................................................... 49 Table 9: Australian Coal Production Value (AUD Billion), 2012–2016 .............................................................................................................. 50 Table 10: Australian Coal Production Value (US$ Billion), 2012–2016............................................................................................................. 50 Table 11: Australian Coal Consumption Volume (Million Tons), 2007–2011 .................................................................................................... 51 Table 12: Australian Coal Import Volume (Million Tons), 2006–2010 ............................................................................................................... 52 Table 13: Australian Coal Export Volume (Million Tons), 2006–2010 ............................................................................................................... 53 Table 14: Key Australian Coal Mining Projects, 2011–2016 .............................................................................................................................. 54 Table 15: Key Australian Coal Mines* ................................................................................................................................................................ 55 Table 16: Australian Iron Ore Production Volume (Million Tons), 2007–2011 .................................................................................................. 59 Table 17: Australian Iron Ore Production Volume (Million Tons), 2012–2016 .................................................................................................. 60 Table 18: Australian Iron Ore Production Value (AUD Million), 2007–2011 ..................................................................................................... 61 Table 19: Australian Iron Ore Production Value (US$ Million), 2007–2011 ...................................................................................................... 61 Table 20: Australian Iron Ore Production Value (AUD Million), 2012–2016 ..................................................................................................... 62 Table 21: Australian Iron Ore Production Value (US$ Million), 2012–2016 ...................................................................................................... 62 Table 22: Australian Iron Ore Consumption Volume (Million Tons), 2007–2011 .............................................................................................. 63 Table 23: Australian Iron Ore Import Volume (Million Tons), 2006–2011 ......................................................................................................... 64 Table 24: Australian Iron Ore Export Volume (Million Tons), 2006–2011 ......................................................................................................... 65 Table 25: Key Projects ........................................................................................................................................................................................ 66 Table 26: Key Australian Iron Ore Processing Units .......................................................................................................................................... 67 Table 27: Australian Phosphate Rock Production Volume (Thousand Tons), 2007–2011 .............................................................................. 71 Table 28: Australian Phosphate Rock Production Volume (Thousand Tons), 2012–2016 .............................................................................. 72 Table 29: Australian Phosphate Rock Production Value (AUD Million), 2007–2011 ........................................................................................ 73 Table 30: Australian Phosphate Rock Production Value (US$ Million), 2007–2011 ........................................................................................ 73 Table 31: Australian Phosphate Rock Production Value (AUD Million), 2012–2016 ........................................................................................ 74 Table 32: Australian Phosphate Rock Production Value (US$ Million), 2012–2016 ........................................................................................ 74 Table 33: Australian Phosphate Rock Consumption Volume (Thousand Tons), 2007–2011 .......................................................................... 75 Table 34: Australian Phosphate Rock Import Volume (Thousand Tons), 2007–2011...................................................................................... 76 Table 35: Australian Phosphate Rock Export Volume (Thousand Tons), 2007–2011 ..................................................................................... 77 Table 36: Australian Salt Production Volume (Million Tons), 2007–2011 ......................................................................................................... 81 Table 37: Australian Salt Production Volume (Million Tons), 2012–2016 ......................................................................................................... 82 Table 38: Australian Salt Production Value (AUD Million), 2007–2011............................................................................................................. 83 Table 39: Australian Salt Production Value (US$ Million), 2007–2011 ............................................................................................................. 83 Table 40: Australian Salt Production Value (AUD Million), 2012–2016............................................................................................................. 84 Table 41: Australian Salt Production Value (US$ Million), 2012–2016 ............................................................................................................. 84 Table 42: Australian Salt Consumption Volume (Million Tons), 2007–2011 ..................................................................................................... 85 Table 43: Australian Salt Import Volume (Million Tons), 2007–2011 ................................................................................................................ 86 Table 44: Australian Salt Export Volume (Million Tons), 2007–2011 ................................................................................................................ 87 Table 45: Key Australian Salt Mining Processing Units ..................................................................................................................................... 88 Table 46: Production Capacities of Leading Australian Salt Producers ............................................................................................................ 89 Table 47: Australian Leading Mining Companies – Financial Comparison (US$ Million), 2007–2011 ............................................................ 91 Table 48: Exchange Rate (US$–AUD), 2007–2016......................................................................................................................................... 106
INDUSTRY DYNAMICS: FIVE FORCES ANALYSIS
Australian Mining Industry Outlook – Market Opportunities and Entry Strategies, Analyses and
Forecasts to 2016 Page 9
© BRICdata. This product is licensed and is not to be photocopied Published: March 2012
2 Mining Industry Outlook in Australia
Australia possesses a large supply of natural resources, and the country’s sustainable economic model has attracted a
high level of foreign direct investments (FDIs) during the review period (2007–2011). The country contains the world’s
largest reserves of nickel, silver, zinc and brown coal. In addition, Australia has reserves of bauxite, black coal, copper,
gold, diamond and iron ore that rank within the six largest of their kind in the world. Australia is the world’s largest
producer of bauxite and alumina, and the third-largest producer of zinc, iron ore and gold. Furthermore, the country is a
net exporter of numerous mineral categories.
Australia’s political stability and low levels of political interference make the country’s mining industry one of the most
attractive for investments in the world. Moreover, due to the country’s geographical proximity to the emerging economies
of China and India, Australia is expected to register increased demand for natural resources from these economies.
Australia recorded strong export and production growth in its key minerals in 2009, despite the adverse impact of the
global economic crisis in the same year. This indicates the strength and sustainable economic model being followed in the
country.
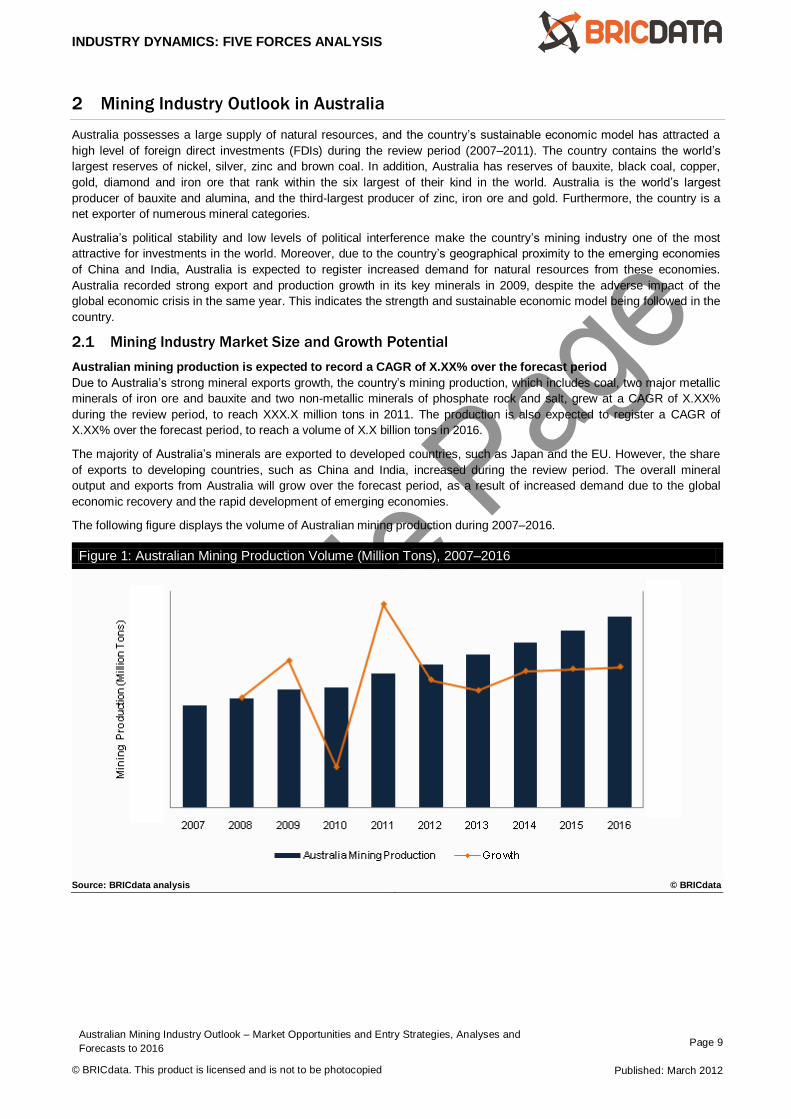
2.1 Mining Industry Market Size and Growth Potential
Australian mining production is expected to record a CAGR of X.XX% over the forecast period
Due to Australia’s strong mineral exports growth, the country’s mining production, which includes coal, two major metallic
minerals of iron ore and bauxite and two non-metallic minerals of phosphate rock and salt, grew at a CAGR of X.XX%
during the review period, to reach XXX.X million tons in 2011. The production is also expected to register a CAGR of
X.XX% over the forecast period, to reach a volume of X.X billion tons in 2016.
The majority of Australia’s minerals are exported to developed countries, such as Japan and the EU. However, the share
of exports to developing countries, such as China and India, increased during the review period. The overall mineral
output and exports from Australia will grow over the forecast period, as a result of increased demand due to the global
economic recovery and the rapid development of emerging economies.
The following figure displays the volume of Australian mining production during 2007–2016.
Figure 1: Australian Mining Production Volume (Million Tons), 2007–2016
Source: BRICdata analysis © BRICdata
COAL
Australian Mining Industry Outlook – Market Opportunities and Entry Strategies, Analyses and
Forecasts to 2016 Page 10
© BRICdata. This product is licensed and is not to be photocopied Published: March 2012
3 Coal
3.1 Overview of Coal Mining Category
Coal is important to the Australian economy, as it is the country’s second-largest exported commodity. In addition, black
coal exports have increased by more than XX% in the country since 2002. Australia is the fourth-largest coal producer in
the world, trailing only China, the USA and India. However, Australia is the world’s largest coal exporter. The total
production of coal Australia totaled XXX million tons in 2011. There are new challenges for the country’s coal production
following the introduction of Australia’s carbon tax, which was passed in November 2011 and is scheduled to become
effective from July 2012. This carbon tax law represents one of the largest economic reforms in this country for a
generation and a huge challenge to the coal mining category. As a result of this tax, coal mining will become the country’s
highest taxed mining category. Consequently, BRICdata projects a XX–XX% increase in Australian coal prices over the
forecast period.
3.2 Reserves, Production and Consumption
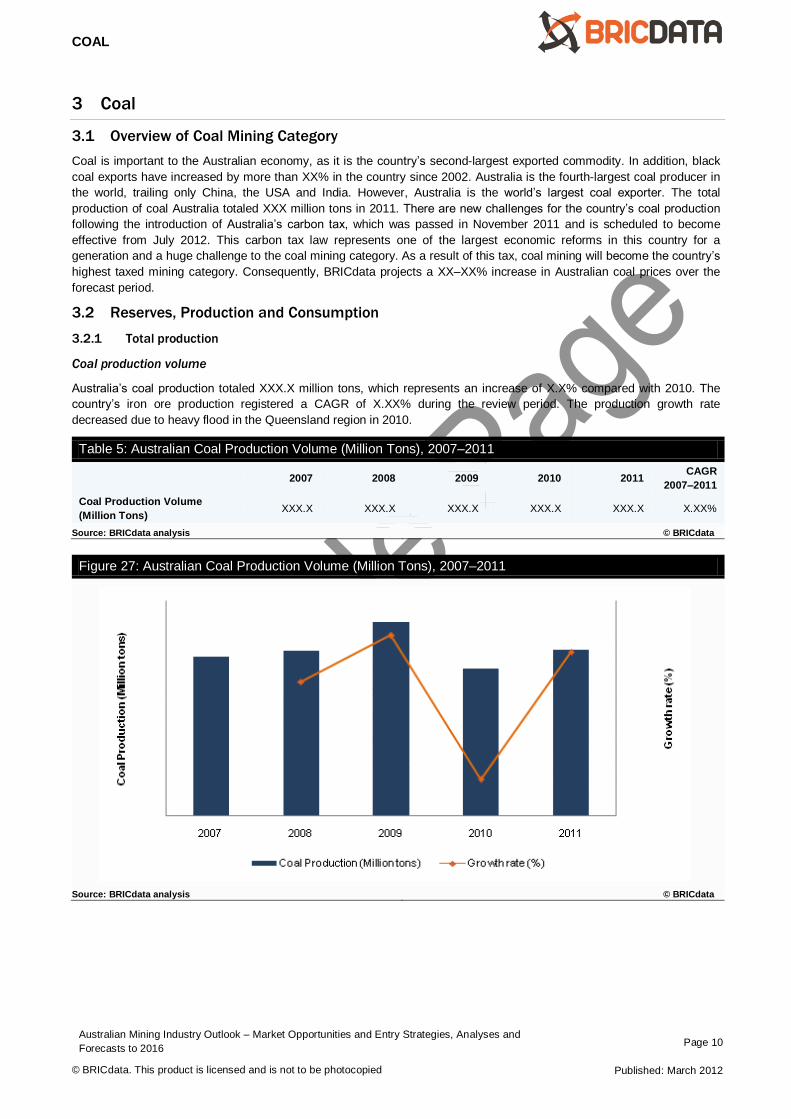
3.2.1 Total production
Coal production volume
Australia’s coal production totaled XXX.X million tons, which represents an increase of X.X% compared with 2010. The
country’s iron ore production registered a CAGR of X.XX% during the review period. The production growth rate
decreased due to heavy flood in the Queensland region in 2010.
Table 5: Australian Coal Production Volume (Million Tons), 2007–2011
2007 2008 2009 2010 2011 CAGR
2007–2011
Coal Production Volume
(Million Tons) XXX.X XXX.X XXX.X XXX.X XXX.X X.XX%
Source: BRICdata analysis © BRICdata
Figure 27: Australian Coal Production Volume (Million Tons), 2007–2011
Source: BRICdata analysis © BRICdata
IRON ORE
Australian Mining Industry Outlook – Market Opportunities and Entry Strategies, Analyses and
Forecasts to 2016 Page 11
© BRICdata. This product is licensed and is not to be photocopied Published: March 2012
4 Iron Ore
4.1 Overview of Iron Ore Mining Sub-Category
The Australian iron ore mining sub-category registered impressive growth during the review period. Since 1950, Australia
has been one of the world’s leading iron ore exporters. The sub-category has benefited from factors such as the country’s
abundant natural resources and favorable government policies. However, China’s rapid development in becoming a
leading steel producer and iron ore exporter will provide strong competition for the Australian iron ore mining sub-category
over the forecast period.
4.2 Reserves, Production and Consumption
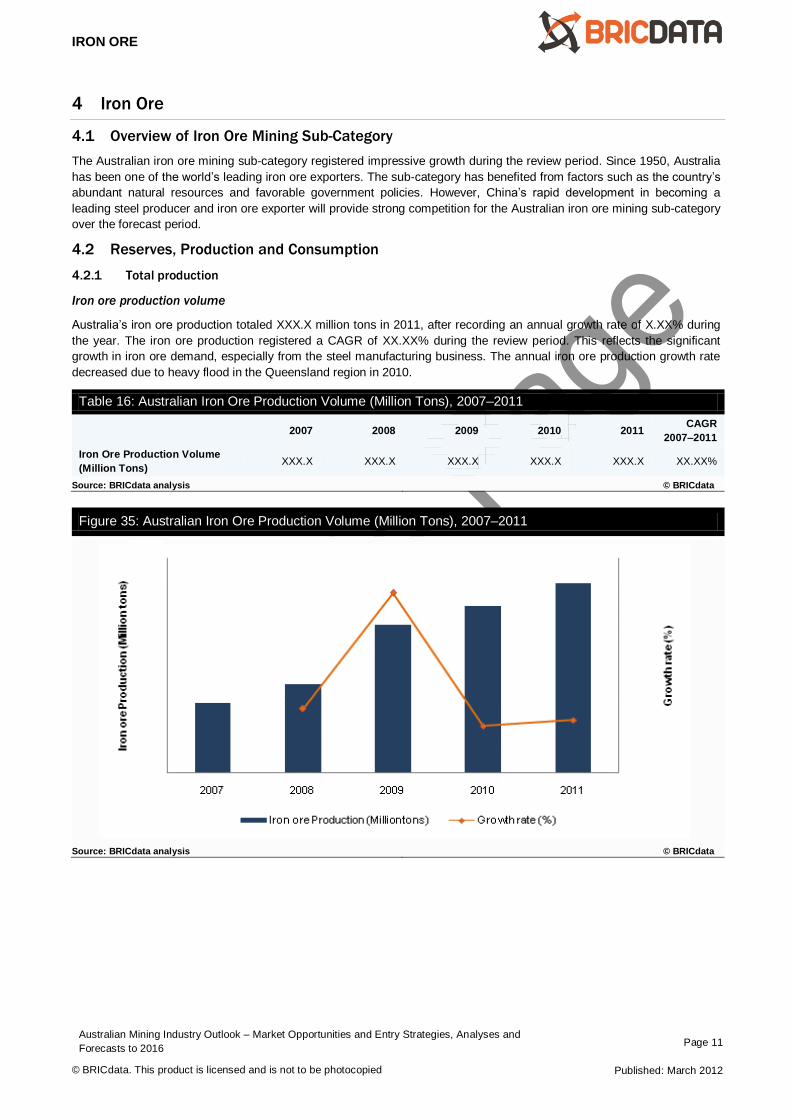
4.2.1 Total production
Iron ore production volume
Australia’s iron ore production totaled XXX.X million tons in 2011, after recording an annual growth rate of X.XX% during
the year. The iron ore production registered a CAGR of XX.XX% during the review period. This reflects the significant
growth in iron ore demand, especially from the steel manufacturing business. The annual iron ore production growth rate
decreased due to heavy flood in the Queensland region in 2010.
Table 16: Australian Iron Ore Production Volume (Million Tons), 2007–2011
2007 2008 2009 2010 2011 CAGR
2007–2011
Iron Ore Production Volume
(Million Tons) XXX.X XXX.X XXX.X XXX.X XXX.X XX.XX%
Source: BRICdata analysis © BRICdata
Figure 35: Australian Iron Ore Production Volume (Million Tons), 2007–2011
Source: BRICdata analysis © BRICdata
PHOSPHATE ROCK
Australian Mining Industry Outlook – Market Opportunities and Entry Strategies, Analyses and
Forecasts to 2016 Page 12
© BRICdata. This product is licensed and is not to be photocopied Published: March 2012
5 Phosphate Rock
5.1 Overview of Phosphate Rock Mining Sub-Category
Australia accounted for X.XX% of the global phosphate rock production in 2010 and X.XX% of the global phosphate rock
reserves. China was the largest phosphate rock producer in the world in 2010, with a production of XX million tons, while
Morocco and Western Sahara accounted for the largest phosphate rock reserves. Phosphate rock is primarily used in the
production of fertilizers. The Australian phosphate rock production grew at a strong rate due to the growing global demand
for fertilizers during the review period, and is projected to continue to recording robust growth rates over the forecast
period.
5.2 Reserves, Production and Consumption
5.2.1 Production
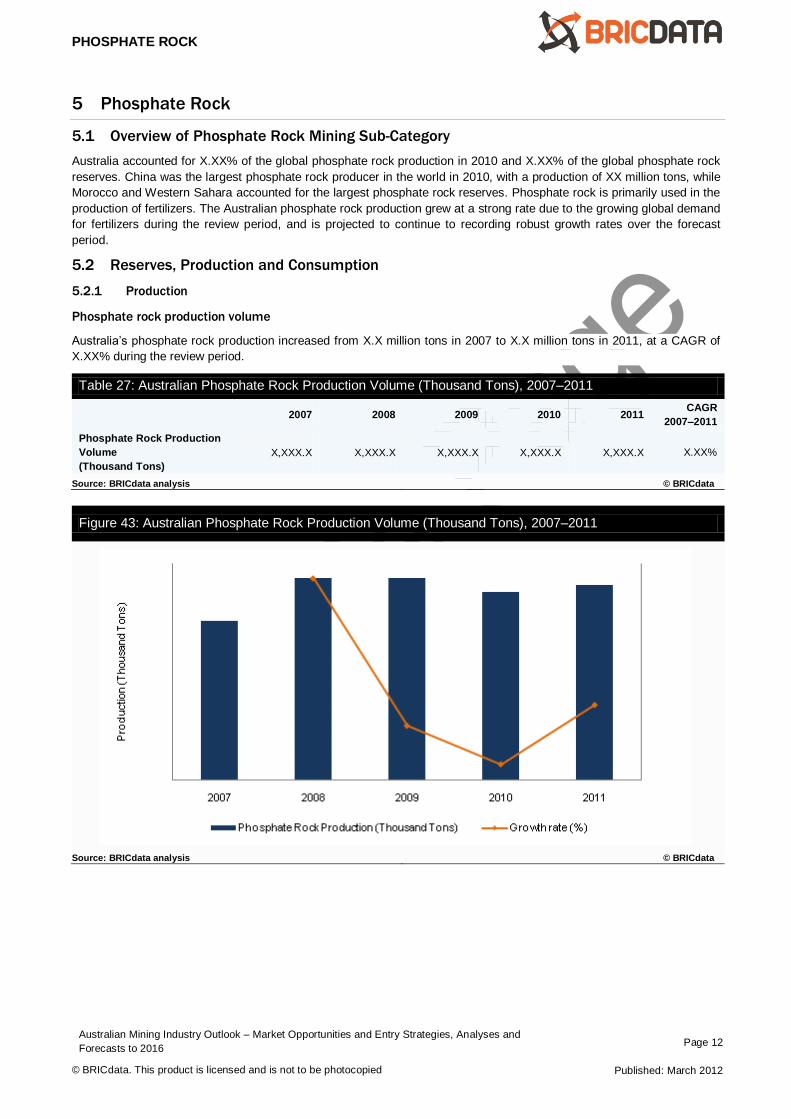
Phosphate rock production volume
Australia’s phosphate rock production increased from X.X million tons in 2007 to X.X million tons in 2011, at a CAGR of
X.XX% during the review period.
Table 27: Australian Phosphate Rock Production Volume (Thousand Tons), 2007–2011
2007 2008 2009 2010 2011 CAGR
2007–2011
Phosphate Rock Production
Volume
(Thousand Tons)
X,XXX.X X,XXX.X X,XXX.X X,XXX.X X,XXX.X X.XX%
Source: BRICdata analysis © BRICdata
Figure 43: Australian Phosphate Rock Production Volume (Thousand Tons), 2007–2011
Source: BRICdata analysis © BRICdata
COMPANY PROFILE
Australian Mining Industry Outlook – Market Opportunities and Entry Strategies, Analyses and
Forecasts to 2016 Page 13
© BRICdata. This product is licensed and is not to be photocopied Published: March 2012
6 Salt
6.1 Overview of Salt Mining Sub-Category
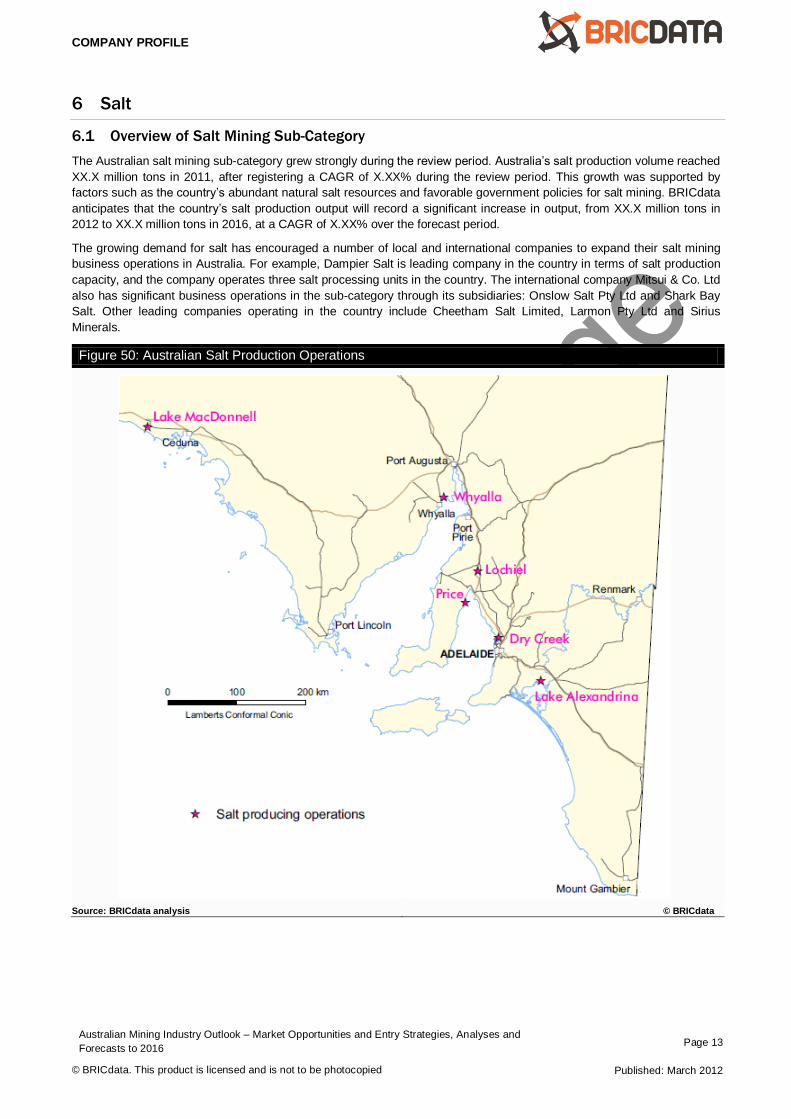
The Australian salt mining sub-category grew strongly during the review period. Australia’s salt production volume reached
XX.X million tons in 2011, after registering a CAGR of X.XX% during the review period. This growth was supported by
factors such as the country’s abundant natural salt resources and favorable government policies for salt mining. BRICdata
anticipates that the country’s salt production output will record a significant increase in output, from XX.X million tons in
2012 to XX.X million tons in 2016, at a CAGR of X.XX% over the forecast period.
The growing demand for salt has encouraged a number of local and international companies to expand their salt mining
business operations in Australia. For example, Dampier Salt is leading company in the country in terms of salt production
capacity, and the company operates three salt processing units in the country. The international company Mitsui & Co. Ltd
also has significant business operations in the sub-category through its subsidiaries: Onslow Salt Pty Ltd and Shark Bay
Salt. Other leading companies operating in the country include Cheetham Salt Limited, Larmon Pty Ltd and Sirius
Minerals.
Figure 50: Australian Salt Production Operations
Source: BRICdata analysis © BRICdata
APPENDIX–
Australian Mining Industry Outlook – Market Opportunities and Entry Strategies, Analyses and
Forecasts to 2016 Page 14
© BRICdata. This product is licensed and is not to be photocopied Published: March 2012
7 Appendix
7.1 About BRICdata
BRICdata publishes in-depth strategic intelligence reports that help its customers better understand opportunities in
emerging markets and industry sectors. Its reports provide an independent, expert view supported by primary research
and access to leading data and intelligence sources.
BRICdata is a comprehensive source of insights and analysis, and publishes a broad range of reports across a number of
different industry sectors, including consumer, retail, financial services, technology, telecoms and construction.
BRICdata is headquartered in London with research, analysis and account management teams based across Europe, the
US and Asia-Pacific. Its global research footprint is supported by a network of external associates, data partners and
industry experts to give the clearest possible perspective on emerging markets.
7.1.1 Areas of expertise
BRICdata operates a dedicated, multilingual team of in-house industry analysts with significant experience of global and
country-level research. BRICdata also maintains data and research partnerships with other research companies, industry
experts and trade associations, along with a network of independent industry consultants and former industry participants
contributing research and reports to bring additional insight and expertise in more specialist areas.
BRICdata’s research offering spans the following industry areas:
Construction BRICdata publishes reports covering the entire construction value chain: construction materials, equipment, construction
services, architectural services and interior design. It also covers the main value sectors of construction activity:
commercial, infrastructure, industrial, institutional and residential.
This comprehensive view of the market enables BRICdata to detail key growth sectors and countries and identify the most
attractive industry opportunities.
Consumer goods Covering a broad range of areas across the consumer goods market, from interior products to fast-moving consumer
goods (FMCG), ingredients, and packaging, BRICdata offers a comprehensive insight into key consumer sectors across
fast-growing markets, identifying key trends, future innovations and growth opportunities.
Comprehensive data sets including unique primary survey-driven research creates accurate market forecasts and
understanding of the factors driving consumption behavior.
Financial services Providing detailed insights into insurance and banking markets, BRICdata’s financial services reports identify key market
opportunities, emerging technologies and channel strategies. The reports provide unique data combined with local
examples of best practice and expert insights into the market.
Retail BRICdata maintains a comprehensive database of forecasts of retail spending, along with a series of unique indicators
enabling a forward view of retailers’ prospects in emerging markets. The reports identify emerging concepts in retail,
including the nascent online and mobile retail sectors in the BRIC countries and other emerging markets.
Technology BRICdata tracks key trends and innovations, emerging technologies and markets, and the key operators in both emerging
markets and technologies. Covering a range of emerging and disruptive technologies including telecoms, social media,
online and mobile retailing, and telemedicine, BRICdata examines strategies for success, the state of the competitive
landscape and the inherent threats and opportunities in the emerging technological economy.
APPENDIX–
Australian Mining Industry Outlook – Market Opportunities and Entry Strategies, Analyses and
Forecasts to 2016 Page 15
© BRICdata. This product is licensed and is not to be photocopied Published: March 2012
7.2 Methodology
All BRICdata reports are rigorously sourced and created according to a comprehensive, two-stage methodology. This
includes internal audit and primary research.
A) Internal audit
Review of in-house databases to gather existing data:
o Historic market databases and reports
o Company database
o projects database
B) Primary research
Review of the latest company strategy and asset management trends
1) Research
A. Sources
Collection of the latest market-specific data from a wide variety of industry sources:
o Government statistics
o Industry associations
o Company filings
o Broker reports
o International organizations
B. Expert opinion
Collation of opinion taken from leading industry experts
Analysis of third-party opinion and forecasts:
o Broker reports
o Industry associations
o Official government sources
C. Data consolidation and verification
Consolidation of data and opinion to create historical datasets
Creation of models to benchmark data across sectors and geographies
2) Research Analysis
Market forecasts
Feed of forecast data into market models:
o Macroeconomic indicators
o Industry-specific drivers
Analysis of Market Databases to identify trends by sector:
o Latest trends
o Key drivers of the market
3) Report Writing
Analysis of market data
Discussion of company and industry trends and issues
Integration of survey results
Annual review of trends
Standardization of market definitions using recognized industry classifications
4) Quality Control
A. Templates
Detailed process manuals
Standardized report templates and accompanying style guides
Complex forecasting tool used to ensure forecast methodologies are consistently applied
QC checklists
B. QC process
Peer review
Senior-level QC
Random spot checks on data integrity
Benchmark checks across databases
APPENDIX–
Australian Mining Industry Outlook – Market Opportunities and Entry Strategies, Analyses and
Forecasts to 2016 Page 16
© BRICdata. This product is licensed and is not to be photocopied Published: March 2012
Market data cross-checked for consistency with accumulated data from company filings
7.3 Definitions
For the purposes of this report, the following timeframes apply:
Review period: 2007–2011
Forecast period: 2012–2016
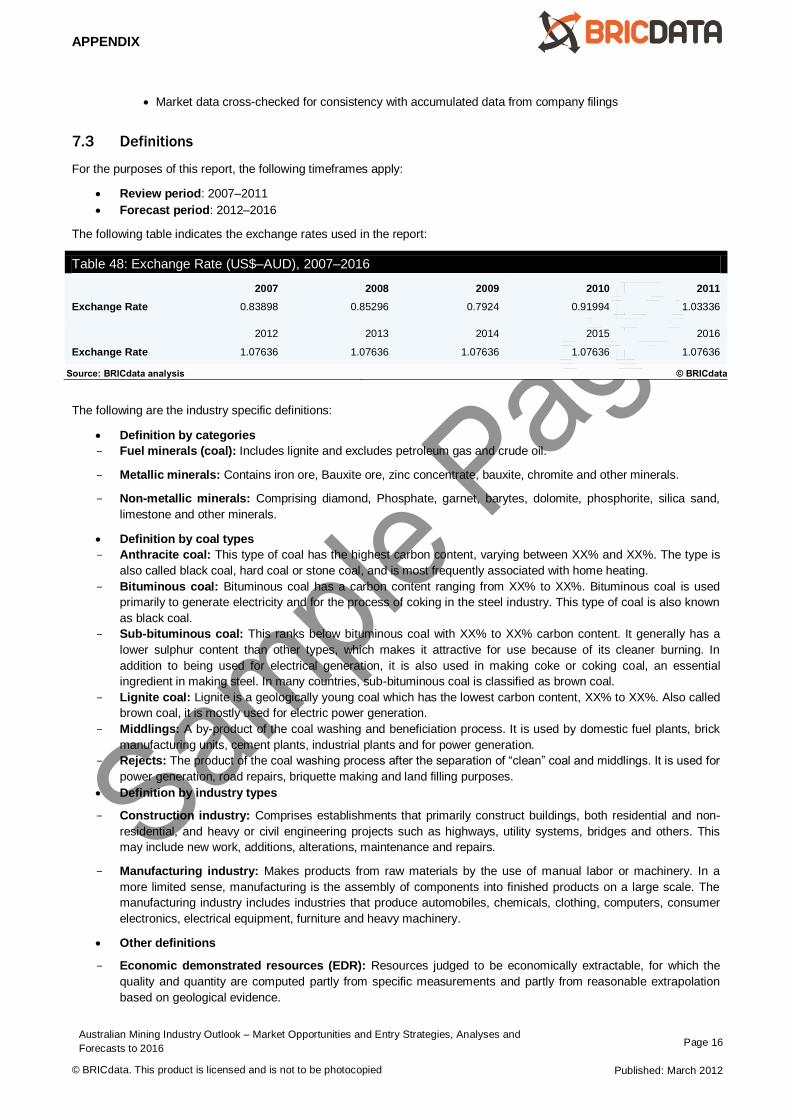
The following table indicates the exchange rates used in the report:
Table 48: Exchange Rate (US$–AUD), 2007–2016
2007 2008 2009 2010 2011
Exchange Rate 0.83898 0.85296 0.7924 0.91994 1.03336
2012 2013 2014 2015 2016
Exchange Rate 1.07636 1.07636 1.07636 1.07636 1.07636
Source: BRICdata analysis © BRICdata
The following are the industry specific definitions:
Definition by categories
Fuel minerals (coal): Includes lignite and excludes petroleum gas and crude oil.
Metallic minerals: Contains iron ore, Bauxite ore, zinc concentrate, bauxite, chromite and other minerals.
Non-metallic minerals: Comprising diamond, Phosphate, garnet, barytes, dolomite, phosphorite, silica sand,
limestone and other minerals.
Definition by coal types
Anthracite coal: This type of coal has the highest carbon content, varying between XX% and XX%. The type is
also called black coal, hard coal or stone coal, and is most frequently associated with home heating.
Bituminous coal: Bituminous coal has a carbon content ranging from XX% to XX%. Bituminous coal is used
primarily to generate electricity and for the process of coking in the steel industry. This type of coal is also known
as black coal.
Sub-bituminous coal: This ranks below bituminous coal with XX% to XX% carbon content. It generally has a
lower sulphur content than other types, which makes it attractive for use because of its cleaner burning. In
addition to being used for electrical generation, it is also used in making coke or coking coal, an essential
ingredient in making steel. In many countries, sub-bituminous coal is classified as brown coal.
Lignite coal: Lignite is a geologically young coal which has the lowest carbon content, XX% to XX%. Also called
brown coal, it is mostly used for electric power generation.
Middlings: A by-product of the coal washing and beneficiation process. It is used by domestic fuel plants, brick
manufacturing units, cement plants, industrial plants and for power generation.
Rejects: The product of the coal washing process after the separation of “clean” coal and middlings. It is used for
power generation, road repairs, briquette making and land filling purposes.
Definition by industry types
Construction industry: Comprises establishments that primarily construct buildings, both residential and non-
residential, and heavy or civil engineering projects such as highways, utility systems, bridges and others. This
may include new work, additions, alterations, maintenance and repairs.
Manufacturing industry: Makes products from raw materials by the use of manual labor or machinery. In a
more limited sense, manufacturing is the assembly of components into finished products on a large scale. The
manufacturing industry includes industries that produce automobiles, chemicals, clothing, computers, consumer
electronics, electrical equipment, furniture and heavy machinery.
Other definitions
Economic demonstrated resources (EDR): Resources judged to be economically extractable, for which the
quality and quantity are computed partly from specific measurements and partly from reasonable extrapolation
based on geological evidence.
APPENDIX–
Australian Mining Industry Outlook – Market Opportunities and Entry Strategies, Analyses and
Forecasts to 2016 Page 17
© BRICdata. This product is licensed and is not to be photocopied Published: March 2012
Sub-economic demonstrated resources (SDR): Similar to economic demonstrated resources in terms of
certainty of occurrence and although considered to be potentially economic in the foreseeable future, these
resources are judged to be sub-economic at present.
7.4 Disclaimer
All rights reserved.
No part of this publication may be reproduced, stored in a retrieval system or transmitted in any form by any means,
electronic, mechanical, photocopying, recording or otherwise, without the prior permission of the publisher, BRICdata.
The facts of this report are believed to be correct at the time of publication but cannot be guaranteed. Please note that the
findings, conclusions and recommendations that BRICdata delivers will be based on information gathered in good faith
from both primary and secondary sources, whose accuracy we are not always in a position to guarantee. BRICdata can,
therefore, accept no liability whatsoever for actions taken based on any information that may subsequently prove to be
incorrect.
Related Documents