Australian ICT Statistical Compendium 2011 www.acs.org.au/2011compendium

Welcome message from author
This document is posted to help you gain knowledge. Please leave a comment to let me know what you think about it! Share it to your friends and learn new things together.
Transcript

AustrAliAn iCt stAtistiCAl Compendium 2011
1AustrAliAn Computer soCiety
AUSTRALIANCOMPUTERSOCIETY
Australian ICT StatisticalCompendium 2011
www.acs.org.au/2011compendium

AustrAliAn iCt stAtistiCAl Compendium 2011
AustrAliAn Computer soCiety2
AustrAliAn iCt stAtistiCAl Compendium 2011
2 Australian Computer society

AustrAliAn iCt stAtistiCAl Compendium 2011
3AustrAliAn Computer soCiety
Contents 4 Why this publication?
4 About the Australian Computer society
5 At A Glance
6 defining iCt
14 Who We Are
15 iCt employment demographics
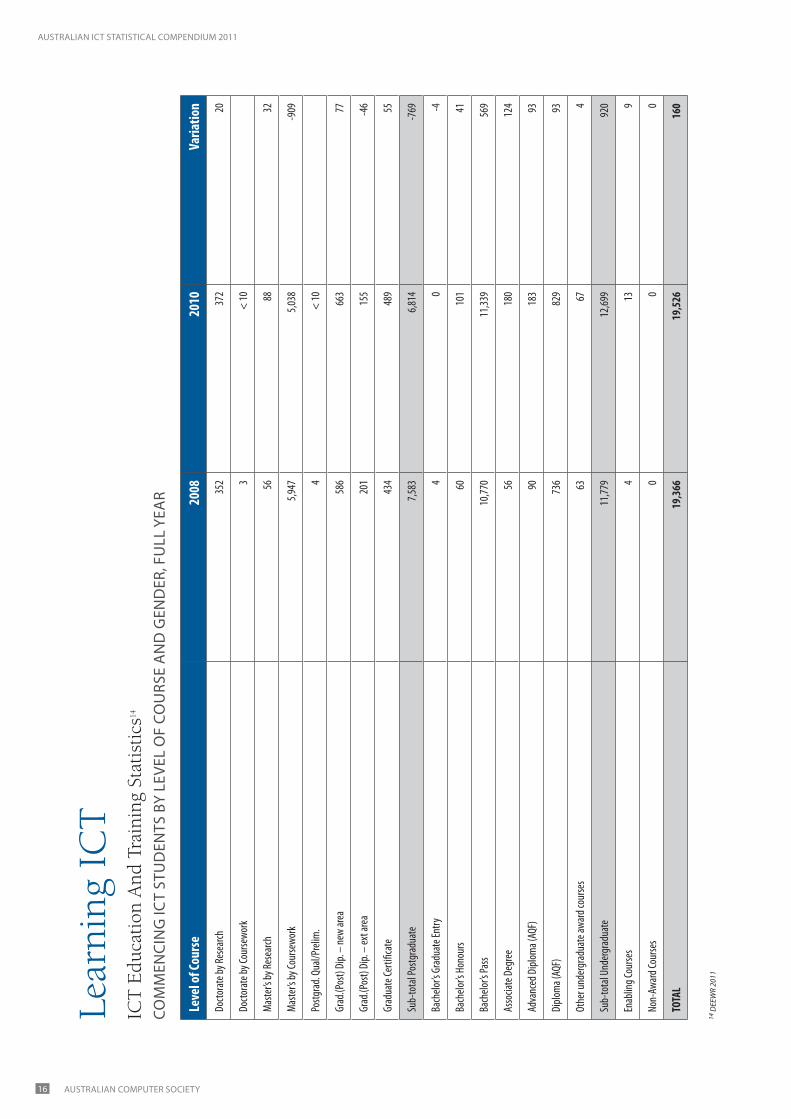
16 learning iCt
24 Vocational education & training (Vet)
29 Women in iCt
35 Where We Work
38 iCt industry By state
46 What We do
50 iCt exports
52 iCt research
55 How We do it
56 How do We Compare?
62 Where Have We Come From – And Where Are We Going?
67 the nBn effect
72 How should We read this document?
73 About the Centre For innovative industries economic research inc
74 sources And Acknowledgments
AustrAliAn iCt stAtistiCAl Compendium 2011
AustrAliAn Computer soCiety4
the Australian Computer society (ACs) is the recognised professional association for those working in information and Communications technology, seeking to raise the standing of iCt professionals and represent their views to government, industry and the community. A member of the Australian Council of professions, the ACs is the guardian of professional
ethics and standards in the iCt sector, committed to ensuring the beneficial use of iCt for all Australians. it provides both members and non-members with opportunities for professional education, networking and certification, as well as enabling them to contribute to the development of their profession. Visit www.acs.org.au for more information.
About TheAustralian Computer Society
AUSTRALIANCOMPUTERSOCIETY
po Box Q534, QVB post office,
sydney nsW 1234
tel: +61 2 9299 3666
Fax: +61 2 9299 3997
We all recognise the difficulty of easily accessing relevant data (employment, educational outputs, research spend, etc.) on iCt economic and social trends. ACs, in cooperation with the Australian Bureau of statistics (ABs) and other relevant Government departments, engaged Ciier in 2009 and 2010 to develop an iCt statistical Compendium to combine quality iCt-related data into a single summary report, as part of the ACs commitment to improving iCt outcomes in Australia. the Compendiums have been very well received by the iCt profession, iCt industry, and by Governments around Australia, so this year, Ciier has again been engaged to provide an expanded version of the Compendium, including new analysis on the digital economy, more trend analysis, and discussions on improving iCt-related statistical data.
As with each edition, this Compendium does not include
all of the available data, but we have tried to amass a range of data addressing the main questions that arise. some data
included in the first publication – e.g. ABs iCt industry data, has again been substituted with later data from Ciier in this edition, as no later information was available from ABs. Where no later data could be identified, but the data is considered still highly relevant, information has been repeated.
the objective of this project was to produce a series of ‘snapshots’ of statistical data on the iCt workforce for ACs members, industry and government, and a potential ‘bible’ for iCt users, incorporating statistics on the Australian iCt sector, iCt higher and vocational education, iCt trade, iCt employment and skills, iCt immigration, with some breakdowns of the statistical data on a national and state/territory basis.
our aim is to continue to assist policymakers involved in the iCt sector by providing the latest available data, and to provide a tool for iCt professionals and the iCt industry, and for businesses that deal with the iCt sector.
Why This Publication?messAGe From tHe ACs
© Data in this publication is copyright to the attributed and referenced organisations, and this publication itself is also copyright. Other than for the purposes of and subject to the conditions prescribed under the Copyright Act, no part of it may be in any form or by any means (electronic, mechanical, microcopying, photocopying, recording or otherwise) be reproduced, stored in a retrieval system or transmitted without prior written permission.

AustrAliAn iCt stAtistiCAl Compendium 2011
5AustrAliAn Computer soCiety
At
A G
lanc
esu
mm
Ary
tA
Ble
oF
Key
nAt
ion
Al
stAt
isti
Cs
1 CIIE
R tr
end
asse
ssm
ents
2 No
late
r ABS
dat
a av
aila
ble
Mea
sure
men
tSt
atist
icPe
riod/
curre
ncy
Sour
ceTr
end
1
Tota
l ICT w
orke
rs in
Austr
alia
554,7
00Fe
b 201
1AB
S Lab
our M
arke
t Sur
vey F
eb 20
11, IC
T Ind
ustry
log
istics
CIIER
2010
Cont
inuing
grow
th, d
eman
d is
appa
rent
Tota
l ICT T
echn
ical, P
rofes
siona
l, Man
agem
ent, T
rade
staff
in
Austr
alia
468,7
73Fe
b 201
1AB
S Lab
our M
arke
t Sur
vey F
eb 20
11, C
IIER e
xtra
ctCo
ntinu
ed gr
owth
over
20-y
ear c
ycle.
Dec
line i
n 20
09-1
0 and
2010
-11
Tota
l ICT T
echn
ical, P
rofes
siona
l and
Man
agem
ent
staff
in Au
strali
a 38
3,135
Feb 2
011
ABS L
abou
r Mar
ket S
urve
y Feb
2011
, CIIE
R ext
ract
Stea
dy gr
owth
to 20
08, s
tatic
in 20
09-1
0, sli
ght
grow
th in
2010
-11
Tota
l ICT D
omes
tic an
nual
com
men
cem
ents
in Au
strali
a 8,7
0420
10DE
EWR
4.5%
incre
ase i
n 201
0, af
ter c
ontin
uing d
eclin
e, slo
wing
in pa
st th
ree y
ears
Tota
l tem
pora
ry IC
T migr
ants
to Au
strali
a8,5
30 pe
r ann
um
2009
-10
DIM
IA, C
IIER c
alcula
tion
Has b
een i
ncre
asing
rapid
ly to
star
t of 2
008,
decli
ned i
n 200
8-9 a
nd 20
09-1
0
Emplo
yees
in IC
T Ind
ustry
. (Com
panie
s tha
t sup
ply IC
T go
ods a
nd Se
rvice
s)28
5,000
Dec 2
010
CIIER
T250
2010
Slo
w gr
owth
, reco
verin
g fro
m G
FC
Reve
nue o
f ICT I
ndus
try$8
2 billi
onDe
c 201
0 CII
ER T2
50 20
10Co
ntra
ction
from
2008
in te
lecom
mun
icatio
ns
reve
nue,
secto
ral v
ariat
ions
ICT R&
D$5
.206 b
illion
2008
-9 2
ABS 2
011
Reco
very
from
long
-term
decli
ne, c
ontin
uing t
o be
led by
busin
ess R
&D
ICT ex
ports
(exc
luding
re-e
xpor
ts)$4
.534 b
illion
2008
-9CS
ES 20
10, A
BS Tr
aded
ata
Dip i
n 200
9, af
ter g
radu
al re
cove
ry to
1999
-200
0 ex
port
levels
, but
with
an in
creas
ing tr
ade d
eficit

AustrAliAn iCt stAtistiCAl Compendium 2011
AustrAliAn Computer soCiety6
Defining ICT
one of the significant difficulties in understanding iCt in Australia is the frequent confusion between analysis of the iCt workforce in labour market terms (e.g. what job the individual performs), and analysing the iCt workforce in industry terms (e.g. what kind of organisation the individual worked for). Clearly iCt is evident in every industry sector, but unfortunately iCt is not yet always recognised statistically as an industry sector in its own right, and it will remain so until the current industry statistical metrics used in Australia are updated to reflect the pervasiveness and reality of iCt in the 21st century.
iCt broad employment occurs in a number of groupings. these include:
• the providers of iCt goods and services (usually called the iCt industry)
• the purchasers and users of iCt goods and services, including the government and private sectors, which also employ a large number of specialists to help them apply their iCt purchases
• the trainers, teachers and researchers in iCt who generally (but not always) operate within universities and colleges
• people who provide technical support to iCt, but who might, more properly, be categorised as electrical or electronics specialists
• people working in call-centres, or in desktop publishing and graphics design
there is a significant percentage of iCt professionals in the iCt industry, but iCt industry employment includes not only those professionals, but also many iCt non-professional technical, sales, logistical and administrative staff.
AnZsCo (Australia, new Zealand standard Classification of occupations) is a multi-level nomenclature essential to the understanding of employment statistics. the upper level (the 2-digit level) is meant to bring like occupations together so they can be aggregated. unfortunately, the iCt occupation grouping at this level leaves out some occupations that we, and others, would consider are, wholly or in part, within iCt. Accordingly, simple extracts from employment data of the “iCt” AnZsCo group can easily lead to inadvertent understatement of the actual position of iCt employment. in this report we have identified the key AnZsCo classes from which the iCt analysis is derived.
the ACs maintains a more appropriate classification of iCt occupations is required to understand the iCt sector and the “digital economy” in Australia, and thus inform iCt policy with a clear, verifiable set of metrics, potentially by reference to the skills Framework for the information Age.3
AnZsiC (Australia, new Zealand standard industry
Classification) is similarly structured to AnZsCo, and while it also has an upper-level iCt grouping (information media and telecommunications), which includes some small non-iCt elements, it unfortunately does not include the numerically larger software and services iCt industry sector, which is included as a misnamed subset (Computer
systems design) within the upper-level grouping “professional, scientific and technical services”.
“information media and telecommunications” also leaves out iCt hardware manufacture, iCt wholesale and retail trade, and iCt consulting sectors, which are scattered across a number of other AnZsiC classifications.
General economists, and other commentators, sometimes presume that “information media and telecommunications” in ABs data and government publications is the iCt industry, and make comment without realising that in employment terms, it is actually less than half of the employment of the “real” iCt industry.
this same analysis impacts their calculations of iCt revenue, exports and Gdp/GVA, which regularly become a synonym for economic importance, and are frequently understated for iCt, but overstated for the AnZsiC industry classifications in which the missing iCt industry sectors are hidden.
However, in this report we have tried, wherever possible, while not altering figures derived from these misleading categorisations, to indicate the estimated “true” value of the iCt industry component of each of these measures.
3 Skills Framework for the Information Age © http://www.sfia.org.uk
tHe iCt seCtor
AnZsCo And AnZsiC

AustrAliAn iCt stAtistiCAl Compendium 2011
7AustrAliAn Computer soCiety
parts of the iCt industry can be found in the following AnZsiC categories:
• professional, scientific and technical services• information media and telecommunications• retail trade• manufacturing• education and training• Wholesale trade• Arts and recreation services
major sectors within the industry include:
• it services, systems integration and software support• internet services and telecommunications• software and digital content development• Wholesale and retail distribution of software and
hardware• manufacture of iCt products and components
the ABs has measured the iCt industry intermittently as a specific exercise since 1996, with its last report now over five years old representing the period 2006-7 (cat 8126.0) and published in october 2008. this report was referenced for the iCt industry data in the 2009 ACs iCt statistical Compendium.
the Centre for innovative industries economic research inc has conducted an annual survey, since 1998, on a smaller survey sample, modelling the iCt industry in a similar manner to ABs. the iCt industry data for the 2011 statistical Compendium will draw upon Ciier’s december 2010 data, as the 2006-7 ABs data is now too far out of date to add meaningful value.
Further confusion is now arising with the use of the terms “digital economy” and “internet economy” to describe both those elements of the economic processes of all industries impacted by iCt, or by the specifics of internet-based iCt, and in some cases the productive elements (labour, infrastructure, etc.) that make these possible.
it is easier to accurately define Australia’s digital economy by what it is not, rather than by what it is. in the
broadest sense it is almost the entire domestic economy, other than those very small components of the economy that do not use any iCt support at all (e.g. subsistence farming or street musicians – unless they also distribute their outputs electronically). more logically, it is all of the iCt industry, and a significant proportion of almost every other economic sector that uses iCt. mining, healthcare, education, government, wholesale and retail trade, manufacturing, transport and other sectors all rely on iCt goods and services, and are therefore participants in the digital economy.
the internet economy can be defined as a varying subset of the digital economy. the variation is because the decision whether to use internet-based iCt or internal organisational iCt is one that is made for lots of different reasons – technical, financial, data security or operational control – and those decisions change over time. the distinction is also economically irrelevant, other than for iCt suppliers whose markets are internet-focused products and services. unfortunately, these terms are used interchangeably, and the more narrow definition of internet economy may therefore lead to conservative interpretations of the significance of the digital economy, and thus of the iCt industry and iCt profession that creates and maintains it.
the term “iCt industry” is also often used for a confusing range of different things, ranging from the “tight” definition of companies solely concerned with the provision of iCt products and services, but which includes companies with major units supplying iCt goods and services, through to a “looser” definition that may include retail iCt, that may include call centres that are mainly parts of other industries (e.g. banking), that may include significant sections of the electronics industries and of other professional services (e.g. management consultants and, historically, accountants), to a “broad” definition that can include anyone working on iCt-related matters in any industry.
“iCt industry” in this publication refers to the tighter ABs
and Ciier definitions; we have used the term “iCt worker” for the broader definition. the table below sets out a suggested model for the redefinition of the iCt industry, drawing upon existing AnZsiC structures.
tHe iCt industry

AustrAliAn iCt stAtistiCAl Compendium 2011
AustrAliAn Computer soCiety8
Maj
or se
ctor
Sugg
este
d na
me c
hang
esCu
rrent
Anz
sic co
deCu
rrent
ANZ
SIC t
itle
Info
rmat
ion
and
Com
mun
icatio
ns Te
chno
logy
, Dig
ital C
onte
nt, M
edia
and
Ente
rtai
nmen
t
ICT Co
nten
tDi
gital
Cont
ent,
Med
ia, G
ames
and E
nter
tainm
ent
5700
Inte
rnet
Publi
shing
and B
road
casti
ng
ICT Co
nten
tICT
Info
rmat
ion M
anag
emen
t Ser
vices
and D
igita
l Libr
aries
part
6010
Libra
ries a
nd Ar
chive
s
ICT Co
nten
tpa
rt 60
20Ot
her I
nfor
mat
ion Se
rvice
s
ICT Pr
oduc
tsCo
mpu
ter a
nd El
ectro
nic O
ffice
Equip
men
t Man
ufac
turin
g24
21Co
mpu
ter a
nd El
ectro
nic O
ffice
Equip
men
t Man
ufac
turin
g
ICT Pr
oduc
tsCo
mm
unica
tion E
quipm
ent M
anuf
actu
ring
2422
Com
mun
icatio
n Equ
ipmen
t Man
ufac
turin
g
ICT Pr
oduc
tsCo
mpu
ter a
nd Co
mpu
ter P
eriph
eral
Who
lesali
ng34
92Co
mpu
ter a
nd Co
mpu
ter P
eriph
eral
Who
lesali
ng
ICT Pr
oduc
tsSo
ftwar
e Who
lesali
ngpa
rt34
92?
ICT Pr
oduc
tsTe
lecom
mun
icatio
n Goo
ds W
holes
aling
3493
Telec
omm
unica
tion G
oods
Who
lesali
ng
ICT Pr
oduc
tsCo
mpu
ter a
nd Co
mpu
ter P
eriph
eral
Reta
iling
4222
Com
pute
r and
Com
pute
r Per
ipher
al Re
tailin
g
ICT Pr
oduc
tsSo
ftwar
e Ret
ailing
part
4222
?
ICT Pr
oduc
tsSo
ftwar
e Pub
lishin
g54
20So
ftwar
e Pub
lishin
g
ICT Pr
oduc
tsCo
mpu
ter a
nd Te
lecom
mun
icatio
ns Eq
uipm
ent
Repa
ir and
Main
tena
nce
part
9422
Electr
onic
(exc
ept D
omes
tic Ap
plian
ce) a
nd Pr
ecisi
on Eq
uipm
ent
Repa
ir
ICT Se
rvice
sICT
Out
sour
cing a
nd Tr
ansa
ction
Proc
essin
g59
21Da
ta Pr
oces
sing a
nd W
eb H
ostin
g Ser
vices
ICT Se
rvice
sEle
ctron
ic In
form
ation
Stor
age S
ervic
es59
22Ele
ctron
ic In
form
ation
Stor
age S
ervic
es
ICT Se
rvice
sSy
stem
Des
ign an
d Sof
twar
e Dev
elopm
ent S
ervic
es70
00Co
mpu
ter S
yste
m D
esign
and R
elate
d Ser
vices
ICT Se
rvice
sICT
Engin
eerin
g Des
ign an
d Eng
ineer
ing Co
nsult
ing Se
rvice
spa
rt 69
23En
ginee
ring D
esign
and E
ngine
ering
Cons
ulting
Serv
ices
ICT Se
rvice
sICT
Cons
ulting
, Man
agem
ent a
nd Ed
ucat
ion S
ervic
espa
rt 69
62M
anag
emen
t Adv
ice an
d Rela
ted C
onsu
lting
Serv
ices
ICT Se
rvice
sICT
Cons
ulting
, Man
agem
ent a
nd Ed
ucat
ion S
ervic
espa
rt 82
20Ed
ucat
ional
Supp
ort S
ervic
es
A m
od
el F
or
reFo
rm o
F tH
e A
Bs A
ust
rAli
An
An
d n
eW Z
eAlA
nd
stA
nd
Ard
ind
ust
riA
lCl
Ass
iFiC
Atio
n (A
nZs
iC),
2006
– C
od
es A
nd
tit
les

AustrAliAn iCt stAtistiCAl Compendium 2011
9AustrAliAn Computer soCiety
ICT Se
rvice
sICT
Scien
tific a
nd Te
chnic
al Se
rvice
s n.e.
c.pa
rt 69
99Ot
her P
rofes
siona
l, Scie
ntifi
c and
Tech
nical
Serv
ices n
.e.c.
ICT Tr
ansm
ission
Telec
omm
unica
tions
Net
work
Carri
er O
pera
tion
5801
Wire
d Tele
com
mun
icatio
ns N
etwo
rk O
pera
tion
ICT Tr
ansm
ission
Telec
omm
unica
tions
Net
work
Carri
er O
pera
tion
5802
Othe
r Tele
com
mun
icatio
ns N
etwo
rk O
pera
tion
ICT Tr
ansm
ission
Othe
r Tele
com
mun
icatio
ns Se
rvice
s58
09Ot
her T
eleco
mm
unica
tions
Serv
ices
ICT Tr
ansm
ission
Inte
rnet
Serv
ice Pr
ovide
rs an
d Dat
a Tra
nsm
ission
Serv
ices
5910
Inte
rnet
Serv
ice Pr
ovide
rs an
d Web
Sear
ch Po
rtals
Publ
ishin
g, B
road
cast
ing,
and
Non-
Digi
tal I
nfor
mat
ion
Med
ia an
d ent
erta
inmen
tNe
wspa
per P
ublis
hing
5411
News
pape
r Pub
lishin
g
Med
ia an
d ent
erta
inmen
tM
agaz
ine an
d Oth
er Pe
riodic
al Pu
blish
ing54
12M
agaz
ine an
d Oth
er Pe
riodic
al Pu
blish
ing
Med
ia an
d ent
erta
inmen
tBo
ok Pu
blish
ing54
13Bo
ok Pu
blish
ing
Med
ia an
d ent
erta
inmen
tDi
recto
ry an
d Mail
ing Li
st Pu
blish
ing54
14Di
recto
ry an
d Mail
ing Li
st Pu
blish
ing
Med
ia an
d ent
erta
inmen
tOt
her P
ublis
hing (
Exce
pt So
ftwar
e, M
usic
and I
nter
net)
5419
Othe
r Pub
lishin
g (ex
cept
Softw
are,
Mus
ic an
d Int
erne
t)
Med
ia an
d ent
erta
inmen
tM
otion
Pictu
re an
d Vide
o Pro
ducti
on55
11M
otion
Pictu
re an
d Vide
o Pro
ducti
on
Med
ia an
d ent
erta
inmen
tM
otion
Pictu
re an
d Vide
o Dist
ribut
ion55
12M
otion
Pictu
re an
d Vide
o Dist
ribut
ion
Med
ia an
d ent
erta
inmen
tM
otion
Pictu
re Ex
hibiti
on55
13M
otion
Pictu
re Ex
hibiti
on
Med
ia an
d ent
erta
inmen
tPo
st-pr
oduc
tion S
ervic
es an
d Oth
er M
otion
Pictu
re
and V
ideo A
ctivit
ies55
14Po
st-pr
oduc
tion S
ervic
es an
d Oth
er M
otion
Pictu
re an
d Vide
o Ac
tiviti
es
Med
ia an
d ent
erta
inmen
tM
usic
Publi
shing
5521
Mus
ic Pu
blish
ing
Med
ia an
d ent
erta
inmen
tM
usic
and O
ther
Soun
d Rec
ordin
g Acti
vities
5522
Mus
ic an
d Oth
er So
und R
ecor
ding A
ctivit
ies
Med
ia an
d ent
erta
inmen
tRa
dio Br
oadc
astin
g56
10Ra
dio Br
oadc
astin
g
Med
ia an
d ent
erta
inmen
tFre
e-to
-Air T
elevis
ion Br
oadc
astin
g56
21Fre
e-to
-Air T
elevis
ion Br
oadc
astin
g
Med
ia an
d ent
erta
inmen
tCa
ble an
d Oth
er Su
bscri
ption
Broa
dcas
ting
5622
Cable
and O
ther
Subs
cript
ion Br
oadc
astin
g
Libra
ry an
d non
-digi
tal in
form
ation
Non-
Digit
al Lib
rarie
s and
Arch
ives
part
6010
Libra
ries a
nd Ar
chive
s
Libra
ry an
d non
-digi
tal in
form
ation
Othe
r Inf
orm
ation
Serv
ices
part
6020
Othe
r Inf
orm
ation
Serv
ices

AustrAliAn iCt stAtistiCAl Compendium 2011
AustrAliAn Computer soCiety10
in 2008, according to an Australian treasury paper4 and the ABs, it was not the mining sector that “rescued” Australia from the global financial crisis, but the services sectors, with the exception of the finance and insurance sector.
prior to the current resources boom, and notwithstanding data set limitations, Australian iCt contributed more to Australia’s Gdp than the mining sector.5
iCt services represent a large proportion of the remaining services.
iCt eConomiC ContriBution
Sectoral contributions to GDP growth Sep 2008-May 2008
Source ABS 5206.0 and Treasury
-1.20%
-1.00%
-0.80%
-0.60%
-0.40%
-0.20%
0.00%
0.20%
0.40%
0.60%Agriculture Mining Manufacturing
ICT and other servicesexcluding Finance and
Insurance Finance and Insurance Other sectors
4 The Australian economy and the global downturn – Part 2: The key quarters5 ABS ICT Satellite Account 2003, published 2006

AustrAliAn iCt stAtistiCAl Compendium 2011
11AustrAliAn Computer soCiety
in early 2011, the eminent economic analysts iBis published an industry sectoral analysis of fiscal contribution to Gross domestic product (Gdp) in 2010, derived from ABs data. Ciier reviewed this analysis, and found that (even excluding iCt manufacture, iCt
wholesaling and iCt retail, and some iCt consulting) the iCt industry sector contributes nearly 8 per cent of Australian Gdp. this was as much as the mining industry, and more than all other industry sectors, other than manufacturing, and finance and insurance.
Industry sector contribution to Australian GDP (2010)
7.74%
0.00% 2.00% 4.00% 6.00% 8.00% 10.00% 12.00%
Finance and Insurance
Manufacturing
Mining
Ownership of Dwellings
ICT, excluding ICT manufacture, wholesale and retail
Construction
Industry taxes et al
Property & Business Services (excluding ICT)
Health/Comm Services
Government Administration
Transport
Wholesale Trade
Retail trade
Education
Agriculture
Accommodation and Restaurants
Utilities
Personal Services
Cultural and Recreational Services

AustrAliAn iCt stAtistiCAl Compendium 2011
AustrAliAn Computer soCiety12
6 Del
oitt
e Ac
cess
Eco
nom
ics,
“The
Con
nect
ed C
ontin
ent”
Aug
201
17 C
IIER/
ABS
2011
in A
ugus
t 20
11, d
eloi
tte
Acce
ss e
cono
mic
s re
leas
ed a
pub
licat
ion
title
d “t
he C
onne
cted
Co
ntin
ent”,
whi
ch a
ttem
pted
to a
scrib
e a
valu
e to
the
“inte
rnet
eco
nom
y”. t
hey
appl
ied
two
met
hods
, one
focu
sed
on t
he v
alue
of “
inpu
ts” (
e.g.
the
val
ue o
f sta
ff w
ages
and
ret
aine
d pr
ofits
, etc
.) an
d th
e ot
her f
ocus
ed o
n “o
utpu
ts” (
esse
ntia
lly G
dp)
.
the
repo
rt e
stim
ated
the
valu
e of
the
“inte
rnet
eco
nom
y” a
t $22
bill
ion
base
d on
inpu
ts,
larg
ely
of a
n id
entifi
ed 1
90,0
00 jo
bs, a
nd $
46.8
bill
ion
(roun
ded
up to
$50
bill
ion
for
pres
s pu
rpos
es) b
y th
e ou
tput
s m
etho
dolo
gy.
Ciie
r ac
cept
s d
eloi
tte
Acce
ss e
cono
mic
s ex
pert
ise,
and
has
use
d th
e sa
me
met
hodo
logy
to
calc
ulat
e th
e in
puts
res
ult
for
the
“dig
ital e
cono
my”
, bas
ed u
pon
Ciie
r an
d A
Bs e
mpl
oyee
da
ta, a
nd a
pplie
d th
e iB
is/C
iier
calc
ulat
ions
of G
dp
cont
ribut
ion
to t
he o
utpu
ts e
quat
ion.
the
resu
lt fo
r th
e “d
igita
l eco
nom
y” (e
ssen
tially
the
iCt
indu
stry
and
iCt
wor
kers
in o
ther
in
dust
ries)
is $
65.1
bill
ion
base
d on
inpu
ts, a
nd o
ver $
100
billi
on, b
ased
on
outp
uts.
Inpu
ts A
naly
sisIn
dust
ry Se
gmen
t“In
tern
et Em
ploy
ees”
6 In
tern
et Va
lue-
Adde
d$b
illio
nDi
gita
l Eco
nom
yEm
ploy
ees 7
Digi
tal E
cono
my
Valu
e-Ad
ded
$bill
ion
ISPs
15,00
0$4
Hard
ware
4,000
$17,6
54$0
.86
IT So
ftwar
e and
Cons
ulting
40,00
0$5
125,3
68$1
4.10
Onlin
e Inf
orm
ation
Serv
ices
4,000
$14,0
00$1
Adve
rtisin
g and
Ente
rpris
e Site
s75
,000
$675
,000
$6
Gove
rnm
ent
2,000
$22,0
00$2
e-Co
mm
erce
50,00
0$5
50,00
0$5
Telec
omm
unica
tions
/ISPs
77,96
3$8
.77
Distr
ibutio
n of H
ardw
are a
nd/o
r So
ftwar
e Pro
ducts
71,77
4$8
.07
Othe
r ICT
wor
kers
not i
nclud
ed in
Delo
itte
Acce
ss Ec
onom
ics da
ta14
0,941
Tota
l19
0,00
0$2
255
4,70
0$6
5.10
inpu
ts A
nA
lysi
s
Outp
uts A
naly
sisIn
tern
et Va
lue-
Adde
d $b
illio
nIC
T Val
ue-A
dded
$bill
ion
Perce
ntag
e of G
DP3.6
0%7.7
4%
Value
$46.8
0$1
00.62

AustrAliAn iCt stAtistiCAl Compendium 2011
13AustrAliAn Computer soCiety
the
ABs
defi
nes
iCt
empl
oym
ent b
y th
e A
nZs
Co d
efini
tion
at a
num
ber o
f lev
els
desc
ribed
by
the
num
ber o
f dig
its in
the
code
use
d.
At t
he “4
dig
it” le
vel,
the
follo
win
g ar
e th
e m
ain
iCt
jobs
, eith
er w
holly
or i
n pa
rt. F
or th
e pu
rpos
e of
som
e of
the
ana
lysi
s in
thi
s re
port
, the
se o
ccup
atio
ns a
re g
roup
ed in
to C
iier
occu
patio
n gr
oupi
ng c
ateg
orie
s:
ClA
ssiF
yin
G iC
t em
plo
ymen
t
ANZS
CO co
deAN
ZSCO
4 Le
vel D
escr
iptio
nCI
IER
ICT O
ccup
atio
n Gr
oupi
ng
1351
ICT M
anag
ers
ICT M
anag
emen
t and
Ope
ratio
ns
2232
ICT Tr
ainer
sICT
Man
agem
ent a
nd O
pera
tions
2247
Man
agem
ent a
nd O
rgan
isatio
n Ana
lysts
ICT M
anag
emen
t and
Ope
ratio
ns
2249
Othe
r Inf
orm
ation
and O
rgan
isatio
n Pro
fessio
nals
ICT M
anag
emen
t and
Ope
ratio
ns
2252
ICT Sa
les Pr
ofes
siona
lsICT
Sales
2324
Grap
hic an
d Web
Des
igner
s, an
d Illu
strat
ors
ICT Te
chnic
al an
d Pro
fessio
nal
2611
ICT Bu
sines
s and
Syste
ms A
nalys
tsICT
Tech
nical
and P
rofes
siona
l
2612
Mult
imed
ia Sp
ecial
ists a
nd W
eb D
evelo
pers
ICT Te
chnic
al an
d Pro
fessio
nal
2613
Softw
are a
nd Ap
plica
tions
Prog
ram
mer
sICT
Tech
nical
and P
rofes
siona
l
2621
Data
base
and S
yste
ms A
dmini
strat
ors,
and I
CT Se
curit
y Spe
cialis
tsICT
Man
agem
ent a
nd O
pera
tions
2631
Com
pute
r Net
work
Prof
essio
nals
ICT Te
chnic
al an
d Pro
fessio
nal
2632
ICT Su
ppor
t and
Test
Engin
eers
ICT M
anag
emen
t and
Ope
ratio
ns
2633
Telec
omm
unica
tions
Engin
eerin
g Pro
fessio
nals
ICT Te
chnic
al an
d Pro
fessio
nal
3123
Electr
ical E
ngine
ering
Dra
ftspe
rsons
and T
echn
ician
sEle
ctron
ic Tra
des a
nd Pr
ofes
siona
l8
3124
Electr
onic
Engin
eerin
g Dra
ftspe
rsons
and T
echn
ician
sEle
ctron
ic Tra
des a
nd Pr
ofes
siona
l
3131
ICT Su
ppor
t Tec
hnici
ans
ICT Tr
ades
3132
Telec
omm
unica
tions
Tech
nical
Spec
ialist
sICT
Tech
nical
and P
rofes
siona
l
3423
Electr
onics
Trad
es W
orke
rsEle
ctron
ic Tra
des a
nd Pr
ofes
siona
l
3424
Telec
omm
unica
tions
Trad
es W
orke
rsICT
Trad
es
6212
ICT Sa
les A
ssista
nts
ICT Sa
les
8 Ele
ctro
nic
Trad
es a
nd P
rofe
ssio
nal E
mpl
oym
ent (
3123
/312
4) is
incl
uded
in o
ur IC
T to
tals
whe
re e
mpl
oym
ent i
s with
in m
ajor
ICT
indu
stry
cate
gorie
s

AustrAliAn iCt stAtistiCAl Compendium 2011
AustrAliAn Computer soCiety14
Who
We
Are
iCt
teCH
niC
Al
An
d p
roFe
ssio
nA
l em
plo
ymen
t
9 CIIE
R ex
trac
t fro
m A
BS la
bour
mar
ket s
tatis
tics F
eb 2
011
10 C
IIER
estim
ate
from
Top
250
ICT
Indu
stry
mod
el D
ec 2
010
11 M
ost o
f the
se o
f the
se p
eopl
e w
ork
in th
e 28
5,00
0 st
rong
ICT
indu
stry
12 E
xclu
des E
lect
roni
cs e
mpl
oym
ent o
utsi
de m
ain
ICT
indu
stry
sect
ors
ICT W
orkf
orce
, All
Indu
strie
s 9IC
T Tec
hnica
l &
Prof
essio
nal
ICT M
anag
emen
t &
Oper
atio
nsIC
T Tra
des
ICT S
ales
Elec
troni
c Tra
des
& Pr
ofes
siona
lIC
T Ind
ustr
y Adm
in
& Lo
gist
ics Su
ppor
tIC
T Wor
kers
(ACS
/CI
IER
defin
ition
)
Prof
essio
nal, S
cient
ific a
nd Te
chnic
al Se
rvice
s11
2,028
49,77
519
,085
10,20
04,5
70–
–
Info
rmat
ion M
edia
and T
eleco
mm
unica
tions
26,83
710
,820
20,59
012
,903
982
––
Tota
l of M
ain “I
CT” S
ecto
rs13
8,865
60,59
539
,675
23,10
35,5
5244
,99510
312,7
8511
Publi
c Adm
inistr
ation
and S
afety
16,54
120
,194
6,387
02,4
30–
45,55
2
Finan
cial a
nd In
sura
nce S
ervic
es16
,509
12,81
83,9
220
0–
33,24
9
Man
ufac
turin
g15
,114
8,315
3,303
401
2,872
–30
,005
Reta
il Tra
de5,0
944,5
114,3
969,1
863,7
09–
26,89
6
Educ
ation
and T
raini
ng9,3
198,4
815,2
2439
91,9
21–
25,34
4
Who
lesale
Trad
e7,0
324,4
942,6
316,1
562,9
40–
23,25
3
Cons
tructi
on2,9
382,0
145,6
240
6,802
–17
,378
Othe
r Ser
vices
4,434
2,271
1,256
411
8,911
–17
,283
Healt
hcar
e and
Socia
l Assi
stanc
e5,0
505,6
122,0
650
366
–13
,093
Trans
port,
Posta
l and
War
ehou
sing
4,042
4,011
2,212
072
1–
10,98
6
Adm
inistr
ative
and S
uppo
rt Se
rvice
s3,0
504,6
5836
550
679
9–
9,378
Electr
icity,
Gas
, Wat
er an
d Was
te Se
rvice
s1,7
543,9
6770
734
241
1–
7,181
Arts
and R
ecre
ation
Serv
ices
2,932
954
432
01,0
76–
5,394
Mini
ng1,2
221,7
301,3
300
699
–4,9
81
Rent
al, H
iring
and R
eal E
state
Serv
ices
1,253
1,152
039
749
2–
3,294
Acco
mm
odat
ion an
d Foo
d Ser
vices
588
1,286
390
00
–2,2
64
Agric
ultur
e, Fo
restr
y and
Fish
ing22
810
716
70
0–
502
235,
965
147,
170
80,0
8640
,901
39,7
0144
,995
??10
554,
66912

AustrAliAn iCt stAtistiCAl Compendium 2011
15AustrAliAn Computer soCiety
ICT
Em
ploy
men
t D
emog
raph
ics
13 E
xtra
ct fr
om A
BS la
bour
mar
ket s
tatis
tics,
Feb
2009
ANZS
CO Jo
b-ty
pe%
over
40%
over
55Gr
and T
otal
Med
ian
age
3420
Elec
tronic
s and
Telec
omm
unica
tions
Trad
es W
orke
rs nf
d10
0.00%
48.33
%1,0
4553
.54
2232
ICT T
raine
rs75
.00%
24.58
%4,7
4046
.20
3132
Telec
omm
unica
tions
Tech
nical
Spec
ialist
s87
.18%
0.00%
3,954
45.26
3124
Elec
tronic
Engin
eerin
g Dra
ftspe
rsons
and T
echn
ician
s64
.44%
23.67
%8,2
4744
.23
2247
Man
agem
ent a
nd O
rgan
isatio
n Ana
lysts
54.25
%19
.39%
50,57
641
.92
2249
Oth
er In
form
ation
and O
rgan
isatio
n Pro
fessio
nals
51.10
%15
.26%
14,37
540
.73
1351
ICT M
anag
ers
53.23
%8.2
9%43
,771
40.35
2600
ICT P
rofes
siona
ls nf
d50
.98%
15.11
%13
,372
40.21
3423
Elec
tronic
s Tra
des W
orke
rs49
.25%
12.72
%41
,025
39.31
3424
Telec
omm
unica
tions
Trad
es W
orke
rs47
.67%
6.25%
13,95
739
.12
2633
Telec
omm
unica
tions
Engin
eerin
g Pro
fessio
nals
42.41
%6.9
0%8,5
2438
.28
2611
ICT B
usine
ss an
d Sys
tem
s Ana
lysts
40.71
%7.5
1%22
,010
38.06
3131
ICT S
uppo
rt Te
chnic
ians
39.66
%11
.33%
48,37
437
.95
2632
ICT S
uppo
rt an
d Tes
t Eng
ineer
s47
.61%
1.57%
9,199
37.83
2621
Dat
abas
e and
Syste
ms A
dmini
strat
ors,
and I
CT Se
curit
y Spe
cialis
ts39
.14%
6.47%
41,81
737
.66
2252
ICT S
ales P
rofes
siona
ls38
.69%
10.33
%12
,216
37.61
2613
Softw
are a
nd Ap
plica
tions
Prog
ram
mer
s38
.19%
6.03%
74,56
537
.44
2631
Com
pute
r Net
work
Prof
essio
nals
34.06
%3.5
3%23
,629
36.40
2324
Gra
phic
and W
eb D
esign
ers,
and I
llustr
ator
s30
.77%
7.33%
48,46
036
.09
2612
Mult
imed
ia Sp
ecial
ists a
nd W
eb D
evelo
pers
20.48
%10
.10%
11,32
634
.85
6212
ICT S
ales A
ssista
nts
27.94
%7.6
0%21
,921
34.44
AG
e d
emo
GrA
pHy
oF
iCt
Wo
rKer
s13
AustrAliAn iCt stAtistiCAl Compendium 2011
AustrAliAn Computer soCiety16
Lear
ning
IC
TIC
T E
duca
tion
And
Tra
inin
g St
atis
tics
14
Leve
l of C
ours
e20
0820
10Va
riatio
n
Docto
rate
by Re
sear
ch35
237
220
Docto
rate
by Co
urse
work
3<
10
Mas
ter’s
by Re
sear
ch56
8832
Mas
ter’s
by Co
urse
work
5,947
5,038
-909
Postg
rad.
Qual/
Preli
m.
4<
10
Grad
.(Pos
t) Di
p. –
new
area
586
663
77
Grad
.(Pos
t) Di
p. –
ext a
rea
201
155
-46
Grad
uate
Certi
ficat
e43
448
955
Sub-
tota
l Pos
tgra
duat
e7,5
836,8
14-7
69
Bach
elor’s
Gra
duat
e Ent
ry4
0-4
Bach
elor’s
Hon
ours
6010
141
Bach
elor’s
Pass
10,77
011
,339
569
Asso
ciate
Deg
ree
5618
012
4
Adva
nced
Dipl
oma (
AQF)
9018
393
Diplo
ma (
AQF)
736
829
93
Othe
r und
ergr
adua
te aw
ard c
ourse
s63
674
Sub-
tota
l Und
ergr
adua
te11
,779
12,69
992
0
Enab
ling C
ourse
s4
139
Non-
Awar
d Cou
rses
00
0
TOTA
L19
,366
19,5
2616
0
14 D
EEW
R 20
11
Com
men
Cin
G iC
t st
ud
ents
By
leVe
l o
F Co
urs
e A
nd
Gen
der
, Fu
ll y
eAr
AustrAliAn iCt stAtistiCAl Compendium 2011
17AustrAliAn Computer soCiety
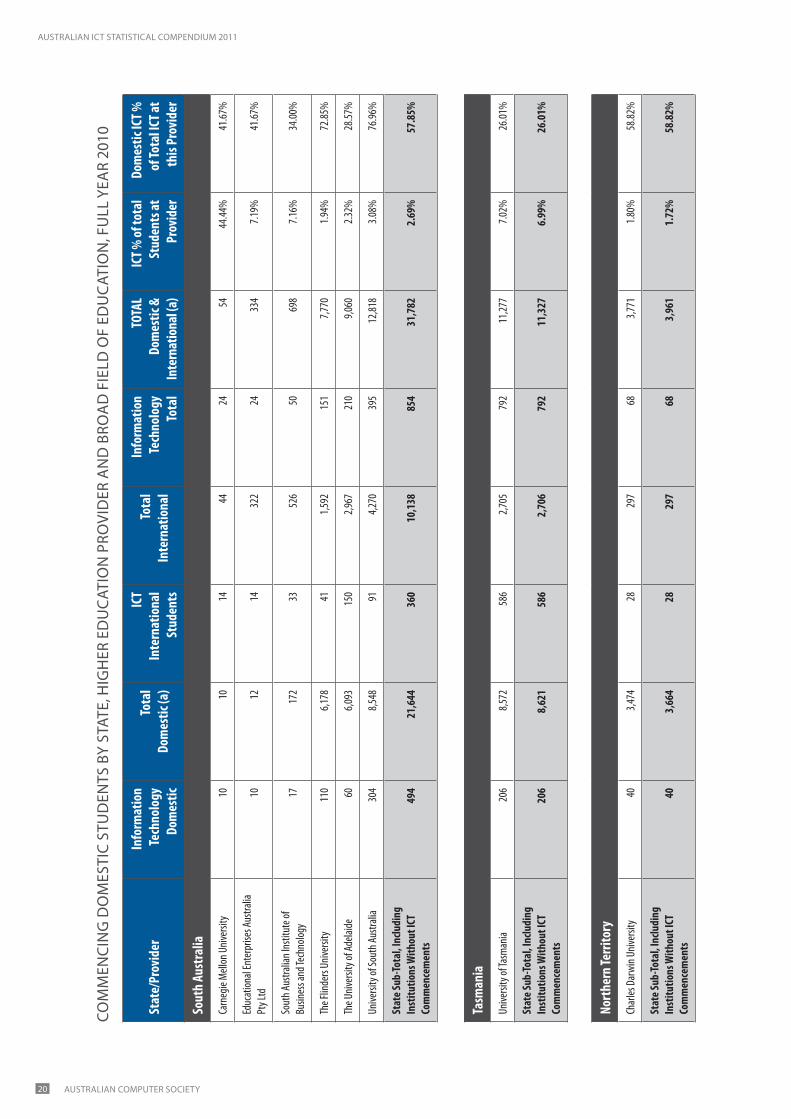
Stat
e/Pr
ovid
erIn
form
atio
n Te
chno
logy
Do
mes
tic
Tota
l Do
mes
tic (a
)
ICT
Inte
rnat
iona
l St
uden
ts
Tota
l In
tern
atio
nal
Info
rmat
ion
Tech
nolo
gy
Tota
l
TOTA
L Do
mes
tic &
In
tern
atio
nal (
a)
ICT %
of To
tal
Stud
ents
at
Prov
ider
Dom
estic
ICT %
of
Tota
l ICT
at
this
Prov
ider
New
Sout
h W
ales
Char
les St
urt U
niver
sity
404
14,55
934
82,6
6775
217
,226
4.37%
53.72
%
Inse
arch
3532
111
782
715
21,1
4813
.24%
23.03
%
Mac
quar
ie Un
iversi
ty22
98,4
5096
5,911
325
14,36
12.2
6%70
.46%
Raffl
es KV
B Ins
titut
e30
130
1314
843
278
15.47
%69
.77%
Sout
hern
Cros
s Univ
ersit
y74
4,851
691,3
4714
36,1
982.3
1%51
.75%
Sydn
ey In
stitu
te of
Busin
ess a
nd
Tech
nolog
y34
394
512,6
5985
3,053
2.78%
40.00
%
The U
niver
sity o
f New
Engla
ndnp
6,895
np61
113
47,5
061.7
9%np
The U
niver
sity o
f New
Sout
h Wale
s22
512
,763
197
6,700
422
19,46
32.1
7%53
.32%
The U
niver
sity o
f New
castl
e24
211
,741
222
2,666
464
14,40
73.2
2%52
.16%
The U
niver
sity o
f Syd
ney
234
14,86
322
35,6
5645
720
,519
2.23%
51.20
%
Unive
rsity
of Te
chno
logy,
Sydn
ey46
68,2
1540
44,3
6187
012
,576
6.92%
53.56
%
Unive
rsity
of W
este
rn Sy
dney
484
13,34
494
2,319
578
15,66
33.6
9%83
.74%
Unive
rsity
of W
ollon
gong
263
6,340
1008
4,984
1,271
11,32
411
.22%
20.69
%
Woll
ongo
ng Co
llege
Austr
alia
1023
3115
141
174
23.56
%24
.39%
Stat
e Sub
-Tota
l, In
cludi
ng
Inst
itutio
ns W
ithou
t ICT
Co
mm
ence
men
ts2,
811
114,
423
2,92
642
,313
5,73
715
6,73
63.
66%
49.0
0%
Com
men
Cin
G d
om
esti
C st
ud
ents
By
stAt
e, H
iGH
er e
du
CAt
ion
pro
Vid
er A
nd
Bro
Ad
Fie
ld o
F ed
uC
Atio
n, F
ull
yeA
r 20
10
NO
TE: n
p =
not p
ublis
hed/
not p
ublic
ised

AustrAliAn iCt stAtistiCAl Compendium 2011
AustrAliAn Computer soCiety18
Stat
e/Pr
ovid
erIn
form
atio
n Te
chno
logy
Do
mes
tic
Tota
lDo
mes
tic (a
)
ICT
Inte
rnat
iona
l St
uden
ts
Tota
l In
tern
atio
nal
Info
rmat
ion
Tech
nolo
gy
Tota
l
TOTA
LDo
mes
tic &
In
tern
atio
nal (
a)
ICT %
of To
tal
Stud
ents
at
Prov
ider
Dom
estic
ICT %
of
Tota
l ICT
at
this
Prov
ider
Vict
oria
Box H
ill In
stitu
te of
TAFE
6026
637
7197
337
28.78
%61
.86%
Deak
in Un
iversi
ty (b
)37
310
,870
193
3,801
566
14,67
13.8
6%65
.90%
La Tr
obe U
niver
sity
127
9,530
126
3,826
253
13,35
61.8
9%50
.20%
Melb
ourn
e Ins
titut
e of B
usine
ss an
d Tec
hnolo
gy30
724
139
1,740
169
2,464
6.86%
17.75
%
Melb
ourn
e Ins
titut
e of T
echn
ology
np18
8np
359
183
547
33.46
%np
Mon
ash C
olleg
e Gro
up10
7547
1,220
571,2
954.4
0%17
.54%
Mon
ash U
niver
sity
514
13,78
669
08,1
181,2
0421
,904
5.50%
42.69
%
RMIT
Unive
rsity
620
9,122
1043
10,49
31,6
6319
,615
8.48%
37.28
%
Swinb
urne
Univ
ersit
y of
Tech
nolog
y34
45,5
3644
23,6
1078
69,1
468.5
9%43
.77%
The U
niver
sity o
f Melb
ourn
e29
11,74
779
4,466
108
16,21
30.6
7%26
.85%
Unive
rsity
of Ba
llara
tnp
2,570
np2,6
2868
95,1
9813
.26%
np
Victo
ria U
niver
sity
131
6,645
389
2,900
520
9,545
5.45%
25.19
%
Stat
e Sub
-Tota
l, In
cludi
ng
Inst
itutio
ns W
ithou
t ICT
Co
mm
ence
men
ts2,
382
73,3
853,
913
46,1
956,
295
119,
580
5.26
%37
.84%
Com
men
Cin
G d
om
esti
C st
ud
ents
By
stAt
e, H
iGH
er e
du
CAt
ion
pro
Vid
er A
nd
Bro
Ad
Fie
ld o
F ed
uC
Atio
n, F
ull
yeA
r 20
10

AustrAliAn iCt stAtistiCAl Compendium 2011
19AustrAliAn Computer soCiety
Stat
e/Pr
ovid
erIn
form
atio
n Te
chno
logy
Do
mes
tic
Tota
lDo
mes
tic (a
)
ICT
Inte
rnat
iona
l St
uden
ts
Tota
l In
tern
atio
nal
Info
rmat
ion
Tech
nolo
gy
Tota
l
TOTA
LDo
mes
tic &
Inte
rnat
iona
l (a)
ICT %
of To
tal
Stud
ents
at
Prov
ider
Dom
estic
ICT %
of
Tota
l ICT
at
this
Prov
ider
Quee
nsla
nd
Bond
Univ
ersit
y33
1,622
321,8
4365
3,465
1.88%
50.77
%
Cent
ral Q
ueen
sland
Univ
ersit
y17
55,9
1372
53,9
7090
09,8
839.1
1%19
.44%
Griffi
th U
niver
sity
247
12,32
515
25,8
9539
918
,220
2.19%
61.90
%
Jam
es Co
ok U
niver
sity
120
5,100
225
2,577
345
7,677
4.49%
34.78
%
Quee
nslan
d Ins
titut
e of B
usine
ss an
d Tec
hnolo
gy27
230
391,2
3066
1,460
4.52%
40.91
%
Quee
nslan
d Univ
ersit
y of
Tech
nolog
y66
612
,723
323
3,319
989
16,04
26.1
7%67
.34%
The U
niver
sity o
f Que
ensla
nd22
611
,158
155
5,039
381
16,19
72.3
5%59
.32%
Unive
rsity
of So
uthe
rn Q
ueen
sland
139
8,045
224
2,812
363
10,85
73.3
4%38
.29%
Unive
rsity
of th
e Sun
shine
Coas
t56
3,564
497
460
4,538
1.32%
93.33
%
Stat
e Sub
-Tota
l, In
cludi
ng
Inst
itutio
ns W
ithou
t ICT
Co
mm
ence
men
ts1,
689
62,9
111,
879
27,6
973,
568
90,6
083.
94%
47.3
4%
Com
men
Cin
G d
om
esti
C st
ud
ents
By
stAt
e, H
iGH
er e
du
CAt
ion
pro
Vid
er A
nd
Bro
Ad
Fie
ld o
F ed
uC
Atio
n, F
ull
yeA
r 20
10
Wes
tern
Aus
tral
ia
Curti
n Int
erna
tiona
l Coll
ege
1010
528
1213
381,3
182.8
8%26
.32%
Curti
n Univ
ersit
y of T
echn
ology
215
10,07
120
275
0841
717
,579
2.37%
51.56
%
Edith
Cowa
n Univ
ersit
y28
29,4
2332
627
1460
812
,137
5.01%
46.38
%
Mur
doch
Univ
ersit
y13
24,5
4413
120
6526
36,6
093.9
8%50
.19%
Perth
Insti
tute
of Bu
sines
s and
Te
chno
logy
1041
2048
230
523
5.74%
33.33
%
The U
niver
sity o
f Wes
tern
Austr
alia
104
5,831
5718
5816
17,6
892.0
9%64
.60%
Stat
e Sub
-Tota
l, In
cludi
ng
Inst
itutio
ns W
ithou
t ICT
Co
mm
ence
men
ts73
933
,513
778
16,2
241,
517
49,7
373.
05%
48.7
1%
AustrAliAn iCt stAtistiCAl Compendium 2011
AustrAliAn Computer soCiety20
Stat
e/Pr
ovid
erIn
form
atio
n Te
chno
logy
Do
mes
tic
Tota
lDo
mes
tic (a
)
ICT
Inte
rnat
iona
l St
uden
ts
Tota
l In
tern
atio
nal
Info
rmat
ion
Tech
nolo
gy
Tota
l
TOTA
LDo
mes
tic &
In
tern
atio
nal (
a)
ICT %
of to
tal
Stud
ents
at
Prov
ider
Dom
estic
ICT %
of
Tota
l ICT
at
this
Prov
ider
Sout
h Au
stra
lia
Carn
egie
Mell
on U
niver
sity
1010
1444
2454
44.44
%41
.67%
Educ
ation
al En
terp
rises
Austr
alia
Pty L
td10
1214
322
2433
47.1
9%41
.67%
Sout
h Aus
tralia
n Ins
titut
e of
Busin
ess a
nd Te
chno
logy
1717
233
526
5069
87.1
6%34
.00%
The F
linde
rs Un
iversi
ty
110
6,178
411,5
9215
17,7
701.9
4%72
.85%
The U
niver
sity o
f Ade
laide
606,0
9315
02,9
6721
09,0
602.3
2%28
.57%
Unive
rsity
of So
uth A
ustra
lia30
48,5
4891
4,270
395
12,81
83.0
8%76
.96%
Stat
e Sub
-Tota
l, In
cludi
ng
Inst
itutio
ns W
ithou
t ICT
Co
mm
ence
men
ts49
421
,644
360
10,1
3885
431
,782
2.69
%57
.85%
Com
men
Cin
G d
om
esti
C st
ud
ents
By
stAt
e, H
iGH
er e
du
CAt
ion
pro
Vid
er A
nd
Bro
Ad
Fie
ld o
F ed
uC
Atio
n, F
ull
yeA
r 20
10
Tasm
ania
Unive
rsity
of Ta
sman
ia20
68,5
7258
62,7
0579
211
,277
7.02%
26.01
%
Stat
e Sub
-Tota
l, In
cludi
ng
Inst
itutio
ns W
ithou
t ICT
Co
mm
ence
men
ts20
68,
621
586
2,70
679
211
,327
6.99
%26
.01%
Nort
hern
Terri
tory
Char
les D
arwi
n Univ
ersit
y40
3,474
2829
768
3,771
1.80%
58.82
%
Stat
e Sub
-Tota
l, In
cludi
ng
Inst
itutio
ns W
ithou
t ICT
Co
mm
ence
men
ts40
3,66
428
297
683,
961
1.72
%58
.82%
AustrAliAn iCt stAtistiCAl Compendium 2011
21AustrAliAn Computer soCiety
Stat
e/Pr
ovid
erIn
form
atio
n Te
chno
logy
Do
mes
tic
Tota
l Do
mes
tic(a
)
ICT
Inte
rnat
iona
l St
uden
ts
Tota
l In
tern
atio
nal
Info
rmat
ion
Tech
nolo
gy
Tota
l
TOTA
L Do
mes
tic &
In
tern
atio
nal(a
)
ICT %
of To
tal
Stud
ents
at
Prov
ider
Dom
estic
ICT %
of
Tota
l ICT
at
this
Prov
ider
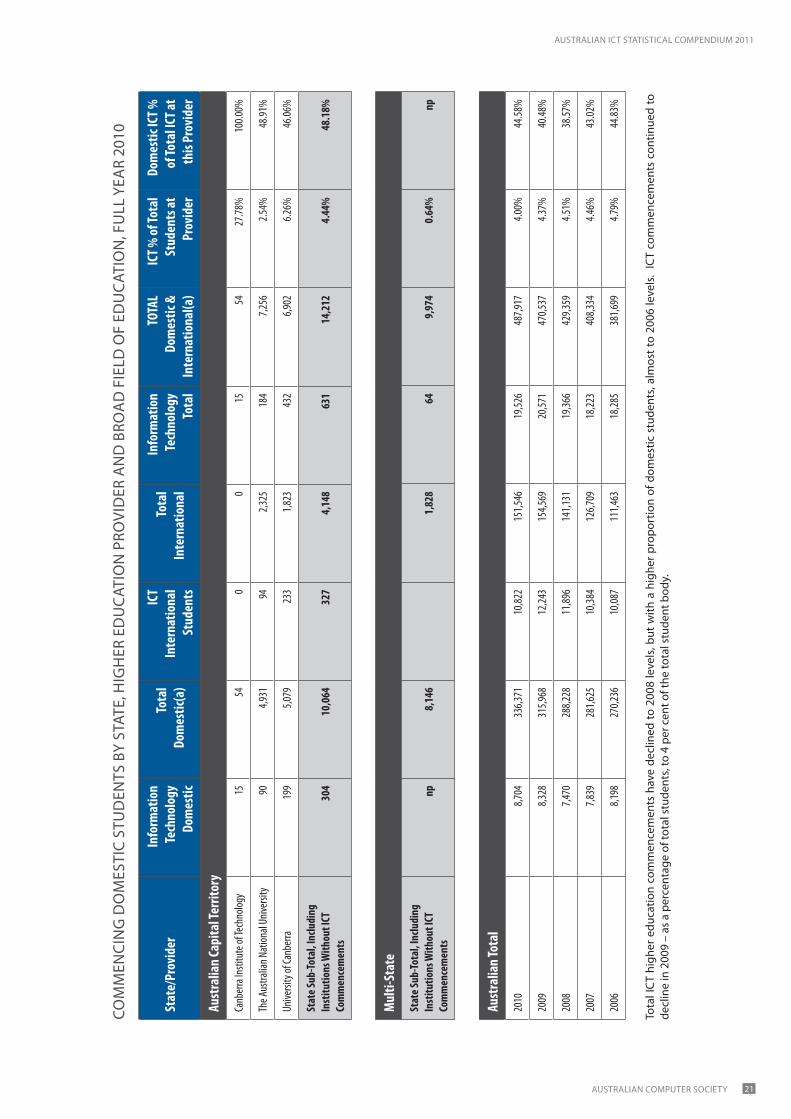
Aust
ralia
n Ca
pita
l Ter
ritor
y
Canb
erra
Insti
tute
of Te
chno
logy
1554
00
1554
27.78
%10
0.00%
The A
ustra
lian N
ation
al Un
iversi
ty90
4,931
942,3
2518
47,2
562.5
4%48
.91%
Unive
rsity
of Ca
nber
ra19
95,0
7923
31,8
2343
26,9
026.2
6%46
.06%
Stat
e Sub
-Tota
l, In
cludi
ng
Inst
itutio
ns W
ithou
t ICT
Co
mm
ence
men
ts30
410
,064
327
4,14
863
114
,212
4.44
%48
.18%
Aust
ralia
n To
tal
2010
8,704
336,3
7110
,822
151,5
4619
,526
487,9
174.0
0%44
.58%
2009
8,328
315,9
6812
,243
154,5
6920
,571
470,5
374.3
7%40
.48%
2008
7,470
288,2
2811
,896
141,1
3119
,366
429,3
594.5
1%38
.57%
2007
7,839
281,6
2510
,384
126,7
0918
,223
408,3
344.4
6%43
.02%
2006
8,198
270,2
3610
,087
111,4
6318
,285
381,6
994.7
9%44
.83%
tota
l iC
t hi
gher
edu
catio
n co
mm
ence
men
ts h
ave
decl
ined
to 2
008
leve
ls, b
ut w
ith a
hig
her p
ropo
rtio
n of
dom
estic
stu
dent
s, al
mos
t to
2006
leve
ls.
iCt
com
men
cem
ents
con
tinue
d to
de
clin
e in
200
9 –
as a
per
cent
age
of to
tal s
tude
nts,
to 4
per
cen
t of t
he to
tal s
tude
nt b
ody.
Com
men
Cin
G d
om
esti
C st
ud
ents
By
stAt
e, H
iGH
er e
du
CAt
ion
pro
Vid
er A
nd
Bro
Ad
Fie
ld o
F ed
uC
Atio
n, F
ull
yeA
r 20
10
Mul
ti-St
ate
Stat
e Sub
-Tota
l, In
cludi
ng
Inst
itutio
ns W
ithou
t ICT
Co
mm
ence
men
tsnp
8,14
61,
828
649,
974
0.64
%np

AustrAliAn iCt stAtistiCAl Compendium 2011
AustrAliAn Computer soCiety22
C
omm
enci
ng IC
T st
uden
ts in
Hig
her E
duca
tion,
200
6-20
10
0
5000
10,0
00
15,0
00
20,0
00
25,0
00
2006
2007
2008
2009
2010
Dom
estic
ICT
stud
ent c
omm
ence
men
ts
Inte
rnat
iona
l IC
T st
uden
t com
men
cem
ents
Tota
l IC
T st
uden
t com
men
cem
ents

AustrAliAn iCt stAtistiCAl Compendium 2011
23AustrAliAn Computer soCiety
C
omm
enci
ng IC
T st
uden
t per
cent
ages
200
6-20
10
ICT
% o
f all
dom
estic
stu
dent
s,
2.59
%
ICT
% o
f all
stud
ents
, 4.0
0%
0.00
%
1.00
%
2.00
%
3.00
%
4.00
%
5.00
%
6.00
%
2006
2007
2008
2009
2010
ICT
% o
f all
dom
estic
stu
dent
s
ICT
% o
f all
stud
ents
AustrAliAn iCt stAtistiCAl Compendium 2011
AustrAliAn Computer soCiety24
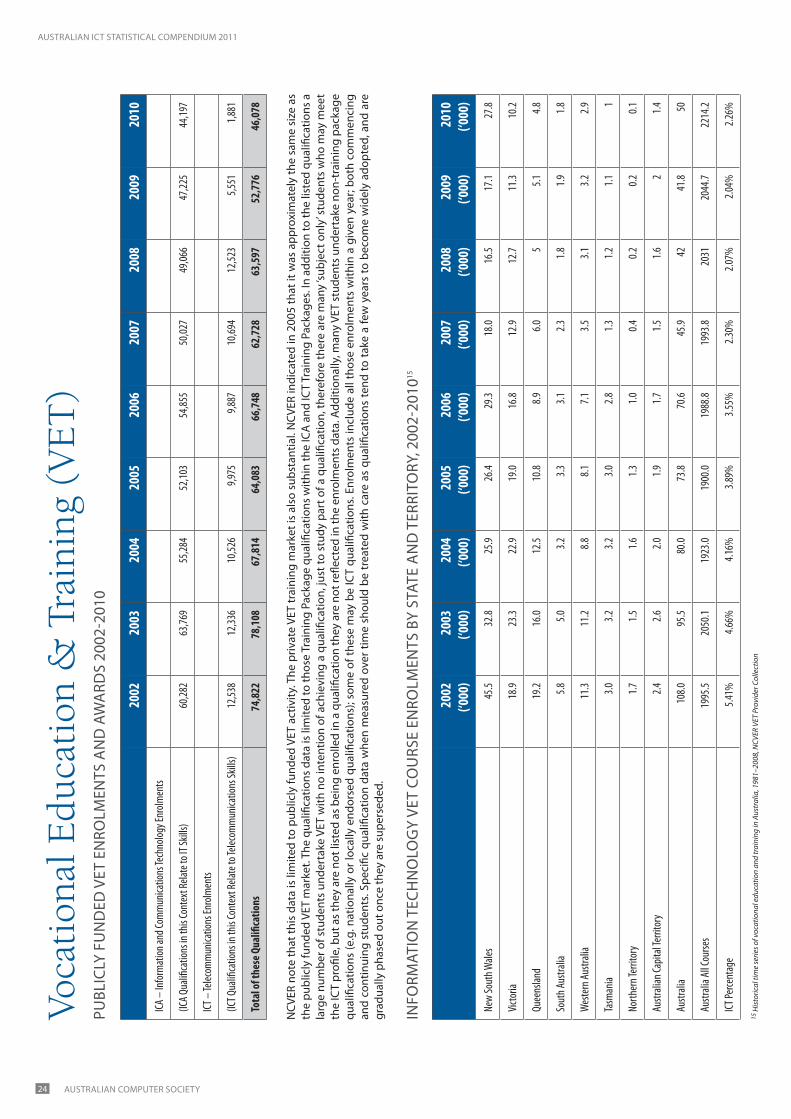
Voca
tion
al E
duca
tion
& T
rain
ing
(VE
T)
20
0220
0320
0420
0520
0620
0720
0820
0920
10
ICA –
Info
rmat
ion an
d Com
mun
icatio
ns Te
chno
logy E
nrolm
ents
(ICA Q
ualifi
catio
ns in
this
Cont
ext R
elate
to IT
Skills
)60
,282
63,76
955
,284
52,10
354
,855
50,02
749
,066
47,22
544
,197
ICT –
Telec
omm
unica
tions
Enro
lmen
ts
(ICT Q
ualifi
catio
ns in
this
Cont
ext R
elate
to Te
lecom
mun
icatio
ns Sk
ills)
12,53
812
,336
10,52
69,9
759,8
8710
,694
12,52
35,5
511,8
81
Tota
l of t
hese
Qua
lifica
tions
74,8
2278
,108
67,8
1464
,083
66,7
4862
,728
63,5
9752
,776
46,0
78
20
02(‘0
00)
2003
(‘000
)20
04(‘0
00)
2005
(‘000
)20
06(‘0
00)
2007
(‘000
)20
08(‘0
00)
2009
(‘000
)20
10(‘0
00)
New
Sout
h Wale
s45
.532
.825
.926
.429
.318
.016
.517
.127
.8
Victo
ria18
.923
.322
.919
.016
.812
.912
.711
.310
.2
Quee
nslan
d19
.216
.012
.510
.88.9
6.05
5.14.8
Sout
h Aus
tralia
5.85.0
3.23.3
3.12.3
1.81.9
1.8
Wes
tern
Austr
alia
11.3
11.2
8.88.1
7.13.5
3.13.2
2.9
Tasm
ania
3.03.2
3.23.0
2.81.3
1.21.1
1
North
ern T
errit
ory
1.71.5
1.61.3
1.00.4
0.20.2
0.1
Austr
alian
Capit
al Te
rrito
ry2.4
2.62.0
1.91.7
1.51.6
21.4
Austr
alia
108.0
95.5
80.0
73.8
70.6
45.9
4241
.850
Austr
alia A
ll Cou
rses
1995
.520
50.1
1923
.019
00.0
1988
.819
93.8
2031
2044
.722
14.2
ICT Pe
rcent
age
5.41%
4.66%
4.16%
3.89%
3.55%
2.30%
2.07%
2.04%
2.26%
nCV
er n
ote
that
this
dat
a is
lim
ited
to p
ublic
ly fu
nded
Vet
act
ivity
. the
priv
ate
Vet
trai
ning
mar
ket i
s al
so s
ubst
antia
l. n
CVer
indi
cate
d in
200
5 th
at it
was
app
roxi
mat
ely
the
sam
e si
ze a
s th
e pu
blic
ly fu
nded
Vet
mar
ket.
the
qual
ifica
tions
dat
a is
lim
ited
to th
ose
trai
ning
pac
kage
qua
lifica
tions
with
in th
e iC
A a
nd iC
t tr
aini
ng p
acka
ges.
in a
dditi
on to
the
liste
d qu
alifi
catio
ns a
la
rge
num
ber o
f stu
dent
s un
dert
ake
Vet
with
no
inte
ntio
n of
ach
ievi
ng a
qua
lifica
tion,
just
to s
tudy
par
t of a
qua
lifica
tion,
ther
efor
e th
ere
are
man
y ‘su
bjec
t onl
y’ s
tude
nts
who
may
mee
t th
e iC
t pr
ofile
, but
as
they
are
not
list
ed a
s be
ing
enro
lled
in a
qua
lifica
tion
they
are
not
refle
cted
in th
e en
rolm
ents
dat
a. A
dditi
onal
ly, m
any
Vet
stud
ents
und
erta
ke n
on-t
rain
ing
pack
age
qual
ifica
tions
(e.g
. nat
iona
lly o
r loc
ally
end
orse
d qu
alifi
catio
ns);
som
e of
thes
e m
ay b
e iC
t qu
alifi
catio
ns. e
nrol
men
ts in
clud
e al
l tho
se e
nrol
men
ts w
ithin
a g
iven
yea
r; bo
th c
omm
enci
ng
and
cont
inui
ng s
tude
nts.
spec
ific
qual
ifica
tion
data
whe
n m
easu
red
over
tim
e sh
ould
be
trea
ted
with
car
e as
qua
lifica
tions
tend
to ta
ke a
few
yea
rs to
bec
ome
wid
ely
adop
ted,
and
are
gr
adua
lly p
hase
d ou
t onc
e th
ey a
re s
uper
sede
d.
15 H
isto
rical
tim
e se
ries o
f voc
atio
nal e
duca
tion
and
trai
ning
in A
ustr
alia
, 198
1–20
08, N
CVER
VET
Pro
vide
r Col
lect
ion
puBl
iCly
Fu
nd
ed V
et e
nro
lmen
ts A
nd
AW
Ard
s 20
02-2
010
inFo
rmAt
ion
teC
Hn
olo
Gy
Vet
Cou
rse
enro
lmen
ts B
y st
Ate
An
d t
erri
tory
, 200
2-20
1015

AustrAliAn iCt stAtistiCAl Compendium 2011
25AustrAliAn Computer soCiety
Info
rmat
ion
Tech
nolo
gy V
ET e
nrol
men
ts 2
002-
2010
020406080100
120
2002
2003
2004
2005
2006
2007
2008
2009
2010
'000 enrolled
0.00
%
1.00
%
2.00
%
3.00
%
4.00
%
5.00
%
6.00
%
7.00
%
8.00
%
ICT %
Info
rmat
ion
Tech
nolo
gy V
ET e
nrol
men
ts '0
00
ICT
Perc
enta
ge o
f all
VET
cour
ses

AustrAliAn iCt stAtistiCAl Compendium 2011
AustrAliAn Computer soCiety26
In
form
atio
n Te
chno
logy
VET
enr
olm
ents
by
Stat
e 20
02-2
010
05101520253035404550
2002
2003
2004
2005
2006
2007
2008
2009
2010
NSW
VIC
Qld
SA WA
TAS
NT
ACT
iCt
Vet
enro
lmen
ts c
ontin
ued
to d
eclin
e to
200
8, a
nd in
mos
t sta
tes
to 2
010.
the
re w
as a
hug
e re
cove
ry in
new
sou
th W
ales
in 2
009-
10.

AustrAliAn iCt stAtistiCAl Compendium 2011
27AustrAliAn Computer soCiety
IC
T 45
7 Vi
sa tr
ends
200
6-20
10
0
2,00
0
4,00
0
6,00
0
8,00
0
10,0
00
12,0
00
14,0
00
16,0
00
2005
-200
620
06-2
007
2007
-200
820
08-2
009
2009
-201
0
No.
per
ann
um
0.00
%
2.00
%
4.00
%
6.00
%
8.00
%
10.0
0%
12.0
0%
14.0
0%
Perc
enta
ge o
f tot
al
ICT
457
entra
nts
ICT
per c
ent o
f tot
al 4
57 v
isa
Perio
dTo
tal t
empo
rary
(457
) Visa
IC
T occ
upat
ions
cite
d16IC
T % of
tota
lSo
urce
2007
-200
811
0,570
13,37
912
.10%
DIM
IA Po
pulat
ion Fl
ows:
Imm
igrat
ion A
spec
ts 20
07-0
8 Edit
ion
2008
-200
910
1,280
11,44
511
.30%
DIAC
Popu
lation
flows
: Imm
igrat
ion A
spec
ts 20
08-9
Editi
on
2009
-201
067
,980
8,530
12.55
%CII
ER Es
timat
e, Ba
sed o
n Lim
ited A
NZSC
O Da
ta
16 C
ompu
ting
Prof
essi
onal
s NEC
; Bus
ines
s and
Info
rmat
ion
Prof
essi
onal
s NEC
; App
licat
ions
and
Ana
lyst
Pro
gram
mer
(200
9-10
onl
y)

AustrAliAn iCt stAtistiCAl Compendium 2011
AustrAliAn Computer soCiety28
IC
T M
igra
tion
to A
ustr
alia
– 2
003-
2009
0
5,00
0
10,0
00
15,0
00
20,0
00
25,0
00
30,0
00
35,0
00
2003
2004
2005
2006
2007
2008
2009
ICT
Tem
pora
ry s
kille
d m
igra
tion
(new
457
vis
as)
ICT
perm
anen
t ski
lled
mig
ratio
n
inw
ards
per
man
ent
mig
ratio
n le
vels
hav
e in
crea
sed
sinc
e 20
06; s
hort
-ter
m m
igra
tion
has
redu
ced
in t
he p
ast
year
, aft
er g
row
ing
rapi
dly
sinc
e 20
05. n
o da
ta la
ter t
han
2009
was
ava
ilabl
e on
iCt
perm
anen
t ski
lled
mig
ratio
n.

AustrAliAn iCt stAtistiCAl Compendium 2011
29AustrAliAn Computer soCiety
Wom
en I
n IC
T
Fem
ale I
CT Em
ploy
men
tFe
mal
e % of
Tota
l ICT
Empl
oym
ent
Prof
essio
nal, S
cient
ific a
nd Te
chnic
al Se
rvice
s/Inf
orm
ation
Med
ia an
d Tele
com
mun
icatio
ns
45,60
923
.31%
Info
rmat
ion M
edia
and T
eleco
mm
unica
tions
18
,985
26.32
%
Publi
c Adm
inistr
ation
and S
afety
14
,837
32.57
%
Finan
cial a
nd In
sura
nce S
ervic
es
11,60
734
.91%
Man
ufac
turin
g 8,3
2627
.75%
Reta
il Tra
de
6,702
24.92
%
Educ
ation
and T
raini
ng
6,558
25.88
%
Healt
hcar
e and
Socia
l Assi
stanc
e 3,2
7525
.01%
Who
lesale
Trad
e 3,0
1412
.96%
Adm
inistr
ative
and S
uppo
rt Se
rvice
s 2,5
2026
.87%
Mini
ng
1,984
39.83
%
Electr
icity,
Gas
, Wat
er an
d Was
te Se
rvice
s 1,6
7323
.30%
Arts
and R
ecre
ation
Serv
ices
1,413
26.20
%
Trans
port,
Posta
l and
War
ehou
sing
1,312
11.94
%
Rent
al, H
iring
and R
eal E
state
Serv
ices
1,229
37.31
%
Othe
r Ser
vices
92
55.3
5%
Cons
tructi
on
862
4.96%
Agric
ultur
e, Fo
restr
y and
Fish
ing
228
45.42
%
Acco
mm
odat
ion an
d Foo
d Ser
vices
0
0.00%
Gran
d Tot
al13
1,05
924
.10%
the
fem
ale
perc
enta
ge o
f iC
t w
orke
rs h
as m
argi
nally
incr
ease
d by
0.6
per
cen
t sin
ce F
ebru
ary
2010
, whi
le th
e ab
solu
te n
umbe
r has
incr
ease
d by
ove
r 8,0
00.
17
Feb
2011
, ABS
labo
ur m
arke
t Sur
vey,
CIIE
R sp
ecia
l ext
ract
Fem
Ale
iCt
mA
nA
Ger
iAl,
pro
Fess
ion
Al,
teC
Hn
iCA
l A
nd
trA
de
empl
oym
ent
Fte
FeB
2010
By
ind
ust
ry (A
nZs
iC)17

AustrAliAn iCt stAtistiCAl Compendium 2011
AustrAliAn Computer soCiety30
W
omen
IC
T st
aff b
y In
dust
ry s
ecto
r
0
5000
10,0
00
15,0
00
20,0
00
25,0
00
30,0
00
35,0
00
40,0
00
45,0
00
50,0
00
Industry sector
Professional,Scientific and
Technical Information Mediaand
Telecommunications Public Administration
and Safety
Financial andInsurance Services
Manufacturing
Retail Trade
Education andTraining
Health Care andSocial Assistance
Wholesale Trade
Administrative andSupport Services
Mining
Electricity, Gas,Water and Waste
Services Arts and Recreation
Services
Transport, Postaland Warehousing
Rental, Hiring andReal Estate Services
Other Services
Construction
Agriculture, Forestryand Fishing
Accommodation andFood Services
0.0%
5.0%
10.0
%
15.0
%
20.0
%
25.0
%
30.0
%
35.0
%
40.0
%
45.0
%
50.0
%
Fem
ale
staf
fFe
mal
e %
this
cha
rt, s
ourc
ed fr
om th
e sp
ecia
l Ciie
r ex
trac
t of A
Bs la
bour
mar
ket d
ata
for F
ebru
ary
2011
, sho
ws
the
varia
ble
perc
enta
ge a
nd q
uant
ity
of fe
mal
e iC
t st
aff b
y in
dust
ry s
ecto
r. th
e hi
ghes
t vol
umes
are
foun
d in
iCt
sect
ors,
incl
udin
g so
ftw
are
and
serv
ices
com
pani
es.

AustrAliAn iCt stAtistiCAl Compendium 2011
31AustrAliAn Computer soCiety
W
omen
in IC
T, J
ob n
umbe
rs a
nd fe
mal
e pe
rcen
tage
s
0
1000
2000
3000
4000
5000
6000
7000
1351 ICT Managers
2232 ICT Trainers
2247 Managementand Organisation
Analysts2249 Other
Information andOrganisation
2252 ICT SalesProfessionals
2324 Graphic andWeb Designers, and
Illustrators2600 ICT
Professionals nfd2610 Business andSystems Analysts,and Programmers2611 ICT Business
and SystemsAnalysts
2612 MultimediaSpecialists and Web
Developers2613 Software and
ApplicationsProgrammers
2621 Database andSystems
Administrators, and2630 ICT Network
and SupportProfessionals nfd
2631 ComputerNetwork
Professionals2632 ICT Support
and Test Engineers2633
TelecommunicationsEngineering3124 Electronic
EngineeringDraftspersons and3130 ICT and
TelecommunicationsTechnicians nfd3131 ICT Support
Technicians3132
TelecommunicationsTechnical Specialists3420 Electronics andTelecommunicationsTrades Workers nfd
3423 ElectronicsTrades Workers
3424Telecommunications
Trades Workers6212 ICT Sales
Assistants
0.0%
10.0
%
20.0
%
30.0
%
40.0
%
50.0
%
60.0
%
70.0
%
80.0
%IC
T In
dust
ry/T
elec
oms
ICT
Indu
stry
Sof
twar
e an
d S
ervi
ces
ICT
Indu
stry
/Tel
ecom
s Fe
mal
e %
ICT
Indu
stry
Sof
twar
e an
d S
ervi
ces
Fem
ale
%
this
cha
rt, f
rom
the
sam
e so
urce
s, sh
ows
fem
ale
occu
patio
n m
ixes
with
in th
e iC
t se
ctor
s. H
igh
perc
enta
ge o
f wom
en in
iCt
sect
ors
wor
k in
sa
les,
grap
hic
desi
gn a
nd s
oftw
are
deve
lopm
ent o
ccup
atio
ns.

AustrAliAn iCt stAtistiCAl Compendium 2011
AustrAliAn Computer soCiety32
All I
ndus
trie
sIC
T Ind
ustr
y/Te
leco
ms a
nd IS
Ps
ICT I
ndus
try/
So
ftw
are &
Se
rvice
s
All I
ndus
trie
s Fe
mal
e %
ICT I
ndus
try/
Tele
com
s and
ISPs
Fe
mal
e %
ICT I
ndus
try/
So
ftw
are &
Se
rvice
s Fem
ale %
1351
ICT M
anag
ers
9,178
1,848
2,509
21.4%
27.3%
21.3%
2232
ICT T
raine
rs2,7
670
053
.6%–
–
2247
Man
agem
ent a
nd O
rgan
isatio
n Ana
lysts
18,69
60
879
39.8%
–46
.6%
2249
Oth
er In
form
ation
and O
rgan
isatio
n Pro
fessio
nals
10,07
70
055
.3%–
–
2252
ICT S
ales P
rofes
siona
ls4,6
291,7
211,0
8425
.4%46
.6%16
.0%
2324
Gra
phic
and W
eb D
esign
ers,
and I
llustr
ator
s28
,395
3,600
3,116
47.2%
56.3%
29.2%
2600
ICT P
rofes
siona
ls nf
d1,2
240
392
11.6%
–8.2
%
2610
Busin
ess a
nd Sy
stem
s Ana
lysts,
and P
rogr
amm
ers n
fd0
00
––
–
2611
ICT B
usine
ss an
d Sys
tem
s Ana
lysts
4,672
01,7
6021
.3%–
18.9%
2612
Mult
imed
ia Sp
ecial
ists a
nd W
eb D
evelo
pers
805
00
7.3%
–0.0
%
2613
Softw
are a
nd Ap
plica
tions
Prog
ram
mer
s11
,699
876
4,384
14.1%
27.9%
10.6%
2621
Dat
abas
e and
Syste
ms A
dmini
strat
ors,
and I
CT Se
curit
y Spe
cialis
ts8,6
210
1,940
25.4%
–23
.1%
2630
ICT N
etwo
rk an
d Sup
port
Prof
essio
nals
nfd
00
00.0
%–
–
2631
Com
pute
r Net
work
Prof
essio
nals
2,463
331
364
10.7%
13.3%
8.1%
2632
ICT S
uppo
rt an
d Tes
t Eng
ineer
s25
60
134
3.8%
–6.4
%
2633
Telec
omm
unica
tions
Engin
eerin
g Pro
fessio
nals
1,912
1,296
115
13.8%
15.2%
100.0
%
3124
Elec
tronic
Engin
eerin
g Dra
ftspe
rsons
and T
echn
ician
s82
00
2.5%
––
3130
ICT a
nd Te
lecom
mun
icatio
ns Te
chnic
ians n
fd0
00
––
–
3131
ICT S
uppo
rt Te
chnic
ians
10,87
885
12,9
7919
.8%26
.1%19
.1%
3132
Telec
omm
unica
tions
Tech
nical
Spec
ialist
s87
342
10
17.4%
13.1%
–
3420
Elec
tronic
s and
Telec
omm
unica
tions
Trad
es W
orke
rs nf
d0
00
––
–
3423
Elec
tronic
s Tra
des W
orke
rs1,7
370
427
4.9%
21.4%
3424
Telec
omm
unica
tions
Trad
es W
orke
rs1,7
761,7
760
7.1%
10.2%
–
6212
ICT S
ales A
ssista
nts
10,31
96,2
651,3
2845
.5%68
.1%51
.1%
Tota
l ICT
occu
patio
ns13
1,05
918
,985
21,4
1124
.1%
26.3
%16
.4%
Tota
l Em
ploy
ed in
all A
NZCO
code
s (no
t jus
t tho
se li
sted
abov
e)5,
152,
703
37,9
7042
,822
21.4
%17
.5%
25.2
%
18 Fe
b 20
11, A
BS la
bour
mar
ket S
urve
y, C
IIER
spec
ial e
xtra
ct
Fem
Ale
iCt
Wo
rKer
s By
oCC
upA
tio
n18

AustrAliAn iCt stAtistiCAl Compendium 2011
33AustrAliAn Computer soCiety
W
omen
in IC
T by
job
(AN
ZSC
O le
vel 4
) Feb
201
1So
urce
ABS
labo
ur m
arke
t spe
cial
ext
ract
CIIE
R F
eb 2
011
1351
ICT
Man
ager
s, 9
,178
2232
ICT
Trai
ners
, 2,7
67
2631
Com
pute
r Net
wor
k P
rofe
ssio
nals
, 2,4
63
2621
Dat
abas
e an
d S
yste
ms
Adm
inis
trato
rs, a
nd IC
T S
ecur
ity
Spe
cial
ists
, 8,6
21
2613
Sof
twar
e an
d A
pplic
atio
ns
Pro
gram
mer
s, 1
1,69
9
2612
Mul
timed
ia S
peci
alis
ts a
nd
Web
Dev
elop
ers,
805
2611
ICT
Bus
ines
s an
d S
yste
ms
Ana
lyst
s, 4
,672
2600
ICT
Pro
fess
iona
ls n
fd, 1
,224
2324
Gra
phic
and
Web
Des
igne
rs,
and
Illus
trato
rs, 2
8,39
5
2252
ICT
Sal
es P
rofe
ssio
nals
, 4,
629
2249
Oth
er In
form
atio
n an
d O
rgan
isat
ion
Pro
fess
iona
ls, 1
0,07
722
47 M
anag
emen
t and
O
rgan
isat
ion
Ana
lyst
s, 1
8,69
6
2632
ICT
Sup
port
and
Test
E
ngin
eers
, 256
2633
Tel
ecom
mun
icat
ions
E
ngin
eerin
g P
rofe
ssio
nals
, 1,9
12
3124
Ele
ctro
nic
Eng
inee
ring
Dra
ftspe
rson
s an
d Te
chni
cian
s, 8
2
3131
ICT
Sup
port
Tech
nici
ans,
10
,878
3132
Tel
ecom
mun
icat
ions
Te
chni
cal S
peci
alis
ts, 8
73
3423
Ele
ctro
nics
Tra
des
Wor
kers
, 1,
737
3424
Tel
ecom
mun
icat
ions
Tra
des
Wor
kers
, 1,7
76
6212
ICT
Sal
es A
ssis
tant
s, 1
0,31
9

AustrAliAn iCt stAtistiCAl Compendium 2011
AustrAliAn Computer soCiety34
Av
erag
e to
tal w
eekl
y w
ages
in IC
T re
late
d In
dust
ry s
ecto
rsSo
urce
AB
S 63
02.0
May
201
1
$1,5
37
$1,6
47
$1,1
24
$992
$0
$200
$400
$600
$800
$1,0
00
$1,2
00
$1,4
00
$1,6
00
$1,8
00 Aug-94 Feb-95 Aug-95 Feb-96 Aug-96 Feb-97 Aug-97 Feb-98 Aug-98 Feb-99 Aug-99 Feb-00 Aug-00 Feb-01 Aug-01 Feb-02 Aug-02 Feb-03 Aug-03 Feb-04 Aug-04 Feb-05 Aug-05 Feb-06 Aug-06 Feb-07 Aug-07 Feb-08 Aug-08 Feb-09 Aug-09 Feb-10 Aug-10 Feb-11
Mal
es; T
otal
ear
ning
s ;
Info
rmat
ion
Med
ia a
ndTe
leco
mm
unic
atio
ns ;
Mal
es; T
otal
ear
ning
s ;
Prof
essi
onal
, Sci
entif
ican
d Te
chni
cal S
ervi
ces
;Fe
mal
es; T
otal
ear
ning
s ;
Info
rmat
ion
Med
ia a
ndTe
leco
mm
unic
atio
ns ;
Fem
ales
; Tot
al e
arni
ngs
; Pr
ofes
sion
al, S
cien
tific
and
Tech
nica
l Ser
vice
s ;

AustrAliAn iCt stAtistiCAl Compendium 2011
35AustrAliAn Computer soCiety
19 E
xtra
ct fr
om A
BS la
bour
mar
ket s
tatis
tics F
eb 2
011.
Cod
es w
ith ze
ro d
ata
excl
uded
. Tot
als b
y St
ate
this
yea
r exc
lude
ele
ctro
nics
w
orke
rs a
nd g
raph
ic d
esig
n w
orke
rs o
utsi
de th
e m
ain
ICT
indu
stry
sect
ors a
nd m
ay th
eref
ore
be u
nder
stat
ed.
Whe
re W
e W
ork
iCt
empl
oym
ent
By s
tAte
19
ICT O
ccup
atio
ns by
ANZ
SCO
Code
NSW
VIC
QLD
SAW
ATA
SNT
ACT
1351
ICT M
anag
ers
17,04
213
,488
6,628
1,767
2,066
352
165
1,292
2232
ICT T
raine
rs2,2
191,6
4077
719
90
111
8912
8
2247
Man
agem
ent a
nd O
rgan
isatio
n Ana
lysts
18,21
113
,999
6,303
2,411
3,212
534
191
2,117
2249
Oth
er In
form
ation
and O
rgan
isatio
n Pro
fessio
nals
6,230
5,547
2,749
757
1,434
225
244
1,046
2252
ICT S
ales P
rofes
siona
ls7,8
707,3
511,8
8319
529
30
103
509
2324
Gra
phic
and W
eb D
esign
ers,
and I
llustr
ator
s6,7
586,4
671,8
5822
91,5
5412
872
0
2600
ICT P
rofes
siona
ls nf
d2,6
824,0
6068
878
823
212
084
1,908
2611
ICT B
usine
ss an
d Sys
tem
s Ana
lysts
8,502
8,144
1,613
375
2,285
110
7281
8
2612
Mult
imed
ia Sp
ecial
ists a
nd W
eb D
evelo
pers
6,150
2,514
1,240
404
553
128
112
0
2613
Softw
are a
nd Ap
plica
tions
Prog
ram
mer
s30
,582
27,06
48,2
744,3
196,1
8666
626
75,8
10
2621
Dat
abas
e and
Syste
ms A
dmini
strat
ors,
and I
CT Se
curit
y Spe
cialis
ts12
,568
7,850
5,876
2,151
2,730
997
243
1,581
2630
ICT N
etwo
rk an
d Sup
port
Prof
essio
nals
nfd
039
90
00
00
0
2631
Com
pute
r Net
work
Prof
essio
nals
5,555
8,034
3,359
842
2,709
452
373
1,686
2632
ICT S
uppo
rt an
d Tes
t Eng
ineer
s2,2
372,4
821,1
5218
70
124
7252
0
2633
Telec
omm
unica
tions
Engin
eerin
g Pro
fessio
nals
7,296
3,581
1,097
063
411
575
1,021
3124
Elec
tronic
Engin
eerin
g Dra
ftspe
rsons
and T
echn
ician
s0
036
60
00
00
3131
ICT S
uppo
rt Te
chnic
ians
19,54
713
,589
9,881
3,563
5,163
572
280
2,435
3132
Telec
omm
unica
tions
Tech
nical
Spec
ialist
s1,3
692,0
741,0
8017
60
115
7513
5
3423
Elec
tronic
s Tra
des W
orke
rs99
788
10
214
280
107
012
9
3424
Telec
omm
unica
tions
Trad
es W
orke
rs9,3
994,9
765,2
962,1
792,2
5646
830
817
0
6212
ICT S
ales A
ssista
nts
5,295
5,469
6,548
2,479
1,931
805
017
2
Tota
l wor
king i
n ICT
occu
patio
ns in
all in
dustr
ies17
0,509
139,6
0966
,668
23,23
533
,518
6,129
2,825
21,47
7
ICT oc
cupa
tion %
of to
tal S
tate
/Terri
tory
emplo
ymen
t4.7
1%4.8
4%2.9
0%2.8
5%2.7
7%2.5
9%2.3
0%10
.61%
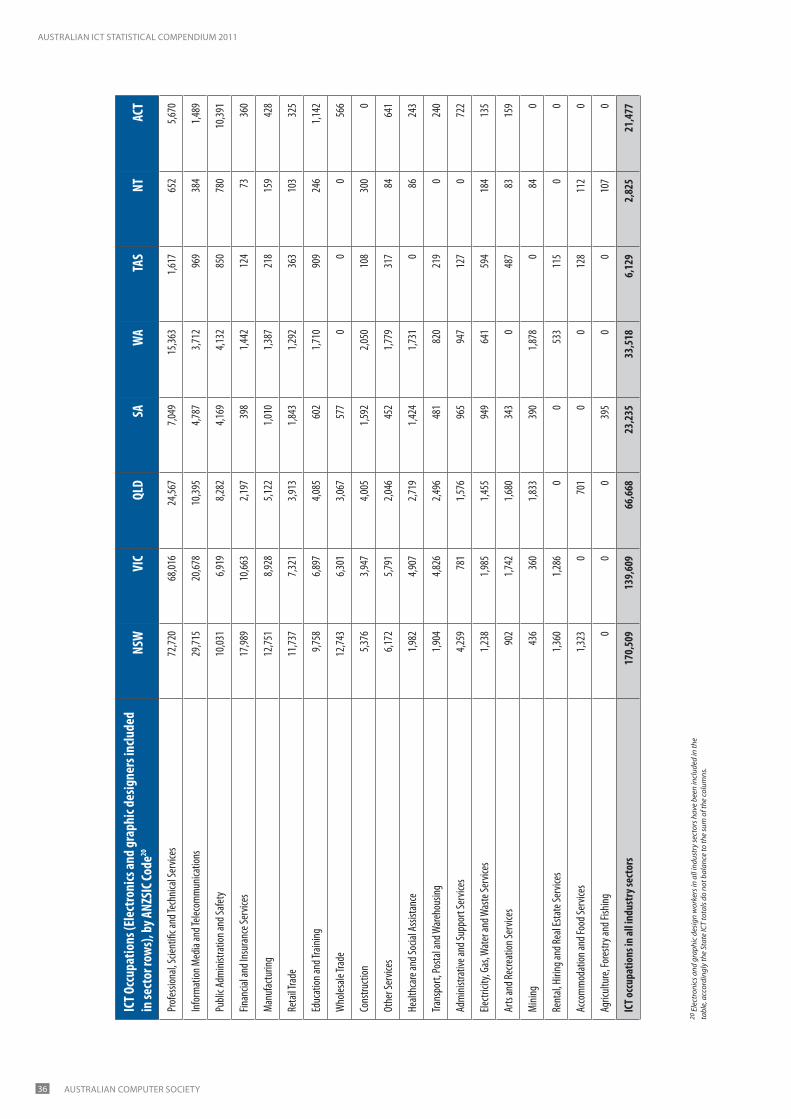
AustrAliAn iCt stAtistiCAl Compendium 2011
AustrAliAn Computer soCiety36
20 E
lect
roni
cs a
nd g
raph
ic d
esig
n w
orke
rs in
all
indu
stry
sect
ors h
ave
been
incl
uded
in th
e ta
ble,
acc
ordi
ngly
the
Stat
e IC
T to
tals
do
not b
alan
ce to
the
sum
of t
he co
lum
ns.
ICT O
ccup
atio
ns (E
lect
roni
cs an
d gr
aphi
c des
igne
rs in
clude
d in
sect
or ro
ws),
by A
NZSI
C Cod
e20NS
WVI
CQL
DSA
WA
TAS
NTAC
T
Prof
essio
nal, S
cient
ific a
nd Te
chnic
al Se
rvice
s72
,720
68,01
624
,567
7,049
15,36
31,6
1765
25,6
70
Info
rmat
ion M
edia
and T
eleco
mm
unica
tions
29
,715
20,67
810
,395
4,787
3,712
969
384
1,489
Publi
c Adm
inistr
ation
and S
afety
10
,031
6,919
8,282
4,169
4,132
850
780
10,39
1
Finan
cial a
nd In
sura
nce S
ervic
es
17,98
910
,663
2,197
398
1,442
124
7336
0
Man
ufac
turin
g 12
,751
8,928
5,122
1,010
1,387
218
159
428
Reta
il Tra
de
11,73
77,3
213,9
131,8
431,2
9236
310
332
5
Educ
ation
and T
raini
ng
9,758
6,897
4,085
602
1,710
909
246
1,142
Who
lesale
Trad
e 12
,743
6,301
3,067
577
00
056
6
Cons
tructi
on
5,376
3,947
4,005
1,592
2,050
108
300
0
Othe
r Ser
vices
6,1
725,7
912,0
4645
21,7
7931
784
641
Healt
hcar
e and
Socia
l Assi
stanc
e 1,9
824,9
072,7
191,4
241,7
310
8624
3
Trans
port,
Posta
l and
War
ehou
sing
1,904
4,826
2,496
481
820
219
024
0
Adm
inistr
ative
and S
uppo
rt Se
rvice
s 4,2
5978
11,5
7696
594
712
70
722
Electr
icity,
Gas
, Wat
er an
d Was
te Se
rvice
s 1,2
381,9
851,4
5594
964
159
418
413
5
Arts
and R
ecre
ation
Serv
ices
902
1,742
1,680
343
048
783
159
Mini
ng
436
360
1,833
390
1,878
084
0
Rent
al, H
iring
and R
eal E
state
Serv
ices
1,360
1,286
00
533
115
00
Acco
mm
odat
ion an
d Foo
d Ser
vices
1,3
230
701
00
128
112
0
Agric
ultur
e, Fo
restr
y and
Fish
ing
00
039
50
010
70
ICT o
ccup
atio
ns in
all i
ndus
try s
ecto
rs17
0,50
913
9,60
966
,668
23,2
3533
,518
6,12
92,
825
21,4
77

AustrAliAn iCt stAtistiCAl Compendium 2011
37AustrAliAn Computer soCiety
Au
stra
lian
ICT
Indu
stry
Em
ploy
men
t – M
odel
com
paris
ons
1996
-201
0
150,
000
170,
000
190,
000
210,
000
230,
000
250,
000
270,
000
290,
000
310,
000 Ju
n-96
Jun-
97Ju
n-98
Jun-
99Ju
n-00
Jun-
01Ju
n-02
Jun-
03Ju
n-04
Jun-
05Ju
n-06
Jun-
07Ju
n-08
Jun-
09Ju
n-10
Jun-
11
ABS
ICT
Indu
stry
Mod
el (A
BS 8
126.
0)
CIIE
R/W
hite
hors
e M
odel
ABs
last
mea
sure
d th
e iC
t in
dust
ry in
200
6-7
(812
6.0)
. the
cha
rt a
bove
mea
sure
s the
cor
rela
tion
betw
een
the
7 A
Bs a
nd 2
2 Ci
ier-
Whi
teho
rse
iCt
indu
stry
mod
els
sinc
e 19
96. e
ach
box
is a
sep
arat
e su
rvey
and
repo
rt.

AustrAliAn iCt stAtistiCAl Compendium 2011
AustrAliAn Computer soCiety38
21 C
IIER
Whi
teho
rse
Top
250
ICT
indu
stry
ana
lysi
s by
Stat
e an
d Te
rrito
ry D
ec 2
010,
by
ICT
indu
stry
gro
upin
g. N
on-IC
T oc
cupa
tions
in IC
T in
dust
ries a
re in
clud
ed in
thes
e to
tals.
ICT
Ind
ustr
y By
Sta
te21
Cons
ultin
g &
Soft
war
e Se
rvice
sM
anuf
actu
ring
Dist
ribut
ion
of H
ardw
are
and/
or So
ftw
are p
rodu
cts
Tele
com
mun
icatio
ns
Serv
ices
Tota
l
New
Sout
h Wale
s46
,545
2,892
35,30
229
,515
114,2
54
Victo
ria37
,420
1,803
24,46
223
,465
87,14
9
Quee
nslan
d18
,481
883
5,966
10,59
935
,930
Wes
tern
Austr
alia
10,07
731
43,4
687,7
6921
,627
Sout
h Aus
tralia
3,506
1,479
1,723
5,387
12,09
6
Austr
alian
Capit
al Te
rrito
ry6,9
6012
289
482
18,7
97
Tasm
ania
1,992
5627
01,3
763,6
93
North
ern T
errit
ory
182
9019
333
31,1
71
Tota
l12
5,16
37,
638
72,2
7879
,265
284,
716
% of
Tota
l43
.96%
2.68
%25
.39%
27.8
4%
iCt
indu
stry
in A
ustr
alia
em
ploy
men
t is d
omin
ated
by
soft
war
e an
d se
rvic
es. e
ach
stat
e an
d te
rrito
ry h
as a
diff
eren
t mix
of i
ndus
try
sect
ors,
with
nea
rly 4
9 pe
r cen
t of d
istr
ibut
ion
empl
oym
ent
in n
ew s
outh
Wal
es, c
ompa
red
to it
s ov
eral
l 40
per c
ent o
f tot
al iC
t in
dust
ry e
mpl
oym
ent,
but 3
0 pe
r cen
t of s
oftw
are
and
serv
ices
in V
icto
ria, a
nd s
oftw
are
and
serv
ices
com
pris
ing
79 p
er
cent
of t
he to
tal o
f Aus
tral
ian
Capi
tal t
errit
ory
iCt
indu
stry
em
ploy
men
t.
Fte
Wo
rKFo
rCe

AustrAliAn iCt stAtistiCAl Compendium 2011
39AustrAliAn Computer soCiety
IC
T In
dust
ry E
mpl
oym
ent b
y In
dust
ry s
ecto
r, D
ec 2
010
Tele
com
mun
icat
ions
Ser
vice
s28
%C
onsu
lting
and
Sof
twar
e Se
rvic
es44
%
Man
ufac
turin
g of
Har
dwar
e or
So
ftwar
e3%
Dis
tribu
tion
of H
ardw
are
and/
or
Softw
are
prod
ucts
25%

AustrAliAn iCt stAtistiCAl Compendium 2011
40 AustrAliAn Computer soCiety
Em
ploy
men
t Str
uctu
re o
f the
Aus
tral
ian
ICT
indu
stry
200
3-20
10
Man
ufac
turin
g of
Har
dwar
e or
S
oftw
are
Dis
tribu
tion
of H
ardw
are
and/
or
Sof
twar
e pr
oduc
ts
Tele
com
mun
icat
ions
Ser
vice
s
Con
sulti
ng a
nd S
oftw
are
Ser
vice
s
0
20,0
00
40,0
00
60,0
00
80,0
00
100,
000
120,
000
140,
000
160,
000 Ju
n- 03D
ec-
03Ju
n- 04D
ec-
04Ju
n- 05D
ec-
05Ju
n- 06D
ec-
06Ju
n- 07D
ec-
07Ju
n- 08D
ec-
08Ju
n- 09D
ec-
09Ju
n- 10D
ec-
10Ju
n- 11D
ec-
11Ju
n- 12D
ec-
12

AustrAliAn iCt stAtistiCAl Compendium 2011
41AustrAliAn Computer soCiety
Vo
latil
ity in
ICT
indu
stry
em
ploy
men
t by
Stat
e by
per
iod
-10,
000
-5,0
000
5,00
0
10,0
00
15,0
00
20,0
00
25,0
00
30,0
00
commen
cing %
Dec-03
Jun-04
Dec-04
Jun-05
Dec-05
Jun-06
Dec-06
Jun-07
Dec-07
Jul-0
8Ju
l-09
Dec-10
NS
WS
A
AC
TTA
S
VIC
NT
QLD
WA
empl
oym
ent v
olat
ility
has
dim
inis
hed
in re
cent
yea
rs.

AustrAliAn iCt stAtistiCAl Compendium 2011
42 AustrAliAn Computer soCiety
St
ate
Con
trib
utio
n to
Nat
iona
l IC
T In
dust
ry J
obs
grow
th J
ul 2
003-
Dec
201
0
SA, 6
00, 1
%
Oth
er, 1
,587
, 3%
VIC
, 20,
942,
33%
TAS,
735
, 1.1
7%
NT,
125
, 0.2
0%
ACT,
727
, 1.1
6%
NSW
, 21,
159,
35%
QLD
, 11,
575,
18%
WA,
6,8
61, 1
1%
NSW
SA
ACT
TAS
VIC
NT
QLD
WA

AustrAliAn iCt stAtistiCAl Compendium 2011
43AustrAliAn Computer soCiety
IC
T In
dust
ry E
mpl
oym
ent P
erce
ntag
e by
Sta
te D
ec 2
010
TAS
1.3% NT
0.4%
VIC
30.6
%
NSW
40.1
%
QLD
12.6
%
SA 4.2%
WA
7.6%
ACT
3.1%
VIC
NSW
QLD
ACT
SA WA
TAS
NT
stat
e an
d te
rrito
ry i
Ct
indu
stry
em
ploy
men
t al
so g
row
s at
diff
eren
t ra
tes.
sinc
e 20
03, V
icto
ria,
Que
ensl
and
and
Wes
tern
Aus
tral
ia h
ave
cont
ribut
ed jo
bs g
row
th h
ighe
r tha
n th
eir s
tate
per
cent
age
of to
tal i
Ct
indu
stry
em
ploy
men
t, ta
sman
ia a
nd th
e n
orth
ern
terr
itory
hav
e ke
pt
pace
, whi
le n
ew s
outh
Wal
es, s
outh
Aus
tral
ia a
nd th
e Au
stra
lian
Capi
tal t
errit
ory
have
gro
wn
mor
e sl
owly
.

AustrAliAn iCt stAtistiCAl Compendium 2011
44 AustrAliAn Computer soCiety
22 C
IIER
Whi
teho
rse
Top
250
ICT
Indu
stry
Sur
vey
and
Mod
el D
ecem
ber 2
010
Com
pute
r Ser
vice
sM
anuf
actu
ring
Who
lesa
le Tr
ade
Tele
com
mun
icatio
nsTo
tal
New
Sout
h Wale
s$7
.31$1
.02$8
.51$1
5.84
$32.6
8
Victo
ria$5
.87$0
.63$5
.90$1
2.60
$25.0
0
Quee
nslan
d$2
.90$0
.31$1
.44$5
.69$1
0.34
Wes
tern
Austr
alia
$1.58
$0.11
$0.84
$4.17
$6.70
Sout
h Aus
tralia
$0.55
$0.52
$0.42
$2.89
$4.38
Rest
of Au
strali
a$1
.49$0
.09$0
.33$1
.36$3
.27
Tota
l$1
9.70
$2.6
9$1
7.42
$42.
55$8
2.36
Dec-0
3De
c-04
Dec-0
5De
c-06
Dec-0
7De
c-08
Dec-0
9De
c-10
Com
pute
r Ser
vices
$11,8
86$1
2,483
$13,6
35$1
4,989
$17,8
61$1
7,519
$18,4
99$1
9,703
Man
ufac
turin
g$2
,718
$2,61
6$2
,160
$2,59
0$2
,687
$2,70
0$2
,693
$2,68
7
Who
lesale
Trad
e$1
2,377
$12,5
05$1
8,262
$18,7
66$1
5,803
$17,0
88$1
7,251
$17,4
24
Telec
omm
unica
tions
$38,4
59$4
0,062
$40,9
52$4
2,432
$42,4
32$4
7,293
$43,0
81$4
2,549
$65,
439
$67,
665
$75,
008
$78,
777
$78,
782
$84,
600
$81,
524
$82,
362
Busin
ess M
onito
r Int
erna
tiona
l
IT m
arke
t (ex
clude
s Tele
com
mun
icatio
ns)
2010
$US1
8.7 bi
llion
2014
$US2
2.7 bi
llion
Oth
er R
even
ue E
stim
ates
iCt
indu
stry
rev
enue
gre
w m
argi
nally
sin
ce d
ec 2
009,
aft
er a
dro
p fr
om
dec
embe
r 200
8. C
ompu
ter s
ervi
ces
reve
nue
lead
s th
e re
cove
ry.
ICT
Ind
ustr
y R
even
ue e
stim
ates
$A
Bill
ion22
ICT
Rev
enue
tre
nd, $
A M
illio
n

AustrAliAn iCt stAtistiCAl Compendium 2011
45AustrAliAn Computer soCiety
Con
sulti
ng a
nd S
oftw
are
Serv
ices
24% Man
ufac
turin
g of
Har
dwar
e or
So
ftwar
e3%
Dis
tribu
tion
of H
ardw
are
and/
or
Softw
are
Pro
duct
s21
%
Tele
com
mun
icat
ions
Ser
vice
s52
%
ICT
Indu
stry
Rev
enue
by
Indu
stry
sec
tor,
Dec
201
0
tele
com
mun
icat
ions
com
pani
es c
ontin
ue, h
owev
er, t
o ga
in th
e m
ajor
ity o
f iC
t in
dust
ry re
venu
e.
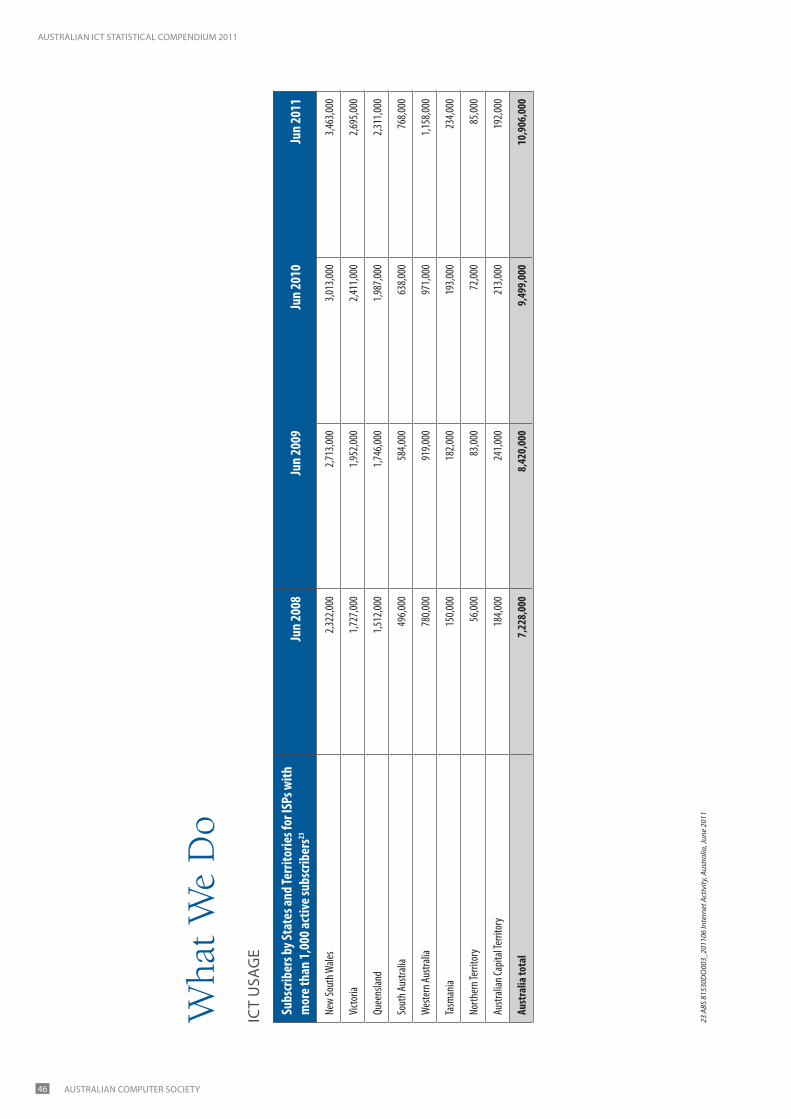
AustrAliAn iCt stAtistiCAl Compendium 2011
46 AustrAliAn Computer soCiety
Wha
t W
e D
oiC
t u
sAG
e
Subs
crib
ers b
y Sta
tes a
nd Te
rrito
ries f
or IS
Ps w
ith
mor
e tha
n 1,
000 a
ctive
subs
crib
ers23
Jun
2008
Jun
2009
Jun
2010
Jun
2011
New
Sout
h Wale
s2,3
22,00
02,7
13,00
03,0
13,00
03,4
63,00
0
Victo
ria1,7
27,00
01,9
52,00
02,4
11,00
02,6
95,00
0
Quee
nslan
d1,5
12,00
01,7
46,00
01,9
87,00
02,3
11,00
0
Sout
h Aus
tralia
496,0
0058
4,000
638,0
0076
8,000
Wes
tern
Austr
alia
780,0
0091
9,000
971,0
001,1
58,00
0
Tasm
ania
150,0
0018
2,000
193,0
0023
4,000
North
ern T
errit
ory
56,00
083
,000
72,00
085
,000
Austr
alian
Capit
al Te
rrito
ry18
4,000
241,0
0021
3,000
192,0
00
Aust
ralia
tota
l7,
228,
000
8,42
0,00
09,
499,
000
10,9
06,0
00
23 A
BS 8
1530
DO
003_
2011
06 In
tern
et A
ctiv
ity, A
ustr
alia
, Jun
e 20
11

AustrAliAn iCt stAtistiCAl Compendium 2011
47AustrAliAn Computer soCiety
In
tern
et s
ubsc
riber
s by
Sta
te a
nd T
errit
ory
(ISPs
with
mor
e th
an 1
,000
sub
scrib
ers)
0
2,00
0,00
0
4,00
0,00
0
6,00
0,00
0
8,00
0,00
0
10,0
00,0
00
12,0
00,0
00
Jun
2008
Jun
2009
Jun
2010
Jun
2011
Aust
ralia
n C
apita
l Ter
ritor
yN
orth
ern
Terr
itory
Tasm
ania
Wes
tern
Aus
tralia
Sout
h Au
stra
liaQ
ueen
slan
dVi
ctor
iaN
ew S
outh
Wal
es
tele
com
mun
icat
ions
com
pani
es c
ontin
ue, h
owev
er, t
o ga
in th
e m
ajor
ity o
f iC
t in
dust
ry re
venu
e.

AustrAliAn iCt stAtistiCAl Compendium 2011
48 AustrAliAn Computer soCiety
24 A
BS 8
1460
DO
002_
2008
09 H
ouse
hold
Use
of I
nfor
mat
ion
Tech
nolo
gy, A
ustr
alia
, 200
8-09
( no
late
r dat
a av
aila
ble)
Empl
oyed
per
sons
aged
15 an
d ov
er, L
abou
r Fo
rce C
hara
cter
istics
, by l
ocat
ion
of In
tern
et
Acce
ss –
2008
-0924
Tota
l em
ploy
ed
pers
ons
Hom
eW
ork
Any l
ocat
ion
Indu
stry
‘000
‘000
%‘0
00%
‘000
%
11 Fi
nanc
ial an
d Ins
uran
ce Se
rvice
s41
537
490
332
8040
698
10 In
form
ation
Med
ia an
d Tele
com
mun
icatio
ns23
120
790
180
7822
296
12 Re
ntal,
Hiri
ng an
d Rea
l Esta
te Se
rvice
s21
617
179
160
7420
796
13 Pr
ofes
siona
l, Scie
ntifi
c and
Tech
nical
Serv
ices
822
728
8967
081
792
96
16 Ed
ucat
ion an
d Tra
ining
898
784
8766
474
851
95
04 El
ectri
city,
Gas, W
ater
and W
aste
Serv
ices
143
123
8795
6613
192
15 Pu
blic A
dmini
strat
ion an
d Safe
ty70
159
385
486
6964
091
02 M
ining
125
105
8462
5010
987
18 Ar
ts an
d Rec
reat
ion Se
rvice
s19
715
880
112
5717
387
07 Re
tail T
rade
1,269
1,009
8040
232
1,090
86
17 H
ealth
care
and S
ocial
Assi
stanc
e1,1
4090
479
598
5298
686
08 Ac
com
mod
ation
and F
ood S
ervic
es64
750
778
138
2155
085
06 W
holes
ale Tr
ade
426
322
7624
357
357
84
09 Tr
ansp
ort,
Posta
l and
War
ehou
sing
600
443
7418
330
475
79
03 M
anuf
actu
ring
1,063
747
7041
939
825
78
05 Co
nstru
ction
1,031
759
7434
133
803
78
19 O
ther
Serv
ices
447
315
7017
940
345
77
14 Ad
mini
strat
ive an
d Sup
port
Serv
ices
322
226
7013
442
246
76
01 Ag
ricult
ure,
Fore
stry a
nd Fi
shing
302
163
5476
2517
357
Tota
l Em
ploy
ed Pe
rson
s11
,008
8,64
779
5,48
250
9,38
985

AustrAliAn iCt stAtistiCAl Compendium 2011
49AustrAliAn Computer soCiety
U
se o
f Int
erne
t in
the
wor
kpla
ce, b
y In
dust
ry (A
NZS
IC c
lass
ifica
tion)
010
2030
4050
6070
8090
Prof
essi
onal
, sci
entif
ic a
nd te
chni
cal s
ervi
ces
Fina
ncia
l and
insu
ranc
e se
rvic
es
Info
rmat
ion
med
ia a
nd te
leco
mm
unic
atio
ns
Ren
tal,
hirin
g an
d re
al e
stat
e se
rvic
es
Educ
atio
n an
d tra
inin
g
Publ
ic a
dmin
istra
tion
and
safe
ty
Elec
trici
ty, g
as, w
ater
and
was
te s
ervi
ces
Arts
and
recr
eatio
n se
rvic
es
Who
lesa
le tr
ade
Hea
lthca
re a
nd s
ocia
l ass
ista
nce
Min
ing
All I
ndus
tries
Adm
inis
trativ
e an
d su
ppor
t ser
vice
s
Oth
er s
ervi
ces
Man
ufac
turin
g
Con
stru
ctio
n
Ret
ail t
rade
Tran
spor
t, po
stal
and
war
ehou
sing
Agric
ultu
re, f
ores
try a
nd fi
shin
g
Acco
mm
odat
ion
and
food
ser
vice
s
% B
usin
ess
use
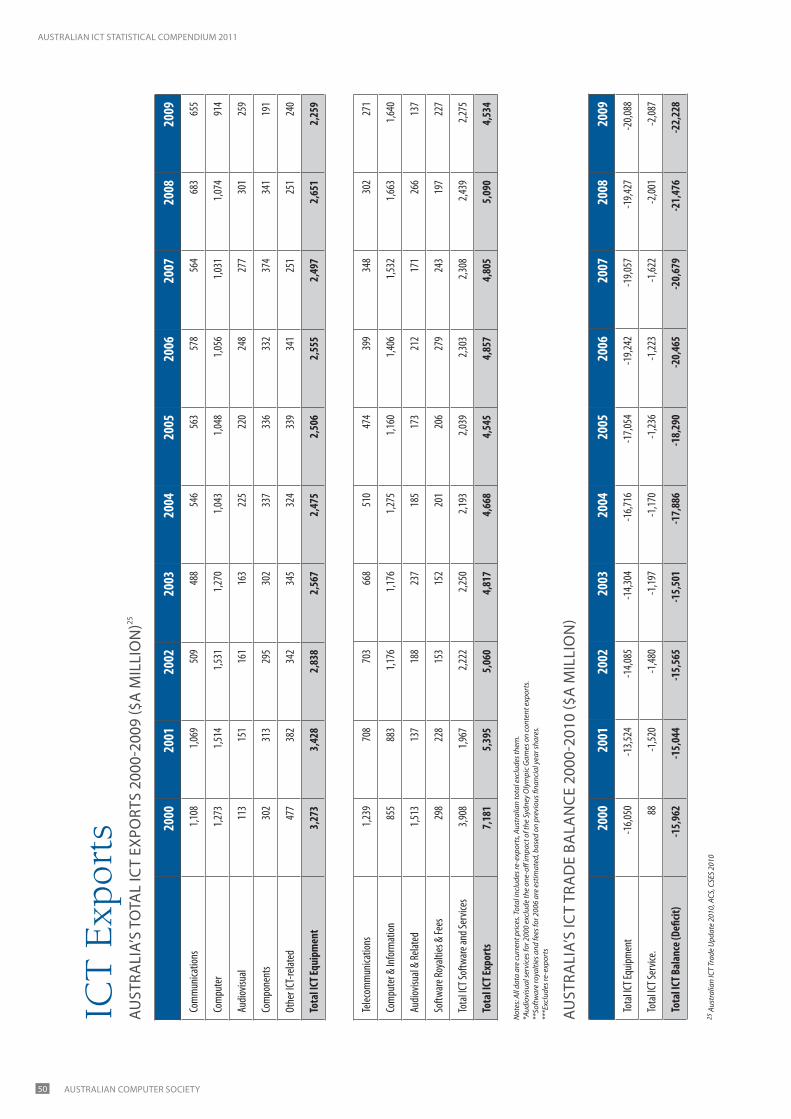
AustrAliAn iCt stAtistiCAl Compendium 2011
50 AustrAliAn Computer soCiety
ICT
Exp
orts 20
0020
0120
0220
0320
0420
0520
0620
0720
0820
09
Com
mun
icatio
ns1,1
081,0
6950
948
854
656
357
856
468
365
5
Com
pute
r1,2
731,5
141,5
311,2
701,0
431,0
481,0
561,0
311,0
7491
4
Audio
visua
l11
315
116
116
322
522
024
827
730
125
9
Com
pone
nts
302
313
295
302
337
336
332
374
341
191
Othe
r ICT
-relat
ed47
738
234
234
532
433
934
125
125
124
0
Tota
l ICT
Equi
pmen
t3,
273
3,42
82,
838
2,56
72,
475
2,50
62,
555
2,49
72,
651
2,25
9
2000
2001
2002
2003
2004
2005
2006
2007
2008
2009
Tota
l ICT E
quipm
ent
-16,0
50-1
3,524
-14,0
85-1
4,304
-16,7
16-1
7,054
-19,2
42-1
9,057
-19,4
27-2
0,088
Tota
l ICT S
ervic
e.88
-1,52
0-1
,480
-1,19
7-1
,170
-1,23
6-1
,223
-1,62
2-2
,001
-2,08
7
Tota
l ICT
Bal
ance
(Defi
cit)
-15,
962
-15,
044
-15,
565
-15,
501
-17,
886
-18,
290
-20,
465
-20,
679
-21,
476
-22,
228
25 A
ustr
alia
n IC
T Tr
ade
Upd
ate
2010
, ACS
, CSE
S 20
10
Not
es: A
ll da
ta a
re c
urre
nt p
rices
. Tot
al in
clud
es re
-exp
orts
, Aus
tral
ian
tota
l exc
lude
s the
m.
*Aud
iovi
sual
serv
ices
for 2
000
excl
ude
the
one-
off im
pact
of t
he S
ydne
y O
lym
pic
Gam
es o
n co
nten
t exp
orts
. **
Soft
war
e ro
yalti
es a
nd fe
es fo
r 200
6 ar
e es
timat
ed, b
ased
on
prev
ious
fina
ncia
l yea
r sha
res.
***E
xclu
des r
e-ex
port
s
Au
strA
liA’
s to
tAl
iCt
expo
rts
2000
-200
9 ($
A m
illi
on
)25
Telec
omm
unica
tions
1,239
708
703
668
510
474
399
348
302
271
Com
pute
r & In
form
ation
855
883
1,176
1,176
1,275
1,160
1,406
1,532
1,663
1,640
Audio
visua
l & Re
lated
1,513
137
188
237
185
173
212
171
266
137
Softw
are R
oyalt
ies &
Fees
298
228
153
152
201
206
279
243
197
227
Tota
l ICT S
oftw
are a
nd Se
rvice
s3,9
081,9
672,2
222,2
502,1
932,0
392,3
032,3
082,4
392,2
75
Tota
l ICT
Expo
rts
7,18
15,
395
5,06
04,
817
4,66
84,
545
4,85
74,
805
5,09
04,
534
Au
strA
liA’
s iC
t tr
Ad
e BA
lAn
Ce 2
000-
2010
($A
mil
lio
n)
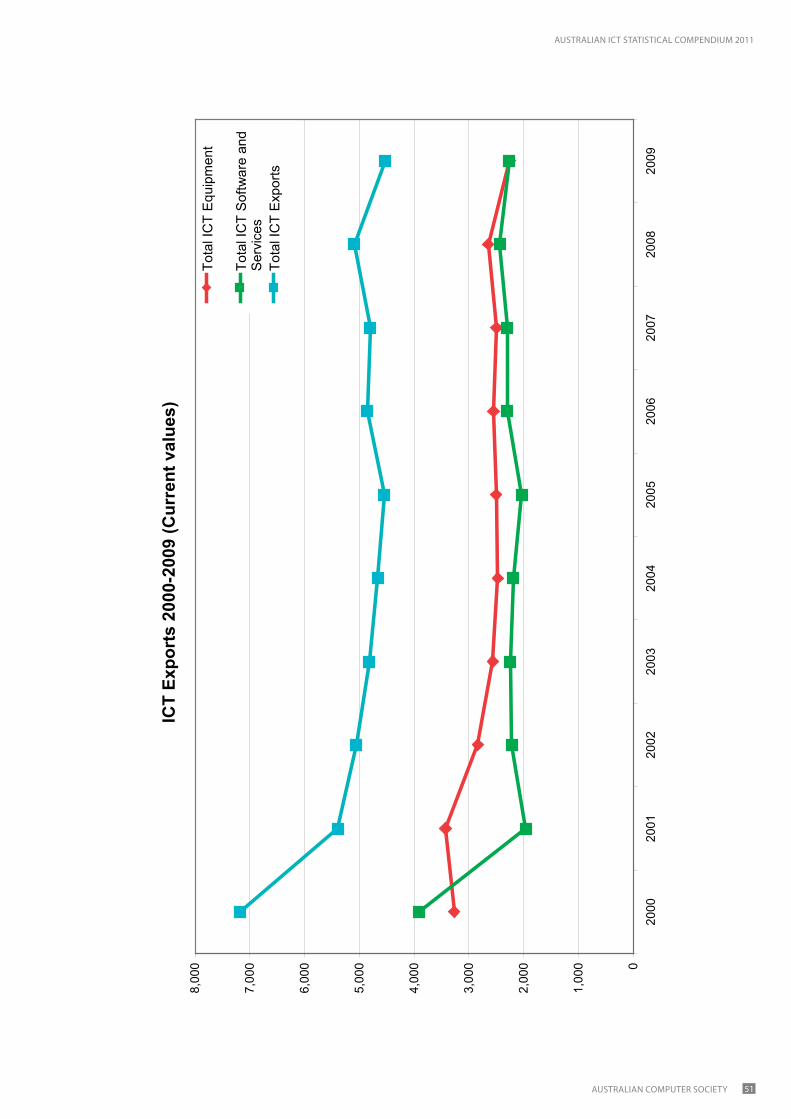
AustrAliAn iCt stAtistiCAl Compendium 2011
51AustrAliAn Computer soCiety
ICT
Expo
rts
2000
-200
9 (C
urre
nt v
alue
s)
0
1,00
0
2,00
0
3,00
0
4,00
0
5,00
0
6,00
0
7,00
0
8,00
0
2000
2001
2002
2003
2004
2005
2006
2007
2008
2009
Tota
l IC
T Eq
uipm
ent
Tota
l IC
T So
ftwar
e an
dSe
rvic
esTo
tal I
CT
Expo
rts

AustrAliAn iCt stAtistiCAl Compendium 2011
52 AustrAliAn Computer soCiety
26 8
104.
0DO
007_
2008
09 R
esea
rch
and
Expe
rimen
tal D
evel
opm
ent,
Busi
ness
es, A
ustr
alia
, 200
8-09
, 811
1.0D
O00
5_20
09 R
esea
rch
and
Expe
rimen
tal D
evel
opm
ent,
Hig
her E
duca
tion
Org
anis
atio
ns, A
ustr
alia
, 200
827
811
.10D
O00
5_20
08 R
esea
rch
and
Expe
rimen
tal D
evel
opm
ent,
Hig
her E
duca
tion
Org
anis
atio
ns, A
ustr
alia
, 200
8
ICT
Res
earc
h
Busin
ess
High
er Ed
ucat
ion
Aust
ralia
n Go
vern
men
tAl
l Sta
te/T
errit
ory G
over
nmen
ts
Artifi
cial In
tellig
ence
and I
mag
e Pro
cessi
ng$5
0.31
Com
puta
tion T
heor
y and
Mat
hem
atics
$98.9
6
Com
pute
r Sof
twar
e$1
,994.9
8
Data
form
at$1
89.38
Distr
ibute
d Com
putin
g$1
9.89
Info
rmat
ion Sy
stem
s$1
,852.9
9
Libra
ry an
d Inf
orm
ation
Stud
ies$9
.55
Othe
r Inf
orm
ation
& Co
mpu
ting S
cienc
es$1
91.43
Tota
l Inf
orm
atio
n &
Com
putin
g Sc
ienc
es$4
,407
.49
$218
.21
$260
.95
$29.
57
ICT %
of al
l R&D
Und
erta
ken
26.1
4%3.
25%
11.5
9%2.
53%
NSW
VIC
QLD
SAW
ATA
SNT
ACT
Aust
.
Info
rmat
ion &
Com
putin
g Scie
nces
$62.2
2$6
0.55
$34.3
5$1
5.00
$28.7
1$1
.18$0
.11$1
6.09
$218
.21
Tota
l$2
,015.4
3$1
,774.9
1$1
,061.4
7$5
05.08
$662
.12$1
28.65
$46.0
7$5
23.37
$6,71
7.11
ICT a
s % of
Tota
l3.
09%
3.41
%3.
24%
2.97
%4.
34%
0.92
%0.
23%
3.07
%3.
25%
By r
eseA
rCH
Fie
ld –
inFo
rmAt
ion
& C
om
puti
nG
sCi
enCe
s 20
08-9
26 ($
A m
illi
on
)
HiG
Her
ed
uC
Atio
n e
xpen
dit
ure
on
r&
d, B
y lo
CAt
ion
–By
iCt
Fiel
d o
F re
seA
rCH
, 200
827 ($
A m
illi
on
)

AustrAliAn iCt stAtistiCAl Compendium 2011
53AustrAliAn Computer soCiety
B
usin
ess
Expe
nditu
re o
n R
&D
200
8-9
Oth
er7%
Tota
l che
mic
al s
cien
ces
2%
Tota
l bui
lt en
viro
nmen
t and
de
sign
2%
Tota
l ear
th s
cien
ces
1%
Tota
l eco
nom
ics
0.1%
Tota
l phy
sica
l sci
ence
s0.
1%
Tota
l com
mer
ce, m
anag
emen
t, to
uris
m a
nd s
ervi
ces
1%
Tota
l env
ironm
enta
l sci
ence
s1%
Tota
l agr
icul
tura
l and
vet
erin
ary
scie
nces
2%
Tota
l tec
hnol
ogy
5%To
tal m
edic
al a
nd h
ealth
sc
ienc
es6%
Tota
l inf
orm
atio
n an
d co
mpu
ting
scie
nces
26%
Tota
l eng
inee
ring
54%
Tota
l bio
logi
cal s
cien
ces
0.4%

AustrAliAn iCt stAtistiCAl Compendium 2011
54 AustrAliAn Computer soCiety
IC
T R
&D
by
field
of r
esea
rch
$-
$1,0
00
$2,0
00
$3,0
00
$4,0
00
$5,0
00
$6,0
00
1996
-719
98-9
2000
-120
02-3
2004
-520
06-7
2007
-820
08-9
Year
$Amillion
Priv
ate
non-
prof
it
Hig
her E
duca
tion
Stat
e/Te
rrito
ry
Com
mon
wea
lth
Busi
ness
Res
earc
h es
timat
ed a
s eq
ual t
o la
test
dat
a av
aila
ble
for p
rior y
ear
iCt
rese
arch
in A
ustr
alia
con
tinue
s to
be
unde
rtak
en p
redo
min
atel
y by
bus
ines
s, ra
ther
than
by
gove
rnm
ent o
r hig
her e
duca
tion.
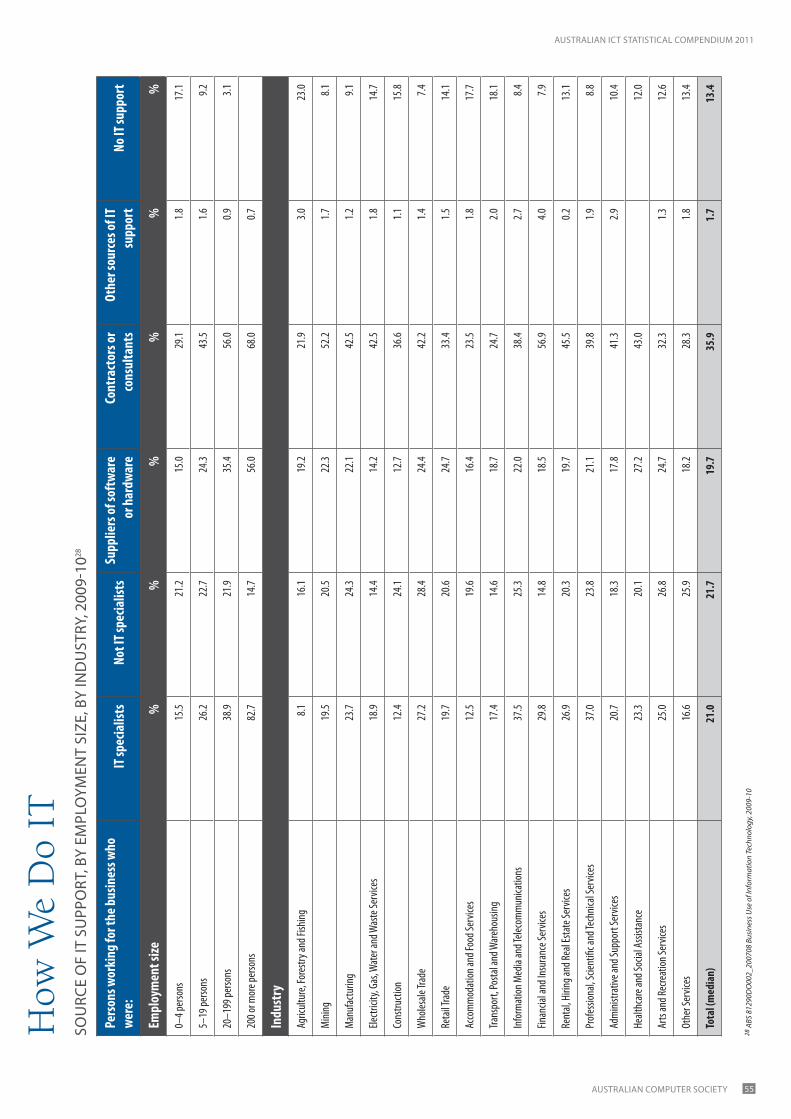
AustrAliAn iCt stAtistiCAl Compendium 2011
55AustrAliAn Computer soCiety
28 A
BS 8
1290
DO
002_
2007
08 B
usin
ess U
se o
f Inf
orm
atio
n Te
chno
logy
, 200
9-10
How
We
Do
IT
Pers
ons w
orki
ng fo
r the
bus
ines
s who
we
re:
IT sp
ecia
lists
Not I
T spe
cialis
tsSu
pplie
rs of
soft
war
e or
har
dwar
eCo
ntra
ctor
s or
cons
ulta
nts
Othe
r sou
rces
of IT
su
ppor
tNo
IT su
ppor
t
Empl
oym
ent s
ize%
%%
%%
%
0–4 p
erso
ns15
.521
.215
.029
.11.8
17.1
5–19
perso
ns26
.222
.724
.343
.51.6
9.2
20–1
99 pe
rsons
38.9
21.9
35.4
56.0
0.93.1
200 o
r mor
e per
sons
82.7
14.7
56.0
68.0
0.7
Indu
stry
Agric
ultur
e, Fo
restr
y and
Fish
ing8.1
16.1
19.2
21.9
3.023
.0
Mini
ng19
.520
.522
.352
.21.7
8.1
Man
ufac
turin
g23
.724
.322
.142
.51.2
9.1
Electr
icity,
Gas
, Wat
er an
d Was
te Se
rvice
s18
.914
.414
.242
.51.8
14.7
Cons
tructi
on12
.424
.112
.736
.61.1
15.8
Who
lesale
Trad
e27
.228
.424
.442
.21.4
7.4
Reta
il Tra
de19
.720
.624
.733
.41.5
14.1
Acco
mm
odat
ion an
d Foo
d Ser
vices
12.5
19.6
16.4
23.5
1.817
.7
Trans
port,
Posta
l and
War
ehou
sing
17.4
14.6
18.7
24.7
2.018
.1
Info
rmat
ion M
edia
and T
eleco
mm
unica
tions
37.5
25.3
22.0
38.4
2.78.4
Finan
cial a
nd In
sura
nce S
ervic
es29
.814
.818
.556
.94.0
7.9
Rent
al, H
iring
and R
eal E
state
Serv
ices
26.9
20.3
19.7
45.5
0.213
.1
Prof
essio
nal, S
cient
ific a
nd Te
chnic
al Se
rvice
s37
.023
.821
.139
.81.9
8.8
Adm
inistr
ative
and S
uppo
rt Se
rvice
s20
.718
.317
.841
.32.9
10.4
Healt
hcar
e and
Socia
l Assi
stanc
e23
.320
.127
.243
.012
.0
Arts
and R
ecre
ation
Serv
ices
25.0
26.8
24.7
32.3
1.312
.6
Othe
r Ser
vices
16.6
25.9
18.2
28.3
1.813
.4
Tota
l (m
edia
n)21
.021
.719
.735
.91.
713
.4
sou
rCe
oF
it s
upp
ort
, By
empl
oym
ent
siZe
, By
ind
ust
ry, 2
009-
1028

AustrAliAn iCt stAtistiCAl Compendium 2011
56 AustrAliAn Computer soCiety
29 O
ECD
IT O
utlo
ok 2
008,
Apr
il 20
08.
How
Do
We
Com
pare
?
Shar
e of I
CT va
lue a
dded
in th
e bus
ines
s sec
tor v
alue
adde
d19
9520
06
Finlan
d8.1
314
.78
Kore
a (5)
10.70
13.69
Irelan
d11
.1212
.14
Hung
ary
6.41
10.95
Swed
en (1
)8.3
110
.78
Unite
d King
dom
(1)
9.27
10.67
Neth
erlan
ds7.1
49.2
0
Unite
d Sta
tes
9.08
8.70
Norw
ay6.2
98.3
4
Denm
ark
6.57
7.93
Franc
e7.7
37.9
2
Japa
n (3)
7.27
7.90
Belgi
um (5
)5.9
67.6
5
Cana
da7.0
47.6
2
Czec
h Rep
ublic
(3,5)
4.77
7.54
Italy
5.77
7.48
Aust
ralia
7.62
7.08
Portu
gal (
1,5)
6.58
7.07
Germ
any (
5)7.0
06.9
2
Austr
ia7.0
66.8
1
Spain
6.18
6.75
1. 20
05 in
stead
of 20
06. 2
. 200
4 ins
tead
of 20
06. 3
. ICT w
holes
ale (5
150)
is no
t ava
ilable
. 4. T
eleco
mm
unica
tion s
ervic
es (6
42) i
nclud
ed Po
stal s
ervic
es. 5
. Ren
tal o
f ICT g
oods
(712
3) is
not a
vaila
ble.
oeC
d K
ey iC
t in
diC
Ato
rs29

AustrAliAn iCt stAtistiCAl Compendium 2011
57AustrAliAn Computer soCiety
Shar
e of I
CT-re
late
d oc
cupa
tions
(nar
row
defi
nitio
n) in
the t
otal
econ
omy
Rank
ing
2007
Switz
erlan
d1
5.21
Swed
en2
4.94
Norw
ay3
4.76
Czec
h Rep
.4
4.49
Finlan
d5
4.40
Cana
da6
4.24
Denm
ark
74.0
1
Neth
erlan
ds8
3.90
Unite
d Sta
tes
93.7
4
Aust
ralia
103.
62
Slova
k Rep
.11
3.53
Luxe
mbo
urg
123.1
9
Unite
d King
dom
133.1
7
Germ
any
143.1
4
30 O
ECD
(200
8), I
nfor
mat
ion
Tech
nolo
gy O
utlo
ok 2
008,
OEC
D, P
aris,
van
Wel
sum
, D. a
nd G
. Vic
kery
(200
5), “
New
Per
spec
tives
on
ICT
Skill
s and
Em
ploy
men
t”, D
STI I
nfor
mat
ion
Econ
omy
Wor
king
Pap
er, D
STI/I
CCP/
IE(2
004)
10/F
INAL
, OEC
D, P
aris
oeC
d K
ey iC
t in
diC
Ato
rs30

AustrAliAn iCt stAtistiCAl Compendium 2011
58 AustrAliAn Computer soCiety
E-re
adin
ess R
anki
ng
(out
of 70
coun
trie
s)31Ov
eral
l sco
reCo
nnec
tivity
Busin
ess
Envi
ronm
ent
Socia
l and
Cu
ltura
l En
viro
nmen
t
Lega
l En
viro
nmen
tGo
vern
men
t Po
licy a
nd Vi
sion
Cons
umer
an
d Bu
sines
s Ad
optio
n
Rank
ing
Cate
gory
we
ight
ing
20%
15%
15%
10%
15%
25%
1De
nmar
k8.8
79.5
08.0
38.5
38.1
09.6
58.9
0
2Sw
eden
8.67
9.10
7.85
8.63
8.50
9.15
8.63
3Ne
ther
lands
8.64
9.50
7.80
8.23
8.70
8.50
8.75
4No
rway
8.62
9.10
7.83
8.13
8.05
8.75
9.15
5US
A8.6
08.2
57.6
59.0
38.7
09.5
58.6
0
6Au
stra
lia8.
458.
607.
968.
678.
508.
708.
33
7Sin
gapo
re8.3
58.1
58.1
57.5
78.7
09.1
88.4
8
8Ho
ng Ko
ng8.3
38.2
08.2
07.4
79.0
09.1
88.2
8
9Ca
nada
8.33
8.45
8.16
8.03
8.25
8.65
8.35
10Fin
land
8.30
9.10
8.17
8.40
8.25
7.45
8.23
31 E
cono
mis
t Int
ellig
ence
Uni
t (EI
U) E
-Rea
dine
ss R
anki
ngs 2
009,
The
Usa
ge Im
pera
tive,
App
endi
x 2;
Aus
trad
e

AustrAliAn iCt stAtistiCAl Compendium 2011
59AustrAliAn Computer soCiety
Ra
nkin
gHo
useh
olds
with
Co
mpu
ter A
cces
sHo
useh
olds
with
In
tern
et A
cces
sHo
useh
olds
with
Br
oadb
and
Inte
rnet
Acc
ess
Rank
ing
(calcu
late
d by
CI
IER)
Aver
age %
(Cal
cula
ted
by CI
IER)
%%
%
Kore
a1
80.9
94.3
94.3
189
.8
Icelan
d2
91.9
87.7
83.2
287
.6
Neth
erlan
ds3
87.7
86.1
74.0
382
.6
Norw
ay4
85.8
84.0
73.0
480
.9
Swed
en5
87.1
84.4
70.7
580
.7
Denm
ark
685
.581
.974
.16
80.5
Switz
erlan
d7
77.4
73.9
na7
75.7
Luxe
mbo
urg
882
.880
.161
.08
74.6
Cana
da9
78.4
72.7
64.2
971
.8
Finlan
d10
75.8
72.4
66.1
1071
.4
Aust
ralia
1178
.072
.062
.011
70.7
Germ
any
1281
.874
.954
.912
70.5
Unite
d King
dom
1378
.071
.161
.513
70.2
Japa
n14
85.9
63.9
58.5
1469
.4
Austr
ia15
75.9
68.9
54.5
1566
.4
Belgi
um16
70.0
63.6
60.3
1664
.6
Franc
e17
68.4
62.3
57.1
1762
.6
EU27
1867
.960
.448
.618
59.0
Irelan
d19
70.3
63.0
42.9
1958
.7
Unite
d Sta
tes
2061
.861
.750
.820
58.1
New
Zeala
nd21
71.6
64.5
33.2
2156
.4
32 A
BS 8
1460
DO
011_
2008
09 H
ouse
hold
Use
of I
nfor
mat
ion
Tech
nolo
gy, A
ustr
alia
, 200
8-09
Ho
use
Ho
lds
Wit
H A
CCes
s to
A H
om
e Co
mpu
ter,
Au
strA
liA
An
d s
eleC
ted
Co
un
trie
s –
2008
32

AustrAliAn iCt stAtistiCAl Compendium 2011
60 AustrAliAn Computer soCiety
33 In
tern
atio
nal T
elec
omm
unic
atio
n U
nion
(ITU
) ann
ual I
CT D
evel
opm
ent I
ndex
Rep
ort 2
010
Aust
ralia
USA
UKCa
nada
NZ
ICT de
velop
men
t Ind
ex Ra
nk 20
0815
1910
2116
IDI 2
008
6.90
6.54
7.07
6.49
6.81
ICT D
evelo
pmen
t Ind
ex Ra
nk 20
0714
1710
1916
20
09 R
ank
2008
Ran
kIC
T Pric
e Bas
ket V
alue
Broa
dban
d(%
of G
NI p
er ca
pita
*)
Singa
pore
21
0.33
0.49
USA
62
0.40
0.50
Finlan
d12
100.5
90.9
7
UK9
140.5
70.6
3
Cana
da11
150.5
80.7
1
Irelan
d21
210.8
20.8
8
Kore
a19
230.7
91.4
1
Japa
n35
241.0
91.1
8
Belgi
um18
250.7
50.7
8
Aust
ralia
2526
0.86
0.77
NZ39
331.2
81.2
3
inte
rnAt
ion
Al
tele
Com
mu
niC
Atio
n u
nio
n (i
tu) A
nn
uA
l iC
t d
eVel
opm
ent
ind
ex r
epo
rt 2
010
iCt
priC
e BA
sKet
200
933

AustrAliAn iCt stAtistiCAl Compendium 2011
61AustrAliAn Computer soCiety
34 IT
U W
orld
Tele
com
mun
icat
ion
/ ICT
Indi
cato
rs D
atab
ase
2010
2000
2001
2002
2003
2004
2005
2006
2007
2008
2009
2010
Icelan
d44
.4749
.3979
.1283
.1483
.8887
.0089
.5190
.6091
.0093
.0095
.00
Norw
ay26
.7629
.2572
.8478
.1377
.6981
.9982
.5586
.9390
.5792
.0893
.39
Neth
erlan
ds43
.9849
.3761
.2964
.3568
.5281
.0083
.7085
.8287
.4289
.6390
.72
Swed
en45
.6951
.7770
.5779
.1383
.8984
.8387
.7682
.0190
.0091
.0090
.00
Denm
ark
39.17
42.96
64.25
76.26
80.93
82.74
86.65
85.03
85.02
86.84
88.72
Finlan
d37
.2543
.1162
.4369
.2272
.3974
.4879
.6680
.7883
.6782
.4986
.89
Unite
d King
dom
26.82
33.48
56.48
64.82
65.61
70.00
68.82
75.09
78.39
83.56
85.00
Kore
a (Re
p.)44
.7056
.6059
.4065
.5072
.7073
.5078
.1078
.8080
.9981
.6083
.70
New
Zeala
nd47
.3853
.2459
.0860
.9661
.8562
.7269
.0069
.7672
.0379
.7083
.00
Germ
any
30.22
31.65
48.82
55.90
64.73
68.71
72.16
75.16
77.91
79.26
81.85
Cana
da51
.3060
.2061
.5964
.2065
.9671
.6672
.4073
.2076
.7080
.3081
.60
Franc
e14
.3126
.3330
.1836
.1439
.1542
.8746
.8766
.0970
.6871
.5880
.10
Japa
n29
.9938
.5346
.5948
.4462
.3966
.9268
.6974
.3075
.4078
.0080
.00
Unite
d Sta
tes
43.08
49.08
58.79
61.70
64.76
67.97
68.93
75.00
74.00
78.00
79.00
Unite
d Ara
b Em
irate
s23
.6326
.2728
.3229
.4830
.1340
.0052
.0061
.0072
.0075
.0078
.00
Aust
ralia
46.7
652
.69
n/a
n/a
n/a
63.0
066
.00
69.4
571
.67
74.2
576
.00
inte
rnet
use
rs p
er 1
00 in
HA
BitA
nts
, sel
eCte
d C
ou
ntr
ies34

AustrAliAn iCt stAtistiCAl Compendium 2011
62 AustrAliAn Computer soCiety
35 CIIER/Whitehorse Top 250 Survey and industry model36 ABS labour market surveys for 5 main ICT occupations (old Anzsco format) to 2008, ICT Technical, professional and trade since 2008.
Jun-01 Jun-02 Jun-03 Jun-04 Jun-05 Jun-06 Jun-07 Jun-08Dec-
09/Feb 2010
Dec-10/Feb
2011
ICT industry35 210,686 202,766 222,136 224,830 237,979 255,086 287,829 288,372 283,000 285,000
ICT technicians and professionals36
267,900 268,700 280,100 273,100 273,400 277,700 282,000 282,533 297,075 316,051
Where Have We Come From – And Where Are We Going?
ICT R&D by field of research
$-
$1,000
$2,000
$3,000
$4,000
$5,000
$6,000
1996-7 1998-9 2000-1 2002-3 2004-5 2006-7 2007-8 2008-9
Year
$Am
illio
n
Private non-profit
Higher Education
State/Territory
Commonwealth
Business
Research estimated as equal to latest data available for prior year
iCt industry staffing has flattened since 2008. this is offset by rises in overall iCt technical, professional and trade staff, suggesting the change away from “panacea” outsourcing towards previous ratios of in-house iCt staffing is having an effect. the trend-line in the iCt industry data adds some support to this hypothesis, as it matches more closely to rises in iCt professional, technical and trade staff since 2008.
Longitudinal Employment And Economic Data
employment estimAtes deeWr/ABs/Ciier

AustrAliAn iCt stAtistiCAl Compendium 2011
63AustrAliAn Computer soCiety
ICT Industry revenue trends 2003-2010
$0
$10,000
$20,000
$30,000
$40,000
$50,000
$60,000
$70,000
$80,000
$90,000
2003 2004 2005 2006 2007 2008 2009 2010
$A,000
ManufacturingWholesale TradeComputer ServicesTelecommunications
Part of the ICT Industry – long-term growth
0.0
50.0
100.0
150.0
200.0
250.0
300.0
Nov-84
Nov-86
Nov-88
Nov-90
Nov-92
Nov-94
Nov-96
Nov-98
Nov-00
Nov-02
Nov-04
Nov-06
Nov-08
Part Time ; Telecommunications Services ; Persons ;Part Time ; Internet Service Providers, Web SearchPortals and Data Processing Services ; Persons ;Part Time ; Internet Publishing and Broadcasting ; Persons ;Part Time ; Computer System Design and RelatedServices ; Persons ;Full Time ; Telecommunications Services ; Persons ;Full Time ; Internet Service Providers, Web SearchPortals and Data Processing Services ; Persons ;Full Time ; Internet Publishing and Broadcasting ; Persons ;Full Time ; Computer System Design and RelatedServices ; Persons ;
iCt industry revenue37 dipped in 2008-9, led by telecommunications. While overall revenue has risen in 2009-10, telecommunications remains flat. long-term employment growth continued, however, here based on those parts of the iCt industry that can be extracted from ABs labour market quarterly data.38
37 CIIER Whitehorse Top 250 ICT Industry Survey and industry model 2003-1038 ABS labour market Nov 2010

AustrAliAn iCt stAtistiCAl Compendium 2011
64 AustrAliAn Computer soCiety
CIIER projections of future ICT technical and professional Employment Based upon ASX 200 June 30 closes and ABS labour market data extracts
0
1000
2000
3000
4000
5000
6000
7000
01/07
/99
03/07
/00
02/07
/01
01/07
/02
01/07
/03
01/07
/04
01/07
/05
01/07
/06
01/07
/07
01/07
/08
01/07
/09
01/07
/10
01/07
/11
01/07
/12
01/07
/13
01/07
/14
01/07
/15
01/07
/16
50,000
100,000
150,000
200,000
250,000
300,000
350,000
400,000
ASX June 30 close from previous year, plus average economist projections for 2011 and 2012
ASX trend
ICT Tech, professional and trade employment actual and CIIER projections
ICT technical and professional employment trend
this chart models a future iCt employment demand algorithm based upon a regressive analysis of correlations to Australian share market indices (effectively a surrogate for future investment intentions).
Forward share market index positions, of course, may vary from those projected, which are based upon conservative economist indicators.
the Ciier model projects a growth in iCt technical and professional employment net demand of 14,000 next year, and, assuming an Asx close June 30, 2012 of 5000 points, 21,000 the following year.
With the current uncertainties, it is useful to calculate the possible outcomes of these algorithms should the stock market recover more slowly, or if a recession should occur.
Future trends

AustrAliAn iCt stAtistiCAl Compendium 2011
65AustrAliAn Computer soCiety
CIIER projections of future ICT Professional and Technical EmploymentBased upon ASX 200 sharemarket analysis
01/07/14, 341,000
01/07/14, 372,000
01/07/12, 299,000
01/07/11, 285,00001/07/14, 272,800
0
50,000
100,000
150,000
200,000
250,000
300,000
350,000
400,000
Jul-99 Jul-00 Jul-01 Jul-02 Jul-03 Jul-04 Jul-05 Jul-06 Jul-07 Jul-08 Jul-09 Jul-10 Jul-11 Jul-12 Jul-13 Jul-14 Jul-15
Stockmarket slow recoveryStockmarket projected recoveryStockmarket recession
Historic employment 1999-2011, ABS labour market data
these suggest that, unless Australia tips into a minimum two-year recession, net demand for iCt technical and professional staff continues to grow over the next three years.
it should also be noted that this projected data is about net change. notwithstanding any growth in net demand, replacements will also still need to be made for retirements, external migration, the expiring of temporary visas and other ongoing reductions in the iCt workforce.
it is highly doubtful that this demand can be met from current education sources, as despite a slight increase in domestic iCt enrolments in the past two years, the neglect of domestic iCt education for the previous 10 years still has a long way to go to recover to necessary levels to support Australia’s digital economy.
Year 2001 2002 2003 2004 2005 2006 2007 2008 2009 2010
No 17,436 15,997 13,553 11,123 9,277 8,198 7,839 7,470 8,328 8,704
domestiC iCt HiGHer eduCAtion CommenCements

AustrAliAn iCt stAtistiCAl Compendium 2011
66 AustrAliAn Computer soCiety
IC
T pr
ofes
sion
als
– An
nual
Gra
duat
e en
try
v Ag
e re
tirem
ent,
curr
ent t
rend
s
0
1,00
0
2,00
0
3,00
0
4,00
0
5,00
0
6,00
0
7,00
0
2007
2008
2009
2010
2011
2012
2013
2014
2015
2016
2017
2018
2019
2020
loca
l gra
duat
es,
Ret
irem
ents
,
the
char
t ab
ove
has
been
upd
ated
fro
m t
hat
orig
inal
ly f
ound
in
a Ci
ier/
ACs
pub
licat
ion39
to
refle
ct t
he r
ecov
ery
in i
Ct
dom
estic
co
mm
ence
men
ts, a
nd, t
hus,
like
ly g
radu
atio
ns in
a t
hree
-yea
r sc
enar
io. i
t in
dica
tes
that
ret
irem
ents
alo
ne w
ill s
till h
ave
a gr
owin
g an
d si
gnifi
cant
impa
ct u
pon
the
likel
y pr
opor
tion
of d
omes
tic iC
t gr
adua
tes
left
to fu
el e
mpl
oym
ent g
row
th.
39 IC
T Sk
ills F
orec
astin
g Re
port
Aug
200
8, C
IIER,
ACS
AustrAliAn iCt stAtistiCAl Compendium 2011
67AustrAliAn Computer soCiety
The NBN Effect“A National Broadband Network based on FTTP technology will provide the best possible platform for Australia to use as a basis for its move into the knowledge economy. The NBN will provide Australia with a future-proof broadband infrastructure and provide support for future generations of applications and services that will underpin all sectors of the Australian economy. The NBN infrastructure will provide necessary backhaul support for complementary wireless services and will encourage competition at the services level, thereby eliminating wasteful duplication of infrastructure in the access network. Importantly, the FTTP infrastructure in the NBN will be readily upgradeable to 1 Gb/s and even 10 Gb/s to the home as new applications and services continue to drive demand for more bandwidth.” 40
in a report last year for the tasmanian iCt industry and tasmanian Government, Ciier analysts noted that there had been many theories put forward in respect to the potential impact of the nBn on iCt in Australia, and that they had ranged from “fanciful concepts of a panacea to all ills, to luddite rejections of necessity or impact”. A problem in applying rational analysis to the impact or otherwise of the nBn has been the frequent tendency of commentators to forget that advances in communications and iCt applications are, and were, taking place with or without the nBn, so, as noted by Ciier analysts in the tasmanian report: “it is its role as an additional facilitator and catalyst
that becomes important in the long run, rather than the underlying continuation of gains in productivity, efficiency and the range of products and services impacted by or created by iCt”.
the original conjectured “25,000 jobs”41 to be created by the nBn project were not categorised into skills mixes, nor was a difference made between the development phase and steady-state. this lack of clarity has led to presumptions about the quantification and qualification of potential nBn skills demand, many of which must inevitably be poorly founded. An example of this was a headline “Broadband jobs forecast falls short by thousands”,42 referring to nBn workforce modelling forecasting a requirement for 16,000 workers (5500 labourers, 300 cablers, 2300 earthmoving contractors, 1100 telecommunications line workers, 900 traffic controllers, and 3200 higher skills workers in various categories). these are, of course, all construction requirements, and have little to do with the real iCt skills implications of the nBn, which have more to do with enhanced content and bandwidth, not digging holes. the nBn will, however, certainly not diminish the demand for iCt technical and professional skills already identified in this report, and is highly likely to increase such demand beyond the levels already projected. inability to satisfy such demand for skilled labour is likely to become the largest constraint upon the efficacious use of the facilities the nBn will deliver.
40 Tucker, Rodney S. 2010. Broadband facts, fiction and urban myths. telecommunications Journal of Australia. 60 (3): pp. 43.1 to 43.15. http://tja.org.au41 Access Economic report to DBCDE 200842 Age/smH 26/9/2011 p6
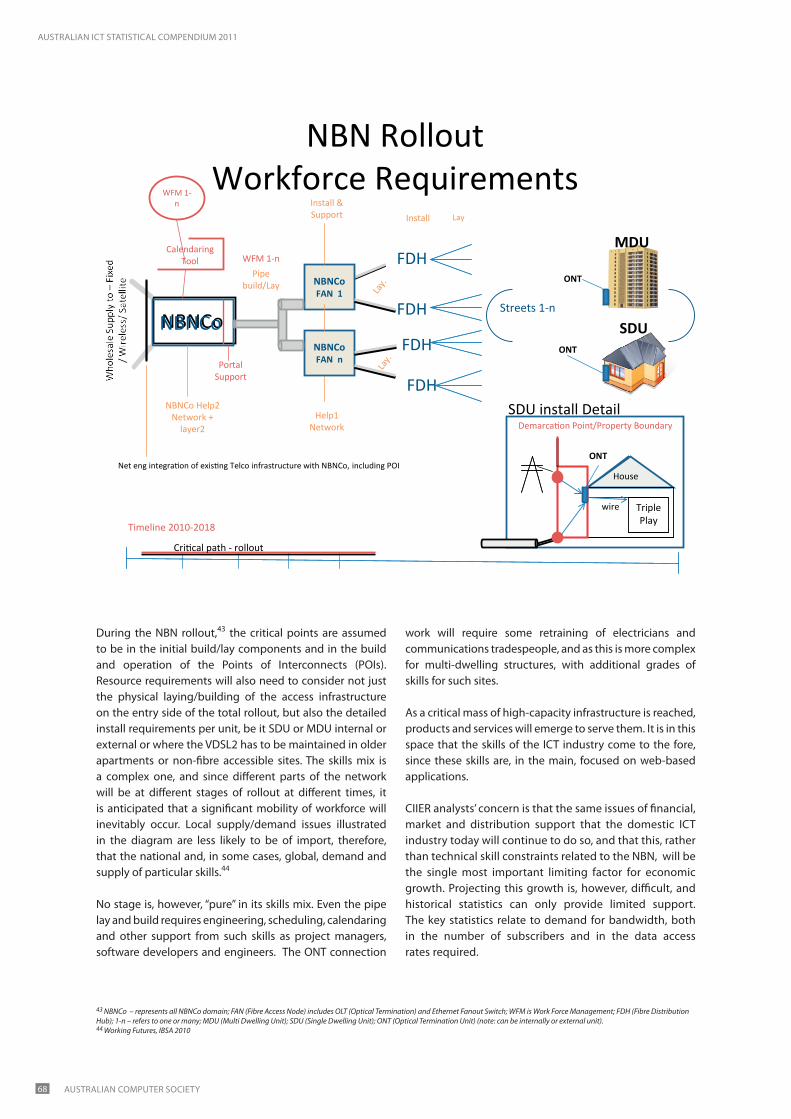
AustrAliAn iCt stAtistiCAl Compendium 2011
68 AustrAliAn Computer soCiety
NBN Rollout Workforce Requirements
NBNCoNBNCo
Timeline 2010-2018
CalendaringTool
WFM 1-n
PortalSupport
NBNCo Help2Network +
layer2
NBNCo FAN 1
Pipe build/Lay
WFM 1-n
Help1Network
Install &Support
FDH
FDH
Lay.
Install
Streets 1-n
House
Demarcation Point/Property Boundary
wire TriplePlay
Net eng integration of existing Telco infrastructure with NBNCo, including POI
SDU
MDU
SDU install Detail
Lay
NBNCo FAN n
FDH
FDHLa
y.
ONT
ONT
ONT
Critical path - rollout
during the nBn rollout,43 the critical points are assumed to be in the initial build/lay components and in the build and operation of the points of interconnects (pois). resource requirements will also need to consider not just the physical laying/building of the access infrastructure on the entry side of the total rollout, but also the detailed install requirements per unit, be it sdu or mdu internal or external or where the Vdsl2 has to be maintained in older apartments or non-fibre accessible sites. the skills mix is a complex one, and since different parts of the network will be at different stages of rollout at different times, it is anticipated that a significant mobility of workforce will inevitably occur. local supply/demand issues illustrated in the diagram are less likely to be of import, therefore, that the national and, in some cases, global, demand and supply of particular skills.44
no stage is, however, “pure” in its skills mix. even the pipe lay and build requires engineering, scheduling, calendaring and other support from such skills as project managers, software developers and engineers. the ont connection
work will require some retraining of electricians and communications tradespeople, and as this is more complex for multi-dwelling structures, with additional grades of skills for such sites.
As a critical mass of high-capacity infrastructure is reached, products and services will emerge to serve them. it is in this space that the skills of the iCt industry come to the fore, since these skills are, in the main, focused on web-based applications.
Ciier analysts’ concern is that the same issues of financial, market and distribution support that the domestic iCt industry today will continue to do so, and that this, rather than technical skill constraints related to the nBn, will be the single most important limiting factor for economic growth. projecting this growth is, however, difficult, and historical statistics can only provide limited support. the key statistics relate to demand for bandwidth, both in the number of subscribers and in the data access rates required.
43 NBNCo – represents all NBNCo domain; FAN (Fibre Access Node) includes OLT (Optical Termination) and Ethernet Fanout Switch; WFM is Work Force Management; FDH (Fibre Distribution Hub); 1-n – refers to one or many; MDU (Multi Dwelling Unit); SDU (Single Dwelling Unit); ONT (Optical Termination Unit) (note: can be internally or external unit).44 Working Futures, IBSA 2010
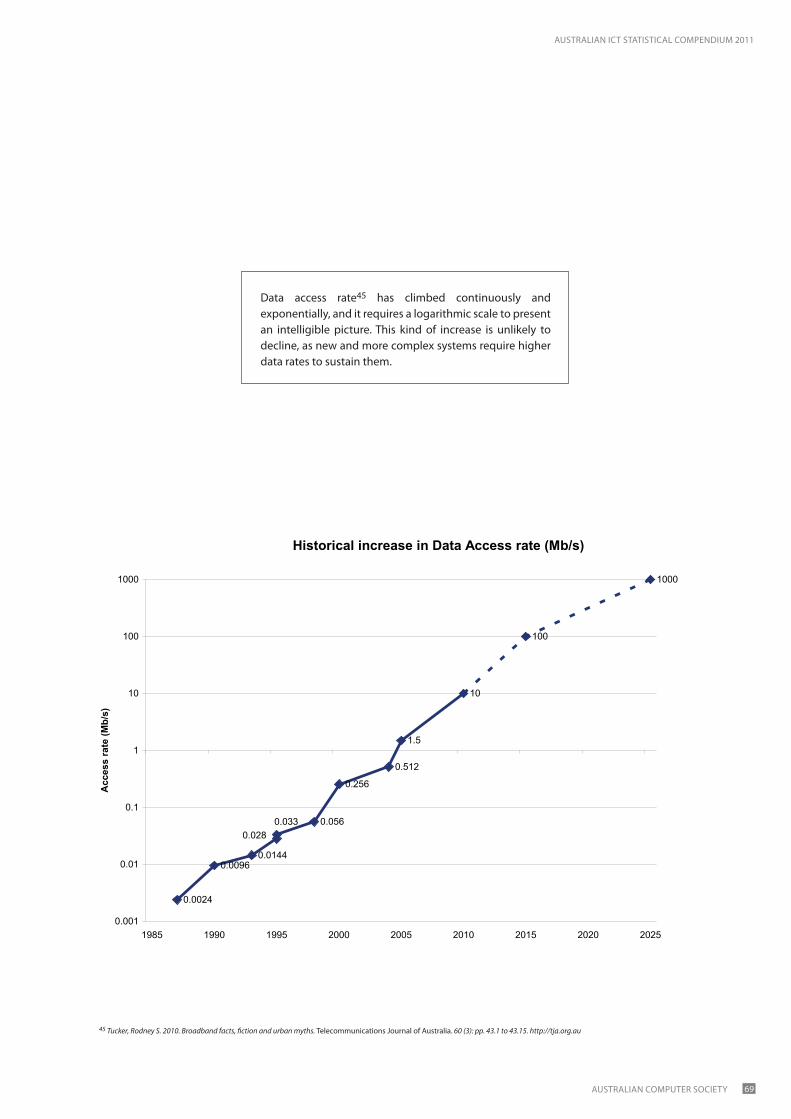
AustrAliAn iCt stAtistiCAl Compendium 2011
69AustrAliAn Computer soCiety
Historical increase in Data Access rate (Mb/s)
0.0024
0.00960.0144
0.056
0.256
0.512
1.5
10
100
1000
0.0330.028
0.001
0.01
0.1
1
10
100
1000
1985 1990 1995 2000 2005 2010 2015 2020 2025
Acc
ess
rate
(Mb/
s)
45 Tucker, Rodney S. 2010. Broadband facts, fiction and urban myths. telecommunications Journal of Australia. 60 (3): pp. 43.1 to 43.15. http://tja.org.au
data access rate45 has climbed continuously and exponentially, and it requires a logarithmic scale to present an intelligible picture. this kind of increase is unlikely to decline, as new and more complex systems require higher data rates to sustain them.
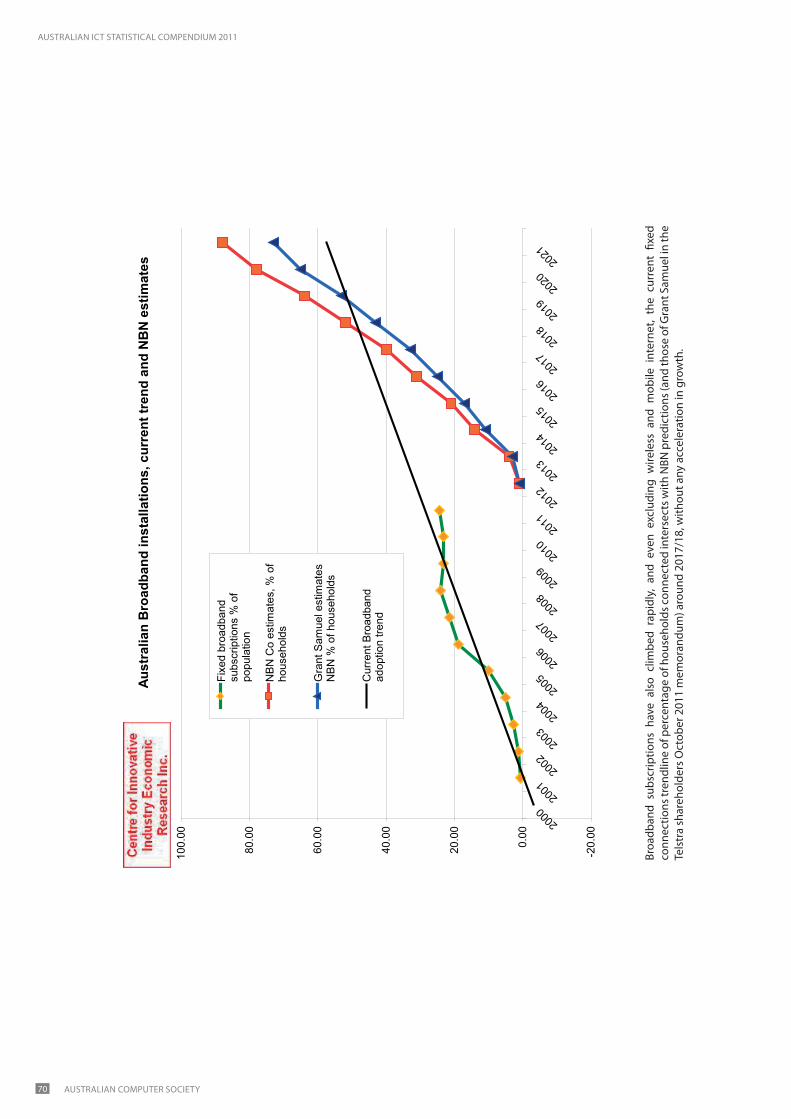
AustrAliAn iCt stAtistiCAl Compendium 2011
70 AustrAliAn Computer soCiety
Au
stra
lian
Bro
adba
nd in
stal
latio
ns, c
urre
nt tr
end
and
NB
N e
stim
ates
-20.
00
0.00
20.0
0
40.0
0
60.0
0
80.0
0
100.
00
2000
2001
2002
2003
2004
2005
2006
2007
2008
2009
2010
2011
2012
2013
2014
2015
2016
2017
2018
2019
2020
2021
Fixe
d br
oadb
and
subs
crip
tions
% o
fpo
pula
tion
NBN
Co
estim
ates
, % o
fho
useh
olds
Gra
nt S
amue
l est
imat
esN
BN %
of h
ouse
hold
s
Cur
rent
Bro
adba
ndad
optio
n tre
nd
Broa
dban
d su
bscr
iptio
ns h
ave
also
clim
bed
rapi
dly,
and
eve
n ex
clud
ing
wire
less
and
mob
ile i
nter
net,
the
curr
ent
fixed
co
nnec
tions
tren
dlin
e of
per
cent
age
of h
ouse
hold
s con
nect
ed in
ters
ects
with
nBn
pre
dict
ions
(and
thos
e of
Gra
nt s
amue
l in
the
tels
tra
shar
ehol
ders
oct
ober
201
1 m
emor
andu
m) a
roun
d 20
17/1
8, w
ithou
t any
acc
eler
atio
n in
gro
wth
.
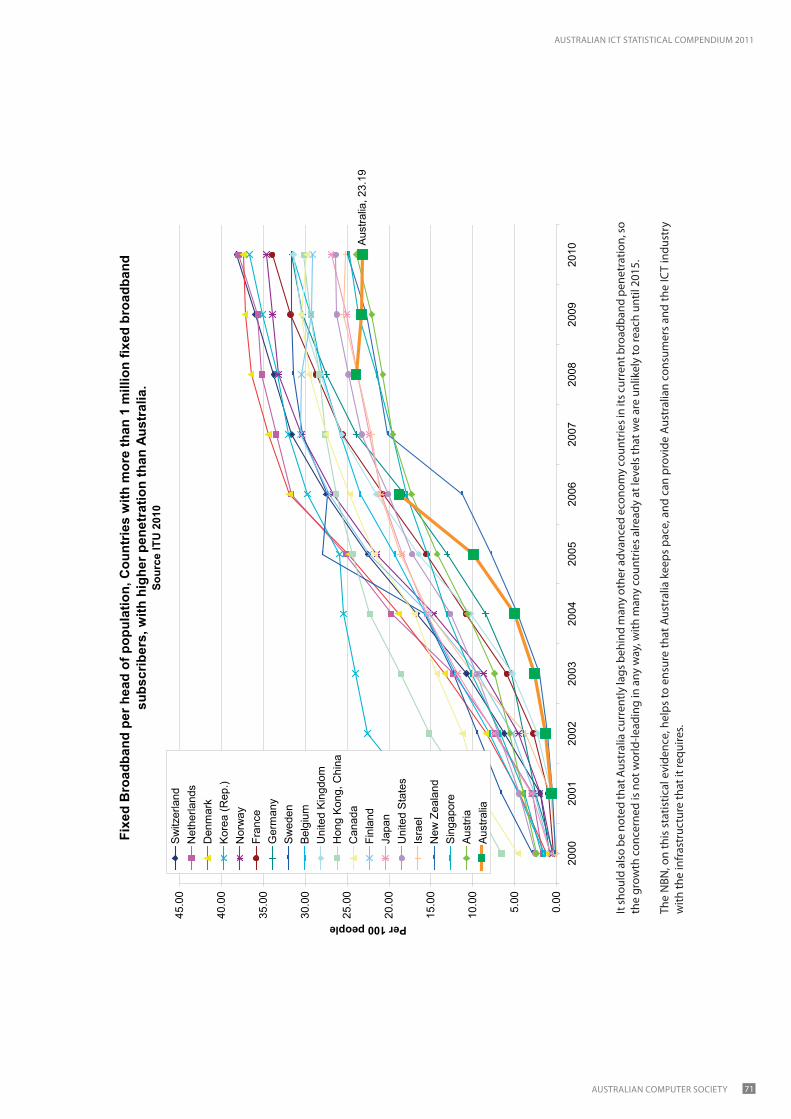
AustrAliAn iCt stAtistiCAl Compendium 2011
71AustrAliAn Computer soCiety
Fi
xed
Bro
adba
nd p
er h
ead
of p
opul
atio
n, C
ount
ries
with
mor
e th
an 1
mill
ion
fixed
bro
adba
nd
subs
crib
ers,
with
hig
her p
enet
ratio
n th
an A
ustr
alia
. So
urce
ITU
201
0
Aust
ralia
, 23.
19
0.00
5.00
10.0
0
15.0
0
20.0
0
25.0
0
30.0
0
35.0
0
40.0
0
45.0
0
2000
2001
2002
2003
2004
2005
2006
2007
2008
2009
2010
Per 100 peopleSw
itzer
land
Net
herla
nds
Den
mar
kKo
rea
(Rep
.)N
orw
ayFr
ance
Ger
man
ySw
eden
Belg
ium
Uni
ted
King
dom
Hon
g Ko
ng, C
hina
Can
ada
Finl
and
Japa
nU
nite
d St
ates
Isra
elN
ew Z
eala
ndSi
ngap
ore
Aust
riaAu
stra
lia
it sh
ould
als
o be
not
ed th
at A
ustr
alia
cur
rent
ly la
gs b
ehin
d m
any
othe
r adv
ance
d ec
onom
y co
untr
ies i
n its
cur
rent
bro
adba
nd p
enet
ratio
n, so
th
e gr
owth
con
cern
ed is
not
wor
ld-le
adin
g in
any
way
, with
man
y co
untr
ies
alre
ady
at le
vels
that
we
are
unlik
ely
to re
ach
until
201
5.
the
nBn
, on
this
sta
tistic
al e
vide
nce,
hel
ps to
ens
ure
that
Aus
tral
ia k
eeps
pac
e, a
nd c
an p
rovi
de A
ustr
alia
n co
nsum
ers
and
the
iCt
indu
stry
w
ith th
e in
fras
truc
ture
that
it re
quire
s.

AustrAliAn iCt stAtistiCAl Compendium 2011
72 AustrAliAn Computer soCiety
A significant amount of the data presented in this compendium is derived from the ABs and other government agencies. other data is derived from surveys conducted by a variety of organisations. it should be noted that the ABs, other government agencies, and many of the organisations concerned, advise that some caution should be exercised in the analysis of such data.
some of the broader caveats to the data in this publication have been incorporated alongside the tables and charts; others are too extensive or complex for easy inclusion.
ABs outlines for its publications both the methods applied to source the data and estimates of the reliability of it for analysis purposes. these can be accessed from the ABs website.
the quality of statistical data is affected by a number of factors, the main ones being time, depth and coverage. timely data is data that is reasonably up-to-date, and non-timely data loses usefulness as it gets older, other than for trend analysis. in this publication we have tried to present the timeliest data available at the time of compilation, however, it is clear that some important iCt data is not as up-to-date as would be preferable. depth of data refers to the base level to which the data penetrates, and the relative size of the sample used. it also addresses whether the data only exists at a summary level, or whether it is a summation of more detailed
data. in general, the greater the depth the greater levels of accuracy. Coverage applies to the relevancy of the source to the analysis, i.e. if the only sources of data come from a single state, industry sector or size of organisation, does that allow analysis to presume with any level of certainty that other states, sectors or corporations are similar?
We have tried to identify in footnotes and comments both the source and timeliness of data, and analysis has been kept to the minimum necessary to minimise any inadvertent misinterpretation of the data presented.
some data are leading indicators, i.e. they can help to project other data (an example of a leading indicator is tertiary commencements, which, by the application of average “success” percentages, can project likely completions three years hence). other data are trailing indicators, i.e. job losses are often a trailing indicator of worse market conditions. Because they are gathered with different timeframes, leading and trailing indicators may not always agree. they can, however, if tracked consistently, show trends of growth or contraction, and of acceleration or slowdown.
statistics can tell us what has happened, but not always why. statistics can give us pointers to the future, but only to the limitations of the data and the environment. We hope you find these statistics useful and that they encourage debate and discussion about the scope and role of iCt in Australia.
stAtistiCAl dAtA CAVeAts And CAutions
How Should We Read This Document?

AustrAliAn iCt stAtistiCAl Compendium 2011
73AustrAliAn Computer soCiety
Ciier is an Australian think-tank developing and analysing consistent, competently researched, up-to-date data on employment, markets, revenue streams, r&d, processes and management methods for high technology, innovative and emerging industries. Ciier conducts the ‘top 250’ iCt industry survey, is recognised as a leading indicator of trends in the Australian iCt industry, and conducts analysis and reporting on information technology and other high technology industries.
Whitehorse strategic Group ltd assisted with the analysis for this publication. Whitehorse is an Australian-owned management consulting practice specialising in information management, iCt policy and strategy, e-government and governance.
About The Centre For Innovative Industries Economic Research Inc
Centre for innovative industries economic research incABn 64 806 162 996suite 2, 597 High st.northcote [email protected]: 03 9614 8510Fax: 03 9614 8201
AustrAliAn iCt stAtistiCAl Compendium 2011
74 AustrAliAn Computer soCiety
the ACs and Ciier express our grateful thanks to the organisations that have contributed to this project by allowing access to data (either direct to the ACs or via Ciier), including:
Sources And Acknowledgements
Australian Bureau of statistics
Working Futures/iBsA
Australian department of education employment and Workplace relations
organisation for economic Cooperation and development (oeCd)
Australian department of immigration and Citizenship (formerly dimiA)
national Centre for Vocational education research (nCVer)
Cses (Victoria university)
tradedata
international telecommunication union (itu)
the project team for this compendium was led by Ciier director ian dennis under the guidance of ACs staff Adam redman, along with Amanda evans and seni murni; and Whitehorse associates phil Kowalski and suzana Grbesa. We especially wish to thank for their generous assistance with their advice and access to data, for this and previous reports, staff from ABs, deeWr, and industry colleagues Graeme philipson, Bob olivier, John Houghton and marcus Bowles, among many others. We hope that you find the ACs Australian iCt statistical Compendium 2011 useful.

AustrAliAn iCt stAtistiCAl Compendium 2011
75AustrAliAn Computer soCiety

AustrAliAn iCt stAtistiCAl Compendium 2011
76 AustrAliAn Computer soCiety
AUSTRALIANCOMPUTERSOCIETY
www.acs.org.au/2011compendium
Related Documents