Australian Honeybee Industry Survey 2006–07 RIRDC Pub. No. 08/170

Welcome message from author
This document is posted to help you gain knowledge. Please leave a comment to let me know what you think about it! Share it to your friends and learn new things together.
Transcript

Australian Honeybee Industry Survey
2006–07
RIRDC Pub. No. 08/170
08-170 covers.indd 2 17/10/2008 11:52:50 AM


Australian Honeybee Industry Survey 2006–07
by Sarah Crooks
Australian Bureau of Agricultural and Resource Economics
October 2008
RIRDC Publication No 08/170 RIRDC Project No PRJ-000968

ii
© 2008 Rural Industries Research and Development Corporation. All rights reserved.
ISBN 1 74151 759 1 ISSN 1440-6845
Australian honeybee industry survey, 2006-07 Publication No. 08/170 Project No. PRJ-000968
The information contained in this publication is intended for general use to assist public knowledge and discussion and to help improve the development of sustainable regions. You must not rely on any information contained in this publication without taking specialist advice relevant to your particular circumstances.
While reasonable care has been taken in preparing this publication to ensure that information is true and correct, the Commonwealth of Australia gives no assurance as to the accuracy of any information in this publication.
The Commonwealth of Australia, the Rural Industries Research and Development Corporation (RIRDC), the authors or contributors expressly disclaim, to the maximum extent permitted by law, all responsibility and liability to any person, arising directly or indirectly from any act or omission, or for any consequences of any such act or omission, made in reliance on the contents of this publication, whether or not caused by any negligence on the part of the Commonwealth of Australia, RIRDC, the authors or contributors.
The Commonwealth of Australia does not necessarily endorse the views in this publication.
This publication is copyright. Apart from any use as permitted under the Copyright Act 1968, all other rights are reserved. However, wide dissemination is encouraged. Requests and inquiries concerning reproduction and rights should be addressed to the RIRDC Publications Manager on phone 02 6271 4165
Researcher Contact Details
Sarah Crooks Australian Bureau of Agricultural and Resource Economics GPO Box 1563 Canberra city ACT 2601
Phone: 02 6272 2076 Email: [email protected]
In submitting this report, the researcher has agreed to RIRDC publishing this material in its edited form.
RIRDC Contact Details
Rural Industries Research and Development Corporation Level 2, 15 National Circuit BARTON ACT 2600
PO Box 4776 KINGSTON ACT 2604
Phone: 02 6271 4100 Fax: 02 6271 4199 Email: [email protected]. Web: http://www.rirdc.gov.au
Published in October 2008 Printed by Union Offset Printing, Canberra

iii
Foreword The honeybee industry is important to Australia with an estimated gross value of honey and beeswax production of $75 million in 2007-08. In common with many other industries, the honeybee industry faces a number of challenges. These include competition in both export and domestic markets and access to native flora. The industry needs to maintain its competitiveness and comparative advantage as a supplier of high quality honey.
Limited information is available on the physical and financial characteristics of honey producing businesses to guide industry decision-making. In addition, little information is available on the demographic and socioeconomic circumstances of people involved in the industry.
This report, commissioned by RIRDC, presents results from a comprehensive survey of Australian honeybee businesses. This is the second survey of this type, with a similar survey conducted in 2002. Survey results will assist benchmarking to improve the industry’s performance and provide information to target industry efforts to improve productivity and profitability.
In addition to providing valuable information on honeybee businesses, survey results also enable estimation of the economic value of the industry and the resources used by the industry. This report will assist in developing industry policies and planning, providing a factual basis for further development of the honeybee industry.
This project was funded from industry revenue, matched by funds provided by the Australian Government. The survey of honeybee businesses was conducted in close cooperation with the industry.
This report, an addition to RIRDC’s diverse range of over 1800 research publications, forms part of our Honeybees R&D program, which aims to increase profitability by improving hive husbandry and management practices through the provision of production and financial benchmarks.
Most of our publications are available for viewing, downloading or purchasing online through our website:
• downloads at www.rirdc.gov.au/fullreports/index.html
• purchases at www.rirdc.gov.au/eshop
Peter O’Brien Managing Director Rural Industries Research and Development Corporation

iv
Acknowledgments The success of the project is because of the cooperation of a large number of beekeepers from around Australia.
In addition, many state government apiary officers assisted in compiling state industry statistics and lists of beekeepers. In particular, thanks to, Ian Bell (Department of Primary Industries (DPI) New South Wales), Diane Werner (DPI Queensland), Bill Shay, Joe Riordan and Allison Lee (DPI Victoria), David White (DPI Tasmania), Ian Seymour (Agriculture Western Australia), Michael Stedman and Emma Brown (DPI South Australia) and Vicki Simlesa (Crocodiles and apiary officer at Berrimah Farm Northern Territory).
The author also thanks ABARE officers who collected and edited the data, Eden O'Mara, Stuart Pile, Linda Kennett, Vicki Franklin, Kathryn Dufty, Merrilyn Woodhouse, Wendy Barlow, John Lisle, Teena Wilcock, Emma Platts, Paul Philips, Neil Bingham, Jason Bakonji, Mark Neilsen and Ken Colbert. Many thanks to Milly Lubulwa for her guidance and overall management of the project and Peter Martin for editing the final report.
Assistance with technical aspects of the project and providing comments on the draft report by Linton Briggs, Des Cannon, Keith Mcilvride and Bruce White is gratefully acknowledged.
ABARE thanks RIRDC for funding the 2008 honeybee industry survey and Margie Thompson of RIRDC for managing the project.

v
Contents Foreword............................................................................................................................................................... iii Acknowledgments ................................................................................................................................................ iv Executive Summary ............................................................................................................................................ vii 1. Introduction....................................................................................................................................................... 1
1.1. Survey objectives .......................................................................................................................................1
1.2. Overview of the honeybee industry ...........................................................................................................2 1.2.1. Structure of the industry ..................................................................................................................2 1.2.2. Outputs from the industry ................................................................................................................3
1.3. Pollination ..................................................................................................................................................3
1.4. Challenges facing the honeybee industry...................................................................................................3 1.4.1. Resource base threats.......................................................................................................................3 1.4.2. Pests and diseases ............................................................................................................................4 1.4.3. Overseas competition.......................................................................................................................4
2. Methodology ...................................................................................................................................................... 5 2.1. Survey design.............................................................................................................................................5
2.2. Survey questionnaire..................................................................................................................................6
3. Physical characteristics..................................................................................................................................... 7 3.1. Size of operations.......................................................................................................................................7
3.2. Production..................................................................................................................................................9
3.3. Socioeconomic and business structure.....................................................................................................12 3.3.1. Business structure ..........................................................................................................................12 3.3.2. Socioeconomics .............................................................................................................................12
4. Financial performance.................................................................................................................................... 14 4.1. Receipts and costs estimates ....................................................................................................................14
4.2. Financial performance..............................................................................................................................17
4.3. Cost of production....................................................................................................................................18
4.4. Capital and debt .......................................................................................................................................20
5. Pollination services.......................................................................................................................................... 22 6. Public land access............................................................................................................................................ 26 7. Challenges facing the industry....................................................................................................................... 29
7.1. Floral resource base .................................................................................................................................30
7.2. Pests and diseases ....................................................................................................................................31
8. Importance and availability of information for beekeepers........................................................................ 32 9. Financial performance compared to 2000-01 ............................................................................................... 34 10. Appendices..................................................................................................................................................... 38
10.1. Definitions..............................................................................................................................................38
10.2. Reliability of estimates...........................................................................................................................40 10.2.1. Sampling errors............................................................................................................................40 10.2.2. Comparing estimates....................................................................................................................40 10.2.3. Data quality..................................................................................................................................41
10.3. Supplementary questionnaire .................................................................................................................42
10.4. References..............................................................................................................................................46
10.5. Appendix tables .....................................................................................................................................47

vi
Tables Table A. Numbers of beekeepers and hives, by state, 2006-07 ...............................................................................2 Table B. Registered beekeepers and sample numbers, 2006-07 ..............................................................................5 Table C. Size of operations of Australian honeybee businesses, 2006-07...............................................................7 Table D. Size of operations of Australian honeybee businesses, 2006-07...............................................................7 Table E. Size of operations of Australian honeybee businesses, 2006-07 ...............................................................8 Table F. Honey production, 2006-07 .......................................................................................................................9 Table G. Financial performance, 2006-07 .............................................................................................................17 Table H. Cost of production per hive for specialist honey producers, 2006-07 ....................................................18 Table I. Cost of production per kg of honey produced for specialist honey producers, 2006-07 ..........................19 Table J. Pollination service provision, 2006-07.....................................................................................................22 Table K. Receipts for pollination services, 2006-07..............................................................................................23 Table L. Expansion of pollination services, 2006-07 ............................................................................................24
Figures Figure 1. Size of operations of Australian honeybee businesses, 2006-07 ..............................................................8 Figure 2. Share of honey production from regional floral resources, 2006-07........................................................9 Figure 3. Honey production, 2006-07....................................................................................................................10 Figure 4. Honey production per hive, 2006-07......................................................................................................11 Figure 5. Aggregate honey production, 2006-07 ...................................................................................................11 Figure 6. Business structure of honey enterprises, 2006-07 ..................................................................................12 Figure 7. Age and years of experience of honeybee business owner/operators, 2006-07 .....................................12 Figure 8. Educational attainment of operators and spouses, 2006-07....................................................................13 Figure 9. Non-honeybee business income of owner/operator and spouse, 2006-07..............................................13 Figure 10. Total cash receipts, 2006-07 .................................................................................................................14 Figure 11. Average price received per kilogram of honey sold, 2006-07..............................................................15 Figure 12. Total cash costs, 2006-07 .....................................................................................................................15 Figure 13. Composition of cash costs for honeybee businesses, 2006-07 .............................................................16 Figure 14. Total business capital, 2006-07 ............................................................................................................20 Figure 15. Composition of capital value, 2006-07.................................................................................................21 Figure 16. Total business debt and equity ratio, 2006-07 ......................................................................................21 Figure 17. Types of crops receiving pollination services, 2006-07 .......................................................................23 Figure 18. Honeybee businesses expecting to expand/commence pollination services, 2006-07 .........................24 Figure 19. Factors influencing the decision to expand/commence pollination services, 2006-07.........................25 Figure 20. Use of public land for honey production over the past 5 years, 2006-07 .............................................26 Figure 21. Use of public land for honey production over the past 5 years, 2006-07 .............................................26 Figure 22. Proportion of 2006-07 honey production derived from public land.....................................................27 Figure 23. Proportion of 2006-07 honey production derived from public land.....................................................27 Figure 24. Use of public land for honey production over the past 5 years, 2006-07 .............................................28 Figure 25. Challenges facing Australian beekeepers, 2006-07..............................................................................29 Figure 26. Challenges facing honeybee businesses access to floral resources, 2006-07 .......................................30 Figure 27. Pests and diseases impacting on honey production, 2006-07 ...............................................................31 Figure 28. Information sources of beekeepers, 2006-07........................................................................................32 Figure 29. Importance of information by topic, 2006-07.......................................................................................33 Figure 30. Price received per kilogram of honey sold in 2000-01 and 2006-07....................................................34 Figure 31. Cash receipts and honey receipts in 2000-01 and 2006-07 ..................................................................35 Figure 32. Cash receipts in 2000-01 and 2006-07 .................................................................................................35 Figure 33. Average cash costs in 2000-01 and 2006-07 ........................................................................................36 Figure 34. Average cash operating surplus in 2000-01 and 2006-07 ....................................................................36 Figure 35. Average rate of return, excluding capital appreciation in 2000-01 and 2006-07 .................................37
vii
Executive Summary What the report is about
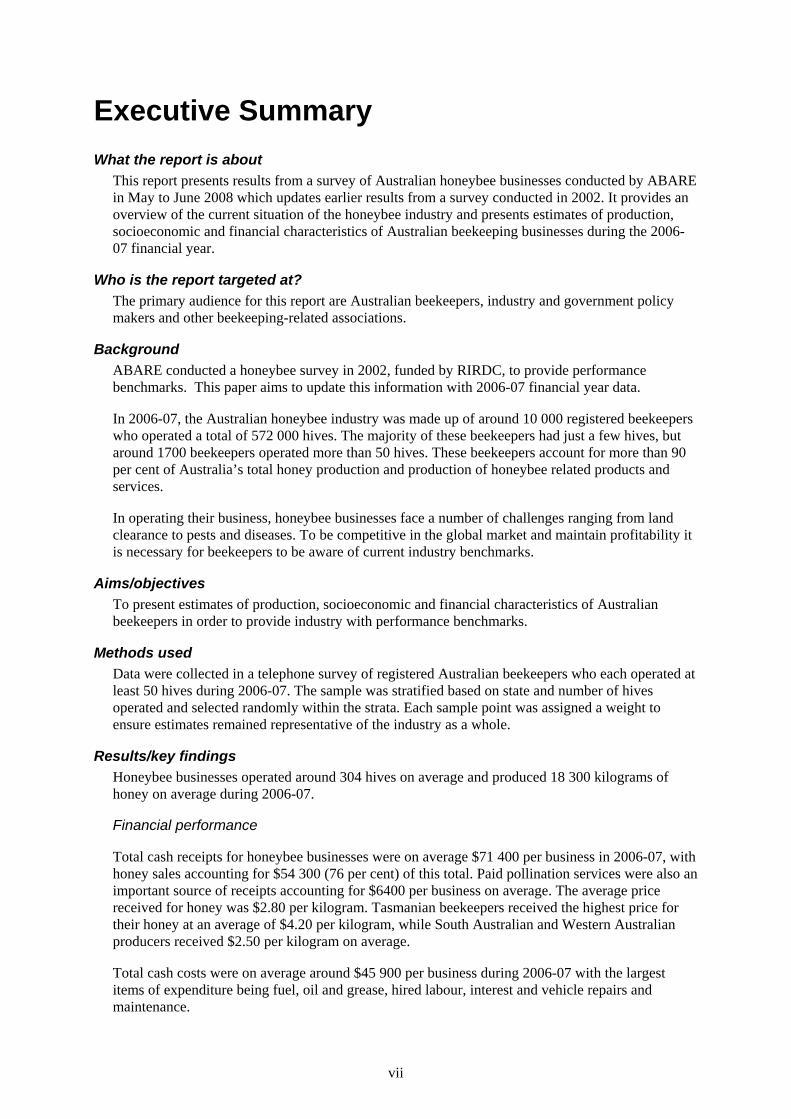
This report presents results from a survey of Australian honeybee businesses conducted by ABARE in May to June 2008 which updates earlier results from a survey conducted in 2002. It provides an overview of the current situation of the honeybee industry and presents estimates of production, socioeconomic and financial characteristics of Australian beekeeping businesses during the 2006-07 financial year.
Who is the report targeted at? The primary audience for this report are Australian beekeepers, industry and government policy makers and other beekeeping-related associations.
Background ABARE conducted a honeybee survey in 2002, funded by RIRDC, to provide performance benchmarks. This paper aims to update this information with 2006-07 financial year data.
In 2006-07, the Australian honeybee industry was made up of around 10 000 registered beekeepers who operated a total of 572 000 hives. The majority of these beekeepers had just a few hives, but around 1700 beekeepers operated more than 50 hives. These beekeepers account for more than 90 per cent of Australia’s total honey production and production of honeybee related products and services.
In operating their business, honeybee businesses face a number of challenges ranging from land clearance to pests and diseases. To be competitive in the global market and maintain profitability it is necessary for beekeepers to be aware of current industry benchmarks.
Aims/objectives To present estimates of production, socioeconomic and financial characteristics of Australian beekeepers in order to provide industry with performance benchmarks.
Methods used Data were collected in a telephone survey of registered Australian beekeepers who each operated at least 50 hives during 2006-07. The sample was stratified based on state and number of hives operated and selected randomly within the strata. Each sample point was assigned a weight to ensure estimates remained representative of the industry as a whole.
Results/key findings Honeybee businesses operated around 304 hives on average and produced 18 300 kilograms of honey on average during 2006-07.
Financial performance
Total cash receipts for honeybee businesses were on average $71 400 per business in 2006-07, with honey sales accounting for $54 300 (76 per cent) of this total. Paid pollination services were also an important source of receipts accounting for $6400 per business on average. The average price received for honey was $2.80 per kilogram. Tasmanian beekeepers received the highest price for their honey at an average of $4.20 per kilogram, while South Australian and Western Australian producers received $2.50 per kilogram on average.
Total cash costs were on average around $45 900 per business during 2006-07 with the largest items of expenditure being fuel, oil and grease, hired labour, interest and vehicle repairs and maintenance.

viii
Cash operating surplus (total cash receipts minus total cash costs) was on average $25 500 per business with Tasmanian businesses generating the highest average cash operating surplus at more than $52 800. Queensland businesses on the other hand recorded the lowest average cash operating surplus at just $12 200 per business, in 2006-07.
The average capital value of Australian beekeeping businesses was estimated to be $610 000 with the majority being accounted for by land and fixed improvements. Fixed improvements include honey extraction plant, packing sheds and other buildings at the business premises. Business debt levels were on average $93 300 per business and equity ratio was 87 per cent on average.
The financial performance of honeybee businesses is estimated to have improved since the last survey in 2000-01, largely because of increases in honey prices and increased revenue from pollination services, despite substantial increases in the businesses operating costs. Average rates of return for 2006-07 were -3 per cent compared with -5 per cent in 2000-01. In 2006-07, rates of return for honeybee businesses were generally low but were higher for larger businesses.
Pollination services and challenges facing the industry
During 2006-07, 28 per cent of honeybee businesses provided pollination services for Australian agricultural producers, with an estimated 76 per cent of these businesses receiving payment for pollination services.
The industry is faced with the challenge of meeting future demand for pollination services. Thirty-six per cent of honeybee businesses indicated they expect to begin or expand pollination services in the future. The main types of crops on which paid pollination services were used in 2006-07 were almonds, cherries, other fruit, pumpkins, apples, lucerne and canola.
An estimated 66 per cent of beekeepers used public land for honey production in the past five years. Over the past five years, 20 per cent of businesses decreased their usage while 14 per cent increased usage.
Drought was the most widespread challenge facing honeybee businesses during 2006-07 with an estimated 87 per cent of beekeepers indicating production was reduced as a result of drought. Most businesses, except those in South Australia reported honey production in 2006-07 to be below normal. Other challenges impacting on production were pesticide use, tree dieback, weed control, conserved area access, land clearance and fire damage.
An estimated 70 per cent of honeybee businesses indicated the existence of wax moths in their stored honeycomb had an impact on production, although it was generally to a small extent, probably because wax moths invade only after a hive has been stored. Producers also said chalkbrood was another honeybee disease impacting on production. Very few beekeepers’ production was affected by the honeybee diseases sacbrood and American foulbrood.
Implications for relevant stakeholders for: Results provide Australian honeybee businesses with industry benchmarks to facilitate a better understanding of the relative performance of honeybee businesses. Estimates provide the basis to improve decision making of both beekeepers and policy makers to ensure that honeybee industry continues to remain viable and competitive in the global market.
Recommendations That estimates be used to inform and improve decision making by beekeepers and policy makers.
1
1. Introduction
1.1. Survey objectives
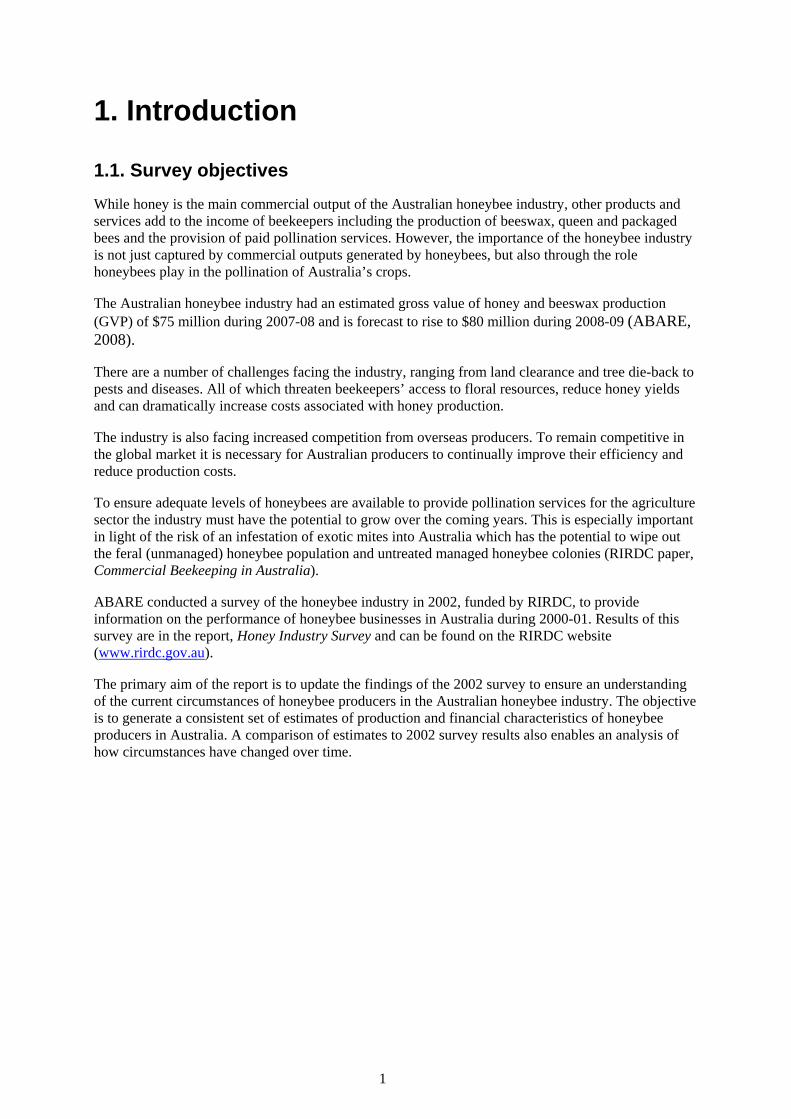
While honey is the main commercial output of the Australian honeybee industry, other products and services add to the income of beekeepers including the production of beeswax, queen and packaged bees and the provision of paid pollination services. However, the importance of the honeybee industry is not just captured by commercial outputs generated by honeybees, but also through the role honeybees play in the pollination of Australia’s crops.
The Australian honeybee industry had an estimated gross value of honey and beeswax production (GVP) of $75 million during 2007-08 and is forecast to rise to $80 million during 2008-09 (ABARE, 2008).
There are a number of challenges facing the industry, ranging from land clearance and tree die-back to pests and diseases. All of which threaten beekeepers’ access to floral resources, reduce honey yields and can dramatically increase costs associated with honey production.
The industry is also facing increased competition from overseas producers. To remain competitive in the global market it is necessary for Australian producers to continually improve their efficiency and reduce production costs.
To ensure adequate levels of honeybees are available to provide pollination services for the agriculture sector the industry must have the potential to grow over the coming years. This is especially important in light of the risk of an infestation of exotic mites into Australia which has the potential to wipe out the feral (unmanaged) honeybee population and untreated managed honeybee colonies (RIRDC paper, Commercial Beekeeping in Australia).
ABARE conducted a survey of the honeybee industry in 2002, funded by RIRDC, to provide information on the performance of honeybee businesses in Australia during 2000-01. Results of this survey are in the report, Honey Industry Survey and can be found on the RIRDC website (www.rirdc.gov.au).
The primary aim of the report is to update the findings of the 2002 survey to ensure an understanding of the current circumstances of honeybee producers in the Australian honeybee industry. The objective is to generate a consistent set of estimates of production and financial characteristics of honeybee producers in Australia. A comparison of estimates to 2002 survey results also enables an analysis of how circumstances have changed over time.

2
1.2. Overview of the honeybee industry
1.2.1. Structure of the industry Beekeepers in all states, apart from Tasmania, are required to register their business. Registration is not compulsory in Tasmania, the Northern Territory and the Australian Capital Territory. The number of beekeepers is known to be low in the Northern Territory and numbers in the Australian Capital Territory are not known exactly.
There are currently close to 10 000 registered beekeepers in Australia operating a total of just less than 572 000 hives. A large proportion of registered beekeepers are located in New South Wales and Queensland with around 31 per cent located in each of these two states (Table A). Tasmania has the lowest number of registered beekeepers accounting for 2 per cent of registered beekeepers, however, it should be noted that registration is not compulsory.
Around 90 per cent of the total number of hives is accounted for by beekeepers operating more than 50 hives. For the purposes of this report, beekeepers with more than 50 hives are considered to be commercial honeybee businesses.
Table A. Numbers of beekeepers and hives, by state, 2006-07
State/territory Number of beekeepers
% of beekeepers
Number of hives
% of hives % operating 50
hives or more New South Wales 3 062 31 236 233 41 22 North 1 623 16 120 252 21 23 South 1 439 15 115 981 20 21 Queensland 3 113 31 127 057 22 12 Western Australia 712 7 26 929 5 13 South Australia 724 7 67 344 12 27 Tasmaniaa 157 2 13 939 2 20 Victoria 2 143 22 99 261 17 16 Northern Territorya 7 0 1 205 0 na Total 9 918 100 571 968 100 17
aregistration is not compulsory in these states and as such the number of beekeepers is likely to be higher. Source: state apiary offices na: not available

3
1.2.2. Outputs from the industry While honey is the major commercial output of the honeybee industry there are a number of other products which also add to the income of honeybee businesses. These include production of beeswax, queen and packaged bees and propolis. A number of beekeepers are also paid for providing pollination services to agricultural producers.
1.3. Pollination
Pollination refers to the fertilisation of flora through the transfer of pollen. While this can occur as a result of pollen transfer by native bees, beetles and other insects, honeybees are the most important agent of pollination. Pollination of many crops increases yields and improves quality and is particularly important for tree crops such as almond and stone fruit, as well as the seeds for field crops such as lucerne, clovers and vegetables. Pollination plays a large role in the agricultural sector with an estimated 65 per cent of Australian crops relying on honeybees for pollination (Valuing honeybee pollination, 2003).
While some apiarists are paid to provide pollination services, a significant number of apiarists do not receive monetary payment for the service. Some are paid “in-kind” for the services, while others benefit from using the crops as a source of pollen to feed their bees and produce honey. An example of an “in-kind” payment might be receiving vegetables in return for providing pollination services to a vegetable farm.
Section 4 presents more detailed survey results in relation to pollination.
1.4. Challenges facing the honeybee industry
There are a number of challenges and risks facing the honeybee industry which have the potential to impact on the production of honey, the quality of honey produced and prices received for honey including:
• resource base threats (access to flora); • pests and diseases risks; and • overseas competition.
1.4.1. Resource base threats Output depends to a large extent upon the level and quality of inputs. In the case of the honey industry, the major input is the pollen and nectar collected by honeybees from flora. There are a number of threats to the access of beekeepers to suitable flora including:
• a reduction in access to public lands and the conversion of land to conserved area; • land clearance, which is happening at a higher rate than plantation; • the death of trees caused by salinity and rising water tables; • natural circumstances such as flooding, bush fires and drought conditions; • the use of pesticides harmful to honeybees by producers on crops; and • the control of weeds which act as a source of pollen.

4
1.4.2. Pests and diseases There are a number of pests and diseases impacting on honey production within Australia. The most serious currently facing Australian apiarists are american foulbrood, european foulbrood, chalkbrood, nosema, sacbrood, wax moth and the small hive beetle.
Because of strict quarantine restrictions, the more serious exotic mites have not yet reached Australia. If they were to reach the country, they have the potential to wipe out the entire population of feral honeybees (RIRDC paper, Commercial beekeeping in Australia). It is important extensive planning is undertaken to minimize the impact these would have on pollination requirements in the agriculture sector.
1.4.3. Overseas competition Australian honey is renowned for its quality and is exported widely to more than 38 countries. Movements in exchange rates impact on the competitiveness of Australian honey on world markets. A rise in the Australian dollar relative to the currency of importing countries makes Australian honey exports relatively more expensive and may lead to a decline in demand. In addition, tariffs, quotas and bans in some countries also limit Australian honey producers access to overseas markets.

5
2. Methodology
2.1. Survey design
The 2008 Australian honeybee industry survey was designed and the sample selected from lists of beekeepers obtained from departmental apiary officers for each state. To be eligible for sample selection, the beekeeper must have operated at least 50 hives during 2006-07. A sample of 150 beekeepers were selected from a total population of 1702 beekeepers who operated 50 hives or more (Table B). To select the sample, the population was stratified based on state and the number of hives operated and the sample selected randomly within the strata. In New South Wales the state was divided into two regions, north and south to enable the presentation of separate survey results for these two areas. Since the survey was voluntary, selections were made in addition to the primary selection to ensure as close to the sample goal of 150 was realised.
Once the sample was selected, information was collected using telephone interviews with supporting financial data being submitted by mail or fax.
Table B. Registered beekeepers and sample numbers, 2006-07
Population (Number of businesses with 50 hives or
more)
Hive numbers Target sample of businesses
Realised sample
New South Wales 664 216 239 33 30 North 364 107 747 18 15 South 300 108 492 15 15 Queensland 374 105 096 27 27 Victoria 338 86 037 24 24 South Australia 192 62 917 21 17 Western Australia 95 21 990 21 18 Tasmania 32 12 782 18 17 Northern Territory 7 1 205 6 2 Australia 1 702 506 266 150 135
The Australian Bureau of Statistics (ABS) business register was also considered as a source of the sample list for the survey but was not used. This list appeared to have an under-coverage of smaller units and a disproportionate number of the beekeepers on the list were classified to the horticultural industry.
The sampling methodology and questionnaire were cleared by the Commonwealth Statistical Clearing House (SCH). The SCH ensures surveys conducted by the Commonwealth are well designed and place minimum burden on respondents.
After collection, each sample point was assigned a weight to ensure estimates were representative of the full population of beekeepers.

6
2.2. Survey questionnaire
The 2008 survey of honeybee producers covered the following:
Pre-interview questions, to
o Determine eligibility and stratification level o Establish business structure and activities o Confirm address and location o Check availability of financial and production data.
Production details
o Honeybee related production for the survey year (2006-07 financial year). o Details of each type of product including quantity, sales, transfers, and stocks on hand.
Labour
o Family and hired labour. o Workers’ status in the operation, hours worked and wages paid. o Questions about operator and spouses education, off-farm work and government
assistance.
Assets
o Type and value of liquid assets (owned by or available to the business), land, vehicles, plant and equipment and buildings and other structural improvements used in the business.
Liabilities
o Type, purpose and value of debts.
Income and expenses
o All costs and income associated with the honeybee business.
Supplementary survey questions
o Covering a range of issues including: public land access, provision of pollination services, challenges facing the industry and the importance of information sources. A copy of the supplementary questionnaire is included at Appendix 10.3.
7
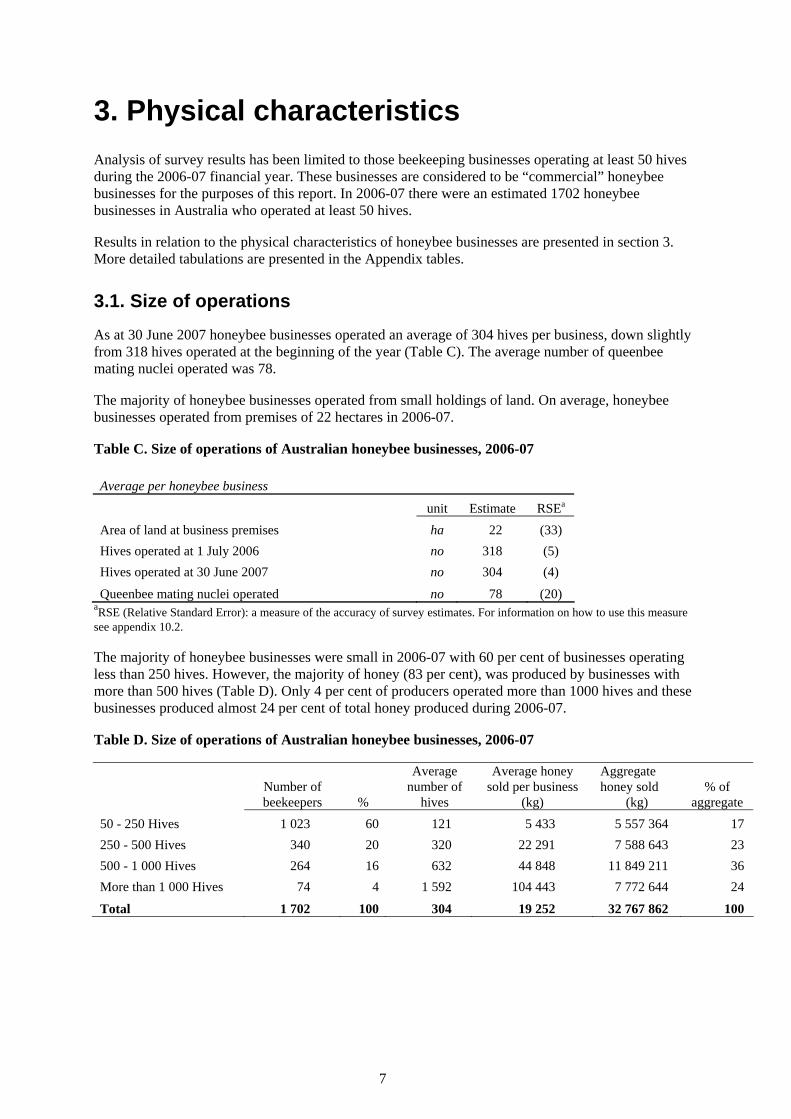
3. Physical characteristics Analysis of survey results has been limited to those beekeeping businesses operating at least 50 hives during the 2006-07 financial year. These businesses are considered to be “commercial” honeybee businesses for the purposes of this report. In 2006-07 there were an estimated 1702 honeybee businesses in Australia who operated at least 50 hives.
Results in relation to the physical characteristics of honeybee businesses are presented in section 3. More detailed tabulations are presented in the Appendix tables.
3.1. Size of operations
As at 30 June 2007 honeybee businesses operated an average of 304 hives per business, down slightly from 318 hives operated at the beginning of the year (Table C). The average number of queenbee mating nuclei operated was 78.
The majority of honeybee businesses operated from small holdings of land. On average, honeybee businesses operated from premises of 22 hectares in 2006-07.
Table C. Size of operations of Australian honeybee businesses, 2006-07
Average per honeybee business
unit Estimate RSEa Area of land at business premises ha 22 (33) Hives operated at 1 July 2006 no 318 (5) Hives operated at 30 June 2007 no 304 (4)
Queenbee mating nuclei operated no 78 (20) aRSE (Relative Standard Error): a measure of the accuracy of survey estimates. For information on how to use this measure see appendix 10.2.
The majority of honeybee businesses were small in 2006-07 with 60 per cent of businesses operating less than 250 hives. However, the majority of honey (83 per cent), was produced by businesses with more than 500 hives (Table D). Only 4 per cent of producers operated more than 1000 hives and these businesses produced almost 24 per cent of total honey produced during 2006-07.
Table D. Size of operations of Australian honeybee businesses, 2006-07
Number of beekeepers %
Average number of
hives
Average honey sold per business
(kg)
Aggregate honey sold
(kg) % of
aggregate 50 - 250 Hives 1 023 60 121 5 433 5 557 364 17 250 - 500 Hives 340 20 320 22 291 7 588 643 23 500 - 1 000 Hives 264 16 632 44 848 11 849 211 36 More than 1 000 Hives 74 4 1 592 104 443 7 772 644 24
Total 1 702 100 304 19 252 32 767 862 100

8
In South Australia and Northern New South Wales the majority of honeybee businesses operated at least 250 hives (Figure 1). However, the majority of honeybee businesses in Victoria, Queensland, Western Australia, Tasmania and southern New South Wales operated less than 250 hives. While around 70 per cent of Tasmanian honeybee businesses operated less than 250 hives, the state also had the highest proportion of honeybee businesses operating in excess of 1000 hives.
Figure 1. Size of operations of Australian honeybee businesses, 2006-07
0%
20%
40%
60%
80%
100%
Northern NSW Southern NSW Victoria Queensland South Australia Western Australia Tasmania
50 - 250 Hives 250 - 500 Hives 500 - 1000 Hives More than 1000 Hives
Tasmanian businesses were the largest, operating around 410 hives per business and selling around 37.4 tonnes of honey on average. However, Tasmanian businesses accounted for only 4 per cent of national honey production (Table E). On average, southern New South Wales honeybee businesses were also relatively large and just under one-quarter of all honey sold during 2006-07 was produced from this region. While Western Australian honeybee businesses operated the smallest number of hives on average, they sold the fourth largest tonnage of honey on average.
Table E. Size of operations of Australian honeybee businesses, 2006-07
Number of beekeepers
Average number of hives
Average honey sold per business (kg)
% of national honey sold
Tasmania 32 410 37 423 4 Southern NSW 300 367 25 399 23 South Australia 192 330 32 402 19 Northern NSW 364 319 14 499 16 Queensland 374 276 11 823 14 Victoria 338 262 16 485 17
Western Australia 95 236 25 068 7

9
3.2. Production
In 2006-07, Australian honeybee businesses produced an average of 18 300 kilograms of honey and sold 19 300 kilograms of honey (Table F). Stocks of honey fell from 5800 kilograms on average at 1 July 2006 to 5200 kilograms at 30 June 2007. The reduction in honey stocks was because of low production levels and high domestic and world demand. In addition, some beekeepers purchased honey, possibly to increase the range of floral honey types for sale.
For the honeybee businesses that sold queenbees, there was an average of 551 queenbees sold during 2006-07.
Table F. Honey production, 2006-07
Average per honeybee business
unit Estimate RSEb Opening stock of honey kg 5 837 (17) Quantity purchased kg 493 (74) Quantity produced kg 18 295 (7) Quantity given away kg 173 (28) Quantity of honey solda kg 19 252 (7)
Closing stock of honey kg 5 200 (18)
Queenbees soldc no 551 (67) aquantity sold includes transfers out bRSE: Relative Standard Error as a measure of the accuracy of survey estimates. For more information see appendix 10.2 cestimate based only on those who sold queenbees Around 40 per cent of honey was produced from floral resources in New South Wales with an equal share from both the southern and northern regions of the state (Figure 2). Less than 5 per cent of honey was derived from Tasmania and around 6 per cent from Western Australian sources.
Figure 2. Share of honey production from regional floral resources, 2006-07
0
5
10
15
20
25
Queensland Southern NSW Northern NSW Victoria South Australia Western Australia Tasmania
%

10
On average, honeybee businesses in Tasmania produced the largest quantity of honey, at around 35 tonnes per business (Figure 3). South Australian businesses also produced a relatively large quantity of honey, 32 tonnes per business on average. On the other hand, Queensland and northern New South Wales honeybee businesses produced a relatively small amount of honey per business, despite not being ranked the smallest business in terms of average number of hives operated.
Small producers operating less than 250 hives produced around 5 tonnes of honey on average compared to 103 tonnes per business for those operating in excess of 1000 hives.
Respondents were asked what their honey production was during a normal year, and the average honey production per business was below normal in all states apart from South Australia during 2006-07 reflecting drought conditions during the year (Appendix table 10.5.2).
Figure 3. Honey production, 2006-07
Average per honeybee business
0
20
40
60
80
100
120
Tasman
ia
South
Austra
lia
Wester
n Aus
tralia
Southe
rn NSW
Austra
lia
Victori
a
Northe
rn NSW
Queen
sland
50 - 2
50 H
ives
250 -
500 H
ives
500 -
1000
Hive
s
More th
an 10
00 H
ives
kg ('
000)
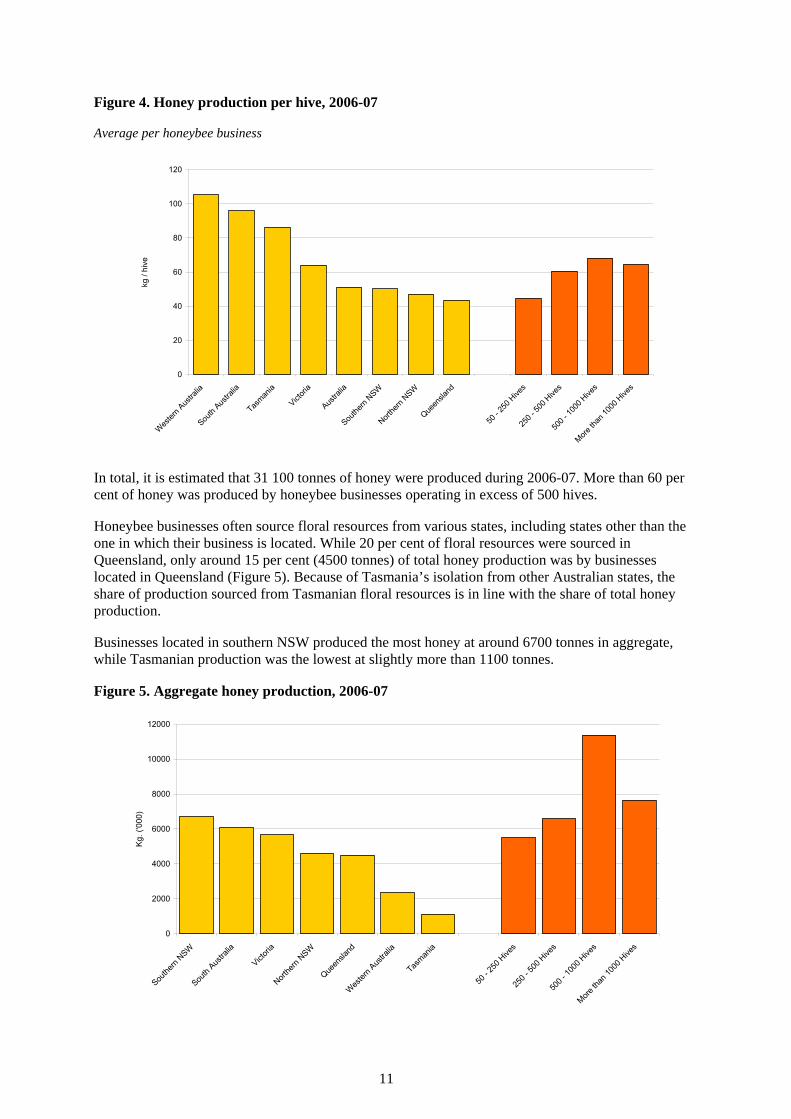
Nationally, an average of 51 kilograms of honey were produced per hive operated (Figure 4). Western Australian and Southern Australian honeybee businesses on average produced 105 and 96 kilograms of honey per hive respectively, while Queensland and northern NSW honeybee businesses had the smallest honey production per hive. Honeybee businesses operating in excess of 500 hives produced more honey per hive than did smaller businesses.
11
Figure 4. Honey production per hive, 2006-07
Average per honeybee business
0
20
40
60
80
100
120
Wes
tern A
ustra
lia
South
Austra
lia
Tasman
ia
Victori
a
Austra
lia
Southe
rn NSW
Northe
rn NSW
Queen
sland
50 - 2
50 H
ives
250 -
500 H
ives
500 -
1000
Hive
s
More th
an 10
00 H
ives
kg /
hive
In total, it is estimated that 31 100 tonnes of honey were produced during 2006-07. More than 60 per cent of honey was produced by honeybee businesses operating in excess of 500 hives.
Honeybee businesses often source floral resources from various states, including states other than the one in which their business is located. While 20 per cent of floral resources were sourced in Queensland, only around 15 per cent (4500 tonnes) of total honey production was by businesses located in Queensland (Figure 5). Because of Tasmania’s isolation from other Australian states, the share of production sourced from Tasmanian floral resources is in line with the share of total honey production.
Businesses located in southern NSW produced the most honey at around 6700 tonnes in aggregate, while Tasmanian production was the lowest at slightly more than 1100 tonnes.
Figure 5. Aggregate honey production, 2006-07
0
2000
4000
6000
8000
10000
12000
Southe
rn NSW
South
Austra
lia
Victori
a
Northe
rn NSW
Queen
sland
Wes
tern A
ustra
lia
Tasman
ia
50 - 2
50 H
ives
250 -
500 H
ives
500 -
1000
Hive
s
More th
an 10
00 H
ives
Kg.
('00
0)
12
3.3. Socioeconomic and business structure
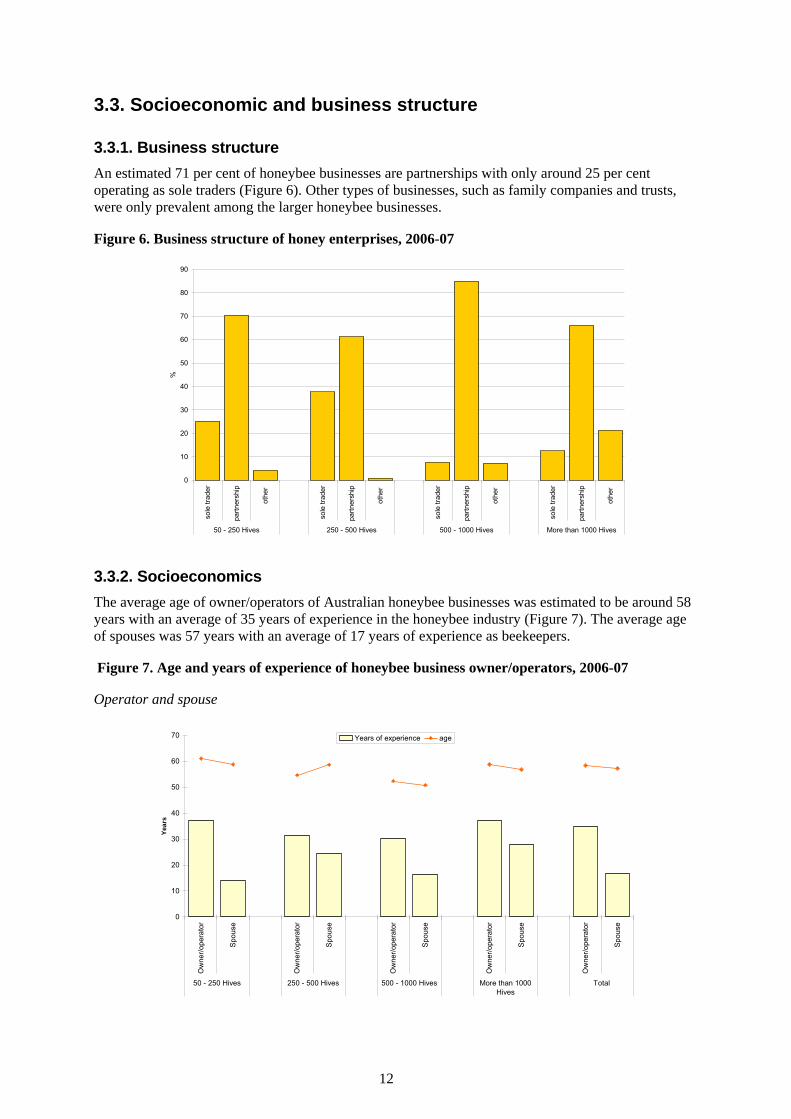
3.3.1. Business structure An estimated 71 per cent of honeybee businesses are partnerships with only around 25 per cent operating as sole traders (Figure 6). Other types of businesses, such as family companies and trusts, were only prevalent among the larger honeybee businesses.
Figure 6. Business structure of honey enterprises, 2006-07
0
10
20
30
40
50
60
70
80
90
sole
trad
er
partn
ersh
ip
othe
r
sole
trad
er
partn
ersh
ip
othe
r
sole
trad
er
partn
ersh
ip
othe
r
sole
trad
er
partn
ersh
ip
othe
r
50 - 250 Hives 250 - 500 Hives 500 - 1000 Hives More than 1000 Hives
%
3.3.2. Socioeconomics The average age of owner/operators of Australian honeybee businesses was estimated to be around 58 years with an average of 35 years of experience in the honeybee industry (Figure 7). The average age of spouses was 57 years with an average of 17 years of experience as beekeepers.
Figure 7. Age and years of experience of honeybee business owner/operators, 2006-07
Operator and spouse
0
10
20
30
40
50
60
70
Ow
ner/o
pera
tor
Spou
se
Ow
ner/o
pera
tor
Spou
se
Ow
ner/o
pera
tor
Spou
se
Ow
ner/o
pera
tor
Spou
se
Ow
ner/o
pera
tor
Spou
se
50 - 250 Hives 250 - 500 Hives 500 - 1000 Hives More than 1000Hives
Total
Year
s
Years of experience age

13
A high proportion (around 45 per cent) of owner/operators of honeybee businesses and their spouses had less than Year 11 as their formal educational attainment (Figure 8). This is a significantly higher proportion than for the agricultural sector where only around 30 per cent of owner/operators had less than Year 11 as their formal educational attainment (ABARE, 2008). To some extent the high proportion of owner/operators with formal education of less than Year 11 is a reflection of the age of many operators. Many operators would have completed schooling when the mandatory school-leaving age was less than 17.
Around 17 per cent of owner/operators and 21 per cent of spouses had university degree qualification.
Figure 8. Educational attainment of operators and spouses, 2006-07
0
5
10
15
20
25
30
35
40
45
50
Year 10 orless
Year 11 or 12 Tafe Degree Year 10 orless
Year 11 or 12 Tafe Degree
Operator educational attainment Spouse educational attainment
%
Income earned outside the honeybee business by the business operator and their spouse was estimated to be on average $28 000 in 2006-07 (Figure 9). The majority of this was comprised of wages/salaries and other income including income from other businesses or investments. On average beekeepers received around $3000 in government sourced payments and allowances including family allowance and child-care assistance. The owner/operator and spouse of businesses operating fewer hives received more income from other sources than those operating larger honeybee businesses.
Figure 9. Non-honeybee business income of owner/operator and spouse, 2006-07
Average per business including operator and spouse income
0
5
10
15
20
25
30
35
40
50 - 250 Hives 250 - 500 Hives 500 - 1000 Hives More than 1000 Hives Total
$ ('0
00)
wages/salaries Other income Government assistance income

14
4. Financial performance The following sections present results relating to the financial performance of Australian beekeeping businesses during 2006-07. A comparison of financial performance in 2006-07 to that recorded for 2000-01 is undertaken in Section 9 of the report.
4.1. Receipts and costs estimates
During 2006-07, Australian honeybee businesses received on average an estimated $71 400 per business in total cash receipts of which $54 300 were from the sale of honey (Figure 10). Tasmania had the highest average cash receipts at just less than $166 000 per business and Queensland businesses had the smallest average cash receipts at $55 400 per business.
Honeybee businesses operating less than 250 hives had a diverse source of business cash receipts, with only around 65 per cent of their receipts coming from honey sales compared to 74 per cent for businesses operating more than 1000 hives.
Other major sources of cash receipts included receipts from the sale of propolis, wax and honeycomb, queenbees and receipts from providing pollination services.
Figure 10. Total cash receipts, 2006-07
Average per honeybee business
0
50
100
150
200
250
300
350
400
450
Tasman
ia
South
Austra
lia
Wes
tern A
ustra
lia
Austra
lia
New S
outh
Wale
s
Victori
a
Queen
sland
50 - 2
50 H
ives
250 -
500 H
ives
500 -
1000
Hive
s
More th
an 10
00 H
ives
T
$ ('0
00)
Honey receipts Other receipts

15
The average price received by honeybee businesses for honey sold during 2006-07 was $2.80 per kilogram (Figure 11). Tasmanian honeybee businesses received the highest price on average for their honey at $4.20 per kilogram. This is because of the higher price received for leatherwood honey which accounts for a substantial proportion of Tasmanian production and the high proportion of Tasmanian producers who undertake their own honey packaging. South Australia and Western Australia received the lowest prices, around $2.50 per kilogram on average.
Figure 11. Average price received per kilogram of honey sold, 2006-07
Average per honeybee businessa
0.0
0.5
1.0
1.5
2.0
2.5
3.0
3.5
4.0
4.5
Tasman
ia
Victori
a
Queen
sland
New S
outh
Wale
s
Austra
lia
South
Austra
lia
Wester
n Aus
tralia
50 - 2
50 H
ives
250 -
500 H
ives
500 -
1000
Hive
s
More th
an 10
00 H
ives
$/kg
aincludes producers who sold direct to retail, in markets, and for export as well as to processors/honey packers.
Total cash costs were on average around $45 900 per business during 2006-07 with Tasmanian beekeepers spending the most at $113 100 per business (Figure 12). Businesses in New South Wales had the lowest average expenditure at $40 500 per business.
Figure 12. Total cash costs, 2006-07
Average per honeybee business
0
50
100
150
200
250
300
Tasman
ia
South
Austra
lia
Wes
tern A
ustra
lia
Austra
lia
Queen
sland
Victori
a
New S
outh
Wale
s
50 - 2
50 H
ives
250 -
500 H
ives
500 -
1000
Hive
s
More th
an 10
00 H
ives
$ ('0
00)
16
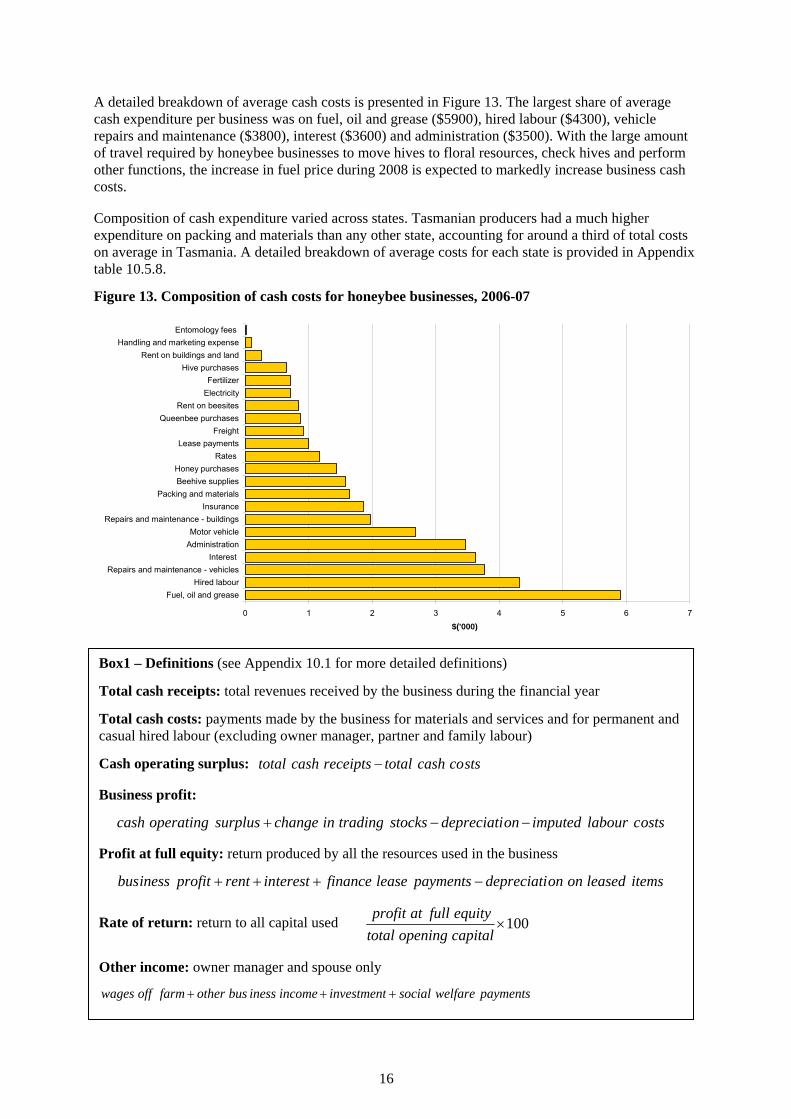
A detailed breakdown of average cash costs is presented in Figure 13. The largest share of average cash expenditure per business was on fuel, oil and grease ($5900), hired labour ($4300), vehicle repairs and maintenance ($3800), interest ($3600) and administration ($3500). With the large amount of travel required by honeybee businesses to move hives to floral resources, check hives and perform other functions, the increase in fuel price during 2008 is expected to markedly increase business cash costs.
Composition of cash expenditure varied across states. Tasmanian producers had a much higher expenditure on packing and materials than any other state, accounting for around a third of total costs on average in Tasmania. A detailed breakdown of average costs for each state is provided in Appendix table 10.5.8.
Figure 13. Composition of cash costs for honeybee businesses, 2006-07
0 1 2 3 4 5 6 7
Fuel, oil and greaseHired labour
Repairs and maintenance - vehiclesInterest
AdministrationMotor vehicle
Repairs and maintenance - buildingsInsurance
Packing and materialsBeehive suppliesHoney purchases
Rates Lease payments
FreightQueenbee purchases
Rent on beesitesElectricityFertilizer
Hive purchasesRent on buildings and land
Handling and marketing expenseEntomology fees
$('000)
Box1 – Definitions (see Appendix 10.1 for more detailed definitions)
Total cash receipts: total revenues received by the business during the financial year
Total cash costs: payments made by the business for materials and services and for permanent and casual hired labour (excluding owner manager, partner and family labour)
Cash operating surplus: stscocashtotalreceiptscashtotal −
Business profit:
ostsclabourimputedondepreciatistockstradinginchangesurplusoperatingcash −−+
Profit at full equity: return produced by all the resources used in the business
itemsleasedonondepreciatipaymentsleasefinanceterestinrentprofitinessbus −+++
Rate of return: return to all capital used 100×capitalopeningtotalequityfullatprofit
Other income: owner manager and spouse only
paymentswelfaresocialinvestmentincomeinessbusotherfarmoffwages +++

17
4.2. Financial performance
During 2006-07, honeybee businesses generated an average cash operating surplus (total cash receipts less total cash costs) of $25 500 per business (Table G). Tasmanian businesses had the highest cash operating surplus averaging more than $52 800 per business while Queensland businesses averaged only $12 200. In part, the higher average cash operating surplus in Tasmania reflects the larger scale of operations of Tasmanian honeybee businesses.
Only Tasmanian and Western Australian honeybee businesses generated a positive profit at full equity, in 2006-07 (Table G). Profit at full equity is a measure of business profitability that takes account of the value of all unpaid labour inputs by family and partners (imputed labour), the requirement to replace business capital over time and the change in trading stocks. It also adjusts profitability for all businesses as if they fully owned all capital used in the business.
The average rate of return, excluding capital appreciation, was -3.0 per cent in 2006-07. Although South Australia had the second largest average cash operating surplus at $42 700, South Australian businesses had relatively high imputed labour costs and depreciation costs leading to a -0.4 per cent rate of return.
Larger businesses generated a higher level of average cash operating surplus and generated the highest average rates of return.
Table G. Financial performance, 2006-07
Average per honeybee business
Total cash receipts
($)
Total cash costs ($)
Cash operating surplus
($)
Profit at full equity
($)
Rate of return (%)
New South Wales 68 477 40 510 27 966 -26 128 -5.0 Victoria 62 552 42 375 20 178 -11 577 -2.5 Queensland 55 439 43 239 12 200 -23 163 -3.5 South Australia 103 700 61 000 42 700 -3 446 -0.4 Western Australia 87 284 52 908 34 376 99 0.0 Tasmania 165 926 113 120 52 806 8 532 1.3 Australia 71 386 45 860 25 526 -17 971 -3.0 50 - 250 Hives 24 343 19 757 4 587 -24 440 -4.7 250 - 500 Hives 77 375 46 224 31 151 -27 297 -4.4 500 - 1 000 Hives 144 199 87 933 56 266 -778 -0.1 More than 1 000 Hives 412 328 242 654 169 673 49 887 4.8

18
4.3. Cost of production
Accurate estimation of the unit cost of producing honey requires very detailed cost information with cost items disaggregated according to their contribution to the cost of producing particular outputs such as honey, queenbees, pollination services etc. Alternatively, sophisticated statistical techniques may be employed to partition costs applicable to various outputs.
In the following section, a simple analysis of the unit costs of production from honeybee businesses has been undertaken using the 2006-07 survey data to provide a rough guide to the range of unit production costs. Production cost is presented per hive and per kilogram of honey produced.
To approximate the costs associated with running and producing outputs from a hive, total costs were divided by number of hives. Total costs used in this analysis exclude costs associated with packing so as to compare all businesses on the same basis.
To ensure costs relate only to honey and other bee-related production (i.e. production from hives) only specialist honeybee producers’ data were used to estimate the costs of production of honey and honeybee related products.
During 2006-07, the average cost of operating a hive was $284 (Table H). This estimate takes into account imputed labour and depreciation. Smaller businesses generally had a higher cost of production on average. Tasmanian and Victorian businesses had the highest cost of production per hive at $313 on average.
Table H. Cost of production per hive for specialist honey producers, 2006-07
Average per honeybee businessa
Cash cost per hive (excludes imputed labourb costs and
depreciation) ($)
Cost per hive including imputed
labourb costs ($)
Total cost per hive including imputed labourb costs and
depreciation ($)
New South Wales 88 203 261 Queensland 129 226 302 Victoria 152 252 313 South Australia 92 201 264 Western Australia 153 274 340 Tasmania 182 230 313 Australia 114 221 284 50-250 hives 109 279 378 250-500 hives 135 275 336 500-1 000 hives 86 156 201 More than 1 000 hives 140 187 228 aspecialist honeybee businesses are defined as those businesses whose receipts are entirely derived from honey-related activities such as honey sales, queenbee sales and pollination service provision. bimputed labour is the value of family and partner labour inputs to the business.

19
Calculation of the per kilogram cost of honey production was taken from the survey data by apportioning costs on the basis of the share of business receipts accounted for by honey. The average total cost to produce a kilogram of honey, including family and partner labour and depreciation costs was $4.90. The average total cost of production was lower for larger producers (Table I).
Table I. Cost of production per kg of honey produced for specialist honey producers, 2006-07
Average per honeybee businessa
Cash cost per kg of honey (excludes imputed labourb
costs and depreciation) ($)
Cost per kg of honey including imputed
labourb costs ($)
Total cost per kg of honey including imputed labourb costs
and depreciation ($)
New South Wales 2.0 4.9 6.3 Queensland 2.7 5.3 7.3 Victoria 2.3 4.0 5.0 South Australia 0.8 2.0 2.6 Western Australia 1.8 3.5 4.4 Tasmania 1.9 2.4 3.4 Australia 1.8 3.7 4.9 50-250 hives 2.6 6.8 9.2 250-500 hives 1.8 4.3 5.3 500-1 000 hives 1.3 2.4 3.2 More than 1 000 hives 1.8 2.5 3.1 aspecialist honeybee businesses are defined as those businesses whose receipts are entirely derived from honey-related activities such as honey sales, queenbee sales and pollination service provision. bimputed labour is the value of family and partner labour inputs to the business.

20
4.4. Capital and debt
The total capital value of honeybee business was estimated to average $610 000 per honeybee business at 30 June 2007 (Figure 14). This capital does not include the owner/operators house. South Australian businesses had the highest average capital value at $966 000. In contrast, northern New South Wales businesses had the lowest capital values, at just $442 000 on average per business.
Figure 14. Total business capital, 2006-07
Average per honeybee business
0
200
400
600
800
1000
1200
South
Austra
lia
Wes
tern A
ustra
lia
Queen
sland
Tasman
ia
Southe
rn NSW
Austra
lia
Victori
a
Northe
rn NSW
50 - 2
50 H
ives
250 -
500 H
ives
500 -
1000
Hive
s
More th
an 10
00 H
ives
$ (0
00's
)
The majority of total capital value is derived from land and fixed improvements in all states and for all business sizes (Figure 15). Fixed improvements include honey extraction plant and packing sheds as well as other buildings. Businesses operating in excess of 1000 hives had a larger proportion of capital value accounted for by hives than smaller businesses. Tasmanian honeybee businesses had a smaller proportion of their total capital value made up of land and fixed improvements and a higher proportion of total capital in the form of honey stocks as well as other plant and equipment, particularly honey packing equipment. This reflects a higher proportion of Tasmanian businesses involved in packing honey.

21
Figure 15. Composition of capital value, 2006-07
Average per honeybee business
0
10
20
30
40
50
60
70
80
90
100
South
Austra
lia
Wes
tern A
ustra
lia
Queen
sland
Austra
lia
Southe
rn NSW
Victori
a
Northe
rn NSW
Tasman
ia
50 - 2
50 H
ives
250 -
500 H
ives
500 -
1000
Hive
s
More th
an 10
00 H
ives
%
Land and fixed improvements Honey stocks Hive stocks
Honeybee businesses on average had debt of $93 300 per business at 30 June 2007 (Figure 16). The average debt was much higher for those businesses operating in excess of 1000 hives at around $133 000.
Equity ratios for honeybee businesses were on average around 87 per cent at 30 June 2007. Smaller businesses had a slightly lower equity ratio on average at 85 per cent. Medium and large sized enterprises, operating more than 500 hives, had the highest equity ratios averaging around 88 per cent.
Figure 16. Total business debt and equity ratio, 2006-07
Average per honeybee business
0
20
40
60
80
100
120
140
50 - 250 Hives 250 - 500 Hives 500 - 1000 Hives More than 1000 Hives Total
$ ('0
00)
70%
75%
80%
85%
90%
95%
100%
Total debt closed equity ratio

22
5. Pollination services Pollination by honeybees plays an important role in Australian agriculture with an estimated 65 per cent of agricultural production relying to some extent on it (Valuing honeybee pollination, 2003). Pollination is essential for some crops, while for many others it increases yields and leads to higher quality produce. It is particularly important for crops such as almonds, some stone fruit and seed for crops.
While some pollination occurs as a result of feral honeybees or native bees, some agricultural producers use the services of honeybee businesses through the process of placing hives close to their crops. Some honeybee businesses do not receive payment for providing pollination services because of the mutual benefits where honeybees have access to an abundant floral resource to generate honey. An estimated 28 per cent of honeybee business provided pollination services of some type and more than three-quarters of these businesses received payment for the pollination services during 2006-07 (Table J).
Providing pollination services varies widely both between and within states depending on the types of crops grown. In northern New South Wales only 4 per cent of honeybee businesses are estimated to have provided pollination services in 2006-07, while in South Australia around 52 per cent of honeybee businesses provided pollination services.
All honeybee businesses surveyed in Tasmania, Victoria and Western Australia received payment for providing pollination services. In northern New South Wales, however, only 32 per cent of those providing pollination services received payment.
Table J. Pollination service provision, 2006-07
Proportion of honeybee businesses providing pollination services
(%)
Number of businesses providing pollination services
Number of businesses receiving payment for
pollination services
Proportion of businesses receiving
payment for pollination services
(%) South Australia 52 100 66 66 Tasmania 47 15 15 100 Victoria 39 132 132 100 Queensland 29 107 62 58 Western Australia 35 33 33 100 Southern NSW 26 78 51 65 Northern NSW 4 16 5 32
Total 28 481 363 76
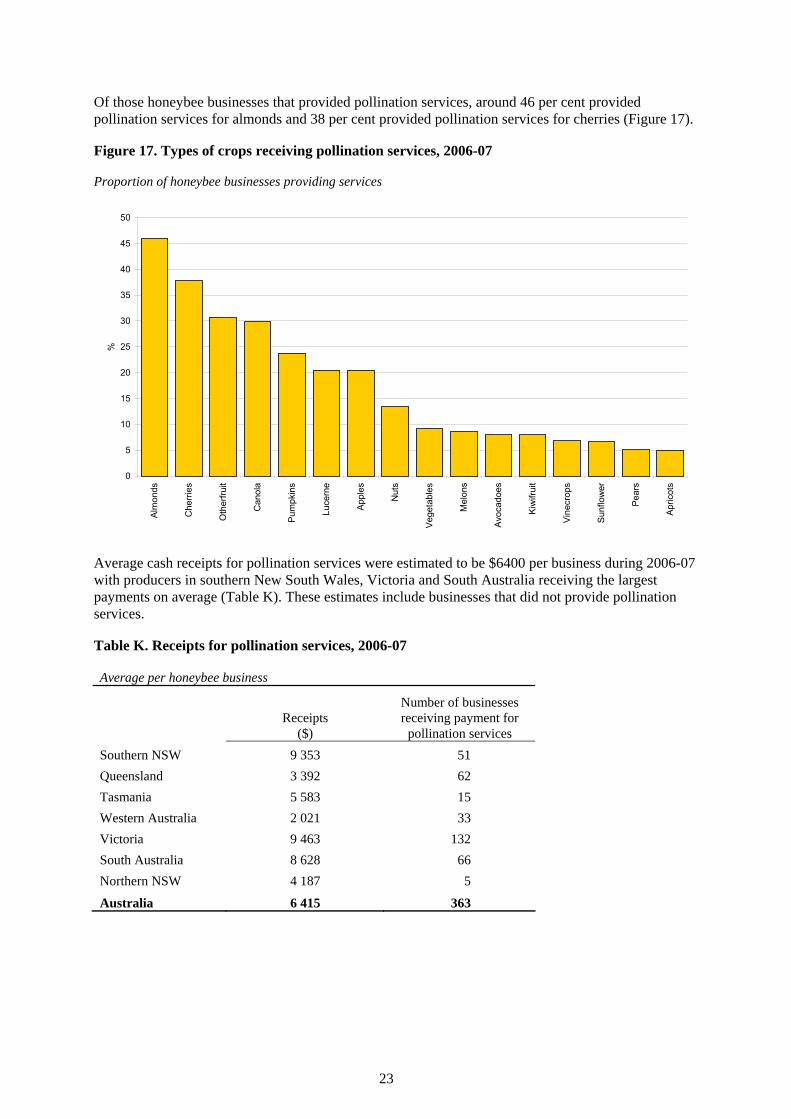
23
Of those honeybee businesses that provided pollination services, around 46 per cent provided pollination services for almonds and 38 per cent provided pollination services for cherries (Figure 17).
Figure 17. Types of crops receiving pollination services, 2006-07
Proportion of honeybee businesses providing services
0
5
10
15
20
25
30
35
40
45
50
Alm
onds
Che
rrie
s
Oth
erfru
it
Can
ola
Pum
pkin
s
Luce
rne
Appl
es
Nut
s
Vege
tabl
es
Mel
ons
Avo
cado
es
Kiw
ifrui
t
Vine
crop
s
Sunf
low
er
Pear
s
Apric
ots
%
Average cash receipts for pollination services were estimated to be $6400 per business during 2006-07 with producers in southern New South Wales, Victoria and South Australia receiving the largest payments on average (Table K). These estimates include businesses that did not provide pollination services.
Table K. Receipts for pollination services, 2006-07
Average per honeybee business
Receipts
($)
Number of businesses receiving payment for
pollination services Southern NSW 9 353 51 Queensland 3 392 62 Tasmania 5 583 15 Western Australia 2 021 33 Victoria 9 463 132 South Australia 8 628 66 Northern NSW 4 187 5
Australia 6 415 363

24
Beekeepers’ ability and willingness to expand the provision of pollination services in the future is of particular interest because of concerns that the Varroa mite may find its way to Australia. Infestations of the Varroa mite overseas have resulted in the majority of the feral honeybee population being wiped out. Given that many of Australia’s agricultural producers still rely on feral honeybees to pollinate their crops, it is important that should such an event occur, honeybee businesses are able to expand their pollination services as a substitute.
According to the 2006-07 survey, an estimated 36 per cent of Australian producers are expecting to commence or expand pollination services in the future (Figure 18). A higher percentage of honeybee businesses in Queensland, Victoria and South Australia reported they expected to expand pollination services, while the percentage was lower in New South Wales.
Figure 18. Honeybee businesses expecting to expand/commence pollination services, 2006-07
0
10
20
30
40
50
60
Queensland Victoria South Australia Tasmania Australia WesternAustralia
Southern NSW Northern NSW
%
Proportion expecting to expand/commence pollination services
In the next five years, honeybee businesses expecting to expand pollination services, estimated that they would be using around 560 hives to provide pollination services, up from the 400 they expected to use in the next two years (Table L).
Table L. Expansion of pollination services, 2006-07
Average for businesses expecting to expand pollination services
No. of hives Hives operated at 30 June 2007 422 Expected to be used for pollination services in the next two years 397
Expected to be used for pollination services in the next five years 558

25
The incentive for honeybee businesses to expand their provision of pollination services is not currently strong. Some 40 per cent of honeybee businesses indicated that low prices paid for pollination was a factor limiting the decision to expand or commence pollination services (Figure 19). Other factors reported to limit honeybee businesses’ ability to expand pollination services are physical constraints and the difficulty involved in providing the service.
Figure 19. Factors influencing the decision to expand/commence pollination services, 2006-07
Proportion of honeybee businesses
0
5
10
15
20
25
30
35
40
45
Knowledge andexperience constraints
Financial constraints Additional infrastructureor assets needed
Physical constraints Too hard Prices too low
%

26
6. Public land access An estimated 66 per cent of honeybee businesses used public land for honey production in the past five years ranging from 100 per cent for Tasmanian and northern New South Wales businesses to 22 per cent for South Australian businesses (Figure 20). Over this time, around 20 per cent of businesses decreased their usage of public land, while 14 per cent increased usage and 33 per cent made no change. The low level of public land usage in South Australia is a result of limited availability of public land and favourable conditions for growing crops, such as lucerne. All honeybee businesses with more than 1000 hives reported using public land for honey production in the past five years, compared to only 54 per cent of honeybee businesses operating less than 250 hives (Figure 21). Some honeybee businesses are likely to have hives located on land which is close to public land. As such, use of public land may be higher than reported.
Figure 20. Use of public land for honey production over the past 5 years, by region, 2006-07 Proportion of honeybee businesses
0
10
20
30
40
50
60
70
80
90
100
Tasmania Northern NSW Victoria Queensland Australia Southern NSW WesternAustralia
SouthernAustralia
%
used public land Decreased usage Unchanged usage Increased usage
Figure 21. Use of public land for honey production over the past 5 years, by number of hives, 2006-07
Proportion of honeybee businesses
0
10
20
30
40
50
60
70
80
90
100
50 - 250 Hives 250 - 500 Hives 500 - 1000 Hives More than 1000 Hives
%
used public land Decreased usage Unchanged usage Increased usage
27
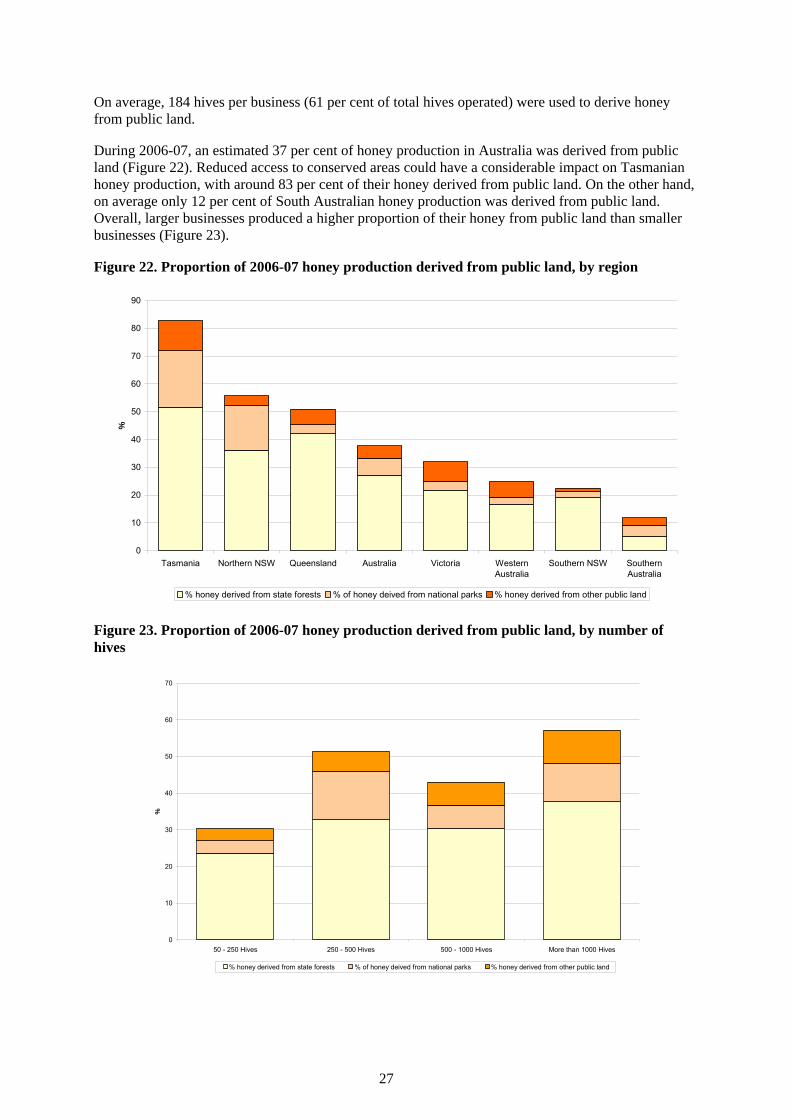
On average, 184 hives per business (61 per cent of total hives operated) were used to derive honey from public land.
During 2006-07, an estimated 37 per cent of honey production in Australia was derived from public land (Figure 22). Reduced access to conserved areas could have a considerable impact on Tasmanian honey production, with around 83 per cent of their honey derived from public land. On the other hand, on average only 12 per cent of South Australian honey production was derived from public land. Overall, larger businesses produced a higher proportion of their honey from public land than smaller businesses (Figure 23).
Figure 22. Proportion of 2006-07 honey production derived from public land, by region
0
10
20
30
40
50
60
70
80
90
Tasmania Northern NSW Queensland Australia Victoria WesternAustralia
Southern NSW SouthernAustralia
%
% honey derived from state forests % of honey deived from national parks % honey derived from other public land
Figure 23. Proportion of 2006-07 honey production derived from public land, by number of hives
0
10
20
30
40
50
60
70
50 - 250 Hives 250 - 500 Hives 500 - 1000 Hives More than 1000 Hives
%
% honey derived from state forests % of honey deived from national parks % honey derived from other public land
28
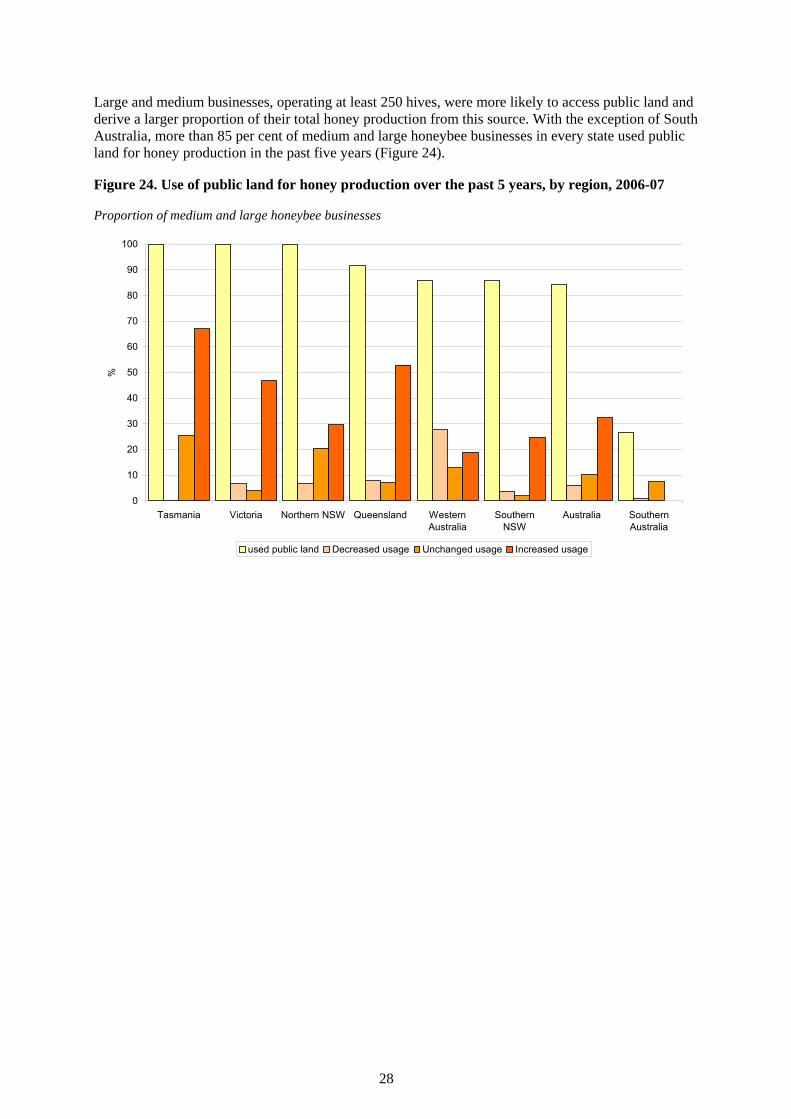
Large and medium businesses, operating at least 250 hives, were more likely to access public land and derive a larger proportion of their total honey production from this source. With the exception of South Australia, more than 85 per cent of medium and large honeybee businesses in every state used public land for honey production in the past five years (Figure 24).
Figure 24. Use of public land for honey production over the past 5 years, by region, 2006-07
Proportion of medium and large honeybee businesses
0
10
20
30
40
50
60
70
80
90
100
Tasmania Victoria Northern NSW Queensland WesternAustralia
SouthernNSW
Australia SouthernAustralia
%
used public land Decreased usage Unchanged usage Increased usage

29
7. Challenges facing the industry There are a number of challenges facing the honeybee industry which can impact on the quantity and quality of honey produced. These include:
• drought; • pesticide use; • tree dieback; • weed control; • access to conserved areas; • land clearance; • fire; • salinity; • flood damage; and • pests and diseases.
Among these, drought was reported as the most common challenge facing the industry with 87 per cent of beekeepers indicating that production was affected by drought (Figure 25). More than half of beekeepers indicated that pesticide use, tree dieback, weed control, conserved area access, land clearance and fire damage also impacted on production. However, salinity and flood damage on the other hand did not pose a problem for the majority of businesses.
Honeybee business operators indicated wax moth and chalkbrood impacted more on production than other pests and diseases, although the impact was generally to a relatively small extent. Few honeybee businesses were affected by sacbrood. While few honeybee businesses were affected by small hive beetle, around 22 per cent were affected to a large extent.
Figure 25. Challenges facing Australian beekeepers, 2006-07
Proportion of honeybee businesses
0
10
20
30
40
50
60
70
80
90
100
Dro
ught
Con
trol o
f wee
ds
Tree
/bus
h di
ebac
k
Use
of p
estic
ides
Acce
ss to
con
serv
ed a
reas
Land
cle
aran
ce Fire
Salin
ity
Floo
d da
mag
e
Wax
mot
h
Cha
lk b
rood
Nos
ema
Euro
pean
foul
broo
d
Smal
l hiv
e be
etle
Am
eric
an fo
ulbr
ood
Sac
broo
d
Resource base risks Pests and diseases
Small extent Great extent

30
7.1. Floral resource base
The impact of drought on honey and bee-related production varied across states. More than 90 per cent of honeybee businesses in New South Wales and Queensland are estimated to have been affected by drought to some extent. This compares with only around 52 per cent of businesses affected by drought in Tasmania (Figure 26).
Production in Tasmania was relatively unaffected by most of the challenges faced by producers in other states with drought and land clearance being the only factors impacting on the majority of honeybee businesses in this state.
Figure 26. Challenges facing honeybee businesses access to floral resources, by region, 2006-07
Proportion of honeybee businesses
0
10
20
30
40
50
60
70
80
90
100
Dro
ught
Use
of p
estic
ides
Acc
ess
to c
onse
rved
are
asC
ontro
l of w
eeds
Tree
/bus
h di
ebac
kLa
nd c
lear
ance Fire
Dro
ught
Con
trol o
f wee
dsTr
ee/b
ush
dieb
ack
Fire
Use
of p
estic
ides
Land
cle
aran
ceSa
linity
Dro
ught
Tree
/bus
h di
ebac
kFi
reA
cces
s to
con
serv
ed a
reas
Use
of p
estic
ides
Con
trol o
f wee
dsLa
nd c
lear
ance
Dro
ught
Land
cle
aran
ceU
se o
f pes
ticid
esTr
ee/b
ush
dieb
ack
Acc
ess
to c
onse
rved
are
asC
ontro
l of w
eeds Fire
Salin
ityFl
ood
dam
age
Use
of p
estic
ides
Con
trol o
f wee
dsD
roug
htTr
ee/b
ush
dieb
ack
Acc
ess
to c
onse
rved
are
asFi
reLa
nd c
lear
ance
Dro
ught
Fire
Use
of p
estic
ides
Tree
/bus
h di
ebac
kA
cces
s to
con
serv
ed a
reas
Land
cle
aran
ceC
ontro
l of w
eeds
Land
cle
aran
ceD
roug
htC
ontro
l of w
eeds
Fire
Use
of p
estic
ides
Tree
/bus
h di
ebac
k
Northern NSW Southern NSW Victoria Queensland South Australia Western Australia Tasmania
%
Great extent Small extent

31
7.2. Pests and diseases
The pests and diseases which impacted on production during 2006-07 are presented in Figure 27. Small hive beetle is estimated to have impacted on honey production for almost 100 per cent of producers in northern New South Wales. It also impacted on production in southern New South Wales, Queensland and South Australia. Nosema and European foulbrood also impacted on a large proportion of producers.
Once again, Tasmanian beekeeping businesses were relatively unaffected by pests and diseases during 2006-07.
Figure 27. Pests and diseases impacting on honey production, by region, 2006-07
Proportion of honeybee businesses
0
10
20
30
40
50
60
70
80
90
100
Sm
all h
ive
beet
leN
osem
aEu
rope
an fo
ulbr
ood
Cha
lk b
rood
Amer
ican
foul
broo
dW
ax m
oth
Sacb
rood
Wax
mot
hS
mal
l hiv
e be
etle
Euro
pean
foul
broo
dC
halk
bro
odAm
eric
an fo
ulbr
ood
Nos
ema
Wax
mot
hC
halk
bro
odN
osem
aEu
rope
an fo
ulbr
ood
Sacb
rood
Amer
ican
foul
broo
d
Wax
mot
hS
mal
l hiv
e be
etle
Nos
ema
Cha
lk b
rood
Amer
ican
foul
broo
dEu
rope
an fo
ulbr
ood
Sacb
rood
Nos
ema
Cha
lk b
rood
Wax
mot
hEu
rope
an fo
ulbr
ood
Amer
ican
foul
broo
dSa
cbro
odS
mal
l hiv
e be
etle
Wax
mot
hC
halk
bro
odAm
eric
an fo
ulbr
ood
Sacb
rood
Nos
ema
Amer
ican
foul
broo
dEu
rope
an fo
ulbr
ood
Cha
lk b
rood
Wax
mot
hN
osem
a
Northern NSW Southern NSW Victoria Queensland South Australia WesternAustralia
Tasmania
%
Great extent Small extent

32
8. Importance and availability of information for beekeepers The majority of honeybee business operators gather information from a wide range of sources (Figure 28). Around 94 per cent are estimated to have received at least some of their information from other beekeepers. Other key sources of information were government apiary staff (86 per cent), books on beekeeping (85 per cent), beekeeping associations (84 per cent), Australian Beekeeping and other association newsletters and journals (83 per cent) and research papers including RIRDC publications (78 per cent). Only around 43 per cent of honeybee business operators are estimated to have obtained information from the media.
Figure 28. Information sources of beekeepers, 2006-07
Proportion of honeybee businesses
0 10 20 30 40 50 60 70 80 90 100
Other beekeepers
Government apiary staff
Books on beekeeping
Beekeeping associations
ABK or association newsletters/journals
Research papers including RIRDC publications
Field days
Other beekeeping industry newsletters/magazines
Australian Honey Bee Industry Council
Internet
Manufacturers
Honey packers
Courses
Media
%
Topics on which honeybee business operators particularly sought information on were pests and diseases, nutrition, bee and hive health and pesticides (Figure 29).

33
Figure 29. Importance of information by topic, 2006-07
Proportion of honeybee businesses
0 10 20 30 40 50 60 70 80 90 100
Bee diseases and pests
Nutrition
Bee and hive health
Pesticides
Hive equipment
Commercial beekeeping
State regulations
Honey flora
Honey extraction packing and packaging
Marketing
Queen raising
Pollination
Seasonal management
Management systems
%

34
9. Financial performance compared to 2000-01 The financial performance of Australian honeybee businesses improved in 2006-07 relative to that recorded in a similar survey in 2000-01. Higher honey prices, in particular contributed to a rise in the average cash operating surplus per business.
In real terms (adjusted for inflation), the average price of honey received by honeybee businesses increased between 2000-01 and 2006-07 by 70 cents a kilogram largely because of drought induced supply shortages and a fall in overseas production (Figure 30).
Figure 30. Price received per kilogram of honey sold in 2000-01 and 2006-07
Average per honeybee business in 2006-07 dollars
0.0
0.5
1.0
1.5
2.0
2.5
3.0
3.5
4.0
4.5
Tasm
ania
Vict
oria
Que
ensl
and
New
Sou
th W
ales
Aust
ralia
Sou
th A
ustra
lia
Wes
tern
Aus
tralia
50 -
250
Hiv
es
250
- 500
Hiv
es
500
- 100
0 H
ives
Mor
e th
an 1
000
Hiv
es
$ / k
g (2
006-
07 d
olla
rs)
Average price of honey, 2000-01 Average price of honey, 2006-07
Because of higher prices received for honey sold, honey receipts increased on average by $15 500 per business and total cash receipts by $17 000 per business in real terms between 2000-01 and 2006-07 (Figure 31).

35
Figure 31. Cash receipts and honey receipts in 2000-01 and 2006-07
Average per honeybee business in 2006-07 dollars
0
10
20
30
40
50
60
70
80
Honey receipts Total cash receipts
$ ('0
00) 2
006-
07 d
olla
rs
2000-01 2006-07
Receipts from other major items did not change significantly between 2000-01 and 2006-07. The two exceptions were pollination receipts which grew by around $4000 per business (165 per cent) on average and other cash receipts which fell by around $2400 (Figure 32).
Figure 32. Cash receipts from other major items in 2000-01 and 2006-07
Average per honeybee business in 2006-07 dollars
0
1
2
3
4
5
6
7
Queenbee receipts Propolis,wax andhoneycomb receipts
Pollination receipts Wool receipts Crop receipts Other cash receipts
$ ('0
00) 2
006-
07 d
olla
rs
2000-01 2006-07

36
In real terms, average cash costs per business rose between 2001-02 and 2006-07 by more than $9700 driven largely by a rise in the costs associated with administration, fuel, oil and grease, interest payments and repairs and maintenance to buildings and vehicles (Figure 33).
Figure 33. Average cash costs in 2000-01 and 2006-07
Average per honeybee business in 2006-07 dollars
0
1
2
3
4
5
6
7
Adm
inis
tratio
n
Hon
ey p
urch
ases
Que
enbe
e pu
rcha
ses
Elec
trici
ty
Frei
ght
Fuel
, oil
and
grea
se
Insu
ranc
e
Inte
rest
Leas
e pa
ymen
ts
Beeh
ive
supp
lies
Mot
or v
ehic
le
Pac
king
and
mat
eria
ls
Rep
airs
and
mai
nten
ance
-bui
ldin
gs
Rep
airs
and
mai
nten
ance
-veh
icle
s
Rat
es
Hire
d la
bour
$ ('0
00) 2
006-
07 d
olla
rs
Costs, 2000-01 Costs, 2006-07
Increases in costs between 2000-01 and 2006-07 were more than offset by higher receipts from honey and pollination services and honeybee businesses are estimated to have recorded a 40 per cent increase in cash operating surplus (Figure 34).
Figure 34. Average cash operating surplus in 2000-01 and 2006-07
Average per honeybee business in 2006-07 dollars
0
20
40
60
80
100
120
140
160
180
Tasm
ania
Sout
h Au
stra
lia
Wes
tern
Aus
tralia
New
Sou
th W
ales
Aust
ralia
Vict
oria
Que
ensl
and
50 -
250
Hiv
es
250
- 500
Hiv
es
500
- 100
0 H
ives
Mor
e th
an 1
000
Hiv
es
$ ('0
00) 2
006-
07 d
olla
rs
Farm cash income, 2000-01 Farm cash income, 2006-07
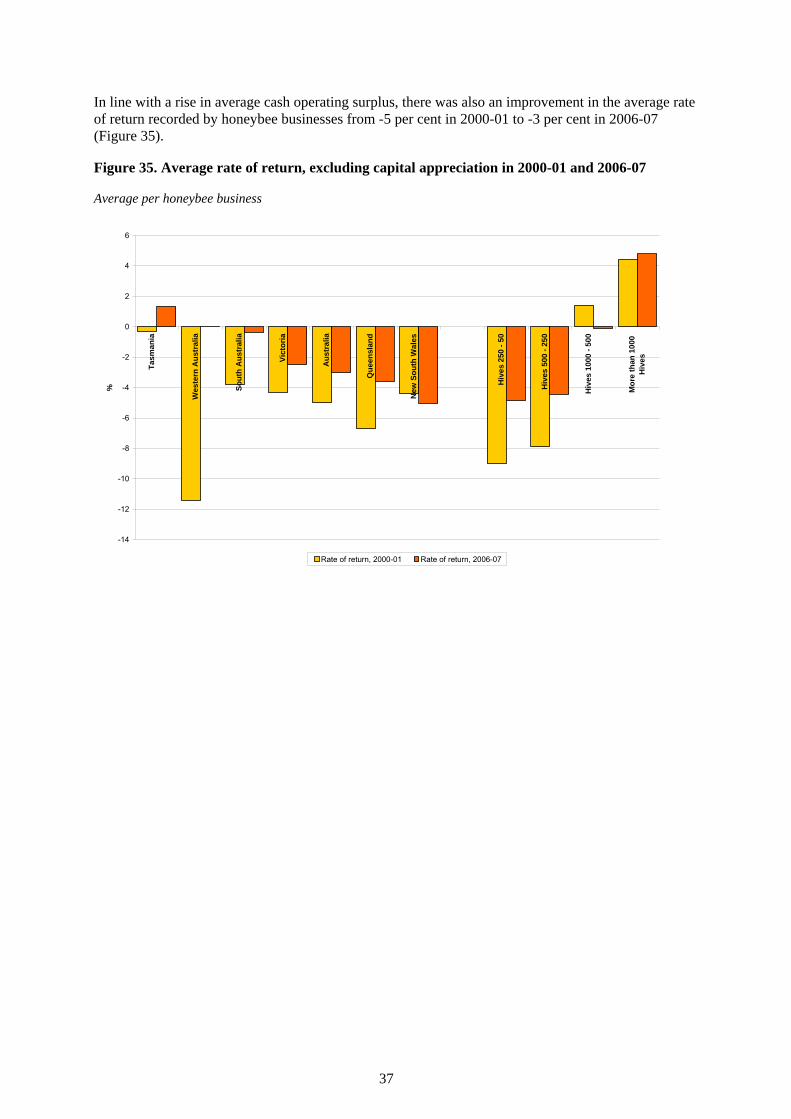
37
In line with a rise in average cash operating surplus, there was also an improvement in the average rate of return recorded by honeybee businesses from -5 per cent in 2000-01 to -3 per cent in 2006-07 (Figure 35).
Figure 35. Average rate of return, excluding capital appreciation in 2000-01 and 2006-07
Average per honeybee business
-14
-12
-10
-8
-6
-4
-2
0
2
4
6
Tasm
ania
W
este
rn A
ustr
alia
Sou
th A
ustr
alia
V
icto
ria
Aus
tral
ia
Que
ensl
and
N
ew S
outh
Wal
es
H
ives
250
- 50
H
ives
500
- 25
0
Hiv
es 1
000
- 500
Mor
e th
an 1
000
Hiv
es
%
Rate of return, 2000-01 Rate of return, 2006-07

38
10. Appendices
10.1. Definitions
Area of land at business premises: Includes all land operated by the honeybee business, whether owned or rented by the business.
Business profit: Cash operating surplus plus buildup in trading stocks, less depreciation, less the imputed value of the owner manager, partner(s) and family labour.
Capital: The value of capital employed by the honeybee business is the market value of all the assets used including leased items but excluding machinery and equipment either hired or used by contractors. Market valuations were provided by the owner manager of surveyed businesses and included the market value of operating hives, honey on hand, stocks of other bee products, quotas and contracts. The value of honey on hand at the end of the financial year was calculated as the closing quantity of honey multiplied by the average price received by the surveyed honeybee business for honey sold during the year. Capital also includes the market value of land and fixed improvements used by the surveyed honeybee business, excluding the value of the owner manager’s house. The house value deducted from the total value of land and fixed improvements was the present day replacement cost, depreciated for age.
Cash operating surplus: The difference between total cash receipts and total cash costs.
Debt: Estimated as honeybee business debt. Includes all debts attributable to the honeybee business, excluding personal debt and underwritten loans. Information collected at the survey interview was supplemented by information in the business accounts.
Depreciation: Estimated by applying the diminishing value depreciation method to the market value of capital items at the 30 June 2001. Capital items are categorised into several groups and relevant depreciation rates are applied. The capital groups include vehicles; handling, harvesting and packing equipment; cultivation and sowing equipment; computers, electronic and communications equipment; other plant and equipment; and buildings on the business premises.
Equity ratio: Calculated as honeybee business equity as a percentage of total owned capital at 30 June.
Fixed improvements: Fixed assets including machinery, honey extraction plant and packing sheds as well as other specialist industry buildings.
Hired labour: Excludes the owner manager, partners and family labour, and work undertaken by contractors. Expenditure on contract services appears as a cash cost.
Imputed labour cost: Payments for owner manager and family labour may bear little relationship to the actual work input. An estimate of the labour input of the owner manager, partners and their families is calculated in work-weeks and a value is imputed at the relevant Federal Pastoral Industry Award rates.
Labour: Measured in work-weeks, as estimated by the owner manager. It includes all work on the business by the owner manager, partners, family, hired permanent and casual workers, but excludes work done by contractors.
Non-honeybee business income: Collected for the owner manager and spouse only, including income from wages, other businesses, investment and social welfare payments. The results shown are averages for those businesses for which non-honeybee business income information for both the owner manager and spouse is available.

39
Owner manager: The primary decision maker for the honeybee business. This person is identified by discussion between interviewer and interviewee as (one of) the key decision maker(s) in the business. This person is usually responsible for the day-to-day operation of the business and may own or have a share in the honeybee business.
Profit at full equity: Business profit plus interest, rent and finance lease payments. It is the return produced by all the resources used in the beekeeping business.
Rate of return: Computed by expressing profit at full equity as a percentage of the total opening capital of the beekeepers business.
Total cash costs: Payments made by the honeybee business for materials and services and for permanent and casual hired labour (excluding beekeeper, partner and other family labour). It includes the value of any lease payments on capital, produce purchased for resale, rent, interest, bee related purchases. Capital and household expenditures are excluded from total cash costs. Handling and marketing expenses include commission, levies etc. for business produce sold. Administration costs include accountancy fees, banking and legal expenses, postage, stationery, subscriptions and telephone. Other cash costs include stores, electricity, advisory services, motor vehicle expenses, travelling expenses and insurance. While ‘other cash costs’ may comprise a relatively large proportion of total cash costs, individually the components are relatively small overall and, as such, have not been listed.
Total cash receipts: Total of revenues received by the honeybee business during the financial year, including revenues from the sale of honey and bee related products. It includes revenue received from royalties, rebates, refunds, plant hire, contracts, insurance claims and compensation, and government assistance payments.

40
10.2. Reliability of estimates
The reliability of the estimates of population characteristics presented in this report depends on the design of the sample and the accuracy of the measurement of characteristics for the individual sample businesses.
10.2.1. Sampling errors Only a proportion of businesses in a state are surveyed. The data collected from each sample business are weighted to calculate population estimates. Estimates derived from these businesses are likely to be different from those that would have been obtained if information had been collected from a census of all businesses. Any such differences are called ‘sampling errors’.
The size of the sampling error is most influenced by the survey design and the estimation procedures, as well as the sample size and the variability of businesses in the population. The larger the sample size, the lower the sampling error is likely to be. So state estimates are likely to have greater sampling errors than national estimates.
To give a guide to the reliability of the survey estimates, sampling errors have been calculated for the estimates. These estimated errors, expressed as percentages of the survey estimates and termed ‘relative standard errors’ are given next to each estimate in parentheses and italics.
10.2.2. Comparing estimates When comparing estimates between different states and size groups, it is important to recognise that the differences are subject to sampling error. As a rough rule of thumb, a conservative estimate (an overestimate) of the standard error of the difference can be constructed by adding the squares of the estimated standard errors of the component estimates and then taking the square root of the result. An example is given below.
Suppose the estimates of total cash receipts were $100 000 in Victoria and $125 000 in Tasmania - a difference of $25 000 - and the relative standard error is given as 6 per cent for each estimate. The standard error of the difference can be estimated as:
9605$)000125$06.0()000100$06.0( 22 =×+×
so the relative standard error of the difference is:
%3810000025$
9605$=×⎟⎟
⎠
⎞⎜⎜⎝
⎛

41
10.2.3. Data quality ABARE’s survey system is designed to produce data of a quality suitable for research and analysis at the unit level. This involves a set of quality controls, with procedures being tailored to the specific requirements of individual surveys. The key to the success of the system is employing specialist highly experienced survey officers and statisticians to guide the design and operation of the data collection and estimation process.
With voluntary surveys, the first critical control point is maximising the response rate of the selected survey sample. Having staff with appropriate interpersonal skills is essential. Nevertheless, low response rates can be unavoidable in some surveys. Problems of data quality arising from this source are reduced by the use of procedures to guide the selection of replacement businesses, and the use of statistical modeling in the estimation process.
Data quality is also enhanced by checks against available external data sources and by internal consistency checks. The first of these checks takes place at the time of collection. With expert survey staff and training in the specific survey topic, much of the checking for internal consistency of data is done as part of the interview. After the collection of the survey information, further automated and manual checks against the full set of collected data are made. Extreme observations are also identified and, if necessary, checked by a second contact with the survey respondent.

42
10.3. Supplementary questionnaire 1. What percentage of your 2006-07 honey production was derived from each of the following regions/states: - Northern NSW (N of E/W line running through Bathurst) - SA - Southern NSW (S of E/W line running through Bathurst) - WA - Qld - TAS - Vic - NT 2. What proportion of honey and other honeybee products was sold through the following outlets in 2006-07 (%) - Major processors (eg Capilano, Beechworth, Spring Gully or Wescobee) - Other processors/honey packers - Direct to retail - Local markets (inc. farmers markets, etc.) - Door Sales - Export Pollination
If no pollination services in main survey go to Q4
3. What were the main crops you provided pollination services for during 2006-07 and were these services paid for?:
Yes and Yes but no No paid for payment
Yes and Yes but no No paid for payment
- Almond - Kiwi fruit - Apple - Lemon & Lime - Apricot - Lettuce (seed) - Asparagus - Lucerne (seed) - Avocado - Lupin - Bean - Macadamia - Blueberry - Mandarin - Broccoli (seed) - Mango - Brussels sprout (seed) - Nectarine - Cabbage (seed) - Onion (seed) - Canola - Orange - Carrot (seed) - Peach - Celery (seed) - Peanut - Cherries - Pear - Clover (white,red,or other)(seed) - Plum and Prune - Cotton lint - Pumpkin - Cucumber - Strawberry - Grapefruit - Watermelon Others (please list)

43
4. Do you expect to expand/commence pollination services in the future?
If Q4=Yes go to Q5 If Q4 = No go to Q7
5. Hives expected to be used in pollination services in next two years
6. Hives expected to be used in pollination services in next five years
7. Are any of the following major impediments to you developing/commencing pollination services? Knowledge and experience constraints Physical constraints (eg to far to travel to deliver pollination services) Financial constraints Prices not high enough Additional infrastructure or assets needed (eg transport/storage/packing) Too hard / too time consuming.
Public land use
8. Have you used public land for honey production over the last 5 years? (incl. state forests, national parks, stock routes etc. excl. public land operated by private individuals such as pastoral leases in Qld and NSW Western division)
1 Yes 2 No
9. Over the last 5 years has your use of public lands for honey production 1 decreased 2 remained the same 3 increased
10. What percentage of your 2006-07 honey production was derived from each of the following:
- state forests - national parks - other public land
11. How many operating hives contributed to your honey production from public lands during 2006-07?
Information and knowledge base
12. Using the following scale, how importantly do you rate each of the following as a source of information on beekeeping:
- Australian Beekeeping magazines - other beekeeping industry newsletters/magazines - media (press, radio, TV) - internet - books on beekeeping - research papers - field days - courses - Department of Agriculture apiary officers - beekeeping associations - Australian Honey Bee Industry Council (AHBIC) - honey packers - manufacturers - other beekeepers - other (please specify)
13. Using the same scale from 1 to 3, considering your present knowledge of beekeeping, how importantly do you rate the availability of information on:
Code: 1 not at all 2 to a small extent 3 to a great extent
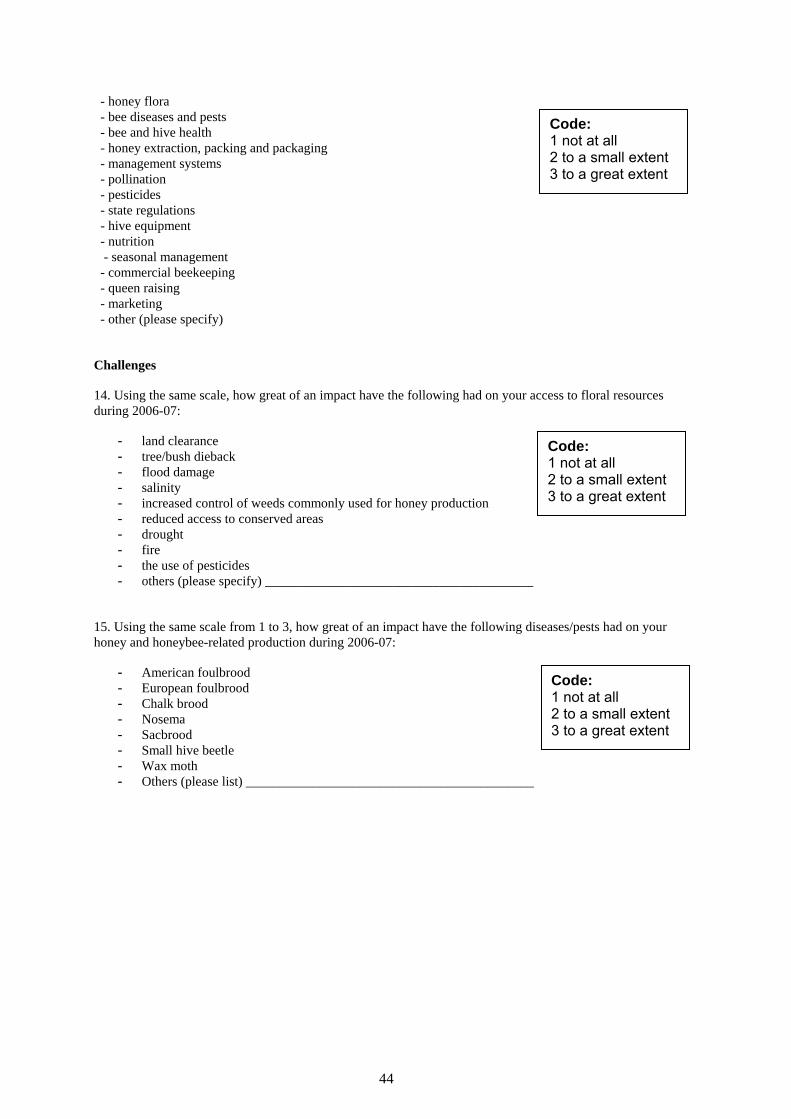
44
- honey flora - bee diseases and pests - bee and hive health - honey extraction, packing and packaging - management systems - pollination - pesticides - state regulations - hive equipment - nutrition - seasonal management - commercial beekeeping - queen raising - marketing - other (please specify)
Challenges
14. Using the same scale, how great of an impact have the following had on your access to floral resources during 2006-07:
- land clearance - tree/bush dieback - flood damage - salinity - increased control of weeds commonly used for honey production - reduced access to conserved areas - drought - fire - the use of pesticides - others (please specify) ________________________________________
15. Using the same scale from 1 to 3, how great of an impact have the following diseases/pests had on your honey and honeybee-related production during 2006-07:
- American foulbrood - European foulbrood - Chalk brood - Nosema - Sacbrood - Small hive beetle - Wax moth - Others (please list) ___________________________________________
Code: 1 not at all 2 to a small extent 3 to a great extent
Code: 1 not at all 2 to a small extent 3 to a great extent
Code: 1 not at all 2 to a small extent 3 to a great extent

45
Future perspectives:
16. Which of the following best describes what you expect to be doing in 5 years time?
- similar honeybee related production - increased honeybee related production - decreased honeybee related production - diversified into other honeybee related products - leave industry. 17. Using the following scale from 1 to 3, how great of an impact does they following have in determining if you stay in the honeybee industry?:
- prices received for products - diminished floral resources - increased bee diseases or pests - continuing poor seasonal conditions - age - availability of labour - availability of finance - access to value adding services (eg pollinations opportunities, packaged bees etc) - Continuity of contracts year to year.
Code: 1 not at all 2 to a small extent 3 to a great extent
46
10.4. References
ABARE report, Australian commodities - June quarter 08.2, June 2008
RIRDC report, Commercial beekeeping in Australia, RIRDC pub. no 07/059, April 2007
Jenny Gordon and Lee Davis, Valuing honeybee pollination, RIRDC pub. no 03/077, June 2003
V. Rodriguez et. al., Honey industry survey, RIRDC pub. no 03/039, May 2003

47
10.5. Appendix tables 10.5.1. Physical estimates for honeybee businesses, by number of hives, 2006-07 Average per business
50 - 250 hives 250 - 500 hives 500 - 1000 hives More than 1000 hives All businesses Estimate RSEa Estimate RSE Estimate RSE Estimate RSE Estimate RSE Population no 1 023 340 264 74 1 702 Sample no 54 26 35 20 135 Area of land at business premises ha 19 (52) 11 (58) 50 (51) 20 (45) 22 (33) Queenbee mating nucs operated no 40 (49) 31 (21) 217 (26) 313 (34) 78 (20) Hives operated at 1 July no 136 (14) 354 (7) 626 (3) 1 547 (11) 318 (5) Hives operated at 30 June no 121 (13) 320 (4) 632 (3) 1 592 (11) 304 (4) Honey production Opening stock of honey kg 2 041 (23) 7 899 (41) 12 830 (32) 23 760 (29) 5 837 (17) Honey purchased kg 33 (88) 0 2 485 (93) 2 006 (66) 493 (74) Honey produced kg 5 386 (19) 19 389 (11) 43 084 (10) 102 717 (17) 18 295 (7) Honey sold during yearb kg 5 433 (21) 22 291 (14) 44 848 (9) 104 443 (19) 19 252 (7) Quantity of honey given away kg 92 (79) 185 (36) 349 (21) 609 (35) 173 (28) Closing stock of honey kg 1 936 (29) 4 812 (40) 13 202 (35) 23 432 (31) 5 200 (18) Bee related activities Queenbees purchased no 23 (38) 60 (39) 152 (22) 395 (34) 67 (16) Queenbees soldb no 106 (81) 314 (79) 417 (59) 488 (40) 213 (38) Packaged bees soldb no 0.1 (91) 5 (82) 8 (95) 162 (72) 9 (56) Propolis, wax and honeycomb soldb kg 31 (72) 34 (81) 67 (42) 1 709 (88) 111 (61) Hives purchased no 0.3 (60) 5 (69) 11 (71) na 3 (43) Hives soldb no 17 (47) 2 (95) 5 (95) na 11 (43) Conditions for honey production in 2006-07 Above average % 4 (65) 11 (25) 7 (60) 6 (31) 6 (28) Average % 25 (36) 12 (83) 13 (39) 29 (28) 21 (28) Below average % 32 (21) 39 (31) 24 (34) 42 (19) 32 (15) Drought % 39 (24) 34 (33) 49 (19) 22 (50) 39 (16) Not reported % 0 4 (95) 6 (57) 0 2 (52) Honey production in a normal year kg 10 250 (23) 25 690 (18) 50 053 (11) 97 164 (24) 23 318 (9) Number of hives in a normal year no 134 (16) 363 (10) 664 (4) 1 559 (11) 324 (5)
aRefer to section 10.2 for detail on RSE (Relative Standard Error) bquantities sold includes transfers out na – not provided due to insufficient responses

48
10.5.2 Physical estimates for honeybee businesses, by state, 2006-07 Average per business New South Wales Victoria Queensland South Australia Western Australia Tasmania
Estimate RSE Estimat
e RSE Estimate RSE Estimate RSE Estimate RSE Estimat
e RSE Population no 664 338 374 192 95 32 Sample no 30 24 27 17 18 17 Area of land at business premises ha 9 (44) 5 (52) 27 (74) 91 (53) 21 (46) 12 (29) Queenbee mating nucs operated no 63 (48) 55 (36) 117 (44) 84 (28) 86 (15) 116 (23) Hives operated at 1 July no 362 (17) 263 (19) 295 (17) 336 (8) 232 (13) 408 (16) Hives operated at 30 June no 341 (20) 262 (18) 276 (18) 330 (8) 236 (12) 410 (16) Honey production Opening stock of honey kg 8 327 (34) 4 223 (41) 1 578 (60) 8 448 (50) 2 509 (30) 16 498 (37) Honey purchased kg 0 462 (72) 6 (198) 3 419 (113) 65 (91) 586 (49) Honey produced kg 17 062 (22) 16 770 (23) 12 039 (20) 31 638 (15) 24 800 (19) 35 327 (24) Honey sold during yeara kg 19 424 (22) 16 485 (25) 11 823 (20) 32 402 (21) 25 068 (20) 37 423 (24) Quantity of honey given away kg 210 (22) 154 (26) 204 (69) 17 (94) 240 (19) 25 (42) Closing stock of honey kg 5 756 (41) 4 815 (44) 1 596 (66) 11 087 (51) 2 065 (33) 14 963 (39) Bee related activities Queenbees purchased no 82 (54) 78 (24) 20 (58) 83 (26) 56 (30) 91 (22) Queenbees solda no 226 (32) 66 (28) 447 (58) 72 (35) 36 (45) 103 (22) Packaged bees solda no 7 (320) 23 (96) 6 (109) 0 19 (75) 0 Propolis, wax and honeycomb solda kg 0 365 (97) 159 (37) 0 0 177 (62) Hives purchased no 2 (101) 5 (97) 3 (121) 5 (98) 4 (60) 1 (76) Hives solda no 12 (67) 9 (102) 17 (71) 10 (84) 1 (91) 2 (76) Conditions for honey production in 2006-07 Above average % 1 (88) 16 (48) 0 5 (97) 6 (50) 43 (17) Average % 6 (82) 25 (49) 30 (78) 30 (42) 56 (23) 44 (20) Below average % 48 (17) 28 (54) 9 (52) 37 (33) 35 (36) 8 (73) Drought % 45 (17) 31 (34) 57 (42) 21 (58) 3 (83) 6 (67) Not reported % 0 0 4 (93) 8 (62) 0 0 Honey production in a normal year kg 23 726 (21) 20 561 (22) 23 029 (33) 25 289 (29) 30 496 (13) na Number of hives in a normal year no 343 (20) 278 (18) 330 (29) 330 (8) 255 (12) 410 (16) aquantities sold includes transfers out na – not provided due to insufficient responses

49
10.5.3. Sources of flora for honeybee businesses, by number of hives, 2006-07 Average per business 50 - 250 hives 250 - 500 hives 500 - 1000 hives More than 1000 hives All businesses
Estimate RSE Estimat
e RSE Estimate RSE Estimate RSE Estimat
e RSE Proportion of honey from: Northern NSW % 13 (26) 44 (10) 19 (16) 12 (15) 20 (11) Queensland % 20 29 (6) 23 (13) 6 (17) 22 (3) South Australia % 9 12 24 (1) 0 11 (0.4) Southern NSW % 23 (14) 4 (92) 22 (10) 45 (10) 20 (11) Tasmania % 2 1 1 (92) 4 (44) 2 (7) Victoria % 25 7 10 (21) 30 (13) 19 (2) Western Australia % 7 3 2 (27) 3 (60) 6 (2) Proportion of honeybee businesses using public land: Used public land in last 5 years % 54 (20) 87 (6) 76 (7) 100 (36) 66 (10) Use of public land has: Decreased % 15 (70) 37 (37) 13 (49) 34 (33) 20 (35) Stayed the samea % 77 (15) 37 (24) 75 (10) 32 (36) 67 (11) Increased % 8 (73) 26 (46) 12 (51) 35 (37) 14 (33) Proportion of honey production from: State forests % 24 (38) 33 (18) 30 (13) 38 (14) 27 (21) National parks % 3 (68) 13 (26) 6 (46) 10 (41) 6 (27) Other public lands % 3 (67) 5 (45) 6 (29) 9 (52) 4 (33) Number of hives contributing to honey production from public lands no 66 (33) 233 (10) 306 (15) 1 148 (15) 184 (9)
astayed the same includes those who did not use public land at all in the past 5 years

50
10.5.4. Sources of flora for honeybee businesses, by state, 2006-07 Average per business New South Wales Victoria Queensland South Australia Western Australia Tasmania
Estimate RSE Estimat
e RSE Estimat
e RSE Estimate RSE Estimate RSE Estimat
e RSE Proportion of honey from: Northern NSW % 49 (12) 0 3 (92) 0 0 5 (62) Queensland % 1 (95) 0 97 (3) 0 0 0 South Australia % 0 0 0 100 0 0 Southern NSW % 49 (12) 4 (49) 0 0 0 0 Tasmania % 0 0 0 0 0 95 (3) Victoria % 0 (85) 96 (2) 0 0 (95) 0 0 Western Australia % 0 0 0 0 100 0 Proportion of honeybee businesses using public land: Used public land in last 5 years % 79 (14) 71 (14) 67 (35) 22 (52) 44 (29) 100 Use of public land has: Decreased % 20 (44) 32 (45) 18 (103) 10 (66) 6 (51) 13 (51) Stayed the same % 60 (18) 63 (22) 64 (32) 90 (7) 89 (4) 58 (16) Increased % 20 (51) 6 (53) 18 (44) 0 5 (65) 29 (29) Proportion of honey production from: State forests % 28 (31) 22 (44) 42 (38) 5 (106) 17 (39) 52 (16) National parks % 10 (38) 3 (75) 3 (149) 4 (90) 3 (51) 20 (31) Other public lands % 3 (68) 7 (45) 6 (87) 3 (90) 6 (34) 11 (56) Number of hives contributing to honey production from public lands no 231 (23) 165 (27) 212 (30) 13 (89) 144 (25) 265 (26)
astayed the same includes those who did not use public land at all in the past 5 years

51
10.5.5. Receipts for honeybee businesses, by number of hives, 2006-07 Average per business 50 - 250 hives 250 - 500 hives 500 - 1000 hives More than 1000 hives All businesses Estimate RSE Estimate RSE Estimate RSE Estimate RSE Estimate RSE Honey receipts $ 15 921 (22) 63 696 (17) 115 884 (10) 303 914 (18) 54 293 (8) Queenbee receipts $ 1 522 (98) 2 923 (97) 4 889 (85) 2 741 (140) 2 394 (52) Propolis, wax and honeycomb receipts $ 842 (50) 2 219 (27) 3 018 (24) 7 434 (22) 1 760 (18) operating and spare hives receipts $ 380 (107) 0 0 0 226 (107) Pollination receipts $ 639 (240) 5 164 (21) 13 834 (23) 62 775 (45) 6 415 (26) Total bee related receipts $ 19 304 (29) 74 003 (13) 137 625 (10) 376 864 (13) 65 088 (8) Wool receipts $ 762 (98) 0 349 (77) 0 507 (88) Other product receipts $ 16 (66) 154 (61) 0 1 (60) 41 (49) Crop receipts $ 1 877 (68) 36 (95) 512 (83) 0 1 202 (63) Government assistance/rebates $ 315 (98) 220 (58) 74 (59) 279 (90) 256 (73) Interest and dividend receipts $ 37 (57) 38 (86) 481 (46) 1 032 (68) 152 (32) Other cash receipts $ 2 033 (50) 2 924 (51) 5 158 (27) 34 152 (80) 4 139 (34) Total cash receipts $ 24 343 (23) 77 375 (13) 144 199 (10) 412 328 (14) 71 386 (7) Price received for honey $/kg 3.0 (10) 2.9 (20) 2.6 (5) 2.9 (6) 2.8 (6) Value of: Honey given away $ 247 (59) 779 (58) 965 (19) 1 508 (35) 525 (25) Honey produced in 2006-07 $ 16 027 (17) 61 671 (19) 109 859 (9) 304 677 (16) 53 024 (7)
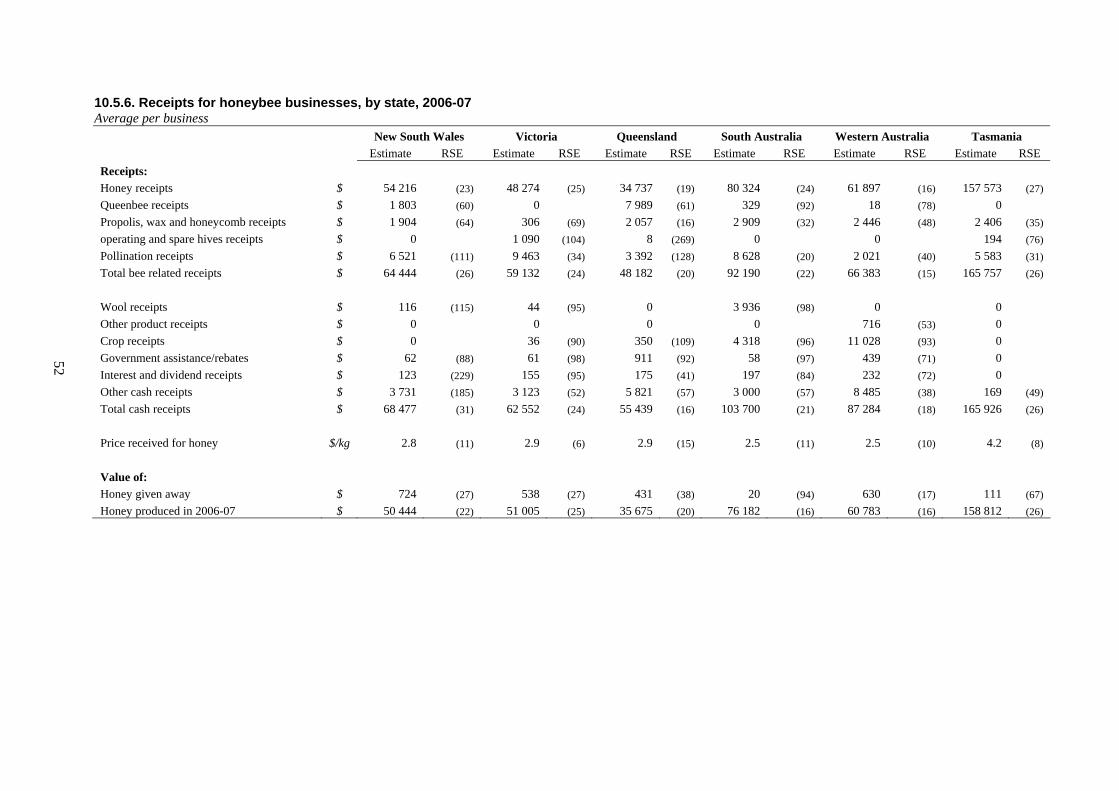
52
10.5.6. Receipts for honeybee businesses, by state, 2006-07 Average per business New South Wales Victoria Queensland South Australia Western Australia Tasmania Estimate RSE Estimate RSE Estimate RSE Estimate RSE Estimate RSE Estimate RSE Receipts: Honey receipts $ 54 216 (23) 48 274 (25) 34 737 (19) 80 324 (24) 61 897 (16) 157 573 (27) Queenbee receipts $ 1 803 (60) 0 7 989 (61) 329 (92) 18 (78) 0 Propolis, wax and honeycomb receipts $ 1 904 (64) 306 (69) 2 057 (16) 2 909 (32) 2 446 (48) 2 406 (35) operating and spare hives receipts $ 0 1 090 (104) 8 (269) 0 0 194 (76) Pollination receipts $ 6 521 (111) 9 463 (34) 3 392 (128) 8 628 (20) 2 021 (40) 5 583 (31) Total bee related receipts $ 64 444 (26) 59 132 (24) 48 182 (20) 92 190 (22) 66 383 (15) 165 757 (26) Wool receipts $ 116 (115) 44 (95) 0 3 936 (98) 0 0 Other product receipts $ 0 0 0 0 716 (53) 0 Crop receipts $ 0 36 (90) 350 (109) 4 318 (96) 11 028 (93) 0 Government assistance/rebates $ 62 (88) 61 (98) 911 (92) 58 (97) 439 (71) 0 Interest and dividend receipts $ 123 (229) 155 (95) 175 (41) 197 (84) 232 (72) 0 Other cash receipts $ 3 731 (185) 3 123 (52) 5 821 (57) 3 000 (57) 8 485 (38) 169 (49) Total cash receipts $ 68 477 (31) 62 552 (24) 55 439 (16) 103 700 (21) 87 284 (18) 165 926 (26) Price received for honey $/kg 2.8 (11) 2.9 (6) 2.9 (15) 2.5 (11) 2.5 (10) 4.2 (8) Value of: Honey given away $ 724 (27) 538 (27) 431 (38) 20 (94) 630 (17) 111 (67) Honey produced in 2006-07 $ 50 444 (22) 51 005 (25) 35 675 (20) 76 182 (16) 60 783 (16) 158 812 (26)

53
10.5.7. Costs for honeybee businesses, by number of hives, 2006-07 Average per business 50 - 250 hives 250 - 500 hives 500 - 1000 hives More than 1000 hives All businesses Estimate RSE Estimate RSE Estimate RSE Estimate RSE Estimate RSE Administration $ 2 037 (28) 4 693 (22) 5 492 (21) 9 861 (14) 3 473 (13) Honey related purchase costs: Hive purchases $ 207 (67) 730 (76) 800 (83) 5 752 (80) 654 (41) Honey purchases $ 128 (316) 0 6 944 (93) 5 960 (67) 1 440 (74) Queenbee purchases $ 401 (55) 739 (36) 1 256 (24) 6 264 (26) 867 (19) Other costs: Handling and marketing expense $ 90 (98) 117 (97) 95 (86) 54 (0) 95 (62) Electricity $ 383 (26) 825 (27) 1 070 (17) 3 459 (18) 719 (12) Fertilizer $ 644 (56) 0 963 (70) 4 032 (9) 714 (34) Freight $ 212 (44) 915 (50) 1 229 (21) 9 143 (60) 914 (30) Fuel, oil and grease $ 2 673 (25) 7 061 (23) 9 537 (16) 30 760 (21) 5 903 (11) Insurance $ 707 (37) 1 858 (25) 3 185 (14) 12 489 (29) 1 858 (14) Interest $ 1 339 (207) 4 867 (38) 7 442 (26) 15 035 (16) 3 633 (47) Lease payments $ 19 (74) 175 (84) 4 669 (46) 4 860 (32) 1 002 (34) Beehive supplies $ 609 (26) 2 165 (29) 2 913 (34) 7 117 (29) 1 580 (15) Motor vehicle $ 1 420 (20) 2 907 (36) 4 741 (19) 11 177 (44) 2 683 (14) Packing and materials $ 830 (24) 2 039 (49) 79 (60) 16 260 (46) 1 645 (25) Repairs and maintenance - buildings $ 1 340 (83) 858 (34) 2 676 (30) 12 946 (27) 1 970 (35) Repairs and maintenance - vehicles $ 2 365 (88) 5 564 (25) 4 987 (17) 9 988 (18) 3 771 (34) Rent on buildings and land $ 1 (78) 924 (59) 170 (57) 1 085 (51) 264 (43) Rent on beesites $ 255 (58) 1 183 (33) 1 531 (28) 4 529 (30) 836 (18) Rates $ 918 (33) 1 290 (27) 1 613 (16) 2 364 (21) 1 168 (17) Entomology fees $ 0 0 0 332 (135) 15 (135) Hired labour $ 23 (98) 2 945 (63) 11 012 (25) 44 028 (34) 4 316 (20) Other cash costs $ 3 157 (21) 4 369 (25) 15 528 (29) 25 158 (26) 6 340 (14) Total cash costs $ 19 757 (37) 46 224 (15) 87 933 (16) 242 654 (18) 45 860 (12)
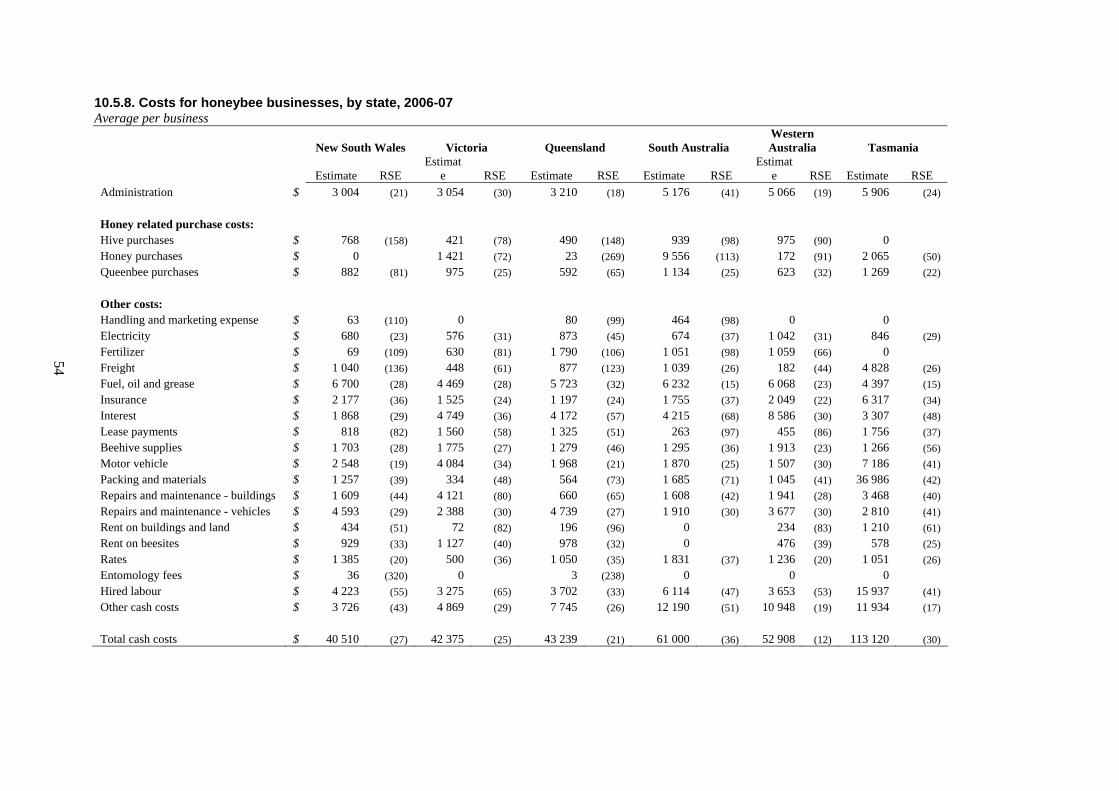
54
10.5.8. Costs for honeybee businesses, by state, 2006-07 Average per business
New South Wales Victoria Queensland South Australia Western Australia Tasmania
Estimate RSE Estimat
e RSE Estimate RSE Estimate RSE Estimat
e RSE Estimate RSE Administration $ 3 004 (21) 3 054 (30) 3 210 (18) 5 176 (41) 5 066 (19) 5 906 (24) Honey related purchase costs: Hive purchases $ 768 (158) 421 (78) 490 (148) 939 (98) 975 (90) 0 Honey purchases $ 0 1 421 (72) 23 (269) 9 556 (113) 172 (91) 2 065 (50) Queenbee purchases $ 882 (81) 975 (25) 592 (65) 1 134 (25) 623 (32) 1 269 (22) Other costs: Handling and marketing expense $ 63 (110) 0 80 (99) 464 (98) 0 0 Electricity $ 680 (23) 576 (31) 873 (45) 674 (37) 1 042 (31) 846 (29) Fertilizer $ 69 (109) 630 (81) 1 790 (106) 1 051 (98) 1 059 (66) 0 Freight $ 1 040 (136) 448 (61) 877 (123) 1 039 (26) 182 (44) 4 828 (26) Fuel, oil and grease $ 6 700 (28) 4 469 (28) 5 723 (32) 6 232 (15) 6 068 (23) 4 397 (15) Insurance $ 2 177 (36) 1 525 (24) 1 197 (24) 1 755 (37) 2 049 (22) 6 317 (34) Interest $ 1 868 (29) 4 749 (36) 4 172 (57) 4 215 (68) 8 586 (30) 3 307 (48) Lease payments $ 818 (82) 1 560 (58) 1 325 (51) 263 (97) 455 (86) 1 756 (37) Beehive supplies $ 1 703 (28) 1 775 (27) 1 279 (46) 1 295 (36) 1 913 (23) 1 266 (56) Motor vehicle $ 2 548 (19) 4 084 (34) 1 968 (21) 1 870 (25) 1 507 (30) 7 186 (41) Packing and materials $ 1 257 (39) 334 (48) 564 (73) 1 685 (71) 1 045 (41) 36 986 (42) Repairs and maintenance - buildings $ 1 609 (44) 4 121 (80) 660 (65) 1 608 (42) 1 941 (28) 3 468 (40) Repairs and maintenance - vehicles $ 4 593 (29) 2 388 (30) 4 739 (27) 1 910 (30) 3 677 (30) 2 810 (41) Rent on buildings and land $ 434 (51) 72 (82) 196 (96) 0 234 (83) 1 210 (61) Rent on beesites $ 929 (33) 1 127 (40) 978 (32) 0 476 (39) 578 (25) Rates $ 1 385 (20) 500 (36) 1 050 (35) 1 831 (37) 1 236 (20) 1 051 (26) Entomology fees $ 36 (320) 0 3 (238) 0 0 0 Hired labour $ 4 223 (55) 3 275 (65) 3 702 (33) 6 114 (47) 3 653 (53) 15 937 (41) Other cash costs $ 3 726 (43) 4 869 (29) 7 745 (26) 12 190 (51) 10 948 (19) 11 934 (17) Total cash costs $ 40 510 (27) 42 375 (25) 43 239 (21) 61 000 (36) 52 908 (12) 113 120 (30)

55
10.5.9. Financial performance of honeybee businesses, by number of hives, 2006-07 Average per business 50 - 250 hives 250 - 500 hives 500 - 1000 hives More than 1000 hives All businesses Estimate RSE Estimate RSE Estimate RSE Estimate RSE Estimate RSE Total cash receipts $ 24 343 (23) 77 375 (13) 144 199 (10) 412 328 (14) 71 386 (7) Total cash costs $ 19 757 (37) 46 224 (15) 87 933 (16) 242 654 (18) 45 860 (12) Cash operating surplus $ 4 587 (86) 31 151 (22) 56 266 (15) 169 673 (11) 25 526 (12) less: depreciation $ 11 768 (17) 17 586 (11) 25 990 (10) 66 050 (15) 17 621 (8) less: imputed labour $ 19 139 (25) 46 014 (18) 49 029 (10) 81 624 (13) 32 126 (11) plus: buildup in trading stocks $ 267 (442) - 1 998 (112) 4 152 (89) 2 379 (1112) 514 (303) Business profit $ - 26 053 (27) - 34 447 (33) - 14 601 (66) 24 378 (125) - 23 706 (22) Profit at full equity $ - 24 440 (21) - 27 297 (40) - 788 (1102) 49 887 (61) - 17 971 (23) Total capital at 1 Julya $ 514 821 (12) 614 112 (20) 807 062 (17) 1 040 885 (14) 603 049 (8) Rate of return $ -4.7 (30) -4.4 (43) -0.1 (1100) 4.8 (72) -3.0 (26)
acapital does not include owner/operators house

56
10.5.10. Financial performance for honeybee businesses, by state, 2006-07 Average per business New South Wales Victoria Queensland South Australia Western Australia Tasmania Estimate RSE Estimate RSE Estimate RSE Estimate RSE Estimate RSE Estimate RSE Total cash receipts $ 68 477 (31) 62 552 (24) 55 439 (16) 103 700 (21) 87 284 (18) 165 926 (26) Total cash costs $ 40 510 (27) 42 375 (25) 43 239 (21) 61 000 (36) 52 908 (12) 113 120 (30) Cash operating surplus $ 27 966 (41) 20 178 (34) 12 200 (43) 42 700 (19) 34 376 (31) 52 806 (30) less: depreciation $ 17 985 (18) 14 699 (24) 17 193 (22) 20 521 (19) 15 770 (15) 35 397 (26) less: imputed labour $ 35 224 (20) 28 962 (21) 28 171 (29) 36 618 (19) 29 579 (20) 19 724 (26) plus: buildup in trading stocks $ -4 933 (101) 4 398 (121) 3 330 (52) 6 515 (59) 1 321 (193) 3 995 (63) Business profit $ -30 177 (31) -19 085 (54) -29 834 (45) -7 924 (131) -9 652 (121) 1 681 (1108) Profit at full equity $ -26 128 (36) -11 577 (90) -23 163 (52) -3 446 (279) 99 (11351) 8 532 (231) Total capital at 1 Julya $ 519 475 (17) 466 163 (23) 661 393 (8) 961 156 (25) 724 156 (20) 640 068 (16) Rate of return $ -5.0 (44) -2.5 (85) -3.5 (61) -0.4 (274) 0.0 (11338) 1.3 (241)
acapital does not include owner/operators house

57
10.5.11. Capital estimates for honeybee businesses, by number of hives, 2006-07 Average per business
50 - 250 hives 250 - 500 hives 500 - 1000 hives More than 1000 hives All businesses Estimate RSE Estimate RSE Estimate RSE Estimate RSE Estimate RSE Total capital at 1 July $ 514 821 (12) 614 112 (20) 807 062 (17) 1 040 885 (14) 603 049 (8) Total capital at 30 June $ 517 147 (12) 613 647 (20) 819 338 (17) 1 119 476 (14) 609 696 (8) Components of capital value at 30 June: Land and fixed improvements $ 509 880 (13) 506 380 (24) 646 812 (22) 502 589 (17) 530 118 (10) Honey stocks $ 4 983 (30) 20 671 (51) 28 970 (41) 63 074 (29) 14 385 (21) Other bee related product stocks $ 680 (37) 1 693 (64) 10 086 (63) 30 498 (133) 3 647 (56) Hive stocks $ 17 916 (13) 54 170 (6) 86 970 (8) 231 821 (14) 45 240 (5) Plant and equipment $ 1 121 (88) 4 361 (83) 19 613 (37) 70 737 (34) 7 684 (23) Cars, utes etc $ 14 592 (14) 15 583 (15) 22 056 (16) 48 855 (14) 17 447 (8) Trucks and forklifts $ 13 598 (53) 28 735 (17) 42 175 (14) 106 129 (23) 25 107 (19) Tractors $ 1 873 (29) 4 743 (32) 4 707 (43) 5 049 (40) 3 026 (18) Cultivation sowing fertiliser and spraying equipment $ 336 (59) 531 (97) 676 (56) 1 875 (12) 495 (34) Harvesting and handling equipment $ 12 652 (30) 16 552 (19) 20 187 (17) 82 529 (17) 17 657 (14) Livestock handling equipment $ 2 096 (80) 0 2 987 (70) 587 (0) 1 749 (60) Irrigation and water supply equipment $ 5 (55) 2 017 (109) 79 (92) 0 419 (105) Computers and other electrical equipment $ 919 (26) 1 541 (34) 4 009 (69) 1 666 (13) 1 556 (30) Other plant and equipment $ 12 649 (29) 7 874 (9) 19 738 (21) 67 317 (43) 15 185 (17) Total additions $ 6 186 (49) 4 125 (54) 9 380 (34) 63 409 (27) 8 771 (24) Total disposals $ 3 (67) 1 249 (92) 911 (48) 2 479 (58) 501 (49)
acapital does not include owner/operators house

58
10.5.12. Capital estimates for honeybee businesses, by state, 2006-07 Average per business New South Wales Victoria Queensland South Australia Western Australia Tasmania Estimate RSE Estimate RSE Estimate RSE Estimate RSE Estimate RSE Estimate RSE Total capital at 1 July $ 519 475 (17) 466 163 (23) 661 393 (8) 961 156 (25) 724 156 (20) 640 068 (16) Total capital at 30 June $ 518 565 (17) 487 932 (21) 668 124 (8) 965 669 (25) 731 548 (19) 654 332 (15) Components of capital value at 30 June: Land and fixed improvements $ 355 320 (23) 351 871 (29) 525 888 (13) 808 685 (29) 585 741 (22) 362 600 (16) Honey stocks $ 20 595 (40) 10 408 (45) 3 573 (62) 17 678 (65) 6 750 (29) 59 884 (43) Other bee related product stocks $ 3 862 (269) 1 793 (34) 5 717 (64) 1 958 (39) 5 367 (44) 358 (62) Hive stocks $ 46 536 (23) 37 349 (22) 45 683 (19) 48 765 (15) 61 356 (18) 31 281 (23) Plant and equipment $ 6 392 (45) 22 032 (37) 3 035 (58) 0 2 648 (49) 0 Cars, utes etc $ 15 638 (17) 17 506 (23) 16 631 (16) 21 008 (19) 20 232 (14) 35 849 (23) Trucks and forklifts $ 25 155 (24) 24 005 (48) 25 664 (49) 31 688 (30) 19 908 (26) 8 178 (33) Tractors $ 2 421 (43) 809 (80) 5 952 (46) 3 809 (62) 3 187 (40) 269 (60) Cultivation sowing fertiliser and spraying equipment
$ 272 (85) 58 (85) 701 (107) 1 942 (51) 82 (100) 0
Harvesting and handling equipment $ 25 610 (31) 12 641 (21) 10 528 (78) 12 120 (23) 11 780 (41) 40 104 (56) Livestock handling equipment $ 0 213 (104) 7 191 (59) 1 096 (96) 59 (94) 0 Irrigation and water supply equipment $ 0 0 1 834 (178) 0 286 (46) 0 Computers and other electrical equipment $ 694 (40) 940 (19) 1 871 (32) 5 336 (72) 915 (24) 1 717 (18) Other plant and equipment $ 16 070 (36) 8 308 (30) 13 855 (8) 11 584 (38) 13 239 (22) 114 093 (48) Total additions $ 5 083 (45) 21 902 (43) 6 012 (31) 3 799 (97) 6 070 (53) 18 160 (38) Total disposals $ 0 575 (66) 488 (69) 2 095 (97) 242 (79) 1 601 (58)
acapital does not include owner/operators house

59
10.5.13. Debt estimates for honeybee businesses, by number of hives, 2006-07 Average per business 50 - 250 hives 250 - 500 hives 500 - 1000 hives More than 1000 hives All businesses Estimate RSE Estimate RSE Estimate RSE Estimate RSE Estimate RSE Total business debt $ 92 130 (45) 70 986 (35) 107 366 (20) 132 822 (26) 93 348 (22) Loan purpose: Land purchase $ 64 246 (67) 21 369 (61) 20 290 (71) 0 38 888 (51) Building and structures $ 1 618 (403) 0 43 716 (56) 17 160 (51) 12 185 (53) Vehicles and machines $ 3 254 (108) 10 269 (54) 16 998 (44) 78 887 (51) 13 495 (29) Working capital $ 23 012 (42) 32 315 (72) 22 181 (34) 36 775 (53) 26 068 (29) Other $ 0 7 033 (54) 4 181 (85) 0 2 712 (47) Debt sources: Hire purchase $ 0 4 988 (103) 10 832 (47) 58 006 (65) 7 826 (71) Bank overdraft $ 22 053 (55) 9 210 (66) 7 027 (55) 10 421 (100) 14 553 (40) Bank other $ 59 627 (71) 56 788 (46) 67 321 (34) 48 642 (33) 59 966 (35) Building society $ 0 0 3 604 (91) 2 166 (71) 997 (78) Pastoral or insurance companies $ 0 0 0 0 0 Government agency $ 0 0 10 832 (60) 0 2 542 (60) Trade creditor $ 0 0 3 645 (97) 0 855 (97) Other amounts owing $ 10 450 (98) 0 4 106 (71) 13 587 (54) 6 609 (71) Equity ratio % 85 (7) 86 (6) 88 (3) 88 (2) 87 (3)

60
10.5.14. Debt estimates for honeybee businesses, by state, 2006-07 Average per business New South Wales Victoria Queensland South Australia Western Australia Tasmania Estimate RSE Estimate RSE Estimate RSE Estimate RSE Estimate RSE Estimate RSE Total business debt $ 25 025 (27) 102 529 (14) 135 015 (41) 272 540 (42) 133 781 (30) 74 558 (42) Loan purpose: Land purchase $ 0 1 919 (93) 91 710 (54) 145 893 (59) 69 001 (63) 0 Building and structures $ 1 075 (240) 7 301 (297) 4 493 (47) 113 449 (153) 16 388 (93) 11 953 (62) Vehicles and machines $ 13 120 (38) 34 946 (53) 3 948 (90) 0 5 536 (102) 15 662 (62) Working capital $ 10 516 (26) 58 362 (46) 34 864 (69) 0 14 645 (78) 46 943 (51) Other $ 314 (110) 0 0 13 198 (96) 28 211 (102) 0 Debt sources: Hire purchase $ 6 142 (81) 23 440 (73) 3 948 (88) 0 0 0 Bank overdraft $ 7 671 (32) 38 218 (68) 12 298 (84) 0 14 645 (78) 25 541 (62) Bank other $ 10 897 (41) 31 315 (77) 113 450 (48) 164 159 (98) 110 799 (44) 33 355 (24) Building society $ 0 0 123 (125) 12 537 (90) 0 15 662 (62) Pastoral or insurance companies $ 0 0 0 0 0 0 Government agency $ 314 (110) 7 161 (87) 4 076 (71) 0 0 0 Trade creditor $ 0 0 0 13 198 (96) 0 0 Other amounts owing $ 0 (81) 2 396 (73) 1 120 (78) 82 647 (86) 8 338 (69) 0 (75) Equity ratio % 96 (2) 78 (11) 80 (9) 87 (3) 81 (6) 95 (2)
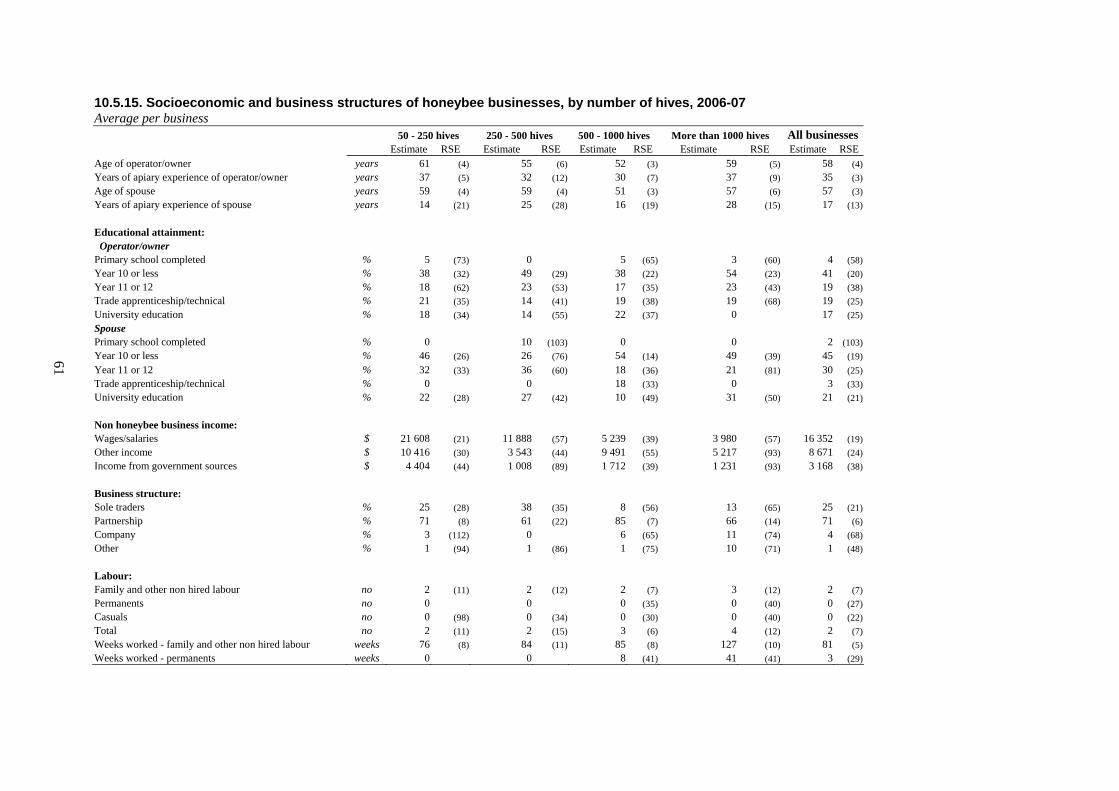
61
10.5.15. Socioeconomic and business structures of honeybee businesses, by number of hives, 2006-07 Average per business 50 - 250 hives 250 - 500 hives 500 - 1000 hives More than 1000 hives All businesses Estimate RSE Estimate RSE Estimate RSE Estimate RSE Estimate RSEAge of operator/owner years 61 (4) 55 (6) 52 (3) 59 (5) 58 (4)Years of apiary experience of operator/owner years 37 (5) 32 (12) 30 (7) 37 (9) 35 (3)Age of spouse years 59 (4) 59 (4) 51 (3) 57 (6) 57 (3)Years of apiary experience of spouse years 14 (21) 25 (28) 16 (19) 28 (15) 17 (13) Educational attainment: Operator/owner Primary school completed % 5 (73) 0 5 (65) 3 (60) 4 (58)Year 10 or less % 38 (32) 49 (29) 38 (22) 54 (23) 41 (20)Year 11 or 12 % 18 (62) 23 (53) 17 (35) 23 (43) 19 (38)Trade apprenticeship/technical % 21 (35) 14 (41) 19 (38) 19 (68) 19 (25)University education % 18 (34) 14 (55) 22 (37) 0 17 (25)Spouse Primary school completed % 0 10 (103) 0 0 2 (103)Year 10 or less % 46 (26) 26 (76) 54 (14) 49 (39) 45 (19)Year 11 or 12 % 32 (33) 36 (60) 18 (36) 21 (81) 30 (25)Trade apprenticeship/technical % 0 0 18 (33) 0 3 (33)University education % 22 (28) 27 (42) 10 (49) 31 (50) 21 (21) Non honeybee business income: Wages/salaries $ 21 608 (21) 11 888 (57) 5 239 (39) 3 980 (57) 16 352 (19)Other income $ 10 416 (30) 3 543 (44) 9 491 (55) 5 217 (93) 8 671 (24)Income from government sources $ 4 404 (44) 1 008 (89) 1 712 (39) 1 231 (93) 3 168 (38) Business structure: Sole traders % 25 (28) 38 (35) 8 (56) 13 (65) 25 (21)Partnership % 71 (8) 61 (22) 85 (7) 66 (14) 71 (6)Company % 3 (112) 0 6 (65) 11 (74) 4 (68)Other % 1 (94) 1 (86) 1 (75) 10 (71) 1 (48) Labour: Family and other non hired labour no 2 (11) 2 (12) 2 (7) 3 (12) 2 (7)Permanents no 0 0 0 (35) 0 (40) 0 (27)Casuals no 0 (98) 0 (34) 0 (30) 0 (40) 0 (22)Total no 2 (11) 2 (15) 3 (6) 4 (12) 2 (7)Weeks worked - family and other non hired labour weeks 76 (8) 84 (11) 85 (8) 127 (10) 81 (5)Weeks worked - permanents weeks 0 0 8 (41) 41 (41) 3 (29)

62
10.5.16. Socioeconomic and business structures of honeybee businesses, by state, 2006-07 Average per business
New South Wales Victoria Queensland South Australia Western Australia Tasmania Estimate RSE Estimate RSE Estimate RSE Estimate RSE Estimate RSE Estimate RSE Age of operator/owner years 57 (5) 59 (5) 62 (4) 57 (6) 56 (3) 58 (6) Years of apiary experience of operator/owner years 38 (5) 31 (11) 40 (6) 22 (20) 31 (12) 27 (17) Age of spouse years 57 (6) 54 (4) 62 (4) 59 (3) 53 (3) 57 (5) Years of apiary experience of spouse years 12 (21) 20 (14) 29 (15) 6 (40) 9 (28) 12 (34) Educational attainment: Operator/owner Primary school completed % 0 6 (101) 12 (67) 0 3 (86) 0 Year 10 or less % 45 (27) 37 (38) 43 (47) 35 (44) 23 (50) 37 (32) Year 11 or 12 % 21 (51) 19 (48) 16 (98) 11 (68) 27 (42) 29 (24) Trade apprenticeship/technical % 8 (77) 38 (40) 17 (49) 24 (50) 27 (29) 34 (37) University education % 26 (37) 0 (162) 12 (103) 30 (50) 21 (51) 0 Spouse Primary school completed % 0 0 8 (249) 0 0 0 Year 10 or less % 41 (38) 43 (27) 66 (56) 28 (74) 26 (54) 54 (20) Year 11 or 12 % 25 (51) 49 (24) 3 (118) 48 (46) 47 (34) 31 (45) Trade apprenticeship/technical % 6 (42) 0 0 8 (93) 0 0 University education % 28 (34) 8 (79) 23 (115) 16 (78) 26 (54) 15 (59) Non honeybee business income: Wages/salaries $ 22 178 (25) 13 821 (46) 6 621 (121) 3 447 (70) 51 531 (39) 11 939 (39) Other income $ 9 066 (45) 14 157 (42) 1 206 (73) 9 083 (69) 17 649 (42) 14 (67) Income from government sources $ 1 228 (80) 4 072 (46) 7 703 (59) 1 059 (74) 1 218 (64) 0 Business structure: Sole traders % 17 (48) 23 (58) 18 (44) 45 (28) 42 (32) 68 (11) Partnership % 81 (10) 66 (13) 80 (10) 51 (24) 40 (33) 32 (24) Company % 1 (93) 10 (105) 2 (108) 4 (113) 0 0 Other % 1 (100) 0 0 0 19 (53) 0 Labour: Family and other non hired labour no 2 (7) 3 (20) 2 (12) 2 (14) 2 (10) 1 (20) Permanents no 0 (41) 0 (99) 0 (47) 0 (73) 0 (84) 0 (40) Casuals no 0 (52) 0 (66) 0 (43) 0 (44) 0 (31) 0 (62) Total no 2 (8) 3 (20) 2 (10) 2 (12) 2 (10) 1 (22) Weeks worked - family and other non hired labour weeks 89 (9) 84 (12) 77 (9) 76 (13) 66 (16) 48 (21) Weeks worked - permanents weeks 4 (68) 2 (99) 3 (41) 3 (83) 0 (84) 15 (51)
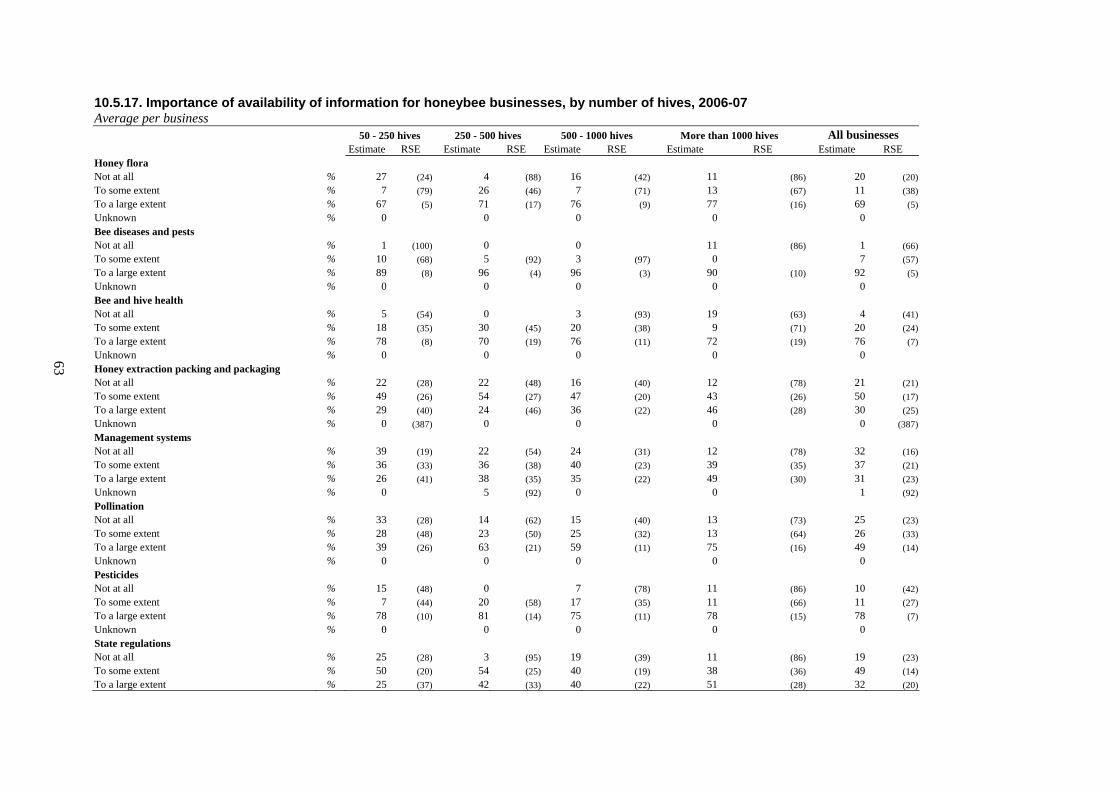
63
10.5.17. Importance of availability of information for honeybee businesses, by number of hives, 2006-07 Average per business 50 - 250 hives 250 - 500 hives 500 - 1000 hives More than 1000 hives All businesses Estimate RSE Estimate RSE Estimate RSE Estimate RSE Estimate RSE Honey flora Not at all % 27 (24) 4 (88) 16 (42) 11 (86) 20 (20)To some extent % 7 (79) 26 (46) 7 (71) 13 (67) 11 (38)To a large extent % 67 (5) 71 (17) 76 (9) 77 (16) 69 (5)Unknown % 0 0 0 0 0Bee diseases and pests Not at all % 1 (100) 0 0 11 (86) 1 (66)To some extent % 10 (68) 5 (92) 3 (97) 0 7 (57)To a large extent % 89 (8) 96 (4) 96 (3) 90 (10) 92 (5)Unknown % 0 0 0 0 0Bee and hive health Not at all % 5 (54) 0 3 (93) 19 (63) 4 (41)To some extent % 18 (35) 30 (45) 20 (38) 9 (71) 20 (24)To a large extent % 78 (8) 70 (19) 76 (11) 72 (19) 76 (7)Unknown % 0 0 0 0 0Honey extraction packing and packaging Not at all % 22 (28) 22 (48) 16 (40) 12 (78) 21 (21)To some extent % 49 (26) 54 (27) 47 (20) 43 (26) 50 (17)To a large extent % 29 (40) 24 (46) 36 (22) 46 (28) 30 (25)Unknown % 0 (387) 0 0 0 0 (387)Management systems Not at all % 39 (19) 22 (54) 24 (31) 12 (78) 32 (16)To some extent % 36 (33) 36 (38) 40 (23) 39 (35) 37 (21)To a large extent % 26 (41) 38 (35) 35 (22) 49 (30) 31 (23)Unknown % 0 5 (92) 0 0 1 (92)Pollination Not at all % 33 (28) 14 (62) 15 (40) 13 (73) 25 (23)To some extent % 28 (48) 23 (50) 25 (32) 13 (64) 26 (33)To a large extent % 39 (26) 63 (21) 59 (11) 75 (16) 49 (14)Unknown % 0 0 0 0 0Pesticides Not at all % 15 (48) 0 7 (78) 11 (86) 10 (42)To some extent % 7 (44) 20 (58) 17 (35) 11 (66) 11 (27)To a large extent % 78 (10) 81 (14) 75 (11) 78 (15) 78 (7)Unknown % 0 0 0 0 0State regulations Not at all % 25 (28) 3 (95) 19 (39) 11 (86) 19 (23)To some extent % 50 (20) 54 (25) 40 (19) 38 (36) 49 (14)To a large extent % 25 (37) 42 (33) 40 (22) 51 (28) 32 (20)

64
10.5.17. Continued… Importance of availability of information for honeybee businesses, by number of hives, 2006-07 Average per business Unknown % 0 0 0 0 0Hive equipment Not at all % 16 (44) 4 (84) 21 (35) 30 (42) 15 (30) To some extent % 48 (29) 71 (18) 51 (18) 48 (25) 53 (17) To a large extent % 36 (34) 25 (51) 27 (28) 22 (50) 32 (25) Unknown % 0 0 0 0 0 Nutrition Not at all % 1 (100) 0 13 (52) 19 (63) 3 (38) To some extent % 25 (31) 36 (37) 30 (28) 1 27 (20) To a large extent % 74 (10) 65 (20) 56 (13) 80 (15) 70 (8) Unknown % 0 0 0 0 0 Seasonal management Not at all % 35 (25) 9 (62) 20 (36) 28 (43) 27 (20) To some extent % 15 (50) 22 (52) 33 (28) 10 (77) 19 (28) To a large extent % 50 (14) 69 (19) 46 (17) 62 (21) 53 (9) Unknown % 0 0 0 0 0 Commercial beekeeping Not at all % 16 (42) 11 (92) 22 (34) 21 (44) 16 (29) To some extent % 52 (16) 37 (36) 33 (27) 53 (25) 46 (13) To a large extent % 33 (23) 52 (24) 44 (17) 26 (38) 38 (14) Unknown % 0 0 0 0 0 Queen raising Not at all % 30 (25) 7 (5) 31 (24) 20 (60) 25 (19) To some extent % 22 (49) 36 (36) 33 (26) 36 (36) 27 (26) To a large extent % 48 (18) 57 (23) 34 (22) 45 (31) 48 (12) Unknown % 0 0 0 0 0 Marketing Not at all % 22 (33) 25 (49) 23 (33) 19 (49) 22 (23) To some extent % 31 (37) 9 (53) 35 (26) 11 (69) 26 (27) To a large extent % 47 (19) 63 (20) 40 (20) 70 (17) 50 (12) Unknown % 1 (65) 3 (97) 0 0 1 (64) Other Not at all % 61 (12) 32 (27) 53 (14) 41 (25) 53 (9) To some extent % 0 0 0 0 0 To a large extent % 0 11 (63) 0 0 2 (63) Unknown % 40 (18) 57 (11) 46 (16) 59 (18) 45 (10)

65
10.5.18. Importance of availability of information for honeybee businesses, by state, 2006-07 Average per business New South Wales Victoria Queensland South Australia Western Australia Tasmania Estimate RSE Estimate RSE Estimate RSE Estimate RSE Estimate RSE Estimate RSE Honey flora Not at all % 24 (40) 26 (40) 0 44 (14) 3 (84) 6 (78) To some extent % 22 (47) 2 (108) 0 10 (72) 15 (68) 5 (62) To a large extent % 54 (10) 72 (15) 100 46 (14) 80 (13) 89 (6) Unknown % 0 0 0 0 0 0 Bee diseases and pests Not at all % 1 (91) 0 0 0 8 (100) 0 To some extent % 13 (73) 7 (73) 0 7 (106) 0 0 To a large extent % 86 (11) 93 (5) 100 93 (8) 89 (10) 100 Unknown % 0 0 0 0 0 0 Bee and hive health Not at all % 1 (91) 6 (78) 0 15 (71) 15 (68) 0 To some extent % 31 (31) 17 (53) 7 (131) 21 (49) 12 (56) 0 To a large extent % 68 (14) 77 (12) 93 (10) 63 (22) 70 (16) 100 Unknown % 0 0 0 0 0 0 Honey extraction packing and packaging Not at all % 30 (34) 14 (58) 8 (152) 28 (40) 27 (44) 11 (45) To some extent % 50 (29) 56 (27) 46 (43) 55 (23) 38 (34) 29 (21) To a large extent % 21 (56) 31 (46) 47 (52) 17 (33) 32 (26) 60 (10) Unknown % 0 0 0 0 0 0 Management systems Not at all % 48 (20) 23 (59) 4 (93) 53 (9) 27 (44) 17 (34) To some extent % 31 (42) 48 (20) 45 (45) 30 (23) 21 (51) 29 (26) To a large extent % 19 (55) 30 (47) 51 (38) 17 (42) 50 (11) 55 (12) Unknown % 2 (91) 0 0 0 0 0 Pollination Not at all % 40 (36) 16 (56) 0 33 (34) 47 (27) 10 (46) To some extent % 32 (48) 21 (65) 20 (80) 27 (49) 22 (53) 11 (41) To a large extent % 28 (31) 62 (24) 80 (20) 40 (18) 28 (30) 79 (7) Unknown % 0 0 0 0 0 0 Pesticides Not at all % 10 (77) 17 (72) 0 19 (60) 11 (77) 6 (67) To some extent % 6 (112) 16 (54) 7 (64) 18 (42) 32 (39) 28 (27) To a large extent % 84 (11) 67 (22) 93 (5) 62 (22) 54 (25) 67 (11) Unknown % 0 0 0 0 0 0 State regulations Not at all % 29 (39) 8 (70) 2 (109) 45 (0) 11 (77) 0 To some extent % 35 (42) 43 (36) 82 (13) 45 (15) 59 (22) 34 (25) To a large extent % 37 (36) 50 (31) 16 (65) 10 (67) 28 (44) 66 (13)

66
10.5.18. Continued… Importance of availability of information for honeybee businesses, by state, 2006-07 Average per business Unknown % 0 0 0 0 0 0 Hive equipment Not at all % 18 (59) 9 (47) 1 (111) 39 (27) 28 (40) 5 (62) To some extent % 59 (27) 50 (31) 53 (38) 53 (21) 36 (36) 41 (20) To a large extent % 24 (53) 41 (37) 46 (45) 9 (59) 33 (39) 55 (15) Unknown % 0 0 0 0 0 0 Nutrition Not at all % 4 (82) 4 (65) 0 4 (95) 11 (77) 0 To some extent % 33 (35) 27 (39) 6 (75) 39 (34) 46 (24) 11 (41) To a large extent % 63 (19) 69 (16) 94 (4) 57 (24) 40 (19) 89 (5) Unknown % 0 0 0 0 0 0 Seasonal management Not at all % 46 (31) 5 (61) 4 (105) 54 (12) 22 (50) 0 To some extent % 26 (45) 25 (52) 6 (63) 8 (60) 30 (42) 11 (41) To a large extent % 27 (37) 71 (18) 91 (6) 37 (20) 45 (27) 89 (5) Unknown % 0 0 0 0 0 0 Commercial beekeeping Not at all % 23 (50) 3 (95) 1 (110) 49 (7) 17 (57) 5 (62) To some extent % 43 (28) 58 (26) 49 (34) 24 (35) 51 (23) 58 (14) To a large extent % 34 (30) 40 (38) 50 (34) 28 (30) 29 (29) 38 (22) Unknown % 0 0 0 0 0 0 Queen raising Not at all % 23 (47) 53 (21) 2 (109) 37 (26) 18 (59) 0 To some extent % 29 (38) 25 (40) 20 (80) 35 (35) 31 (39) 29 (29) To a large extent % 48 (13) 23 (45) 79 (20) 28 (30) 49 (13) 71 (12) Unknown % 0 0 0 0 0 0 Marketing Not at all % 31 (36) 17 (50) 2 (108) 49 (7) 16 (61) 0 To some extent % 19 (59) 58 (26) 16 (95) 12 (44) 28 (44) 46 (15) To a large extent % 50 (12) 25 (50) 81 (19) 34 (21) 54 (25) 54 (13) Unknown % 0 0 0 5 (97) 0 0 Other Not at all % 66 (14) 21 (60) 83 (15) 36 (39) 0 48 (19) To some extent % 0 0 0 0 0 0 To a large extent % 0 0 7 (179) 5 (97) 4 (78) 0 Unknown % 35 (27) 79 (16) 11 (52) 60 (23) 94 (3) 52 (17)
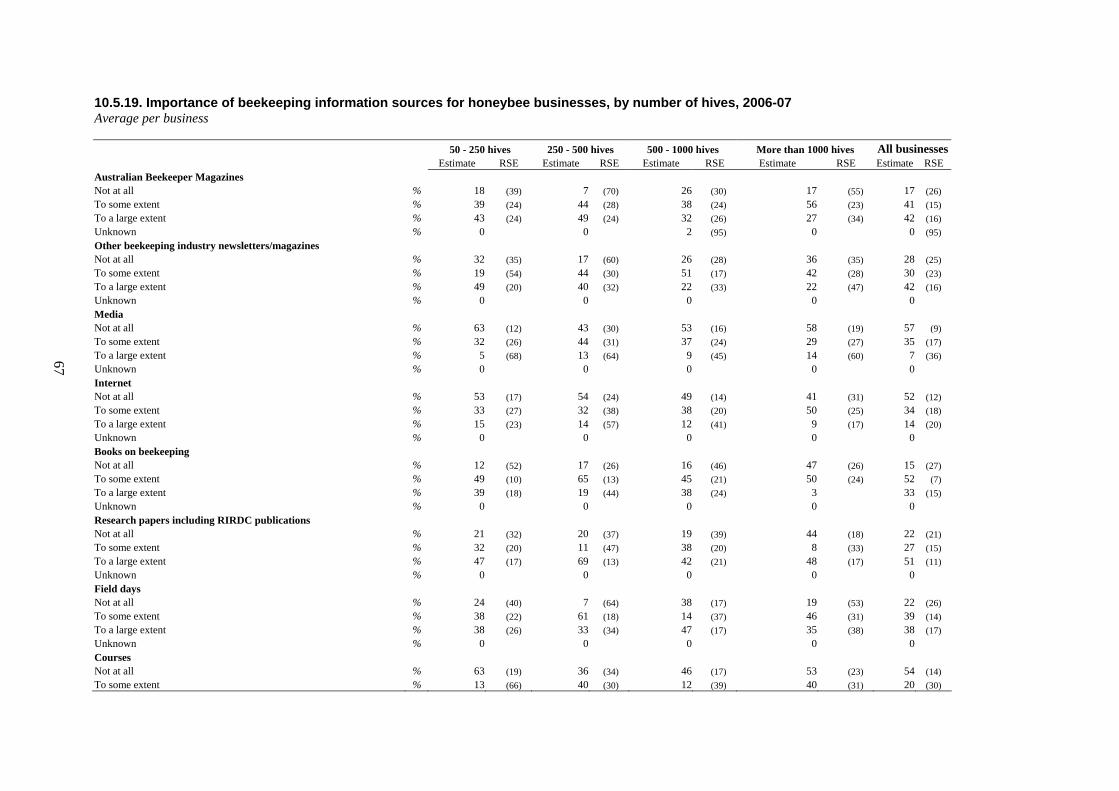
67
10.5.19. Importance of beekeeping information sources for honeybee businesses, by number of hives, 2006-07 Average per business 50 - 250 hives 250 - 500 hives 500 - 1000 hives More than 1000 hives All businesses Estimate RSE Estimate RSE Estimate RSE Estimate RSE Estimate RSE Australian Beekeeper Magazines Not at all % 18 (39) 7 (70) 26 (30) 17 (55) 17 (26) To some extent % 39 (24) 44 (28) 38 (24) 56 (23) 41 (15) To a large extent % 43 (24) 49 (24) 32 (26) 27 (34) 42 (16) Unknown % 0 0 2 (95) 0 0 (95) Other beekeeping industry newsletters/magazines Not at all % 32 (35) 17 (60) 26 (28) 36 (35) 28 (25) To some extent % 19 (54) 44 (30) 51 (17) 42 (28) 30 (23) To a large extent % 49 (20) 40 (32) 22 (33) 22 (47) 42 (16) Unknown % 0 0 0 0 0 Media Not at all % 63 (12) 43 (30) 53 (16) 58 (19) 57 (9) To some extent % 32 (26) 44 (31) 37 (24) 29 (27) 35 (17) To a large extent % 5 (68) 13 (64) 9 (45) 14 (60) 7 (36) Unknown % 0 0 0 0 0 Internet Not at all % 53 (17) 54 (24) 49 (14) 41 (31) 52 (12) To some extent % 33 (27) 32 (38) 38 (20) 50 (25) 34 (18) To a large extent % 15 (23) 14 (57) 12 (41) 9 (17) 14 (20) Unknown % 0 0 0 0 0 Books on beekeeping Not at all % 12 (52) 17 (26) 16 (46) 47 (26) 15 (27) To some extent % 49 (10) 65 (13) 45 (21) 50 (24) 52 (7) To a large extent % 39 (18) 19 (44) 38 (24) 3 33 (15) Unknown % 0 0 0 0 0 Research papers including RIRDC publications Not at all % 21 (32) 20 (37) 19 (39) 44 (18) 22 (21) To some extent % 32 (20) 11 (47) 38 (20) 8 (33) 27 (15) To a large extent % 47 (17) 69 (13) 42 (21) 48 (17) 51 (11) Unknown % 0 0 0 0 0 Field days Not at all % 24 (40) 7 (64) 38 (17) 19 (53) 22 (26) To some extent % 38 (22) 61 (18) 14 (37) 46 (31) 39 (14) To a large extent % 38 (26) 33 (34) 47 (17) 35 (38) 38 (17) Unknown % 0 0 0 0 0 Courses Not at all % 63 (19) 36 (34) 46 (17) 53 (23) 54 (14) To some extent % 13 (66) 40 (30) 12 (39) 40 (31) 20 (30)
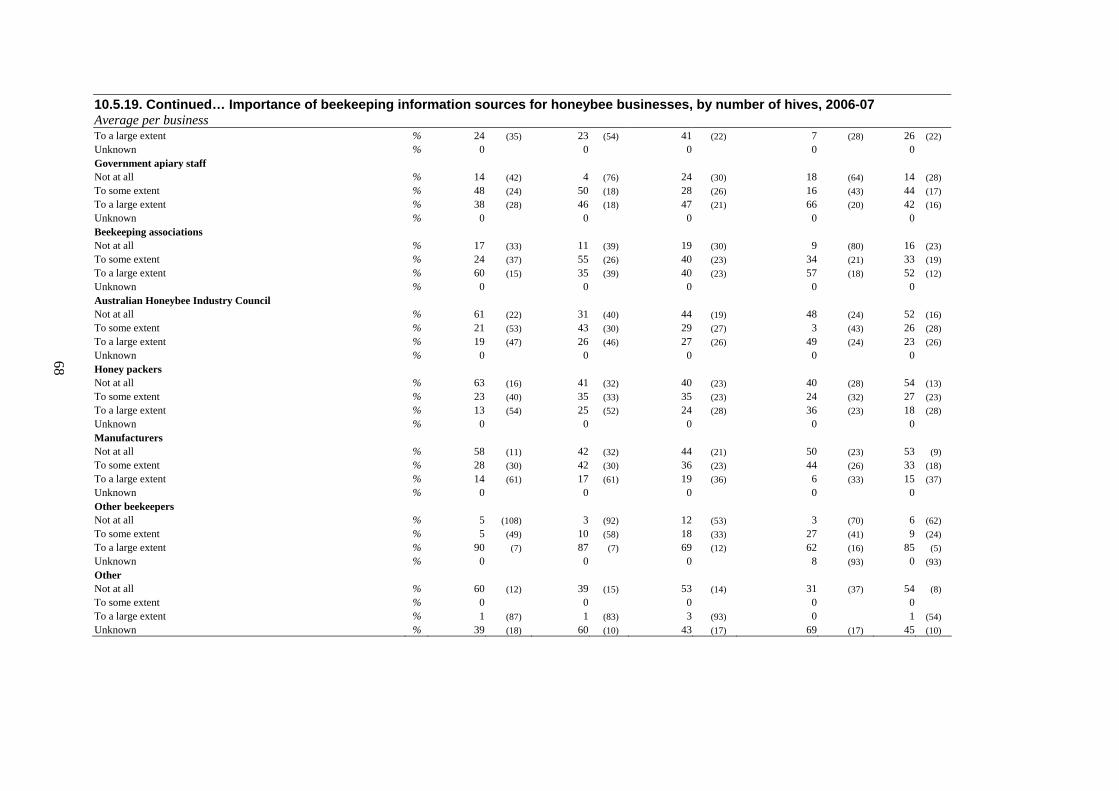
68
10.5.19. Continued… Importance of beekeeping information sources for honeybee businesses, by number of hives, 2006-07 Average per business To a large extent % 24 (35) 23 (54) 41 (22) 7 (28) 26 (22) Unknown % 0 0 0 0 0 Government apiary staff Not at all % 14 (42) 4 (76) 24 (30) 18 (64) 14 (28) To some extent % 48 (24) 50 (18) 28 (26) 16 (43) 44 (17) To a large extent % 38 (28) 46 (18) 47 (21) 66 (20) 42 (16) Unknown % 0 0 0 0 0 Beekeeping associations Not at all % 17 (33) 11 (39) 19 (30) 9 (80) 16 (23) To some extent % 24 (37) 55 (26) 40 (23) 34 (21) 33 (19) To a large extent % 60 (15) 35 (39) 40 (23) 57 (18) 52 (12) Unknown % 0 0 0 0 0 Australian Honeybee Industry Council Not at all % 61 (22) 31 (40) 44 (19) 48 (24) 52 (16) To some extent % 21 (53) 43 (30) 29 (27) 3 (43) 26 (28) To a large extent % 19 (47) 26 (46) 27 (26) 49 (24) 23 (26) Unknown % 0 0 0 0 0 Honey packers Not at all % 63 (16) 41 (32) 40 (23) 40 (28) 54 (13) To some extent % 23 (40) 35 (33) 35 (23) 24 (32) 27 (23) To a large extent % 13 (54) 25 (52) 24 (28) 36 (23) 18 (28) Unknown % 0 0 0 0 0 Manufacturers Not at all % 58 (11) 42 (32) 44 (21) 50 (23) 53 (9) To some extent % 28 (30) 42 (30) 36 (23) 44 (26) 33 (18) To a large extent % 14 (61) 17 (61) 19 (36) 6 (33) 15 (37) Unknown % 0 0 0 0 0 Other beekeepers Not at all % 5 (108) 3 (92) 12 (53) 3 (70) 6 (62) To some extent % 5 (49) 10 (58) 18 (33) 27 (41) 9 (24) To a large extent % 90 (7) 87 (7) 69 (12) 62 (16) 85 (5) Unknown % 0 0 0 8 (93) 0 (93) Other Not at all % 60 (12) 39 (15) 53 (14) 31 (37) 54 (8) To some extent % 0 0 0 0 0 To a large extent % 1 (87) 1 (83) 3 (93) 0 1 (54) Unknown % 39 (18) 60 (10) 43 (17) 69 (17) 45 (10)

69
10.5.20. Importance of beekeeping information sources for honeybee businesses, by state, 2006-07 Average per business New South Wales Victoria Queensland South Australia Western Australia Tasmania Estimate RSE Estimate RSE Estimate RSE Estimate RSE Estimate RSE Estimate RSE Australian Beekeeper Magazines Not at all % 17 (56) 19 (52) 2 (86) 33 (41) 44 (30) 0 To some extent % 32 (37) 35 (32) 72 (11) 30 (45) 26 (44) 12 (50) To a large extent % 51 (29) 46 (22) 25 (33) 37 (35) 27 (46) 88 (7) Unknown % 0 0 2 (109) 0 0 0 Other beekeeping industry newsletters/magazines Not at all % 23 (45) 31 (45) 36 (55) 34 (37) 15 (62) 6 (78) To some extent % 24 (33) 29 (37) 42 (51) 36 (27) 26 (44) 11 (51) To a large extent % 53 (24) 39 (39) 22 (36) 30 (45) 56 (23) 83 (8) Unknown % 0 0 0 0 0 0 Media Not at all % 56 (21) 68 (16) 60 (19) 40 (31) 61 (22) 58 (15) To some extent % 40 (29) 32 (32) 28 (44) 42 (32) 27 (46) 32 (26) To a large extent % 4 (86) 0 12 (67) 18 (42) 10 (69) 10 (46) Unknown % 0 0 0 0 0 0 Internet Not at all % 46 (28) 61 (25) 57 (8) 56 (16) 41 (33) 50 (17) To some extent % 51 (24) 23 (58) 15 (42) 36 (23) 29 (43) 28 (28) To a large extent % 3 (107) 16 (60) 28 (28) 9 (73) 27 (44) 22 (34) Unknown % 0 0 0 0 0 0 Books on beekeeping Not at all % 21 (47) 10 (36) 0 30 (44) 26 (45) 5 (62) To some extent % 54 (8) 23 (42) 69 (21) 58 (24) 42 (32) 90 (5) To a large extent % 25 (39) 67 (15) 31 (46) 12 (44) 29 (43) 6 (67) Unknown % 0 0 0 0 0 0 Research papers including RIRDC publications Not at all % 23 (45) 28 (38) 5 (183) 41 (30) 28 (44) 0 To some extent % 10 (77) 28 (37) 55 (31) 26 (34) 45 (30) 17 (40) To a large extent % 67 (19) 45 (16) 40 (34) 33 (39) 25 (34) 83 (8) Unknown % 0 0 0 0 0 0 Field days Not at all % 28 (48) 28 (38) 2 (108) 24 (53) 36 (31) 5 (62) To some extent % 36 (32) 36 (42) 55 (23) 36 (38) 16 (45) 65 (14) To a large extent % 36 (39) 35 (41) 43 (30) 40 (30) 45 (29) 31 (29) Unknown % 0 0 0 0 0 0 Courses Not at all % 62 (21) 81 (11) 41 (49) 13 (72) 57 (23) 5 (62) To some extent % 12 (32) 14 (59) 24 (68) 46 (30) 14 (56) 65 (14) To a large extent % 27 (50) 6 (96) 35 (40) 41 (31) 27 (44) 31 (29)

70
10.5.20. Continued… Importance of beekeeping information sources for honeybee businesses, by state, 2006-07 Average per business Unknown % 0 0 0 0 0 0 Government apiary staff Not at all % 14 (59) 6 (51) 1 (82) 31 (43) 43 (31) 17 (33) To some extent % 46 (35) 29 (51) 50 (34) 57 (25) 33 (38) 52 (18) To a large extent % 40 (38) 65 (23) 49 (36) 13 (43) 21 (56) 31 (26) Unknown % 0 0 0 0 0 0 Beekeeping associations Not at all % 9 (74) 30 (34) 2 (100) 34 (37) 28 (44) 0 To some extent % 32 (38) 37 (41) 26 (53) 45 (32) 39 (31) 11 (51) To a large extent % 59 (23) 33 (45) 72 (19) 21 (34) 30 (42) 89 (6) Unknown % 0 0 0 0 0 0 Australian Honeybee Industry Council Not at all % 52 (32) 65 (15) 47 (41) 51 (11) 39 (34) 6 (78) To some extent % 21 (55) 18 (47) 36 (57) 36 (23) 35 (37) 11 (51) To a large extent % 27 (49) 17 (41) 17 (46) 14 (52) 24 (49) 83 (8) Unknown % 0 0 0 0 0 0 Honey packers Not at all % 67 (14) 32 (34) 50 (39) 60 (12) 52 (14) 59 (16) To some extent % 11 (29) 45 (34) 42 (39) 32 (26) 17 (43) 31 (28) To a large extent % 23 (44) 24 (59) 8 (124) 8 (60) 28 (30) 10 (40) Unknown % 0 0 0 0 0 0 Manufacturers Not at all % 52 (14) 40 (37) 59 (19) 60 (12) 63 (13) 59 (16) To some extent % 27 (39) 49 (31) 31 (23) 31 (27) 24 (35) 31 (28) To a large extent % 21 (61) 11 (76) 10 (99) 9 (59) 11 (64) 10 (40) Unknown % 0 0 0 0 0 0 Other beekeepers Not at all % 10 (91) 0 0 10 (67) 13 (76) 11 (51) To some extent % 3 (110) 11 (53) 8 (59) 23 (51) 13 (68) 36 (24) To a large extent % 88 (11) 88 (7) 92 (5) 68 (19) 72 (15) 54 (17) Unknown % 0 2 (99) 0 0 0 0 Other Not at all % 64 (15) 20 (61) 90 (6) 36 (39) 0 48 (19) To some extent % 0 0 0 0 0 0 To a large extent % 0 3 (87) 0 0 15 (67) 0 Unknown % 36 (27) 77 (16) 11 (52) 65 (21) 83 (12) 52 (17)

71
10.5.21. Pollination service provision of honeybee businesses, by number of hives, 2006-07 Average per business 50 - 250 hives 250 - 500 hives 500 - 1000 hives More than 1000 hives All businesses Estimate RSE Estimate RSE Estimate RSE Estimate RSE Estimate RSE Honeybee businesses providing pollination services no 190 129 121 40 481 Proportion receiving payment for pollination services % 57 (22) 83 (16) 91 (9) 98 (3) 76 (8) Proportion providing pollination services to: Vegetables % 0 28 (67) 1 (106) 17 (80) 9 (56) Pumpkins % 35 (89) 27 (70) 7 (92) 16 (89) 24 (56) Onions % 1 (65) 0 6 (97) 16 (89) 3 (59) Carrots % 1 (65) 1 (57) 0 0 1 (44) Cauliflowers % 1 (66) 0 0 0 0 (66) Broccoli % 0 12 (92) 0 0 3 (92) Cabbage % 1 (65) 0 0 0 0 (65) Clover % 0 0 0 4 (131) 0 Melons % 0 27 (70) 6 (99) 0 9 (61) Sunflower % 0 15 (103) 0 32 (63) 7 (67) Canola % 31 (91) 24 (63) 34 (47) 37 (52) 30 (42) Lucerne % 0 7 (98) 59 (24) 44 (48) 21 (21) Fababeans % 0 0 0 14 (93) 1 (93) seed/seedlngs % 0 12 (92) 0 0 3 (92) Pome fruit % 0 0 7 (94) 0 2 (94) Apples % 25 (51) 21 (78) 15 (62) 17 (88) 21 (35) Pears % 0 0 20 (54) 0 5 (54) Nashi fruit % 0 0 7 (89) 14 (93) 3 (65) Peaches % 4 (110) 0 0 0 2 (0) Apricots % 4 (110) 0 13 (66) 0 5 (57) Plums % 6 (77) 0 8 (81) 0 4 (56) Cherries % 79 (49) 1 (57) 13 (68) 34 (47) 38 (41) Almonds % 8 (112) 62 (12) 73 (14) 94 (7) 46 (10) Vine crops % 17 (81) 0 0 0 7 (81) Avocadoes % 4 (110) 18 (121) 6 (99) 0 8 (80) Olives % 0 0 0 14 (93) 1 (93) Kiwifruit % 13 (99) 0 7 (89) 14 (93) 8 (66) Nuts % 0 18 (121) 32 (64) 5 (135) 13 (59) Other fruit % 60 (66) 2 (36) 14 (42) 33 (50) 31 (51) Undisclosed pollination % 0 0 2 (62) 0 1 (62)

72
10.5.22. Pollination service provision of honeybee businesses, by state, 2006-07 Average per business
New South Wales Victoria Queensland South Australia Western Australia Tasmania
Estimat
e RSE Estimat
e RSE Estimate RSE Estimate RSE Estimat
e RSE Estimate RSE Honeybee businesses providing pollination services no 94 132 107 100 33 15 Proportion receiving payment for pollination services % 59 (43) 100 58 (29) 66 (24) 100 100 Proportion providing pollination services to: Vegetables % 22 (97) 0 18 (112) 0 0 33 (22) Pumpkins % 23 (89) 0 87 (54) 0 0 0 Onions % 7 (101) 6 (97) 0 0 0 12 (65) Carrots % 0 0 0 0 0 23 (45) Cauliflowers % 0 0 0 0 0 12 (66) Broccoli % 16 (118) 0 0 0 0 0 Cabbage % 0 0 0 0 0 12 (65) Clover % 0 0 0 0 0 10 (64) Melons % 16 (118) 0 24 (92) 0 0 0 Sunflowerr % 7 (101) 5 (99) 18 (112) 0 0 0 Canola % 22 (51) 44 (89) 18 (139) 46 (67) 0 10 (64) Lucerne % 22 (51) 11 (65) 0 65 (21) 0 0 Fababeans % 0 4 (100) 0 0 0 0 seed/seedlngs % 16 (118) 0 0 0 0 0 Pome fruit % 0 0 0 9 (92) 0 0 Apples % 0 30 (64) 25 (82) 9 (92) 57 (7) 38 (43) Pears % 9 (84) 6 (97) 0 9 (92) 0 0 Nashifruit % 9 (84) 4 (100) 0 0 0 0 Peaches % 0 0 0 0 23 (110) 0 Apricots % 9 (84) 6 (97) 0 0 23 (110) 0 Plums % 0 6 (87) 2 (165) 0 31 (84) 0 Cherries % 58 (82) 35 (55) 0 55 (70) 58 (48) 50 (28) Almonds % 59 (43) 59 (27) 0 87 (32) 0 0 Vine crops % 0 23 (85) 0 0 0 17 (71) Avocadoes % 0 0 29 (117) 0 23 (110) 0 Olives % 0 4 (100) 0 0 0 0 Kiwifruit % 9 (84) 23 (81) 0 0 0 0 Nuts % 23 (74) 0 40 (102) 0 0 0 Other fruit % 15 (79) 5 (124) 69 (62) 47 (81) 3 (129) 37 (40) Undisclosed pollination % 0 0 0 0 8 (116) 0

73
10.5.23. Future pollination service provision by honeybee businesses, by number of hives, 2006-07 Average per business 50 - 250 hives 250 - 500 hives 500 - 1000 hives More than 1000 hives All businesses Estimate RSE Estimate RSE Estimate RSE Estimate RSE Estimate RSEProportion expecting to expand or commence pollination services % 26 (30) 39 (29) 64 (14) 63 (21) 36 (15) Constraints to expansion of pollination services: Knowledge and experience constraints % 4 (74) 4 (95) 10 (45) 19 (51) 5 (36)Physical constraints % 26 (24) 17 (43) 37 (19) 21 (44) 26 (16)Financial constraints % 3 (153) 5 (77) 17 (41) 19 (60) 7 (52)Prices too low % 35 (14) 60 (22) 31 (19) 44 (22) 40 (10)Additional infrastructure or assets needed % 8 (52) 19 (23) 7 (66) 7 (95) 10 (27)Too hard % 42 (24) 33 (35) 10 (47) 12 (58) 34 (19) Proportion facing a constraint to pollination service expansion % 80 (4) 73 (16) 65 (9) 65 75 (4) Of those expecting to expand or commence pollination services: Hives operated at 30 June 2007 no 134 (11) 316 (10) 632 (5) 1533 (10) 422 (4)Hives expected to be used for pollination services in next 2 years no 154 (12) 249 (28) 585 (17) 1467 (18) 397 (10)Hives expected to be used for pollination services in next 5 years no 275 (13) 331 (36) 768 (21) 1985 (15) 558 (11)

74
10.5.24. Future pollination service provision by honeybee businesses, by state, 2006-07 Average per business New South Wales Victoria Queensland South Australia Western Australia Tasmania
Estimate RSE Estimat
e RSE Estimat
e RSE Estimate RSE Estimate RSE Estimat
e RSE Proportion expecting to expand or commence pollination services % 23 (47) 45 (34) 50 (51) 43 (32) 33 (35) 37 (25) Constraints to expansion of pollination services: Knowledge and experience constraints % 2 (61) 7 (98) 10 (52) 4 (113) 10 (94) 0 Physical constraints % 28 (30) 0 46 (41) 36 (31) 15 (70) 8 (73) Financial constraints % 5 (70) 0 11 (53) 6 (93) 26 (45) 0 Prices too low % 52 (14) 0 56 (26) 40 (31) 44 (26) 37 (21) Additional infrastructure or assets needed % 2 (122) 0 28 (91) 17 (72) 10 (94) 14 (51) Too hard % 24 (53) 13 (65) 63 (41) 36 (37) 47 (26) 71 (11) Proportion facing a constraint to pollination service expansion % 84 (1) 20 (48) 97 (4) 96 (4) 87 (11) 88 (7) Of those expecting to expand or commence pollination services: Hives operated at 30 June 2007 no 651 (17) 274 (26) 399 (15) 429 (15) 298 (33) 171 (4) Hives expected to be used for pollination services in next 2 years no 633 (16) 341 (26) 323 (17) 340 (17) 89 (31) 146 (7) Hives expected to be used for pollination services in next 5 years no 900 (16) 544 (16) 399 (22) 462 (25) 182 (22) 180 (7)

75
10.5.25. Impact of challenges on honey and honey-related production, by number of hives, 2006-07 Average per business
50 - 250 hives 250 - 500 hives 500 - 1000 hives More than 1000 hives All businesses Estimate RSE Estimate RSE Estimate RSE Estimate RSE Estimate RSE Land clearance not at all % 53 (19) 43 (30) 43 (20) 58 (20) 50 (14) small extent % 31 (40) 39 (33) 20 (33) 29 (29) 31 (26) great extent % 16 (69) 19 (19) 36 (23) 13 (66) 19 (35) Tree/bush dieback not at all % 35 (30) 53 (26) 30 (30) 28 (41) 37 (19) small extent % 41 (29) 37 (34) 30 (29) 23 (11) 38 (21) great extent % 25 (43) 10 (70) 39 (23) 49 (23) 25 (27) Flood damage not at all % 91 (7) 97 (3) 90 (5) 91 (7) 92 (4) small extent % 1 (100) 0 9 (51) 9 (75) 2 (40) great extent % 8 (81) 4 (96) 0 0 6 (72) Salinity not at all % 88 (9) 88 (8) 89 (6) 80 (14) 88 (6) small extent % 9 (74) 7 (88) 8 (64) 8 (84) 8 (51) great extent % 3 (141) 4 (72) 3 (94) 12 (78) 4 (71) Weed control not at all % 39 (21) 24 (37) 35 (22) 25 (37) 35 (15) small extent % 25 (41) 44 (27) 8 (69) 21 (13) 26 (26) great extent % 36 (26) 32 (34) 56 (14) 54 (17) 39 (16) Conserved area access not at all % 62 (12) 29 (42) 20 (38) 29 (41) 48 (11) small extent % 13 (56) 32 (37) 26 (25) 11 (70) 19 (27) great extent % 25 (40) 39 (32) 53 (16) 61 (21) 34 (20) Drought not at all % 12 (38) 15 (56) 12 (56) 13 (57) 13 (27) small extent % 19 (44) 1 (64) 5 (78) 2 (71) 12 (41) great extent % 69 (13) 85 (10) 83 (9) 85 (9) 75 (8) Fire not at all % 57 (20) 39 (36) 41 (23) 29 (40) 50 (15) small extent % 22 (36) 42 (32) 30 (24) 30 (38) 28 (20) great extent % 21 (40) 19 (59) 28 (31) 40 (25) 22 (25) Pesticide use not at all % 44 (15) 28 (30) 39 (23) 33 (36) 39 (11) small extent % 39 (9) 35 (40) 28 (27) 47 (27) 37 (10) great extent % 17 (36) 37 (35) 32 (26) 20 (48) 24 (20) American foulbrood not at all % 67 (18) 32 (34) 51 (11) 66 (17) 58 (13) small extent % 25 (34) 48 (18) 38 (18) 24 (39) 32 (17) great extent % 8 (118) 20 (42) 10 (56) 11 (63) 11 (54) European foulbrood not at all % 52 (24) 26 (20) 46 (20) 61 (16) 46 (16) small extent % 47 (26) 65 (8) 43 (22) 32 (24) 50 (15)

76
10.5.25. Continued… Impact of challenges on honey and honey-related production, by number of hives, 2006-07 Average per business great extent % 1 (101) 9 (49) 10 (61) 8 (84) 4 (34) Chalkbrood not at all % 30 (40) 41 (30) 30 (23) 55 (18) 33 (23) small extent % 63 (20) 50 (25) 67 (11) 33 (23) 60 (14) great extent % 7 (59) 9 (83) 3 (94) 12 (56) 7 (42) Nosema not at all % 51 (18) 40 (34) 31 (22) 33 (34) 45 (14) small extent % 34 (32) 47 (29) 49 (19) 37 (38) 39 (18) great extent % 15 (54) 13 (40) 19 (37) 30 (40) 16 (32) Sacbrood not at all % 80 (9) 56 (24) 71 (10) 87 (8) 74 (7) small extent % 20 (38) 41 (34) 26 (27) 12 (57) 25 (22) great extent % 0 3 (97) 3 (92) 1 (0) 1 (64) Small hive beetle not at all % 54 (15) 35 (23) 61 (4) 71 (16) 52 (10) small extent % 29 (29) 22 (51) 23 (24) 10 (72) 26 (22) great extent % 17 (67) 44 (29) 15 (37) 19 (54) 22 (33) Wax moth not at all % 18 (59) 49 (25) 48 (19) 43 (33) 30 (23) small extent % 70 (16) 39 (36) 39 (23) 39 (32) 58 (13) great extent % 12 (42) 12 (65) 12 (44) 18 (58) 12 (29)

77
10.5.26. Impact of challenges on honey and honey-related production, by state, 2006-07 Average per business
New South Wales Victoria Queensland South Australia Western Australia Tasmania Estimate RSE Estimate RSE Estimate RSE Estimate RSE Estimate RSE Estimate RSE Land clearance not at all % 50 (26) 77 (18) 23 (35) 51 (10) 64 (18) 47 (20) small extent % 35 (37) 19 (73) 39 (61) 29 (25) 23 (43) 12 (51) great extent % 15 (67) 5 (67) 38 (65) 21 (23) 10 (62) 41 (22) Tree/bush dieback not at all % 45 (36) 33 (32) 19 (68) 33 (40) 58 (20) 90 (5) small extent % 40 (33) 20 (48) 51 (49) 46 (29) 29 (38) 6 (67) great extent % 15 (59) 47 (22) 30 (67) 21 (23) 10 (62) 5 (62) Flood damage not at all % 92 (9) 90 (12) 94 (4) 92 (5) 89 (10) 95 (3) small extent % 1 (301) 0 2 (108) 8 (60) 8 (100) 5 (62) great extent % 7 (109) 10 (109) 3 (99) 0 0 0 Salinity not at all % 80 (16) 96 (3) 93 (13) 92 (5) 80 (13) 100 small extent % 14 (76) 0 7 (172) 4 (93) 13 (72) 0 great extent % 5 (112) 4 (83) 0 (198) 4 (94) 4 (94) 0 Weed control not at all % 14 (67) 43 (36) 64 (28) 10 (72) 66 (17) 67 (13) small extent % 38 (41) 13 (68) 27 (67) 11 (56) 27 (41) 20 (38) great extent % 48 (29) 44 (34) 9 (48) 79 (10) 4 (79) 13 (51) Conserved area access not at all % 34 (34) 54 (21) 62 (29) 43 (22) 59 (20) 95 (4) small extent % 25 (42) 13 (60) 22 (76) 4 (93) 16 (61) 0 great extent % 41 (35) 33 (33) 16 (41) 53 (19) 22 (36) 6 (67) Drought not at all % 5 (74) 22 (58) 7 (73) 27 (43) 16 (49) 48 (19) small extent % 2 (102) 5 (97) 29 (80) 18 (63) 36 (29) 22 (33) great extent % 93 (5) 74 (18) 64 (37) 55 45 (28) 30 (29) Fire not at all % 45 (32) 52 (30) 61 (23) 47 (21) 32 (39) 72 (11) small extent % 33 (37) 14 (64) 32 (44) 32 (26) 24 (47) 12 (51) great extent % 22 (50) 34 (43) 7 (64) 21 (50) 41 (31) 17 (38) Pesticide use not at all % 38 (22) 58 (26) 33 (19) 12 (57) 52 (23) 82 (8) small extent % 44 (14) 18 (49) 50 (25) 34 (31) 24 (49) 5 (62) great extent % 19 (44) 24 (57) 17 (76) 54 (19) 22 (53) 13 (51) American foulbrood not at all % 58 (25) 80 (12) 44 (47) 46 (29) 48 (27) 73 (11) small extent % 36 (37) 17 (54) 37 (16) 30 (45) 43 (30) 27 (29) great extent % 7 (102) 3 (90) 19 (105) 24 (33) 6 (89) 0 European foulbrood not at all % 31 (40) 51 (22) 53 (46) 42 (34) 97 (2) 78 (10) small extent % 66 (20) 45 (25) 46 (54) 39 (34) 0 23 (35)
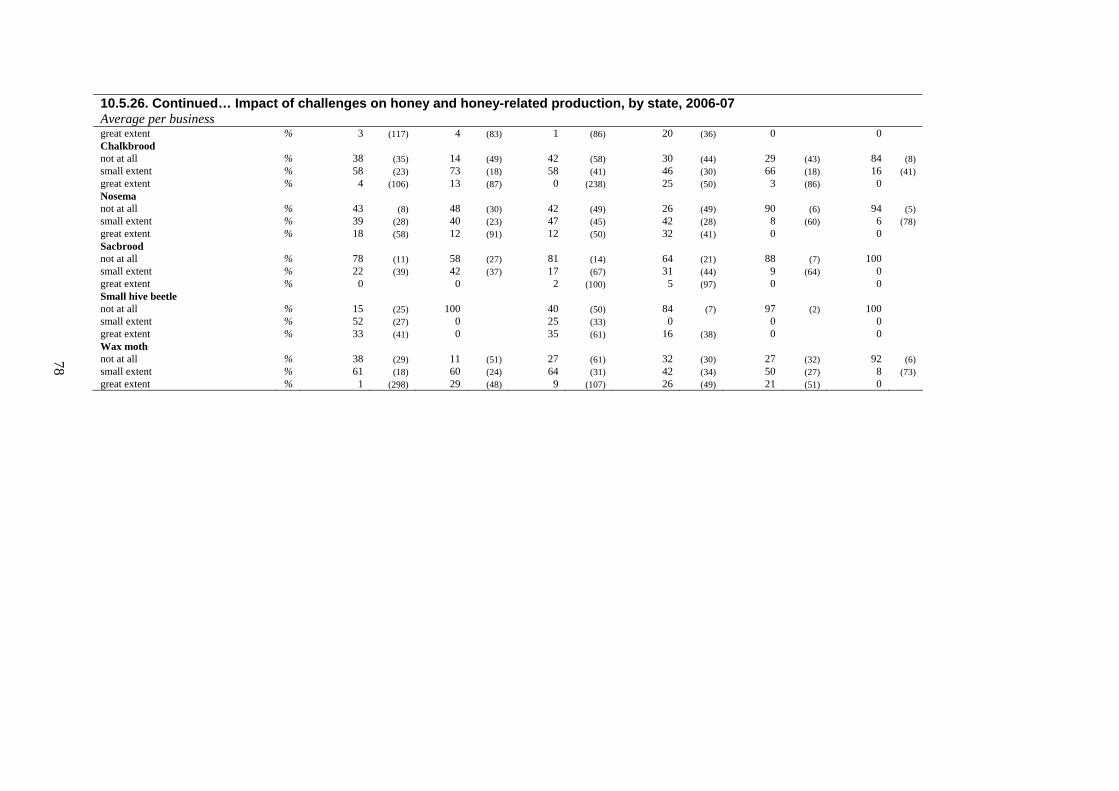
78
10.5.26. Continued… Impact of challenges on honey and honey-related production, by state, 2006-07 Average per business great extent % 3 (117) 4 (83) 1 (86) 20 (36) 0 0 Chalkbrood not at all % 38 (35) 14 (49) 42 (58) 30 (44) 29 (43) 84 (8) small extent % 58 (23) 73 (18) 58 (41) 46 (30) 66 (18) 16 (41) great extent % 4 (106) 13 (87) 0 (238) 25 (50) 3 (86) 0 Nosema not at all % 43 (8) 48 (30) 42 (49) 26 (49) 90 (6) 94 (5) small extent % 39 (28) 40 (23) 47 (45) 42 (28) 8 (60) 6 (78) great extent % 18 (58) 12 (91) 12 (50) 32 (41) 0 0 Sacbrood not at all % 78 (11) 58 (27) 81 (14) 64 (21) 88 (7) 100 small extent % 22 (39) 42 (37) 17 (67) 31 (44) 9 (64) 0 great extent % 0 0 2 (100) 5 (97) 0 0 Small hive beetle not at all % 15 (25) 100 40 (50) 84 (7) 97 (2) 100 small extent % 52 (27) 0 25 (33) 0 0 0 great extent % 33 (41) 0 35 (61) 16 (38) 0 0 Wax moth not at all % 38 (29) 11 (51) 27 (61) 32 (30) 27 (32) 92 (6) small extent % 61 (18) 60 (24) 64 (31) 42 (34) 50 (27) 8 (73) great extent % 1 (298) 29 (48) 9 (107) 26 (49) 21 (51) 0

Australian Honeybee Industry Survey 2006–07by Sarah Crooks
Australian Bureau of Resource Economics RIRDC Pub. No. 08/170
Contact RIRDC:Level 2
15 National CircuitBarton ACT 2600
PO Box 4776Kingston ACT 2604
Ph: 02 6271 4100Fax: 02 6271 4199
Email: [email protected]: www.rirdc.gov.au
This publication can be viewed at our website— www.rirdc.gov.au. All RIRDC books can be purchased from:
www.rirdc.gov.au/eshop
The Australian honeybee industry produced an estimated gross value of honey and beeswax of $75 million in 2007-08. At present the industry faces a number of challenges that include competition in both export and domestic markets and access to native flora. The industry also needs to maintain its competitiveness and comparative advantage as a supplier of high quality honey.
Limited information is available on the physical and financial characteristics of honey producing businesses to guide industry decision-making. In addition, little information is available on the demographic and socioeconomic circumstances of people involved in the industry.
This report presents results from a survey of Australian honeybee businesses conducted by the Australian Bureau of Agricultural and Resource Economics (ABARE) in May to June 2008. The survey updates earlier results from a survey conducted in 2002.
It provides an overview of the current situation of the Australian honeybee industry and presents estimates of production, socioeconomic and
financial characteristics of Australian beekeeping businesses during the 2006–07 financial year.
The primary audiences for this report are Australian beekeepers, industry and government policy makers and other beekeeping-related associations.
The Rural Industries Research and Development Corporation (RIRDC) manages and funds priority research and translates results into practical outcomes for industry.
Our business is about new products and services and better ways of producing them.
Most of the information we produce can be downloaded for free from our website: www.rirdc.gov.au.
RIRDC books can be purchased by phoning 02 6271 4160 or online at: www.rirdc.gov.au/eshop.
08-170 covers.indd 3 17/10/2008 11:52:53 AM
Related Documents