2 August 2017 Australian Grain Industry Conference 2017

Welcome message from author
This document is posted to help you gain knowledge. Please leave a comment to let me know what you think about it! Share it to your friends and learn new things together.
Transcript

2 August 2017
AustralianGrainIndustry
Conference2017

• WORLDWHEAT2017/18
– Themes• QualityIssues– TheGreatPastaDroughtof2017• WhyAreCashPricesNOTLower?• RussianExportCapacityIssues• USNeededasExporter?

WORLDWHEAT
2015/16 2016/17USDA 2017/18USDAJuly
2017/18MDPProject
Carry In 217.7 242.8 258.0 258.0Production 737.0 754.3 737.8 733.0
Ttl Supply 1124.7 1174.4 1173.8 1169.0
FeedUse 136.4 146.2 139.3 137.0Food/Indu/Seed 575.4 592.9 596.0 595.0Exports 172.9 181.6 178.4 176.0Ttl Demand 881.9 920.6 913.2 910.0
CarryOut 242.8 258.0 260.6 257.0
WorldWheatS&DMetTons(USDA)

WORLDWHEAT
2015/16 2016/17USDAJun
2017/18USDAJun
2017/18MDPProject
Carry Out 242.8 258.0 260.6 258.0US 26.6 32.2 25.5 25.0
China 97.0 111.0 127.2 127.0NetCarryOut 119.2 114.8 107.9 106.0EU 15.6 10.8 10.1 11.0Russia/Ukr 8.9 12.7 13.6 14.0Canada 5.2 7.2 5.2 4.5Australia 5.6 8.9 5.6 5.0Argentina 0.6 0.5 0.5 0.5ROWCarryOut 83.3 74.7 72.9 71.0
WorldWheatS&DMetTons(USDA)

LY31.7MMT‘1727.0MMT
LY62.9MMT‘1746.9MMT
LY35.1MMT‘1723.5MMT
LY26.8MMT‘1723.5MMT
WorldWheatProduction

LY17.0MMT‘1718.0MMT
LY72.5MMT‘1773.0MMT
LY145.5MMT‘17149.0MMT
WorldWheatProduction

GlobalWheatProduction
WorldWheatProduction MajorExportersin2016/17391.5MMTMajorExportersest 2017/18360.4MMT

GlobalWheatExports
WorldWheatExports– MajorExportersduring2016/17156.1MMTMajorExportersexpected2017/18156.0MMT

• Supply– MajorExportersProductionDown30MMTY-on-Y– “Strong”Wheat(Proteinsover12.5%onDMB)SignificantlyLowerSupply
• ThinkUS,CanadianSpringWheat,Durum,Russian13.5%+Protein,Australian?– “Lower”QualityWheat– SemiHardWheat– MorePlentiful
• ThinkRussian11.5%Protein,LowProteinUSHRWW,FeedWheat– ChineseStocksBuildingSince2014/15MYover25MM
• ROWGlobalStocksBuilding(ExChina)OverSamePeriodNegative11MMT
• Demand– CanWorldFeedWheatDemandStayElevated?– WillGlobalFoodDemandContractin2017/18?– CanRussiaHandle18-20%ofGlobalWheatExports?
• SpreadsForQualityDifferencesWidestSince2008
WorldWheatSummary

WorldWheatPricesLowerProtein
HRWW11.5%DMB$190
Ukraine11.5%DMB$184
French11%DMB$195
ASW$250

WorldWheatPricesQuality- 12.5%ProteinOB
HRWW12.5%DMB$19513.2%DMB$210
Russian$200
Baltic$203
ASW$265-70EC
Canada14.5%DMB$300xPNW

USWHEAT 2014/15 2015/16 2016/17 2017/18USDAJuly
2017/18MDPProject
Carry In 16.0 20.5 26.6 32.2 32.2Production 55.1 56.1 62.9 47.9
46.2x38.146.9
45.8x37.6
Ttl Supply 75.3 79.7 92.6 83.9 83.1
Feed/Resid 3.1 4.1 4.0 4.1 4.0Food 26.1 26.0 26.0 26.0 26.0Seed 2.2 1.8 1.7 1.8 1.8Exports 23.5 21.1 28.7 26.5 25.9Ttl Demand 54.8 53.1 60.4 58.4 57.7
CarryOut 20.5 26.6 32.2 25.5 25.4
AGIC2017USWheatS&D
MetTons(USDA)

• Supply– USProductionLower,BUTHighBeginningStocksBufferImpact– ProteinPremiumsVERYFirm
• ExpectSpringWheatSupplyRationedViaPrice– “Lower”QualityWheatPlentiful
• USHRWW11%ProteinDMB,SRWWinSurplus– USFuturesStructureRewardsStorage
• HugeReturnstoDeliveryStorage- $4/MTMonthReturn• 2.4MMTDeliverableWheatvsChicago,3.25MMTDeliverableWheatvsKCY
• Demand– USFeedDemandLimitedbyPlentifulCorn– USFoodDemandCapped– OlderPopulationandGlutionians– USWheatExportsMustBUYStocksOutofStorage
• SpreadsForQualityDifferencesWidestSince2008– DeliveryWheat,ByDefinition,NOTHigherQuality
USWheatSummary

CMEWheatMonthly

• WORLDCORN2017/18
– Themes• TechnologyOutpacesConsumption• WhyAreCashPricesNOTHigher?• ExportCapacityIssuesinSouthAmerica• Currencies• ChineseStocks– FakeNews?

WeatherandUSRowCropYields

WORLD CORN 2015/16 2016/17USDA 2017/18USDAJuly
2017/18MDPProject
Carry In 209.6 212.8 227.5 232.0Production 968.8 1068.8 1036.9 1012.5
Ttl Supply 1317.8 1418.5 1410.2 1390.3
FeedUse 602.5 631.3 652.2 640.0Food/Indu/Seed 363.1 422.7 411.4 405.0Exports 119.6 159.7 152.5 155.0Ttl Demand 1105.0 1191.0 1209.4 1210.0
CarryOut 212.8 227.5 200.8 190.3
WorldCornS&DMetTons(USDA)
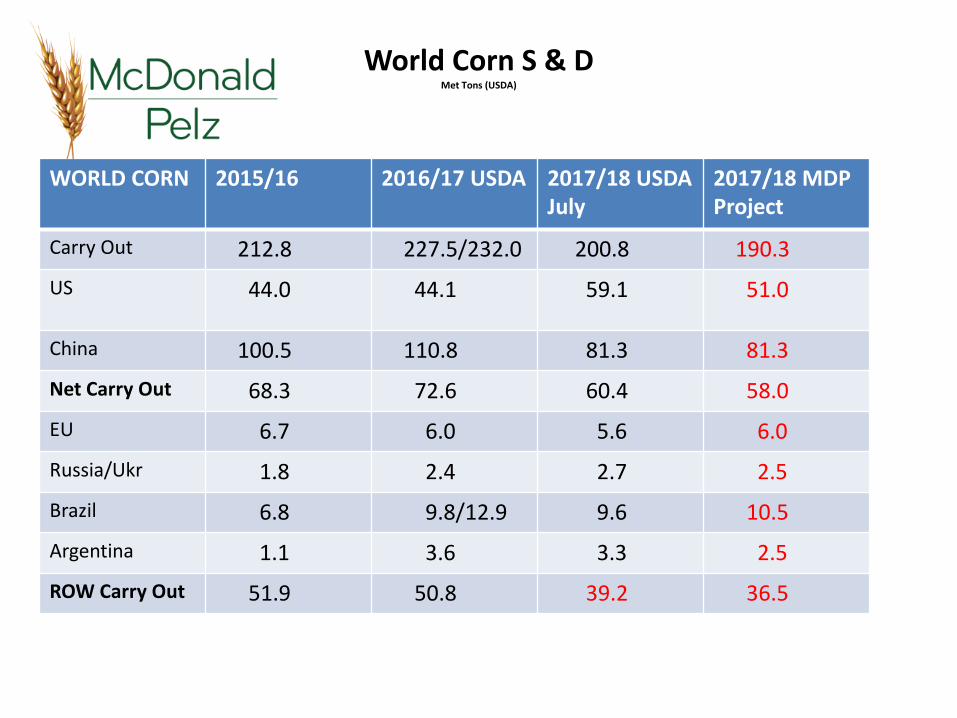
WORLDCORN 2015/16 2016/17USDA 2017/18USDAJuly
2017/18MDPProject
Carry Out 212.8 227.5/232.0 200.8 190.3US 44.0 44.1 59.1 51.0
China 100.5 110.8 81.3 81.3NetCarryOut 68.3 72.6 60.4 58.0EU 6.7 6.0 5.6 6.0Russia/Ukr 1.8 2.4 2.7 2.5Brazil 6.8 9.8/12.9 9.6 10.5Argentina 1.1 3.6 3.3 2.5ROWCarryOut 51.9 50.8 39.2 36.5
WorldCornS&DMetTons(USDA)

LY 384.8 MMT‘17 351.0 MMT
LY 219.6 MMT’17 203.0 MMT
LY 103.0 MMT‘17 95.0 MMT
LY 41.0 MMT‘17 40.0 MMT
LY 28.0 MMT‘17 27.0 MMT
Global Corn Production

AGIC2017
• Awhere slideChinaweather

• Supply– TotalSupplyLower,ButWorld(exChina)EndStocksFallLessThan10
MMT– USCropStillUnknown
• CropToursinAugustWillBetterHighlightYields– BrazilCropLargerThanExpectedOneMonthAgo– UkraineCrop– HowLarge?– ChineseCropandStocks– WhatisReality?
• Demand– CurrencyImpactonBrazilian,ArgentineExportFlows– 2017/18PlantingDecisionsInBrazil,Argentina– WillUSExportsAgainFindBuyersin2nd HalfofMarketingYear?
• ChineseBalanceSheetsVeryInteresting!
WorldCornS&DProspects

WorldBarleyProduction
WorldProduction2016/17148.0MMTWorldProduction2017/18138.5MMT

WorldBarleyProduction
WorldBarleyExports2016/1728.5MMTWorldBarleyExports2017/1824.2MMT

Currencies

USCORN 2015/16 2016/17USDAJune
2017/18USDAJune
2017/18MDPProjection
Carry In 44.0 44.1 60.2 60.2Production 345.5 384.8 362.1 351.0Ttl Supply 391.2 430.3 423.6 412.7
83.5HAx170.7 83.5HAx165.5
Feed/Residual 130.1 137.8 139.1 136.5Ethanol 132.7 138.4 139.7 139.7Food/Seed 36.1 37.3 38.1 38.0Exports 48.2 56.5 47.6 47.5Ttl Demand 347.1 370.1 364.5 361.7
CarryOut 44.1 60.2 59.1 51.0
USCornSupply&DemandMetTons(USDA)

CMECornMonthly

• Supply– HigherPlantedArea– Good/Excellentratinglower,butnotsignificantlylower.– YieldProjections– Marketusing/trading164-5bu/acre,down5%fromLY.– Marketexpectsa13.8– 14.2bil bushel(355MMT)USproductionestimate
duetolargerarea.Weareatjustunder14.0bil bushels(351MMT).– USJuneStocksHigherthanexpected,butexportinspectionsrunningstrong.
• Demand– Domestic85-87%ofTotalDemand– SouthAmericansellersverycompetitive.– Ukrainianmaizecropunderpressure,NOqualityoldcropsupply.– WillUSFarmerStoreEvenMOREofHisStocksOnFarmin2017/18?
• USEndingStocks– Issub2.1bil bushel(53.3MMT)USendingstockprojection$4.50/bushelCZ7?– Isa1.8bil bushel(45.7MMT)figureneededtomaintainrally?
USCornS&DProspects

• WHEAT– OnSurface,BearishGlobalFundamentalsfor2017/18MY– MajorExportersProductionDownSignificantly– MajorExportersNeedtoDrawDownStockstoServiceProjectedDemand
• FarmersNotAccommodatingBearishPundits– PriceWeaknessPossibleFeb2018ForwardIF2018NorthernHemisphereNewCropLooks
Promising• CORN
– OnSurface,BullishGlobalFundamentalsfor2017/18MY– SizableBrazilian,Argentine,USStocksCapPricesThroughCalendar2017– Ukrainianmaizecropunderpressure– Chinesemaizecropandstocks– HUGEunknowns?– WillUSFarmerStoreEvenMOREofHisStocksOnFarmin2017/18?
• USEndingStocks– Issub2.0BillionBushelUSCornEndingStocksForecast$4.00CH8Bullish?DoesMarketNEED
ToBUYCornAcresin2018?– Isa920MillionBushelUSWheatEndingStocksForecast$6.00WH8Bullish?
GrainsSummary

McDonaldPelzGlobalCommoditiesLLC
Aglobal,physicalagriculturalcommoditybrokeragefirmwithofficesintheUS,Brazil,Argentina,Turkey,Australia,China,India,andSingapore,we
workwithclientsthroughoutthesupplychain,providingsuperiorcustomerserviceandthoughtfulanalysis.
6720W121st Street,Suite102,OverlandPark,Kansas66209 Phone: (913)491-3711 Email: [email protected].,SuiteP,Boulder,Colorado80303 Phone:(303)543-7033 Email: [email protected],MapleGrove,MN 55311 Phone:(612)259-1024 Email: [email protected],Sullivan,IL61951 Phone(217)503-4455Email: [email protected]:53BelmontCrescent,MontmorencyVictoria3094,Australia Phone:+61394310133 Email: [email protected]#255,CampoBelo,SaoPaulo,Brasil CEP04515-001 Phone: +551150961866 Email:[email protected] CapitalFederal- BuenosAires- ArgentinaPhone:+541157780069drodriguez@mcdonaldpelzargentina.comKosuyoluMh.MahmutYesariSok.No.10,Kadikoy,Istanbul,Turkey Email:[email protected],CentrumPlaza,Sector53,GolfCourseRd,Gurgaon-122001IndiaEmail:[email protected],139RuijinRd#1,HuangpuDistr,Shanghai,China200020 Email:[email protected] Singapore [email protected]
THANKYOU
Related Documents