ISSN 1326-0200 Vol. 43 No. 6, 2019 The Journal of the Public Health Association of Australia Inc. Australian and New Zealand Journal of Public Health Indigenous Health Advertising Adolescent Health

Welcome message from author
This document is posted to help you gain knowledge. Please leave a comment to let me know what you think about it! Share it to your friends and learn new things together.
Transcript

ISSN 1326-0200 Vol. 43 No. 6, 2019Public Health Association
A U S T R A L I A
The Journal of the Public Health Association of Australia Inc.
Australian and New Zealand Journal of
Public Health
Indigenous Health Advertising Adolescent Health

Australian and New Zealand Journal of Public Health
Statement of policyThe Australian and New Zealand Journal of Public Health is the
journal of the Public Health Association of Australia. PHAA members have training in almost all of the human, natural and social sciences, at various levels of professional status. Some are employed to analyse the ideological, social or empirical features of the health service. Some begin from a basic, some from an applied, perspective; others come to research by reflecting on the work they do in health care – for example, organising industrial health services in a particular locality, trying to implement a patient-held record system or using lay helpers in a domiciliary care system. Others carry out formal epidemiological research into the correlates and causes of disease and of health-related behaviour.
The Australian and New Zealand Journal of Public Health is published six times a year, in February, April, June, August, October and December. Its contents are subject to normal refereeing processes. Finished discussions of research projects are the staple diet of the Journal, but there is space for reviews, views and historical pieces from time to time. The Journal is indexed by Australian Public Affairs Information Service, Cur rent Contents , Excer pta Medica, Index Medicus, the Cumulative Index to Nursing & Allied Health Literature and Social Sciences Citation Index and is available on microfiche from University Microfilms International.
Most of the disciplines embraced by PHAA publish journals that carry articles about facets of health, illness and health care. However, there is no other Australian journal that gives an overview of research across the broad range of PHAA interests, nor does any other journal aim to attract more than one or two of the many levels of workers in health care assessment and delivery. The Australian and New Zealand Journal of Public Health invites contributions which will add to knowledge in its fields of interest. It will give priority, after normal refereeing processes, to papers whose focus and content is specifically related to public health issues.
SubscriptionsPlease address all inquiries about subscriptions, membership, advertising and other PHAA matters to the Public Health Association of Australia Inc., PO Box 319, Curtin, ACT 2605. Phone (02) 6285 2373; Fax (02) 6282 5438; e-mail [email protected]; www.phaa.net.au
Editorial officePlease address all editorial correspondence to: The Editors, Australian and New Zealand Journal of Public Health, e-mail [email protected]
Editorial Board
Professor Ross BailieMenzies School of Health Research, Northern Territory
Dr Sandra CampbellCentre for Chronic Disease Prevention, James Cook University, Queensland
Professor Donna CrossTelethon Kids Institute, Western Australia
Professor Joan CunninghamMenzies School of Health Research, Northern Territory
Professor Chris Del MarFaculty of Health Sciences and Medicine, Bond University, Queensland
Professor Kevin DewSchool of Social and Cultural Studies, Victoria University of Wellington, New Zealand
Professor Annette DobsonSchool of Public Health, University of Queensland, Queensland
Dr Rhys JonesTe Kupenga Hauora Māori, University of Auckland, New Zealand
Professor John LynchSchool of Public Health, University of Adelaide, South Australia
Professor Robyn McDermottCentre for Chronic Disease Prevention, James Cook University, Queensland
Professor Robert McGeeDunedin School of Medicine, University of Otago, New Zealand
Professor Terry NolanSchool of Population and Global Health, The University of Melbourne, Victoria
Dr Yin ParadiesFaculty of Arts and Education, Deakin University, Victoria
Professor Andre RenzahoHumanitarian and Development Studies, Western Sydney University, New South Wales
Professor Peter SainsburyDirector, Population Health, South Western Sydney Local Health District, New South Wales
Professor Cindy ShannonPro-Vice Chancellor (Indigenous Education), The University of Queensland
Professor Alan ShiellSchool of Psychology and Public Health, La Trobe University, Victoria
Assoc. Prof. David ThomasTobacco Control Research, Menzies School of Public Health, Northern Territory
Professor Gavin TurrellSchool of Public Health and Social Work, Queensland University of Technology
Professor Alison VennMenzies Institute for Medical Research, University of Tasmania
Editor-in-Chief: Professor John Lowe
Adj. Assoc. Professor Priscilla Robinson School of Public Health, La Trobe University, Victoria
Dr Sandar Tin TinSchool of Population Health, The University of Auckland, New Zealand
Assoc. Professor Luke WolfendenSchool of Medicine and Public Health, The University of Newcastle, NSW
Editors:
Dr Melissa StonehamPublic Health Advocacy Institute WA, Curtin University, WA
Dr Hassan VallySchool of Psychology and Public Health, La Trobe University, Victoria
Dr Nikki PercivalAustralian Centre for Public and Population Health Research, University of Technology Sydney, NSW
Editor-in-Chief: Prof. John Lowe Book Review Editor: Jo-Anne Rayner Production: Journal Assist Pty Ltd.
ANZJPHThe Australian and New Zealand Journal of Public Health is the journal of the
Public Health Association of Australia Inc.
Volume 43, Number 6 December 2019
ContentsEditorial 509 Grace under fire
Priscilla Robinson
Commentary 510 Public Health in an Open Society: how society and language shape prevention, Gordon Oration, Public Health Prevention Conference, 2019Tarun Weeramanthri
516 Pathways to responding and preventing alcohol-related violence against women: why a gendered approach matters Angela Taft, Ingrid Wilson, Anne-Marie Laslett, Sandra Kuntsche
Advertising 519 Discretionary food advertising on television in 2017: a descriptive study Lisa G. Smithers, Xinyue Wang, Dandara Haag, Benjamin Agnew, John Lynch, Matthew Sorell
522 Public health job advertisements in Australia and New Zealand: a changing landscape Rory D. Watts, Devin C. Bowles, Colleen Fisher, Ian W. Li
529 Anti-smoking advertisements are perceived differently by smokers and individuals with health or advertising knowledge Natalia Lizama, Terry Slevin, Simone Pettigrew
Indigenous Health 532 Case study of a decolonising Aboriginal community controlled comprehensive primary health care response to alcohol-related harm Toby Freeman, Fran Baum, Tamara Mackean, Anna Ziersch, Juanita Sherwood, Tahnia Edwards, John Boffa
538 Holistic primary health care for Aboriginal and Torres Strait Islander prisoners: exploring the role of Aboriginal Community Controlled Health Organisations Simon Pettit, Paul Simpson, Jocelyn Jones, Megan Williams, M. Mofizul Islam, Anne Parkinson, Bianca Calabria, Tony Butler
544 The impact of hearing impairment on Aboriginal children’s school attendance in remote Northern Territory: a data linkage study Jiunn-Yih Su, Vincent Yaofeng He, Steven Guthridge, Damien Howard, Amanda Leach, Sven Silburn
551 Supporting healthy drink choices in remote Aboriginal and Torres Strait Islander communities: a community-led supportive environment approach Emma Fehring, Megan Ferguson, Clare Brown, Kirby Murtha, Cara Laws, Kiarah Cuthbert,
Kani Thompson, Tiffany Williams, Melinda Hammond, Julie Brimblecombe

2019 vol. 43 no. 6 Australian and New Zealand Journal of Public Health 508
Indigenous Health cont. 558 What isn’t measured isn’t done – eight years with no progress in Aboriginal and Torres Strait Islander adult influenza and pneumococcal vaccination Fleur Webster, Heather Gidding, Veronica Matthews, Richard Taylor, Robert Menzies
563 Barriers to vaccination service delivery within general practice: opportunity to make a sustainable difference in Aboriginal child health? Rebecca Carman, Lesley Andrew, Amanda Devine, Jacques Oosthuizen
570 The real divide: the use of algorithm-derived Indigenous status to measure disparities in sudden unexpected deaths in infancy in Queensland Rebecca A. Shipstone, Jeanine Young, John M.D. Thompson
Adolescent Health 577 Adolescent abortion in 11 high-income countries including Australia: towards the establishment of a minimum data set Anisa R. Assifi, Elizabeth A. Sullivan, Melissa Kang, Angela J. Dawson
582 Predictors of young people’s healthcare access in the digital age Fiona Robards, Melissa Kang, Georgina Luscombe, Lena Sanci, Katharine Steinbeck, Stephen Jan, Catherine Hawke, Marlene Kong, Tim Usherwood
Letter 589 A follow-up of sunscreen use and sun-protection practices in Darwin: a cross-sectional survey Joyce H.Y. Ma, Mark D. Chatfield, Kirsty Campbell, Dev Tilakaratne
Reviewers 591 Reviews in 2019
2019 vol. 43 no. 6 Australian and New Zealand Journal of Public Health 509© 2019 The Authors
This is an open access article under the terms of the Creative Commons Attribution-NonCommercial-NoDerivs License, which permits use and distribution in any medium, provided the original work is properly cited, the use is non-commercial and no modifications or adaptations are made.
Editorial
doi: 10.1111/1753-6405.12960
Grace under firePriscilla RobinsonANZJPH Editor
It seems no time has passed since the end of last year, but here we are again, reflecting on one year and anticipating another. All
of us will have had some wins and gains, and some losses. We will have both achieved and not achieved goals, made and failed to realise aspirations and been disappointed in lack of progress. However, a broad international scan of the past twelve months identifies no major highlights. Which is not to say it has not been an interesting time.
Public health problems which have been in the headlines – even if not so framed – have been the public treatment of women; climate change; the health and welfare of asylum seekers and refugees; and parenthood.
We have seen many people, who should know a lot better, behaving very badly. We have had several outbursts of racist and sexist comments, mainly but not entirely from grown men. An ‘interviewer’ has suggested that the prime minister of New Zealand needs to be silenced for her evidence-based views through suffocation by sock-shoving (the proffered apology for those comments hardly improved the seeming intent). Poisonous comments have been made about the new ‘mixed race’ royal baby. We have been told by a politician that ‘many’ women escaping domestic violence exaggerate the risks to themselves and their children, supported by another who thinks that court decisions in favour of these women somehow drive men to violent acts.
We also have done rather badly in the area of humanitarian assistance. Although preparations for wholesale relocations of entire populations because of the effects of climate change are beginning, most refugees are still displaced by conflict.1 Worldwide, closed borders leave displaced people unable to flee persecution or at personal risk (to home and family, work and resources), despite SDG 162 clearly stating the goal to “Promote peaceful and inclusive societies for sustainable development …” . Living free from problems of persecution with the ability to work in meaningful jobs is impossible for many people, and there are now more
refugees than ever before. That fleeing one’s home is a cause of great mental and physical ill-health is hardly news (see for example 3 for a personal reflection) and is arguably a matter for public health intervention. For the record, in international law there is absolutely nothing illegal in seeking asylum, nor in the manner by which those fleeing and seeking shelter arrive at a place of safety, be it by plane, train, bus, car, on foot, and in countries with a coastline by boat; or even by donkey. We have evidence that the people languishing in our off-shore facilities for people seeking refuge in Australia are suffering, physically and mentally. The Australian government continues to refuse to allow any to be resettled in New Zealand (NZ), a country which has offered to do so, apparently because it could be used as a back-door entry to Australia.
However, there are at last some signs of progress. For example, the grass-roots movement protesting the wilful lack of action to mitigate human contribution to climate change has gained traction, even in countries where leaders apparently cannot understand even a synopsis of the established and growing body of scientific evidence when schoolchildren clearly can – a win for their teachers! Whole communities are ignoring the national political status quo and building their own systems for sustainable energy and waste management. The USA – well known for its political support of carbon-based industries, including overt support of protection of oil plants in Middle Eastern war zones – already has about 10% of its energy supplied from renewable sources (Australia currently sits on about 20%), and Hawaii plans to be 100% renewable by 2045.
Mercifully, we have also seen some excellent examples of grace under fire, mainly from women. Much of the world seems to be suffering from a big dose of NZ Prime Minister envy, noting the immediate and ongoing response of Jacinda Arden to the events at the mosque in Christchurch (as well as managing to mother her daughter, including in the UN general assembly).
In an inspired response to a belittling set of comments from an adult who should know better, the interesting and fearless teenager Greta Thunberg who happens to have Asperger’s syndrome, has successfully deemed it a ‘superpower’ and not something to be mocked. Angela Merkel, Germany’s Chancellor, has openly stated that her country needs to increase efforts towards building a more tolerant society and combating climate change (this from a not particularly sunny country which has a stated policy of using 100% renewable energy by 2050.) Can we nominate her for World President maybe? Meghan Markle, Duchess of Sussex admitted to ongoing tearfulness and exhaustion (just like almost every other new mother) following the delivery of her son Archie, thus proving herself to be entirely human. She and her husband would prefer not to be hounded by the press at every turn, which adds unnecessary stress to an already complicated and life-changing event – no surprises there! And in the USA, four progressive congresswomen of various non-Anglo-Saxon heritages, nicknamed The Squad, have been standing up to an unpleasant barrage of racist abuse, not least from the US leadership claiming that they are not American.
The Middle Eastern infant refugee whose birthday we celebrate in late December grew into an outspoken adult with a passion for social justice. More of us need to be similarly unafraid to deal with the several ‘intelligent, genius’ adults who are running (or should that be ruining?) our world, exemplified by these brave women. And, as it is Christmas, remember that small personal and local gains and wins are just as important.
Wishing everyone a public health oriented, happy, productive, brave and unafraid 2020.
References1. The UN Refugee Agency (UNHCR). Figures at a glance.
[Internet] Geneva, Switzerland. UNHCR [cited 2019 Nov 8] Available from: https://www.unhcr.org/en-au/figures-at-a-glance.html
2. United Nations. Sustainable Development Goals. [Internet] New York, USA. United Nations Publications. [cited 2019 Nov 8] Available from: https://sustainabledevelopment.un.org/?menu=1300.
3. World Vision Aus. Video 5: World Vision’s response to displacement in the Middle East - World Vision Masterclass. [video file] 2017 May 24 [cited 2019 Nov 8]. Available from https://www.youtube.com/watch?v=TiZCf4ibhCs
Correspondence to: Adj. A/Prof Priscilla, Robinson, Department of Public Health, La Trobe University, Victoria 3086; e-mail: [email protected]

510 Australian and New Zealand Journal of Public Health 2019 vol. 43 no. 6© 2019 The Authors
This is an open access article under the terms of the Creative Commons Attribution-NonCommercial-NoDerivs License, which permits use and distribution in any medium, provided the original work is properly cited, the use is non-commercial and no modifications or adaptations are made.
I’d like to begin by thanking the PHAA conference organising committee for inviting me to give the Douglas Gordon
Oration today.
I respectfully acknowledge the Traditional Owners of this land, the Wurundjeri peoples of the Kulin Nation, and pay respect to their Elders, past and present.
Like many of you, I have spent perhaps too much time in the last three years following not just Australian politics but Trump, Brexit, and the rise of authoritarian and populist governments across the world. As a result, I am more worried than ever before about the vulnerability of democracy and the level of public support for its institutions, about the erosion of a rules-based international order, and the gathering implications for public health.
We do live in an era with much to be outraged about, but outrage alone is unlikely to be effective as a response, and is personally corrosive. So, greater mindfulness aside, what’s the alternative?
I have recently been asked by the WA government to conduct an Inquiry into the Impact of Climate Change on Health. More on that later, but in Sharon Friel’s excellent new book, ‘Climate Change and the People’s Health’, there is a foreword by Nancy Krieger, one of the legendary figures of social epidemiology, and she urges us, paraphrasing Raymond Williams, to ‘make hope practical, not despair convincing.’1
So, in this Oration, I will attempt to do that in three parts.
In the first part by stating some fundamental questions of political philosophy, for which we may have assumed answers for too long. The answers we all come up with and live by, form part of the societal determinants of
health, which shape, or are part of, the more frequently discussed social determinants of health.
In the second part, we will use Brexit as a case study in how language frames and creates problems, but also draw on two recent West Australian examples, to show how we, as a public health community, might use language to offer solutions to complex problems in Australia.
In the third and final part, we’ll look at two as yet unaddressed global issues of the utmost importance, namely attacks on health workers in conflict zones, and climate change, seeking clues on how to better organise a cooperative response, and how to ‘make hope practical’ in solidarity with others around the world.
Douglas Gordon was appointed the foundation Professor of Social and Preventive Medicine at the University of Queensland in 1957. He defined public health as “prevention practised by a community collectively”,2 and published a seminal text ‘Health, Sickness and Society’ in 1976.3 His focus in that textbook was on society, environment, epidemiology and the organisation of health care. One of the final chapters is titled ‘Social Duty and Social Concern.’
So, I don’t think he would have found anything particularly new about the fundamental questions I will pose, or the discussion of societal and social determinants. He might have been surprised though at the context in which we need to restate them and re-argue them so many decades later.
In 2019, indifference to these questions is turning into hostility. The Monty Python question, ‘What have the Romans ever done for us?’ has morphed into the Brexit question, ‘What has the EU ever done for us?’ and
is increasingly part of a global libertarian challenge, ‘What has public health ever done for us?’
Part 1: An Open Society
My first question to you all: would you prefer to live in a society governed by a benign dictator or live in an imperfect democracy?
This is a perennial and non-trivial question that goes back to Ancient Greek times, and is as important now, as it ever was in the past.
Think modern America, where the most fundamental criticism of Trump is that he was elected President, but sees himself as a King.
As in all societies at every time in history, some will be fine with the protection of a powerful leader, perhaps drawn more to certainty and security, and a release from fear, than to civic responsibility and the uncertainty that goes along with that.
In my former government role, I was often lobbied to ban this or mandate that. I did wonder at times if some of my erstwhile public health colleagues would have preferred dealing swiftly with a benign public health dictator with a rubber stamp, rather than face the frustrations and delays inherent in a parliamentary democracy!
But the answer must always be to plump for an imperfect democracy with its checks and balances. The 20th century surely taught us that. Extreme ideological positions that infringe individual liberty and rights, end up costing lives in their thousands and millions. Benign dictatorships turn into malign dictatorships, as night follows day.
So, if we are agreed that a messy democracy is better than other alternatives, let’s put a second, harder question about the place of public health in society, namely: can public health and prevention only succeed in an Open Society?
The Austrian writer, Karl Popper (born 1902, died 1994), is famous as a philosopher of science, but it is his work of political philosophy, ‘The Open Society and its Enemies’,4 written in exile in New Zealand, and published in 1946, that I will mainly draw on. In it, he provides a strong philosophical argument, via a critique of Plato and Marx, for avoiding extremism and the imposition of any kind of abstract ideology, secular or religious.
doi: 10.1111/1753-6405.12940
Public Health in an Open Society: how society and language shape preventionGordon Oration, Public Health Prevention Conference, 2019Delivered in Melbourne on Wednesday 12 June, 2019Tarun Weeramanthri1
1. School of Population and Global Health, University of Western Australia
Commentary

2019 vol. 43 no. 6 Australian and New Zealand Journal of Public Health 511© 2019 The Authors
Commentary
He also cautions against historical determinism, or the idea that we can accurately predict history, or assume its inevitable progress towards an ideal state. This quote appears in his book: “ … progress is not a law of nature. The ground gained by one generation may be lost by the next”.4
An Open Society is “an association of free individuals respecting each other’s rights within the framework of mutual protection supplied by the state, and achieving through the making of responsible rational decisions, a growing measure of humane and enlightened life”.5
For Popper, the state should serve its subjects, not the other way round.
The attraction for scientists, I think, is that such a society is oriented to problem-solving, and incremental change. In Popper’s view, all public policies are hypotheses to be tested and corrected in the light of experience. Unintended consequences must be looked for. Ideally, everyone should be free to criticise and government policies should change accordingly. His is a pluralistic, meritocratic vision.
But note, his general guiding principle for public policy was, “Minimise avoidable suffering”.5
Not for Popper the utilitarian aspiration of maximising happiness, but rather the more modest goal of minimising unhappiness, and remedying specific social evils.
He took Plato’s question ‘Who should rule?’ (choose answer from the Good, the Wise etc.), with its implications of a possible Utopia, and Popper asked instead how we can minimise misrule.
Specifically, ‘How can we so organise political institutions so that bad or incompetent rulers can be prevented from doing too much damage?’4
A first part of the answer is for people to be able to change governments without recourse to violence, a second part emphasises the role of the law and the media, and the third lies in the richness of non-government institutions, as part of an overall system of checks and balances.
And it is well to reflect for a moment, that we are citizens in a society where those three conditions are met, and power transfers peacefully through the ballot box.
Popper also identified a number of enemies of an Open Society, particularly those vested interests that seek not a voice within civil society, but assured power and dominance,
aiming to tilt the political system sharply in their favour.
As public health professionals, we are already on familiar ground calling out undue commercial influence. It may make sense to advocate on the more general theme of making society more open.
Transparency of political donations, media diversity and independence, the need for Indigenous empowerment, gender equality, and codification of human rights are some other examples where Australia could arguably improve and move closer to the ideal of an Open Society.
PHAA is particularly important here. Its diverse membership, range of special interest groups (including the long-standing Political Economy of Health SIG), and suite of policy positions has led to a broader and deeper engagement with fundamentally important issues that impact on health, but are not ‘owned’ by health.
PHAA’s recent media release (May 13th, 2019) in support of an increase in the age of criminal responsibility is a good example of that. Many other groups would not view that as a public health issue, but PHAA to its credit does.
In all countries, there are uncomfortable trade-offs when speaking truth to power. There are some countries where societies could be described as more closed than open, and public health professionals will have to consider putting themselves and their organisations at risk.
Can you, for example, simply promote vaccination, tobacco control and cancer screening, without ever talking about stigma, discrimination and treatment of minority groups? Can you be healthy if you are not free? Or is talk of an Open Society simply code for Western values and dominance? These are all fundamental issues for the global public health community, and a closer reading of political philosophy, in addition to traditional political economy or political science, may help us.
I have emphasised Popper’s views on an Open Society, because they have so strongly influenced my personal approach to public health and public administration, and they are not often discussed these days. I have not mentioned other theories: for example, John Rawls’ well-known theory of Justice as Fairness,6 where we decide principles of justice blind to our own situation; or Philip Petitt’s views on ‘freedom from domination’,
which Michael Moore, the former PHAA President has championed.7 Put Popper, Rawls and Pettit together, and you have a powerful philosophical underpinning for public health advocacy and action. A triad of Open, Fair and Free.
Part 2: Language and Society
Brexit
In the second part of this talk, I will turn to a recent example of how language can mislead and distort, and why it matters for public health.
The best book I have read this year is the Irish historian and writer, Fintan O’Toole’s withering analysis of Brexit as psycho-drama, called ‘Heroic Failure’.8 He asks, ‘How did a once-great nation bring itself to the point of such wilful self-harm?’
He points to the irony – Indigenous Australians take note – that the nation once built on colonising others, has managed to appropriate the pain of the colonised, in a crucible of self-pity, that combines a sense of grievance with a sense of superiority.
He shows how some slogans make us stupid. ‘Brexit means Brexit’, ‘Take back control’, ‘The Will of the People’ are all meaningless. (You can think of your own three-word slogans in the Australian political context.) Events in Westminster show that language can lead us in circles, and entrap us in very practical ways. You now have the phenomenon of the Brexit Party, not just a single-issue party, but a single-word party without a policy to match.
Brexit means Brexit … means … Brexit.
O’Toole writes, “Perhaps the most brilliant linguistic manoeuvre … was the renaming of the welfare state as the nanny state. The helping hand was transformed at a stroke into a pointing finger. The things that enabled people to be free of drudgery and want were re-defined as barriers to their freedom”.8
The European Union has been characterised not just as the Nanny State (a term and critique obviously familiar to public health people) but as the Nanny Superstate.
Does any of this matter right now to public health? Yes, absolutely.
There are strong links between nationalism, populism, and hostility to science, underpinned by a mistrust and dismissal of experts and/or ‘outsiders’. The leader of the Brexit Party champions smoking and has warned his followers that the World Health Organization is “just another club of ‘clever
512 Australian and New Zealand Journal of Public Health 2019 vol. 43 no. 6© 2019 The Authors
Commentary
people’ who want to bully and tell us what to do”.8 The former Mayor of London, and prime ministerial aspirant happily portrays himself as a beer-drinking glutton, and Brexiteer media commentators have turned junk food into a symbol of English freedom.
And such attitudes are not confined to Britain. There is a growing worldwide scepticism towards arguably the most successful public health intervention of all time, namely vaccination.
Exhibit A: rising measles cases and falling vaccination rates globally after decades of progress. And Italy and Indonesia are good examples of countries where the falling rates are explicitly linked to either nationalist political ideology (in Italy)9 or religious views (in Indonesia).10 There are links between the anti-vax movement and populist parties across Europe, and the Vaccine Confidence Project showed that countries where populists performed well in the 2014 European elections had higher levels of vaccine hesitancy.9
Public health cannot be complacent and cannot take previous public support for granted, even for the most evidence-based and successful policies and programs. As Popper reminded us, there is no one historically determined path for society, we can fall back or move forward, depending on our efforts.
Fighting back through language
So how can we fight back, what can we draw on?
Let’s go back to 1946, when George Orwell wrote his essay ‘Politics and the English Language’.11
Orwell wrote that the “slovenliness of our language makes it easier for us to have foolish thoughts” but also, “the point is that the process is reversible”.11
He wrote “political language is designed to makes lies sound truthful and murder respectable” but he also wrote, “To think clearly is a necessary first step towards political regeneration”.11
His essay has inspired an army of writers since to use shorter sentences, unadorned words, the active tense, verbs rather than nouns, the concrete rather than the abstract, as aids to expression and thinking.
Don Watson in Australia is famous for his championing of such ‘plain English’ as an antidote to bureaucratese.12
There are also many wonderful public health professionals we can learn from. Over the last ten years, I have listened to a fair bit of talk back radio in Perth. We have had two superb ‘out there’ public health advocates in Terry Slevin and Mike Daube, who would frequently speak on the public health issue of the day – anything from bowel cancer screening to e-cigarettes.
Both would listen attentively, speak plainly and come across as informed, open-minded and relatable.
Never as patronising.
Their relatability, their empathy, the lack of distance between speaker and listener – I would like to emphasise how important that is for public health.
Relatability is a key part of the toolkit for inspiring optimism, hope and change, for participating in the public square, not trying to dominate it.
The opening of the Perth Children’s Hospital
Acknowledging that we’ve had our fair share of setbacks to prevention in Western Australia over the last 10 years, and hopefully without sounding too parochial, I’d like to highlight a couple of recent wins, examples where appropriate language played a part in creating a successful outcome.
The first example highlights the difference a reformulation of language can make to an intractable problem.
The new Perth Children’s Hospital is a futuristic, funky green building on the edge of King’s Park. Construction began in 2012, costed at around 1.2 billion dollars, with the hospital due to open in 2016. However, opening was delayed by the finding of high levels of lead in the drinking water supply.
The source of the lead was disputed, whether it was coming from inside or outside the new hospital, there was disagreement between the managing contractor and the government, tension between government agencies and a succession of inquiries. The issue played out regularly on the front pages of the West Australian, and in State Parliament.
To cut a very long story short, and simplify it, after a dozen or so external reports, baseline testing revealed only 74% compliance with Australian Drinking Water Guidelines. At that point, in July 2017, I was asked as the then Chief Health Officer, by the Minister for Health, to conduct a scientific review.13
We formed a small team, stepped back from the myriad of confusing test results, and took a simple and traditional public health approach. Our team conducted a series of experiments inside the hospital and identified the probable source of contamination as emanating from brass fittings within assembly boxes, each a metre square, situated next to many of the taps or outlets, in plain sight.
It was a Broad Street Pump moment, as none of the engineers or consultants previously responsible, had realised the significance of those assembly boxes right in front of their eyes.
So, channelling the spirit of John Snow, we recommended that around 1,400 assembly boxes be replaced in their entirety. It took the State Government some months to source and replace them, and then testing was repeated using the same methods and criteria as before. Everyone held their breath, but thankfully, in March 2018, following replacement of the assembly boxes, the hospital returned 98% compliance with the Australian Drinking Water Guidelines for lead. The hospital opened in May 2018.
On reflection, one key to the success of the review was the way the problem was re-formulated from engineering language and its related way of thinking, into everyday language suitable for a public health approach.
The engineering language had provided the basis for a series of unsuccessful trial and error fixes based on rather scattergun testing, whereas the everyday language created a framework for a simple hypothesis, and targeted sampling and testing.
We wrote the following down in plain English before we commenced the Review, on the basis of data already collected by others:
‘System is water, pipes and fittings. Water is clear coming in and in the basement tanks, so problem is not in the incoming water and must be distal to the tanks … Stainless steel does not contain lead. Only source of lead is brass – fittings, valves, joins etc. We have data that can point to outlets where lead levels are particularly high, so we can now target those brass fittings proximal to the outlets and examine them. We can also test piping in the walls and check … lead levels … prior to (the water) entering the brass fittings around the outlets.’
That is exactly what we did over a four-week period in mid-2017, sampling from different

2019 vol. 43 no. 6 Australian and New Zealand Journal of Public Health 513© 2019 The Authors
parts of the piping, testing sequential aliquots of water as they emerged from taps, utilising high powered spectroscopic analysis provided by Curtin University, and re-analysing old and new data to test our hypothesis. Our team’s approach drew directly from our respective training in public health, epidemiology, and environmental science.
All in all, a very traditional public health approach applied successfully in modern times. But getting the initial formulation and language right was the gateway to solving what had been, until then, an intractable problem.
Advocating with Treasury and Government for Prevention
Now to a second WA example where language may have helped produce a good recent win.
In 2017, the WA Government commissioned a once-in-15-year comprehensive review of the health system, the Sustainable Health Review, that was led by Robyn Kruk from NSW.14
Its final report was delivered in March this year, and its first recommendation was to increase investment in prevention from its current 2% up to 5% of the health budget over the next 10 years, a recommendation that the WA government has accepted.
This is a big deal for us in the West, and I have to admit the outcome was a pleasant surprise, after many years of talking with Treasury and Government with less success about the benefits of investment in prevention and public health. Clearly, there is no one easy answer and good luck and good timing are critical!
In hindsight, the key to the submissions and papers put forward to the Sustainable Health Review team, may have been that no-one overpromised on short-term savings. Public health investment will not save dollars from this or next year’s acute care budget. Hospital beds cannot be closed behind such an investment, and we need to admit that, as other priorities simply come to the top of the queue.
But based on a wealth of ‘best buys’, cost-effectiveness literature, program evaluations, and detailed case studies, a range of submissions did make the argument that the return on investment (a favoured Treasury term) from a diverse range of public health programs is fantastic, in terms of quantity and quality of life; and that the arc of the cost
curve can be bent favourably over the longer term, not just for health but for a broad range of social care costs.
The review team concluded in their wisdom that prevention is, therefore, critical to sustainability of the whole health system.
I think there is a subtle but important difference between saying that ‘every dollar spent in prevention saves over five dollars in health spending’, with its implication of a short-term saving, and arguing to Treasury there is a fivefold long-term return on every dollar invested in prevention.
As PHAA argues for an investment of 5% of national health spending into prevention, not raising unrealistic expectations and tailoring of language to your audience may matter.
Part 3: Achieving UN Sustainable Development Goals
In the final part of this talk, I’ll mention two issues that bear directly on the world’s potential to achieve two of the 17 UN Sustainable Development Goals, goal 16 (Peace, Justice and Strong Institutions), and goal 13 (Climate Action).
Health Care in Danger
Imagine this – you are a health worker at the Royal Melbourne Hospital a few kilometres from here. In the middle of your shift, a military aircraft targets that hospital and drops a bomb precisely onto it. Certain carnage. Inconceivable here, but a fact of life in many parts of the world.
Health Care in Danger describes the escalating tragedy of direct and deliberate attacks on health care personnel and facilities in conflict zones. It includes attacks on health centres, ambulances and field workers, such as those delivering vaccines. As a result of such attacks, health workers leave, health centres close, and whole communities are deprived of basic health services. People’s need for health care is thus turned against them, causing populations to lose hope and flee.
The UN Security Council passed resolution number 2286 in 2016 condemning such attacks, but the situation has not improved in the three years since.
The latest report from the Safeguarding Health in Conflict Coalition titled Impunity Remains, documented a total of 973 attacks on health in 23 countries in 2018.15 At least 167 workers died, and a further 710 were injured. The highest number of deaths
occurred in Syria, where the scale of attacks is unprecedented, and Afghanistan.
Vaccination workers were attacked in 6 countries in 2018.
In the Democratic Republic of Congo, there have been over 40 attacks on health centres, frustrating attempts to bring the current Ebola epidemic under control, and creating agonising ethical dilemmas for responders and employers.
Picture again the Red Cross or Red Crescent. They are meant to be symbols of protection, not targets in crosshairs for militias and governments.
This year marks the 70th anniversary of the modern form of the Geneva Conventions, under which attacks on hospitals and health staff are plainly outlawed.
The Australian Red Cross is trying to raise awareness of this issue, through its international humanitarian law or IHL committees in each state and territory.
I’m the health sector representative on the WA committee, hence my raising of the issue today.
It is easy to despair and condemn as precious norms erode in front of our eyes, but to ‘make hope practical’ we need to bolster the impact of words written into law through other concrete actions; education of civil and military forces, on-the-ground protection, and ultimately sanctions and enforcement of accountability, through international mechanisms and the courts.
Dr Tedros Adhanom, Director General of the World Health Organization has said simply that there is no health without health workers. An attack on one is an attack on us all.
But what can we personally do to bridge the distance between our work and lives here in Australia, and this issue, if we want to show solidarity with our fellow public health workers in other countries?
Firstly, we can start by recognising that though not exactly the same, violence against staff, particularly in Emergency Departments, is an issue here in Australia, and we have strategies in place to address it.
Having made that connection, we can learn more about the international issue, by going to websites hosted by the ICRC, WHO or Safeguarding Health in Conflict Coalition.
An easy, practical thing you can do immediately if you have a mobile phone, is to download the ‘Emblem Protection’ app developed by the Red Cross, and learn
Commentary

514 Australian and New Zealand Journal of Public Health 2019 vol. 43 no. 6© 2019 The Authors
more about the Red Cross emblem, and its meaning.
Lastly, recognise that global solidarity is important, and health workers in the field in affected countries appreciate and value your support. Mobilisation of health workers internationally, and the use of our moral authority through our professional organisations is a key policy lever.
Climate change
And, finally, to climate change. The WA Government has recently announced an Inquiry into the Impact of Climate Change on Health.16 Like the increase in funding for prevention, this was a recommendation of the Sustainable Health Review.
This is the first inquiry using powers laid out in the new Public Health Act of 2016, and recommendations for a path forward will cover both mitigation of health sector emissions, as well as public health adaptation.
We will call for written submissions in the next 1-2 weeks, hold open public hearings later in the year, and report by early 2020. It is clear there is a wealth of evidence that demonstrates the direct and indirect links between climate change and health, and highlights specific practical options for climate action.
We need to bring all that information together, emphasise the particular environmental and health impacts for Western Australia, and tap into the strengths, leadership, networks and success stories in the current health system.
The inquiry team are not the experts, but the means of synthesis and alignment, and the bridge between the science, the sector and the public. We therefore need to create a process, and report in a language, that connects with the public as well as current health sector employees.
We are optimistic, based on the level of expertise and commitment in the community, that the Inquiry can contribute to the momentum for change.
But we also need to recognise that the health sector has to this point been slow to act, despite contributing 7% of all emissions in Australia, and think harder about why more concerted action on climate change has been delayed.
What are the barriers? There are obviously structural, economic and political barriers, but there are also intersecting psychological and linguistic ones.
Per Espen Stoknes, in his book ‘What we think about when we try not to think about Global Warming’,17 emphasises psychological factors, which he names Distance, Denial, Doom, Dissonance and iDentity.
Let’s just take the first factor, Distance. People can’t see climate change easily, it feels distant from everyday concerns, and even 2050, let alone 2100, seems a long way away.
We need to reduce the distance between the ‘now and the never’, making it the ‘now and the near’. The slogan ’12 years for Climate Action’ is cutting through, and is based on excellent science in the Intergovernmental Panel on Climate Change (IPCC) 1.5 degrees of Global Warming 2018 Special Report. Accordingly, we will focus the Inquiry on what the health sector can do and contribute in the ten-year period, 2020 to 2030.
It’s also possible to construct an imaginative bridge to the future. Damon Gameau, the Australian actor and film-maker, has done just that in his recently released film ‘2040’, in which he speaks to his 4-year old daughter, and paints an optimistic canvas for her in 2040, drawing on approaches to energy, waste etc. that are in place somewhere today, on the assumption that what is already possible, will be more widely adopted.
Another way to deal with the time frame issue is to draw on Indigenous knowledge, perspectives, experiences and frameworks of environmental and generational care. 60,000 years equates to 3,000 generations of stewardship.
Indigenous knowledge is critical to ecological science. Indeed, the IPCC 1.5 degrees Special Report stresses the importance of strengthening the capacity of Indigenous peoples and local communities for climate action.18
There is already active discussion of climate change in the Aboriginal community-controlled health sector, who are on the frontlines of natural disasters, extreme weather events and environmental change. There was a First Nations Climate Summit held in Queensland only two weeks ago. So, I have committed the WA Inquiry (as a matter of necessity, not nicety) to seek to engage with Aboriginal people and organisations across the state in coming months.
Conclusion
In conclusion, at a time of crisis for democracy across the world, I am grateful to live in Australia, where we may not have produced
that many visionary political leaders, but the community can still find ways to organise and lead, and we can get rid of would-be tyrants peacefully.
As I get older, I’d still like to change the world, and minimise unhappiness, but I don’t want to aim for a Utopia. I admit it’s a fine balance, better or best. My heartfelt wish is for a more Open Society, that navigates that tension. Not a closed society, succumbing to a populism that closes minds, and sees all experts as tall poppies to be dismissed or cut down. If we close ourselves off, and turn inwards, we then risk turning on each other. An Open Society is a bedrock determinant of health, critical to a fairer world, a freer world and a sustainable environment.
We should be mindful that there will always be defenders of a particular status quo. It’s part of public health’s ‘strategic operating environment.’ The clue to working out who simply holds a genuine conservative view, and who might be called in Popperian terms, an enemy of an Open Society, is whether or not they are committed to greater transparency and accountability themselves.
Brexit and Trump are the latest in a long line of morality tales, and important, because they arise from countries that created the forms of parliamentary and constitutional democracy, that we drew most heavily on in drafting our Australian Constitution.
To unpick the lessons from the tales, we need to relearn the lessons of history; in particular, revisiting closely the period after the second world war. The consequences of political extremism and nationalism were then painfully recent, and the world had to be remade through decolonisation on the one hand and international cooperation on the other. The United Nations, the World Health Organization, the Universal Declaration of Human Rights, and the Geneva Conventions all came into being between 1945 and 1950. That period also saw philosophers like Karl Popper, and writers like George Orwell, publish their most enduring works and imprint in indelible ink the links between politics, populism and language.
In public health, we are both products and influencers of society and language. Currently facing rising levels of distrust and doubt, by careful attention to our philosophical roots, and ways of speaking, we can, as Orwell pointed out, reverse the process and fight back.11
This is no time to rest, as we are currently going backwards in some areas globally,
Commentary

2019 vol. 43 no. 6 Australian and New Zealand Journal of Public Health 515© 2019 The Authors
and some norms are being eroded – I have mentioned falling vaccination rates, and attacks on health care.
And we are at risk of inaction on the most difficult and pressing challenge of our time, climate change, unless we quickly change our approach in the next ten years.
But we have much to be proud of and to draw on, as we seek to make progress and help restore trust in science.
The public health approach to prevention, including its core of epidemiological methods, and its commitment to meaningful equal partnerships, has been spectacularly successful and continues to be applicable, even to the building of shiny new hospitals.
We have a great track record in Australia of ‘practising prevention as a community collectively’, as Douglas Gordon put it,2 though it most often takes time and persistence.
The returns on public health investment are simply compelling. Just look at PHAA’s publication ‘Top 10 public health successes over the last 20 years’,19 and be amazed at the range of achievements – on tobacco, road deaths, gun control, HIV, prevention of neural tube defects with folate – the list goes on.
But it’s also how we communicate that success, and what underpins it, that counts. We know how important it is to close the gap between society and the individual, the public and experts, and build bridges to others and the future.
Conscious of the political, societal and social determinants of health, we can promote a philosophy of Open, Fair and Free as a strong positive vision and counter-argument against Nanny State critics.
We are at our best when we are relatable and our language is plain and fit for purpose – whether talking to each other, to the community or to power.
We can act in solidarity with our public health colleagues worldwide to negotiate pathways to more Open societies, relevant to each country, and find ways to meet the UN Sustainable Development Goals.
We also know none of this is easy, and we need to help and support each other to be our best selves through organisations like PHAA.
Wherever and whenever the question comes ‘What has public health ever done for us?’, we will be ready to answer.
Acknowledgements
I would like to thank Professor John Mathews, now at the University of Melbourne, for introducing me to the work of Karl Popper in the early 1990’s, when he was Director of the Menzies School of Health Research in Darwin. And I also acknowledge the helpful comments from both manuscript reviewers, encouraging me to clarify my belief that a political philosophy approach overlaps with and is complementary to a more traditional political economy or political science approach. Interested readers may find the podcast ‘Public health and the Open Society’ broadcast on Radio National’s The Philosopher’s Zone on 23 June, 2019, helpful in further exploring the philosophical basis of this Oration.
References1. Friel S. Climate Change and the People’s Health. New York
(NY): Oxford University Press; 2019.2. Gordon D. Mad Dogs and Englishmen Went Out in the
Queensland Sun: The Bancroft Oration of 1969. Brisbane (AUST): University of Queensland Press; 1990.
3. Gordon D. Health, Sickness and Society. Brisbane (AUST): University of Queensland Press; 1976.
4. Popper K. The Open Society and its Enemies. London (UK): Routledge and Kegan; 1945.
5. Magee B. Popper. London (UK): Fontana/Collins; 1973.6. Rawls, J. Justice as Fairness: A Restatement. Cambridge
(MA): Harvard University Press; 2018.7. Moore M, Yeatman H, Davey R. Which nanny – the state
or industry? Wowsers, teetotallers and the fun police in public health advocacy. Public Health. 2015;129:1030-7.
8. O’Toole, F. Heroic Failure: Brexit and the Politics of Pain. London (UK): Head of Zeus; 2018.
9. Kennedy J. How populists spread vaccine fear. Politico [Internet]. 2019 [updated 2019 May 8; cited 2019 June 16] May 7. Available from: https://www.politico.eu/article/how-populists-spread-vaccine-fear/
10. McKenna M. The plague years: How the rise of right-wing nationalism is jeopardizing the world’s health. The New Republic [Internet]. 2019 [cited 2019 June 16] April 1 Available from: https://newrepublic.com/article/153264/rise-right-wing-nationalism-jeopardizing-world-health
11. Orwell G. Politics and the English Language. In: Bott G, editor. George Orwell Selected Writings. London (UK): Heinemann Educational Books; 1958. p.75-89.
12. Watson D. Death Sentence: The Decay of Public Language. Sydney (AUST): Knopf, Random House Australia; 2003.
13. Weeramanthri TS, Walker CE, Davies AL, Tan HS, Theobald RG, Dodds JC. Report on Perth Children’s Hospital Potable Water: Chief Health Officer Review [Internet]. Perth (AUST): Western Australia Department of Health; 2017 [cited 2019 Jun 16]. Available from: https://ww2.health.wa.gov.au/~/media/Files/Corporate/Reports%20and%20publications/Perth-Childrens-Hospital/CHO-PCH-Report.pdf
14. Sustainable Health Review. Sustainable Health Review: Final Report to the Western Australian Government [Internet]. Perth (AUST): Western Australia Department of Health; 2019 [cited 2019 Jun 16]. Available from: https://ww2.health.wa.gov.au/Improving-WA-Health/Sustainable-health-review/Final-report
15. Safeguarding Health in Conflict Coalition. Impunity Remains: Attacks on Health Care in 23 Countries in Conflict, 2018 [Internet]. Washington (DC): Safeguarding Health in Conflict Coalition; 2019 [cited 2019 Jun 16]. Available from: https://www.safeguardinghealth.org/sites/shcc/files/SHCC2019final.pdf
16. Western Australia Department of Health. Climate Health WA Inquiry [Internet]. Perth (AUST): Government of Western Australia; 2019 [cited 2019 Jun 16]. Available from: https://ww2.health.wa.gov.au/Improving-WA-Health/Climate-health-inquiry
17. Stocknes PE. What We Think About When We Try Not to Think About Global Warming. Vermont (USA): Chelsea Green Publishing; 2015.
18. IPCC. Global Warming of 1.5°C. An IPCC Special Report on the impacts of global warming of 1.5°C above pre-industrial levels and related global greenhouse gas emission pathways, in the context of strengthening the global response to the threat of climate change, sustainable development, and efforts to eradicate poverty. Geneva (Switzerland): World Meteorological Organization; 2018.
19. Public Health Association of Australia. Top Ten Public Health Successes Over the Last 20 Years. PHAA Monograph Series No.: 2. Canberra (AUST): PHAA; 2018.
Correspondence to: Adjunct Professor Tarun Weeramanthri, School of Population and Global Health, University of Western Australia; e-mail: [email protected]
Commentary

516 Australian and New Zealand Journal of Public Health 2019 vol. 43 no. 6© 2019 The Authors
This is an open access article under the terms of the Creative Commons Attribution-NonCommercial-NoDerivs License, which permits use and distribution in any medium, provided the original work is properly cited, the use is non-commercial and no modifications or adaptations are made.
Violence against women is a significant public health issue – globally, one in three women are estimated to
experience physical and/or sexual violence from an intimate partner in their lifetime. Australia is not immune; one in four Australian women report violence from an intimate partner since the age of 15.1 Some groups are burdened more than others, due to the intersection of systemic factors such as race, discrimination and social and economic disadvantage. Indigenous women are hospitalised for family violence-related assaults at 32 times the rate of non-Indigenous women.2 Victims experience significant negative physical, mental and reproductive health damage.
Decades of global evidence confirms that harmful use of alcohol increases the likelihood of intimate partner violence and sexual violence towards women. Although the exact role of alcohol in such violence is complex and contested,3 there is consensus that alcohol use, particularly heavy and binge drinking, contributes to the increased frequency and severity of violence. Alcohol use on its own is neither sufficient nor necessary for violence to occur. Many men drink heavily but do not abuse their partners, nor commit acts of sexual aggression.
There is well established evidence of sex differences in the impacts of alcohol use on men and women.4 Despite drinking less than men, women who drink heavily tend to be more negatively affected physically than men, including reproductive problems, in the short and long term.5 They also experience more negative social responses to their drinking (i.e. infringing social norms of femininity) as well as increased vulnerability to sexual assault and violence. Women living with a
heavy drinking spouse experience higher levels of anxiety and depression symptoms and lower satisfaction with life.6 These are likely to be associated with the experience of alcohol-related partner violence.
Alcohol contributes to violence through a combination of: direct pharmacological effects on thinking, behaviour and the ability to resolve conflict; characteristics of the individual and others involved in the interaction; the circumstances and interaction in the setting; and underlying attitudes and social norms. However, while both men and women suffer victimisation as a result of men’s alcohol-related violence – men are disproportionately the victims of violence from other men in public, while women experience alcohol-related violence disproportionately from males known to them and at higher rates than men.7
While there has been significant attention to the role of alcohol in men’s public violence as a result of injuries and deaths of young men in public, alcohol-related violence against women rarely features in public health policy and intervention research. Indigenous communities and clinical populations with severe alcohol problems have been the exception.
In this commentary, we make a distinction between sex – defined as the biological or genetic features taken to differentiate females from males – as distinct from gender, which can be defined as the socially constructed differences in character traits and role expectations for the different sexes. As de Beauvoir asserted, “one is not born, but becomes a woman”.8 We argue below for the importance of a gendered focus to prevention and reduction of alcohol-related violence against women.
Why a gendered lens is important
Violence against women is a complex ‘wicked’ problem, with gender inequality as the necessary context for men’s violence.9 We use the term ‘violence against women’ to reflect the evidence that women are disproportionately the victims of violence from a male intimate partner, or sexual violence from a non-intimate partner, often in the context of control and dominance. Applying a gendered lens to preventing alcohol-related violence is important for several reasons. Firstly, alcohol consumption itself is highly differentiated in drinking behaviours; studies across different countries find universal patterns – men are more likely than women to drink, and in more problematic ways (i.e. high frequency and high volume drinking). Women tend to drink substantially less or are more likely to be lifetime abstainers compared to men.10 While the magnitude of the difference varies across cultures, the pattern remains that harm associated with alcohol use primarily relates to men’s drinking.
Men’s alcohol use is linked to sexual aggression and violence; it may affect their social information processes, contributing to ‘misreading’ cues of sexual interest, and exerting sexual pressure and coercion.11 Alcohol use affects relationship functioning with conflict around drinking particularly exacerbated by discrepant drinking patterns within the couple increasing the risk of violence as an outcome, particularly if one (usually the male) or both partners have been drinking. While harmful drinking in women does not increase the risk of violence per se, it increases their vulnerability to victimisation and unwanted sexual attention.
For some women, whose partner’s alcohol use is inter-connected with repeated cycles of abuse, drinking can act as a signal for the potential for violence, and thus a tool of control, as women are forced to adopt preventive or protective strategies when a partner starts drinking.12 Women may also experience economic abuse resulting from a partner spending household funds on his drinking. Where a partner develops an alcohol use disorder, women are socialised to take on a caring role even under the threat of drunken violence. Leaving an abusive partner is made more difficult for women when a partner is dependent on such care. In these
doi: 10.1111/1753-6405.12943
Pathways to responding and preventing alcohol-related violence against women: why a gendered approach mattersAngela Taft,1 Ingrid Wilson,1,2 Anne-Marie Laslett,3 Sandra Kuntsche3
1. Judith Lumley Centre, La Trobe University, Melbourne, Victoria
2. Singapore Institute of Technology, Singapore
3. Centre for Alcohol Policy Research, La Trobe University, Melbourne, Victoria
Commentary

2019 vol. 43 no. 6 Australian and New Zealand Journal of Public Health 517© 2019 The Authors
Commentary
ways, a gendered understanding of alcohol-related violence against women reveals how alcohol contributes to the existing gender inequalities that drive violence against women.
Prevention strategies around violence against women emphasise the gendered nature of intimate partner and sexual violence, and how gender inequality sets the context for violence perpetrated by men against women and girls. Within this context, alcohol misuse is viewed as a reinforcing factor, with social norms around alcohol use altered by disinhibition in problematic masculine drinking contexts associated with more sexualised behaviour.9 Both drinking and violence are social behaviours that are influenced by gendered social norms. Conforming to stereotypes of traditional masculinity is seen as a predictor of violence, including intimate partner and sexual violence.13 The intersecting traits of exaggerated masculinity, heavy drinking and violence are made visible in studies of male-dominated drinking settings such as bars.14 Alcohol use is intertwined with expression of harmful masculinity, particularly where traditional masculinity markers (such as employment) are absent. It provides ‘liquid courage’ to take on risky behaviours, and particularly to act powerfully and dominantly through violence against strangers and towards women.13 However, alcohol use is two-sided for men who are violent; while alcohol use facilitates the performance of exaggerated masculinity markers, it is also used as a response to the demands and expectations of living up to false ideals of manhood.13 Hence, maintaining an explicit focus on men’s harmful drinking and an examination of the masculine norms and peer group behaviour that underpin it should be a priority for primary prevention and early intervention strategies.
Implications for primary prevention and early intervention: the role of the health profession and public health policy
By acknowledging the gendered nature of alcohol-related violence against women and responding with an understanding of harmful masculinities and drinking culture, health professionals can be more effective with heavy drinking male patients and their families. An early identification of problematic alcohol use can be an opportunity to assess family safety and identify the risk of
a man perpetrating violence against family members.15 Brief interventions to reduce alcohol use have been shown to work with younger people, and recent evidence shows that they are effective at reducing alcohol consumption among hazardous and harmful drinkers in emergency department and primary care populations.3
Men’s use of alcohol can be both a ‘tool’ of violence, but also a symptom of exposure to violence, thus creating a cycle that has inter-generational effects. Multi-country research on men’s perpetration of violence shows that exposure to their father’s violence against their mother is directly and indirectly associated with their own perpetration of physical partner violence. Additionally, men who have been exposed to violence in childhood are more likely to abuse alcohol than those unexposed.16 A perpetrator’s co-morbidity of mental health and alcohol problems should obligate health professionals to respond in an appropriate therapeutic way, while not diminishing accountability for the violent behaviour.
At a public health level, reducing harmful alcohol use is recognised by the World Health Organization as an important strategy for reducing violence against women, although not the complete solution.17 Alcohol policy strategies that reduce alcohol consumption at the population- and community-level, such as increasing the price and reducing the availability of alcohol, have been shown to be effective at reducing alcohol-related harm more generally.18
However, there is limited evidence of what alcohol strategies work to prevent alcohol-related violence against women,3 although some strategies such as alcohol outlet density show promise. This is not because these strategies do not work, but that there has been little attention to including outcomes of intimate partner and sexual violence.
Some scholars argue that while sex differences are accounted for as a demographic factor in epidemiological alcohol research, gender is absent from prevention and intervention research on alcohol.3 The accepted alcohol policy strategies and interventions pay limited attention to harmful masculinities, men’s peer group activities and their role in consumption and harm. Attention to the importance of gendered health promotion approaches is vital, including the social norms around drinking and masculinity that should be a focus, particularly where these are linked
to violence against women. Public health policy around alcohol and violence needs to engage with gender in theory and practice, and we need to design and evaluate primary prevention and early intervention strategies that explicitly acknowledge the gendered nature of both drinking and violence against women, e.g. in schools, local community and campus student violence prevention strategies.
The World Health Organization recommends ‘gender-transformative’ approaches as the most promising and effective in preventing gender-based violence. 19 These include prevention programs that focus explicitly on the gendered dimensions of behaviour and challenge stereotyped gender roles and promote gender-equitable relationships between men and women. The Australian health system and health professionals can play a role by challenging social norms that trivialise men’s harmful drinking and behaviours, and advocating for gender-informed alcohol policy changes that reduce men’s problematic drinking patterns, create safer drinking environments and cultures for women and men, and prohibit advertising that reinforces gender inequity and masculine heavy drinking cultures.
Acknowledgement
The authors gratefully acknowledge funding support from the Victorian Health Promotion Foundation.
References1. Cox P. Violence Against Women in Australia: Additional
Analysis of the Australian Bureau of Statistics’ Personal Safety Survey, 2012. Sydney (AUST): Australia’s National Research Organisation for Women’s Safety; 2015.
2. Australian Institute of Health and Welfare. Family, Domestic and Sexual Violence in Australia. Canberra (AUST): AIHW; 2018.
3. Wilson IM, Graham K, Taft A. Alcohol interventions, alcohol policy and intimate partner violence: A systematic review. BMC Public Health. 2014;14(1):881.
4. Obot IS, Room R, editors. Alcohol, Gender and Drinking Problems: Perspectives from Low and Middle Income Countries. Geneva (CHE): World Health Organisation; 2005.
5. Nolen-Hoeksema S. (2004). Gender differences in risk factors and consequences for alcohol use and problems. Clin Psychol Rev. 2004;24(8);981-1010.
6. Callinan S, Rankin G, Room R, Stanesby O, Rao G, Waleewong O, et al. Harms from a partner’s drinking: An international study on adverse effects and reduced quality of life for women. Am J Drug Alcohol Abuse. 2019;45(2):170-8.
7. Australian Institute of Health and Welfare. National Drug Strategy Household Survey Detailed Report 2013. Canberra (AUST): AIHW; 2014.
8. Gould CC, editor. Gender. Key Concepts in Critical Theory. New Jersey (NJ): Humanities Press; 1997.
9. Our Watch, ANROWS, VicHealth. Change the Story: A Shared Framework for the Primary Prevention of Violence Against Women and their Children in Australia. Melbourne (AUST): Our Watch; 2015.
518 Australian and New Zealand Journal of Public Health 2019 vol. 43 no. 6© 2019 The Authors
Commentary
10. Wilsnack RW, Wilsnack SC, Kristjanson AF, Vogeltanz-Holm ND, Gmel G. Gender and alcohol consumption: Patterns from the multinational GENACIS project. Addiction. 2009;104(9):1487-500.
11. Abbey A. Alcohol’s role in sexual violence perpetration: Theoretical explanations, existing evidence and future directions. Drug Alcohol Rev. 2011;30(5):481-9.
12. Wilson IM, Graham K, Taft A. Living the cycle of drinking and violence: A qualitative study of women’s experience of alcohol-related intimate partner violence. Drug Alcohol Rev. 2017;36(1):115-24.
13. Moore D, Fraser S, Keane H, Seear K, Valentine K. Missing masculinities: Gendering practices in Australian alcohol research and policy. Aust Feminist Stud. 2017;32(93):309-24.
14. Miller P, Wells S, Hobbs R, Zinkiewicz L, Curtis A, Graham K. Alcohol, masculinity, honour and male barroom aggression in an Australian sample. Drug Alcohol Rev. 2014;33(2):136-43.
15. Hegarty KL. Gender, alcohol and intimate partner violence: How to respond in primary care? Adv Dual Diagn. 2012;5(2):68-73.
16. Fulu E, Miedema S, Roselli T, et al. Pathways between childhood trauma, intimate partner violence, and harsh parenting: findings from the UN Multi-country Study on men and violence in Asia and the Pacific. Lancet Glob Health. 2017;5(5):e512-e22.
17. World Health Organization. Preventing Intimate Partner and Sexual Violence against Women: Taking Action and Generating Evidence. Geneva (CHE): WHO; 2010.
18. Hall WD, Weier M. Reducing alcohol-related violence and other harm in Australia. Med J Aust. 2017;206(3):111-12.
19. Barker G, Ricardo C, Nascimento M. Engaging Men and Boys in Changing Gender-based Inequity in Health: Evidence from Programme Interventions. Geneva (CHE): World Health Organization; 2007.
Correspondence to: Professor Angela Taft, Judith Lumley Centre, Level 3, George Singer Building, La Trobe University, Bundoora, Victoria 3083; e-mail: [email protected]
2019 vol. 43 no. 6 Australian and New Zealand Journal of Public Health 519© 2019 The Authors
Advertising has come under scrutiny as contributing to an environment that encourages children to consume
unhealthy foods,1 and television has been one of the major sources of food advertising to Australian children. Data from 2012 and 2015 suggest that most children (97%) watch television, averaging 8.5 hours per week.2,3 The advertising of discretionary foods has been previously described for one commercial network (comprising four distinct channels) during 2016.4 It was reported that 11% of all advertising was for food and beverages (henceforth combined to ‘food’) and that discretionary foods were advertised twice as frequently as healthy foods.
In 2009, the Australian Food and Grocery Council (AFGC) introduced a code to address food marketing to children. Broadly, the goals of the code were to reduce the advertising of discretionary foods to children. Companies signed up to the code on a voluntary basis. However, from June 2019 the Australian Association of National Advertisers (AANA) introduced their own code, and now all advertising is subject to one of these industry codes.
Given our previous work5 showing wide monthly variations in discretionary food advertising4 and the revised interest by government in advertising to children,6 we aimed to use contemporary data to describe the patterns of food advertising. This work will become baseline data for future examination of the performance of the AANA’s code in reducing children’s exposure to food advertising. In supplementary analyses, we explored advertising, including whether
a company was a signatory (or not) to the AFGC code, which applied at the time when these data were collected. These exploratory analyses may be useful for settings that have voluntary food industry codes in place and for strengthening regulations on food marketing.
Methods
Briefly, a digital tuner attached to a computer and purpose-built software was used to detect advertisements on television.4 Each advertisement was logged, viewed and coded as being ‘food/not food’, then further categorised as per the method of Smithers et al.4 Foods were further categorised as ‘healthy’, ‘discretionary’ or ‘other’ (e.g. tea, coffee) according to the Australian Guide to
Healthy Eating.7 All food advertisements were coded by two separate members of the team with any discrepancies resolved through discussion. We coded all food advertisements shown on the four channels of the Nine Network from Adelaide during 2017. The Nine Network was used as previous work showed it had the highest discretionary food advertising rates of the free-to-air networks in Adelaide.8 We randomly sampled 84 days from the 2017 year, which included one of each day of the week for each month. For each food advertisement we obtained information available at the AFGC website to determine whether the company was a signatory to the industry code.
Discretionary food advertising on television in 2017: a descriptive study Lisa G. Smithers,1,2 Xinyue Wang,1,2 Dandara Haag,1,2 Benjamin Agnew,3 John Lynch,1,2,4 Matthew Sorell3
1. School of Public Health, University of Adelaide, South Australia2. Robinson Research Institute, South Australia3. School of Electrical and Electronic Engineering, University of Adelaide, South Australia4. Population Health Sciences, University of Bristol, United KingdomCorrespondence to: A/Prof Lisa Smithers, Mail drop 650550, School of Public Health, University of Adelaide, South Australia, 5005; e-mail: [email protected]: June 2019; Revision requested: August 2019; Accepted: August 2019The authors have stated they have no conflict of interest.This is an open access article under the terms of the Creative Commons Attribution-NonCommercial-NoDerivs License, which permits use and distribution in any medium,
provided the original work is properly cited, the use is non-commercial and no modifications or adaptations are made.
Aust NZ J Public Health. 2019; 43:519-21; doi: 10.1111/1753-6405.12942
Abstract
Objective: To describe advertising of discretionary foods on television at times when children watch television.
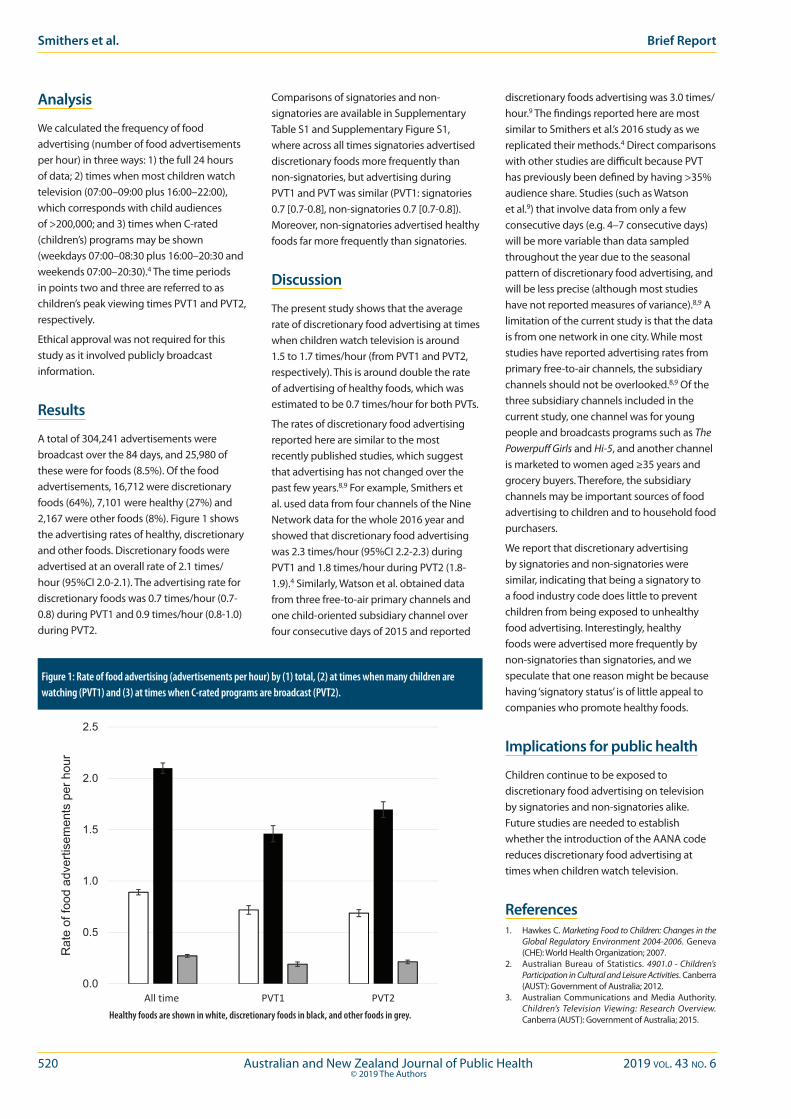
Methods: We randomly sampled 84 days (one of each weekday for every month of the year) for 2017, viewed all food advertisements and categorised them according to type (healthy, discretionary or other). The frequency of advertisements per hour was calculated for times when most children watch television (peak viewing time PVT1) and when C-rated programs can be broadcast (PVT2).
Results: The rate of advertising of discretionary foods during PVT1 was 1.5/hour (95%CI 1.4-1.5), and during PVT2 was 1.7/hour (1.6-1.8).
Conclusions: Children continue to be exposed to food advertising.
Implications for public health: Voluntary food and grocery industry codes have not prevented children from being exposed to discretionary food advertising on television. From June 2019, all food and beverage advertising is subject to either food industry or advertising industry codes. The data presented here will form the baseline for future evaluation of whether the new arrangements reduce children’s exposure to food advertising.
Key words: food and beverage, television, advertising, children
ADVERTISING
520 Australian and New Zealand Journal of Public Health 2019 vol. 43 no. 6© 2019 The Authors
Smithers et al. Brief Report
Analysis
We calculated the frequency of food advertising (number of food advertisements per hour) in three ways: 1) the full 24 hours of data; 2) times when most children watch television (07:00–09:00 plus 16:00–22:00), which corresponds with child audiences of >200,000; and 3) times when C-rated (children’s) programs may be shown (weekdays 07:00–08:30 plus 16:00–20:30 and weekends 07:00–20:30).4 The time periods in points two and three are referred to as children’s peak viewing times PVT1 and PVT2, respectively.
Ethical approval was not required for this study as it involved publicly broadcast information.
Results
A total of 304,241 advertisements were broadcast over the 84 days, and 25,980 of these were for foods (8.5%). Of the food advertisements, 16,712 were discretionary foods (64%), 7,101 were healthy (27%) and 2,167 were other foods (8%). Figure 1 shows the advertising rates of healthy, discretionary and other foods. Discretionary foods were advertised at an overall rate of 2.1 times/hour (95%CI 2.0-2.1). The advertising rate for discretionary foods was 0.7 times/hour (0.7-0.8) during PVT1 and 0.9 times/hour (0.8-1.0) during PVT2.
Comparisons of signatories and non-signatories are available in Supplementary Table S1 and Supplementary Figure S1, where across all times signatories advertised discretionary foods more frequently than non-signatories, but advertising during PVT1 and PVT was similar (PVT1: signatories 0.7 [0.7-0.8], non-signatories 0.7 [0.7-0.8]). Moreover, non-signatories advertised healthy foods far more frequently than signatories.
Discussion
The present study shows that the average rate of discretionary food advertising at times when children watch television is around 1.5 to 1.7 times/hour (from PVT1 and PVT2, respectively). This is around double the rate of advertising of healthy foods, which was estimated to be 0.7 times/hour for both PVTs.
The rates of discretionary food advertising reported here are similar to the most recently published studies, which suggest that advertising has not changed over the past few years.8,9 For example, Smithers et al. used data from four channels of the Nine Network data for the whole 2016 year and showed that discretionary food advertising was 2.3 times/hour (95%CI 2.2-2.3) during PVT1 and 1.8 times/hour during PVT2 (1.8-1.9).4 Similarly, Watson et al. obtained data from three free-to-air primary channels and one child-oriented subsidiary channel over four consecutive days of 2015 and reported
discretionary foods advertising was 3.0 times/hour.9 The findings reported here are most similar to Smithers et al.’s 2016 study as we replicated their methods.4 Direct comparisons with other studies are difficult because PVT has previously been defined by having >35% audience share. Studies (such as Watson et al.9) that involve data from only a few consecutive days (e.g. 4–7 consecutive days) will be more variable than data sampled throughout the year due to the seasonal pattern of discretionary food advertising, and will be less precise (although most studies have not reported measures of variance).8,9 A limitation of the current study is that the data is from one network in one city. While most studies have reported advertising rates from primary free-to-air channels, the subsidiary channels should not be overlooked.8,9 Of the three subsidiary channels included in the current study, one channel was for young people and broadcasts programs such as The Powerpuff Girls and Hi-5, and another channel is marketed to women aged ≥35 years and grocery buyers. Therefore, the subsidiary channels may be important sources of food advertising to children and to household food purchasers.
We report that discretionary advertising by signatories and non-signatories were similar, indicating that being a signatory to a food industry code does little to prevent children from being exposed to unhealthy food advertising. Interestingly, healthy foods were advertised more frequently by non-signatories than signatories, and we speculate that one reason might be because having ‘signatory status’ is of little appeal to companies who promote healthy foods.
Implications for public health
Children continue to be exposed to discretionary food advertising on television by signatories and non-signatories alike. Future studies are needed to establish whether the introduction of the AANA code reduces discretionary food advertising at times when children watch television.
References1. Hawkes C. Marketing Food to Children: Changes in the
Global Regulatory Environment 2004-2006. Geneva (CHE): World Health Organization; 2007.
2. Australian Bureau of Statistics. 4901.0 - Children’s Participation in Cultural and Leisure Activities. Canberra (AUST): Government of Australia; 2012.
3. Australian Communications and Media Authority. Children’s Television Viewing: Research Overview. Canberra (AUST): Government of Australia; 2015.
0.0
0.5
1.0
1.5
2.0
2.5
All time PVT1 PVT2
Rat
e of
food
adv
ertis
emen
ts p
er h
our
Figure 1: Rate of food advertising (advertisements per hour) by (1) total, (2) at times when many children are watching (PVT1) and (3) at times when C-rated programs are broadcast (PVT2).
Healthy foods are shown in white, discretionary foods in black, and other foods in grey.
2019 vol. 43 no. 6 Australian and New Zealand Journal of Public Health 521© 2019 The Authors
Advertising Discretionary food advertising on television in 2017
4. Smithers LG, Haag DG, Agnew B, Lynch J, Sorell M. Food advertising on Australian television: Frequency, duration and monthly pattern of advertising from a commercial network (four channels) for the entire 2016. J Paediatr Child Health. 2018;54(9):962-7.
5. Smithers LG, Lynch JW, Merlin T. Industry self-regulation and TV advertising of foods to Australian children. J Pediatr Child Health. 2014;50(5):386-92.
6. The Senate. Select Committee into the Obesity Epidemic in Australia. Canberra (AUST): Government of Australia; 2018.
7. Australian Department of Health. Australian Guide to Healthy Eating. Canberra (AUST): Government of Australia; 2013.
8. Brindal E, Corsini N, Hendrie G. Television Food Advertising to Children in South Australia. Adelaide (AUST): CSIRO; 2011.
9. Watson WL, Lau V, Wellard L, Hughes C, Chapman K. Advertising to children initiatives have not reduced unhealthy food advertising on Australian television. J Public Health (Oxf). 2017;39(4):787-92.
Supporting Information
Additional supporting information may be found in the online version of this article:
Supplementary Table 1: Mean (95%CI) rate of food advertising according to signatories versus non-signatories status and by time when advertising is broadcast.
Supplementary Figure 1: Rate of food advertising (advertisements per hour) by signatories and non-signatories into (1) total time (all available data from 24 hours/day), (2) at times when many children are watching (PVT1) and (3) at times when C-rated programs are broadcast.

522 Australian and New Zealand Journal of Public Health 2019 vol. 43 no. 6© 2019 The Authors
Many workforces can benefit from planning. Clear delineation of the workforce, such as through
accreditation or well circumscribed duties, facilitates such planning. Workforces that are less clearly defined may be more difficult to plan for and the public health workforce is one such example.1
The public health workforce can be defined as “people whose primary function is the protection [promotion and/or restoration] of the collective health of whole or specific populations (as distinct from activities directed to the care of individuals)”.1 This definition is broad and identifying the supply of, and demand for, this workforce is difficult: for non-clinical roles in Australia there are many pathways to enter such roles, no mandatory certifications or registrations and many functions that the workforce perform. This impedes and complicates workforce planning activities.
One way to assess demand for the workforce is through assessment of job advertisements and these have proved a versatile data source in public health, providing information about what employers are seeking,2 how many positions are advertised over time,3 and what duties the workforce can be expected to perform.4,5 In Australia, Rotem et al.4 characterised 404 public health advertisements collected in June–July 2003. They found advertisements for a heterogeneous workforce, consisting of officers, managers, clinicians and others, who would work mainly in government positions. Rotem et al. strongly recommended that their study be repeated so that variations in recruitment (such as position, sector and
salary) could be identified; however, no further studies have done so. Our study builds on the solid base provided by Rotem et al. adding breadth in terms of job boards used and depth in terms of the level of associations made (e.g. qualifications by job sector). We also wished to provide research for the New Zealand public health workforce, which could be strengthened by observations in the future.
The aim of this research was to describe and compare recently advertised public health jobs in Australia and New Zealand. In particular, we wished to answer the following research questions:
1. What jobs are in demand, in which locations and advertised by whom?
2. What is required of applicants to get these jobs?
3. How much are people paid to do these jobs?
Methods
Definition of a public health jobWe aimed to capture job advertisements that were public health jobs, rather than job opportunities for graduates of public health. Similar to Rotem et al. we defined public health practitioners as people who were “engaged in activities related to the protection (promotion and/or restoring) of the collective health of whole or specific populations (as distinct from activities
Public health job advertisements in Australia and New Zealand: a changing landscapeRory D. Watts,1 Devin C. Bowles,2,3 Colleen Fisher,1 Ian W. Li1
1. School of Population and Global Health, The University of Western Australia2, Medical School, Australian National University, Australian Capital Territory3. Council of Academic Public Health Institutions Australasia, Australian Capital TerritoryCorrespondence to: Rory D. Watts, School of Population and Global Health, The University of Western Australia, (M431), 35 Stirling Highway, Perth, WA 6009;
e-mail: [email protected]: March 2019; Revision requested: May 2019; Accepted: July 2019The authors have stated they have no conflict of interest.This is an open access article under the terms of the Creative Commons Attribution License, which permits use, distribution and reproduction in any medium, provided the
original work is properly cited.
Aust NZ J Public Health. 2019; 43:522-8; doi: 10.1111/1753-6405.12931
Abstract
Objective: To describe available public health jobs in Australia and New Zealand by comparing recent job advertisements.
Methods: We screened vacancies from 14 online job boards for public health jobs in late 2018. Data collected included information on job titles, sector, contract tenure, location and salary. We compared our findings with those of a job advertisements study from 2005.
Results: We found 333 public health job advertisements in Australia and New Zealand. Common roles included project officers, researchers and managers. Nearly 40% of jobs asked for a ‘tertiary’ degree, with an additional 20% requiring a PhD degree. A qualification in public health was considered essential in 13% of job advertisements. Median annual salary range was $95,000–$111,365.
Conclusions: There is not one specific public health job. Instead, such jobs are diverse in role, sector, qualification level required and the salary they confer.
Implications for public health: There is a demand for skilled workers to perform increasingly complex public health functions, but this may eventually be outpaced by graduate supply. Furthermore, while salaries are considerable, long-term positions are not, and this has implications for the sustainability of the public health workforce.
Key words: workforce, human resources, public health
ADVERTISING
2019 vol. 43 no. 6 Australian and New Zealand Journal of Public Health 523© 2019 The Authors
directed to the care of individuals)”.4 We also wished for this set of jobs to be unlikely to be double-counted by researchers of other workforces if they had access to the same data. Therefore, jobs that had clinical duties, or roles that were not traditionally ‘public health’ were only included if the reviewer felt the role, duty and program area were ‘more public health than not’, which was guided by a published taxonomy of the public health workforce.6 Job advertisements were excluded if they were volunteer positions, internships, cadetships or generic listings for a recruitment pool.
Job advertisement boardsWe searched for job advertisements using fourteen online advertisement boards from Australia and New Zealand. These consisted of commercial job boards (e.g. SEEK), federal and state government boards, and job boards of professional bodies (e.g. the Australian Dental Association). Our search strategies are available in Supplementary File 1. Although each website was idiosyncratic in terms of design, we had two approaches for searches. Where it was practical to do so, all jobs were searched, regardless of category. Where it was not practical to do so (e.g. SEEK.com.au has 150,000+ current advertisements) we conducted three searches: a search using relevant keywords (e.g. “public health”, “epidemiology”, etc.); a random sample of 100 jobs in ‘all listings’; and a random sample of 100 jobs in a ‘healthcare’ category. Random samples were taken to find relevant jobs that had not been captured by our original search strategy, and to modify keywords accordingly to enhance the search strategy. If jobs entries were found to be overlapping, they were reduced to one entry.
Data extraction, cleaning and analysisIncluded advertisements had the following data extracted: date advertised, advertiser, location, annual salary, job title, job type (e.g. full-time, part-time), contract term (e.g. ongoing, fixed-term), contract length in months, position(s) reporting to, direct report(s). Essential qualifications were defined as any tertiary or professional accreditation listed by advertisers as necessary in order to apply for the position. Variables were saved in a database and a copy of the job advertisement (either an .html, or a .pdf/.doc when available) was saved. When available, full job descriptions (job advertisements
are often abridged and accompanied by a full description) were also used. Job titles were trimmed and saved as three variables: hierarchical classifiers (e.g. junior, senior, associate), title (e.g. officer, manager) and original text.
Data cleaning and analysis was performed using the programming language Python version 3.7.3, which was adapted for numerical analyses using open-source packages. Counts, rates, means and medians were estimated for the variables of interest. The code used is available in Supplementary File 2.
Modelling total annual job advertisementsWe developed a simple model to estimate the yearly job advertisements in Australia for 2018 and 2003 (the year Rotem et al.4 collected their data). This involved calculating the average monthly volume of advertisements and extrapolating this to their respective calendar year. For 2018, only one-third of job advertisements included dates for when the job was posted and 78% of these were posted in October. We assumed that advertisements without dates were similar to this subset and therefore 78% of all collected jobs were assumed to be posted in October. For 2003, we used the collected amount of advertisements (n=404) as the estimate for June and July of 2003 (the months that jobs were collected in). To estimate other calendar months, we adjusted these estimates by the rate of change of job advertisements using monthly figures for Australian job advertisement volumes.7 We also conducted a sensitivity analysis, based on the assumption that we did not capture all jobs posted in early October 2018 (advertisements are commonly advertised for a month but some jobs would have been taken down before we searched them). We tested this assumption by only using the job advertisements for the last full week in October and multiplying this by the number of weeks in October.
Additional data sources and classificationsFor additional comparisons, we used the following resources. New Zealand annual salaries were converted to AUD 2018 using the spot exchange rate from XE.com in October 2018, at a rate of AUD $0.92.8 We used population statistics from the Australian Bureau of Statistics (ABS) – Demographic
Statistics, March 2018,9 and the 2018 Subnational Population Estimates for New Zealand.10 Remoteness categories were obtained for Australia from ABS – Remoteness Structures 2016,11 and from the Stats New Zealand Geographic Data Service 2018 – Urban Rural Classification.12 For classifying job sectors, we labelled all university positions as ‘tertiary’, and labelled other advertisers using information provided by the Australian Business Register,13 New Zealand Business Number Registry,14 Australia Charities and Not-for-profits Commission Register15 and advertiser websites. If a job advertisement was posted by a recruitment agency they were classified as ‘recruiter’.
Results
What jobs are advertised, where and by whom?We collected 333 public health job advertisements from 14 job boards with advertisements collected in October and November 2018, the majority of which were found on SEEK Australia and SEEK New Zealand (n=235). Public health jobs gathered from SEEK Australia and SEEK New Zealand represented 1.38% and 1.58% of ‘Healthcare & Medical’ jobs on these websites, respectively (0.12% and 0.09% of all jobs on these websites).
Table 1 lists the common characteristics of public health jobs, and data by location can be found in Supplementary Table 1. There were more job advertisements in Australia compared with New Zealand (n=290 and n=43, respectively) and per capita (11.60 and 8.97 per million persons, respectively). In Australia, the most job advertisements were in New South Wales (n=91), followed by Victoria (n=72). When considered per capita, Northern Territory and the Australian Capital Territory had the most job advertisements (n=72.96 and n=45.32 per million persons, respectively). In New Zealand, Wellington and Auckland regions had the most job advertisements (n=10 and n=8, respectively), whereas Nelson and Northland had the most jobs per capita (57.80 and 33.50 per million persons, respectively). Public health jobs tended to be centralised, with 74% of Australian job advertisements in major cities, and 56% of New Zealand job advertisements in major urban areas.
Of advertised job titles, officers (e.g. project officer, policy officer) were the most common
Advertising Public health job advertisements in Australia and NZ
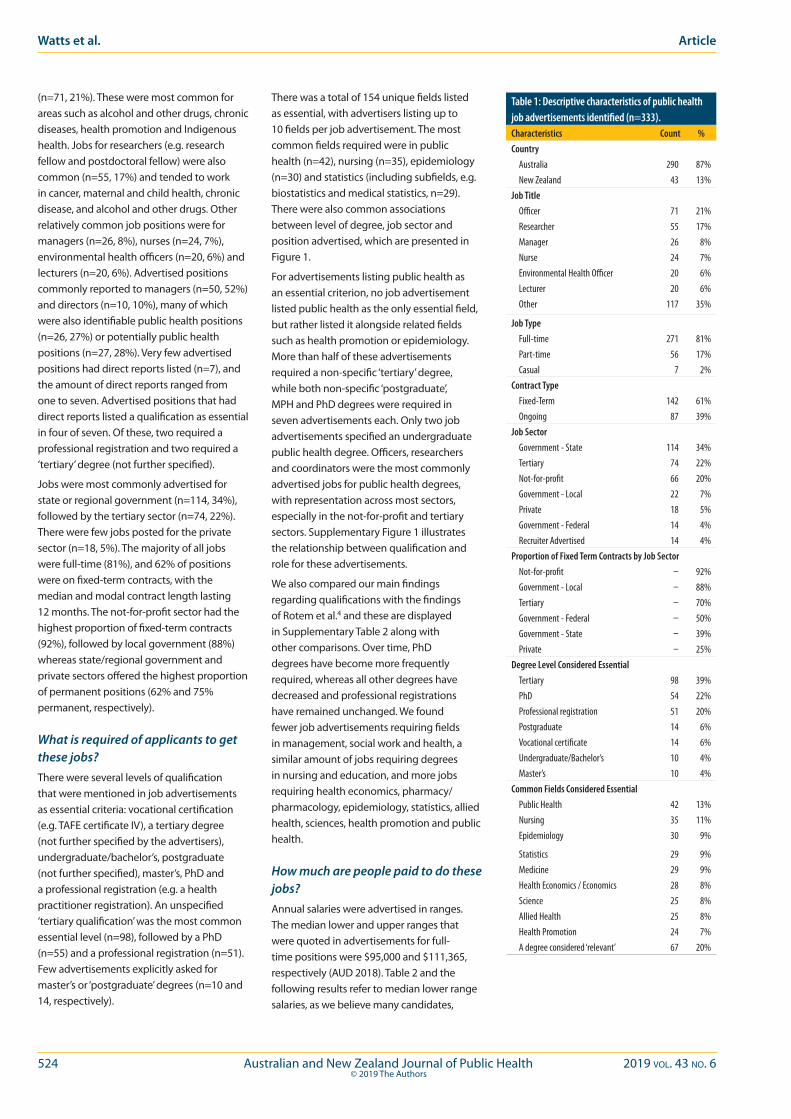
524 Australian and New Zealand Journal of Public Health 2019 vol. 43 no. 6© 2019 The Authors
(n=71, 21%). These were most common for areas such as alcohol and other drugs, chronic diseases, health promotion and Indigenous health. Jobs for researchers (e.g. research fellow and postdoctoral fellow) were also common (n=55, 17%) and tended to work in cancer, maternal and child health, chronic disease, and alcohol and other drugs. Other relatively common job positions were for managers (n=26, 8%), nurses (n=24, 7%), environmental health officers (n=20, 6%) and lecturers (n=20, 6%). Advertised positions commonly reported to managers (n=50, 52%) and directors (n=10, 10%), many of which were also identifiable public health positions (n=26, 27%) or potentially public health positions (n=27, 28%). Very few advertised positions had direct reports listed (n=7), and the amount of direct reports ranged from one to seven. Advertised positions that had direct reports listed a qualification as essential in four of seven. Of these, two required a professional registration and two required a ‘tertiary’ degree (not further specified).
Jobs were most commonly advertised for state or regional government (n=114, 34%), followed by the tertiary sector (n=74, 22%). There were few jobs posted for the private sector (n=18, 5%). The majority of all jobs were full-time (81%), and 62% of positions were on fixed-term contracts, with the median and modal contract length lasting 12 months. The not-for-profit sector had the highest proportion of fixed-term contracts (92%), followed by local government (88%) whereas state/regional government and private sectors offered the highest proportion of permanent positions (62% and 75% permanent, respectively).
What is required of applicants to get these jobs?There were several levels of qualification that were mentioned in job advertisements as essential criteria: vocational certification (e.g. TAFE certificate IV), a tertiary degree (not further specified by the advertisers), undergraduate/bachelor’s, postgraduate (not further specified), master’s, PhD and a professional registration (e.g. a health practitioner registration). An unspecified ‘tertiary qualification’ was the most common essential level (n=98), followed by a PhD (n=55) and a professional registration (n=51). Few advertisements explicitly asked for master’s or ‘postgraduate’ degrees (n=10 and 14, respectively).
Table 1: Descriptive characteristics of public health job advertisements identified (n=333).Characteristics Count %Country Australia 290 87% New Zealand 43 13%Job Title Officer 71 21% Researcher 55 17% Manager 26 8% Nurse 24 7% Environmental Health Officer 20 6% Lecturer 20 6% Other 117 35%
Job Type Full-time 271 81% Part-time 56 17% Casual 7 2%Contract Type Fixed-Term 142 61% Ongoing 87 39%Job Sector Government - State 114 34% Tertiary 74 22% Not-for-profit 66 20% Government - Local 22 7% Private 18 5% Government - Federal 14 4% Recruiter Advertised 14 4%Proportion of Fixed Term Contracts by Job Sector Not-for-profit – 92% Government - Local – 88% Tertiary – 70% Government - Federal – 50% Government - State – 39% Private – 25%Degree Level Considered Essential Tertiary 98 39% PhD 54 22% Professional registration 51 20% Postgraduate 14 6% Vocational certificate 14 6% Undergraduate/Bachelor’s 10 4% Master’s 10 4%Common Fields Considered Essential Public Health 42 13% Nursing 35 11% Epidemiology 30 9%
Statistics 29 9% Medicine 29 9% Health Economics / Economics 28 8% Science 25 8% Allied Health 25 8% Health Promotion 24 7% A degree considered ‘relevant’ 67 20%
There was a total of 154 unique fields listed as essential, with advertisers listing up to 10 fields per job advertisement. The most common fields required were in public health (n=42), nursing (n=35), epidemiology (n=30) and statistics (including subfields, e.g. biostatistics and medical statistics, n=29). There were also common associations between level of degree, job sector and position advertised, which are presented in Figure 1.
For advertisements listing public health as an essential criterion, no job advertisement listed public health as the only essential field, but rather listed it alongside related fields such as health promotion or epidemiology. More than half of these advertisements required a non-specific ‘tertiary’ degree, while both non-specific ‘postgraduate’, MPH and PhD degrees were required in seven advertisements each. Only two job advertisements specified an undergraduate public health degree. Officers, researchers and coordinators were the most commonly advertised jobs for public health degrees, with representation across most sectors, especially in the not-for-profit and tertiary sectors. Supplementary Figure 1 illustrates the relationship between qualification and role for these advertisements.
We also compared our main findings regarding qualifications with the findings of Rotem et al.4 and these are displayed in Supplementary Table 2 along with other comparisons. Over time, PhD degrees have become more frequently required, whereas all other degrees have decreased and professional registrations have remained unchanged. We found fewer job advertisements requiring fields in management, social work and health, a similar amount of jobs requiring degrees in nursing and education, and more jobs requiring health economics, pharmacy/pharmacology, epidemiology, statistics, allied health, sciences, health promotion and public health.
How much are people paid to do these jobs?Annual salaries were advertised in ranges. The median lower and upper ranges that were quoted in advertisements for full-time positions were $95,000 and $111,365, respectively (AUD 2018). Table 2 and the following results refer to median lower range salaries, as we believe many candidates,
Watts et al. Article

2019 vol. 43 no. 6 Australian and New Zealand Journal of Public Health 525© 2019 The Authors
Advertising Public health job advertisements in Australia and NZ
especially those being promoted or entering the sector, would start at the lower range. New Zealand public health jobs advertised a slightly higher median salary than Australian jobs ($97,385 and $95,000, respectively). Advertised median salary was highest in the Federal Government ($100,502) followed by the tertiary sector ($95,461). The lowest advertised salaries were local government ($74,076) and private sector ($70,000), although we note the very limited sample size for the private sector where salary information was available (n=3). Higher degrees were associated with higher salaries, with jobs requiring a vocational certificate (e.g. TAFE) advertising a median salary of $59,494 compared with jobs requiring a PhD advertising a median salary of $98,099. However, this was not the case for advertisements that specified for undergraduate or master’s positions ($111,790 for undergraduate, $77,551 for master’s), but we note the small sample size here too (n=1 and n=3 for undergraduate and master’s, respectively). Many fields were associated with high advertised salaries, such as business, health services, nursing, economics and statistics (median
salaries above $98,000). Health promotion, environmental health and Aboriginal primary health care requirements advertised the lowest salaries (median salaries below $70,000), while public health qualifications were relatively well-remunerated, with a median annual salary listing of $92,465.
Modelled total annual job advertisementsIn 2018, we found 82 advertisements in October from a total of 104 advertisements that posted dates in October or later (78.85%). Therefore, assuming that advertisements without dates were similar, there would be 229 advertisements posted in October in Australia and 2,751 jobs in 2018 when applying the changing rate of job volume per month. In 2003, the total estimated job volume was 2,419, an increase in 14% over this time. Sensitivity analysis provided a much larger estimate for 2018 job advertisements. Assuming all weeks in October had the same volume of jobs as the final full week in October, there would have been 321 jobs advertised in October and 3,863 in 2018, an increase of 60%.
Implications for public health
What jobs are advertised, where and by whom?We collected 333 advertisements for public health jobs, which were mostly advertised in October 2018. Despite several differences in methods (Rotem et al. looked mainly in newspapers, for a longer time period, and only in Australia), some conclusions are similar to Rotem et al.4: the landscape of the workforce is heterogeneous, requiring various roles and qualifications, which is what we would expect from a public health workforce.
We should expect the public health workforce to be responsive to priority areas, national or local, and this appears to be true to some extent. For example, we found numerous officer and researcher positions focused on alcohol and other drugs (11 and 18% of these jobs, respectively), which was an increase from findings in Rotem et al. (6%). This increase may be due to prioritisation in this area including the establishment of the Australian National Advisory Council on Alcohol and Other Drugs (ANACAD) in 2014,16 the Drug and Alcohol program, National Drug Initiatives (e.g. Ice) and
Figure 1: Sankey diagram illustrating the relationship between advertised jobs’ degree level (left bands), sector (centre bands) and role (right bands). Width of bands represents job volume.

526 Australian and New Zealand Journal of Public Health 2019 vol. 43 no. 6© 2019 The Authors
the National Drug Policy in New Zealand (2007–2012 and 2015–2020).17 Priority areas may influence job advertisements through grants, calls for research, or by influencing advertising of specific positions, e.g. research officers in a disease area. Indeed, some of the advertised positions were from Commonwealth Government established research centres, which address particular priority areas. Beyond these observations, it is difficult to assess whether public health job advertisements are responsive to priority areas for two reasons. Firstly, job advertisements in 2018 were more dispersed than in 2003, with greater representation of jobs outside government. Secondly, there is no comprehensive and current listing of public health priority areas in Australia. In New Zealand, two National health targets relate to public health (“increased immunisation” and “better help for smokers to quit”),18 but both countries could benefit from an explicit national priorities list to influence demand.
It is also important to consider whether the amount of jobs we found and modelled is appropriate. We found an increase of between 14% and 60% in the amount of public health jobs between 2003 and 2018. In the same period, however, job advertisements in general increased by 100%,7 all student enrolments increased by 60–70% and students enrolled in health degrees increased by 150% (these are similar for both undergraduate and postgraduate degrees).19 If we assume that public health degrees had a similar increase (we note public health graduates in the US have increased by 300% since 1992),20 then it would appear that in the future not all graduates will be able to find a public health job if they wish to do so.
What is required of applicants to get these jobs?Qualifications and fields sought have changed substantially since 2003. Firstly, it appears that it is more common for advertisers to explicitly acknowledge ‘public health’ as an essential qualification in 2018 than it was 15 years earlier (a 2.3-fold increase), which gives some evidence to coordination between public health education and job markets. However, this amount is only 13%, implying that demand for public health jobs is placed on other qualifications. To this end, the importance of public health education (or on-the-job training) in other fields should
Table 2 - Median advertised full-time annual salary and range. Parameter N Median Salary ($) Range (Min – Max)Country Australia 154 95,000 52,874–175,070 New Zealand 9 97,385 69,920–122,930Job sector Government - Federal 11 100,502 65,563–106,029 Tertiary 58 95,461 65,021–175,070 Government - State 62 95,426 52,874–146,469 Not-for-profit 17 84,150 58,002–100,000 Government - Local 10 74,076 57,662–99,624 Private 3 70,000 69,920–108,044Degree level Vocational certificate 9 59,494 52,898–108,044 Tertiary (raw response) 38 73,412 58,002–124,277 Undergraduate 1 111,790 111,790–111,790 Master’s 3 77,551 65,021–95,426 Postgraduate 6 88,713 65,021–103,000 PhD 39 98,099 66,283–175,070 Professional registration 16 94,055.5 69,920–136,151Degree field Business/Management 1 108,044 108,044–108,044 Health services 4 105,796 68,616–175,070 Nursing 11 99,390 69,920–124,277 Health economics / Economics 15 98,775 73,824–110,961 Statistics 19 98,775 66,283–110,962 Health informatics 5 95,434 95,434–110,962 Health 8 95,426 60,942–110,961 Medicine 13 95,000 70,000–136,151 Epidemiology 17 93,985 65,021–110,962 Public health 18 92,465 58,002–136,946 Allied health 15 82,050 58,002–124,277 Science 11 73,824 69,155–108,044 Social/Behavioural/Political science 11 73,824 60,942–105,000 Pharmacy/Pharmacology 6 73,000 70,000–73,000 Health Promotion 7 68,616 57,662–95,426 Environmental health 7 65,894 60,942–104,227 Aboriginal primary care 7 59,494 52,898–68,683Notes:Advertised salaries are presented in ranges ($X - $Y), and the column ‘Median Salary’ presents the median estimate of the lower bound (i.e. median of $X)
in AUD2018. The ‘Range’ column presents minimum and maximum lower bounds (i.e. min {$X} and max {$X}). Number of advertised salary ranges is presented in column ‘N’.
be emphasised, as graduates from these fields may take up many public health jobs. This sentiment is echoed in prominent Australian21 and US22 reviews, emphasising an understanding of the ecological model of health. Another observation is the change in level of public health degree demanded. Nearly half of all advertisers requested a non-specific tertiary public health degree, with only two advertisers specifying an undergraduate public health degree. This may reflect an uncertainty on the part of employers about differences between the skills obtained in undergraduate and postgraduate public health degrees, which may in turn reflect a lack of clear distinction between what is taught in, and what is
expected of, students of undergraduate- and master’s-level public health degrees.
It is also worth noting the increased requirement for PhD degrees (a 10-fold increase since 2003), which can be partly, but not fully, explained by the increase in jobs advertised in the tertiary sector (three- to four-fold since 2003). This increase may reflect the changes in complexity of work being done, where the PhD is a signal of technical competency (indeed, many job descriptions refer to handling of large datasets, and complex analyses). If such a shift is occurring, there may be scope for non PhD-level degrees to increase focus on these skills and associated knowledge, enhancing graduates’ abilities to meet employer demands.
Watts et al. Article

2019 vol. 43 no. 6 Australian and New Zealand Journal of Public Health 527© 2019 The Authors
How much are people paid to do these jobs?We found that median salary (when only considering Australian advertisements for comparison) has increased substantially. Rotem et al. found a median annual salary of $56,600,4 whereas we found a median salary that ranged between $95,000 and $111,365. If we take the lower estimate, there is a nominal increase of almost $40,000, which implies a real increase of approximately $20,000 since 2003. While Australian and New Zealand salaries were similar (their median salaries differing by $2,000), obtaining a larger sample would enable us to make more granular comparisons.
While this increase is substantial, we must also consider this as a trade-off with a high rate of fixed-term contracts, which has inverted since 2003 (62% permanent/not-stated in 2003 compared with 62% fixed-term in 2018). Australia has the third highest rate of non-standard employment in OECD countries (more than 40% of total employment being non-standard), more than half of which relates to temporary contracts.23 Public health job advertisements are substantially higher than this rate, which may be due to the shift away from government positions to not-for-profit and tertiary sectors, both of which have very high rates of fixed-term contracts (92% and 70%, respectively). This may also show that funding is primarily obtained for projects with a fixed timeframe, deliverables and staffing requirements. These observations have implications for the sustainability of the public health workforce; both high salaries and non-standard employment affect job satisfaction, but in opposite directions. In the US, nearly half the governmental public health workforce is considering leaving in the next five years, more than half of which are leaving for reasons other than retirement,24 and further research in Australia and New Zealand may help establish whether this is also the case in these countries.
LimitationsThere are two key limitations to our work: the definition we have used to capture ‘public health jobs’ and the timeframe we used. Definitional issues regarding the public health workforce and their lack of professional identity are common and unavoidable given the breadth of roles and work performed in this area.25 However, we used the same definition as Rotem et al. and implemented checks and balances (e.g. random sampling
strategy on websites, a broad set of job boards) to minimise missing searches. Our timeframe was short and this may have led to omissions in temporal patterns in job advertisements. Difficulty arises in continual collection of online job advertisements, due to the high volume, rate of false positives (a search of “public health manager” yielded thousands of results, some for “refrigerator mechanic” or “personal trainer” and many more that were irrelevant) and the lack of archiving. One way to circumvent this would be to train a supervised machine learning algorithm to automatically flag advertisements with a high likelihood of being in public health. This may prove fruitful for both future researchers and graduates looking for public health jobs. In the future, it may also be useful to search jobs by degree (e.g. “Master of Public Health”), although we note the limited ways this can be used (e.g. searching “MPH” also brings up non-public health acronyms too).
It is also worth mentioning our observations with advertisements from New Zealand. Firstly, the brevity of the timeframe used led to a much smaller number of advertisements (n=43) when compared to Australia. We suggest that a longer period be adopted in future research to capture a greater number of job listings. To our knowledge, this is the first study to characterise public health jobs in New Zealand and one of very few job advertisement studies more broadly.26 Compared with Australia, data collection has more potential difficulties as jobs are advertised for each district health board, which are numerous and unique. We simplified this by the use of an aggregator website (kiwihealthjobs.net). Although we validated the presence of public health job advertisements on this website with two district health boards, there may have been jobs missing from others. For future research, we would encourage a longer collection period for jobs, using several job boards such as SEEK and district health boards.
Finally, job advertisements are not clear windows into workforce activities, or the persons performing them. Job advertisements are spaces where employers compete to attract the best applicants and accuracy may be substituted with hyperbole or buzzwords.27 It was for this reason that we avoided analysing information about competencies and job duties. Simply put, the content was too heterogeneous and vague to be informative. This is not
common practice, however: Rotem et al. found commonalities in competencies expressed, such as “communication skills” and “interpersonal activity capabilities”.4 Similarly, a content analysis of public health management positions found a high listing of competencies relating to communication, leadership, management and coordination.28 We did not think that our current study would have been enriched by such an analysis. However, we do believe there would be value in observing trends in competencies listed for individual employers (e.g. a state health department or a private firm) over time, as these changes may reflect true shifts in preferences at the level of the individual firm.
Conclusions
A job advertisement is not a job. There are likely to be substantial differences between what is listed, what is performed and who performs it. As there is little information on demand for the public health workforce in Australia or New Zealand, observing job advertisements seems to be a pragmatic way of observing demand and these observations are strengthened through regular review.
Given our observations, there are some conclusions regarding workforce supply and demand that seem reasonable. There appears to be a mismatch between the rate of supply of public health jobs and graduates, which may lead to an oversupply of graduates to fill jobs in public health. However, this does not appear to be the case yet, owing to the marked increase in advertised salaries for public health jobs. This increase may not be due to undersupply of workers and so we must explain it in other terms, such as the increasing complexity of work demanded, increased educational demand on workers and increased risk from temporary employment.
References1. Beaglehole R. Challenging the public health workforce.
Scand J Public Health. 2004;32(4):241-2. 2. Dahal S, Sharma A, Zodpey S. Mapping of public health
jobs in India-where can the public health graduates be employed? J Health Manag. 20(1):73-83.
3. Beck AJ, Boulton ML, Lemmings J, Clayton JL. Challenges to recruitment and retention of the state health department epidemiology workforce. Am J Prev Med. 2012;42(1):76-80.
4. Rotem A, Dewdney JC, Mallock NA, Jochelson TR. Public health job vacancies-who wants what, where? Aust Health Rev. 2005;29:226-34.
5. Frankenfeld CL. Trends in employer postings for epidemiology jobs: An analysis of PublicHealthJobs.net data from 2003 to 2016. Ann Epidemiol. 2017;27(9):553-7.e1.
Advertising Public health job advertisements in Australia and NZ
528 Australian and New Zealand Journal of Public Health 2019 vol. 43 no. 6© 2019 The Authors
6. Boulton ML, Beck AJ, Coronado F, Merrill JA, Friedman CP, Stamas GD, et al. Public health workforce taxonomy. Am J Prev Med. 2014;47(5 Supplement 3):314-23.
7. Trading Economics. Australia Job Advertisements - 2018 [Internet]. New York (NY): Trading Economics; 2018 [cited 2018 Dec 17]. Available from: https://tradingeconomics.com/australia/job-advertisements
8. XE. Current and Historical Rate Tables [Internet]. Ontario (CAN): XE; 2018 [cited 2018 Nov 29]. Available from: https://www.xe.com/currencytables/?from=NZD&date=2018-10-01
9. Australian Bureau of Statistics. 3101.0 - Australian Demographic Statistics, Mar 2018 [Internet]. Canberra (AUST): ABS; 2018 [cited 2018 Nov 29]. Available from: http://www.abs.gov.au/AUSSTATS/[email protected]/mf/3101.0
10. Stats NZ. Subnational Population Estimates at 30 June 2018 (Provisional) – CSV [Internet]. Wellington (NZ): Government of New Zealand; 2018 [cited 2018 Dec 14]. Available from: https://www.stats.govt.nz/large-datasets/csv-files-for-download/
11. Australian Bureau of Statistics. 1270.0.55.005 - Australian Statistical Geography Standard (ASGS): Volume 5 - Remoteness Structure, July 2016 [Internet]. Canberra (AUST): ABS; 2018 [cited 2018 Nov 29]. Available from: http://www.abs.gov.au/AUSSTATS/[email protected]/DetailsPage/1270.0.55.005July%202016?OpenDocument
12. Stats NZ. Geographic Data Service [Internet]. Wellington (NZ): Government of New Zealand; 2018 [cited 2018 Nov 29]. Available from: https://datafinder.stats.govt.nz/?_ga=2.267270726.931780837.1542782504-2054010607.1533284991
13. Australian Business Register. ABN Lookup [Internet]. Newcastle (AUST): Government of Australia; 2018 [cited 2018 Nov 29]. Available from: https://abr.business.gov.au/
14. NZ Ministry of Business, Innovation and Employment. New Zealand Business Number [Internet]. Auckland (NZ): Government of New Zealand; 2018 [cited 2018 Nov 29]. Available from: https://www.nzbn.govt.nz/
15. Australian Charities and Not-for-profits Commission. Search the ACNC Charity Register [Internet]. Melbourne (AUST): ACNC; 2018 [cited 2018 Nov 29]. Available from: https://www.acnc.gov.au/charity
16. Australian Department of Health Australian. National Advisory Council on Alcohol and Other Drugs (ANACAD) [Internet]. Canberra (AUST): Government of Australia; 2018 [cited 2018 Nov 29]. Available from: http://www.health.gov.au/internet/main/publishing.nsf/Content/anacad
17. NZ Ministry of Health. National Drug Policy 2015 to 2020 [Internet]. Wellington (NZ): Government of New Zealand; 2018 [cited 2018 Dec 18]. Available from: https://www.health.govt.nz/publication/national-drug-policy-2015-2020
18. NZ Ministry of Health. Health Targets [Internet]. Wellington (NZ): Government of New Zealand; 2018 [cited 2019 Feb 19]. Available from: https://www.health.govt.nz/new-zealand-health-system/health-targets
19. Department of Education and Training. uCube - Higher Education Statistics [Internet]. Canberra (AUST): Government of Australia; 2018 [cited 2018 Dec 17]. Available from: http://highereducationstatistics.education.gov.au/Default.aspx
20. U.S. Department of Education. National Center for Education Statistics - Integrated Postsecondary Education Data System [Internet]. Washington (DC): NCES; 2019 [cited 2019 Jan 12]. Available from: https://nces.ed.gov/ipeds/datacenter/
21. White KL. Australia’s Bicentennial Health Initiative: Independent Review of Research and Educational Requirements for Public Health and Tropical Health in Australia. The Australian Bicentennary 1788-1988. Canberra (AUST): Australian Department of Health; 1986 [cited 2019 Feb 19]. Available from: http://www.health.gov.au/internet/main/publishing.nsf/Content/C66647AAB9871405CA257BF000209A71/$File/pherp-review-1986.pdf
22. Institute of Medicine (US) Committee on Educating Public Health Professionals for the 21st Century; Gebbie K, Rosenstock L, Hernandez LM, editors. Who Will Keep the Public Healthy? Educating Public Health Professionals for the 21st Century. Washington (DC): National Academies Press; 2003.
23. Organisation for Economic Co-operation and Development. In It Together: Why Less Inequality Benefits All (Fig 4.1, Panel A). Paris (FRA): OECD Publishing; 2015.
24. PH WINS. Public Health Workforce Interest and Needs Survey: Digital Appendix [Internet]. Arlington (VA): Association of State and Territorial Health Officials; 2017. Available from: https://www.debeaumont.org/wp-content/uploads/2017-PH-WINS-Digital-Appendix.pdf
25. Bennett CM, Lilley K, Yeatman H, Parker E, Geelhoed E, Hanna EG, et al. Paving pathways: shaping the public health workforce through tertiary education. Aust N Z Health Policy. 2010;7:2.
26. Ahsan K, Ho M, Khan S. Recruiting project managers: a comparative analysis of competencies and recruitment signals from job advertisements. Proj Manag J. 2013;44(5):36-54.
27. Adzuna. The Top 10 Overused Buzzwords in Job Ads [Internet]. London (UK): Adzuna; 2018 [cited 2018 Nov 28]. Available from: https://www.adzuna.co.uk/blog/2012/04/26/the-top-10-overused-buzzwords-in-job-ads/
28. Meyer M. Qualifications and competencies for population health management positions: a content analysis of job postings. Popul Health Manag. 2017;20(6):475-85.
Supporting Information
Additional supporting information may be found in the online version of this article:
Supplementary File 1: Search strategy.
Supplementary File 2: Data analysis notebook.
Supplementary Table 1: Advertisement counts by location.
Supplementary Table 2: Comparisons of Australian advertisements with Rotem et al. (2005).
Supplementary Figure 1: Relationship between public health level of degree required and advertised role. Width of bands represent number of advertised roles.
Watts et al. Article

2019 vol. 43 no. 6 Australian and New Zealand Journal of Public Health 529© 2019 The Authors
Anti-tobacco mass media campaigns have historically used a range of approaches and techniques.1 The
most effective advertisements for eliciting quitting intentions and behaviours among smokers are those that convey a negative health message or project a negative tone, and employ elements such as graphic imagery or testimonials.1,2 Although the effectiveness of different advertisement characteristics has been well documented, previous research has typically provided limited information about the individuals who code advertisement characteristics. Several studies report graduate students coding anti-smoking advertisement themes or content,3,4 while others note that the task was undertaken wholly or in part by the study authors,5-9 trained coders,10 or members of the general public.11 In some studies, smokers are recruited to undertake9 or validate7,8 coding, while other studies recruit a specific target audience, such as youth12,13 or non-smokers,14 or use a combination of different types of coders.6,9,15 Among studies that do report coder type, relatively few9,11,12 present detailed information about the demographics or smoking habits of coders.
Given that the outcomes of such research are used to inform anti-smoking campaigns, it is important to understand whether the coding of advertisement characteristics is consistent among different groups, and especially between smokers and other types of coders. There is limited research to date on this topic, with only one identified study describing this
in detail: Langley et al. report consistency between smokers and researchers in the perceived emotional valence of anti-tobacco advertisements, but differences in which specific emotion was evoked.7 The aim of the present study was therefore to assess whether evaluations of anti-smoking advertisement characteristics differ between smokers and ‘experts’ to determine whether these two groups are likely to provide comparable assessments.
Methods
RecruitmentParticipating smokers were Western Australian (WA) adults aged 18–54 years who smoked regularly (≥1 cigarette/day or ≥7 cigarettes/week). Smokers were recruited and reimbursed through an ISO-accredited web panel provider (PureProfile) and were excluded if they worked in the areas of health promotion, public health or advertising.
‘Experts’ were defined as adults aged ≥18 years with knowledge of health promotion,
Anti-smoking advertisements are perceived differently by smokers and individuals with health or advertising knowledgeNatalia Lizama,1,2 Terry Slevin,1–3 Simone Pettigrew2,4
1. Cancer Council Western Australia2. School of Psychology, Curtin University, Western Australia3. Public Health Association of Australia, Australian Capital Territory4. The George Institute for Global Health, New South WalesCorrespondence to: Dr Natalia Lizama, Cancer Council Western Australia, 420 Bagot Rd, Subiaco WA 6008; e-mail: [email protected]: March 2019; Revision requested: July 2019; Accepted: September 2019The authors have stated they have no conflict of interest.This is an open access article under the terms of the Creative Commons Attribution-NonCommercial-NoDerivs License, which permits use and distribution in any medium,
provided the original work is properly cited, the use is non-commercial and no modifications or adaptations are made.
Aust NZ J Public Health. 2019; 43:529-31; doi: 10.1111/1753-6405.12945
Abstract
Objective: Several studies have examined the characteristics of anti-smoking advertisements that are associated with quitting behaviour. Some studies use researchers or graduate students to code advertisement characteristics, while others recruit smokers or members of the general public. The aim of this study was to assist future campaign development by assessing whether anti-smoking advertisement characteristics are coded differently by smokers and ‘experts’ (individuals with knowledge of health promotion, public health or advertising).
Methods: A total of 49 smokers and 42 experts coded anti-smoking advertisements according to four key characteristics (emotional/cognitive approach, negative/positive tone, message frame, and main message) and the use of eight executional techniques. Chi-squared tests were used to measure differences in coding outcomes between smokers and experts.
Results: There were significant differences between smokers and experts in the coding of all key characteristics and four of the eight executional techniques. Compared with smokers, experts were more likely to perceive advertisements as negative in tone and as inducing fear.
Conclusions: Smokers and experts perceived the characteristics of anti-smoking advertisements differently.
Implications for public health: Differences between smokers and experts may need to be taken into account where studies use either of these groups to code advertisements for campaign development or evaluation purposes.
Key words: tobacco smoking, smoking prevention, advertisements, anti-smoking campaign
ADVERTISING
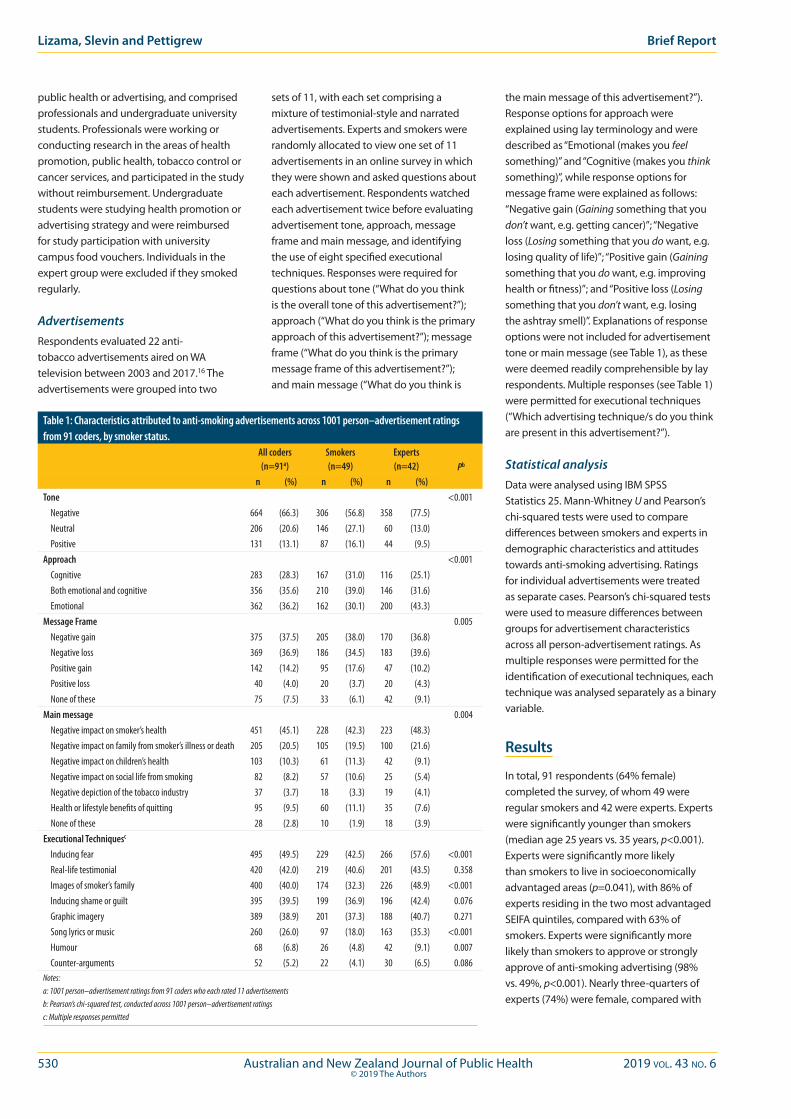
530 Australian and New Zealand Journal of Public Health 2019 vol. 43 no. 6© 2019 The Authors
Lizama, Slevin and Pettigrew Brief Report
public health or advertising, and comprised professionals and undergraduate university students. Professionals were working or conducting research in the areas of health promotion, public health, tobacco control or cancer services, and participated in the study without reimbursement. Undergraduate students were studying health promotion or advertising strategy and were reimbursed for study participation with university campus food vouchers. Individuals in the expert group were excluded if they smoked regularly.
AdvertisementsRespondents evaluated 22 anti-tobacco advertisements aired on WA television between 2003 and 2017.16 The advertisements were grouped into two
sets of 11, with each set comprising a mixture of testimonial-style and narrated advertisements. Experts and smokers were randomly allocated to view one set of 11 advertisements in an online survey in which they were shown and asked questions about each advertisement. Respondents watched each advertisement twice before evaluating advertisement tone, approach, message frame and main message, and identifying the use of eight specified executional techniques. Responses were required for questions about tone (“What do you think is the overall tone of this advertisement?”); approach (“What do you think is the primary approach of this advertisement?”); message frame (“What do you think is the primary message frame of this advertisement?”); and main message (“What do you think is
the main message of this advertisement?”). Response options for approach were explained using lay terminology and were described as “Emotional (makes you feel something)” and “Cognitive (makes you think something)”, while response options for message frame were explained as follows: “Negative gain (Gaining something that you don’t want, e.g. getting cancer)”; “Negative loss (Losing something that you do want, e.g. losing quality of life)”; “Positive gain (Gaining something that you do want, e.g. improving health or fitness)”; and “Positive loss (Losing something that you don’t want, e.g. losing the ashtray smell)”. Explanations of response options were not included for advertisement tone or main message (see Table 1), as these were deemed readily comprehensible by lay respondents. Multiple responses (see Table 1) were permitted for executional techniques (“Which advertising technique/s do you think are present in this advertisement?”).
Statistical analysisData were analysed using IBM SPSS Statistics 25. Mann-Whitney U and Pearson’s chi-squared tests were used to compare differences between smokers and experts in demographic characteristics and attitudes towards anti-smoking advertising. Ratings for individual advertisements were treated as separate cases. Pearson’s chi-squared tests were used to measure differences between groups for advertisement characteristics across all person-advertisement ratings. As multiple responses were permitted for the identification of executional techniques, each technique was analysed separately as a binary variable.
Results
In total, 91 respondents (64% female) completed the survey, of whom 49 were regular smokers and 42 were experts. Experts were significantly younger than smokers (median age 25 years vs. 35 years, p<0.001). Experts were significantly more likely than smokers to live in socioeconomically advantaged areas (p=0.041), with 86% of experts residing in the two most advantaged SEIFA quintiles, compared with 63% of smokers. Experts were significantly more likely than smokers to approve or strongly approve of anti-smoking advertising (98% vs. 49%, p<0.001). Nearly three-quarters of experts (74%) were female, compared with
Table 1: Characteristics attributed to anti-smoking advertisements across 1001 person–advertisement ratings from 91 coders, by smoker status.
All coders (n=91a)
Smokers (n=49)
Experts (n=42) Pb
n (%) n (%) n (%)Tone <0.001 Negative 664 (66.3) 306 (56.8) 358 (77.5) Neutral 206 (20.6) 146 (27.1) 60 (13.0) Positive 131 (13.1) 87 (16.1) 44 (9.5)Approach <0.001 Cognitive 283 (28.3) 167 (31.0) 116 (25.1) Both emotional and cognitive 356 (35.6) 210 (39.0) 146 (31.6) Emotional 362 (36.2) 162 (30.1) 200 (43.3)Message Frame 0.005 Negative gain 375 (37.5) 205 (38.0) 170 (36.8) Negative loss 369 (36.9) 186 (34.5) 183 (39.6) Positive gain 142 (14.2) 95 (17.6) 47 (10.2) Positive loss 40 (4.0) 20 (3.7) 20 (4.3) None of these 75 (7.5) 33 (6.1) 42 (9.1)Main message 0.004 Negative impact on smoker’s health 451 (45.1) 228 (42.3) 223 (48.3) Negative impact on family from smoker’s illness or death 205 (20.5) 105 (19.5) 100 (21.6) Negative impact on children’s health 103 (10.3) 61 (11.3) 42 (9.1) Negative impact on social life from smoking 82 (8.2) 57 (10.6) 25 (5.4) Negative depiction of the tobacco industry 37 (3.7) 18 (3.3) 19 (4.1) Health or lifestyle benefits of quitting 95 (9.5) 60 (11.1) 35 (7.6) None of these 28 (2.8) 10 (1.9) 18 (3.9)Executional Techniquesc
Inducing fear 495 (49.5) 229 (42.5) 266 (57.6) <0.001 Real-life testimonial 420 (42.0) 219 (40.6) 201 (43.5) 0.358 Images of smoker’s family 400 (40.0) 174 (32.3) 226 (48.9) <0.001 Inducing shame or guilt 395 (39.5) 199 (36.9) 196 (42.4) 0.076 Graphic imagery 389 (38.9) 201 (37.3) 188 (40.7) 0.271 Song lyrics or music 260 (26.0) 97 (18.0) 163 (35.3) <0.001 Humour 68 (6.8) 26 (4.8) 42 (9.1) 0.007 Counter-arguments 52 (5.2) 22 (4.1) 30 (6.5) 0.086Notes:a: 1001 person–advertisement ratings from 91 coders who each rated 11 advertisementsb: Pearson’s chi-squared test, conducted across 1001 person–advertisement ratingsc: Multiple responses permitted
2019 vol. 43 no. 6 Australian and New Zealand Journal of Public Health 531© 2019 The Authors
Advertising Perceptions of anti-smoking advertisements
55% of smokers, although this difference was not statistically significant (p=0.064).
Each respondent evaluated 11 different anti-smoking advertisements, resulting in 1,001 person–advertisement ratings for each advertising characteristic. There were significant differences between smokers and experts in the attribution of all four key advertisement characteristics (Table 1). Compared with experts, smokers more frequently perceived advertisements as positive or neutral in tone and less frequently identified the main message of advertisements to be the negative impact of smoking on a smoker’s health. Significant differences between smokers and experts were observed for four of the eight executional techniques, with smokers less likely to identify advertisements as inducing fear, presenting images of a smoker’s family, containing humour, or featuring song lyrics or music.
Conclusions
This study found that the attribution of advertising characteristics and executional techniques used in anti-smoking advertisements differed significantly between smokers and experts. Notably, smokers were significantly less likely than experts to perceive advertisements as negative or fear-inducing and less frequently identified advertisements as portraying the negative health impacts of smoking.
These findings have some similarities with a study by Langley et al.,7 which describes discrepancies between smokers and researchers in the attribution of specific emotions – such as fear or happiness – evoked by advertisements. The present study similarly found that smokers and experts had differing perceptions of whether advertisements induced fear or used humour. However, while Langley et al.7 reported consistency between smokers and researchers in relation to advertisements evoking negative or positive emotional responses, the present study found that smokers were significantly less likely than experts to perceive advertisements as negative in tone.
Implications for public health
The observed differences between smokers’ and experts’ evaluations of anti-smoking advertisements indicate that relying solely
on either group to code such advertisements could lead to misclassification of advertising elements. It is therefore important that future studies evaluating the effectiveness of anti-smoking advertisement characteristics report by whom the coding process was undertaken and consider the resulting implications.
In addition, research has demonstrated that negative emotional tone and a negative health message are associated with increased smoking cessation intentions and outcomes.1,2 The observed results indicate that public health and advertising experts may overestimate the negativity or fear appeal of anti-tobacco advertisements relative to smokers, and are more likely than smokers to interpret these advertisements as conveying a negative health message. These advertising elements may therefore need to be exaggerated in anti-tobacco campaigns to evoke a fearful or negative emotion among smokers that is sufficiently strong to elicit quitting intentions and actions. This research further reinforces the importance for those working on the communication of public health messages of capturing and considering feedback from individuals who are the target of those messages.
Acknowledgements
The authors would like to thank all individuals who participated in the study without reimbursement. Thank you to Ashleigh Parnell for assisting with data collection.
Ethical approvalEthical approval to conduct the study was obtained from the Curtin University Human Research Ethics Office (RD-19-14).
FundingThis work was supported by funding from the Department of Health Western Australia (#C06387) and Healthway (#31863).
References1. National Cancer Institute. The Role of the Media in
Promoting and Reducing Tobacco Use. Tobacco Control Monograph No.: 19. Bethesda (MD): NCI; 2008.
2. Durkin S, Brennan E, Wakefield M. Mass media campaigns to promote smoking cessation among adults: An integrative review. Tob Control. 2012;21(2):127-38.
3. Beaudoin CE. Exploring antismoking ads: appeals, themes, and consequences. J Health Commun. 2002;7(2):123-37.
4. Cohen EL, Shumate MD, Gold A. Anti-smoking media campaign messages: theory and practice. Health Commun. 2007;22(2):91-102.
5. Terry-McElrath Y, Wakefield M, Ruel E, et al. The effect of antismoking advertisement executional characteristics on youth comprehension, appraisal, recall, and engagement. J Health Commun. 2005;10(2):127-43.
6. Durkin SJ, Biener L, Wakefield MA. Effects of different types of antismoking ads on reducing disparities in smoking cessation among socioeconomic subgroups. Am J Public Health. 2009;99(12):2217-23.
7. Langley T, Lewis S, McNeill A, et al. Characterizing tobacco control mass media campaigns in England. Addiction. 2013;108(11):2001-8.
8. Richardson S, Langley T, Szatkowski L, et al. How does the emotive content of televised anti-smoking mass media campaigns influence monthly calls to the NHS Stop Smoking helpline in England? Prev Med. 2014;69:43-8.
9. Durkin SJ, Wakefield MA, Spittal MJ. Which types of televised anti-tobacco campaigns prompt more quitline calls from disadvantaged groups? Health Educ Res. 2011;26(6):998-1009.
10. Davis KC, Nonnemaker JM, Farrelly MC, et al. Exploring differences in smokers’ perceptions of the effectiveness of cessation media messages. Tob Control. 2011;20(1):26-33.
11. Biener L, McCallum-Keeler G, Nyman AL. Adults’ response to Massachusetts anti-tobacco television advertisements: Impact of viewer and advertisement characteristics. Tob Control. 2000;9(4):401-7.
12. Biener L, Ji M, Gilpin EA, et al. The impact of emotional tone, message, and broadcast parameters in youth anti-smoking advertisements. J Health Commun. 2004;9(3):259-74.
13. Biener L, Wakefield M, Shiner CM, et al. How broadcast volume and emotional content affect youth recall of anti-tobacco advertising. Am J Prev Med. 2008;35(1):14-19.
14. Dunlop SM, Cotter T, Perez D. When your smoking is not just about you: Antismoking advertising, interpersonal pressure, and quitting outcomes. J Health Commun. 2014;19(1):41-56.
15. Dunlop SM, Perez D, Cotter T. The natural history of antismoking advertising recall: The influence of broadcasting parameters, emotional intensity and executional features. Tob Control. 2014;23(3):215-22.
16. Cancer Council Western Australia. Make Smoking History. Past Campaigns: Make Smoking History [Internet]. Perth (AUST): Cancer Council WA; 2019 [cited 2019 Jul 9]. Available from: https://makesmokinghistory.org.au/more-information/past-campaigns/

532 Australian and New Zealand Journal of Public Health 2019 vol. 43 no. 6© 2019 The Authors
Both Aboriginal and Torres Strait Islander peoples’ use of alcohol and policy responses to address it are
linked to Australia’s history of colonisation.1 While Brady has documented pre-colonisation Aboriginal and Torres Strait Islander use of fermented, intoxicating drinks including those made from pandanus plants, banksia cones, and coconut tree buds,2 European settlers brought with them the practice of heavy drinking2 and used alcohol as wages and to control and trade with Aboriginal and Torres Strait Islander people.3 When heavy drinking by Aboriginal and Torres Strait Islander people began to produce visible harms, the Europeans prohibited the supply of alcohol to Aboriginal and Torres Strait Islander people.2 Langton4 recounts how the Europeans constructed the colonial stereotype of the “drunken Aborigine”, and prohibited alcohol to Aboriginal and Torres Strait Islander people out of fear, exempting those who did not live in camps and mixed with “good” company.2 This prohibition was repealed between 1957 and 1972 in different states and territories.2
While, among Aboriginal and Torres Strait Islander people who drink, a higher proportion drink at risky levels than non-Indigenous people5,6 and disproportionately suffer from alcohol-related harms including violence, hospitalisations and death,6,7 the context around this disparity is vitally important.8 Colonisation is a root cause, or underpinning social determinant of health
for Indigenous peoples, providing the social and political context that drives inequities in the intermediate and proximal determinants of health such as education, health and other systems, employment, housing, interpersonal and institutional racism, discrimination and alcohol use.9-11 There is a large shortfall in alcohol treatment services for Aboriginal and Torres Strait Islander people,12 and extensive unmet needs for wider social and emotional wellbeing services.13
Alcohol-related harms among Aboriginal people are particularly prevalent in the Northern Territory (NT), where the alcohol-attributable death rates are considerably higher than the national average.14 Policy responses, particularly the Northern Territory Emergency Response (NTER, 2007–2008), have often continued the same logic and power relations of colonisation, problematising Aboriginal and Torres Strait Islander communities.15 Alcohol use was
Case study of a decolonising Aboriginal community controlled comprehensive primary health care response to alcohol-related harmToby Freeman,1 Fran Baum,1 Tamara Mackean,1 Anna Ziersch,1 Juanita Sherwood,2 Tahnia Edwards,3 John Boffa3
1. Southgate Institute for Health, Society and Equity, Flinders University, South Australia2. National Centre for Cultural Competency, University of Sydney, New South Wales3. Central Australian Aboriginal Congress, Northern TerritoryCorrespondence to: Dr Toby Freeman, Southgate Institute for Health, Society and Equity, Flinders University, GPO Box 2100, Adelaide, SA 5001;
e-mail: [email protected] Submitted: December 2018; Revision requested: June 2019; Accepted: August 2019The authors have stated the following conflict of interest: Two co-authors are employees of the service where the project was conducted, as this was participatory research.This is an open access article under the terms of the Creative Commons Attribution License, which permits use, distribution and reproduction in any medium, provided the
original work is properly cited.
Aust NZ J Public Health. 2019; 43:532-7; doi: 10.1111/1753-6405.12938
Abstract
Objective: This paper provides a case study of the responses to alcohol of an Aboriginal Community Controlled Health Service (The Service), and investigates the implementation of comprehensive primary health care and how it challenges the logic of colonial approaches.
Methods: Data were drawn from a larger comprehensive primary health care study. Data on actions on alcohol were collected from: a) six-monthly service reports of activities; b) 29 interviews with staff and board members; c) six interviews with advocacy partners; and d) community assessment workshops with 13 service users.
Results: The Service engaged in rehabilitative, curative, preventive and promotive work targeting alcohol, including advocacy and collaborative action on social determinants of health. It challenged other government approaches by increasing Aboriginal people’s control, providing culturally safe services, addressing racism, and advocating to government and industry.
Conclusions: This case study provides an example of implementation of the full continuum of comprehensive primary health care activities. It shows how community control can challenge colonialism and ongoing power imbalances to promote evidence-based policy and practice that support self-determination as a positive determinant for health.
Implications for public health: Aboriginal Community Controlled Health Services are a good model for comprehensive primary health care approaches to alcohol control.
Key words: alcohol drinking, primary health care, social determinants of health, colonisation, racism
INDIGENOUS HEALTH

2019 vol. 43 no. 6 Australian and New Zealand Journal of Public Health 533© 2019 The Authors
a key NTER target, which included racial place-based alcohol restrictions, compulsory income management, increased policing and temporary acquisition of Aboriginal townships.16
Aboriginal Community Controlled Health Services (ACCHSs) have been established across Australia, often as a result of local, grassroots movements by Aboriginal and Torres Strait Islander peoples in response to poor access and discrimination in mainstream health care.17 Today, 150 ACCHSs serve one-third to one-half of the Aboriginal and Torres Strait Islander population.18 ACCHSs are an expression of self-determination that aim to improve health and wellbeing and mitigate the processes of ongoing colonisation.19 This is not to suggest a dichotomy between community controlled services versus government services, but to acknowledge that ongoing colonisation is a critical part of the context within which all efforts to improve Aboriginal and Torres Strait Islander health take place.11 This paper seeks to investigate the extent to which a community controlled model of comprehensive primary health care has the potential to contest and provide an alternative to ongoing colonisation using alcohol as an example.
ACCHSs are a world-leading model of Primary Health Care4 – pre-dating but embodying the Alma Ata Declaration’s20 vision of comprehensive primary health care. Key to the Alma Ata vision is that primary health care (PHC) ought to not only engage in treatment of diseases and rehabilitation, but also prevent diseases and promote health.20 How this comprehensive PHC approach can be specifically applied to alcohol is illustrated in Table 1.
While ACCHSs often demonstrate these four pillars of PHC in action, we acknowledge that this Alma Ata terminology is Western and does not necessarily capture Aboriginal and Torres Strait Islander concepts of health and healing. This paper investigates the potential of an ACCHS approach to address alcohol-related harm among Aboriginal and Torres Strait Islander peoples in a way
that encourages self-determination rather than ongoing colonisation. It focuses on an example of one ACCHS’s actions on alcohol-related harm, Central Australian Aboriginal Congress Aboriginal Corporation (Congress), in a regional town in the Northern Territory (Alice Springs).
Two research questions guided the study:
1. How does the health service implement a community controlled comprehensive primary health care response to alcohol-related harm?
2. How does this comprehensive approach challenge the logic and processes of ongoing colonisation in responses to Aboriginal and Torres Strait Islander alcohol-related harm?
Methods
Data were drawn from a larger study on comprehensive PHC that partnered with five South Australian services and Congress.4,21-23 The six PHC services were selected to maximise diversity and because they had existing relationships with the research team that would make participation in a five-year research project (2009–2014) feasible. The research used participatory action methods24 where participating services were partners in the research. Its aim was to understand how the principles of comprehensive PHC were implemented on the ground by these services. The South Australian services did not have a comprehensive approach to alcohol, but Congress’ activity stood out as a well-resourced, comprehensive response to alcohol-related harm in the community it serves.
Data on Congress’ response to alcohol-related harm were drawn from a) six-monthly service reports of activities; b) interviews with staff; c) interviews with partners in the People’s Alcohol Action Coalition; and d) community assessment workshops with service users:
a) Service reports. From 2009 to 2013, service data were collected from the services in a biannual audit that provided details
of budgets, types of services offered, organisational documents and staff numbers.
b) Congress staff interviews. There were two rounds of staff interviews, one in 2009–2010, including 14 interviews with Congress staff and board members25 and one in 2013–2014, including 15 interviews with Congress staff and board members.22 The first round explored implementation of comprehensive PHC principles at the service, while the second round focused on how this had changed in the intervening four years.
c) People’s Alcohol Action Coalition. We interviewed two Congress staff, three staff from partner organisations and one community member who were all active in the alcohol action coalition.26 We also collected reports and media releases from the coalition.
d) Community assessment workshops. Workshops were held at each service with community members,27 including three workshops at Congress with a total of 13 community members, including some who had attended Congress’ alcohol treatment program. Community members were asked to rate services’ achievement of nine different comprehensive PHC service qualities and provide reasons for those ratings.
All interviews and workshops were audio recorded. Transcripts were imported into NVivo for analysis. A priori codes based on comprehensive PHC elements and context factors including colonisation and racism were developed and applied to the transcripts. Congress’ activities related to alcohol were categorised according to the PHC strategies of treatment, rehabilitation, prevention, and promotion based on the service reports and staff interviews and checked with the chief executive officer in a telephone interview.
The Congress board approved the service’s participation in the project, and the board’s senior executives were informed of each stage of research. Two Congress staff members were associate investigators on the grant and had input into the proposal. Ethical approval for each research stage was received from the relevant Flinders University and South Australian Health research ethics committees, and the Aboriginal Health Research Ethics Committee, South Australia. The alcohol-specific study was approved by Central Australian Human Research Ethics Committee and by the Congress research subcommittee. All participants provided informed consent.
Table 1: A comprehensive primary health care response to alcohol-related harms.Comprehensive primary health care element20
Application to alcohol-related harms
Rehabilitation Rehabilitative support for people who have experienced alcohol-related harm, including addiction, injury, illness
Treatment Treatment of alcohol-related harm, including addiction, injury, illnessPrevention Prevention of alcohol-related harm, e.g. through screening, brief intervention, health education and
early childhood programsHealth promotion Promotion of health and wellbeing through addressing structures and environmental factors that
contribute to alcohol-related harm, including addressing alcohol policies, alcohol availability, housing30
Indigenous Health Community controlled primary health care response to alcohol

534 Australian and New Zealand Journal of Public Health 2019 vol. 43 no. 6© 2019 The Authors
Results
Congress’ history and context is presented, followed by the service’s responses to alcohol-related harm. The extent to which these responses challenge colonial approaches to alcohol-related harm is then considered.
ContextCongress is situated in the remote township of Alice Springs in the Northern Territory with a population of approximately 28,000 people, 19% of whom are Aboriginal.28 Congress was established in 1973 at a public meeting of Central Australian Aboriginal people and was initially formed as an advocacy organisation for Aboriginal people’s rights. In 1975, after lobbying the Minister for Aboriginal Affairs and the Minister for Health, it came to provide a primary health care service that was “comprehensive, not selective”, included treatment, prevention, and health promotion, and was controlled by the Aboriginal community.29(p126) Congress grew throughout the 1980s, 1990s and 2000s. When this research commenced in 2009, the service employed approximately 300 people, serving Alice Springs and surrounding areas in a 100-km radius, as well as some remote Aboriginal communities in partnership with local health boards. The total annual budget was $27 million4 and more than 90% of this funding came from the Commonwealth Department of Health. As of 2019, the service has a budget of more than $50 million and employs more than 400 staff, of whom about half are Aboriginal people.
Policy contextCongress is addressing alcohol-related harm in a very challenging policy context. In 2007, the Federal Government instigated the NTER, which included alcohol restrictions (“near-blanket ban on possession and consumption of alcohol on all Aboriginal land”30(p462), increased policing, compulsory acquisition of some townships, suspension of the Racial Discrimination Act and a range of other interventionist measures.31 Importantly, nothing was done to reduce the supply of take-away alcohol; instead there was a punitive, place-based approach to the location where drinking could take place. Northern Territory Government approaches to alcohol are heavily politicised and are affected by vested interests relating to the tourist economy. The Australian Hotels Association is the single biggest funder of
both major political parties30 and, in response to the advocacy on supply reduction, industry-sponsored groups emerged to protect the profits resulting from alcohol. Australian Government policies continue to focus on public drunkenness, rather than health and wellbeing,30 reminiscent of Langton’s account of the fears of the “drunken Aborigine”.3 A range of punitive policies have been enacted in the NT, some with roots in the legacy of the NTER,30 including the Alcohol Mandatory Treatment Act, which allows people to be held for up to four days without legal representation, the Alcohol Protection Orders Act, which allows for increased custodial sentences for individuals where alcohol is felt to be a factor in the crime, and Temporary Beat Locations, where police stand outside take-away alcohol outlets and can question patrons, ask for identification and confiscate alcohol.30 An evaluation of the Alcohol Mandatory Treatment initiative found that it lacked a program logic and failed to impact on health, re-apprehension into custody or homelessness.32 The Temporary Beat Locations dramatically reduced the supply of alcohol, showing effectiveness in spite of their discriminatory nature.33
Congress responses to alcohol-related harmCongress has addressed alcohol-related harm since its inception, with methods that include addressing social determinants of alcohol-related harm and providing treatment services and strategies to minimise alcohol-related harm. Often these strategies have been driven by the Aboriginal community, not just the health professionals employed at Congress. Past examples include a night shelter and pick-up service to reduce the number of Aboriginal people being charged for public drunkenness, set up in 1975,29 and an alcohol rehabilitation centre established in the 1980s. In 1990, Congress collaborated with other Aboriginal organisations to produce a comprehensive plan to address alcohol use, including supply reduction measures to reduce take-away trading hours, reduce outlets and remove cheap alcohol from the market, and approaches to rehabilitation, including the establishment of an alcohol programs unit.34 Implementing this plan, Congress purchased an alcohol outlet in 1991, let the $150,000 license lapse,35 “ceremoniously poured all the grog down the drain” (Practitioner interview),
and converted it to a health service site. More recently, Congress set up an alcohol treatment program including intensive case management, with a medical/pharmacotherapy stream, psychological therapy stream, and a social and cultural support stream that addresses positive social and cultural determinants of health.35
Table 2 presents the broad range of treatment, rehabilitation, prevention and health promotion activities Congress undertook to address alcohol-related harms at the time of this study.
As well as the medical, clinical and alcohol services, the Table indicates the activities in other sections of the service that contribute to addressing alcohol-related harm. For example, there is a strong link between healthy early childhood development and later alcohol consumption,36 so Congress’ activities in early childhood are likely to reduce future alcohol-related harm. Similarly, social determinants of Aboriginal health, including employment, education, housing, cultural determinants of health and self-determination, are all associated with increased health, and Congress’ efforts in improving these determinants through collaborations with housing and other government sectors, and health promotion strategies, such as addressing job skills in the Men’s health branch, are likely to reduce the burden of alcohol-related harm in the community.1
One advocacy strategy was the People’s Alcohol Action Coalition (PAAC), a community group formed in 1995 from a public meeting organised by the late, influential Arrernte leader, Charlie Perkins.37 Congress is a leading partner in PAAC, along with other services, church groups, trade unions and Aboriginal organisations, with staff members active participants in the group. The coalition advocates for evidence-based alcohol supply measures, such as a minimum floor price and other sales restrictions.
The staff we spoke to overwhelmingly endorsed this comprehensive approach – “this idea of balancing the here and now with longer-term action to change the social determinants of health” (Practitioner interview). Even if staff did not participate in each aspect of the comprehensive approach, they saw how they fitted in with the larger picture:
We [treatment staff] are just one part of the wheel, a spoke in the wheel, but there needs to be a multi-pronged approach. Some of
Freeman et al. Article
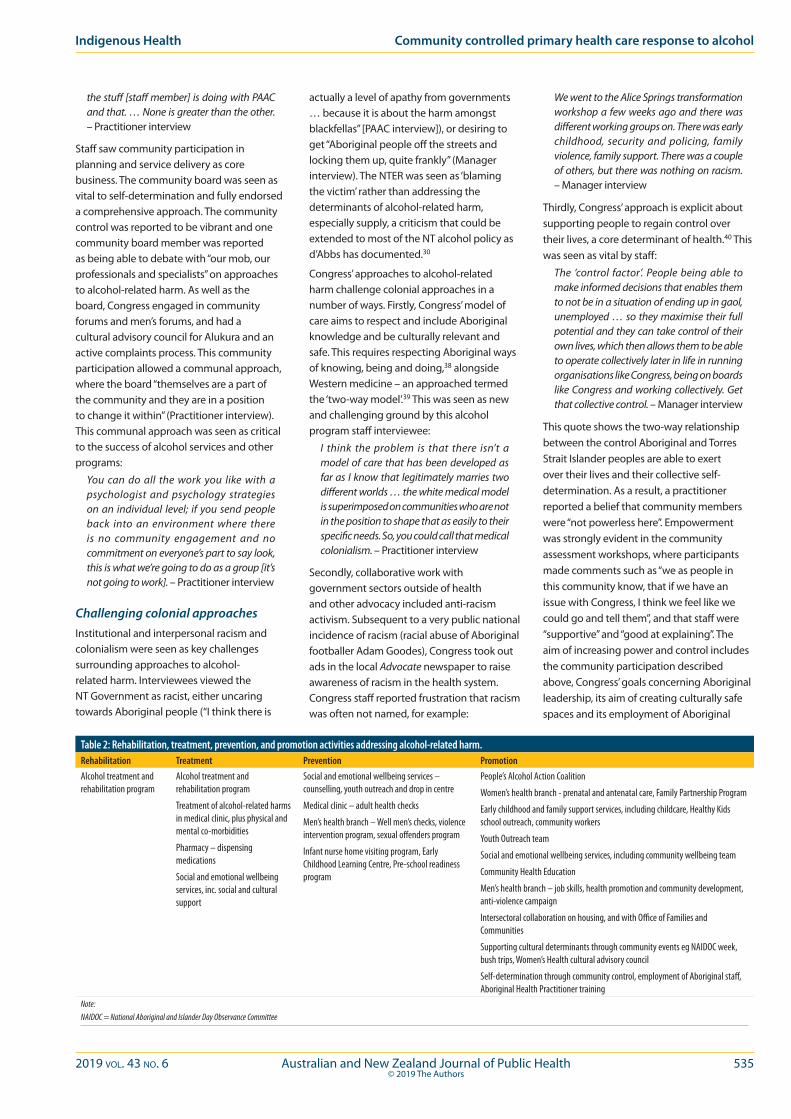
2019 vol. 43 no. 6 Australian and New Zealand Journal of Public Health 535© 2019 The Authors
Indigenous Health Community controlled primary health care response to alcohol
the stuff [staff member] is doing with PAAC and that. … None is greater than the other. – Practitioner interview
Staff saw community participation in planning and service delivery as core business. The community board was seen as vital to self-determination and fully endorsed a comprehensive approach. The community control was reported to be vibrant and one community board member was reported as being able to debate with “our mob, our professionals and specialists” on approaches to alcohol-related harm. As well as the board, Congress engaged in community forums and men’s forums, and had a cultural advisory council for Alukura and an active complaints process. This community participation allowed a communal approach, where the board “themselves are a part of the community and they are in a position to change it within” (Practitioner interview). This communal approach was seen as critical to the success of alcohol services and other programs:
You can do all the work you like with a psychologist and psychology strategies on an individual level; if you send people back into an environment where there is no community engagement and no commitment on everyone’s part to say look, this is what we’re going to do as a group [it’s not going to work]. – Practitioner interview
Challenging colonial approachesInstitutional and interpersonal racism and colonialism were seen as key challenges surrounding approaches to alcohol-related harm. Interviewees viewed the NT Government as racist, either uncaring towards Aboriginal people (“I think there is
actually a level of apathy from governments … because it is about the harm amongst blackfellas” [PAAC interview]), or desiring to get “Aboriginal people off the streets and locking them up, quite frankly” (Manager interview). The NTER was seen as ‘blaming the victim’ rather than addressing the determinants of alcohol-related harm, especially supply, a criticism that could be extended to most of the NT alcohol policy as d’Abbs has documented.30
Congress’ approaches to alcohol-related harm challenge colonial approaches in a number of ways. Firstly, Congress’ model of care aims to respect and include Aboriginal knowledge and be culturally relevant and safe. This requires respecting Aboriginal ways of knowing, being and doing,38 alongside Western medicine – an approached termed the ‘two-way model’.39 This was seen as new and challenging ground by this alcohol program staff interviewee:
I think the problem is that there isn’t a model of care that has been developed as far as I know that legitimately marries two different worlds … the white medical model is superimposed on communities who are not in the position to shape that as easily to their specific needs. So, you could call that medical colonialism. – Practitioner interview
Secondly, collaborative work with government sectors outside of health and other advocacy included anti-racism activism. Subsequent to a very public national incidence of racism (racial abuse of Aboriginal footballer Adam Goodes), Congress took out ads in the local Advocate newspaper to raise awareness of racism in the health system. Congress staff reported frustration that racism was often not named, for example:
We went to the Alice Springs transformation workshop a few weeks ago and there was different working groups on. There was early childhood, security and policing, family violence, family support. There was a couple of others, but there was nothing on racism. – Manager interview
Thirdly, Congress’ approach is explicit about supporting people to regain control over their lives, a core determinant of health.40 This was seen as vital by staff:
The ‘control factor’. People being able to make informed decisions that enables them to not be in a situation of ending up in gaol, unemployed … so they maximise their full potential and they can take control of their own lives, which then allows them to be able to operate collectively later in life in running organisations like Congress, being on boards like Congress and working collectively. Get that collective control. – Manager interview
This quote shows the two-way relationship between the control Aboriginal and Torres Strait Islander peoples are able to exert over their lives and their collective self-determination. As a result, a practitioner reported a belief that community members were “not powerless here”. Empowerment was strongly evident in the community assessment workshops, where participants made comments such as “we as people in this community know, that if we have an issue with Congress, I think we feel like we could go and tell them”, and that staff were “supportive” and “good at explaining”. The aim of increasing power and control includes the community participation described above, Congress’ goals concerning Aboriginal leadership, its aim of creating culturally safe spaces and its employment of Aboriginal
Table 2: Rehabilitation, treatment, prevention, and promotion activities addressing alcohol-related harm.Rehabilitation Treatment Prevention PromotionAlcohol treatment and rehabilitation program
Alcohol treatment and rehabilitation program
Treatment of alcohol-related harms in medical clinic, plus physical and mental co-morbidities
Pharmacy – dispensing medications
Social and emotional wellbeing services, inc. social and cultural support
Social and emotional wellbeing services – counselling, youth outreach and drop in centre
Medical clinic – adult health checks
Men’s health branch – Well men’s checks, violence intervention program, sexual offenders program
Infant nurse home visiting program, Early Childhood Learning Centre, Pre-school readiness program
People’s Alcohol Action Coalition
Women’s health branch - prenatal and antenatal care, Family Partnership Program
Early childhood and family support services, including childcare, Healthy Kids school outreach, community workers
Youth Outreach team
Social and emotional wellbeing services, including community wellbeing team
Community Health Education
Men’s health branch – job skills, health promotion and community development, anti-violence campaign
Intersectoral collaboration on housing, and with Office of Families and Communities
Supporting cultural determinants through community events eg NAIDOC week, bush trips, Women’s Health cultural advisory council
Self-determination through community control, employment of Aboriginal staff, Aboriginal Health Practitioner training
Note:NAIDOC = National Aboriginal and Islander Day Observance Committee
536 Australian and New Zealand Journal of Public Health 2019 vol. 43 no. 6© 2019 The Authors
staff. One manager reported that “Aboriginal employment as a tool of empowerment within Congress is taken very seriously” (Manager interview).
Fourthly, through PAAC, Congress advocated to government on evidence-based alcohol policy, arguing that alcohol-related harm “needs a health response, not a criminal response” (Manager interview). This advocacy was conducted as core business, despite pressure from the government:
[PAAC] has been quite effective around some of the alcohol stuff, to the extent we had a specific visit by the Chief Minister asking what were we going to do about the noise that [staff and PAAC member] was making. – Manager interview
Interviewees noted that Congress’ ability to advocate was in part due to being outside of government. While PAAC originally received a grant from the NT Government, “as we became more effective, the money dried up completely and we have never had a government grant since” (Practitioner interview).
PAAC was successful in lobbying a previous NT Government to introduce the Alice Springs Liquor Supply Plan in 2006 and supported the Banned Drinkers Register, which was then overturned by the next NT Government. The subsequent NT Government installed the Temporary Beat Locations policy, which was viewed as more discriminatory towards Aboriginal people (whereas the register covered everyone). The Banned Drinkers Register was associated with reducing alcohol-related presentations to the Alice Springs hospital.33 As well as government, Congress and PAAC also found the need to advocate to and against private companies, particularly alcohol outlets. PAAC has had some success with many supermarkets agreeing to a minimum alcohol floor price at around $1 per standard drink. A key success was the agreement by the current NT Government to undertake the Alcohol Policies and Legislative review,41 which has seen the Government agree to implement all but one recommendation, representing far-reaching alcohol policy reforms. This has included the successful implementation of a Territory-wide alcohol floor price of $1.30 per standard drink.42
Discussion
This case study illustrates how a comprehensive PHC service can provide care and rehabilitation for alcohol-related
harm and can reduce alcohol-related harm through individual prevention activities and addressing the social determinants of alcohol-related harm. This case provides an example of the full continuum of strategies in the Alma Ata Declaration for comprehensive PHC and concords with other literature indicating that ACCHSs are at the forefront of comprehensive PHC practice.43 This is also supported by findings that when health services have been transferred to Aboriginal community control, more culturally respectful services and more focus on population health has followed.44,45 The ACCHS approach is also more in line with the United Nations Declaration on the Rights of Indigenous Peoples, which emphasises Indigenous peoples’ rights to “participate in decision-making”, “maintain and develop their own [I]ndigenous decision-making institutions”, “traditional medicines and to maintain their health practices”, and have “access, without any discrimination, to all social and health services”.46
The findings highlight how community control can challenge colonialism, racism and power imbalances through incorporating Aboriginal and Torres Strait Islander knowledges, promoting cultural relevance and safety, empowering people to have more control in their lives, and encouraging Aboriginal and Torres Strait Islander-led advocacy. In so doing, community control promotes evidence-based policy and practice that supports self-determination. It also provides a somewhat protected space that enables political advocacy in ways that are difficult or impossible for government employees to undertake.21,47 This is especially important for alcohol, where ongoing colonisation and racism and support for industry frames so much of the public discussion and policy making. Increasing people’s control over their own lives is fundamental to reducing health inequities so they have the power to challenge these social determinants.40,48 The need to end the logic of paternalistic control evident in policies such as Stronger Futures,49 and to instead increase self-determination, community and individual control, is clear in the writing of many Aboriginal and Torres Strait Islander researchers11,50 and statements such as the Uluru Statement from the Heart51 and the Redfern Statement.52 Data have been seen as an instrument of colonialism but control over data can instead make a tool of self-determination.53 Congress uses data and evidence in all aspects of its
work, and community control means that community views can be brought together with professional knowledge and evidence to inform appropriate policy. All of these factors together are critical for effective public health advocacy, and community controlled health services create a unique environment to support this.
Only one ACCHS was included in this research. There are 150 ACCHSs around Australia that are tailored to their local communities. Further studies would yield additional approaches to address alcohol-related harm, and insights into how these solutions challenge colonialist approaches. Whatever research is conducted in the future should be designed to contribute to decolonisation. This will require incorporation of Indigenous knowledge to inform the epistemology and methods underpinning the research. Examples are that the research could incorporate yarning with people affected by alcohol-related harm and consideration of the extent to which alcohol policies are culturally safe.54 The research focused on understanding local implementations of the principles of comprehensive PHC and did not seek to measure health outcomes. One study evaluated the alcohol program at Congress35 and found 79% of clients stopped drinking or reduced their consumption, although 70% of the control group also stopped drinking or reduced their consumption, clouding the evidence for the program. In addition, PAAC have collaborated with research partners to provide data on reductions in alcohol consumption and harms in the community following increases in alcohol pricing, and after the introduction of the Banned Drinkers Register.33 An evaluation of the alcohol supply measures undertaken in Alice Springs that PAAC advocated for found they were effective in reducing per capita consumption and rates of assaults and hospital admission for alcohol-attributable conditions.55
Conclusion
This case study of a comprehensive, Aboriginal Community Controlled Health Service’s evidence-based responses to alcohol-related harm highlighted its strengths. In particular, the service employed a range of actions across the comprehensive spectrum of rehabilitation, treatment, disease prevention, and health promotion. ACCHSs have practiced such
Freeman et al. Article
2019 vol. 43 no. 6 Australian and New Zealand Journal of Public Health 537© 2019 The Authors
comprehensive PHC approaches since before the Alma Ata Declaration, because that was the approach deemed suitable by the community grass roots movements that formed the first ACCHSs.29 This pioneering of a comprehensive PHC approach further highlights the value of community control to develop locally responsive and appropriate solutions, and to address local determinants of health through advocacy.
Acknowledgements
This research was supported by the National Health and Medical Research Council (grant number 535041), and a Flinders University Faculty of Medicine, Nursing and Health Sciences Seeding Grant. We thank the Central Australian Aboriginal Congress staff and Board for their participation.
References1. Wilson M, Stearne A, Gray D, Saggers S. The Harmful use
of Alcohol Amongst Indigenous Australians. Australian Indigenous Health Reviews No. 4. Mount Lawley (AUST): Edith Cowan University Australian Education and Research Australian Indigenous HealthInfoNet; 2010.
2. Brady M. The Grog Book. Revised ed. Canberra (AUST): Australian Department of Health and Ageing; 2005.
3. Langton M. Rum, seduction and death:‘Aboriginality’and alcohol. Oceania. 1993;63(3):195-206.
4. Freeman T, Baum F, Lawless A, Labonte R, Sanders D, Boffa J, et al. Case Study of an Aboriginal Community-Controlled Health Service in Australia: Universal, Rights-Based, Publicly Funded Comprehensive Primary Health Care in Action. Health Hum Rights. 2016;18(2):93-108.
5. Australian Health Ministers’ Advisory Council. Aboriginal and Torres Strait Islander Health Performance Framework 2017 Report. Canberra (AUST): AHMAC, 2017.
6. Australian Indigenous HealthInfoNet. Summary of Aboriginal and Torres Strait Islander Health 2017. Mount Lawley (AUST: Edith Cowan University; 2017.
7. Australian Institute of Health and Welfare. The Health and Welfare of Australia’s Aboriginal and Torres Strait Islander Peoples 2015. Catalogue No.: IHW 147. Canberra (AUST): AIHW; 2015.
8. Vos T, Barker B, Stanley L, Lopez A. The Burden of Disease and Injury in Aboriginal and Torres Strait Islander Peoples 2003. Brisbane (AUST): The University of Queensland School of Population Health; 2007.
9. Czyzewski K. Colonialism as a broader social determinant of health. Int Indigenous Policy J. 2011;2(1). DOI: 10.18584/iipj.2011.2.1.5.
10. International Symposium on the Social Determinants of Indigenous Health. Social Determinants and Indigenous Health: The International Experience and its Policy Implications. Adelaide (AUST): Commission on Social Determinants of Health; 2007.
11. Sherwood J. Colonisation - it’s bad for your health: The context of Aboriginal health. Contemp Nurse. 2013;46:28-40.
12. Brett J, Lee K, Gray D, Wilson S, Freeburn B, Harrison K, et al. Mind the gap: What is the difference between alcohol treatment need and access for Aboriginal and Torres Strait Islander Australians? Drug Alcohol Rev. 2016;35(4):456-60.
13. Parker R, Milroy H. Aboriginal and Torres Strait Islander mental health: An overview. In: Purdie N, Dudgeon P, Walker R. Working Together: Aboriginal and Torres Strait Islander Mental Health and Wellbeing Principles and Practice. 2nd ed. Nedlands (AUST): Telethon Kids Institute/Kulunga Aboriginal Research Development Unit; 2014.
14. Chikritzhs T, Pascal R, Gray D, Stearne A, Saggers S, Jones P. Trends in Alcohol-attributable Deaths among Indigenous Australians, 1998–2004. National Alcohol Indicators, Bulletin No.: 11. Perth (AUST): National Drug Research Institute, Curtin University of Technology; 2007
15. Moreton-Robinson A. The White Possessive: Property, Power, and Indigenous Sovereignty. In: Indigenous Americas. Volume 17. Minneapolis (MN): University of Minnesota Press; 2015.
16. Evans BW. Northern Territory Emergency Response: Criticism, support and redesign. Aust J Rural Health. 2012;20(3):103-7.
17. Torzillo P, Rainow S, Pholeros P, Tunkin W, Vartto K. Extending community health services. In: Baum F, Fry D, Lennie I, editors. Community Health: Policy and Practice in Australia. Leichhardt (AUST): Pluto Press; 1992.
18. Dwyer J, Lavoie J, O’Donnell K, Marlina U, Sullivan P. Contracting for Indigenous health care: Towards mutual accountability. Aust J Public Admin. 2011;70(1):34-46.
19. Fredericks BL, Legge D. Revitalizing Health for All: International Indigenous Representative Group. Learning from the Experience of Comprehensive Primary Health Care in Aboriginal Australia—A Commentary on Three Projects. Melbourne (AUST): The Lowitja Institute; 2011.
20. World Health Organization. Declaration of Alma-Ata, International Conference on Primary Health Care, USSR, 6-12 September. Geneva (CHE): WHO; 1978.
21. Baum F, Freeman T, Sanders D, Labonté R, Lawless A, Javanparast S. Comprehensive primary health care under neo-liberalism in Australia. Soc Sci Med. 2016;168:43-52.
22. Freeman T, Baum F, Lawless A, Javanparast S, Jolley G, Labonte R, et al. Revisiting the ability of Australian primary health care services to respond to health inequity. Aust J Prim Health. 2015;22:332-8.
23. Freeman T, Baum FE, Jolley GM, Lawless A, Edwards T, Javanparast S, et al. Service providers’ views of community participation at six Australian primary healthcare services: scope for empowerment and challenges to implementation. The International Journal of Health Planning and Management. 2016;31:E1-E21.
24. Baum F. Participatory action research. J Epidemiol Community Health. 2006;60(10):854-7.
25. Baum F, Legge D, Freeman T, Lawless A, Labonte R, Jolley G. The potential for multi-disciplinary primary health care services to take action on the social determinants of health: actions and constraints. BMC Public Health. 2013;13(1):460.
26. Anaf J, Baum F, Freeman T, Labonte R, Javanparast S, Jolley G, et al. Factors shaping intersectoral action in primary health care services. Aust N Z J Public Health. 2014;38(6):553-9.
27. Freeman T, Jolley G, Baum F, Lawless A, Javanparast S, Labonté R. Community assessment workshops: a group method for gathering client experiences of health services. Health Soc Care Comm. 2014;22:47-56.
28. Australian Bureau of Statistics. Alice Springs Regional Summary. Canberra (AUST): ABS; 2017.
29. Rosewarne C, Vaarzon-Morel P, Bell S, Carter E, Liddle M, Liddle J. The historical context of developing an Aboriginal community controlled health service: A social history of the first ten years of the Central Australian Aboriginal Congress. Health History. 2007;9:114-43.
30. d’Abbs P. Widening the gap: The gulf between policy rhetoric and implementation reality in addressing alcohol problems among Indigenous Australians. Drug Alcohol Rev. 2015;34:461–6.
31. O’Mara P. Health impacts of the Northern Territory intervention. Med J Aust. 2010;192(10):546-8.
32. PricewaterhouseCoopers Indigenous Consulting, Menzies School of Health Research. Evaluation of the Alcohol Mandatory Treatment Program. Darwin (AUST): Northern Territory Department of Health; 2017.
33. People’s Alcohol Action Coalition. Submission to the Alcohol Policies and Legislation Review in the Northern Territory Alice Springs (AUST): PAAC; 2017.
34. Lyon P. What Everybody Knows About Alice: A Report on the Impact of Alcohol Abuse on the Town of Alice Springs. Alice Springs (AUST): Tangentyere Council; 1990.
35. d’Abbs P, Togni S, Rosewarne C, Boffa J. The Grog Mob: Lessons from an evaluation of a multi-disciplinary alcohol intervention for Aboriginal clients. Aust N Z J Public Health. 2013;37(5):450-6.
36. Roche A, Kostadinov V, Fischer J, Nicholas R, O’Rourke K, Pidd K, et al. Addressing inequities in alcohol consumption and related harms. Health Promot Int. 2015;30 Suppl 2:ii20-35.
37. Boffa J, Rosewarne C. Alcohol and Alice Springs: Meeting the needs and wishes of the community. Indigenous Law Bull. 2003;5(25):11.
38. Martin K, Mirraboopa B. Ways of knowing, being and doing: A theoretical framework and methods for indigenous and indigenist re‐search. J Aust Stud. 2003;27(76):203-14.
39. McGuinness K, Leckning B. Bicultural Practice in the Northern Territory Children and Families Sector: Practitioners’ Reflections of Working Two-ways. Casuarina (AUST): Menzies School of Health Research; 2013.
40. Marmot M. Social determinants and the health of Indigenous Australians. Med J Aust. 2011;194(10):512-13.
41. Department of the Chief Minister. Alcohol Policies and Legislation Review: Final Report. Darwin (AUST): Northern Territory Government; 2017.
42. Boffa J. The NT is putting a minimum floor price on alcohol, because evidence shows this works to reduce harm. The Conversation. 2018 September 25.
43. Dwyer J, Martini A, Brown C, Tilton E, Devitt J, Myott P, et al. The Road is Made by Walking: Towards a Better Primary Health Care System for Australia’s First Peoples. Melbourne (AUST): The Lowitja Institute, 2015.
44. Bailie R, Menzies School of Health Research Local Evaluation Team, Katherine West Health Board. Jirntangku Miyrta: Katherine West Coordinated Care Trial Local Evaluation Final Report. Casuarina (AUST): Menzies School of Health Research; 2000.
45. Department of Health and Ageing. The National Evaluation of the Second Round of Coordinated Care Trials: Final Report [Internet]. Canberra (AUST): Government of Australia; 2007 (cited 2016 Feb 22]. Available from: http://apo.org.au/files/Resource/final_cct2.pdf.
46. United Nations. United Nations Declaration on the Rights of Indigenous Peoples. New Yourk (NY): UN; 2008.
47. Boffa J, George C, Tsey K. Sex, alcohol and violence: A community collaborative action against striptease shows. Aust J Public Health. 1994;18(4):359-66.
48. Devitt J, Hall G, Tsey K. An Introduction to the Social Determinants of HEALTH in Relation to the Northern Territory Indigenous Population. Darwin (AUST); Cooperative Research Centre for Aboriginal and Tropical Health; 2001.
49. Bielefeld S. History wars and stronger futures laws: A stronger future or perpetuating past paternalism? Altern Law J. 2014;39(1):15-18.
50. Anderson I. The end of Aboriginal self-determination? Futures. 2007;39(2):137-54.
51. Referendum Council. Uluru Statement from the Heart. Uluru (AUST): National Constitutional Convention; 2017.
52. National Congress of Australia’s First Peoples et al. Redfern Statement. Redfern (AUST): ANTaR; 2016.
53. Wilks J, Kennedy G, Drew N, Wilson K. Indigenous data sovereignty in higher education: Towards a decolonised data quality framework. Aust Univ Rev. 2018;60(2):4.
54. Mackean T, Fisher M, Friel S, Baum F. A framework to assess cultural safety in Australian public policy. Health Promot Int. 2019. doi.org/10.1093/heapro/daz011.
55. Symons M, Gray D, Chikritzhs T, Skov S, Saggers S, Boffa J, et al. A Longitudinal Study of Infleunces on Alcohol Consumption and Related Harm in Central Australia: With a Particular Emphasis on the Role of Price. Perth (AUST): Curtin University National Drug Research Institute; 2012.
Indigenous Health Community controlled primary health care response to alcohol

538 Australian and New Zealand Journal of Public Health 2019 vol. 43 no. 6© 2019 The Authors
The offender population is one of the most stigmatised and socially excluded groups in society. Epidemiological
studies of prisoners consistently find high levels of physical ill health, psychiatric illness and communicable diseases, and engagement in health risk behaviours such as smoking, alcohol consumption, illicit drug use and violence.1,2 For Aboriginal and Torres Strait Islander (hereon ‘Indigenous’) offenders, disadvantage is further compounded by poor social determinants of health. Since colonisation more than 230 years ago, Indigenous Australians have lower levels of political representation, educational attainment and income when compared to the general Australian population, as well as higher rates of social exclusion, unemployment, trauma and ill-health, and shorter life expectancy.3 Indigenous Australians frequently experience racism and low levels of access in mainstream health services and the legal system.4,5 These issues underscore the importance of community controlled primary health care for Indigenous offenders that is contextually relevant, holistic and culturally safe.
Aboriginal and Torres Strait Islander Community Controlled Health Organisations (ACCHOs) provide culturally appropriate, autonomous primary health care services that are initiated, planned and governed by local Aboriginal Australian communities through an elected board of directors.6
ACCHOs are represented nationally by the National Aboriginal Community Controlled Organisation (NACCHO), which engages directly with policy makers and funding bodies, links ACCHOs to facilitate health service delivery and research, advises on research, and provides leadership on service delivery principles such as community control. Community control is vital for culturally appropriate and acceptable health
care services in Indigenous communities and enacts articles of the United Nations Declaration on the Rights of Indigenous Peoples, ensuring self-reliance, self-determination, appropriate and acceptable health care.6
Since the establishment of the first ACCHO in inner Sydney in 1971, the network of ACCHOs has grown to 143 across Australia, providing more than three million episodes
Holistic primary health care for Aboriginal and Torres Strait Islander prisoners: exploring the role of Aboriginal Community Controlled Health Organisations Simon Pettit,1 Paul Simpson,1 Jocelyn Jones,2 Megan Williams,3 M. Mofizul Islam,4 Anne Parkinson,5 Bianca Calabria,5 Tony Butler1
1. The Kirby Institute, University of New South Wales 2. Faculty of Health and Medical Sciences, The University of Western Australia 3. Graduate School of Health, University of Technology Sydney, New South Wales4. Department of Public Health, La Trobe University, Victoria5. Research School of Population Health, Australian National University, Australian Capital TerritoryCorrespondence to: Dr Paul Simpson, The Kirby Institute, University of New South Wales, Wallace Wurth Building, Sydney, NSW 2015; e-mail: [email protected]: May 2019; Revisions requested: August 2019; Accepted: August 2019The authors have stated they have no conflict of interest.This is an open access article under the terms of the Creative Commons Attribution-NonCommercial-NoDerivs License, which permits use and distribution in any medium,
provided the original work is properly cited, the use is non-commercial and no modifications or adaptations are made.
Aust NZ J Public Health. 2019; 43:538-43; doi: 10.1111/1753-6405.12941
Abstract
Objective: Aboriginal and Torres Strait Islander Community Controlled Health Organisations (ACCHOs) have been identified as having an important role in improving the health and wellbeing of individuals in prison; however, a lack of information exists on how to strengthen this role. This paper explores the experiences of ACCHO staff in primary health care to individuals inside or leaving prison.
Methods: Nineteen staff from four ACCHOs were interviewed. ACCHO selection was informed by proximity to prisons, town size and/or Local Government Area offending rates. Thematic analysis of the interviews was undertaken.
Results: While most ACCHOs had delivered post-release programs, primary health care delivery to prisoners was limited. Three themes emerged: i) a lack of access to prisoners; ii) limited funding to provide services to prisoners; and iii) the need for a team approach to primary health care delivery.
Conclusion: A holistic model of care underpinned by a reliable funding model (including access to certain Medicare items) and consistent access to prisoners could strengthen ACCHOs’ role in primary health care delivery to people inside or leaving prison.
Implications for public health: ACCHOs have an important role to play in the delivery of primary health care to prisoners. Existing models of care for prisoners should be examined to explore how this can occur.
Key words: Indigenous, prisoners, health care, Aboriginal and Torres Strait Islander Community Controlled Health Organisations, Aboriginal Medical Services.
INDIGENOUS HEALTH
2019 vol. 43 no. 6 Australian and New Zealand Journal of Public Health 539© 2019 The Authors
of care each year for approximately 350,000 people.7 Primary health care services provided by ACCHOs embody the Aboriginal definition of health, which is not just about an individual’s physical wellbeing but also the social, emotional and cultural wellbeing of the community, and takes a whole-of-life perspective that incorporates a cyclical concept of life–death–life.8 ACCHOs provide comprehensive primary health care that includes health education, health promotion, social and emotional wellbeing support and a range of other community development initiatives.9
Limited access to primary health care services for Indigenous peoples is a major barrier to addressing the overall aim of the Australian Government’s ‘Closing the Gap’ framework.10 Data show that, compared to mainstream services, ACCHOs are frequently accessed by Indigenous people.11 A 9% growth in Indigenous community members accessing their local ACCHO was observed between 2012–13 and 2014–15, with a 23% increase in the total number of episodes of care during this time.7 In a study comparing outcomes and indicators between ACCHOs and mainstream services, ACCHOs performed better in terms of best practice care, monitoring clinical performance, increasing engagement of Indigenous community members, and better leadership in training non-Indigenous staff in Indigenous health matters.12
Barriers to accessing mainstream services extend also to Indigenous Australians in the criminal justice system. In Australia, Indigenous people comprise 28% of the prisoner population, but only 2% of the general population.13 Australian state and territory legislation states that prisoners must be able to access health care when they require it, and that they have the right to the same level of care as in the wider community14 – a right referred to in the international context as the ‘equivalence of care’ principle.15
Incarceration causes a person to be separated from their community.17 A recommendation (168) by the Royal Commission into Aboriginal Deaths in Custody (RCIADIC) requires that a person be incarcerated as close to their home community as possible.16 Incarceration can also disrupt continuity of holistic health care provided by an ACCHO,17 if that ACCHO has no means of accessing the prisoner. Other custodial health and safety recommendations made by the RCIADIC state
that Corrective Services departments should review the provision of health services to Indigenous prisoners including the level of involvement of ACCHOs (Recommendation 152c) and the exchange of relevant health information between prison medical staff and ACCHOs (Recommendation 152e).16
Australia’s National Indigenous Drug and Alcohol Committee (NIDAC) asserts that improvements in health services for Indigenous prisoners and juvenile detainees may assist in reducing the overall prisoner numbers.18 Areas noted for improvement included health screening on reception, increasing uptake of recommended treatments, and enhancing prisoner throughcare by facilitating access of Indigenous health and other services to Indigenous prisoners.18 NIDAC highlighted that “the provision of a ‘one health service fits all’ model, as in the case for many corrections systems, creates a disjointed and unsuitable approach” for addressing health needs of Indigenous prisoners.18 In response, NIDAC recommended several strategies for involving ACCHOs to improve the health care of prisoners and their ongoing care post-release.18 However, there is a dearth of literature on external health care provision to Australia’s prisoners from which to plan coordinated actions and resource allocation. Only a small number of reports are available on health care provided by community-based organisations in prisons.19,20
Health care varies greatly in Australia’s state- and territory-based prisons, with government Departments of Health providing health care services to some through agencies such as the Justice and Forensic Mental Health Network in New South Wales (NSW), and Departments of Justice or contracted private companies providing services to others.21 There is no nationally coordinated approach or body whose role it is to monitor prisoners’ health care needs, and no national strategy for assessing or meeting the specific health needs of Indigenous prisoners.22 Australia’s publicly funded universal health care system – the Medicare Benefits Scheme and Pharmaceutical Benefits Scheme, collectively known as Medicare – is suspended for prisoners during incarceration. This is because other state- and territory-level government departments become responsible for providing health care to prisoners.23 However, this arrangement has been identified as problematic, with concerns that it reduces resources or opportunities for providing
comprehensive health care to prisoners that is equivalent to that available in the community.23
This project was designed by a team of Aboriginal and non-Aboriginal researchers working at the nexus of the justice and health systems, and with specialisations in Indigenous health research, epidemiology, qualitative research and health services research and evaluation. Three of the team members identified as Indigenous Australians. The primary aim of the research was to explore prisoner health services and programs provided by a selection of ACCHOs, including the challenges and enablers of delivering these, and implications for further research.
Method
ACCHO sites were selected based on geographical proximity to prisons, town size and population. Four sites were identified across three jurisdictions after considering existing geo-spatial data on prison and ACCHO locations and offending rates. Two ACCHOs in NSW from Local Government Areas (LGAs) with higher offending levels, a low socioeconomic status index, and a prison were selected; and two ACCHOs near a prison from other jurisdictions were selected for comparative reasons. Sampling of participants was purposive and designed to reflect the breadth of roles performed within ACCHOs, including management, clinicians, social workers and administrative staff. Fifteen semi-structured interview questions were devised by the team. In total, 19 interviews were conducted by two Indigenous interviewers. Interviews were audio-recorded and then transcribed.
Latent thematic analysis was conducted using a six-phase protocol: i) familiarisation with the data; ii) generating initial codes from the data; iii) searching for themes; iv) reviewing themes; v) defining and naming final themes; and vi) writing up findings for dissemination.24 Two research team members (Petit and Simpson) independently conducted phases one to four on eight interviews and met to discuss their findings and to complete phases five and six. After achieving a consensus on emerging themes and sub-themes, one team member (Petit) conducted all the six phases of analysis for the remaining interviews. To maintain confidentiality, each participant was assigned a pseudonym when reporting on the findings.
Indigenous Health Holistic primary health care for prisoners by ACCHOs
540 Australian and New Zealand Journal of Public Health 2019 vol. 43 no. 6© 2019 The Authors
Results
Three core themes were identified from the interviews: i) a lack of access to prisoners; ii) limited funding to deliver services in prison; and iii) the potential for involvement in a team approach to primary health care delivery for prisoners. These themes resonated among all four participating ACCHOs. Although there were few differences between reported experiences among ACCHOs, one ACCHO stood out in terms of its higher level of engagement with its local prison compared to other ACCHOs. All but one of the participating ACCHOs were located within 10 kms of a prison. The one ACCHO that was located 50 kms from the nearest prison reported less engagement with the prison compared to other participating ACCHOs.
Lack of access to prisonersThe theme ‘lack of access to prisoners’ represents a number of facets relating to the difficulties ACCHOs experienced in physically accessing prisoners to provide health care. Some participants spoke of previous formal partnerships and programs with local prisons over an extended period of time.
While all participants expressed a desire to expand and improve their ACCHO services to prisoners, most told of limited and episodic access to prisoners that were largely outside of a primary health care scope. One interviewee, Kate, an executive manager, reflected that “there were some talks but it’s like the usual response is ‘It’s covered by Justice Health’. We have had some; a partnership with them … but as far as primary health care goes, no”. Kate reported that there had been more contact “in the earlier days … they actually used to have the nurse and one of the clinicians go” (to the local prison), but not since “changes of government policies”. Other than that, Kate said, “We’ve had prisoners access [the ACCHO] for a procedure or something where they’ve been escorted” (by guards) – but not for any strategic access to their primary health care services.
Some participants described having greater success providing non-clinical programs in prison such as smoking cessation clinics and cultural workshops as well as parental support programs, and mental health and wellbeing promotion. These programs occurred through preparing required documentation and devising procedures
to adhere with prison requirements. This took some time, as ACCHO mental health coordinator Amanda explained, “I met with them a month ago. We’re in that process of getting everyone’s ID through, waiting on getting approval for everyone to have that clearance to be able to go in there”.
When looking at what enabled access, many participants spoke of the importance of established relationships in the past between individual ACCHO staff and prison decision-makers. Yet, it takes time to develop relationships with prison staff who can facilitate access to Indigenous prisoners. When talking about the present time, most participants spoke of less-developed relationships. Fiona, a senior finance officer at an ACCHO, explained, “I’m aware that we have done like an outreach kind of ‘go and visit the prisons’ to kind of have a bit of a relationship. And we probably have only done that maybe twice that I know of in the past two years”. For ACCHOs, like other fee-for-service clinics, ‘time is money’ and developing relationships that have few precedents of success can be difficult to rationalise.
However, even when relationships or partnerships were established, at times these were unreliable. If the prison staff member was unavailable, if the prison was ‘locked down’ (when prisoners are confined to their cells for what is usually a disciplinary or security measure), or a staff member did not respect the value of ACCHO staff, access was denied or slowed down. One interviewee, Sue, a chief executive officer, said that racism had contributed to restricted access to prisoners for the provision of health care:
… it ’d depend on who was on, the relationship that that person [prison staff ] had with our doctor, how quickly they’d move through [the prison security and cell blocks]. And that’s the risk when you provide a health service in a prison; if somebody doesn’t like you or there’s racism and stuff like that, they can be as slow as they like where you might see one or two. But then, if you got a good one, they can move them through. – Sue, CEO
The key implication of slow movement through prison security and cell blocks is less time to potentially spend with Indigenous prisoners.
One service did, however, describe sustained access to prisoners. This occurred through a specially funded program to enable the ACCHO to do so. That is, the ACCHO did not have to rely on their existing funding from
which to deliver services to prisoners, but were able to develop a particular strategy:
We piloted the program through the Commonwealth back then [12–16 years ago] for a doctor and an Aboriginal health worker to go to [prison]. We went there for 10 years and when we did get in there, they just couldn’t get enough of us. – Sue, CEO
The latter part of this quote highlights a related issue to access to prisoners for the specific ACCHO: the lack of opportunity to grow services to meet demand.
Alongside the challenges of accessing prisoners were the difficulties of accessing recently released prisoners, due to individuals leaving the local area to return home:
One of the issues that we had with that program was follow-ups for prisoners became quite challenging because many of the prisoners that they were working with came from different areas. And so, when they were released, they went back to their areas, and then it was quite difficult to keep in contact with them. – Jennifer, CEO
Throughcare programs, designed to support a prisoner and prepare them for release and post-release, have often been described as under-developed and not meeting needs of prisoners.20,25-30 ACCHOs have been identified as providing models of care that generally reflect throughcare, including capacity to provide intensive care, coordinated among the required multi-disciplinary teams and over sustained periods of time.27
Limited funding Funding for ACCHOs is generally obtained from a variety of sources. In the past, cessation of funding, or under-funding, meant that programs for prisoners and those exiting prison would be stopped or not be given enough time to develop and succeed.27 Some participants spoke of staff funding issues and how ACCHOs must remain competitive and attractive to staff to maintain good quality of care:
… we have to be competitive, with professionals that warrant a certain salary because of their training in Aboriginal health and you need to be funding that. – Alex, clinical director
In describing funding models to provide health care to people in prison, Medicare was reflected on by some participants:
See, Justice Health provides services while they’re in prison, and post-release it’s the general community AMS [ACCHO]
Simpson et al. Article

2019 vol. 43 no. 6 Australian and New Zealand Journal of Public Health 541© 2019 The Authors
Indigenous Health Holistic primary health care for prisoners by ACCHOs
hospital, but also prisoners can access, under emergency, the hospitals as well. We don’t have any access to the prison but one of the biggest barriers we have is that there’s no funding for inmates to access [ACCHO] whilst in prison. But they’re not entitled to access Medicare either. – Kate, executive manager
However, only three participants indicated they were aware that individual Medicare benefits were suspended upon incarceration, such as Steve, a general practitioner who said, “I didn’t know they lost their Medicare card when they went to gaol”.
Participants who were aware of the Medicare suspension had great insight into the grey area that Indigenous prisoner health occupies and the inability to receive the targeted care that individuals would enjoy outside of prison:
It impacts on from GPs and nurses the ability to be able to generate this Medicare income that can assist in getting services for them. So, getting out to have specialist appointments, having X-rays or, you know, having those other things that cost a lot of money, whether the prison will allow that to happen or not. So, I think it impacts on the decisions that are made within the prison system. – Jennifer, CEO
Further, there is the risk of prison visits affecting the services ACCHOs are funded to undertake:
Part of your incarceration is you lose your entitlement to Medicare. So, from an AMS [ACCHO] point of view, if we were to go and provide Aboriginal health checks and those things, there’s no funding to do so. So, we’re actually taking away services that we’re funded for from our community to go and deliver services that we couldn’t claim a 715 [Medicare Health Assessment for Aboriginal and Torres Strait Islander People] for. The only way around that is to provide funding for it [from Medicare]. – Kate, executive manager
Upon becoming aware of prisoner’s Medicare suspension, there was overall acknowledgement by participants of the potential benefit of a Medicare-funded model in delivering primary health care to Indigenous people in prison. All participants were confident that an adequately funded team, possibly through certain Medicare items that are separate and in addition to their existing allowance, could deliver excellent patient outcomes to Indigenous people in prison.
Potential team approach to primary health care delivery Interviews explored the potential role of ACCHOs in Indigenous offender health ranging from establishing best practice indicators for successful health care delivery and the need to develop models of care that included post-prison release holistic care.
In discussing beneficial features of a primary health care model specific to prisoners and those leaving prison, most participants emphasised the need for a multi-disciplinary team-based approach consisting of a clinician, social/Aboriginal health worker, mental health worker and prison-based Aboriginal wellbeing officer. Most also had specific views on post-release care. For example, Steve discussed the idea of a liaison officer and a social and wellbeing team:
I think having an Aboriginal liaison officer or social and emotional wellbeing people … team … involved when they get released from the gaol, I think it works well. So, they can probably find their way to seeing a doctor and all, or a clinician, or a nurse over here. So, having that team involved early, after the incarceration is finished, I think is a good idea. – Steve, general practitioner
Similarly, Jennifer spoke of a team-based approach or ‘wrap-around’ service, referring to a system-of-care model of health care delivery:31
… we should have a dedicated prison-release program because that way you’re capturing those prisoners that need to be [seen]. Like I said, having that ‘wrap-around’, primary health care, assessments, the mental health, you know, the other things we can deliver that can all be tailored and factored into a program, a prison release program if we’ve got that. – Jennifer, CEO
Some participants spoke of continuity of care being difficult to achieve. They explained how drug treatment regimens and ongoing treatment plans can become disconnected between the community and prison systems. Several spoke of how a lack of communication and transferring of clinical information creates problems between prison health care and the external ACCHO model. Amanda, in the mental health context, explained:
Yeah, for us the biggest problem is getting that information. We often don’t know if they have a mental condition. We don’t know what medication they’re on. We
don’t understand their programs, what they’re needing. – Amanda, mental health coordinator
For Jan, a social worker, the breakdown in communication meant being limited in what services could be provided:
… the information we will basically get is they’re leaving. We don’t know their journey. We don’t know their … And we might know the reason they went to gaol, but we don’t know the … kind of … what transpired for them. We don’t know what they’re wanting, what they’re looking for. – Jan, social worker
In some circumstances, ACCHOs are the ‘first port of call’ for people when released from prison. However, the ACCHO will generally have no awareness of the individual’s prison release and pending visit, so no planning takes place. As Bruce, a social-health team manager, explains in relation to one ACCHO service user:
He was there [in prison] for 17 years; a lot has changed. He couldn’t read or write, so they gave him a bus ticket to leave the gaol. He didn’t know how to catch a bus. Another had a prisoner turn up to the site still in his prison greens … we have quite a few that still turn up in their prison greens. – Bruce, social-health team manager
Such a disconnection of communication between ACCHOs and prison-based health services and prison managers is likely to impact the level of care that can be provided upon release.
Discussion
This research aimed to understand current and previous Indigenous offender health services and programs offered by four ACCHOs and the experiences, challenges and enablers of delivering these. While ACCHOs provide culturally appropriate and effective services to significant numbers of Indigenous citizens in the community, findings showed that there were several barriers to achieving this for Indigenous people in prison, including limited access and funding models.
Overall, ACCHO staff spoke of being unable to physically access prisoners due to security protocols and the attitudes of individual facility decision-makers. Although an existing relationship between individual ACCHO staff and prison decision-makers had been an important enabler to access Indigenous prisoners for some ACCHOs, it also could

542 Australian and New Zealand Journal of Public Health 2019 vol. 43 no. 6© 2019 The Authors
make access vulnerable to individual differences within prison staff. Accessing people after release from prison was also raised by many, with care planning and follow-up difficulties specifically noted.
Although health programs and services for people in prison had been implemented by the ACCHOs, including nurse and clinician in-reach services, health promotion clinics and cultural wellbeing workshops, for most, these programs/services have not been sustainable due to limited funding. Reforming health service funding arrangements for Indigenous prisoners is a feasible way to enhance the contribution of ACCHOs to Indigenous health. One possibility is for certain aspects of the ACCHOs’ work with prisons to be funded under Medicare arrangements, as they are for other primary health care services. Under the Health Insurance Act (1973) the Federal Health Minister has the capacity to grant an exemption to the Act that would allow Medicare rebates to be claimed for services in a prison setting.23,32 It has been suggested that the Health Assessment for Aboriginal and Torres Strait Islander People (MBS item 715) could be claimed under such an exemption.23 In addition to granting exemptions, a cost-sharing scheme is also worth exploring, where Australian State and Commonwealth Governments formulate a funding model that allows ACCHOs access to imprisoned clients.23
Unsurprisingly, most ACCHO staff recognised a need to develop models of care in the offender health space – a model that includes a holistic primary health team approach and a focus on continuity of care planning. Such findings resonate with elements of models of care for Indigenous prisoner health developed in the ACT33 and South Australia (SA).34 The ACT model of care was developed in 2007 and led by Winnunga Nimmityjah Aboriginal Health Service in response to the construction of the ACT’s first prison, which was completed in 2008. The SA model was developed in 2017 by the South Australian Health and Medical Research Institute (SAHMRI) for SA Prison Health Services and Department of Corrective Services. In the SA model, ACCHOs, together with Local Health Networks (SA Department of Health), are noted as instrumental in the implementation of prison in-reach programs. Although these models have different emphasis on the roles of ACCHOs, both models present important elements required of a holistic model of care for Indigenous prisoners such as pre-release planning, culture, spiritual
identity, communication, access and family. However, the present project identifies key implementation enablers such as a sustainable funding model, and consistent and reasonable access to prisoners. Further research is required to better understand the feasibility of ACCHOs delivering primary health care within prisons taking all of the above into account.
This qualitative study provides key insights about opportunities for improving integration between prison health services and ACCHOs. The project was limited to three out of seven Australian jurisdictions and, while geo-spatial mapping was used to select participating services, as well as data about prison populations and locations, it does not represent the experiences and needs of all ACCHOs.
Conclusion
Findings showed that while most participant ACCHOs had delivered services to people in the community upon release from prison, opportunities to deliver primary health care services to individuals in prisons were very limited. Two key barriers to implementing holistic and culturally appropriate health care in prisons were lack of access to prisoners due to security protocols and prison staff attitudes, and lack of a sustainable funding model. A reliable funding model underpinned by consistent access to prisoners and access to certain Medicare items could resolve this conundrum, as has been previously proposed.23 To this end, we encourage the Commonwealth of Australia to engage in appropriate discussions to resolve this matter. Additionally, custodial and prison health providers need to engage in meaningful discussions with ACCHOs to address prisoner access issues.
Acknowledgements
We would like to acknowledge ACCHO staff and participants who gave their support and time. We also acknowledge Dr Jill Guthrie and other Indigenous Offender Health Capacity Group members for their guidance and support of the project. This research is funded by an Australian National Health and Medical Research Council grant (APPA1057492), as part of the Australian Centre for Research Excellence in Offender Health; and Seed funding from the Research School of Population Health, Australian National University.
References1. Butler T, Andrews G, Allnutt S, Sakashita C, Smith NE,
Basson J. Mental disorders in Australian prisoners: A comparison with a community sample. Aust N Z J Psychiatry. 2006;40(3):272-6.
2. Indig D, Topp L, Ross B, Mamoon H, Border B, Kumar S, et al. New South Wales Inmate Health Survey: Key Findings Report. Sydney (AUST): New South Wales Justice Health; 2010.
3. Grace J, Krom I, Maling C, Butler T, Midford R, Simpson P. Review of Indigenous offender health (updated). Aust Indigenous HealthInfoNet. 2013;12:1-24.
4. Kelaher M, Ferdinand A, Paradies Y. Experiencing racism in health care: The mental health impacts for Victorian Aboriginal communities. Med J Aust. 2014;201(1):44-7.
5. Human Rights and Equal Opportunities Commission. Bringing Them Home: National Inquiry into the Separation of Aboriginal and Torres Strait Islander Children from their Families. Canberra (AUST): Government of Australia; 1997.
6. Bell KC, Daniels J, Hunter P, Mayers N, Murray R. Aboriginal community controlled health services. In: Commonwealth Department of Health and Aged Care, editor. General Practice in Australia. Canberra (AUST): Government of Australia; 2000. p. 74-104.
7. Australian Institute of Health and Welfare. Healthy Futures—Aboriginal Community Controlled Health Services: Report Card. Catalogue No.: IHW 171. Canberra (AUST): Australian Institute of Health and Welfare; 2016.
8. National Aboriginal Health Strategy Working Party. National Aboriginal Health Strategy. Canberra (AUST): AGPS; 1989.
9. Hayman N, White N, Spurling G. Improving Indigenous patients’ access to mainstream health services: The Inala experience. Med J Aust. 2009;190(10):604-6.
10. Couzos S, Thiele D. The International Covenant on Economic, Social and Cultural Rights and the Right to Health: Is Australia meeting its obligations to Aboriginal peoples. Med J Aust. 2007;10(186):522-4.
11. Gomersall JS, Gibson O, Dwyer J, O’Donnell K, Stephenson M, Carter D, et al. What Indigenous Australian clients value about primary health care: A systematic review of qualitative evidence. Aust N Z J Public Health. 2017;41(4):417-23.
12. Panaretto K, Wenitong M, Button S, Ring I. Aboriginal community controlled Health services: Leading the way in primary care. Med J Aust. 2014;200(11):649-52.
13. Australian Bureau of Statistics. 4517.0 - Prisoners in Australia, 2018. Canberra (AUST): ABS; 2018.
14. Corrective Services Act 2006 (QLD) [Internet]. 30 May 2017 [cited 2019 May 23]. Available from: https://www.legislation.qld.gov.au/view/pdf/inforce/2017-05-30/act-2006-029
15. United Nations. A/RES/37/194 - Principle of Medical Ethics. Geneva (CHE): UN; 1982.
16. Royal Commission into Aboriginal Deaths in Custody. Royal Commission into Aboriginal Deaths in Custody: National Reports [Vol 1-5], and Regional Reports. Canberra (AUST): AGPS; 1991.
17. Levy M. Prisoner health care provision: Reflections from Australia. Int J Prison Health. 2005;1(1):65-73.
18. National Indigenous Drug and Alcohol Committee. Bridges and Barriers: Addressing Indigenous Incarceration and Health. Canberra (AUST): Australian National Council on Drugs; 2009.
19. Poroch N, Boyd K, Tongs J, Sharp P, Longford E, Keed S. We’re Struggling In Here!: The Phase 2 Study Into the Needs of Aboriginal and Torres Strait Islander People in the ACT Alexander Maconochie Centre and the Needs of their Families. Canberra (AUST): Winnunga Nimmityjah Aboriginal Health Service; 2011.
20. Poroch N. You Do The Crime, You Do The Time. Canberra (AUST): Winnunga Nimmityjah Aboriginal Health Service; 2007.
21. Simpson PL, Guthrie J, Butler T. Prison health service directors’ views on research priorities and organizational issues in conducting research in prison: Outcomes of a national deliberative roundtable. Int J Prison Health. 2017;13(2):113-23.
22. Couzos S, Murray R. Aboriginal Primary Health Care: An Evidence-based Approach. Melbourne (AUST): Oxford University Press; 2008.
Simpson et al. Article

2019 vol. 43 no. 6 Australian and New Zealand Journal of Public Health 543© 2019 The Authors
23. Plueckhahn T, Kinner S, Sutherland G, Butler T. Are some more equal than others? Challenging the basis for prisoners’ exclusion from Medicare. Med J Aust. 2015;203(9):359-61.
24. Braun V, Clarke V. Using thematic analysis in psychology. Qual Res Psychol. 2006;3(2):77-101.
25. Borzycki M. Interventions for Prisoners Returning to the Community. Canberra (AUST): Australian Institute of Criminology; 2005.
26. Conroy E, Williams M. Homelessness at Transition: An Evidence Check Rapid Review. Sydney (AUST): Sax Institute for the NSW Family and Community Services and Family and Community Services Analysis and Research; 2017.
27. Haswell M, Williams M, Blignault I, Grande M, Jackson Pulver L. Returning Home, Back to Community from Custodial Care: Learnings from the First Year Pilot Project Evaluation of Three Sites around Australia. Canberra (AUST): Government of Australia; 2014.
28. Maruna S, Immarigeon R. After Crime and Punishment: Pathways to Ex-Offender Reintegration. Devon (UK): Willan Books; 2004.
29. Ross S. Bridging the gap between prison and the community: Post-release support and supervision. In: O’Toole S, Eyland S, editor. Corrections Criminology. Leichhardt (AUST): Hawkins Press; 2005. p. 169-82.
30. Willis M, Moore J. Reintegration of Indigenous Prisoners. Canberra (AUST): Australian Institute of Criminology; 2008.
31. Winters NC, Metz WP. The wraparound approach in systems of care. Psychiatr Clin North Am. 2009;32(1):135-51.
32. Health Insurance Act 1973 (Cth) [Internet] No. 42, 1974 Compilation No. 108, 1 July 2018 [cited 2019 May 23]. Available from: https://www.legislation.gov.au/Details/C2018C00319
33. Tongs J, Chatfield H, Arabena K. The Winnunga Nimmityjah Aboriginal Health Service Holistic Health Care for Prison Model. Aborig Isl Health Work J. 2007;31(6):6-8.
34. Sivak L, Cantley L, Kelly J, Reilly R, Hawke K, Mott K, et al. Model of Care for Aboriginal Prisoner Health and Wellbeing for South Australia – Final Report. Adelaide (AUST): Wardliparingga Aboriginal Health Research Unit; 2017.
Indigenous Health Holistic primary health care for prisoners by ACCHOs
544 Australian and New Zealand Journal of Public Health 2019 vol. 43 no. 6© 2019 The Authors
The high quality of contemporary Australian education systems is well recognised; however, it is also the case
that the cultural orientation and requirements for students are predominantly Western in their focus.1 Among these requirements, consistent school attendance is considered fundamental. There is clear evidence that regular attendance plays a vital role in children’s learning of core knowledge and skills, such as literacy and numeracy, and that this shapes children’s life trajectories, affecting longer-term socioeconomic status and opportunities.2,3 School attendance has been problematic for some Aboriginal communities,1,4-6 and improving school attendance was nominated as one of the key national goals of the national Aboriginal and Torres Strait Islander Education Action Plan, 2010–2014.6 (Note: In the Northern Territory, ‘Aboriginal’ is respectfully used when referring to both Aboriginal and Torres Strait Islander peoples.)
School attendance is an issue of particular policy concern in the Northern Territory (NT) of Australia, where the average attendance of Aboriginal students was 71% in 2007, 68% in 2012 and 67% in 2016. These attendance rates all fall substantially below the 90% attendance target for Aboriginal students that was agreed to by the Council of Australian Governments (COAG).7 The attendance rates among Aboriginal students in remote areas are even lower and are close to 50% for students commencing secondary school.7,8
According to a recent NT report, only 40% of Aboriginal students attend school 80% or more of the time.8 The consequences of missing one day per week or more to the overall time spent in school education are serious. Students with this level of attendance would, on average, lose two years of education over a 10-year period.9 As several studies have shown significant association between lower attendance and poorer academic achievement, this is highly likely to
translate into poorer education outcomes.3,10 Students with high rates of non-attendance are also at higher risk of early school leaving and failure to complete high school, both of which have been shown to be associated with increased risk of criminal activity.3,11
Several factors have been suggested as contributing to Aboriginal student’s low rates of attendance, including family socioeconomic circumstance, poor child
The impact of hearing impairment on Aboriginal children’s school attendance in remote Northern Territory: a data linkage studyJiunn-Yih Su,1 Vincent Yaofeng He,1 Steven Guthridge,1 Damien Howard,2 Amanda Leach,3 Sven Silburn1
1. Centre for Child Development and Education, Menzies School of Health Research, Charles Darwin University, Northern Territory2. Phoenix Consulting, Northern Territory 3. Ear Health Research Program, Child Health Division, Menzies School of Health Research, Northern TerritoryCorrespondence to: Dr Jiunn-Yih Su, Centre for Child Development and Education, Menzies School of Health Research, PO Box 41096, Casuarina 0811, Northern Territory;
e-mail: [email protected]: April 2019; Revision requested: August 2019; Accepted: September 2019The authors have stated they have no conflict of interest.This is an open access article under the terms of the Creative Commons Attribution-NonCommercial-NoDerivs License, which permits use and distribution in any medium,
provided the original work is properly cited, the use is non-commercial and no modifications or adaptations are made.
Aust NZ J Public Health. 2019; 43:544-50; doi: 10.1111/1753-6405.12948
Abstract
Objective: To investigate the association between hearing impairment (HI) and Year 1 school attendance in Aboriginal children in the Northern Territory (NT) of Australia.
Methods: Observational cohort study (n=3,744) by analysing linked individual-level information for Aboriginal children from the NT Government school attendance records, NT Perinatal Register and Remote Hearing Assessment dataset, and community level data for relative remoteness, socioeconomic disadvantage and housing crowdedness.
Results: Children with unilateral hearing loss, mild HI and moderate or worse HI had significantly lower Year 1 attendance than those with normal hearing, attending 5.6 (95%CI, -9.10~-2.10), 4.0 (95%CI, -7.17~-0.90) and 6.1 (95%CI, -10.71~-1.49) days fewer, respectively. Other variables that yielded significant association were: male gender, having attended preschool less than 20% of available days, speaking English as second language, twin birth and average household size >5.
Conclusions: Aboriginal children with any level of HI are likely to have lower school attendance rates in Year 1 than their peers with normal hearing.
Implications for public health: In this population, where the prevalence of otitis media and accompanying HI remains extremely high, the early detection and management of hearing loss on entry into primary school should be included in the measures to improve school attendance.
Key words: hearing impairment, otitis media, school attendance, Indigenous health, child health
INDIGENOUS HEALTH

2019 vol. 43 no. 6 Australian and New Zealand Journal of Public Health 545© 2019 The Authors
health and wellbeing, high interschool mobility, poor track record of past school engagement, and family travel associated with social and cultural obligations. Further, for some Aboriginal students and families, the Western-style formal education system and curriculum can be perceived as foreign and inflexible.1,3,8,9,12 Aboriginal children’s high rates of otitis media (OM) and the accompanying hearing impairment (HI) is a frequent health condition and may also affect school attendance.1,4 However, to date, no studies have been published that have investigated the independent impact of hearing impairment on school attendance for Aboriginal children.
Given the widely reported rates of low school attendance and the extremely high prevalence of OM in Aboriginal children in NT remote communities, this study was undertaken to address this knowledge gap. It involved investigating the association between HI and Year 1 school attendance in Aboriginal children living in remote NT communities.13 The study was made possible by the availability of the Remote Hearing Assessment (RHA) dataset for individual-level linkage with a range of health and education datasets. The RHA dataset contains clinical and audiometric information collected, from 2007 onwards, by the NT Outreach
Hearing Health Program, an Australian Government-funded program that provides outreach specialist hearing health services to Aboriginal children living in remote NT communities.14 Specifically, this study aimed to test the hypotheses that, in the targeted population, children with HI had lower Year 1 school attendance rates than children with normal hearing.
Methods
Study design and participantsThis was a retrospective observational study using linked individual-level data. The participants were NT-born Aboriginal children with records in three key datasets: the NT Perinatal Register (an administrative data collection of maternal and perinatal data for all births in the NT and available from 1994 to 2014); the NT Department of Education school attendance dataset (containing enrolment and daily attendance records of students attending NT Government schools for the period of 2005–2016); and the RHA dataset (containing hearing assessment data for the period 2007–2015). Children who underwent surgical treatment for OM before the age of four were excluded because the surgery could alter the impact of HI. This was done by searching in a fourth
linked dataset, the NT Hospital Separations Dataset, and excluding 17 children admitted before age four with a diagnosis of OM and selected surgical procedure codes. The diagnosis and procedure codes (Table 1) were classified using the International Statistical Classification of Diseases and Related Health Problems, 10th edition.15 Other exclusion criteria were living in geographic area other than remote and very remote and Aboriginal status being either non-Aboriginal or unknown.
The independent variableResults of hearing assessment were recorded in the RHA dataset as the average threshold of hearing (as deviation from the normal threshold, in decibels hearing level [dB HL]) for the three frequencies: 500 hertz (Hz), 1000 Hz and 2000 Hz, as assessed with pure tone audiometry. The result for each ear was classified as either normal or one of four levels of hearing loss: mild (16–30 dB HL); moderate (31–60 dB HL); severe (61–90 dB HL); and profound (≥91 dB HL), a comparatively conservative classification that was deemed more suitable for children aged under 15.14 Only results of conductive and mixed hearing loss were included.
The independent variable of HI consisted of four ordinal categories:
• No HI: normal audiometry results in both ears
• Unilateral hearing loss (UHL): normal in one ear and any degree of hearing loss in the other
• Mild HI: mild hearing loss in the better-hearing ear
• Moderate or worse HI: moderate or worse hearing loss in the better-hearing ear.
Otitis media in NT Aboriginal children develops early in life, is persistent and often asymptomatic,16,17and tends to be diagnosed at an older age due to easier diagnosis and greater healthcare access. We therefore assumed that the first recorded audiometry result was representative of a child’s HI level regardless of their age at time of assessment.
The outcome measureThe outcome measure was the school attendance rate for Year 1, which is expressed in terms of the number of school days per year from the total of about 200 school days per year.
Table 1: Admission diagnoses and surgical procedures related to otitis media and their International Classification, 10th Revision- Australian Modification codes used in the exclusion criteria.ICD-10AM CODE Diagnosis / ProcedureDiagnosisH65H66H72
Nonsuppurative otitis mediaSuppurative and unspecified otitis mediaPerforation of tympanic membrane
Procedure41527-0041530-0041533-0141542-0041551-0041554-0041560-0041560-0141563-0041563-0141626-0041626-0141632-0041632-0141635-0141638-0141789-0041789-0141801-0090114-00
Myringoplasty, transcanal approachMyringoplasty postaural or endaural approachMyringoplasty with atticotomyMyringoplasty with ossicular chain reconstructionMastoidectomy by intact canal wall technique with myringoplastyMastoidectomy by intact canal wall technique with myringoplasty and ossicular chain reconstructionModified radical mastoidectomy with myringoplastyRadical mastoidectomy with myringoplastyModified radical mastoidectomy with myringoplasty and ossicular chain reconstructionRadical mastoidectomy with myringoplasty and ossicular chain reconstructionMyringotomy, unilateralMyringotomy, bilateralMyringotomy with insertion of tube, unilateralMyringotomy with insertion of tube, bilateralExcision of lesion of middle ear with myringoplastyExcision of lesion of middle ear with myringoplasty and ossicular chain reconstructionTonsillectomy without adenoidectomyTonsillectomy with adenoidectomyAdenoidectomy without tonsillectomyOther procedures on eardrum or middle ear
Indigenous Health Impact of hearing impairment on Aboriginal children’s school attendance

546 Australian and New Zealand Journal of Public Health 2019 vol. 43 no. 6© 2019 The Authors
Control variables and data management Information for each individual across the three datasets was merged using person-specific, anonymised linkage keys (a 10-digit random number) produced by the linkage agency, SA NT DataLink, during the data linkage process. Each individual record in the merged dataset was also linked with relevant community-level information sourced from publicly available Census data downloaded from the website of the Australian Bureau of Statistics (ABS), including the Index of Relative Socio-Economic Disadvantage (IRSD), which represents socioeconomic disadvantage expressed as quintiles,18 the level of relative remoteness of children’s residential community as measured with the Accessibility and Remoteness Index of Australia (ARIA+, ‘remote’ and ‘very remote’ categories only),19 and housing crowdedness indicators (including ‘average household size >5 persons’ and ‘average persons per bedroom >2’).18 The ABS data were aggregated at the level of the Statistical Local Area (SLA), and then merged with the study dataset using the SLA for the school in which each student was enrolled in Year 1.
Control variables for the regression modelling process were selected based on previous Australian literature on school attendance.3,7,20 The control variables selected from the Perinatal Register were those factors associated with early childhood development, which may in turn impact on school attendance. They included teenage mother at time of birth, maternal diabetes, maternal hypertension, maternal smoking or alcohol consumption during pregnancy, twin birth, low birthweight and preterm birth.21 Variables selected from the school attendance dataset were speaking English as a second language (ESL), preschool attendance rate <20%, and demographic variables (gender and age on the first attended school day in Year 1). Other variables of interest from the school attendance and enrolment dataset were parental education level and parent employment status, but these were not included because of the high proportion of missing data.
Statistical analysesThe difference between the study cohort and the cohort of children in the school attendance dataset excluded from the study was assessed with t-test or chi-square test as
appropriate. Linear regression was used in both univariate and multivariate analyses for the association between school attendance and HI. Multivariate model building followed the parsimonious model building strategy.22 As children’s records of attendance data were repeatedly recorded in the same school they attended, there might be some unobservable school factors that had affected their attendance, and we therefore adopted a school level fixed-effects model in the multivariate analysis. In reporting the estimated magnitude of an association with the outcome measure, ‘change in the number of school days attended in Year 1’ was used, instead of ‘change in attendance rate’, for easier interpretation. All analyses were conducted using Stata version 15 (Stata Corporation, College Station, TX, USA). A two-tailed p-value <0.05 or a regression coefficient (COEF) with 95% confidence interval (CI) not inclusive of the unity was considered significant.
Ethical approval The study was approved by the Human Research Ethics Committee of the NT Department of Health and Menzies School of Health Research (HREC-2016-2708).
Results
Descriptive statisticsAfter merging the attendance dataset and the RHA datasets, we found that, of the 12,112 Aboriginal children from remote and very remote areas of the NT who had Year 1 attendance records, 4,299 had hearing assessment data (see Figure 1). The processes of merging with the NT Perinatal Registry dataset and applying the study definition of HI excluded 6,379 children without hearing assessment data, who either were not born in the NT or could not be classified into any of the four categories of HI, leaving a total of 3,744 children in the study cohort (1,769 girls, 47.2%; 1,975 boys, 52.8%). The results of comparison on the descriptive statistics between the study and excluded cohorts are presented in Table 2. The two cohorts were significantly different on all but three variables compared (male gender, antenatal care visits <7 and twin birth). In particular, the study cohort had lower attendance (122.6 mean attended days compared with 126.3 days in the excluded cohort, p<0.001).
Table 2: Comparison of demographic characteristics and selected control factors
Characteristics
Excluded cohort (n=6,379)
Study cohort (n=3,744)
p valueNumber,
mean or %95% CI Number,
mean or %95% CI
Attended days in Year 1, mean 126.3 125.1–127.5 122.6 121.2–124.0 <0.001Demographic factors Age at start of Year 1 (years), mean 6.25 6.24–6.27 6.21 6.19–6.23 <0.001 Male gender 51.2% 50.0–52.4% 52.8% 51.2–54.4% 0.128 Speaking English as second language 74.6% 73.5–75.6% 91.8% 90.9–92.7% <0.001 Attended preschool 98.1% 97–8–98.4% 41.5% 39.9–43.1% <0.001Maternal factors Antenatal care visit <7 35.0% 33.8–36.2% 35.3% 33.8–36.9% 0.715 Teenage pregnancy 27.2% 26.2–28.3% 31.9% 30.4–33.4% <0.001Perinatal factors Low birthweight (<2500 gram) 11.8% 11.0–12.6% 13.4% 12.3–14.5% 0.016 Preterm birth 11.9% 11.1–12.7% 15.0% 13.9–16.2% <0.001 Twin birth 1.7% 1.3–2.0% 2.0% 1.5–2.4% 0.247Community factors IRSD <0.001 Quintile 1 (least disadvantaged) 2.1% 0.7% Quintile 2 4.1% 1.0% Quintile 3 14.0% 4.2% Quintile 4 0.3% 0.2% Quintile 5 (most disadvantaged) 79.5% 93.9% Living in very remote areas 68.7% 67.6–69.9% 92.1% 91.2–92.9% <0.001 Household size >5 24.2% 23.2–25.3% 30.2% 28.8–31.7% <0.001 Average person per bedroom >2 9.5% 8.8–10.3% 11.8% 10.7–12.8% <0.001
Su et al. Article

2019 vol. 43 no. 6 Australian and New Zealand Journal of Public Health 547© 2019 The Authors
Indigenous Health Impact of hearing impairment on Aboriginal children’s school attendance
Results of univariate and multivariate analysesIn the univariate analysis, compared with children in the normal-hearing category, all three HI categories showed evidence for an association with lower Year 1 attendance, with a coefficient ranging from -4.1 days for the UHL category to -7.3 days for the moderate or worse HI category (Table 3). Among the control variables, male gender, preschool attendance rate<20%, ESL, maternal smoking during pregnancy, maternal alcohol consumption during pregnancy, average household size >5 persons and average persons per bedroom >2, and living in very remote regions showed a significant association.
While building the multivariate fixed-effects model, the following variables were retained in the final model to control for confounding: male gender, preschool attendance rate<20%, ESL, low birthweight, IRSD, and average household size >5 persons.23 In the multivariate model, all three categories of HI continued to show evidence of significant association with lower Year 1 attendance, with adjusted coefficients of -5.6 (95%CI, -9.10~-2.10) for UHL, -4.0 days (95%CI, -7.17~-0.90) for mild HI and -6.1 (95%CI, -10.71~-1.49) for moderate or worse HI. Other variables that yielded evidence of an association were: male gender, preschool attendance rate<20%, ESL and twin birth. Notably, household size >5 persons yielded the greatest effect size and
was associated with 24.7 (95%CI, -38.08~-11.34) fewer days attended. In the final model the adjusted R-squared was 0.270.
Discussion
Our study found that HI was negatively associated with Year 1 school attendance in Aboriginal children living in remote and very remote communities in the NT. At univariate analysis, HI, regardless of its level of severity, was found to be negatively correlated with Year 1 attendance rates. After controlling for a range of demographic, maternal, perinatal and community factors as well as school fixed effects, the negative correlation remained for all three categories of HI. These findings provide strong evidence that Aboriginal children with HI, including mild and unilateral hearing loss, are likely to attend school less frequently than their counterparts with normal hearing.
An important result of our study is that UHL has a similar impact on school attendance to mild and moderate HI. Hearing impairment is usually defined by the level of hearing loss in the better hearing ear, and children with UHL are generally not considered to have HI, due to the better ear being normal-hearing. Because of the presence of a normal hearing ear, detection and management of UHL can often be delayed or even neglected.24 Literature has shown that compared to peers with bilateral normal hearing (BNH),
children with UHL were at higher risk of having delayed language development25 and experiencing grade failures.26,27 Children with UHL often required additional educational support and assistance and were more likely to develop behavioural problems at school.28,29 On the other hand, early diagnosis and treatment of UHL can positively impact on verbal-cognitive, linguistic, communicative and socio-emotional development.24 Our study has demonstrated that Aboriginal children with UHL on average attended 5.6 fewer days than their normal hearing peers. This indicates the need to actively detect such hearing loss and provide necessary support in learning.
In the multivariate analysis, four control variables yielded significant associations with the outcome measure, which is consistent with the findings of our previous studies. In particular, the community level variable representing housing crowdedness, ‘average household size >5’ was associated with 24.7 fewer school days attended (about 12.4% of the usual 200 school days in a year). This means that, although HI was independently associated with lower school attendance, its impact was considerably less than that caused by community-level factors, such as housing crowdedness. The association with housing crowdedness is consistent with an increased risk of upper respiratory tract carriage of OM-related bacteria in Aboriginal children.30 Therefore, part of the increased risk associated with crowded housing may have been due to increased incidence of OM and, in turn, increased incidence and severity of HI. However, the overall crowded housing condition in the community can also have a separate impact on school attendance.3,31
There are multiple ways that ear disease and the associated hearing loss may affect school attendance. Firstly, ill health related to ear disease may affect children’s physical health, either in isolation or in combination with other health conditions, in a way that contributes to children not attending school.2,13,32 Secondly, it has been proposed that hearing loss may directly affect a child’s capacity to engage in the ‘talk-focused’ type of learning of Western-style classrooms.33 A common response for children with hearing loss, when faced with unfamiliar social processes, is to avoid engagement.34 Disengagement can range from not participating in classroom conversations to not attending school. To improve the attendance of hearing impaired students in
Figure 1: Processes of dataset merging and study cohort* selection
Merge with Perinatal Registry Dataset to select NT born children
Aboriginal children with hearing data in RHA Dataset (n=8,037)
Aboriginal children with Y1 data in Attendance Dataset (n=12,112)
Aboriginal children with attendance data but no
hearing data (n=7,813)
NT born Aboriginal children with attendance
but no hearing data (n=6,379)
NT born Aboriginal children with attendance
and hearing data*(n=3,744)
Merge
Aboriginal children with both attendance and
hearing data (n=4,299)
Figure 1: Processes of dataset merging and study cohort* selection.

548 Australian and New Zealand Journal of Public Health 2019 vol. 43 no. 6© 2019 The Authors
Table 3: Results of univariate and multivariate analyses of the association between Year 1 attendance and hearing impairment and control variables.
Variable n=Univariate analysis Multivariate analysisa
Coefunadj 95% CI Punadj Coefadj 95% CI Padj
Hearing impairment No 1,680 Ref. Unilateral 706 -4.1 -8.00~-0.17 0.041 -5.6 -9.10~-2.10 0.002 Mild 1,015 -4.3 -7.79~-0.85 0.015 -4.0 -7.17~-0.90 0.012 Moderate or worse 343 -7.3 -12.420~-2.09 0.006 -6.1 -10.71~-1.49 0.01Age at start of Y1 - 2.5 -0.08~5.08 0.058Male gender No 1,769 Ref. Ref. Yes 1,975 -3.3 -6.14~-0.42 0.024 -5.0 -7.48~-2.48 <0.0005Preschool attendance rate<20% No 2,190 Ref. Ref. Yes 1,554 -10.9 -13.82~-8.07 <0.0005 -10.2 -13.01~-7.42 <0.0005Speaking English as second language No 308 Ref. Ref. Yes 3,436 -7.2 -12.42~-2.04 0.006 -6.5 -12.98~0.08 0.047Maternal factors Antenatal care visit>=7 No 2,333 Ref. Yes 1,275 -0.18 -3.22~2.87 0.91 Teenage pregnancy No 2,549 Ref. Yes 1,195 -2 -5.09~1.03 0.194 Smokingb
No 1,625 Ref. Yes 1,371 -7.6 -10.82~-4.44 <0.0005 Alcohol drinkingb
No 2,575 Ref. Yes 373 5.3 0.48~10.09 0.031Perinatal factors Low birthweight (<2500 gram) No 3,235 Ref. Ref. Yes 202 -3.3 -7.49~0.89 0.122 -2.6 -6.43~1.25 0.186 Preterm birth No 3,174 Ref. Yes 562 -1.1 -5.06~2.93 0.601 Twin birth No 3,670 Ref. Ref. Yes 74 10.8 0.55~21.05 0.039 19.9 11.63~28.07 <0.0005Community factors IRSD Quintile 1 (least disadvantaged) 27 Ref. Ref. Quintile 2 37 -9.2 -31.22~12.88 0.415 2.2 -28.27~32.68 0.887 Quintile 3 155 -2.8 -20.96~15.37 0.763 10.8 -15.20~36.82 0.415 Quintile 4 7 8.3 -28.62~45.27 0.659 -8.4 -36.49~19.65 0.556 Quintile 5 (most disadvantaged) 3,488 -4.7 -21.53~12.13 0.584 7.7 -17.60~32.92 0.552 Remoteness category Remote 297 Ref. Very remote 3,447 -16.3 -21.54~-11.03 <0.001 Household size>5 No 2,612 Ref. Ref. Yes 1,132 -28 -30.95~-25.00 <0.001 -24.7 -38.08~-11.34 <0.0005 Average person per bedroom>2 No 3,304 Ref. Yes 440 -19.1 -23.52~-14.74 <0.001Notes:a: with school fixed effects; adjusted R-squared=0.270; other factors included in the analysis, but not listed because they did not yield a significant association,
include maternal (diabetes, hypertension) and perinatal (emergency Caesarean section, resuscitation at birth and APGAR Score<7) factorsb: Missing data for these variables >=20%
this population, teachers should be aware of the high prevalence of OM and the associated HI. This awareness, together with the implementation of routine hearing screening tests, may aid in the early and active detection of students with HI, and in turn facilitate the provision of appropriate educational support to those affected at the earliest possible time. Educational supports for such children may include installing suitable sound amplification hardware in classrooms, improving classroom acoustics, and training teachers to improve their expertise in supporting hearing impaired students.1,3,35,36 Teachers’ training in this respect should be provided routinely to all teachers newly employed to remote Aboriginal schools, especially given the high teacher turnover.37 Where possible, teachers should communicate and collaborate with both parents and health professionals to ensure the affected children receive timely and appropriate care and support in terms of both health and education, which may be conducive to children’s school attendance.
One of the strengths of our study is that it used population-level data for hearing assessment and school attendance to investigate the impact of HI. The comparatively large sample and the comprehensive coverage of administrative datasets provided ample statistical power and good representativeness of the targeted population to make useful inferences. A related benefit was that the linked datasets provided a range of other information that allowed investigation of the independent effect of HI by adjustment for a range of potential confounding and moderating factors. Another strength is the use of audiometry results that provided a clear definition across a spectrum of hearing ability, from normal hearing, UHL, mild HI to moderate or worse HI. The availability of audiometric results avoided the alternative of clinical diagnosis of OM as a proxy for HI.
This study has several limitations. The results from the RHA dataset may not be representative of all NT Aboriginal children.14 Although the NT ear health outreach services were delivered to remote communities, access required a referral by the local clinic. From 2013, services were prioritised based on children’s need for services. Therefore, the children represented in the RHA dataset may be biased towards those with worse ear health and hearing impairment. This bias does not alter the results within the study cohort, but it does suggest caution
Su et al. Article

2019 vol. 43 no. 6 Australian and New Zealand Journal of Public Health 549© 2019 The Authors
in generalising some findings, such as prevalence of HI, to the wider population of Aboriginal children living in remote and very remote areas. Further, a high proportion of the children in the RHA dataset received their first hearing assessment after the age of seven (the usual age of Year 1 students) and 57.6% of children received two or more assessments (data not shown). The availability and timing of hearing assessment made it necessary to use each child’s first audiometry result for analysis, under the assumption that the result was indicative of the long-term HI status of a child. As the severity of HI may change with time, this approach may lead to some misclassification; however, if this was the case then our results underestimate the strength of association of HI with school attendance. Lastly, the results suggest that there are other unmeasured factors that influenced school attendance in the study cohort, as suggested by the moderate scale of the final multivariate model in explaining the variation in school attendance. Future research should incorporate a more comprehensive range of confounding and moderating factors, which might include influences such as parental education and employment status, adverse early life experiences such as child maltreatment,3,38 and cultural and language factors.35
Conclusions
Our study provides clear evidence that HI has a negative, independent impact on school attendance for Year 1 Aboriginal students living in remote NT communities. To improve Aboriginal students’ school attendance, it is important to detect HI early, including UHL, and to provide the necessary support to those affected. This can include referring students for clinical management to improve their hearing and ensuring the classroom and teaching staff are equipped with suitable awareness, skills and facilities to support those students’ learning. The silent way in which HI presents in young Aboriginal students can make it difficult to detect, especially for teachers who may be unfamiliar with the children. This, together with the high prevalence of OM from first months of life, supports regular surveillance of OM and hearing for all Aboriginal children living in remote communities. This should be provided during early childhood, when they are entering pre-school, and/or their first year of compulsory full-time education.39
At the same time, clinical and public health prevention and intervention programs that reduce the prevalence of OM in Aboriginal children can be expected to contribute to improved school attendance.
Acknowledgements
The authors wish to thank the Australian Department of Prime Minister and Cabinet for funding and supporting this research through the Linking Northern Territory and Australian Government (LiNTAG) Project. We wish to also acknowledge the support and the de-identified administrative datasets provided by NT Departments of Health, Education, Territory Families, and Justice through the Child Youth and Development Research Partnership (CYDRP). We would like to also thank the many data custodians and the staff of the SA NT DataLink for their assistance in the linkage and retrieval of the data. The views expressed in this publication are those of the authors and not necessarily those of the government departments mentioned above.
References1. McRae D, Ainsworth G, Cumming J, Hughes P, Mackay
A, Price K, et al. What Works? - Explorations in Improving Outcomes for Indigenous Students. Canberra (AUST): Australian Curriculum Studies Association and National Curriculum Services; 2000.
2. Gray J, Beresford Q. Aboriginal non-attendance at school: Revisiting the debate. Aust Educ Res. 2002;29(1):27-42.
3. Purdie N, Buckley S. School Attendance and Retention of Indigenous Australian Students [Internet]. Canberra (AUST): Australian Institute of Family Studies; 2010 [cited 2019 Mar 20]. Available from: https://research.acer.edu.au/indigenous_education/45
4. Collins B. Learning Lessons: An Independent Review of Indigenous Education in the Northern Territory [Internet]. Darwin (AUST): Northern Territory Department of Education; 1999 [cited 2019 Mar 20 March]. Available from: http://pandora.nla.gov.au/pan/77669/20071116-1155/www.deet.nt.gov.au/education/indigenous_education/previous_publications/docs/learning_lessons_review.pdf
5. Mellor S, Corrigan M. The Case for Change: A Review of Contemporary Research on Indigenous Education Outcomes [Internet]. Melbourne (AUST): Australian Council for Educational Research; 2004 [cited 2019 Mar 20]. Available from: https://research.acer.edu.au/aer/7/
6. Ministerial Council for Education, Early Childhood Development and Youth Affairs. Aboriginal and Torres Strait Islander Education Action Plan [Internet]. Carlton South (AUST): MCEEDCYA; 2010 [cited 2019 Mar 20]. Available from: http://scseec.edu.au/site/DefaultSite/filesystem/documents/ATSI%20documents/ATSIEAP_web_version_final.pdf
7. Hancock K, Shepherd C, Lawrence D, Zubrick S. Student Attendance and Educational Outcomes: Every Day Counts [Internet]. Canberra (Aust): Department of Education, Employment and Workplace Relations; 2013 [cited 2019 Mar 20]. Available from: http://telethonkids.org.au/media/472779/final_report_2013.pdf
8. Wilson B. A Share in the Future: Review of Indigenous Education in the Northern Territory [Internet]. Darwin (AUST): Northern Territory Department of Education; 2014 [cited 2019 Mar 20]. Available from: https://education.nt.gov.au/__data/assets/pdf_file/0020/229016/A-Share-in-the-Future-The-Review-of-Indigenous-Education-in-the-Northern-Territory.pdf
9. Auditor General Western Australia. Every Day Counts: Managing Student Attendance in Western Australian Public Schools [Internet]. Perth (AUST): Western Australia: Office of the Auditor General; 2009 [cited 2019 Mar 20]. Available from: https://audit.wa.gov.au/wp-content/uploads/2013/05/report2009_09.pdf
10. Zubrick SR, Silburn SR, De Maio JA, Shepherd C, Griffin JA, Dalby RB, et al. Western Australian Aboriginal Child Health Survey: Improving the Educational Experiences of Aboriginal Children and Young People. Perth (AUST): Curtin University of Technology and Telethon Institute for Child Health Research; 2006.
11. Chapman B, Weatherburn D, Kapuscinski CA, Chilvers M, Roussel S. Unemployment Duration, Schooling and Property Crime [Internet]. Crime and Justice Bulletin No.: 74. Sydney (AUST): NSW Bureau of Crime Statistics and Research; 2002 [cited 2019 Mar 20]. Available from: https://www.bocsar.nsw.gov.au/Documents/CJB/cjb74.pdf
12. Gray J, Beresford Q. A ‘formidable challenge’: Australia’s quest for equity in Indigenous education. Aust J Educ. 2008;52(2):197-223.
13. Leach AJ, Wigger C, Beissbarth J, Woltring D, Andrews R, Chatfield MD, et al. General health, otitis media, nasopharyngeal carriage and middle ear microbiology in Northern Territory Aboriginal children vaccinated during consecutive periods of 10-valent or 13-valent pneumococcal conjugate vaccines. Int J Pediatr Otorhinolaryngol. 2016;86:224-32.
14. Australian Institute of Health and Welfare. Northern Territory Outreach Hearing Health Program: July 2012 to December 2016. Catalogue No.: IHW 189. Canberra (AUST): AIHW; 2017.
15. Australian Consortium for Classification Development. International Statistical Classification of Diseases and Related Health Problems [Internet]. 10th Revision. In: Australian Modification (ICD-10-AM). 10th ed. Adelaide (AUST): Independent Hospital Pricing Authority, Lane Publishing; 2016 [cited 2019 Mar 20].
16. Leach A, Boswell JB, Asche V, Nienhuys TG, Mathews JD. Bacterial colonization of the nasopharynx predicts very early onset and persistence of otitis media in Australian Aboriginal infants. Pediatr Infect Dis J. 1994;13(1):983-9.
17. Morris PS, Leach AJ, Silberberg P, Mellon G, Wilson C, Hamilton E, et al. Otitis media in young Aboriginal children from remote communities in Northern and Central Australia: A cross-sectional survey. BMC Pediatr. 2005;5:27.
18. Australian Bureau of Statistics. 2011 Census Data-access 2011 Census Data and Products [Internet]. Canberra (AUST): ABS; 2018 [cited 2019 Mar 20]. Available from: http://www.abs.gov.au/websitedbs/censushome.nsf/home/historicaldata2011?opendocument&navpos=280
19. Australian Bureau of Statistics. The Australian Statistical Geography Standard (ASGS) Remoteness Structure [Internet]. Canberra (AUST): ABS; 2018 [cited 2019 Mar 20]. Available from: http://www.abs.gov.au/websitedbs/d3310114.nsf/home/remoteness+structure
20. Biddle N. Developing a Behavioural Model of School Attendance: Policy Implications for Indigenous Children and Youth [Internet]. CAEPR Working Paper No.: 94/2014. Canberra (AUST): Australian National University Centre for Aboriginal Economic Policy Research; 2014 [cited 2019 Mar 20]. Available from: https://openresearch-repository.anu.edu.au/bitstream/1885/24100/2/WP_94_Biddle_Nicholas_DevelopingABehaviouralModel.pdf
21. Guthridge S, Li L, Silburn S, Li SQ, McKenzie J, Lynch J. Early influences on developmental outcomes among children, at age 5, in Australia’s Northern Territory. Early Child Res Q. 2016;35:124-34.
22. Zhang Z. Model building strategy for logistic regression: Purposeful selection. Ann Transl Med. 2016;4(6):111.
Indigenous Health Impact of hearing impairment on Aboriginal children’s school attendance
550 Australian and New Zealand Journal of Public Health 2019 vol. 43 no. 6© 2019 The Authors
23. He V, Su J-Y, McKenzie J, Schurer S. Chapter 5. School Attendance. In: Silburn S, Guthridge S, McKenzie J, Su J-Y, He V, Haste S, editors. Early Pathways to School Learning: Lessons from the NT Data Linkage Study. Darwin (AUST): Menzies School of Health Research; 2018. p. 91-109.
24. Rohlfs AK, Friedhoff J, Bohnert A, Breitfuss A, Hess M, Muller F, et al. Unilateral hearing loss in children: A retrospective study and a review of the current literature. Eur J Pediatr. 2017;176(4):475-86.
25. Borg E, Edquist G, Reinholdson AC, Risberg A, McAllister B. Speech and language development in a population of Swedish hearing-impaired pre-school children, a cross-sectional study. Int J Pediatr Otorhinolaryngol. 2007;71(7):1061-77.
26. Bess FH, Tharpe AM. Unilateral hearing impairment in children. Pediatrics. 1984;74(2):206-16.
27. Keller WD, Bundy RS. Effects of unilateral hearing loss upon educational achievement. Child Care Health Dev. 1980;6(2):93-100.
28. Lieu JE. Speech-language and educational consequences of unilateral hearing loss in children. Arch Otolaryngol Head Neck Surg. 2004;130(5):524-30.
29. Lieu JE, Tye-Murray N, Fu Q. Longitudinal study of children with unilateral hearing loss. Laryngoscope. 2012;122(9):2088-95.
30. Jacoby P, Carville KS, Hall G, Riley TV, Bowman J, Leach AJ, et al. Crowding and other strong predictors of upper respiratory tract carriage of otitis media-related bacteria in Australian Aboriginal and non-Aboriginal children. Pediatr Infect Dis J. 2011;30(6):480-5.
31. McInerney DM. Key determinants of motivation of non-traditional Aboriginal students in school settings: Recommendations for educational change. Aust J Educ. 1991;35(2):154-74.
32. Leach AJ. Otitis media in Australian Aboriginal children: An overview. Int J Pediatr Otorhinolaryngol. 1999;49 Suppl 1:173-8.
33. Howard D. Why we need more Aboriginal adults working with Aboriginal students. Aust J Teach Educ. 2004;29(1):2.
34. Howard D, Barney J. Minced words: The importance of widespread hearing loss as an issue in themental health of Indigenous Australians. Aust Indig Health Bull. 2018;18(1).
35. Burrow S, Galloway A, Weissofner N. Review of educational and other approaches to hearing loss among Indigenous people. Aust Indig Health Bull. 2009;2(1).
36. Massie R, Theodoros D, McPherson B, Smaldino J. Sound-field amplification: Enhancing the classroom listening environment for Aboriginal and Torres Strait Islander children. Aust J Indig Educ. 2004;33:47-53.
37. Heslop J. Living and teaching in Aboriginal communities. In: Beresford Q, Partington G, editors. Reform and Resistance in Aboriginal Education. Crawley (AUST): University of Western Australia Press; 2003.
38. Maclean MJ, Taylor CL, O’Donnell M. Pre-existing adversity, level of child protection involvement, and school attendance predict educational outcomes in a longitudinal study. Child Abuse and Negl. 2016;51:120-31.
39. Morris P, Leach A, Shah P, Nelson S, Anand A, Daby J, et al. Recommendations for Clinical Care Guidelines on the Management of Otitis Media in Aboriginal and Torres Strait Islander Populations (April 2010) [Internet]. Canberra (AUST): Australian Department of Health; 2010 [cited 2019 Mar 20]. Available from: https://www.health.gov.au/internet/main/publishing.nsf/Content/B8A6602C7714B46FCA257EC300837185/$File/Recommendation-for-clinical-guidelines-Otitis-Media.pdf
Su et al. Article
2019 vol. 43 no. 6 Australian and New Zealand Journal of Public Health 551© 2019 The Authors
Overconsumption of sugary drinks is a key dietary contributor to overweight and obesity, tooth
decay and chronic diseases such as type 2 diabetes.1 ‘Sugary drinks’ or ‘sugar-sweetened beverages’ are non-alcoholic water-based beverages with added sugar, including non-diet soft drinks, energy drinks, fruit drinks, sports drinks, iced teas and cordials.1
The National Aboriginal and Torres Strait Islander Nutrition and Physical Activity Survey found more than half (56%) of Aboriginal and Torres Strait Islander participants had consumed a sugary drink in the day prior to interview, compared to 42% of other Australians.1 Consumption of sugary drinks increases with remoteness, with 13.1% of adults living in outer regional and remote Australia consuming sugary drinks daily compared to 8.3% living in major cities.2
Place-based initiatives to encourage healthier drink choices by altering the environment, also known as supportive environment actions, are central to the Ottawa Charter for Health Promotion.3 Australian and international place-based interventions to reduce sugary drink consumption have focused on a particular setting, and include store-based policies,4 such as in-store nutrition education and price discounts,5 and school-based interventions.6 The Healthy Communities Project discussed in this paper took a broader supportive environment approach and combined several strategies
across multiple settings to support healthy drink choices.
The Healthy Communities Project was a pilot health promotion project that aimed to engage local governments (Aboriginal Shire Councils), community leaders, organisations and community members to create supportive environments for health. A supportive environment approach,
centred on community-led action, was selected for the project as it aligned with key organisational,7 state8 and global3 health promotion frameworks. The project focused on enabling both a healthier drink environment and smoke-free environment. The project also incorporated social marketing, that is, the process of applying marketing techniques to social and public
Supporting healthy drink choices in remote Aboriginal and Torres Strait Islander communities: a community-led supportive environment approachEmma Fehring,1 Megan Ferguson,2,3 Clare Brown,1 Kirby Murtha,3 Cara Laws,1 Kiarah Cuthbert,1 Kani Thompson,1
Tiffany Williams,1 Melinda Hammond,1 Julie Brimblecombe3,4
1. Apunipima Cape York Health Council, Queensland2. School of Public Health, The University of Queensland3. Menzies School of Health Research, Northern Territory4. Department of Nutrition, Dietetics and Food, Faculty of Medicine, Nursing and Health Sciences, Monash University, VictoriaCorrespondence to: Ms Clare Brown, Apunipima Cape York Health Council, PO Box 12045, Westcourt QLD 4870; e-mail: [email protected]: April 2019; Revision requested: September 2019; Accepted: September 2019The authors have stated they have no conflict of interest.This is an open access article under the terms of the Creative Commons Attribution-NonCommercial-NoDerivs License, which permits use and distribution in any medium,
provided the original work is properly cited, the use is non-commercial and no modifications or adaptations are made.
Aust NZ J Public Health. 2019; 43:551-7; doi: 10.1111/1753-6405.12950
Abstract
Objective: To create supportive environments to reduce sugary drink consumption and increase water consumption by partnering with remote Aboriginal and Torres Strait Islander communities in Cape York.
Methods: This paper applied qualitative and quantitative methods to evaluate a co-designed multi-strategy health promotion initiative, implemented over 12 months from 2017 to 2018. Outcome measures included changes in community readiness, awareness of the social marketing campaign and changes in drink availability. Changes in store drink sales were measured in one community and compared to sales in a control store.
Results: Community readiness to address sugary drink consumption increased in two of the three communities. Awareness of social marketing campaign messaging was high (56–94%). Availability of drinking water increased in all communities. Water sales as a proportion of total drink volume sales increased by 3.1% (p<0.001) while sugary drink volume sales decreased by 3.4% (p<0.001).
Conclusions: A multi-component strategy with strong engagement from local government, community leaders and the wider community was associated with positive changes in community readiness, drink availability and sales.
Implications for public health: Partnering with community leaders in the co-design of strategies to create environments that support healthy drink consumption can stimulate local action and may positively affect drink consumption.
Key words: Aboriginal and Torres Strait Islander peoples, supportive environment, social marketing, local government, sugar-sweetened beverages
INDIGENOUS HEALTH
552 Australian and New Zealand Journal of Public Health 2019 vol. 43 no. 6© 2019 The Authors
Fehring et al. Article
health issues.9 The social marketing campaign aimed to reinforce messaging around healthy drink choices alongside developing and implementing supportive environment actions. The project was delivered by Apunipima Cape York Health Council (Apunipima), the Aboriginal Community Controlled Health Organisation servicing Cape York.
This paper presents the evaluation findings of this novel multi-strategy community-led health promotion project that used qualitative and quantitative methods to assess change in community readiness, awareness of social marketing messaging, drink availability, and consumption of water and sugary drinks in remote Aboriginal and Torres Strait Islander communities.
Method
Setting and sampleThe Healthy Communities Project was implemented in Cape York, a remote region of Far North Queensland, Australia. Cape York is a region of cultural and environmental richness and diversity. However, Cape York communities experience a complex set of challenges, partly due to remoteness, including limited access to health and other services, and high cost of food and beverages relative to metropolitan areas.10
The project was piloted in three (Community A, B and C) of the 11 remote Aboriginal and Torres Strait Islander communities in Cape York serviced by Apunipima, with community populations ranging from 300 to 1,400 people in 2017.11 The proportion of Aboriginal and/or Torres Strait Islander people in the project communities ranged from 85% to 95%.11
Eligible project communities were those with higher rates of childhood overweight and obesity compared to other communities in Cape York,12 and those governed by an Aboriginal Shire Council. All communities involved in the project had one store located within or close (within 10km) to the community, with the exception of Community A, which had two local stores (stores 1 and 2), both included in the study. Store 3 serviced Community B and store 4 serviced Community C. Complete sales data on water and sugary drink purchasing was only available for store 3. An additional Cape York community was selected as a control to compare store sales data on water and sugary drink purchasing. The control store was selected as it was managed by the same
store group as the intervention store (store 3) and serviced a community similar in size to Community B.
The interventionThe Healthy Communities Project was a multi-strategy initiative combining social marketing with community-led supportive environment actions to increase water consumption and reduce consumption of sugary drinks.3 The project was implemented over a 12-month period from 1 April 2017 to 31 March 2018, with planning and community consultation occurring from February 2017. Apunipima staff worked closely with Aboriginal Shire Councils, community leaders, organisations and community members to co-design and implement local actions. The Healthy Communities Project tested the hypothesis that consumption of sugary drinks could be reduced, and consumption of water increased, in a remote Aboriginal and Torres Strait Islander setting by collaborating with communities to implement a social marketing campaign alongside community-led actions to create supportive environments. It was hypothesised that this engagement with community leaders would result in an increase in community readiness to address sugary drink consumption.
Community-led supportive environment action
A key strategy to engage community members in the co-design and implementation of supportive environment actions was to establish Community Advisory Committees in project communities, with membership from Aboriginal Shire Councils, local organisations and community leaders. The project team convened meetings with Community Advisory Committees to discuss potential actions to address sugary drink and water consumption. Suggestions were invited under five categories informed by the Good Food Planning Tool (places and spaces, policy, signs and promotion, community leadership, and community events).13
The Community Readiness Assessment tool was used at baseline to measure preparedness of each community to implement actions addressing sugary drink consumption.14 Community readiness interviews also provided an opportunity for key community leaders to suggest further actions. Actions identified through Community Advisory Committee meetings and community readiness interviews were
prioritised for implementation by the project team and Community Advisory Committee if they had adequate community support, resources and momentum. Actions such as bans on the sale of sugary drinks within certain community organisations were considered out of scope, as the project timeframe and resources were inadequate to facilitate the process of gaining community-wide acceptance and support.
Prioritised actions to implement fell under three broad categories: i) awareness-raising and education activities, which included co-designing local videos with community members, education sessions for school-aged children, information stalls at community events and distribution of social marketing merchandise; ii) infrastructure changes to improve availability and access, such as installing chilled water bubblers, relaying drink fridges in stores to promote bottled water and displaying water promotion signage in community settings; and iii) policies and partnerships, which involved working with key community organisations to promote the development of policies governing availability of water and sugary drinks within organisations and at events. Actions were delivered by Apunipima staff with in-kind personnel contributions from Aboriginal Shire Councils and community organisations.
Social marketing campaign
A social marketing campaign for Cape York was developed by Apunipima in consultation with community members and Aboriginal and Torres Strait Islander staff members. Early community consultations by Apunipima staff informed the campaign design, which was modified and finalised based on community feedback. The campaign was titled ‘Sugary Drinks Proper No Good – Drink More Water Youfla’ (‘youfla’ is commonly used in Cape York to refer to a group of people). The two-tiered campaign aimed to promote the benefits of water and health risks of excessive sugary drink consumption. First-tier campaign materials featured a popular sporting personality and included three short video clips, a series of posters and a radio advertisement. The campaign was officially launched on 2 November 2017 to Facebook, Twitter, YouTube, and two nationally recognised health organisation websites. Campaign materials were heavily promoted on these channels to 31 March 2018. Video clips were broadcast on state and national
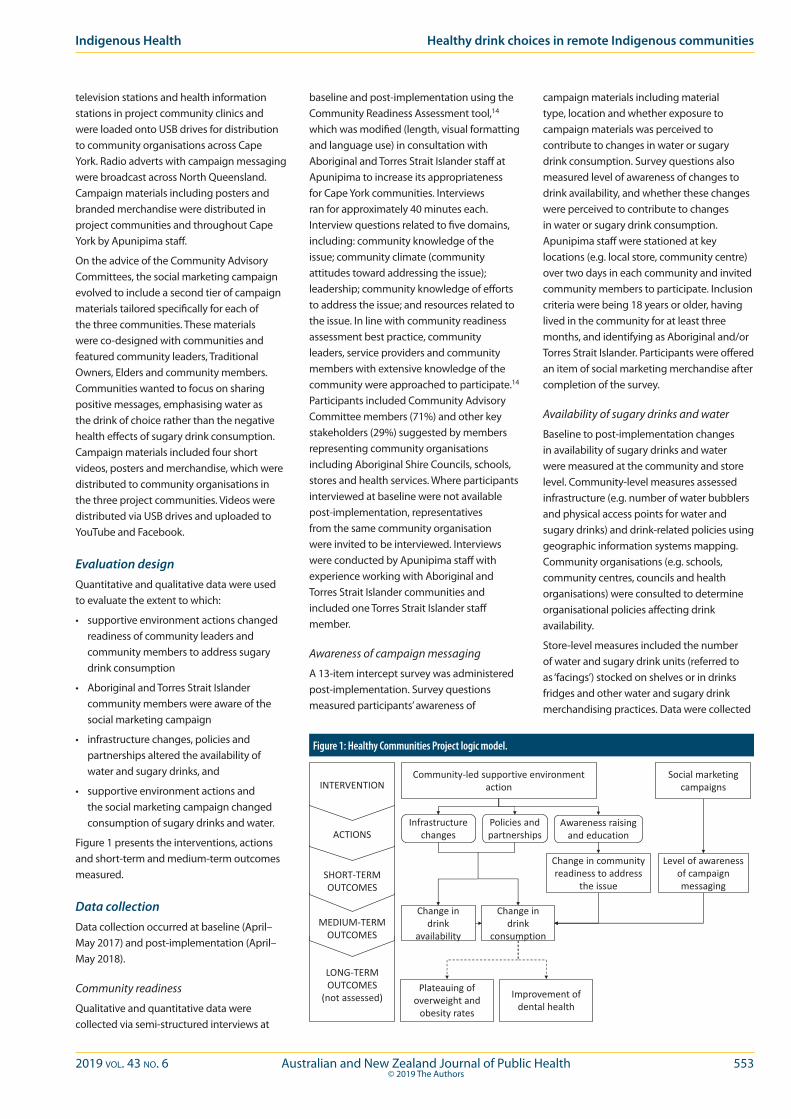
2019 vol. 43 no. 6 Australian and New Zealand Journal of Public Health 553© 2019 The Authors
Indigenous Health Healthy drink choices in remote Indigenous communities
television stations and health information stations in project community clinics and were loaded onto USB drives for distribution to community organisations across Cape York. Radio adverts with campaign messaging were broadcast across North Queensland. Campaign materials including posters and branded merchandise were distributed in project communities and throughout Cape York by Apunipima staff.
On the advice of the Community Advisory Committees, the social marketing campaign evolved to include a second tier of campaign materials tailored specifically for each of the three communities. These materials were co-designed with communities and featured community leaders, Traditional Owners, Elders and community members. Communities wanted to focus on sharing positive messages, emphasising water as the drink of choice rather than the negative health effects of sugary drink consumption. Campaign materials included four short videos, posters and merchandise, which were distributed to community organisations in the three project communities. Videos were distributed via USB drives and uploaded to YouTube and Facebook.
Evaluation designQuantitative and qualitative data were used to evaluate the extent to which:
• supportive environment actions changed readiness of community leaders and community members to address sugary drink consumption
• Aboriginal and Torres Strait Islander community members were aware of the social marketing campaign
• infrastructure changes, policies and partnerships altered the availability of water and sugary drinks, and
• supportive environment actions and the social marketing campaign changed consumption of sugary drinks and water.
Figure 1 presents the interventions, actions and short-term and medium-term outcomes measured.
Data collectionData collection occurred at baseline (April–May 2017) and post-implementation (April–May 2018).
Community readiness
Qualitative and quantitative data were collected via semi-structured interviews at
baseline and post-implementation using the Community Readiness Assessment tool,14 which was modified (length, visual formatting and language use) in consultation with Aboriginal and Torres Strait Islander staff at Apunipima to increase its appropriateness for Cape York communities. Interviews ran for approximately 40 minutes each. Interview questions related to five domains, including: community knowledge of the issue; community climate (community attitudes toward addressing the issue); leadership; community knowledge of efforts to address the issue; and resources related to the issue. In line with community readiness assessment best practice, community leaders, service providers and community members with extensive knowledge of the community were approached to participate.14 Participants included Community Advisory Committee members (71%) and other key stakeholders (29%) suggested by members representing community organisations including Aboriginal Shire Councils, schools, stores and health services. Where participants interviewed at baseline were not available post-implementation, representatives from the same community organisation were invited to be interviewed. Interviews were conducted by Apunipima staff with experience working with Aboriginal and Torres Strait Islander communities and included one Torres Strait Islander staff member.
Awareness of campaign messaging
A 13-item intercept survey was administered post-implementation. Survey questions measured participants’ awareness of
campaign materials including material type, location and whether exposure to campaign materials was perceived to contribute to changes in water or sugary drink consumption. Survey questions also measured level of awareness of changes to drink availability, and whether these changes were perceived to contribute to changes in water or sugary drink consumption. Apunipima staff were stationed at key locations (e.g. local store, community centre) over two days in each community and invited community members to participate. Inclusion criteria were being 18 years or older, having lived in the community for at least three months, and identifying as Aboriginal and/or Torres Strait Islander. Participants were offered an item of social marketing merchandise after completion of the survey.
Availability of sugary drinks and water
Baseline to post-implementation changes in availability of sugary drinks and water were measured at the community and store level. Community-level measures assessed infrastructure (e.g. number of water bubblers and physical access points for water and sugary drinks) and drink-related policies using geographic information systems mapping. Community organisations (e.g. schools, community centres, councils and health organisations) were consulted to determine organisational policies affecting drink availability.
Store-level measures included the number of water and sugary drink units (referred to as ‘facings’) stocked on shelves or in drinks fridges and other water and sugary drink merchandising practices. Data were collected
Community-led supportive environment action
Social marketing campaigns
Awareness raising and education
Infrastructure changes
Policies and partnerships
Change in community readiness to address
the issue
Level of awareness of campaign messaging
Change in drink
availability
Change in drink
consumption
Plateauing of overweight and
obesity rates
Improvement of dental health
INTERVENTION
ACTIONS
SHORT-TERMOUTCOMES
MEDIUM-TERMOUTCOMES
LONG-TERMOUTCOMES
(not assessed)
Figure 1: Healthy Communities Project logic model.

554 Australian and New Zealand Journal of Public Health 2019 vol. 43 no. 6© 2019 The Authors
using a store environment assessment tool developed by Menzies School of Health Research.15
Community and store level measures were compared against intercept survey data on changes in drink availability observed by community members.
Consumption of sugary drinks and water
Store sales data in remote communities in Australia can provide an objective proxy of community-level consumption16 and were therefore used to measure change in sugary drink and water consumption. Electronic data were sought for all project stores for a 12-month baseline period prior to implementation and the 12 months of implementation. A full dataset was obtained from store 3 in Community B and the control store. Outcome measures included volume and dollar value of water and sugary drinks sold as a proportion of total sales.
Intercept survey data on drink choice and perceived influence of the strategy on drink choice were also used to assess strategy impact on behaviour.
Data analysisCommunity readiness
Interview responses were transcribed from recordings and quantified on a 9-point scale of increasing readiness ranging from ‘no awareness’ to ‘community ownership’.14 Community readiness scores were averaged across domains to produce an overall score and an applicable readiness category.14 Interview data were arranged into key themes according to readiness domains by three Apunipima staff. Themes were cross-checked by two other staff and categorisation discrepancies were modified until consensus was reached.
Actions suggested by community leaders during interviews were combined with Community Advisory Committee feedback to form a list of supportive environment
actions. Suggested actions were entered into a table, which allowed for recording of actions as ‘not implemented’, ‘in progress’ and ‘implemented’ as the project proceeded. An action was considered implemented when a change in practice or measurable outcome was observed.
Awareness of campaign messaging
Intercept survey responses were tallied to produce a community-level indication of awareness of campaign materials (total and percentage). Awareness of campaign material formats (e.g. posters, social media) were quantified (total and percentage) and awareness of different campaign materials described.
Availability of sugary drinks and water
Community-level data were quantified to determine the number of supportive environment infrastructure points, physical access points and related policies at community organisations at baseline and post-implementation. Store-level data on facings were analysed to produce a total number of available drinks, an overall score for healthy merchandising practices at each store at baseline and post-implementation and percentage change between the two time points for both variables. Intercept survey responses were tallied to produce a community-level indication of awareness of changes in availability of water and sugary drinks (total and percentage).
Consumption of sugary drinks and water
Sales data were modelled using linear mixed models to estimate the relative change in drink sales during the intervention compared to baseline in the community store compared to the control store.
Intercept survey responses were tallied to produce a community-level indication of self-reported behaviour change regarding drink choice (total and percentage).
Ethical approval
Ethical approval was granted by the James Cook University Human Research Ethics Committee (HREC H6997) and the Northern Territory Department of Health and Menzies School of Health Research Human Research Ethics Committee (HREC 2017-2953).
Results
During the Healthy Communities Project, Apunipima staff facilitated 77 individual and group meetings with Community Advisory Committee members in Community A, 48 in Community B and 34 in Community C.
Change in community readiness Community readiness assessment interviews were completed with 37 key stakeholders. As a mean score across all domains, community readiness to address the issue of sugary drink consumption was low at baseline in Community A and C (‘denial/resistance’ and ‘vague awareness’ stages, respectively) but increased in both communities (to ‘preplanning’ stage, see Table 1).14 No change was shown in Community B (remained at ‘preplanning’ stage).14
Awareness of campaign messagingA total of 97 community members completed intercept surveys. Awareness of the two-tier social marketing campaign was highest in Community A where 94% of community members reported exposure to campaign messaging compared to Community B and C (56% and 67%, respectively; Table 2). Reported exposure to physical marketing materials (posters and merchandise) and TV ads was higher than social media posts.
Availability of sugary drinks and water Increased access to water was observed in each of the communities. Five additional organisations supplied water (14% increase) and two additional water bubblers were installed (11% increase; Table 2). One organisation in Community A had adopted a healthy drinks policy at post-implementation. Community B had increased access to sugary drinks at post-implementation, which included five workplaces supplying sugary drinks to staff for free and two organisations selling drinks for fundraising (233% increase). No change in infrastructure or policies affecting sugary drink availability
Table 1: Community readiness at baseline and post-implementation, by domain.Domain of community readiness
Community Time point Knowledge of the issue
Community climate
Leadership Knowledge of efforts
Resources to address the issue
Mean score across all domains
A Baseline (n=5) 3.4 2.6 3.4 1.4 2.6 2.7Post-implementation (n=8) 5.5 4.8 4.3 4.3 3.0 4.4
B Baseline (n=6) 6.0 4.0 3.3 4.0 3.0 4.1Post-implementation (n=6) 5.7 3.3 3.7 4.3 3.7 4.1
C Baseline (n=5) 5.0 3.0 2.2 2.6 3.0 3.2Post-implementation (n=7) 6.4 3.7 4.1 5.0 3.0 4.5
Fehring et al. Article

2019 vol. 43 no. 6 Australian and New Zealand Journal of Public Health 555© 2019 The Authors
was observed in Community C. A higher proportion of survey participants across all communities reported observing a change in the availability of water compared to changes in sugary drink availability (43% vs. 15%; Table 2).
At the store level, increased facings of bottled water were observed in one store (300% in store 1 servicing Community A), and decreased facings were observed in two stores (2% and 35% in stores 2 and 3 servicing Communities A and B, respectively, see Table 2). No change in water facings was observed in the store servicing Community C. Decreases in sugary drink facings were observed in two stores (24% and 5% in stores 1 and 2 servicing Community A) and increases were observed in store 3 servicing Community B (36%) and store 4 servicing Community C (28%). Across all stores, facings of bottled water decreased (11%) while sugary drink facings increased (7%).
Increased healthy merchandising practices were observed at two stores (stores 2 and 3 servicing Communities A and B). These stores stopped stocking sugary drinks near the checkouts, had refrigerated water stocked at child’s eye level and within arm’s reach, and a price promotion on water and/or low sugar drinks was in place. Healthy practices were observed to decrease at two stores during
the study period (stores 1 and 4 servicing Communities A and C), with sugary drinks taking up more space than low sugar drinks, visible upon entering the store, and stocked in high-traffic areas.
Consumption of sugary drinks and waterAcross all communities, a higher proportion of participants reported consuming more water compared to sugary drinks after seeing the campaign (49% vs. 21%; Table 2). Similarly, a higher proportion of participants reported choosing to drink more water with increased availability of water in communities compared to the perceived effect of availability changes on sugary drink choice (44% vs. 11%, respectively; Table 2).
In store 3 (Community B), water volume sales as a proportion of total drink volume sales increased by 3.1% (p<0.001) and water dollar sales as a proportion of total drink dollar sales increased by 1.3% (p<0.001) compared to the control store.
Sugary drink volume sales as a proportion of total drink volume sales decreased by 3.4% (p<0.001) and sugary drink dollar sales as a proportion of total drink dollar sales decreased by 1.4% (p=0.02) compared to the control store.
Discussion
These findings support the original hypothesis, that the combination of a social marketing campaign and community-led supportive environment actions has the potential to raise awareness of the benefits of increasing water consumption and reducing sugary drink consumption while simultaneously increasing the availability of healthier drink choices in communities. Awareness of social marketing messaging and increased availability of healthier drink choices contributed to positive changes in drink consumption in remote Aboriginal and Torres Strait Islander communities. Enabling factors included community involvement, aligning implemented activities to community readiness and a focus on positive messaging.
Community involvement in all aspects of program planning, delivery and evaluation is a major success factor of community nutrition programs.17 Engagement was crucial to the co-design and impact of this project. Community A, which had the greatest number of committee meetings in response to their request for increased project team engagement, had the most pronounced positive outcomes. Community A was the only community to establish an
Table 2: Results of the intercept survey and drink availability measures.Community A
(n=31)Community B
(n=36)Community C
(n=30)Total
Communities (n=97)
Intercept survey item (n (%))a
Aware of the social marketing campaign
Chose to consume more water after seeing the campaign
Chose to consume fewer sugary drinks after seeing the campaign
Aware of a change in availability of water in places in community
Aware of a change in availability of sugary drinks in places in community
Changes in availability of water helped participant to choose to consume more water
Changes in availability of sugary drinks helped participant to choose to consume fewer sugary drinks
29 (94)
20 (69)
9 (31)
7 (23)
4 (13)
11 (35)
1 (3)
20 (56)
14 (39)
7 (19)
19 (53)
2 (6)
17 (47)
2 (6)
20 (67)
14 (47)
4 (13)
16 (53)
9 (30)
15 (50)
8 (27)
69 (71)
48 (49)
20 (21)
42 (43)
15 (15)
43 (44)
11 (11)Community level drink availability measure
Setting-based drinking water access points (n change (% change))b
Access to working water bubblers (n change (% change))
Setting-based sugary drink access points (n change ( % change))c
Healthy drink policy adopted
2 (14)
-1 (-17)
0 (0)
Yes
3 (23)
0 (0)
7 (233)
No
0 (0)
2 (25)
0 (0)
No
5 (14)
1 (5)
7 (100)
In-store drink availability measure
Bottled water facings (n change (% change))d
Sugary drink facings (n change, % change)
Healthy in-store merchandising practicese
Store 1
21 (300)
-23 (-24%)
Weakened
Store 2
-2 (-25)
-5 (-5)
Strengthened
Store 3
-35 (-30)
36 (15)
Strengthened
Store 4
0 (0)
28 (31)
Weakened
All stores
-16 (-11%)
36 (7)
Notes:a: Five items of the 13-item intercept survey were omitted from analysis due to a lack of baseline data needed to quantify changeb: Setting-based drinking water access points included organisations and places in community that provided water for free (e.g. school, workplaces) or sold bottled water (e.g. store)c: Setting-based sugary drink access points included organisations and places in community that provided sugary drinks for free (e.g. workplaces, aged care centre) or sold sugary drinks (e.g. store) d: Increases in water facings occurred due to actions completed by the project team at the request of store managers including purchasing and installing new water-only drinks fridgese: Healthy in-store merchandising practices concerned the price, promotion and placement of drinks in stores. Healthy practices included selling water at cost price, placing materials (e.g. posters, stickers) promoting water near water fridges, and
moving water to high-traffic areas while moving sugary drinks towards the back of the shop
Indigenous Health Healthy drink choices in remote Indigenous communities
556 Australian and New Zealand Journal of Public Health 2019 vol. 43 no. 6© 2019 The Authors
organisational drink-related policy during the project period. Community A also saw the largest increase in community readiness, demonstrating that time and engagement are required to increase community readiness, establish policies in community organisations, encourage community investment in the project, and deliver positive outcomes.17
When mapped against categories of readiness described in the Community Readiness Assessment tool handbook, actions implemented aligned with levels of readiness observed in each community. While unintended, this finding points to a strength of the Community Readiness Assessment tool when used to prioritise interventions appropriate to a community’s readiness for change. For example, where low levels of readiness were identified, education and awareness-raising activities require emphasis. Activity relating to infrastructure changes and policies and partnerships can be incorporated where a higher level of readiness is observed. However, the correlation between readiness at baseline and prioritised activities may be somewhat biased, as most interviewees were Community Advisory Committee members and involved in the prioritisation process. Further research is required to explore the use of the Community Readiness Assessment tool in community action planning.
Positive campaign messaging promoting the benefits of water, as requested by communities, appeared to be more effective in changing behaviour than negative messaging discouraging sugary drinks. Qualitative research on anti-tobacco marketing campaigns found Aboriginal and Torres Strait Islander audiences disengaged with fear-based messages.18 There are no studies of reactions to negative messaging concerning sugary drink consumption among Aboriginal and Torres Strait Islander audiences, and this study offers some insights.
The project’s pronounced effect on water consumption may be further explained by infrastructure changes and awareness activities affecting water availability being perceived as more overt than initiatives affecting sugary drink availability. Interventions to increase access to water were highly visible, including the installation of water bubblers and provision of branded reusable water bottles and other free merchandise promoting water in communities. While social marketing
and supportive environment actions that encouraged increased water consumption gained greater community support and resulted in increased self-reported water consumption compared to sugary drinks, store sales data showed a consistent improvement for both water and sugary drink sales. Another multi-sectoral community engagement approach to improving the food environment in remote Aboriginal and Torres Strait Islander communities was associated with an increase in store water sales in each of the four participating communities and a variable effect on soft drink sales over a five-year period.19 This study did not focus specifically on reducing soft drink consumption, but aimed to advance knowledge on how to facilitate a multi-sectoral approach to action planning including assessment and feedback on the healthiness of food environments to support community-level decision making. Further studies are required to determine how reductions in sugary drink consumption can continue to be achieved in remote Aboriginal and Torres Strait Islander communities.
There were a number of challenges to implementing the Healthy Communities Project, such as the availability of store sales and merchandising practices data. Caution must be exercised when interpreting sales data as only one community store was able to provide complete sales data for the baseline and intervention periods. The ability to generalise findings to other communities is limited. Further, other Cape York communities were exposed to social marketing campaign materials, including the community for which control store sales data was obtained. Exposure to the campaign may have affected store sales in the control community, potentially underestimating the effect size in the project community store. Drink facings and in-store merchandising practices were recorded at two time points only, which did not account for normal fluctuations in store stock and practices on any given day. This may explain why an increase in sugary drink facings, but a reduction in sugary drink sales, was found in the same store.
Project duration presented further challenges. Twelve months is a short timeframe to implement a multi-strategy health promotion project in a remote context, which reflects the current paucity of resources to support nutrition promotion in this setting, relative to previous investments.20 This study has demonstrated the potential benefits of a
community-led approach, facilitated by an Aboriginal Community Controlled Health Organisation, for community engagement and project outcomes. Longer-term funding would have enabled the project team to further build communities’ understanding of health promotion concepts and strengthen relationships and trust within communities, which would likely have enhanced planning with communities for project sustainability.
Implications for public health
Current resources for nutrition promotion in Queensland’s remote Aboriginal and Torres Strait Islander communities are limited compared to previous investments. Future funding must consider the high level of community engagement required to effectively support communities to move through the stages of readiness and support an enabling environment for healthier choices. Engagement with Aboriginal Shire Councils, community leaders and the wider community to co-design social marketing materials and supportive environment actions is key to health promotion in remote Aboriginal and Torres Strait Islander communities.
The importance of a collaborative approach to co-designing culturally appropriate social marketing materials and local actions with community members and employing Aboriginal and Torres Strait Islander staff to facilitate engagement, must be considered in future work. Positive social marketing messaging about the benefits of behaviour change show promise in Aboriginal and Torres Strait Islander communities.
Overconsumption of sugary drinks is prevalent in remote Aboriginal and Torres Strait Islander communities with many influencing factors. This study demonstrated some effective behaviour change strategies worth further investigation. Longer-term effectiveness of community-led supportive environment approaches to health behaviour change could be explored with extended funding. This would offer longer-term solutions to the health disparity experienced by Aboriginal and Torres Strait Islander populations in remote communities.
Conclusion
Taking a collaborative approach to develop and implement a co-designed social marketing campaign and community-led
Fehring et al. Article
2019 vol. 43 no. 6 Australian and New Zealand Journal of Public Health 557© 2019 The Authors
supportive environment actions can improve access to healthier drinks and may affect consumption of sugary drinks and water in remote Aboriginal and Torres Strait Islander communities. Community involvement, aligning implemented activities to community readiness and a focus on positive messaging are likely to contribute to these positive outcomes.
Aboriginal Shire Councils and local organisations are well-placed to be supported to take action in their communities and create healthy places that support healthy choices.
Acknowledgements
We would like to acknowledge the invaluable contribution of Aboriginal Shire Councils, community leaders, organisations and community members in each of the communities involved in the Healthy Communities Project.
We would also like to acknowledge our research partners: James Cook University and Menzies School of Health Research; the Healthy Communities Project Steering Group for their expertise and guidance; Professor Yvonne Cadet-James, Dr Karla Canuto and Dr Susan Jacups for their contributions to the project and paper; and Federica Barzi and Anthony Gunther from Menzies School of Health Research who imported and analysed store sales data.
The Healthy Communities Project was jointly funded by Queensland Health and Northern Queensland Primary Health Network.
References1. Australian Bureau of Statistics. 4364.0.55.007 – Australian
Health Survey: Nutrition First Results – Foods and Nutrients, 2011-12. Canberra (AUST): ABS; 2015.
2. Australian Bureau of Statistics. 4364.0.55.001 – National Health Survey: First Results, 2017-18. Canberra (AUST): ABS; 2018.
3. World Health Organization. The Ottawa Charter for Health Promotion [Internet]. Geneva (CHE): WHO; 1986 [cited 2018 Nov 20]. Available from: https://www.who.int/healthpromotion/conferences/previous/ottawa/en/
4. Butler R, Tapsell L, Lyons-Wall P. Trends in purchasing patterns of sugar-sweetened water-based beverages in a remote Aboriginal community store following the implementation of a community-developed store nutrition policy. Nutr Diet. 2011;68(2):115-9.
5. Brimblecombe J, Ferguson M, Liberato SC, Ball K, Moodie ML, Magnus A, et al. Stores Healthy Options Project in Remote Indigenous Communities (SHOP@RIC): A protocol of a randomised trial promoting healthy food and beverage purchases through price discounts and in-store nutrition education. BMC Public Health. 2013;13(744):1-11.
6. van de Gaar VM, Jansen W, van Grieken A, Borsboom G, Kremers S, Raat H. Effects of an intervention aimed at reducing the intake of sugar-sweetened beverages in primary school children: A controlled trial. Int J Behav Nutr Phys Act. 2014;11:98.
7. Apunipima Cape York Health Council. Chronic Conditions Strategy 2016 to 2026. Cairns (AUST): Apunipima; 2016.
8. Queensland Health. Health and Wellbeing Strategic Framework 2017 to 2026. Brisbane (AUST): State Government of Queensland; 2017.
9. Grier S, Bryant CA. Social marketing in public health. Annu Rev Public Health. 2005;26(1):319-39.
10. Queensland Health. Healthy Food Access Basket Survey 2014. Brisbane (AUST): State Government of Queensland; 2016.
11. Australian Bureau of Statistics. 1379.0.55.001 – Data by Region. Canberra (AUST): ABS; 2017.
12. Apunipima Cape York Health Council. Internal Audit of Apunipima Electronic Medical Record Data of Childhood Body Mass Index (BMI). Cairns (AUST): Apunipima; 2016. Unpublished observations.
13. Menzies School of Health Research. Good Food Planning Tool [Internet]. Darwin (AUST): Menzies School of Health Research; 2014 [cited 2019 Jan 20]. Available from: https://www.menzies.edu.au/page/Resources/Good_food_planning_tool/
14. Stanley LR. Community Readiness for Community Change, Tri-Ethnic Center Community Readiness Handbook. 2nd ed. Fort Collins (CO): Colorado State University Tri-ethnic Center for Prevention Research; 2014.
15. Jaenke R, van den Boogaard C, Brimblecombe J. Development and pilot of a tool to measure the in-store food environment. Nutr Diet. 2018;75 Suppl 1:9-67.
16. Brimblecombe J, Liddle R, O’Dea K. Use of point-of-sale data to assess food and nutrient quality in remote stores. Public Health Nutr. 2013;16(7):1159-67.
17. Lee A, Ride K. Review of nutrition among Aboriginal and Torres Strait Islander people. Aust Indig HealthInfoNet [Internet]. 2018 [cited 2019 Mar 24]; 18(1). Available from: http://healthbulletin.org.au/articles/review-of-nutrition-among-aboriginal-and-torres-strait-islander-people/
18. Gould GS, Munn J, Avuri S, Hoff S, Cadet-James Y, McEwen A, et al. “Nobody smokes in the house if there’s a new baby in it”: Aboriginal perspectives on tobacco smoking in pregnancy and in the household in regional NSW Australia. Women Birth. 2013;26(4):246-53.
19. Brimblecombe J, Bailie R, van den Boogaard C, Wood B, Liberato SC, Ferguson M, et al. Feasibility of a novel participatory multi-sector continuous improvement approach to enhance food security in remote Indigenous Australian communities. SSM Popul Health. 2017;3:566-76.
20. Vidgen H, Adam M, Gallegos D. Who does nutrition prevention work in Queensland? Nutr Diet. 2015;74:88-94.
Indigenous Health Healthy drink choices in remote Indigenous communities
558 Australian and New Zealand Journal of Public Health 2019 vol. 43 no. 6© 2019 The Authors
Influenza and invasive pneumococcal disease (IPD) are major causes of morbidity and mortality in Aboriginal and Torres
Strait Islander (hereafter respectfully referred to as Indigenous) people. This is likely related to the fact that Indigenous adults have much higher rates of chronic disease compared to non-Indigenous adults, the root causes of which are related to the social determinants of health. Many of these conditions (such as renal disease, diabetes and cardiac disease) are accompanied by a higher risk of severe outcomes from influenza infection and IPD.1,2 In Indigenous adults aged 25–49 years, reported rates of influenza and its complications have been found to be at least eight times higher for hospitalisations and 20 times higher for deaths when compared to their non-Indigenous counterparts (over various periods from 2003–2015).2-4 The notification rate of IPD in the Indigenous population was 31.4 per 100,000 in 2014, approximately six times the rate in the non-Indigenous population (5.3 per 100,000).5
In recognition of these disparities, influenza and pneumococcal vaccines are recommended for use in a broader age range for Indigenous people than for the non-Indigenous population.6 Beginning in 1999, annual influenza vaccination was funded under the National Immunisation Program (NIP) for all adults aged ≥65 years, Indigenous people aged ≥50 years, and 15–49-year-olds with chronic medical conditions predisposing them to severe complications of influenza.
Expanded funding to cover annual influenza vaccination of all individuals aged ≥6 months with chronic medical conditions, and all Indigenous people aged 15–49 years, commenced in January 2010. From 1999, polysaccharide pneumococcal vaccine was also funded for Indigenous adults aged ≥50 years and those aged 15–49 years at high risk, and for all Australians aged ≥65 years from 2005.
Reservations have occasionally been expressed in the scientific literature about the roles of both these vaccines, although more so for pneumococcal7 vaccine than influenza.8 However, the evidence has been assessed by the Australian Technical Advisory Group on Immunisation and these vaccines have been recommended and funded on that basis. While vaccine hesitancy towards specific vaccines in general may have an
What isn’t measured isn’t done – eight years with no progress in Aboriginal and Torres Strait Islander adult influenza and pneumococcal vaccinationFleur Webster,1 Heather Gidding,2,3 Veronica Matthews,4 Richard Taylor,1 Robert Menzies1
1. School of Public Health and Community Medicine, University of NSW, New South Wales2. Clinical and Population Perinatal Health Research, The University of Sydney Northern Clinical School, Faculty of Medicine and Health, University of Sydney, New South Wales3. National Centre for Immunisation Research and Surveillance, New South Wales4. The University Centre for Rural Health, University of Sydney, New South WalesCorrespondence to: Ms Fleur Webster, School of Public Health and Community Medicine, University of NSW, Sydney, NSW; e-mail: [email protected] Submitted: February 2019; Revision requested: June 2019; Accepted: September 2019The authors have stated they have no conflict of interest.This is an open access article under the terms of the Creative Commons Attribution-NonCommercial-NoDerivs License, which permits use and distribution in any medium,
provided the original work is properly cited, the use is non-commercial and no modifications or adaptations are made.
Aust NZ J Public Health. 2019; 43:558-62; doi: 10.1111/1753-6405.12944
Abstract
Objectives: To describe and compare vaccination coverage for Aboriginal and Torres Strait Islander (hereafter referred to as Indigenous) adults in 2004–05 and 2012–13, including the impact of national vaccination funding initiatives.
Methods: National Aboriginal and Torres Strait Islander Health cross-sectional surveys – 2004–05 (n=5,757) and 2012–13 (n=5,482) – were compared. Self-reported influenza and pneumococcal vaccination coverage among Indigenous adults was analysed by age, remoteness, gender and risk factor status.
Results: Influenza vaccination coverage among Indigenous adults in 2004–05 and 2012–13 remained low. While coverage increased for those aged 18–49 years from 23% to 29%, it declined for those aged ≥65 years from 84% to 74%. For remote areas, influenza coverage among those aged 50–64 years declined from 76% to 66%. Pneumococcal vaccination coverage remained very low and declined across all age groups in 2004–05 and 2012–13 (50–64 years: 30% to 23%). For remote areas, pneumococcal coverage declined among those aged 50–64 years from 52% to 32%.
Conclusions: Indigenous adult vaccination coverage for influenza and pneumococcal disease remains unacceptably low. Between 2004–05 and 2012–13, declines occurred in pneumococcal vaccination coverage across all age groups ≥18 years. Despite national funding of influenza vaccine in 2010, there was no increase in influenza coverage, except for the 18–49-year age group.
Implications for public health: Current approaches to promote, deliver and monitor vaccination of Indigenous adults are inadequate.
Key words: vaccination, Aboriginal, Indigenous, coverage, adults
INDIGENOUS HEALTH

2019 vol. 43 no. 6 Australian and New Zealand Journal of Public Health 559© 2019 The Authors
impact on vaccination rates, it is not possible to estimate that from these data, which focus on implementation of a national policy.
Compared to the general adult population in Australia, coverage for vaccination programs targeted specifically at Indigenous adults is substantially lower.4 Vaccine coverage among Indigenous adults aged 15–49 years with medical risk factors was reported in the 2004–05 National Aboriginal and Torres Strait Islander Health Survey (NATSIHS) to be 29% for influenza and 13% for pneumococcal.4 In 2004–05, 73% of non-Indigenous adults aged ≥65 years were vaccinated for influenza and 43% of non-Indigenous adults aged ≥65 years were vaccinated for IPD in accordance with the national program at the time.4
The only national data available on vaccination coverage among Indigenous adults to inform program planning and delivery efforts are from the NATSIHSs, conducted by the Australian Bureau of Statistics (ABS). The most recent survey was conducted in 2012–13, eight years after the previous survey in 2004–05.
The aim of this study was to calculate influenza and pneumococcal vaccination coverage among NIP-eligible adult participants (overall and among those with medical risk factors) in the 2012–13 NATSIHS, then compare with 2004–05 NATSIHS published estimates to measure changes in coverage over the period between surveys and the impact of national vaccination funding initiatives, including the expanded funding of the influenza vaccine in 2010.
Methods
Participants The study participants were Indigenous people aged ≥18 years who were surveyed as part of the 2012–13 NATSIHS (n=5,482).9 Results were compared to published data on Indigenous people aged ≥18 years surveyed as part of the 2004–05 NATSIHS (n=5,757).4
Sampling and sample weightsNATSIHSs are cross-sectional population prevalence surveys of Indigenous residents conducted using a stratified multistage area sample of private dwellings selected in both remote and non-remote areas throughout Australia, as categorised by the Remoteness Structure for the Australian Statistical Geography Standard (ASGS) Remoteness areas.9 As both the NATSIHSs were conducted on a sample of private households, and a
person’s chance of selection in the survey varied depending on the state or territory in which the person lived, the use of weights was necessary. ABS person weights were used to adjust for the probability of sample selection. The person weight indicates how many population units are represented by the sample units. An initial weight is assigned to each person by the ABS, which is equal to the inverse of the probability of being selected in the survey. For the 2012–13 survey, the ABS then calibrated all person weights by age, sex and state/territory to the Indigenous estimated resident population living in private dwellings of Australia at 30 June 2011, based on the 2011 Census of Population and Housing.9 The 2004–05 survey was calibrated to the Indigenous estimated resident population at 31 December 2004, based on the 2001 Census.10 The methodology for calculating weighted proportions has been described in detail elsewhere.9
Participant characteristicsParticipant demographics, along with vaccination and medical risk factor status, were collected through face-to-face interview using a structured questionnaire,9 without referring to any written records. The methodology used was very similar for the 2004–05 and 2012–13 surveys and has been described in detail elsewhere.9,10
Outcome definitionsOutcome measures were vaccination coverage for influenza and IPD for: i) the whole of survey population by age group, geographic remoteness and gender, and ii) those aged 18–49 years with one or more medical risk factors that are indications for vaccination (as defined by the Australian Immunisation Handbook6). Coverage was measured as self-reported vaccination for influenza in the 12 months prior, and for IPD in the five years prior to the surveys. As some medical risk factors captured in the 2012–13 survey did not exactly match those listed in the Handbook, those that best matched the Handbook were included (Supplementary File 1). Some medical risk factors listed in the Handbook were either not captured in the 2012–13 survey or not able to be analysed separately using the ABS Confidentialised Unit Record Files (CURFS) – see Supplementary File 2 – or were recommended but not funded (obesity for influenza vaccination) and therefore were not included in the analysis. The medical
risk factors included in the analysis of the 2004–05 NATSIHS4 and 2012–13 NATSIHS were very similar. However, some medical risk factors captured in the 2004–05 survey were not included in the analysis of the 2012–13 survey due to the level of detail available for analysis in the CURFs (Supplementary File 3).
Statistical analyses Unidentifiable CURFs containing individual unit record data were analysed via the ABS’s secure Remote Access Data Laboratory (RADL) using Stata 10.0 (StataCorp). Vaccination coverage was estimated by age group (≥18, 18–49, 50–64 and ≥65 years), remoteness, gender, and medical risk factor status. The results were compared to published information (based on unit record data) from the 2004–05 NATSIHS.4 Remoteness was defined using the ASGS11 in the 2012–13 survey that replaced the Australian Standard Geographic Classification (ASGC)12 used in the 2004–05 survey. As data on remoteness was reported in both surveys as being either non-remote or remote, the surveys were only able to be compared by using these two broad categories. A two proportion Z-test was used to compare coverage estimates between surveys10 and a chi-squared test was used to compare coverage rates within the 2012–13 survey.13 The delete 1 group jackknife replication method was used for calculating the weighted proportions.9 A p value <0.05 was defined as statistically significant.
The calibrated age group specific coverage estimates for the 2004–05 and 2012–13 NATSIHSs were directly compared. For the purpose of comparing coverage estimates for the ≥18-year age group between the two surveys, it was necessary to test for any confounding effects of differences in population age structure between the two periods. Therefore, two coverage estimates for the ≥18 year age group from the 2012–13 NATSIHS were calculated – one age standardised against the Indigenous estimated resident population of Australia at 30 June 2011 based on the 2011 Census, and the other to the Indigenous estimated resident population of Australia at 30 June 2001 based on the 2001 Census (to compare with the 2004–05 NATSIHS). Age standardisation was accomplished using the direct method,13 with five-year age groupings; 95% confidence intervals (CIs) of the direct age standardised rates were calculated as recommended by Boyle and Parkin (1991).14
Indigenous Health Aboriginal and Torres Strait Islander adult vaccination

560 Australian and New Zealand Journal of Public Health 2019 vol. 43 no. 6© 2019 The Authors
ApprovalsEthics approval for the study was granted by the Aboriginal Health and Medical Research Council of NSW. Approval was obtained from the ABS to analyse relevant CURFs through the RADL.
Results
Influenza vaccination coverageIn the eight years between surveys, influenza vaccination coverage remained low in those aged 18–49 years, both with or without a medical risk factor, and those aged 50–64 years (Figure 1). Influenza vaccination coverage increased with age in 2012–13, even though it is low in those aged 50–64 years, similar to 2004–05 (Figure 1). Between 2004–05 and 2012–13, influenza coverage increased in those aged 18–49 years from 23% to 29% but declined in those aged ≥65 years from 84% to 74%; however, there was no meaningful change in those aged 18–49 years with a medical risk factor, or those aged 50–64 years (Figure 1). There was no statistically significant difference between 2012–13 coverage in those aged ≥18 years standardised to the 2001 Census (34% [95%CI, 34-34]) and standardised to the population at 30 June 2011 (35%; 95%CI, 34-37).
While influenza coverage was low in all regions, it was substantially higher in remote compared to non-remote areas in 2012–13 for those aged ≥18 years (Table 1). From 2004–05 to 2012–13, influenza coverage in remote areas declined significantly in 50–64-year-olds from 76% (95%CI, 72-80) to 66% (95%CI, 61-70), but did not change significantly in non-remote areas in this age group – from 43% (95%CI, 39-47) in 2004–05 to 47% (95%CI, 43-50) in 2012–13. Similar trends were observed in those aged ≥50 years (data not shown). No other age groups were available for comparison.
In 2012–13, influenza coverage in those aged ≥18 years was low for both males and females but significantly higher for females (Table 1). There was no published data from the 2004–05 NATSIHS on gender for comparison.
Pneumococcal vaccination coverageIn 2012–13, pneumococcal vaccination coverage was very low, and similar to 2004–05 (Figure 2). Pneumococcal vaccination coverage increased with age in both surveys but remained very low across all age groups
Figure 1: Indigenous adults in Australia reporting influenza vaccination,a (Per cent) 2012-13 NATSIHSb compared with 2004-05 NATSIHS.c
Figure 1: Indigenous adults in Australia reporting influenza vaccination,* (Per cent) 2012‐13 NATSIHS† compared with 2004‐05 NATSIHS§
*Self‐reported as having had influenza vaccination in the 12 months prior to survey (respondents were asked if they had ever had a flu shot and if so, was it in the last 12 months?).
† Standardised to the Indigenous estimated resident population living in private dwellings of Australia at 30 June 2011, based on the 2011 Census of Population and Housing.
§ Standardised to the Indigenous estimated resident population living in private dwellings of Australia at 31 December 2004, based on the 2001 Census of Population and Housing.
2329
52
84
2933
51
74
0
10
20
30
40
50
60
70
80
90
100
18‐49 18‐49 with riskfactor(s)
50‐64 ≥65
Coverage
%
Age (years)
2004‐05
2012‐13
Notes:a: Self-reported as having had influenza vaccination in the 12 months prior to survey (respondents were asked if they had ever had a flu shot and if so, was it in
the last 12 months?). b: Standardised to the Indigenous estimated resident population living in private dwellings of Australia at 30 June 2011, based on the 2011 Census of Population
and Housing.c: Standardised to the Indigenous estimated resident population living in private dwellings of Australia at 31 December 2004, based on the 2001 Census of
Population and Housing.
Table 1: Indigenous adults aged ≥18 years (per cent) in Australia reporting influenza and pneumococcal vaccination,a by remoteness and gender, 2012-13 NATSIHS.b
Influenza PneumococcalCoverage %
(95%CI)Coverage %
(95%CI)Non-remote 29 (28-31) 11 (10-12)Remote 56 (54-58) 25 (23-27)Males 33 (31-35) 13 (12-15)Females 38 (36-40) 15 (14-16)Notes:a: Self-reported as having had influenza vaccination in the 12 months
prior to survey or pneumococcal vaccination in the 5 years prior to survey.
b: Standardised to the Indigenous estimated resident population living in private dwellings of Australia at 31 December 2014, based on the 2011 Census of Population and Housing.
(Figure 2). Pneumococcal coverage declined slightly between 2004–05 and 2012–13 in Indigenous adults aged 18–49 years from 12% to 10%, and more markedly in those aged 50–64 years from 30% to 23%, but there were no significant changes in those aged 18–49 years with a medical risk factor, or those aged ≥65 years (Figure 2). There was no statistically significant difference between 2012–13 coverage in those aged ≥18 years standardised to the 2001 Census (13% [95%CI, 13-13]) and standardised to the population at 30 June 2011 (14% [95%CI, 13-15]).
In 2012–13, pneumococcal coverage was very low in all regions, but was significantly higher in remote compared to non-remote areas for those aged ≥18 years (Table 1). In the period between 2004–05 and 2012–13, pneumococcal coverage in remote areas declined markedly in 50–64-year-olds from 52% (95%CI, 47-57) to 32% (95%CI, 28-37), but remained steady in non-remote areas in this age group at 22% (95%CI, 19-25) in 2004–05 and 21% (95%CI 18-24) in 2012–13. This trend was also evident in those aged ≥50
years (data not shown). No other comparison data were available.
In 2012–13, pneumococcal coverage in those aged ≥18 years was very low and only slightly higher for females than males (Table 1). No comparable published data from the 2004–05 NATSIHS on gender was available.
Influenza coverage was significantly higher than pneumococcal coverage across all age
Webster et al. Article
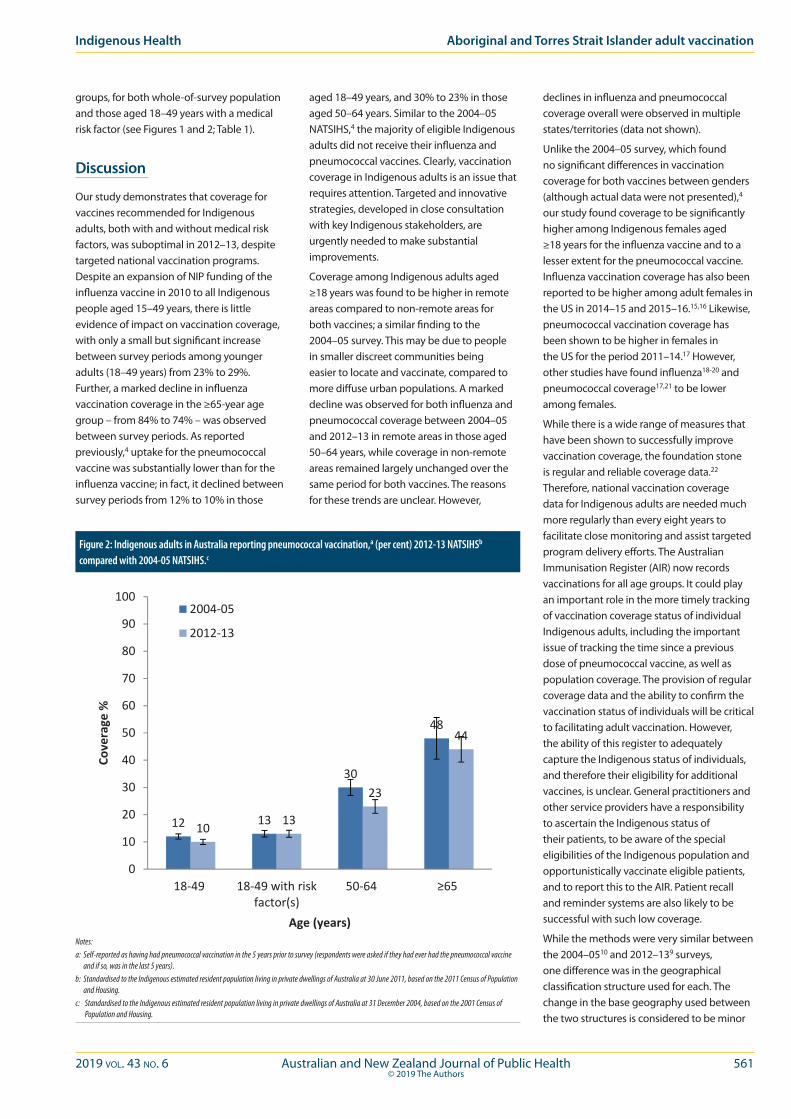
2019 vol. 43 no. 6 Australian and New Zealand Journal of Public Health 561© 2019 The Authors
Indigenous Health Aboriginal and Torres Strait Islander adult vaccination
groups, for both whole-of-survey population and those aged 18–49 years with a medical risk factor (see Figures 1 and 2; Table 1).
Discussion
Our study demonstrates that coverage for vaccines recommended for Indigenous adults, both with and without medical risk factors, was suboptimal in 2012–13, despite targeted national vaccination programs. Despite an expansion of NIP funding of the influenza vaccine in 2010 to all Indigenous people aged 15–49 years, there is little evidence of impact on vaccination coverage, with only a small but significant increase between survey periods among younger adults (18–49 years) from 23% to 29%. Further, a marked decline in influenza vaccination coverage in the ≥65-year age group – from 84% to 74% – was observed between survey periods. As reported previously,4 uptake for the pneumococcal vaccine was substantially lower than for the influenza vaccine; in fact, it declined between survey periods from 12% to 10% in those
aged 18–49 years, and 30% to 23% in those aged 50–64 years. Similar to the 2004–05 NATSIHS,4 the majority of eligible Indigenous adults did not receive their influenza and pneumococcal vaccines. Clearly, vaccination coverage in Indigenous adults is an issue that requires attention. Targeted and innovative strategies, developed in close consultation with key Indigenous stakeholders, are urgently needed to make substantial improvements.
Coverage among Indigenous adults aged ≥18 years was found to be higher in remote areas compared to non-remote areas for both vaccines; a similar finding to the 2004–05 survey. This may be due to people in smaller discreet communities being easier to locate and vaccinate, compared to more diffuse urban populations. A marked decline was observed for both influenza and pneumococcal coverage between 2004–05 and 2012–13 in remote areas in those aged 50–64 years, while coverage in non-remote areas remained largely unchanged over the same period for both vaccines. The reasons for these trends are unclear. However,
declines in influenza and pneumococcal coverage overall were observed in multiple states/territories (data not shown).
Unlike the 2004–05 survey, which found no significant differences in vaccination coverage for both vaccines between genders (although actual data were not presented),4 our study found coverage to be significantly higher among Indigenous females aged ≥18 years for the influenza vaccine and to a lesser extent for the pneumococcal vaccine. Influenza vaccination coverage has also been reported to be higher among adult females in the US in 2014–15 and 2015–16.15,16 Likewise, pneumococcal vaccination coverage has been shown to be higher in females in the US for the period 2011–14.17 However, other studies have found influenza18-20 and pneumococcal coverage17,21 to be lower among females.
While there is a wide range of measures that have been shown to successfully improve vaccination coverage, the foundation stone is regular and reliable coverage data.22 Therefore, national vaccination coverage data for Indigenous adults are needed much more regularly than every eight years to facilitate close monitoring and assist targeted program delivery efforts. The Australian Immunisation Register (AIR) now records vaccinations for all age groups. It could play an important role in the more timely tracking of vaccination coverage status of individual Indigenous adults, including the important issue of tracking the time since a previous dose of pneumococcal vaccine, as well as population coverage. The provision of regular coverage data and the ability to confirm the vaccination status of individuals will be critical to facilitating adult vaccination. However, the ability of this register to adequately capture the Indigenous status of individuals, and therefore their eligibility for additional vaccines, is unclear. General practitioners and other service providers have a responsibility to ascertain the Indigenous status of their patients, to be aware of the special eligibilities of the Indigenous population and opportunistically vaccinate eligible patients, and to report this to the AIR. Patient recall and reminder systems are also likely to be successful with such low coverage.
While the methods were very similar between the 2004–0510 and 2012–139 surveys, one difference was in the geographical classification structure used for each. The change in the base geography used between the two structures is considered to be minor
Figure 2: Indigenous adults in Australia reporting pneumococcal vaccination,a (per cent) 2012-13 NATSIHSb compared with 2004-05 NATSIHS.c
Figure 2: Indigenous adults in Australia reporting pneumococcal vaccination,* (Per cent) 2012‐13 NATSIHS† compared with 2004‐05 NATSIHS§
*Self‐reported as having had pneumococcal vaccination in the 5 years prior to survey (respondents were asked if they had ever had the pneumococcal vaccine and if so, was in the last 5 years).
† Standardised to the Indigenous estimated resident population living in private dwellings of Australia at 30 June 2011, based on the 2011 Census of Population and Housing.
§ Standardised to the Indigenous estimated resident population living in private dwellings of Australia at 31 December 2004, based on the 2001 Census of Population and Housing.
12 13
30
48
10 13
23
44
0
10
20
30
40
50
60
70
80
90
100
18‐49 18‐49 with riskfactor(s)
50‐64 ≥65
Coverage
%
Age (years)
2004‐05
2012‐13
Notes:a: Self-reported as having had pneumococcal vaccination in the 5 years prior to survey (respondents were asked if they had ever had the pneumococcal vaccine
and if so, was in the last 5 years).b: Standardised to the Indigenous estimated resident population living in private dwellings of Australia at 30 June 2011, based on the 2011 Census of Population
and Housing.c: Standardised to the Indigenous estimated resident population living in private dwellings of Australia at 31 December 2004, based on the 2001 Census of
Population and Housing.
562 Australian and New Zealand Journal of Public Health 2019 vol. 43 no. 6© 2019 The Authors
and should not affect comparability of data over time. The study was based on self-reported data, which has some limitations. The long recall period may have posed difficulties for some respondents, particularly those who have irregular influenza vaccinations, and for recalling pneumococcal vaccinations, which could have been given up to five years prior. Studies have examined the validity of self report in elderly patients and found self report of influenza vaccination to be highly sensitive (94–100%) and moderately specific (56–90%),23-25 while self report of pneumococcal vaccination has been found to be a less sensitive (97–74%) and moderately specific (ranged from 95–53%) measure of vaccination status.23-26
Implications for public health
Regular, frequent and reliable coverage data are urgently needed to monitor and assist vaccination program delivery efforts to Indigenous communities.
Conclusions
Indigenous adult vaccination coverage remains at unacceptably low levels. In the eight years between national health surveys, coverage has declined in some areas, namely for pneumococcal vaccination across all age groups ≥18 years, and pneumococcal and influenza vaccination in remote areas (50–64-year-olds). There is little evidence of an impact of funding influenza vaccine for Indigenous adults without medical risk factors in 2010, with only small improvements in influenza vaccination coverage in the 18–49 years age group. Regular, frequent and reliable coverage data are urgently needed to draw attention to this issue and to monitor and assist program delivery efforts.
References 1. Li-Kim-Moy J, Yin JK, Patel C, et al. Australian vaccine
preventable disease epidemiological review series: Influenza 2006 to 2015. Commun Dis Intell Q Rep. 2016;40(4):e482-95.
2. Naidu L, Chiu C, Habig A, et al. Vaccine preventable diseases and vaccination coverage in Aboriginal and Torres Strait Islander people, Australia 2006-2010. Commun Dis Intell Q Rep. 2013;37 Suppl:1-95.
3. Australian Indigenous InfoNet. Overview of Australian Aboriginal and Strait Islander Health Status 2016 [Internet]. Perth (AUST): Edith Cowan University; 2017 [cited 2018 Aug 1]. Available from: https://healthinfonet.ecu.edu.au/key-resources/publications/?id=32785&title=Overview+of+Australian+Aboriginal+and+Torres+Strait+Islander+health+status+2016
4. Menzies R, Turnour C, Chiu C, McIntyre P. Vaccine preventable diseases and vaccination coverage in Aboriginal and Torres Strait Islander people, Australia 2003 to 2006. Commun Dis Intell Q Rep. 2008;32 Suppl:2-67.
5. NNDSS Annual Report Working Group. Australia’s notifiable disease status, 2014: Annual report of the National Notifiable Diseases Surveillance System. Commun Dis Intell Q Rep. 2016;40(1):e48-145.
6. Australian Technical Advisory Group on Immunisation. Australian Immunisation Handbook. 10th ed. Canberra (AUST): Australian Department of Health; 2018.
7. Moberley S, Holden J, Tatham D, Andrews. Vaccines for preventing pneumococcal infection in adults. Cochrane Database of Syst Rev. 2013;(1.):CD000422.
8. Demicheli V, Jefferson T, Ferroni E, Rivetti A, Di Pietrantonj C. Vaccines for preventing influenza in healthy adults. Cochrane Database of Syst Rev. 2018;(2):CD001269.
9. Australian Bureau of Statistics. 4727.0.55.002 - Australian Aboriginal and Torres Strait Islander Health Survey: Users’ Guide, 2012-13 [Internet]. Canberra (AUST): ABS; 2013 [cited 2018 Aug 1]. Available from: http://www.abs.gov.au/ausstats/[email protected]/Lookup/4727.0.55.002Chapter4002012-13
10. Australian Bureau of Statistics. 4715.0.55.004 - National Aboriginal and Torres Strait Islander Health Survey: Users’ Guide, 2004-05 [Internet]. Canberra (AUST): ABS; 2006 [cited 2018 Aug 1]. Available from: http://www.ausstats.abs.gov.au/Ausstats/subscriber.nsf/0/8B24B5C90B33D2BFCA257164007FCC1D/$File/4715055004_2004-05.pdf
11. Australian Bureau of Statistics. 1270.0.55.001 - Australian Statistical Geography Standard (ASGS) [Internet]. Canberra (AUST): ABS; 2010 [cited 2018 Aug 1]. Available from: http://www.abs.gov.au/AUSSTATS/[email protected]/DetailsPage/1270.0.55.001July%202011?OpenDocument
12. Australian Bureau of Statistics. Australian Standard Geographical Classification (ASGC) [Internet]. Canberra (AUST): ABS; 2011 [cited 2018 Aug 1]. Available from: http://www.abs.gov.au/ausstats/[email protected]/mf/1216.0
13. Armitage P, Berry G, Matthews JNS. Statistical Methods in Medical Research. Malden (MA): Blackwell Science; 2002.
14. Boyle P, Parkin DM. Statistical methods for registries. In: Jensen OM, Parkin DM, MacLennan R, et al, editors. Cancer Registration: Principles and Methods. Lyon (FRA): IARC; 1991. p. 126-58.
15. Centers for Disease Control and Prevention. Flu Vaccination Coverage, United States, 2014-15 Influenza Season [Internet]. Washington (DC): United States Department of Health and Human Services; 2015 [cited 2018 Aug 1]. Available from: https://www.cdc.gov/flu/fluvaxview/coverage-1415estimates.htm
16. Centers for Disease Control and Prevention. Flu Vaccination Coverage, United States, 2015-16 Influenza Season [Internet]. Washington (DC): United States Department of Health and Human Services; 2016 [cited 2018 Aug 1]. Available from: https://www.cdc.gov/flu/fluvaxview/coverage-1516estimates.htm
17. La EM, Trantham L, Kurosky SK, et al. An analysis of factors associated with influenza, pneumoccocal, Tdap, and herpes zoster vaccine uptake in the US adult population and corresponding inter-state variability. Hum Vaccin Immunother. 2018;14(2):430-41.
18. Jimenez-Garcia R, Jimenez I, Garrido PC, et al. Coverage and predictors of influenza vaccination among adults with diabetes in Spain. Diabetes Res Clin Pract. 2008;79(3):510-17.
19. Jimenez-Garcia R, Hernandez-Barrera V, de Andres AL, et al. Gender influence in influenza vaccine uptake in Spain: Time trends analysis (1995-2006). Vaccine. 2010;28(38):6169-75.
20. Jimenez-Garcia R, Hernandez-Barrera V, Carrasco-Garrido P, et al. Predictors of influenza vaccination in adults with chronic bronchitis. Respir Med. 2009;103(10):1518-25.
21. Chen CH, Wu MS, Wu IC. Vaccination coverage and associated factors for receipt of the 23-valent pneumococcal polysaccharide vaccine in Taiwan: A nation-wide community-based study. Medicine (Baltimore). 2018;97(5):e9773.
22. World Health Organization. Global Vaccine Action Plan 2011-2020 [Internet]. Geneva (CHE): WHO; 2012 [cited 2018 Aug 1]. Available from: http://www.who.int/immunization/global_vaccine_action_plan/GVAP_doc_2011_2020/en/
23. Skull SA, Andrews RM, Byrnes GB, et al. Validity of self-reported influenza and pneumococcal vaccination status among a cohort of hospitalized elderly inpatients. Vaccine. 2007;25(25):4775-83.
24. Mangtani P, Shah A, Roberts JA. Validation of influenza and pneumococcal vaccine status in adults based on self-report. Epidemiol Infect. 2007;135(1):139-43.
25. Mac Donald R, Baken L, Nelson A, Nichol KL. Validation of self-report of influenza and pneumococcal vaccination status in elderly outpatients. Am J Prev Med. 1999;16(3):173-7.
26. Bayas JM, Izquierdo C, Ruiz L, et al. Validity of self-reported pneumococcal vaccination status in the elderly in Spain. Vaccine. 2009;27(34):4560-4.
27. World Health Organization. International Classification of Diseases and Health Related Problems (ICD-10) [Internet]. 10th ed. Geneva (CHE): WHO; 2010 [cited 2018 Aug 1]. Available from: http://apps.who.int/classifications/icd10/browse/2010/en
Supporting Information
Additional supporting information may be found in the online version of this article:
Supplementary File 1: Risk factors or medical conditions associated with an increased risk of influenza or invasive pneumococcal disease included in the analysis of the 2012–13 NATSIHS.
Supplementary File 2: Risk factors or medical conditions associated with an increased risk of influenza or invasive pneumococcal disease not included in the analysis of the 2012–13 NATSIHS.
Supplementary File 3: Risk factors or medical conditions associated with an increased risk of influenza or invasive pneumococcal disease included in the 2004–05 NATSIHS analysis but not included in the 2012–13 NATSIHS analysis.
Webster et al. Article

2019 vol. 43 no. 6 Australian and New Zealand Journal of Public Health 563© 2019 The Authors
Vaccination delivers one of the most effective strategies of preventative public health.1 Access to vaccines
is not, however, universal. This paucity in administration renders certain child populations to be at heightened risk of vaccine-preventable disease (VPD). Many of these vulnerable populations experience comparatively greater health challenges, including higher rates of notifiable disease, and associated morbidity and mortality.2-9 This increased risk may be compounded by the social determinants of health and the effects of globalisation.9-11
In Australia, the target for childhood vaccination coverage is 95%.12 This figure reflects the nation’s commitment to an accountability in disease prevention, not only within the country but also throughout the Western Pacific Region, where certain VPDs (for example, the rubeola virus) remain prevalent in some locations.13 When viewed collectively, the current Australian childhood coverage rates are reported to be 90% or above.14 However, these figures can mask coverage deficits seen in specific sub-populations and in certain geographical locations.
The national Aboriginal (inclusive of Torres Strait Islander people) childhood coverage rates are comparable to all children when measured at one, two and five years.14 In comparison, the vaccination coverage rates of Aboriginal children living in the Perth metropolitan area at 12–≤15 months and 24–≤27 months are substantially lower than their non-Aboriginal counterparts and reflect some of the lowest rates in the nation.12,14
This disparity renders this population vulnerable, at greater risk of being affected by disease outbreak, contracting a VPD, and hospitalisation. For those children with an immature or compromised immune system, acute, critical or chronic health outcomes may result.15
In WA, Aboriginal children are over-represented in terms of emergency department presentations.16 A considerable proportion of these presentations occur as a result of acute respiratory infection (ARI); many of which are preventable by vaccination.16 This feature not only impacts
the Aboriginal community, state health departments and the wider population, but is of particular concern to individuals who cannot be vaccinated or alternately have multiple co-morbidities.17
General practiceGeneral practice offers highly effective primary healthcare to the Australian population. Within this setting, providers play a key role in the provision of clinical services and evidence-based information designed to meet the healthcare needs of the community. Although jurisdictional
Barriers to vaccination service delivery within general practice: opportunity to make a sustainable difference in Aboriginal child health?Rebecca Carman,1 Lesley Andrew,1 Amanda Devine,1 Jacques Oosthuizen1
1. School of Medical and Health Sciences, Edith Cowan University, Western AustraliaCorrespondence to: Ms Rebecca Carman, School of Medical and Health Sciences, Building 21, Edith Cowan University, WA 6027; e-mail: [email protected]: May 2019; Revision requested: July 2019; Accepted: August 2019The authors have stated they have no conflict of interest.This is an open access article under the terms of the Creative Commons Attribution-NonCommercial-NoDerivs License, which permits use and distribution in any medium,
provided the original work is properly cited, the use is non-commercial and no modifications or adaptations are made.
Aust NZ J Public Health. 2019; 43:563-9; doi: 10.1111/1753-6405.12937
Abstract
Objective: To identify behavioural barriers of service provision within general practice that may be impacting the vaccination coverage rates of Aboriginal children in Perth, Western Australia (WA).
Methods: A purposive developed survey was distributed to 316 general practices across Perth and three key informant interviews were conducted using a mixed-methods approach.
Results: Of the surveyed participants (n=101), 67.4% were unaware of the low vaccination coverage in Aboriginal children; 64.8% had not received cultural sensitivity training in their workplace and 46.8% reported having inadequate time to follow up overdue child vaccinations. Opportunistic vaccination was not routinely performed by 30.8% of participants. Key themes identified in the interviews were awareness, inclusion and cultural safety.
Conclusion: Inadequate awareness of the current rates, in association with a lack of cultural safety training, follow-up and opportunistic practice, may be preventing greater vaccination uptake in Aboriginal children in Perth. Cultural safety is a critical component of the acceptability and accessibility of services; lack of awareness may restrict the development of strategies designed to equitably address low coverage.
Implications: The findings of this study provide an opportunity to raise awareness among clinicians in general practice and inform future strategies to equitably deliver targeted vaccination services to Aboriginal children.
Key words: immunisation, Aboriginal children, coverage rates, Perth, Western Australia, general practice, service delivery, barriers, vaccination
INDIGENOUS HEALTH

564 Australian and New Zealand Journal of Public Health 2019 vol. 43 no. 6© 2019 The Authors
Carman et al. Article
models of service delivery exist, the influence of general practice in the uptake of childhood immunisation, both planned and opportunistic, cannot be underestimated.18 In Australia, general practice delivers a high proportion of vaccination services to Aboriginal and non-Aboriginal adults and children.19 Vaccination provision is, however, a complex and rapidly-changing field, requiring an extensive knowledge of the vaccines administered and a clear understanding of the populations they are targeting.18,20
This research was conducted from February to November 2018, in response to the sub-optimal vaccination coverage rates of Aboriginal children living in Perth. The aim of the study was to identify behavioural barriers among general practitioners (GPs) and practice nurses (PNs) working within general practice, which may be preventing greater levels of access and higher rates of coverage in the studied population.
Theoretical framework The Theory of Planned Behavior (TPB) provided a structural framework for survey development.21 The theory posits that the four proximal constructs: attitude; subjective norm; behavioural control; and intention heavily influence the likelihood of an outcome behaviour occurring.21 The outcome behaviour in this study is effective vaccination services provided to Aboriginal children living in Perth. Determining the relative influence of these four constructs provides an insightful interpretation of the range of barriers limiting vaccination coverage and the behaviour in which they are situated. Within the studied setting, the resultant findings will serve to inform and enhance future clinical practice.22
Methods
Survey development and implementationThe study used a mixed methods approach to gain a greater understanding of the current immunisation services delivered to Aboriginal children attending general practice. The survey tool was developed following an analysis of the published literature and selection of an appropriate theory. During survey development, consultation was conducted with Aboriginal and non-Aboriginal health professionals across a variety of settings: general practice, child health and the WA Department of Health.
Discussions with an interstate Aboriginal vaccination officer, a national Aboriginal immunisation research officer and a general practitioner based in the university setting were also undertaken.
Consultation with members of the Aboriginal community was a critical inclusion throughout the study to ensure that all content was relevant to the setting, population and situation and was culturally appropriate. The survey was piloted (n=10) for content and face validity with medical and science and nursing academics, a general practitioner, an epidemiologist within communicable disease control, a child health nurse, an Aboriginal child health clinical manager, clinical management staff in child and adolescent health, and a clinical research manager in child and adolescent health. Feedback received was used to refine the data collection instrument prior to final dissemination.
The survey consisted of demographic questions to determine the participants’ current role, highest level of education achieved, length of time working in general practice and frequency of vaccinating Aboriginal children. This was followed by a series of statements within each of the four proximal constructs of the chosen theory (TPB).21 Statements within each construct were used to examine whether identifiable barriers and associated behavioural traits existed. A five-point Likert scale was used to gauge the providers’ levels of agreement to each statement (1=strongly agree to 5=strongly disagree). Data displayed in Tables 1–4 were analysed using the five-point scale and collapsed in presentation to represent agree, disagree and uncertain. In the interpretation of results, the reporting of uncertain by providers in statements involving specific behavioural tasks inferred that an action had not been performed.
Survey inclusion criteria and recruitment The inclusion criteria for the survey consisted of a number of pre-determined characteristics. These were: the participants were either a GP or PN; and they were currently working in a general practice setting that was located in the Perth metropolitan area. Recruitment of the participants occurred through direct email request to each general practice (n=316); practice emails were obtained via the WA Department of Health consumer website and consisted of practices that had bulk-billing facilities.
Survey disseminationA survey link to the Qualtrics online platform was initially emailed to 316 general practices in Perth during February 2018. Access remained open until May 2018. Information pertaining to the study, the intended benefits, potential risks and consent to participate were provided through the online survey and prior to survey commencement. A reminder was sent to all general practices three weeks after the initial dissemination to encourage participants who had commenced the survey but had not yet completed it to finalise their responses.
Survey data analysisAll survey data collected were exported into IBM SPSS Version 25 (IBM, New York, USA). Descriptive statistics were used to describe the demographics of the survey sample and the subsequent responses. To determine the differences in the distribution of responses by provider type (GP or PN), statistical analysis was applied using the nonparametric Mann-Whitney U test; a level of significance was set at p<0.05 using the asymptotic p-value.
The effect size for nonparametric analysis (r) was also calculated; 0.1 indicates a small effect, 0.3 a medium effect and 0.5 a large effect.23 The formula used to calculate this figure was r= z/√N.23
Interview development and implementationThe aim of the qualitative component of the study was to investigate whether there was an awareness of the sub-optimal vaccination coverage in Aboriginal children living in Perth. It also sought to determine what strategies were being implemented to address this critical issue, if awareness was evident. The qualitative questions were initially piloted with one general practitioner who was also an academic in the university setting. This process informed the refinement of questions generated and the development of subsequent probes.
Interview processThe interview participants were purposively selected personnel recruited via direct email request. Following pilot testing, three face-to-face, semi-structured interviews were conducted with participants who had previously been involved in a WA-based immunisation working group. The sample consisted of a GP who had worked in Perth for more than 20 years, a senior manager
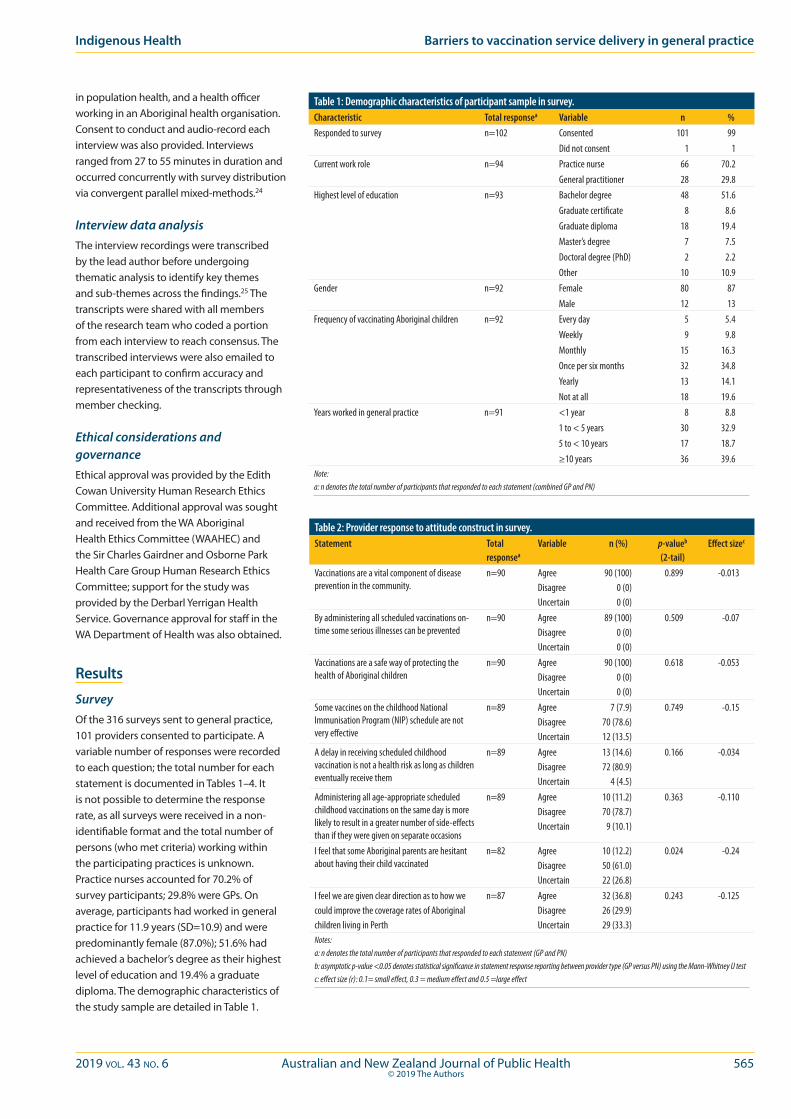
2019 vol. 43 no. 6 Australian and New Zealand Journal of Public Health 565© 2019 The Authors
Indigenous Health Barriers to vaccination service delivery in general practice
in population health, and a health officer working in an Aboriginal health organisation. Consent to conduct and audio-record each interview was also provided. Interviews ranged from 27 to 55 minutes in duration and occurred concurrently with survey distribution via convergent parallel mixed-methods.24
Interview data analysisThe interview recordings were transcribed by the lead author before undergoing thematic analysis to identify key themes and sub-themes across the findings.25 The transcripts were shared with all members of the research team who coded a portion from each interview to reach consensus. The transcribed interviews were also emailed to each participant to confirm accuracy and representativeness of the transcripts through member checking.
Ethical considerations and governanceEthical approval was provided by the Edith Cowan University Human Research Ethics Committee. Additional approval was sought and received from the WA Aboriginal Health Ethics Committee (WAAHEC) and the Sir Charles Gairdner and Osborne Park Health Care Group Human Research Ethics Committee; support for the study was provided by the Derbarl Yerrigan Health Service. Governance approval for staff in the WA Department of Health was also obtained.
Results
SurveyOf the 316 surveys sent to general practice, 101 providers consented to participate. A variable number of responses were recorded to each question; the total number for each statement is documented in Tables 1–4. It is not possible to determine the response rate, as all surveys were received in a non-identifiable format and the total number of persons (who met criteria) working within the participating practices is unknown. Practice nurses accounted for 70.2% of survey participants; 29.8% were GPs. On average, participants had worked in general practice for 11.9 years (SD=10.9) and were predominantly female (87.0%); 51.6% had achieved a bachelor’s degree as their highest level of education and 19.4% a graduate diploma. The demographic characteristics of the study sample are detailed in Table 1.
Table 1: Demographic characteristics of participant sample in survey.Characteristic Total responsea Variable n %Responded to survey n=102 Consented 101 99
Did not consent 1 1Current work role n=94 Practice nurse 66 70.2
General practitioner 28 29.8Highest level of education n=93 Bachelor degree 48 51.6
Graduate certificate 8 8.6Graduate diploma 18 19.4Master’s degree 7 7.5Doctoral degree (PhD) 2 2.2Other 10 10.9
Gender n=92 Female 80 87Male 12 13
Frequency of vaccinating Aboriginal children n=92 Every day 5 5.4Weekly 9 9.8Monthly 15 16.3Once per six months 32 34.8Yearly 13 14.1Not at all 18 19.6
Years worked in general practice n=91 <1 year 8 8.81 to < 5 years 30 32.95 to < 10 years 17 18.7≥10 years 36 39.6
Note:a: n denotes the total number of participants that responded to each statement (combined GP and PN)
Table 2: Provider response to attitude construct in survey.Statement Total
responsea
Variable n (%) p-valueb (2-tail)
Effect sizec
Vaccinations are a vital component of disease prevention in the community.
n=90 AgreeDisagreeUncertain
90 (100)0 (0)0 (0)
0.899 -0.013
By administering all scheduled vaccinations on-time some serious illnesses can be prevented
n=90 AgreeDisagreeUncertain
89 (100)0 (0)0 (0)
0.509 -0.07
Vaccinations are a safe way of protecting the health of Aboriginal children
n=90 AgreeDisagreeUncertain
90 (100)0 (0)0 (0)
0.618 -0.053
Some vaccines on the childhood National Immunisation Program (NIP) schedule are not very effective
n=89 AgreeDisagreeUncertain
7 (7.9)70 (78.6)12 (13.5)
0.749 -0.15
A delay in receiving scheduled childhood vaccination is not a health risk as long as children eventually receive them
n=89 AgreeDisagreeUncertain
13 (14.6)72 (80.9)
4 (4.5)
0.166 -0.034
Administering all age-appropriate scheduled childhood vaccinations on the same day is more likely to result in a greater number of side-effects than if they were given on separate occasions
n=89 AgreeDisagreeUncertain
10 (11.2)70 (78.7)
9 (10.1)
0.363 -0.110
I feel that some Aboriginal parents are hesitant about having their child vaccinated
n=82 AgreeDisagreeUncertain
10 (12.2)50 (61.0)22 (26.8)
0.024 -0.24
I feel we are given clear direction as to how we could improve the coverage rates of Aboriginalchildren living in Perth
n=87 AgreeDisagreeUncertain
32 (36.8)26 (29.9)29 (33.3)
0.243 -0.125
Notes:a: n denotes the total number of participants that responded to each statement (GP and PN)b: asymptotic p-value <0.05 denotes statistical significance in statement response reporting between provider type (GP versus PN) using the Mann-Whitney U testc: effect size (r): 0.1= small effect, 0.3 = medium effect and 0.5 =large effect
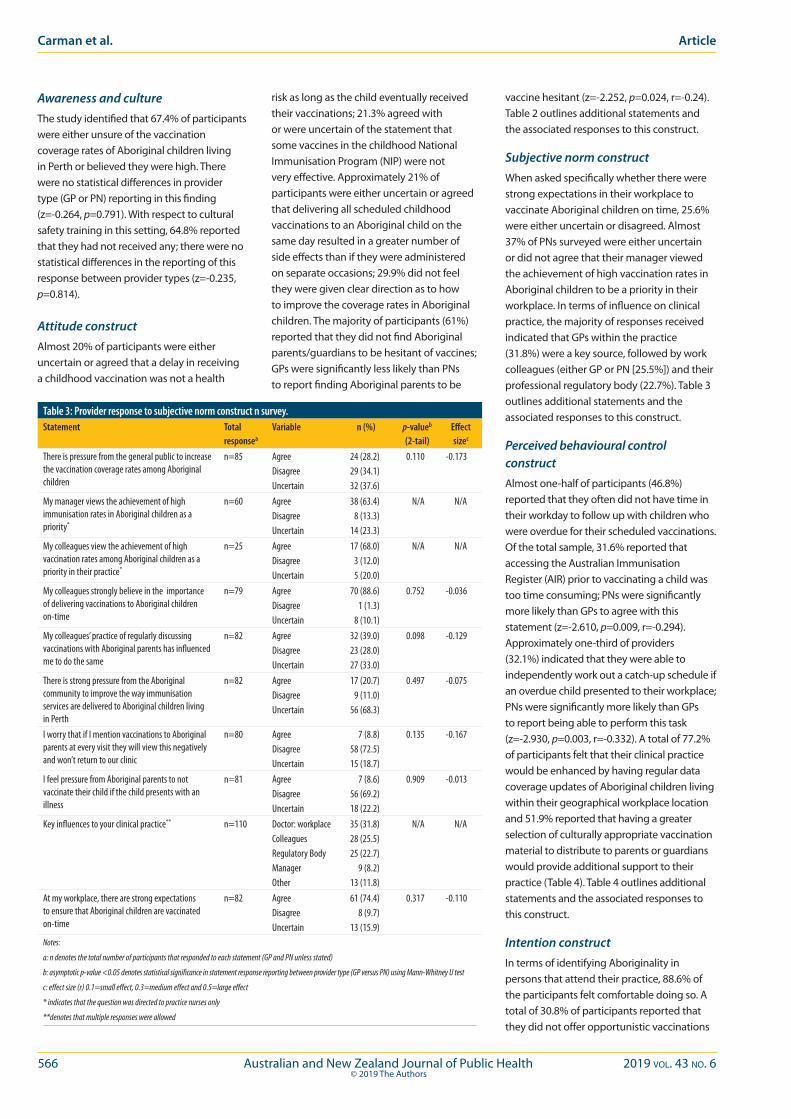
566 Australian and New Zealand Journal of Public Health 2019 vol. 43 no. 6© 2019 The Authors
vaccine hesitant (z=-2.252, p=0.024, r=-0.24). Table 2 outlines additional statements and the associated responses to this construct.
Subjective norm constructWhen asked specifically whether there were strong expectations in their workplace to vaccinate Aboriginal children on time, 25.6% were either uncertain or disagreed. Almost 37% of PNs surveyed were either uncertain or did not agree that their manager viewed the achievement of high vaccination rates in Aboriginal children to be a priority in their workplace. In terms of influence on clinical practice, the majority of responses received indicated that GPs within the practice (31.8%) were a key source, followed by work colleagues (either GP or PN [25.5%]) and their professional regulatory body (22.7%). Table 3 outlines additional statements and the associated responses to this construct.
Perceived behavioural control constructAlmost one-half of participants (46.8%) reported that they often did not have time in their workday to follow up with children who were overdue for their scheduled vaccinations. Of the total sample, 31.6% reported that accessing the Australian Immunisation Register (AIR) prior to vaccinating a child was too time consuming; PNs were significantly more likely than GPs to agree with this statement (z=-2.610, p=0.009, r=-0.294). Approximately one-third of providers (32.1%) indicated that they were able to independently work out a catch-up schedule if an overdue child presented to their workplace; PNs were significantly more likely than GPs to report being able to perform this task (z=-2.930, p=0.003, r=-0.332). A total of 77.2% of participants felt that their clinical practice would be enhanced by having regular data coverage updates of Aboriginal children living within their geographical workplace location and 51.9% reported that having a greater selection of culturally appropriate vaccination material to distribute to parents or guardians would provide additional support to their practice (Table 4). Table 4 outlines additional statements and the associated responses to this construct.
Intention constructIn terms of identifying Aboriginality in persons that attend their practice, 88.6% of the participants felt comfortable doing so. A total of 30.8% of participants reported that they did not offer opportunistic vaccinations
Awareness and cultureThe study identified that 67.4% of participants were either unsure of the vaccination coverage rates of Aboriginal children living in Perth or believed they were high. There were no statistical differences in provider type (GP or PN) reporting in this finding (z=-0.264, p=0.791). With respect to cultural safety training in this setting, 64.8% reported that they had not received any; there were no statistical differences in the reporting of this response between provider types (z=-0.235, p=0.814).
Attitude constructAlmost 20% of participants were either uncertain or agreed that a delay in receiving a childhood vaccination was not a health
risk as long as the child eventually received their vaccinations; 21.3% agreed with or were uncertain of the statement that some vaccines in the childhood National Immunisation Program (NIP) were not very effective. Approximately 21% of participants were either uncertain or agreed that delivering all scheduled childhood vaccinations to an Aboriginal child on the same day resulted in a greater number of side effects than if they were administered on separate occasions; 29.9% did not feel they were given clear direction as to how to improve the coverage rates in Aboriginal children. The majority of participants (61%) reported that they did not find Aboriginal parents/guardians to be hesitant of vaccines; GPs were significantly less likely than PNs to report finding Aboriginal parents to be
Table 3: Provider response to subjective norm construct n survey.Statement Total
responsea
Variable n (%) p-valueb (2-tail)
Effect sizec
There is pressure from the general public to increase the vaccination coverage rates among Aboriginal children
n=85 AgreeDisagreeUncertain
24 (28.2)29 (34.1)32 (37.6)
0.110 -0.173
My manager views the achievement of high immunisation rates in Aboriginal children as a priority*
n=60 AgreeDisagreeUncertain
38 (63.4)8 (13.3)
14 (23.3)
N/A N/A
My colleagues view the achievement of high vaccination rates among Aboriginal children as a priority in their practice*
n=25 AgreeDisagreeUncertain
17 (68.0)3 (12.0)5 (20.0)
N/A N/A
My colleagues strongly believe in the importance of delivering vaccinations to Aboriginal children on-time
n=79 AgreeDisagreeUncertain
70 (88.6)1 (1.3)
8 (10.1)
0.752 -0.036
My colleagues’ practice of regularly discussing vaccinations with Aboriginal parents has influenced me to do the same
n=82 AgreeDisagreeUncertain
32 (39.0)23 (28.0)27 (33.0)
0.098 -0.129
There is strong pressure from the Aboriginal community to improve the way immunisation services are delivered to Aboriginal children living in Perth
n=82 AgreeDisagreeUncertain
17 (20.7)9 (11.0)
56 (68.3)
0.497 -0.075
I worry that if I mention vaccinations to Aboriginal parents at every visit they will view this negatively and won’t return to our clinic
n=80 AgreeDisagreeUncertain
7 (8.8)58 (72.5)15 (18.7)
0.135 -0.167
I feel pressure from Aboriginal parents to not vaccinate their child if the child presents with an illness
n=81 AgreeDisagreeUncertain
7 (8.6)56 (69.2)18 (22.2)
0.909 -0.013
Key influences to your clinical practice** n=110 Doctor: workplaceColleaguesRegulatory BodyManagerOther
35 (31.8)28 (25.5)25 (22.7)
9 (8.2)13 (11.8)
N/A N/A
At my workplace, there are strong expectations to ensure that Aboriginal children are vaccinated on-time
n=82 AgreeDisagreeUncertain
61 (74.4)8 (9.7)
13 (15.9)
0.317 -0.110
Notes:
a: n denotes the total number of participants that responded to each statement (GP and PN unless stated)
b: asymptotic p-value <0.05 denotes statistical significance in statement response reporting between provider type (GP versus PN) using Mann-Whitney U test
c: effect size (r) 0.1=small effect, 0.3=medium effect and 0.5=large effect
* indicates that the question was directed to practice nurses only
**denotes that multiple responses were allowed
Carman et al. Article
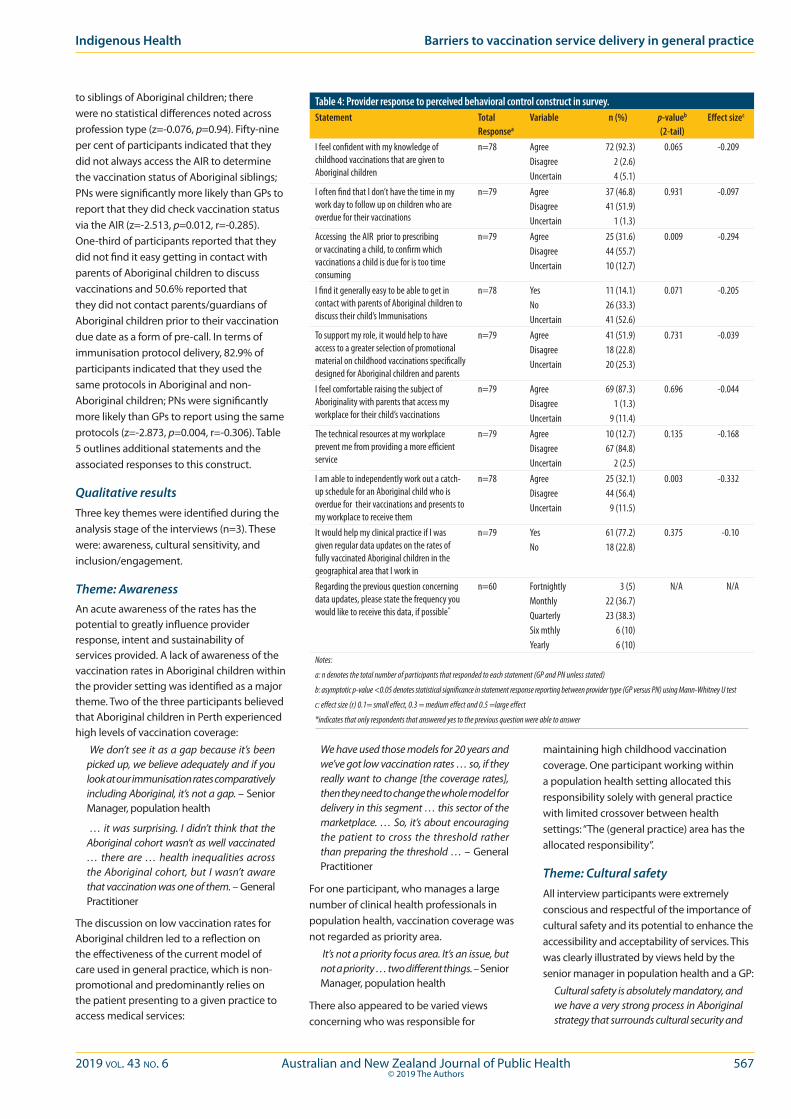
2019 vol. 43 no. 6 Australian and New Zealand Journal of Public Health 567© 2019 The Authors
to siblings of Aboriginal children; there were no statistical differences noted across profession type (z=-0.076, p=0.94). Fifty-nine per cent of participants indicated that they did not always access the AIR to determine the vaccination status of Aboriginal siblings; PNs were significantly more likely than GPs to report that they did check vaccination status via the AIR (z=-2.513, p=0.012, r=-0.285). One-third of participants reported that they did not find it easy getting in contact with parents of Aboriginal children to discuss vaccinations and 50.6% reported that they did not contact parents/guardians of Aboriginal children prior to their vaccination due date as a form of pre-call. In terms of immunisation protocol delivery, 82.9% of participants indicated that they used the same protocols in Aboriginal and non-Aboriginal children; PNs were significantly more likely than GPs to report using the same protocols (z=-2.873, p=0.004, r=-0.306). Table 5 outlines additional statements and the associated responses to this construct.
Qualitative results Three key themes were identified during the analysis stage of the interviews (n=3). These were: awareness, cultural sensitivity, and inclusion/engagement.
Theme: AwarenessAn acute awareness of the rates has the potential to greatly influence provider response, intent and sustainability of services provided. A lack of awareness of the vaccination rates in Aboriginal children within the provider setting was identified as a major theme. Two of the three participants believed that Aboriginal children in Perth experienced high levels of vaccination coverage:
We don’t see it as a gap because it’s been picked up, we believe adequately and if you look at our immunisation rates comparatively including Aboriginal, it’s not a gap. – Senior Manager, population health
… it was surprising. I didn’t think that the Aboriginal cohort wasn’t as well vaccinated … there are … health inequalities across the Aboriginal cohort, but I wasn’t aware that vaccination was one of them. – General Practitioner
The discussion on low vaccination rates for Aboriginal children led to a reflection on the effectiveness of the current model of care used in general practice, which is non-promotional and predominantly relies on the patient presenting to a given practice to access medical services:
We have used those models for 20 years and we’ve got low vaccination rates … so, if they really want to change [the coverage rates], then they need to change the whole model for delivery in this segment … this sector of the marketplace. … So, it’s about encouraging the patient to cross the threshold rather than preparing the threshold … – General Practitioner
For one participant, who manages a large number of clinical health professionals in population health, vaccination coverage was not regarded as priority area.
It’s not a priority focus area. It’s an issue, but not a priority … two different things. – Senior Manager, population health
There also appeared to be varied views concerning who was responsible for
maintaining high childhood vaccination coverage. One participant working within a population health setting allocated this responsibility solely with general practice with limited crossover between health settings: “The (general practice) area has the allocated responsibility”.
Theme: Cultural safetyAll interview participants were extremely conscious and respectful of the importance of cultural safety and its potential to enhance the accessibility and acceptability of services. This was clearly illustrated by views held by the senior manager in population health and a GP:
Cultural safety is absolutely mandatory, and we have a very strong process in Aboriginal strategy that surrounds cultural security and
Table 4: Provider response to perceived behavioral control construct in survey.Statement Total
Responsea
Variable n (%) p-valueb (2-tail)
Effect sizec
I feel confident with my knowledge of childhood vaccinations that are given to Aboriginal children
n=78 AgreeDisagreeUncertain
72 (92.3)2 (2.6)4 (5.1)
0.065 -0.209
I often find that I don’t have the time in my work day to follow up on children who are overdue for their vaccinations
n=79 AgreeDisagreeUncertain
37 (46.8)41 (51.9)
1 (1.3)
0.931 -0.097
Accessing the AIR prior to prescribing or vaccinating a child, to confirm which vaccinations a child is due for is too time consuming
n=79 AgreeDisagreeUncertain
25 (31.6)44 (55.7)10 (12.7)
0.009 -0.294
I find it generally easy to be able to get in contact with parents of Aboriginal children to discuss their child’s Immunisations
n=78 YesNoUncertain
11 (14.1)26 (33.3)41 (52.6)
0.071 -0.205
To support my role, it would help to have access to a greater selection of promotional material on childhood vaccinations specifically designed for Aboriginal children and parents
n=79 AgreeDisagreeUncertain
41 (51.9)18 (22.8)20 (25.3)
0.731 -0.039
I feel comfortable raising the subject of Aboriginality with parents that access my workplace for their child’s vaccinations
n=79 AgreeDisagreeUncertain
69 (87.3)1 (1.3)
9 (11.4)
0.696 -0.044
The technical resources at my workplace prevent me from providing a more efficient service
n=79 AgreeDisagreeUncertain
10 (12.7)67 (84.8)
2 (2.5)
0.135 -0.168
I am able to independently work out a catch-up schedule for an Aboriginal child who is overdue for their vaccinations and presents to my workplace to receive them
n=78 AgreeDisagreeUncertain
25 (32.1)44 (56.4)
9 (11.5)
0.003 -0.332
It would help my clinical practice if I was given regular data updates on the rates of fully vaccinated Aboriginal children in the geographical area that I work in
n=79 YesNo
61 (77.2)18 (22.8)
0.375 -0.10
Regarding the previous question concerning data updates, please state the frequency you would like to receive this data, if possible*
n=60 FortnightlyMonthlyQuarterlySix mthlyYearly
3 (5)22 (36.7)23 (38.3)
6 (10)6 (10)
N/A N/A
Notes:
a: n denotes the total number of participants that responded to each statement (GP and PN unless stated)
b: asymptotic p-value <0.05 denotes statistical significance in statement response reporting between provider type (GP versus PN) using Mann-Whitney U test
c: effect size (r) 0.1= small effect, 0.3 = medium effect and 0.5 =large effect
*indicates that only respondents that answered yes to the previous question were able to answer
Indigenous Health Barriers to vaccination service delivery in general practice

568 Australian and New Zealand Journal of Public Health 2019 vol. 43 no. 6© 2019 The Authors
Aboriginal people, it’s been most successful, most effective when we have got AHWs to do it. – General Practitioner
What you want is Aboriginal people in mainstream services across the board. … Having Aboriginal led mainstream programs ….. is far more important and improves access. – Senior Manager, population health
If the general practices did have an AHW in the areas of high Aboriginal population, it just makes it that little bit more culturally appropriate. – Health Officer, Aboriginal health organisation
Discussion This research set out to explore whether behavioural traits were possibly preventing greater vaccination coverage in the studied population. Although a higher number of PNs in comparison to GPs responded to the survey, it is well established that PNs within this setting administer a high proportion of vaccinations; as such, they are well placed to positively influence uptake and provision.18,26,27
All survey respondents indicated a belief that vaccination was a vital component of disease prevention. The majority of these participants also reported feeling satisfied with their knowledge of the childhood NIP and the additional vaccines offered to Aboriginal children. However, despite these findings, a number of key factors may be hampering sustainable coverage improvements. Critically, the majority of participants who completed the survey were not aware of the low coverage rates of Aboriginal children living in this location; this was also reflected in the interview data with two of the three participants interviewed having this belief. Awareness is key to the development and resourcing of targeted programs designed to redress disparity.
Engagement with patients is a critical component of general practive service provision. It was identified that almost two-thirds of providers had not completed any cultural safety training while working in this setting. This feature may compromise the acceptability and assessabilty of services. Moreover, it could lead to a disengagement of services, reduce the ability to opportunistically vaccinate and may potentially affect other areas of health, further to vaccination. The published literature suggests that vaccination timeliness may be a feature of Aboriginal child health.28-30 A delay in receiving the required vaccines at the recommended age may compromise a child’s health (acute and
respect … it’s about changing attitude and culture and respectful relationships … It’s about respect, it’s about listening … it’s about understanding the trauma and the effect of trauma. … it’s not just about doing the training and ticking the box, it’s far broader than that. – Senior Manager, population health
Vaccinate … in a safe environment that is non-confrontational … and non-judgemental. – General Practitioner
There also seemed to be a focus on equality rather than equity in service provision, with two participants stating they used the same vaccination protocols for Aboriginal and non-Aboriginal children:
There is no different model in my clinic. We try and be respectful to everyone that comes in and we treat them all the same. – General Practitioner
When discussing equity, one participant working in Aboriginal health added in this
perpective with respect to protocol and resource allocation:
… it’s a tricky one though because I think that a lot of GPs don’t want to be (seen as) racist and have almost the opposite effect. – Health Officer, Aboriginal health organisation
Theme: InclusionAnother key theme identified was inclusion. The involvement of the Aboriginal population in the process of supporting vaccination rates was identified as a clear sub-theme. This included engagement with members of the Aboriginal community and the use of Aboriginal Health Workers (AHW) or clinicians in mainstream settings to address low coverage and overdue vaccinations and to provide health promotion and education on the merits of vaccination to parents or guardians.
I think the reality is that anytime we have really needed to intervene with the health of
Table 5: Provider response to intention construct in survey.Statement Total
responsea
Variable n (%) p-valueb (2-tail)
Effect sizec
If the parents of an Aboriginal child do not present for their child’s immunisation appointment I contact them that day to re- schedule
n=78 AgreeDisagree/uncertain
43 (55.1)35 (44.9)
0.917 -0.012
I find it generally easy to be able to get in contact with parents of Aboriginal children to discuss their child’s immunisations
n=78 YesNo Uncertain
11 (14.1)26 (33.3)41 (52.6)
0.071 -0.205
In my workplace, we are encouraged to try new strategies to increase the proportion of fully vaccinated Aboriginal children in our geographical work place*
n=54 AgreeDisagree/Uncertain
16 (29.6)38 (70.4)
N/A N/A
In my workplace, we often try new strategies to increase the proportion of fully vaccinated Aboriginal children in our geographical work area*
n=24 AgreeDisagreeUncertain
1 (4.2)18 (75)5 (20.8)
N/A N/A
I opportunistically offer vaccinations to siblings of Aboriginal children that I see at my workplace
n=78 AgreeDisagree/Uncertain
54 (69.2)24 (30.8)
0.940 -0.009
At my workplace we contact the parents’ of Aboriginal children prior to their vaccination due date to alert them of their child’s upcoming vaccinations
n=77 AgreeDisagree/Uncertain
38 (49.4)39 (50.6)
0.959 -0.006
Making a follow up appointment for an Aboriginal child to receive their next vaccination on the day that I prescribe or administer a vaccination is something I always do
n=76 AgreeDisagree/Uncertain
40 (52.6)36 (47.4)
0.005 -0.323
I feel comfortable raising the subject of Aboriginality with parents that access my workplace for their child’s immunisation
n=79 AgreeDisagreeUncertain
70 (88.6)1 (1.3)8 (10.1)
0.696 -0.044
In my workplace I use the same protocols to maximise the proportion of fully vaccinated Aboriginal children as I do with non-Aboriginal children
n=88 AgreeDisagreeUncertain
73 (82.9)10 (11.4)5 (5.7)
0.004 -0.306
I always check the vaccination status of the siblings of Aboriginal children that attend my workplace via the AIR
n=78 AgreeDisagreeUncertain
32 (41.0)14 (18.0)32 (41.0)
0.012 -0.285
Notes:
a: n denotes the total number of participants that responded to each statement (GP and PN unless stated otherwise)
b: asymptotic p-value <0.05 denotes statistical significance in statement response reporting between provider type (GP versus PN) using Mann-Whitney U test
c: effect size (r): 0.1= small effect, 0.3 = medium effect and 0.5 =large effect
* indicates that the question was directed to practice nurse only
Carman et al. Article
2019 vol. 43 no. 6 Australian and New Zealand Journal of Public Health 569© 2019 The Authors
chronic) if a VPD is contracted.30 This feature reinforces the importance of opportunistic vaccination and consistent engagement.
In terms of follow-up of Aboriginal children overdue for their vaccinations, almost half of participants reported that they often did not have time in their work day to perform this task. Follow-up on overdue children may be more successfully achieved if performed by specific teams situated either within or external to the general practice setting, with an allocated responsibility of active surveillance. Our study also determined that 29.9% of survey participants did not feel they received clear instruction as to how to improve the coverage rates of Aboriginal children; greater intersectoral collaboration may strengthen capacity within this setting.11
The AIR is an important resource used to determine accurate vaccination status of children and adults, record vaccine encounters and generate reports designed to inform practice.31 The study identified that the register was perceived by almost one-third of providers as being time consuming and potentially not being used effectively to support practice. There also appeared to be some uncertainty with the applications of the AIR, with one GP reporting that they were only able to enter data into the register and not extract anything out of it.
A common theme in the qualitative approach was the inclusion of Aboriginal health clinicians in mainstream settings to facilitate an uptake in services and generate demand. The creation of specific roles designed to target low coverage combined with a strong and supportive system could potentiate robust leadership in this area. Lastly, in terms of scheduling, re-call and reminders, a number of findings may impact the current rates. More than 50% of participants reported that they did not alert parents of upcoming vaccinations, while 47.3% reported they did not make a follow-up appointment for the next vaccination when the parents or care-givers were in the practice. Greater engagement and the use of health information technology may be useful options in this setting; alternatively, the development of a WA-specific immunisation application containing alerts, vaccine information and patient-specific vaccination scheduling and reminders should also be considered.
Strengths and limitationsThe high number of combined responses received from GPs and PNs in the survey strenghtened the validity of the findings and
accounted for a considerable proportion of the overall results.
The small sample of qualitative participants may be consided a limitation of this study. The findings in this approach, however, supported and added a depth of interpretation to the survey results.32
Conclusion
Historically, there has been a paucity of research conducted on the impact of vaccination services provided to Aboriginal children within the general practice setting in Perth. This study is of importance as it contributes to the limited body of research conducted in this location. It is well understood that general practice operates within a highly pressured environment. However, key findings identified a general lack of awareness of the coverage rates and to some extent, some hesitancy surrounding the safety and effectivenss of vaccines, which could be influencing the disparity of coverage. Ongoing dedicated staff training to prioritise vaccination in this setting should strengthen capacity. A lack of cultural safety awareness in general practice may also be impacting the accessibility and acceptability of the current services provided. Specific education in this area could potentiate a change in perspective and facilitate a more supportive environment for Aboriginal families.
References1. Gram L, Soremekun S, ten Asbroek A, Manu A, O’Leary
M, Hill Z, et al. Socio-economic determinants and inequities in coverage and timeliness of early childhood immunisation in rural Ghana. Trop Med Int Health. 2014;19(7):802-11.
2. Attwood L, Rodrigues S, Winsor J, Warren S, Biviano L, Gunasekera H. Improving delivery of health care to Aboriginal and Torres Strait Islander children. J Paediatr Child Health. 2015;51(5):534-40.
3. Bitsori M, Galanakis E. Vaccine-preventable infection morbidity of patients with chronic kidney disease and cocoon vaccination strategies. Expert Rev Vaccines. 2015;14(10):1385-95.
4. Brown TIM, Moon G. Geography and global health. Geogr J. 2012;178(1):13-17.
5. Dwyer J, Boulton A, Lavoie JG, Tenbensel T, Cumming J. Indigenous peoples’ health care: New approaches to contracting and accountability at the public administration frontier. Public Manage Rev. 2014;16(8):1091-112.
6. Katz SL. A vaccine-preventable infectious disease kills half a million children annually. J Infect Dis. 2005;192(10):1679-80.
7. Lam E, Brennan M, Maina A, Diaz M. Displaced populations due to humanitarian emergencies and its impact on global eradication and elimination of vaccine-preventable diseases. Confl Health. 2016;10:27 eCollection 2016.
8. Levin R, Herbert M. The experience of urban Aboriginals with health care services in Canada. Soc Work Health Care. 2004;39(1-2):165-79.
9. Naidu L, Chiu C, Habig A, Lowbridge C, Jayasinghe S, Wang H, et al. Vaccine preventable diseases and vaccination coverage in Aboriginal and Torres Strait Islander people, Australia 2006-2010. Commun Dis Intell Q Rep. 2013;37(Suppl):1-95.
10. Andrus JK, Cochi SL, Cooper LZ, Klein JD. Combining global elimination of measles and rubella with strengthening of health systems in developing countries. Health Aff. 2016;35(2):327-33.
11. Baum F. The New Public Health. 4th ed. South Melbourne (AUST): Oxford University Press; 2016.
12. Australian Department of Health. National Immunisation Program. Canberra (AUST): Government of Australia; 2018.
13. Hennessey K, Schluter WW, Wang X, Boualam L, Jee Y, Mendoza-Aldana J, et al. Are we there yet? Assessing achievement of vaccine-preventable disease goals in WHO’s Western Pacific Region. Vaccine. 2014;32(34):4259-66.
14. Australian Institute of Health and Welfare. Healthy Communities: Immunisation Rates for Children in 2015-2016. Canberra (AUST): AIHW; 2017.
15. Abbott P, Menzies R, Davison J, Moore L, Wang H. Improving immunisation timeliness in Aboriginal children through personalised calendars. BMC Public Health. 2013;13:598.
16. Barnes R, Blyth CC, de Klerk N, Lee WH, Borland ML, Richmond P, et al. Geographical disparities in emergency department presentations for acute respiratory infections and risk factors for presenting: A population-based cohort study of Western Australian children. BMJ Open. 2019;9(2):e025360.
17. Li-Kim-Moy J, Yin JK, Patel C, Beard FH, Chiu C, Macartney KK, et al. Australian vaccine preventable disease epidemiological review series: Influenza 2006 to 2015. Commun Dis Intell Q Rep. 2016;40(4):e482-e95.
18. Halcomb E, Hickman L. Attitudes and immunisation practices of Australian general practice nurses. Contemp Nurse. 2016;52(4):440-6.
19. Harris M, Webster V, Jalaludin B, Jackson Pulver LR, Comino EJ. Immunisation coverage among a birth cohort of Aboriginal infants in an urban community. J Paediatr Child Health. 2014;50(4):306-13.
20. Thomas S, Cashman P, Islam F, Baker L, Clark K, Leask J, et al. Tailoring immunisation service delivery in a disadvantaged community in Australia; views of health providers and parents. Vaccine. 2018;36(19):2596-603.
21. Ajzen I. The theory of planned behavior. Organ Behav Hum Decis Process. 1991;50(2):179.
22. Pielak KL, McIntyre CC, Tu AW, Remple VP, Halperin B, Buxton JA. Identifying attitudes, beliefs and reported practices of nurses and doctors as immunization providers. J Adv Nurs. 2010;66(7):1602.
23. Fritz CO, Morris PE, Richler JJ. Effect size estimates: Current use, calculations, and interpretation. J Exp Psychol. 2012;141(1):2.
24. Creswell J. Research Design: Qualitative, Quantitative, and Mixed Methods Approaches. Thousand Oaks (CA): SAGE Publications; 2014.
25. Clarke V, Braun V. Thematic analysis. J Posit Psychol. 2017;12(3):297-8.
26. Taylor L, Turner N, Poutasi C. What are the keys to high immunisation rates in general practice? Nurs N Z. 2017;23(6):25-7.
27. Desmond N, Grant CC, Goodyear-Smith F, Turner N, Petousis-Harris H. Nurses make a difference in immunisation service delivery. Aust J Adv Nurs. 2011;28(4):28-35.
28. O’Grady KA, Krause V, Andrews R. Immunisation coverage in Australian Indigenous children: Time to move the goal posts. Vaccine. 2009;27(2):307-12.
29. Moore L, Menzies R, Davison J, Wang H, Abbott P. Improving immunisation timeliness in Aboriginal children through personalised calendars. BMC Public Health. 2013;13:598.
30. Menzies R, Andrews R. Immunisation issues for Indigenous Australian children. J Paediatr Child Health. 2014;50(10):e21-e5.
31. Law C, McGuire R, Ferson MJ, Reid S, Gately C, Stephenson J, et al. Children overdue for immunisation: A question of coverage or reporting? An audit of the Australian Immunisation Register. Aust N Z J Public Health. 2019;43(3):214-20.
32. Egleston BL, Miller SM, Meropol NJ. The impact of misclassification due to survey response fatigue on estimation and identifiability of treatment effects. Stat Med. 2011;30(30):3560.
Indigenous Health Barriers to vaccination service delivery in general practice
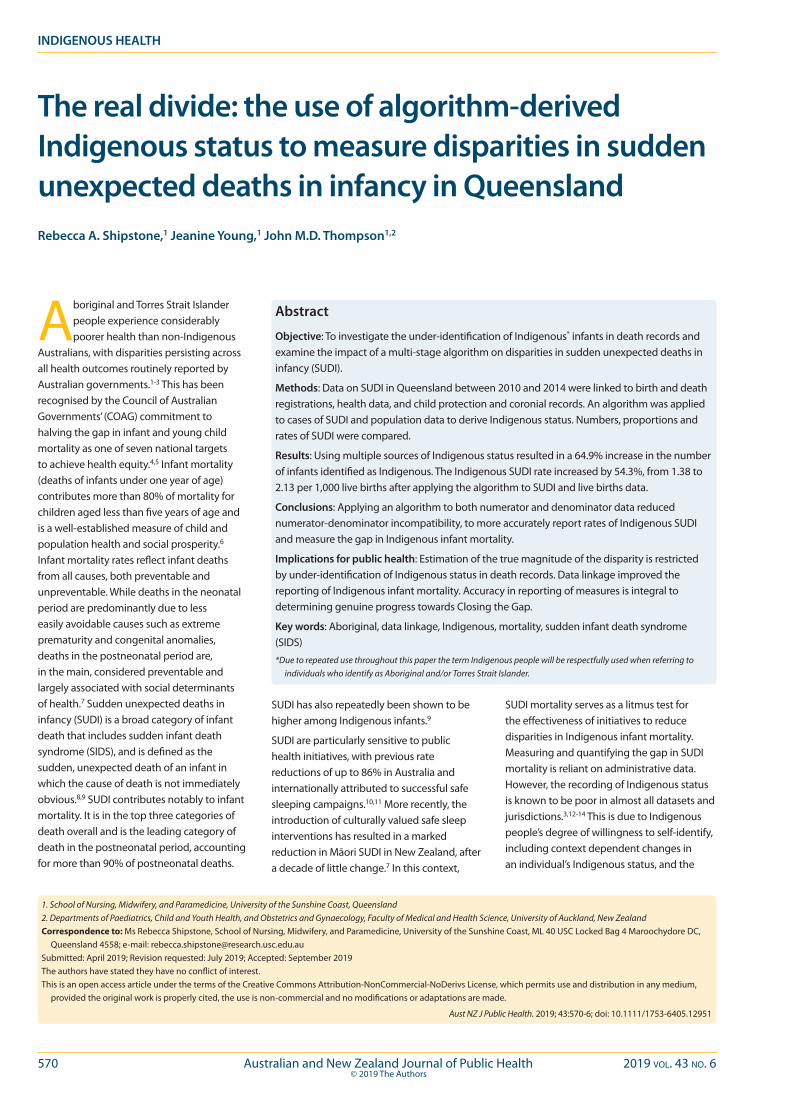
570 Australian and New Zealand Journal of Public Health 2019 vol. 43 no. 6© 2019 The Authors
Aboriginal and Torres Strait Islander people experience considerably poorer health than non-Indigenous
Australians, with disparities persisting across all health outcomes routinely reported by Australian governments.1-3 This has been recognised by the Council of Australian Governments’ (COAG) commitment to halving the gap in infant and young child mortality as one of seven national targets to achieve health equity.4,5 Infant mortality (deaths of infants under one year of age) contributes more than 80% of mortality for children aged less than five years of age and is a well-established measure of child and population health and social prosperity.6 Infant mortality rates reflect infant deaths from all causes, both preventable and unpreventable. While deaths in the neonatal period are predominantly due to less easily avoidable causes such as extreme prematurity and congenital anomalies, deaths in the postneonatal period are, in the main, considered preventable and largely associated with social determinants of health.7 Sudden unexpected deaths in infancy (SUDI) is a broad category of infant death that includes sudden infant death syndrome (SIDS), and is defined as the sudden, unexpected death of an infant in which the cause of death is not immediately obvious.8,9 SUDI contributes notably to infant mortality. It is in the top three categories of death overall and is the leading category of death in the postneonatal period, accounting for more than 90% of postneonatal deaths.
SUDI has also repeatedly been shown to be higher among Indigenous infants.9
SUDI are particularly sensitive to public health initiatives, with previous rate reductions of up to 86% in Australia and internationally attributed to successful safe sleeping campaigns.10,11 More recently, the introduction of culturally valued safe sleep interventions has resulted in a marked reduction in Māori SUDI in New Zealand, after a decade of little change.7 In this context,
SUDI mortality serves as a litmus test for the effectiveness of initiatives to reduce disparities in Indigenous infant mortality. Measuring and quantifying the gap in SUDI mortality is reliant on administrative data. However, the recording of Indigenous status is known to be poor in almost all datasets and jurisdictions.3,12-14 This is due to Indigenous people’s degree of willingness to self-identify, including context dependent changes in an individual’s Indigenous status, and the
The real divide: the use of algorithm-derived Indigenous status to measure disparities in sudden unexpected deaths in infancy in QueenslandRebecca A. Shipstone,1 Jeanine Young,1 John M.D. Thompson1,2
1. School of Nursing, Midwifery, and Paramedicine, University of the Sunshine Coast, Queensland 2. Departments of Paediatrics, Child and Youth Health, and Obstetrics and Gynaecology, Faculty of Medical and Health Science, University of Auckland, New ZealandCorrespondence to: Ms Rebecca Shipstone, School of Nursing, Midwifery, and Paramedicine, University of the Sunshine Coast, ML 40 USC Locked Bag 4 Maroochydore DC,
Queensland 4558; e-mail: [email protected]: April 2019; Revision requested: July 2019; Accepted: September 2019The authors have stated they have no conflict of interest.This is an open access article under the terms of the Creative Commons Attribution-NonCommercial-NoDerivs License, which permits use and distribution in any medium,
provided the original work is properly cited, the use is non-commercial and no modifications or adaptations are made.
Aust NZ J Public Health. 2019; 43:570-6; doi: 10.1111/1753-6405.12951
Abstract
Objective: To investigate the under-identification of Indigenous* infants in death records and examine the impact of a multi-stage algorithm on disparities in sudden unexpected deaths in infancy (SUDI).
Methods: Data on SUDI in Queensland between 2010 and 2014 were linked to birth and death registrations, health data, and child protection and coronial records. An algorithm was applied to cases of SUDI and population data to derive Indigenous status. Numbers, proportions and rates of SUDI were compared.
Results: Using multiple sources of Indigenous status resulted in a 64.9% increase in the number of infants identified as Indigenous. The Indigenous SUDI rate increased by 54.3%, from 1.38 to 2.13 per 1,000 live births after applying the algorithm to SUDI and live births data.
Conclusions: Applying an algorithm to both numerator and denominator data reduced numerator-denominator incompatibility, to more accurately report rates of Indigenous SUDI and measure the gap in Indigenous infant mortality.
Implications for public health: Estimation of the true magnitude of the disparity is restricted by under-identification of Indigenous status in death records. Data linkage improved the reporting of Indigenous infant mortality. Accuracy in reporting of measures is integral to determining genuine progress towards Closing the Gap.
Key words: Aboriginal, data linkage, Indigenous, mortality, sudden infant death syndrome (SIDS)
*Due to repeated use throughout this paper the term Indigenous people will be respectfully used when referring to individuals who identify as Aboriginal and/or Torres Strait Islander.
INDIGENOUS HEALTH
2019 vol. 43 no. 6 Australian and New Zealand Journal of Public Health 571© 2019 The Authors
opportunities afforded for them to do so.3 Indigenous status may not be asked of individuals who do not appear Indigenous, particularly in crisis situations such as the completion of a death certificate following an unexpected infant death. Studies in Western Australia and New South Wales suggest that Indigenous people are under-enumerated in official death records by 23% and 27%, respectively.15,16 Misclassification of Indigenous status affects estimates of Indigenous infant mortality and other health outcomes,12-15 and undermines the credibility of official measures of social progress.17
The problem of under-recording of Indigenous status can be substantially diminished through data linkage, which has been used to improve reporting of mortality data in Australia,14-16,18 New Zealand19 and Canada.20 A number of estimation algorithms for determining Indigenous status from linked data sources have been previously reported.1,12-15,21-25 The aim of this study was to apply the algorithm proposed by the ‘Getting our Story Right’ cross agency data linkage project (GOSR algorithm)12 to improve Indigenous identification in both cases of SUDI (numerator) and infant population data (denominator) to compare the incidence of SUDI and measure disparities between Indigenous and non-Indigenous infants.
Methods
Study sample and data collectionsAll cases of SUDI that occurred in Queensland between 1 January 2010 and 31 December 2014 were extracted from the Queensland Child Death Register for analysis. Cases of SUDI were identified following review of all coronial infant deaths. Deaths that met all the following criteria were classified as SUDI:
• an infant aged less than one year
• death was sudden, with no previously known condition likely to cause death
• death was unexpected (death was not anticipated as a significant possibility in the preceding 24 hours), and
• the cause of death was not immediately obvious.
This included infants who were temporarily but unsuccessfully resuscitated. The data selected for this study included five administrative collections: Death Registrations, Birth Registrations, Perinatal Data Collection (hereafter perinatal), Queensland Hospital Admitted Patient
Data Collection (hereafter inpatient hospitalisations), and the Emergency Department Information System (hereafter emergency presentations). Details of these administrative data collections are provided in Supplementary Table 1. Additionally, an infant’s Indigenous status as captured in coronial and child protection records was extracted manually and entered into the study database following a review of coronial investigation documents and Queensland Family and Child Commission case files (see Child Death Register entry in Supplementary Table 1).
Data linkageLinked Birth and Death Registration data were extracted from the Queensland Child Death Register and provided by the Queensland Family and Child Commission. Linked perinatal, inpatient hospitalisations, and emergency presentations data for infants and their mothers (during the period from conception to an infant’s death) were obtained from Queensland Health’s Master Linkage File. The Master Linkage File contains linked references to multiple health-related data collections and registries in Queensland. The Statistical Analysis and Linkage Unit were provided with the following identifying information from the Child Death Register extract to facilitate data linkage: death registration number, infant’s full name, infant’s date of birth, infant’s date of death, infant’s sex, infant’s address, mother’s full name, mother’s maiden name, mother’s date of birth, and mother’s address.
The Statistical Analysis and Linkage Unit (Queensland Health) performed the data linkage using deterministic and probabilistic matching based on multiple data fields, name compression algorithms, and multiple matching passes. Extensive clerical review of all potential linkages that were not identified as definite matches was also undertaken to improve the linkage rate. The researchers were provided anonymised linkage keys to merge the information from the linked perinatal, inpatient hospitalisations and emergency presentations data with the Child Death Register extract.
Multi-stage algorithm to derive Indigenous statusTo address the false negative reporting of Indigenous status in SUDI mortality data, the GOSR multistage algorithm was used in this
study.12 Table 1 shows the methodology used to combine an infant’s Indigenous statuses within and between collections to determine their overall Indigenous status. Within hospital data collections (perinatal, inpatient hospitalisations, emergency presentations), both maternal and infant data were utilised in a stepwise manner to derive an infant’s Indigenous status for each collection. In deriving an infant’s Indigenous status from maternal data, because the father’s Indigenous status was not collected, the father’s Indigenous status was assumed to be missing. The decision process used to derive an infant’s Indigenous status from parental data is described in the original GOSR paper and outlined in Supplementary Table 2.
An overall Indigenous status for each infant was derived from the collection derived Indigenous statuses in the seven datasets as follows:
1. Death registration – infant status as reported
2. Birth registration – mother and father used to derive infant status
3. Perinatal
a. Perinatal mother – mother status with father status as missing used to derive infant status
b. Perinatal infant – infant status as reported, from 1 July 2010
4. Inpatient hospitalisations
a. Inpatient hospitalisations mother – mother status with father status as missing used to derive infant status
b. Inpatient hospitalisations infant – infant status as reported
5. Emergency presentations
a. Emergency presentations mother – mother status with father status as missing used to derive infant status
b. Emergency presentations infant – infant status as reported
6. Coronial infant – infant status derived from manual review of coronial investigation documents
7. Child protection infant – infant status derived from manual review of child protection documents.
All seven collections reported people as belonging to one of the following groups: Aboriginal; Torres Strait Islander; both Aboriginal and Torres Strait Islander; neither Aboriginal nor Torres Strait Islander; or not stated/unknown. In this study, Aboriginal
Indigenous Health Measuring disparities in sudden unexpected deaths in infancy
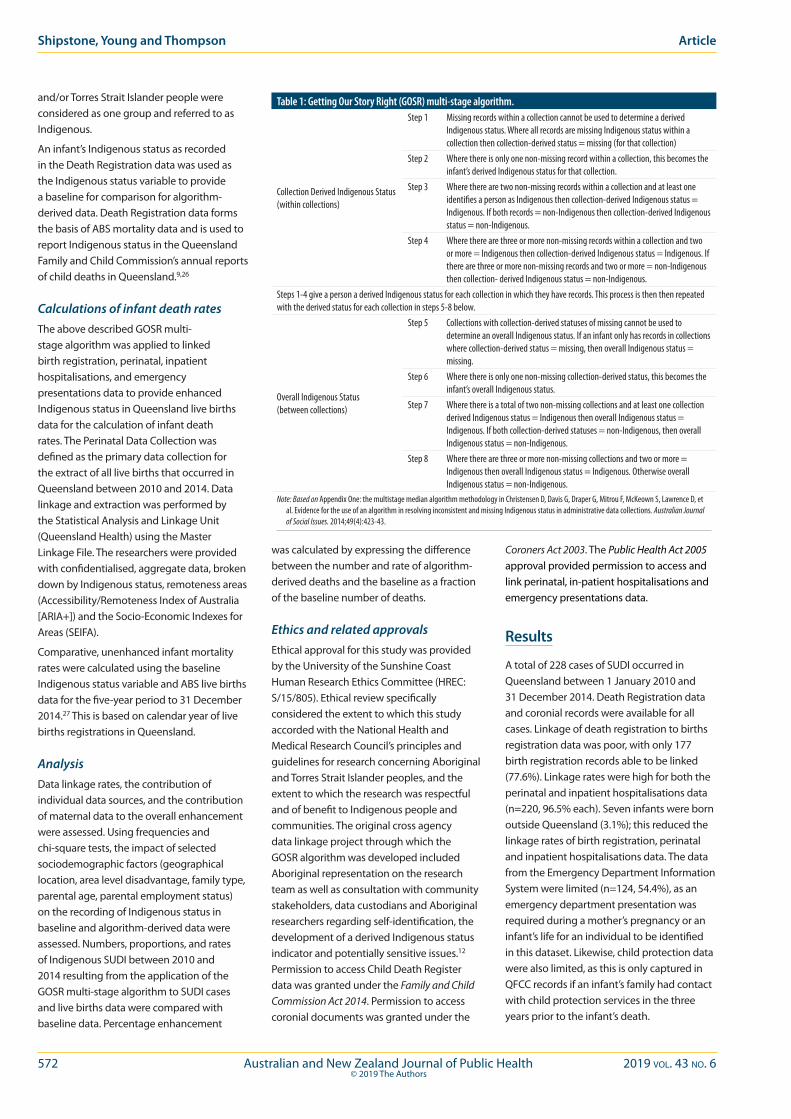
572 Australian and New Zealand Journal of Public Health 2019 vol. 43 no. 6© 2019 The Authors
and/or Torres Strait Islander people were considered as one group and referred to as Indigenous.
An infant’s Indigenous status as recorded in the Death Registration data was used as the Indigenous status variable to provide a baseline for comparison for algorithm-derived data. Death Registration data forms the basis of ABS mortality data and is used to report Indigenous status in the Queensland Family and Child Commission’s annual reports of child deaths in Queensland.9,26
Calculations of infant death rates The above described GOSR multi-stage algorithm was applied to linked birth registration, perinatal, inpatient hospitalisations, and emergency presentations data to provide enhanced Indigenous status in Queensland live births data for the calculation of infant death rates. The Perinatal Data Collection was defined as the primary data collection for the extract of all live births that occurred in Queensland between 2010 and 2014. Data linkage and extraction was performed by the Statistical Analysis and Linkage Unit (Queensland Health) using the Master Linkage File. The researchers were provided with confidentialised, aggregate data, broken down by Indigenous status, remoteness areas (Accessibility/Remoteness Index of Australia [ARIA+]) and the Socio-Economic Indexes for Areas (SEIFA).
Comparative, unenhanced infant mortality rates were calculated using the baseline Indigenous status variable and ABS live births data for the five-year period to 31 December 2014.27 This is based on calendar year of live births registrations in Queensland.
AnalysisData linkage rates, the contribution of individual data sources, and the contribution of maternal data to the overall enhancement were assessed. Using frequencies and chi-square tests, the impact of selected sociodemographic factors (geographical location, area level disadvantage, family type, parental age, parental employment status) on the recording of Indigenous status in baseline and algorithm-derived data were assessed. Numbers, proportions, and rates of Indigenous SUDI between 2010 and 2014 resulting from the application of the GOSR multi-stage algorithm to SUDI cases and live births data were compared with baseline data. Percentage enhancement
was calculated by expressing the difference between the number and rate of algorithm-derived deaths and the baseline as a fraction of the baseline number of deaths.
Ethics and related approvalsEthical approval for this study was provided by the University of the Sunshine Coast Human Research Ethics Committee (HREC: S/15/805). Ethical review specifically considered the extent to which this study accorded with the National Health and Medical Research Council’s principles and guidelines for research concerning Aboriginal and Torres Strait Islander peoples, and the extent to which the research was respectful and of benefit to Indigenous people and communities. The original cross agency data linkage project through which the GOSR algorithm was developed included Aboriginal representation on the research team as well as consultation with community stakeholders, data custodians and Aboriginal researchers regarding self-identification, the development of a derived Indigenous status indicator and potentially sensitive issues.12 Permission to access Child Death Register data was granted under the Family and Child Commission Act 2014. Permission to access coronial documents was granted under the
Coroners Act 2003. The Public Health Act 2005 approval provided permission to access and link perinatal, in-patient hospitalisations and emergency presentations data.
Results
A total of 228 cases of SUDI occurred in Queensland between 1 January 2010 and 31 December 2014. Death Registration data and coronial records were available for all cases. Linkage of death registration to births registration data was poor, with only 177 birth registration records able to be linked (77.6%). Linkage rates were high for both the perinatal and inpatient hospitalisations data (n=220, 96.5% each). Seven infants were born outside Queensland (3.1%); this reduced the linkage rates of birth registration, perinatal and inpatient hospitalisations data. The data from the Emergency Department Information System were limited (n=124, 54.4%), as an emergency department presentation was required during a mother’s pregnancy or an infant’s life for an individual to be identified in this dataset. Likewise, child protection data were also limited, as this is only captured in QFCC records if an infant’s family had contact with child protection services in the three years prior to the infant’s death.
Table 1: Getting Our Story Right (GOSR) multi-stage algorithm.
Collection Derived Indigenous Status (within collections)
Step 1 Missing records within a collection cannot be used to determine a derived Indigenous status. Where all records are missing Indigenous status within a collection then collection-derived status = missing (for that collection)
Step 2 Where there is only one non-missing record within a collection, this becomes the infant’s derived Indigenous status for that collection.
Step 3 Where there are two non-missing records within a collection and at least one identifies a person as Indigenous then collection-derived Indigenous status = Indigenous. If both records = non-Indigenous then collection-derived Indigenous status = non-Indigenous.
Step 4 Where there are three or more non-missing records within a collection and two or more = Indigenous then collection-derived Indigenous status = Indigenous. If there are three or more non-missing records and two or more = non-Indigenous then collection- derived Indigenous status = non-Indigenous.
Steps 1-4 give a person a derived Indigenous status for each collection in which they have records. This process is then then repeated with the derived status for each collection in steps 5-8 below.
Overall Indigenous Status (between collections)
Step 5 Collections with collection-derived statuses of missing cannot be used to determine an overall Indigenous status. If an infant only has records in collections where collection-derived status = missing, then overall Indigenous status = missing.
Step 6 Where there is only one non-missing collection-derived status, this becomes the infant’s overall Indigenous status.
Step 7 Where there is a total of two non-missing collections and at least one collection derived Indigenous status = Indigenous then overall Indigenous status = Indigenous. If both collection-derived statuses = non-Indigenous, then overall Indigenous status = non-Indigenous.
Step 8 Where there are three or more non-missing collections and two or more = Indigenous then overall Indigenous status = Indigenous. Otherwise overall Indigenous status = non-Indigenous.
Note: Based on Appendix One: the multistage median algorithm methodology in Christensen D, Davis G, Draper G, Mitrou F, McKeown S, Lawrence D, et al. Evidence for the use of an algorithm in resolving inconsistent and missing Indigenous status in administrative data collections. Australian Journal of Social Issues. 2014;49(4):423-43.
Shipstone, Young and Thompson Article
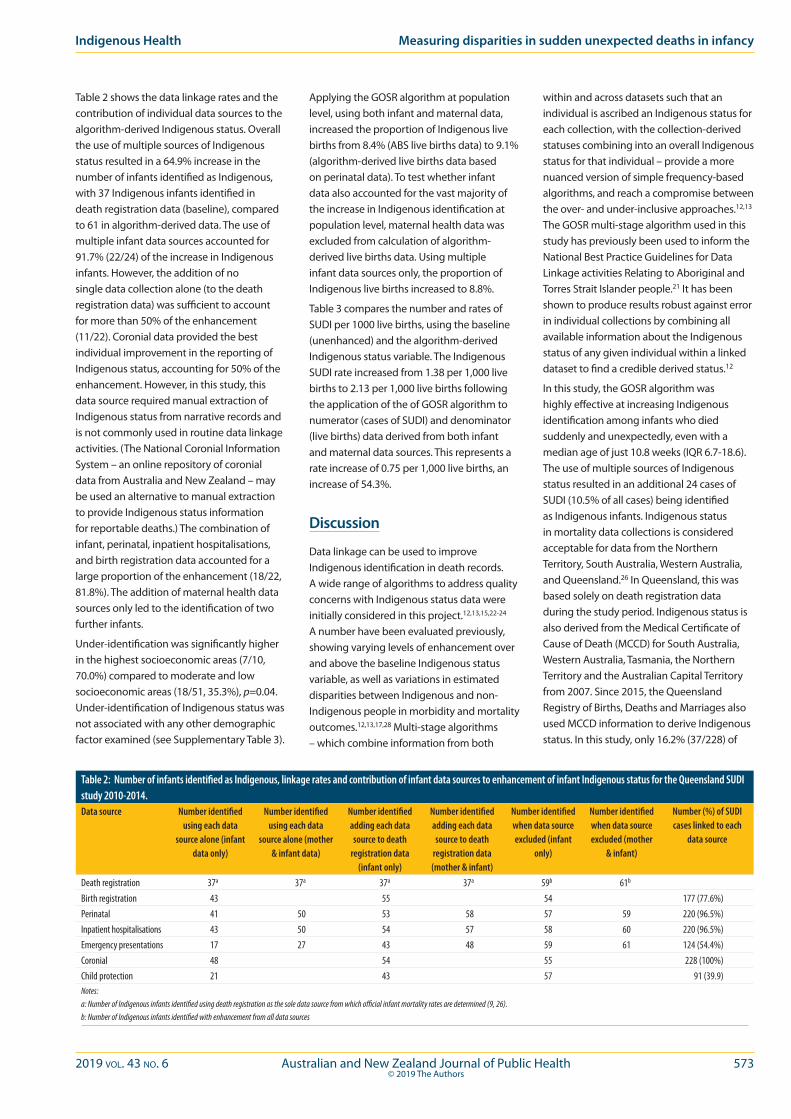
2019 vol. 43 no. 6 Australian and New Zealand Journal of Public Health 573© 2019 The Authors
Indigenous Health Measuring disparities in sudden unexpected deaths in infancy
Table 2 shows the data linkage rates and the contribution of individual data sources to the algorithm-derived Indigenous status. Overall the use of multiple sources of Indigenous status resulted in a 64.9% increase in the number of infants identified as Indigenous, with 37 Indigenous infants identified in death registration data (baseline), compared to 61 in algorithm-derived data. The use of multiple infant data sources accounted for 91.7% (22/24) of the increase in Indigenous infants. However, the addition of no single data collection alone (to the death registration data) was sufficient to account for more than 50% of the enhancement (11/22). Coronial data provided the best individual improvement in the reporting of Indigenous status, accounting for 50% of the enhancement. However, in this study, this data source required manual extraction of Indigenous status from narrative records and is not commonly used in routine data linkage activities. (The National Coronial Information System – an online repository of coronial data from Australia and New Zealand – may be used an alternative to manual extraction to provide Indigenous status information for reportable deaths.) The combination of infant, perinatal, inpatient hospitalisations, and birth registration data accounted for a large proportion of the enhancement (18/22, 81.8%). The addition of maternal health data sources only led to the identification of two further infants.
Under-identification was significantly higher in the highest socioeconomic areas (7/10, 70.0%) compared to moderate and low socioeconomic areas (18/51, 35.3%), p=0.04. Under-identification of Indigenous status was not associated with any other demographic factor examined (see Supplementary Table 3).
Applying the GOSR algorithm at population level, using both infant and maternal data, increased the proportion of Indigenous live births from 8.4% (ABS live births data) to 9.1% (algorithm-derived live births data based on perinatal data). To test whether infant data also accounted for the vast majority of the increase in Indigenous identification at population level, maternal health data was excluded from calculation of algorithm-derived live births data. Using multiple infant data sources only, the proportion of Indigenous live births increased to 8.8%.
Table 3 compares the number and rates of SUDI per 1000 live births, using the baseline (unenhanced) and the algorithm-derived Indigenous status variable. The Indigenous SUDI rate increased from 1.38 per 1,000 live births to 2.13 per 1,000 live births following the application of the of GOSR algorithm to numerator (cases of SUDI) and denominator (live births) data derived from both infant and maternal data sources. This represents a rate increase of 0.75 per 1,000 live births, an increase of 54.3%.
Discussion
Data linkage can be used to improve Indigenous identification in death records. A wide range of algorithms to address quality concerns with Indigenous status data were initially considered in this project.12,13,15,22-24 A number have been evaluated previously, showing varying levels of enhancement over and above the baseline Indigenous status variable, as well as variations in estimated disparities between Indigenous and non-Indigenous people in morbidity and mortality outcomes.12,13,17,28 Multi-stage algorithms – which combine information from both
within and across datasets such that an individual is ascribed an Indigenous status for each collection, with the collection-derived statuses combining into an overall Indigenous status for that individual – provide a more nuanced version of simple frequency-based algorithms, and reach a compromise between the over- and under-inclusive approaches.12,13 The GOSR multi-stage algorithm used in this study has previously been used to inform the National Best Practice Guidelines for Data Linkage activities Relating to Aboriginal and Torres Strait Islander people.21 It has been shown to produce results robust against error in individual collections by combining all available information about the Indigenous status of any given individual within a linked dataset to find a credible derived status.12
In this study, the GOSR algorithm was highly effective at increasing Indigenous identification among infants who died suddenly and unexpectedly, even with a median age of just 10.8 weeks (IQR 6.7-18.6). The use of multiple sources of Indigenous status resulted in an additional 24 cases of SUDI (10.5% of all cases) being identified as Indigenous infants. Indigenous status in mortality data collections is considered acceptable for data from the Northern Territory, South Australia, Western Australia, and Queensland.26 In Queensland, this was based solely on death registration data during the study period. Indigenous status is also derived from the Medical Certificate of Cause of Death (MCCD) for South Australia, Western Australia, Tasmania, the Northern Territory and the Australian Capital Territory from 2007. Since 2015, the Queensland Registry of Births, Deaths and Marriages also used MCCD information to derive Indigenous status. In this study, only 16.2% (37/228) of
Table 2: Number of infants identified as Indigenous, linkage rates and contribution of infant data sources to enhancement of infant Indigenous status for the Queensland SUDI study 2010-2014.Data source Number identified
using each data source alone (infant
data only)
Number identified using each data
source alone (mother & infant data)
Number identified adding each data source to death
registration data (infant only)
Number identified adding each data source to death
registration data (mother & infant)
Number identified when data source excluded (infant
only)
Number identified when data source excluded (mother
& infant)
Number (%) of SUDI cases linked to each
data source
Death registration 37a 37a 37a 37a 59b 61b
Birth registration 43 55 54 177 (77.6%)Perinatal 41 50 53 58 57 59 220 (96.5%)Inpatient hospitalisations 43 50 54 57 58 60 220 (96.5%)Emergency presentations 17 27 43 48 59 61 124 (54.4%)Coronial 48 54 55 228 (100%)Child protection 21 43 57 91 (39.9)Notes:a: Number of Indigenous infants identified using death registration as the sole data source from which official infant mortality rates are determined (9, 26).b: Number of Indigenous infants identified with enhancement from all data sources

574 Australian and New Zealand Journal of Public Health 2019 vol. 43 no. 6© 2019 The Authors
SUDI were identified as Indigenous using death registration (baseline) data, compared with 26.8% (61/228) of cases using algorithm-derived data. Overall, this constitutes a 64.9% increase in the number of sudden infant deaths identified as Indigenous. The high rate of under-identification of Indigenous status in death records has previously been noted.15,16 Previous studies have found that under-enumeration of Indigenous people occurs more frequently in urban areas where the proportion of the population that is Indigenous is lowest, as well as among those that are least disadvantaged.13,16 However, in this study under-identification of Indigenous infants was only found to be related to area-level socioeconomic advantage.
The majority of studies of health outcomes using data linkage to increase Indigenous identification have involved adult populations, with relatively few focusing on infants or very young children.17,29-32 A specific challenge arises when using administrative data to measure infant mortality. Due to their young age at death, most infants will have had limited contact with health and other administrative systems and lack the opportunity to have their Indigenous status captured in multiple presentations across a range of datasets. Greater increases in Indigenous identification occur among older age groups, due to their increased opportunity to utilise health services.13 As this study involves infants under the age of one year, it was hypothesised that relying solely on infant records was likely to under-identify Indigenous infants. To ameliorate this potential limitation, maternal hospital data were also used to derive an infant’s Indigenous status. However, the additional use of multiple maternal data sources was found to account for only 8.4% (2/61) of the enhancement. To test whether the infant data had the same impact at population level, a re-calculation of live births data, excluding maternal health data, was obtained. In contrast to SUDI cases, maternal data had a substantial impact on population data, accounting for nearly half of the enhancement. At population level, the use of infant data sources only significantly under-estimated the number of Indigenous live births. This suggests that the use of both maternal and infant data from multiple sources to derive Indigenous status in both numerator and denominator data is optimal in research involving infant and young child populations.32
Studies using data linkage to improve the completeness of Indigenous status usually calculate crude rates using Census-derived estimated resident population (ERP) data or live births data based on birth registrations.13,14,22,23,28 Higher estimates of mortality and disease rates are thus to be expected, irrespective of the algorithm applied, as this increases the number of Indigenous events (and correspondingly decreases non-Indigenous events) but does not change the population denominators. The present study is the first study of SUDI to apply a multi-stage algorithm to enhance Indigenous status in both numerator (cases of SUDI) and denominator (live births) data. While the manual extraction of Indigenous status data from coronial and child protection records had the potential to result in incongruence between numerator and denominator, almost all of the increase in Indigenous identification came from routinely linked administrative data sources that used both numerator and denominator. This substantially reduces the risk that an increase in Indigenous SUDI mortality rates may be due to numerator–denominator incompatibility, a noted limitation of previous research in this area, which affects the ability to accurately measure the gap in mortality between Indigenous and non-Indigenous infants. Enhancement of both cases of SUDI and live births data in this study resulted in a significant increase in the Indigenous SUDI mortality rate, from 1.38 per 1,000 live births to 2.13 per 1,000 live births. While
there have been some improvements in Indigenous infant mortality rates and a narrowing of the gap between Indigenous and non-Indigenous infants over the longer term,5,9 official state and national child death statistics for Queensland continue to report an Indigenous SUDI rate only twice that of non-Indigenous infants.9,33 The findings of the present study suggest that Indigenous infants in Queensland die suddenly and unexpectedly at a rate that is more than 3.5 times that of non-Indigenous infants; a much higher rate than previously estimated by official statistics
LimitationsDue to their young age at death, most infants have had limited contact with health and other administrative systems and lack the opportunity to have their Indigenous status captured in multiple presentations across a range of datasets. Consequently, studies of infant health outcomes rely heavily on birth registration and perinatal data collections.29,31,34 A low rate of linkage of birth and death registration in the SUDI data was observed (77.6%; with only 3.1% explained by infants born outside Queensland), although the reasons for this are unclear. It may relate to operational processes since this data (obtained from the Child Death Register) was linked by the Registry of Births Deaths and Marriages, which does not have a dedicated data linkage and statistical analysis team. Compounding this issue, Indigenous births are registered at a significantly lower
Table 3: Numbers of deaths, populations, and SUDI rates and changes by infant Indigenous status.Indigenous
Deaths n (%)
Non- Indigenous
Deaths n (%)
Indigenous Births n (%)
Non- Indigenous
Births n (%)
Indigenous SUDI rate per
1,000 live births
Non- Indigenous
SUDI rate per 1,000 live births
Indigenous status as per death registrationa
37 191 26,726 291,307 1.38 0.66
Indigenous status as enhanced by infant data sources only
59 169 28,696 286,239 2.06 0.59
Change from death registration data (percentage change)
+22 (+59.5%)
-22 (-11.5%)
1970 (+7.4%)
-1970 (-0.7%)
+0.68 (+49.3%)
-0.07 (-11.9%)
Indigenous status as enhanced by infant and maternal data sources
61 167 28,696 286,239 2.13 0.58
Change from death registration data (percentage change)
+24 (+64.5%)
-24 (-14.2%)
1970 (+7.4%)
-1970 (-0.7%)
0.75 (+54.3%)
-0.08 (-12.1%)
Note: a: official published Indigenous rate is based on an Indigenous population of 26,726 according to ABS Live Births Cat. No. 3301.0 2015, calculations in this
manuscript have used data prepared by the Statistical Analysis and Linkage Unit based on live births identified in the Perinatal Data Collection. Total births estimate was 318,033 for official estimate and is 314,935 for GOSR algorithm-derived rates. For the purpose of the calculation of rates using the GOSR algorithm-derived live births data, non-Indigenous is an aggregate category including both non-Indigenous and missing/unknown status. The overall SUDI rate was 0.72 per 1000 live births using either denominator.
Shipstone, Young and Thompson Article

2019 vol. 43 no. 6 Australian and New Zealand Journal of Public Health 575© 2019 The Authors
rate than non-Indigenous births.24,31,34 A recent Queensland investigation found that 15–18% of births to Aboriginal mothers were not registered compared with an under-registration rate of 1.8% for births to non-Aboriginal mothers.35 There is the potential for under-identification of Indigenous infants due to the low linkage rate of birth registrations in the SUDI data.
A study by Comino and colleagues29 of the identification of Aboriginal infants within antenatal services showed that, in an urban area, identification based on the Indigenous status of an infant’s mother only significantly under-identified Aboriginal infants, with nearly 40% of Aboriginal infants having a non-Indigenous mother. In the present study, the addition of maternal data yielded minimal enhancement over and above that obtained by using multiple infant records. It is possible that the inclusion of paternal inpatient hospitalisations and emergency presentations data may have resulted in greater enhancement; however, only maternal data was available.
An under-explored limitation of all enhancement algorithms concerns the aggregation of three distinct Indigenous statuses: Aboriginal, Torres Strait Islander, and both Aboriginal and Torres Strait Islander. This is due to the practical difficulty of developing an algorithm that accounts for all possible combinations. However, the potential impact of the inability to distinguish between these two distinct cultural groups should be acknowledged, particularly in research undertaken in Queensland, which has a significantly larger Torres Strait Islander population than any other state or territory.36
Strengths This study shows that the use of unenhanced Indigenous status may lead to an under-enumeration of Indigenous persons and an under-reporting of key outcomes, such as deaths. It further demonstrates that the application of the GOSR algorithm to multiple linked infant and maternal data sources is highly effective at increasing Indigenous identification in studies of infant mortality. By applying the GOSR algorithm to both numerator and denominator data, this study ameliorated numerator–denominator incongruency, to more accurately report the rates of Indigenous infant mortality and measure the gap in SUDI mortality. As they become available, additional data collections
can (and should) be added to this algorithmic approach to determining Indigenous status in both numerator and denominator data with relative ease, resulting in continuous improvement to data quality.
Implications for public health
This study illustrates that the linkage of existent data resources can substantially improve measures of Indigenous health that are based on mortality data. More specifically, with the rapid growth in the use of linked data, the GOSR algorithm has the potential to increase Indigenous status data quality in research and government reporting. Accurate and reliable epidemiological and statistical data provide the foundation for evidence based public policy and are critical to improving Indigenous health and reducing the health disparities between Indigenous and non-Indigenous people. It remains important to recognise that Indigenous identity and identification reflects a complex interplay of individual and contextual factors.12 Ongoing work aimed at improving the quality of administrative data collections should continue.
A key finding of this study – that Indigenous infants died suddenly at a rate more than 3.5 times that of non-Indigenous infants – has serious policy and practice implications. Specifically, it calls into question the continued use of unenhanced data in official Queensland child death statistics, including that of state-based child death review bodies,9 the Australian Bureau of Statistics cause of death data,26 and official reporting of against the COAG Closing the Gap initiative,33,37 all of which presently rely on unenhanced Indigenous status as recorded in death certification and registration data. Much of this deficiency in official statistics could be overcome by the routine linking of readily available data sources, particularly birth registration and perinatal data.
Acknowledgements
We acknowledge and thank the data custodians – the Queensland Family and Child Commission, the Office of the State Coroner, and Queensland Health – and their research and data management staff for providing access to the data that made this research possible. We especially acknowledge the contribution of the Queensland Health
Statistical Analysis and Linkage Unit (SALU) staff, in particular Dale Steinhardt, for data extraction and linkage.
FundingRebecca Shipstone was supported by a University of the Sunshine Coast Research Scholarship – PhD Candidate Funding.
Data accessibility statement The datasets used and/or analysed during the current study are not available publicly as this was not specified in the original ethical approval request; however, they may be available in part from the corresponding author on reasonable request.
References 1. Thompson SC, Woods JA, Katzenellenbogen JM. The
quality of Indigenous identification in administrative health data in Australia: Insights from studies using data linkage. BMC Med Inform Decis Mak. 2012;12:133.
2. Australian institute of Health and Welfare. The Health and Welfare of Australia’s Aboriginal and Torres Strait Islander Peoples 2015. Catalogue IHW N0.: 147. Canberra (AUST): AIHW; 2015.
3. Campbell P, Biddle N, Paradies Y. Indigenous identification and transitions in Australia: Exploring new findings from a linked micro-dataset. Population. 2018;73(4):771-96.
4. Council of Australian Governments. Glosing The Gap on Indigenous Disadvantage: The Challenge for Australia. Canberra (AUST): COAG; 2009.
5. Department of the Prime Minister and Cabinet. Closing The Gap Report 2019. Canberra (AUST): Government of Australia; 2019.
6. Kim D, Saada A. The social determinants of infant mortality and birth outcomes in Western developed nations: A cross-country systematic review. Int J Environ Res Public Health. 2013;10(6):2296-335.
7. Mitchell EA, Cowan S, Tipene-Leach D. The recent fall in postperinatal mortality in New Zealand and the safe sleep programme. Acta Paediatr. 2016;105(11):1312-20.
8. Shipstone R, Young J, Kearney L. New frameworks for understanding sudden unexpected deaths in infancy (SUDI) in socially vulnerable families. J Pediatr Nurs. 2017;37:35-41.
9. Queensland Family and Child Commission. Annual Report: Deaths of Children and Young People, Queensland, 2017–18. Brisbane (AUST): The State of Government; 2018.
10. Australian Institute of Health and Welfare. A Picture of Australia’s Children 2012. Catalogue No.: PHE 167. Canberra (AUST): AIHW; 2012.
11. Hauck FR, Tanabe KO. International trends in sudden infant death syndrome: Stabilization of rates requires further action. Pediatrics. 2008;122(3):660-6.
12. Christensen D, Davis G, Draper G, Mitrou F, McKeown S, Lawrence D, et al. Evidence for the use of an algorithm in resolving inconsistent and missing Indigenous status in administrative data collections. Aust J Soc Issues. 2014;49(4):423-43.
13. Randall DA, Lujic S, Leyland AH, Jorm LR. Statistical methods to enhance reporting of Aboriginal Australians in routine hospital records using data linkage affect estimates of health disparities. Aust N Z J Public Health. 2013;37(5):442-9.
14. Draper GK, Somerford PJ, Pilkington AAG, Thompson SC. What is the impact of missing Indigenous status on mortality estimates? An assessment using record linkage in Western Australia. Aust N Z J Public Health. 2009;33(4):325-31.
Indigenous Health Measuring disparities in sudden unexpected deaths in infancy
576 Australian and New Zealand Journal of Public Health 2019 vol. 43 no. 6© 2019 The Authors
15. Neville SE, Taylor LK, Moore H, Madden R, Ring I, Pulver LJ, et al. Using linkage between hospital and ABS mortality data to enhance reporting of deaths among Aboriginal and Torres Strait Islander peoples. Aust N Z J Public Health. 2011;35(6):543-8.
16. Briffa TG, Sanfilippo FM, Hobbs MS, Ridout SC, Katzenellenbogen JM, Thompson PL, et al. Under-ascertainment of Aboriginality in records of cardiovascular disease in hospital morbidity and mortality data in Western Australia: A record linkage study. BMC Med Res Methodol. 2010;10:111.
17. Lawrence D, Christensen D, Mitrou F, Draper G, Davis G, McKeown S, et al. Adjusting for under-identification of Aboriginal and/or Torres Strait Islander births in time series produced from birth records: Using record linkage of survey data and administrative data sources. BMC Med Res Methodol. 2012;12(1):90.
18. Taylor LK, Bentley J, Hunt J, Madden R, McKeown S, Brandt P, et al. Enhanced reporting of deaths among Aboriginal and Torres Strait Islander peoples using linked administrative health datasets. BMC Med Res Methodol. 2012;12:91.
19. Blakely T, Tobias M, Robson B, Ajwani S, Bonne M, Woodward A. Widening ethnic mortality disparities in New Zealand 1981-99. Soc Sci Med. 2005;61(10):2233-51.
20. Anderson RN, Copeland G, Hayes JM. Linkages to improve mortality data for American Indians and Alaska Natives: A new model for death reporting? Am J Public Health. 2014;104 Suppl 3:258-62.
21. Australian Institute of Health and Welfare and Australian Bureau of Statistics. National Best Practice Guidelines for Data Linkage Activities Relating to Aboriginal and Torres Strait Islander People. Catalogue No.: IHW74. Canberra (AUST): AIHW; 2012.
22. Rowe SL, Cowie BC. Using data linkage to improve the completeness of Aboriginal and Torres Strait Islander status in communicable disease notifications in Victoria. Aust N Z J Public Health. 2016;40(2):148-53.
23. Watkins RE, Mak DB, Giele CM, Clews S. Aboriginal and non-Aboriginal sexually transmitted infections and blood borne virus notification rates in Western Australia: Using linked data to improve estimates. BMC Public Health. 2013;13:404.
24. Gialamas A, Pilkington R, Berry J, Scalzi D, Gibson O, Brown A, et al. Identification of Aboriginal children using linked administrative data: Consequences for measuring inequalities. J Paediatr Child Health. 2016;52(5):534-40.
25. Hunter B, Ayyar A. Undercounts in offender data and closing the gap between Indigenous and other Australians. Aust J Soc Issues. 2011;46(1):69-89.
26. Australian Bureau of Statistics. 3303.0 - Causes of Death, Australia 2017. Canberra (AUST): ABS; 2018.
27. Australian Bureau of Statistics. 3301.0 - Births, Australia 2015. Canberrra (AUST): ABS; 2016.
28. Katzenellenbogen JM, Sanfilippo FM, Hobbs MS, Briffa TG, Ridout SC, Knuiman MW, et al. Incidence of and case fatality following acute myocardial infarction in Aboriginal and non-Aboriginal Western Australians (2000-2004): A linked data study. Heart Lung Circ. 2010;19(12):717-25.
29. Comino EJ, Titmuss A, Harris E, Craig P, Pulver LJ. Identification of Aboriginal infants at an urban hospital. J Paediatr Child Health. 2007;43(9):623-6.
30. Kennedy B, Cornes S, Martyn S, Wills R, Breckell C. Measuring Indigenous Perinatal Outcomes - Should We use the Indigenous Status of the Mother, Father or Baby? Technical Report No.: 2. Brisbane (AUST): Queensland Health; 2009.
31. Xu F, Sullivan EA, Madden RC, Black D, Jackson Pulver LR. Improvement of maternal Aboriginality in NSW birth data. BMC Med Res Methodol. 2012;12:8.
32. Falster K, Jorgensen M, Hanly M, Banks E, Brownell M, Eades S, et al. Data resource profile: Seeding success: A cross-sectoral data resource for early childhood health and development research in Australian Aboriginal and non-Aboriginal children. Int J Epidemiol. 2017;46(5):1365-6.
33. Australian Health Ministers’ Advisory Council. Aboriginal and Torres Strait Islander Health Performance Framework, 2017 Report. Canberra (AUST): Department of Prime Minister and Cabinet; 2017.
34. Gibberd AJ, Simpson JM, Eades SJ. No official identity: A data linkage study of birth registration of Aboriginal children in Western Australia. Aust N Z J Public Health. 2016;40(4):388-94.
35. Queensland Ombudsman. The Indigenous Birth Registration Report. Brisbane (AUST): State Government of Queensland; 2018..
36. Australian Bureau of Statistics. 3238.0.55.001 - Estimates of Aboriginal and Torres Strait Islander Australians, June 2016. Canberra (AUST): ABS; 2018.
37. Queensland Health. Closing The Gap Performance Report 2017. Brisbane (AUST): State Government of Queensland; 2018.
Supporting Information
Additional supporting information may be found in the online version of this article:
Supplementary Table 1: Data collections used to source information for the Queensland SUDI Study.
Supplementary Table 2: The decision process used to derive an infant’s Indigenous status from parental data.
Supplementary Table 3: Associations of socio-demographic factors and Indigenous identification using the GOSR algorithm.
Shipstone, Young and Thompson Article

2019 vol. 43 no. 6 Australian and New Zealand Journal of Public Health 577© 2019 The Authors
Equitable access to quality abortion services should be provided to all women, including adolescents.
Research shows that adolescents experience greater barriers than adults when attempting to access health services for non-stigmatised issues1. Negative views concerning adolescent sexual activity in general affects the way in which services are delivered to and accessed by adolescents.2 Abortion-related stigma, which affects women and providers,3 is therefore likely to be amplified in the adolescent population. Little attention has been paid to the examination of data on adolescent abortion, affecting the ability of health services to adequately respond to adolescent needs4 and provide a benchmark to assess service quality.5,6 Knowledge about cost, timing, method and access to abortion care for adolescents is required to support the development and improvement of reproductive services for this vulnerable group.
Limited national surveillance of abortion in Australia remains a major public health challenge, which adversely impacts upon the ability of national, state and territory governments to monitor health outcomes of priority populations and plan and evaluate reproductive health policy and services.7 Only three jurisdictions (Northern Territory, South Australia and Western Australia) have reporting requirements for induced surgical and medical abortion. Medicare data has been used nationally as a proxy for abortion;8,9 however, this data lacks specificity and sensitivities for early pregnancy, surgical abortions and for medical abortion.10
Chan et al. calculated the most recent national incidence estimates on abortion in Australia as 19.7 abortions per 1,000 women aged 15–44 years for 2003, using South Australian data and Medicare statistics.8 We were only able to identify one Australian cohort study that calculated an abortion incidence rate of 2.1 per 100 women years for 16 –25-year-olds4.
The World Health Organization 2012 abortion guidelines state that quality abortion care must include the accurate collection of abortion service information and the routine
monitoring and evaluation of the service in order to be able to maintain and improve the service if required.11 This includes incidence, by age, method and gestational age at time of procedure.11 Method of abortion is important as it indicates the equipment and funding required for appropriate abortion service planning. Collecting method-related data can also be used to understand if changes in the preference of different population groups occurs over time. For example, in Sweden and Finland over a 20-year period, the demand for medical abortion has overtaken the demand
Adolescent abortion in 11 high-income countries including Australia: towards the establishment of a minimum data setAnisa R. Assifi,1 Elizabeth A. Sullivan,1,2 Melissa Kang,1 Angela J. Dawson1
1. The Australian Centre for Public and Population Health Research, Faculty of Health, University of Technology Sydney, New South Wales2. Office of the PVC Health and Medicine, Faculty of Health and Medicine, University of Newcastle, New South WalesCorrespondence to: Miss Anisa R. Assifi, The Australian Centre for Public and Population Health Research, Faculty of Health, PO Box 123, Broadway 2007 NSW;
e-mail: [email protected]: May 2019; Revision requested: August 2019; Accepted: September 2019The authors have stated they have no conflict of interest.This is an open access article under the terms of the Creative Commons Attribution-NonCommercial-NoDerivs License, which permits use and distribution in any medium,
provided the original work is properly cited, the use is non-commercial and no modifications or adaptations are made.
Aust NZ J Public Health. 2019; 43:577-81; doi: 10.1111/1753-6405.12947
Abstract
Objective: A major public health challenge in Australia is the lack of national adolescent abortion data. This descriptive study identifies, collates and describes publicly available adolescent abortion data in high-income countries including Australia, to describe trends over 10 years and provide recommendations for strengthening data collection.
Methods: Data were extracted from publicly available government sources that met inclusion criteria. All relevant adolescent abortion data from 2007 to 2017 were extracted from datasets and analysed.
Results: Eleven high-income countries were included. Incidence data for the adolescent population were available for all countries and states. Incidence of adolescent abortion over 10 years shows a downward trend in all countries. Gestational age at time of abortion was the second-most available variable. The level and type of data across all countries varied; there was a lack of age range standardisation and aggregation of gestational weeks differed, making comparisons difficult.
Conclusion: A minimum data set of standardised abortion information will enable appropriate adolescent abortion policies and services to be developed that are informed by high quality, up-to-date intelligence.
Implications for public health: Availability of data affects government’s ability to adequately monitor national adolescent health outcomes and plan and evaluate appropriate reproductive health policy and services.
Key words: Induced abortion, adolescent, public health, surveillance
ADOLESCENT HEALTH
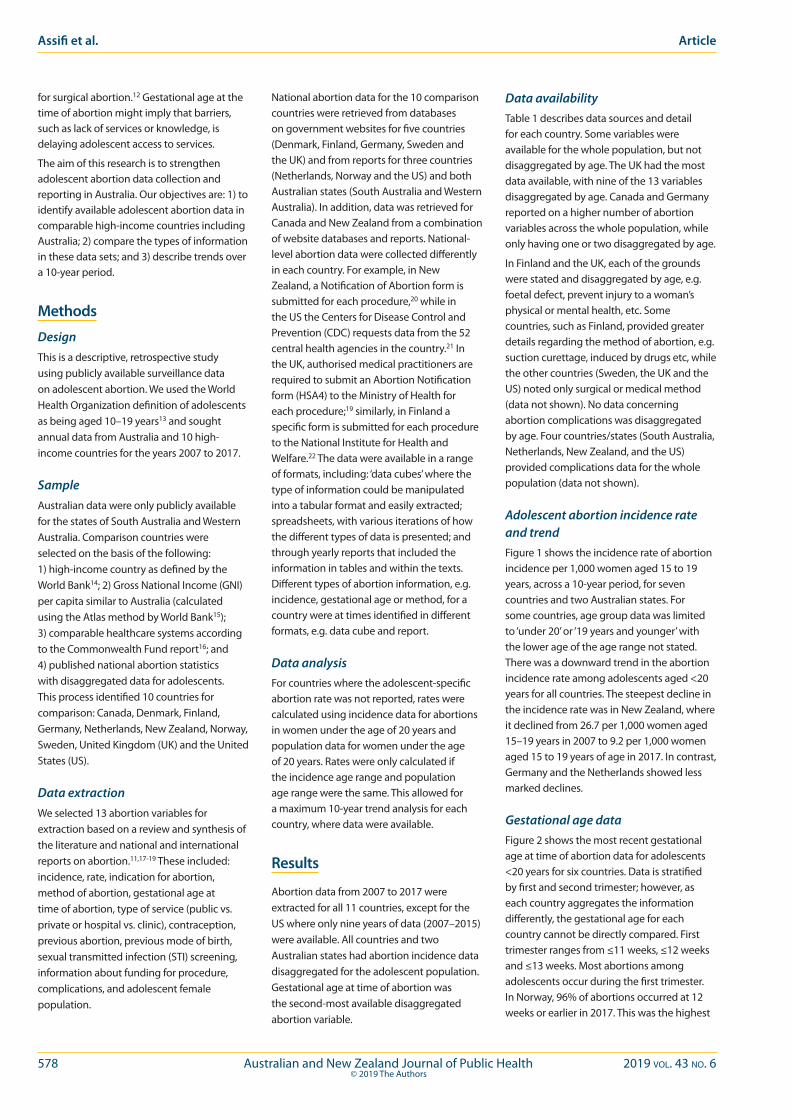
578 Australian and New Zealand Journal of Public Health 2019 vol. 43 no. 6© 2019 The Authors
Assifi et al. Article
for surgical abortion.12 Gestational age at the time of abortion might imply that barriers, such as lack of services or knowledge, is delaying adolescent access to services.
The aim of this research is to strengthen adolescent abortion data collection and reporting in Australia. Our objectives are: 1) to identify available adolescent abortion data in comparable high-income countries including Australia; 2) compare the types of information in these data sets; and 3) describe trends over a 10-year period.
Methods
DesignThis is a descriptive, retrospective study using publicly available surveillance data on adolescent abortion. We used the World Health Organization definition of adolescents as being aged 10–19 years13 and sought annual data from Australia and 10 high-income countries for the years 2007 to 2017.
SampleAustralian data were only publicly available for the states of South Australia and Western Australia. Comparison countries were selected on the basis of the following: 1) high-income country as defined by the World Bank14; 2) Gross National Income (GNI) per capita similar to Australia (calculated using the Atlas method by World Bank15); 3) comparable healthcare systems according to the Commonwealth Fund report16; and 4) published national abortion statistics with disaggregated data for adolescents. This process identified 10 countries for comparison: Canada, Denmark, Finland, Germany, Netherlands, New Zealand, Norway, Sweden, United Kingdom (UK) and the United States (US).
Data extractionWe selected 13 abortion variables for extraction based on a review and synthesis of the literature and national and international reports on abortion.11,17-19 These included: incidence, rate, indication for abortion, method of abortion, gestational age at time of abortion, type of service (public vs. private or hospital vs. clinic), contraception, previous abortion, previous mode of birth, sexual transmitted infection (STI) screening, information about funding for procedure, complications, and adolescent female population.
National abortion data for the 10 comparison countries were retrieved from databases on government websites for five countries (Denmark, Finland, Germany, Sweden and the UK) and from reports for three countries (Netherlands, Norway and the US) and both Australian states (South Australia and Western Australia). In addition, data was retrieved for Canada and New Zealand from a combination of website databases and reports. National-level abortion data were collected differently in each country. For example, in New Zealand, a Notification of Abortion form is submitted for each procedure,20 while in the US the Centers for Disease Control and Prevention (CDC) requests data from the 52 central health agencies in the country.21 In the UK, authorised medical practitioners are required to submit an Abortion Notification form (HSA4) to the Ministry of Health for each procedure;19 similarly, in Finland a specific form is submitted for each procedure to the National Institute for Health and Welfare.22 The data were available in a range of formats, including: ‘data cubes’ where the type of information could be manipulated into a tabular format and easily extracted; spreadsheets, with various iterations of how the different types of data is presented; and through yearly reports that included the information in tables and within the texts. Different types of abortion information, e.g. incidence, gestational age or method, for a country were at times identified in different formats, e.g. data cube and report.
Data analysisFor countries where the adolescent-specific abortion rate was not reported, rates were calculated using incidence data for abortions in women under the age of 20 years and population data for women under the age of 20 years. Rates were only calculated if the incidence age range and population age range were the same. This allowed for a maximum 10-year trend analysis for each country, where data were available.
Results
Abortion data from 2007 to 2017 were extracted for all 11 countries, except for the US where only nine years of data (2007–2015) were available. All countries and two Australian states had abortion incidence data disaggregated for the adolescent population. Gestational age at time of abortion was the second-most available disaggregated abortion variable.
Data availabilityTable 1 describes data sources and detail for each country. Some variables were available for the whole population, but not disaggregated by age. The UK had the most data available, with nine of the 13 variables disaggregated by age. Canada and Germany reported on a higher number of abortion variables across the whole population, while only having one or two disaggregated by age.
In Finland and the UK, each of the grounds were stated and disaggregated by age, e.g. foetal defect, prevent injury to a woman’s physical or mental health, etc. Some countries, such as Finland, provided greater details regarding the method of abortion, e.g. suction curettage, induced by drugs etc, while the other countries (Sweden, the UK and the US) noted only surgical or medical method (data not shown). No data concerning abortion complications was disaggregated by age. Four countries/states (South Australia, Netherlands, New Zealand, and the US) provided complications data for the whole population (data not shown).
Adolescent abortion incidence rate and trendFigure 1 shows the incidence rate of abortion incidence per 1,000 women aged 15 to 19 years, across a 10-year period, for seven countries and two Australian states. For some countries, age group data was limited to ‘under 20’ or ‘19 years and younger’ with the lower age of the age range not stated. There was a downward trend in the abortion incidence rate among adolescents aged <20 years for all countries. The steepest decline in the incidence rate was in New Zealand, where it declined from 26.7 per 1,000 women aged 15–19 years in 2007 to 9.2 per 1,000 women aged 15 to 19 years of age in 2017. In contrast, Germany and the Netherlands showed less marked declines.
Gestational age dataFigure 2 shows the most recent gestational age at time of abortion data for adolescents <20 years for six countries. Data is stratified by first and second trimester; however, as each country aggregates the information differently, the gestational age for each country cannot be directly compared. First trimester ranges from ≤11 weeks, ≤12 weeks and ≤13 weeks. Most abortions among adolescents occur during the first trimester. In Norway, 96% of abortions occurred at 12 weeks or earlier in 2017. This was the highest

2019 vol. 43 no. 6 Australian and New Zealand Journal of Public Health 579© 2019 The Authors
Adolescent Health Adolescent abortion data in high-income countries
Table 1: Country’s abortion statistics disaggregated and made available for adolescent population.
Country Source abortion data Year
Incid
ence
Incid
ence
rate
Indi
catio
ns fo
r abo
rtion
a
Met
hod o
f abo
rtion
b
Gesta
tiona
l age
c
Publ
ic/pr
ivate
or
hosp
ital/c
linicd
Cont
race
ptio
ne
Prev
ious
abor
tion f
Prev
ious
deliv
eryg
STI s
creen
ingh
Info
rmat
ion o
n fun
ding
fo
r pro
cedu
rei
Com
plica
tions
j
Australia - South Australia SA Health36 2007–2015 Yes Yes — — — — — Yes — — — — - Western Australia Department of Health Western Australia 37 2007 - 2015 Yes Yes — — — — — — — — — —Canada Canadian Institute for Health Information38 2007 - 2016 Yes — — — — Yes — — — — — —Denmark Statistics Denmark39 2007 - 2015 Yes — — — — — — — — — — —Finland National Institute for Health and Welfare40 2007 - 2017 Yes — Yes Yes Yes — Yes Yes Yes — — —Germany Federal Health Monitoring System
[Gesundheitsberichterstattung des Bundes]412007 - 2017 Yes — — — — — — — — — — —
Netherlands Health and Youth Care Inspectorate [Inspectie Gezondheidszorg en Jeugd]42
2007 - 2016 Yes — — — — — — — — — — —
New Zealand Statistics New Zealand Tatauranga Aotearoa20 2007 - 2017 Yes Yes — — Yes — Yes Yes Yes — — —Norway Norwegian Institute of Public Health
[Folkehelseinstituttet]432008 - 2017 Yes Yes — — Yes — — — — — — —
Sweden The National Board of Health and Welfare [Socialstyrelsen]44
2014 - 2017, 2007 - 2010
Yes Yes — Yes Yes — — Yes — — — —
United Kingdom Department of Health and Social Care45 2007 - 2017 Yes Yes Yes Yes Yes — — Yes Yes Chlamydia Yes —United States Centers for Disease Control and Prevention35 2007 - 2015 Yes Yes — — Yes — — — — — — —Notes:a: Indications for abortion are the legal grounds which woman are having their abortion.b: Method of abortion is whether it was carried out by medical or surgical abortion method.c: Gestational age is the weeks of gestation that the women was at when she had the abortion.d: Type of service is whether the abortion was carried out at a private or public service or whether it was carried out at a hospital or clinic.e: Contraception data was what women were using before the abortion and their choice of method after the procedure.f: Previous abortion is the number of previous pregnancies resulting in an abortion.g: Previous deliveries are the number of previous pregnancies that resulted in a delivery.h: STI screening is whether the woman was screened for an STI when they came for their abortion.i: Information about funding for the procedure is around whether it was publicly funded, privately funded or the woman had to pay herself.j: Complications which are abortion related morbidity.
proportion among all countries where data were available. In the US, approximately 25% of abortions among those aged <15 years occur >13 weeks. Among adolescents in New Zealand, the UK and the US, approximately 13% of abortions occurred >12 weeks and 13 weeks, respectively, which is higher when compared to other countries.
Discussion
This study reports for the first time adolescent disaggregated abortion data and trends in 10 high-income countries and two Australian states to provide insights for strengthening national data collection and reporting in Australia. There was a lack of consistency and considerable variation in the abortion data available on adolescents across countries. Despite these shortcomings, we noted a downward trend in abortion incidence rate over 10 years from 2007 to 2017 and substantial variability in gestational age at abortion across countries.
Although adolescents are a highly vulnerable population, information is usually not reported separately. Further, this lack of information is compounded by the absence of standardisation in basic reporting of age and gestation of abortion data for adolescents, negatively affecting the utility of the data.
The decline in abortion incidence over 10 years concurs with Sedgh et al.’s similar downward trend among women 15–44 years in Europe and Northern America.23 This might be attributed to improved contraception use,12 as well as increased health literacy, education, later age of first sexual encounter and greater access to services. Data from New Zealand showed the largest decrease in abortion incidence over the 10-year period, which has been postulated as being linked to the increased uptake of subsidised LARC24-26 and rise in the percentage of adolescents who are delaying the initiation of sexual behaviour.27 More research is required to understand the factors for this trend in
the adolescent population in high-income countries.
More than 90% of abortions in Finland, Norway and Sweden occurred during the first trimester. In Norway and Sweden, early access to abortion is likely to be facilitated by legislation that permits induced abortion on request.28 However, in Finland, a woman must justify why she cannot continue with her pregnancy to one doctor who is required to consent if the woman is under 17 years of age.29,30 Despite the legal differences in these countries, induced abortion is viewed as a standard component of public healthcare,31 which may help to ensure access to quality information about abortion and services for adolescents.
The UK and Finland stand out as collecting the most comprehensive abortion data. The UK collected the most abortion information – nine variables – that was disaggregated by age. The information is comprehensive as it covers various aspects around incidence, legal indications, method, gestational
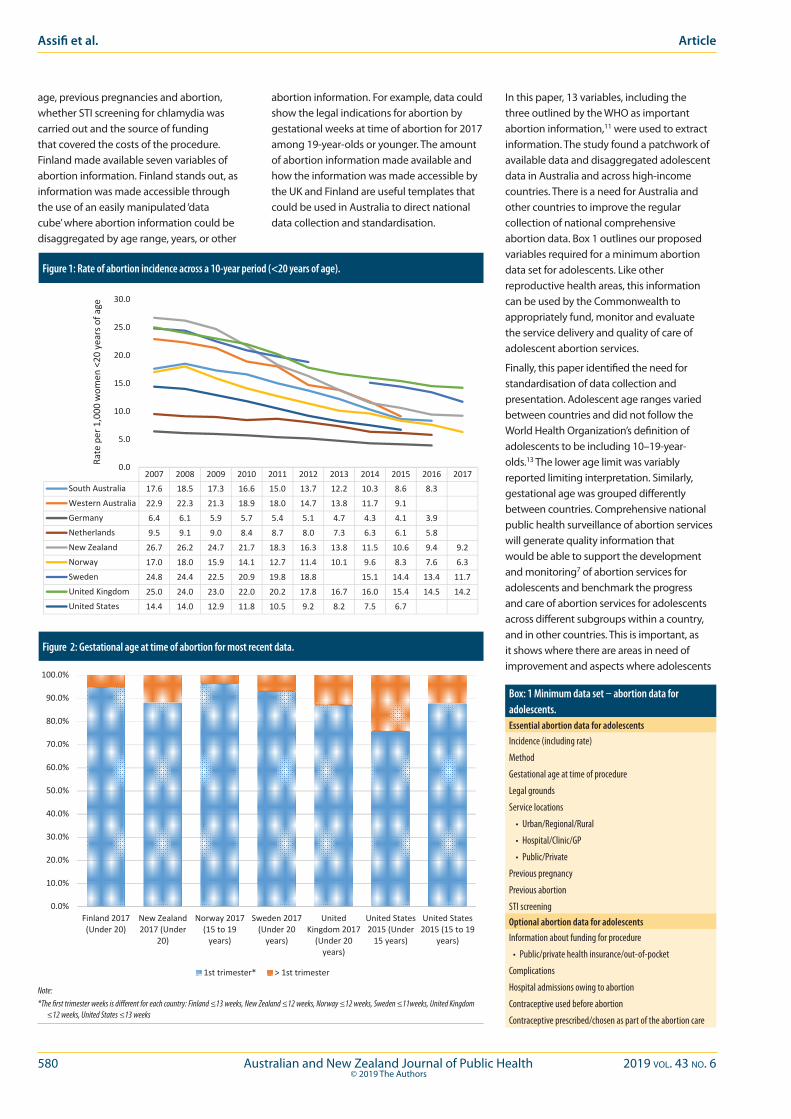
580 Australian and New Zealand Journal of Public Health 2019 vol. 43 no. 6© 2019 The Authors
In this paper, 13 variables, including the three outlined by the WHO as important abortion information,11 were used to extract information. The study found a patchwork of available data and disaggregated adolescent data in Australia and across high-income countries. There is a need for Australia and other countries to improve the regular collection of national comprehensive abortion data. Box 1 outlines our proposed variables required for a minimum abortion data set for adolescents. Like other reproductive health areas, this information can be used by the Commonwealth to appropriately fund, monitor and evaluate the service delivery and quality of care of adolescent abortion services.
Finally, this paper identified the need for standardisation of data collection and presentation. Adolescent age ranges varied between countries and did not follow the World Health Organization’s definition of adolescents to be including 10–19-year-olds.13 The lower age limit was variably reported limiting interpretation. Similarly, gestational age was grouped differently between countries. Comprehensive national public health surveillance of abortion services will generate quality information that would be able to support the development and monitoring7 of abortion services for adolescents and benchmark the progress and care of abortion services for adolescents across different subgroups within a country, and in other countries. This is important, as it shows where there are areas in need of improvement and aspects where adolescents
Figure 1 Rate of abortion incidence across a 10‐year period (<20 years of age)
2007 2008 2009 2010 2011 2012 2013 2014 2015 2016 2017South Australia 17.6 18.5 17.3 16.6 15.0 13.7 12.2 10.3 8.6 8.3
Western Australia 22.9 22.3 21.3 18.9 18.0 14.7 13.8 11.7 9.1
Germany 6.4 6.1 5.9 5.7 5.4 5.1 4.7 4.3 4.1 3.9
Netherlands 9.5 9.1 9.0 8.4 8.7 8.0 7.3 6.3 6.1 5.8
New Zealand 26.7 26.2 24.7 21.7 18.3 16.3 13.8 11.5 10.6 9.4 9.2
Norway 17.0 18.0 15.9 14.1 12.7 11.4 10.1 9.6 8.3 7.6 6.3
Sweden 24.8 24.4 22.5 20.9 19.8 18.8 15.1 14.4 13.4 11.7
United Kingdom 25.0 24.0 23.0 22.0 20.2 17.8 16.7 16.0 15.4 14.5 14.2
United States 14.4 14.0 12.9 11.8 10.5 9.2 8.2 7.5 6.7
0.0
5.0
10.0
15.0
20.0
25.0
30.0
Rate per 1,000
wom
en <20
years of age
Figure 1: Rate of abortion incidence across a 10-year period (<20 years of age).
Figure 2 Gestational age at time of abortion for most recent data
*The first trimester weeks is different for each country: Finland ≤13 weeks, New Zealand ≤12 weeks,
Norway ≤12 weeks, Sweden ≤11weeks, United Kingdom ≤12 weeks, United States ≤13 weeks
0.0%
10.0%
20.0%
30.0%
40.0%
50.0%
60.0%
70.0%
80.0%
90.0%
100.0%
Finland 2017(Under 20)
New Zealand2017 (Under
20)
Norway 2017(15 to 19years)
Sweden 2017(Under 20years)
UnitedKingdom 2017(Under 20years)
United States2015 (Under15 years)
United States2015 (15 to 19
years)
1st trimester* > 1st trimester
Figure 2: Gestational age at time of abortion for most recent data.
Note:*The first trimester weeks is different for each country: Finland ≤13 weeks, New Zealand ≤12 weeks, Norway ≤12 weeks, Sweden ≤11weeks, United Kingdom
≤12 weeks, United States ≤13 weeks
age, previous pregnancies and abortion, whether STI screening for chlamydia was carried out and the source of funding that covered the costs of the procedure. Finland made available seven variables of abortion information. Finland stands out, as information was made accessible through the use of an easily manipulated ‘data cube’ where abortion information could be disaggregated by age range, years, or other
abortion information. For example, data could show the legal indications for abortion by gestational weeks at time of abortion for 2017 among 19-year-olds or younger. The amount of abortion information made available and how the information was made accessible by the UK and Finland are useful templates that could be used in Australia to direct national data collection and standardisation.
Box: 1 Minimum data set – abortion data for adolescents.Essential abortion data for adolescentsIncidence (including rate)
Method
Gestational age at time of procedure
Legal grounds
Service locations
• Urban/Regional/Rural
• Hospital/Clinic/GP
• Public/Private
Previous pregnancy
Previous abortion
STI screeningOptional abortion data for adolescentsInformation about funding for procedure
• Public/private health insurance/out-of-pocket
Complications
Hospital admissions owing to abortion
Contraceptive used before abortion
Contraceptive prescribed/chosen as part of the abortion care
Assifi et al. Article
2019 vol. 43 no. 6 Australian and New Zealand Journal of Public Health 581© 2019 The Authors
health is tracking well – or not.32 Both CDC (2012) and Roberts et al. (2017) discuss the importance that standardisation of information has when it comes to comparing data nationally and internationally.33,34 In the US, the CDC collects standardised abortion data by providing a template to abortion providers on the aggregation, compilation and categorisation of abortion information to be collected and provided to them,35 ensuring consistent, comparable national abortion information is received across all states.21
Conclusion
Australia lags behind other high-income countries in its surveillance of abortion service provision and outcomes for women of reproductive age and adolescents. Policy, planning and delivery of services are therefore not based on evidence. For complex health issues, such as adolescent abortion, the development of nationally and internationally consistent data and indicators is warranted. To develop appropriate policies and services and promote transparency, national level standardised disaggregated information needs to be collected and made publicly available. As proposed in this paper, a minimum data set of abortion information for adolescents needs to be nationally collected across all abortion services, both publicly and privately, in Australia. This helps to prevent the adolescent population from being continually overlooked and supports the recognition that adolescents require appropriate quality abortion care and support. There needs to be equivalency in standards of data collection, availability and how information is disaggregated and made available when it comes to abortion, as compared to other reproductive health areas. In this paper, national-level collection and standardisation of abortion data is seen to not only be needed in Australia, but across other high-income countries as well.
References1. Hargreaves DS, Greaves F, Levay C, Mitchell I, Koch U,
Esch T, et al. Comparison of health care experience and access between young and older adults in 11 high-income countries. J Adolesc Health. 2015;57:413-20.
2. Guttmacher Institute. Fact Sheet - Adolescents’ Need for and Use of Abortion Services In Developing Countries. New York (NY): The Institute; 2016 [cited 2018 Feb 9]. Available from: https://www.guttmacher.org/fact-sheet/adolescents-need-and-use-abortion-services-developing-countries
3. Hanschmidt F, Linde K, Hilbert A, Riedel-Heller SG, Kersting A. Abortion Stigma: A Systematic Review. Perspect Sex Reprod Health. 2016;48(4):169-77.
4. Walker J, McNamee K, Kaldor JK, Donovan B, Fairley CK, Pirotta M, et al. The incidence of induced abortion in a prospective cohort study of 16- to 25-year-old Australian women. Sex Health. 2011;8:439-41.
5. Azzopardi P, Kennedy E, Patton G. Data and Indicators to Measure Adolescent Health, Social Development and Well-being. Florence (ITA): United Nations International Children’s Emergency Fund Office of Research; 2017.
6. Patton GC, Sawyer SM, Santelli JS, Ross DA, Afifi R, Allen NB, et al. Our future: A Lancet commission on adolescent health and wellbeing. Lancet. 2016;387:2423-78.
7. Groseclose SL, Buckeridge DL. Public health surveillance systems: Recent advances in their use and evaluation. Annu Rev Public Health. 2017;38:57-79.
8. Chan A, Sage LC. Estimating Australia’s abortion rates 1985 - 2003. Med J Aust. 2005;182(9):447-52.
9. Grayson N, Hargreaves J, Sullivan EA. Use of Routinely Collected National Data Sets for Reporting on Induced Abortion in Australia. Sydney (AUST): Australian Institute of Health and Welfare; 2005.
10. Nickson C, Smith AM, Shelley JM. Intention to claim a Medicare rebate among women receiving private Victorian pregnancy termination services. Aust N Z J Public Health. 2004;28(2):120-3.
11. World Health Organization. Safe Abortion: Technical and Policy Guidance for Health Systems. Geneva (CHE): WHO; 2012.
12. Singh S, Remez L, Sedgh G, Kwok L, Onda T. Abortion Worldwide 2017: Uneven Progress and Unequal Access. New York (NY): Guttmacher Institute; 2018.
13. World Health Organization. Health for World’s Adolescents. Geneva (CHE): WHO; 2014.
14. The World Bank. New Country Classifications by Income Level: 2018-2019 [Internet]. Washington (DC): The Bank; 2018 [cited 2018 Aug 14]. Available from: https://blogs.worldbank.org/opendata/new-country-classifications-income-level-2018-2019
15. The World Bank. The World Bank Atlas Method - Detailed Methodology [Internet]. Washington (DC): The Bank; 2018 [cited 2018 Aug 14]. Available from: https://datahelpdesk.worldbank.org/knowledgebase/articles/378832-what-is-the-world-bank-atlas-method
16. Schneider EC, Sarnak DO, Squires D, Shah A, Doty MM. Mirror, Mirror 2017: International Comparison Reflects Flaws and Opportunities for Better U.S. Health Care. Washington (DC): The Commonwealth Fund; 2017.
17. Ganatra B, Gerdts C, Rossier C, Johnson BR, Tunçalp Ö, Assifi A, et al. Global, regional, and subregional classification of abortions by safety, 2010–14: Estimates from a Bayesian hierarchical model. Lancet. 2017;390(10110):2372-81.
18. Knowles A, Stone P, Le Grice J, Parker G, Ross S, Wise M, et al. Standards of Care for Women Requesting Abortion in Aotearoa New Zealand: Report of a Standards Committee to the Abortion Supervisory Committee. Wellington (NZ): New Zealand Ministry of Justice; 2018.
19. Department of Health and Social Care. Abortion Statistics in England and Wales:2018 [Internet]. London (UK): Government of United Kingdom; 2019 [cited 2019 Aug 19]. Available from: https://www.gov.uk/government/collections/abortion-statistics-for-england-and-wales
20. Statistics New Zealand. Abortion Statistics. Wellington (NZ): Government of New Zealand; 2018.
21. Jatlaoui TC, Shah J, Mandel MG, Krashin JW, Suchdev DB, Jamieson DJ, et al. Abortion Surveillance - United States, 2014. Atlanta (GA): Centers for Disease Control and Prevention; 2017.
22. National Institute for Health and Welfare. Register of Induced Abortions [Internet]. Helsinki (FIN): NIHW; 2015 [cited 2019 Aug 19]. Available from: https://thl.fi/en/web/thlfi-en/statistics/information-on-statistics/register-descriptions/register-of-induced-abortions
23. Sedgh G, Bearak J, Singh S, Bankole A, Popinchalk A, Ganatra B, et al. Abortion incidence between 1990 and 2014: Global, regional, and subregional levels and trends. Lancet. 2016;388:258-67.
24. Whitley C. Improved Access to Long-acting Reversible Contraception (LARC) and the Declining Abortion Rate. Otago (NZ): University of Otago; 2018.
25. Family Planning New Zealand. Contraceptive Subsidy Announcement Advocacy in Action [Internet]. Wellington (NZ): Family Planning; 2010 [cited 2019 Apr 4]. Available from: https://www.familyplanning.org.nz/news/2010/contraceptive-subsidy-announcement-advocacy-in-action
26. Rose SB, Garrett SM. Post-abortion initiation of long-acting reversible contraception in New Zealand. J Fam Plann Reprod Health Care. 2015;41:197-204.
27. Clark TC, Lucassen MFG, Fleming T, Peiris-John R, Ikihele A, Teevale T, et al. Changes in the sexual health behaviours of New Zealand secondary school students, 2001-2012 findings from a national survey series. Aust N Z J Public Health. 2016;40(4):329-36.
28. Heino A, Gissler M. Induced Abortions in the Nordic Countries 2017. Helsinki (FIN): National Institute for Health and Welfare; 2019.
29. Tiitinen A. Induced Termination of Pregnancy. Helsinki (FIN): Duodecim Terveyskirjasto; 2018.
30. Finland Ministry of Justice. Law No 239 of 24 March 1970 on the Interruption of Pregnancy.
31. Askola H. Dropping the ball or holding the line? Challenges to abortion laws in the Nordic countries. Womens Stud Int Forum. 2018;66:25-32.
32. Azzopardi PS, Hearps SJ, Francis KL, Kennedy EC, Mokdad AH, Kassebaum NJ, et al. Progress in adolescent health and wellbeing: Tracking 12 headline indicators for 195 countries and territories, 1990 - 2016. Lancet. 2019;393:1101-18.
33. Centers for Disease Control and Prevention. CDC’s Vision for Public Health Surveillance in the 21st Century. Atlanta (GA): United States Department of Health and Human Services; 2012.
34. Roberts SC, Fuentes L, Berglas NF, Dennis AJ. A 21st-century public health approach to abortion. Am J public Health. 2017;107:1878-82.
35. Jatlaoui TC, Boutot ME, Mandel MG, Whiteman MK, Ti A, Petersen E, et al. Abortion Surveillance - United States 2015. MMWR Surveill Summ. 2018;67(SS-13):1–45.
36. SA Health. Pregnancy Outcome Statistics [Internet]. Adelaide (AUST): State Government of South Australia; 2018 [cited 2018 Dec 11]. Available from: https://www.sahealth.sa.gov.au/wps/wcm/connect/public+content/sa+health+internet/about+us/health+statistics/pregnancy+outcome+statistics
37. WA Department of Health. Reports on Induced Abortions in Western Australia [Internet]. Perth (AUST): State Government of Western Australia; 2018 [cited 2018 Sep 4]. Available from: https://ww2.health.wa.gov.au/Reports-and-publications/Reports-on-induced-abortions-in-Western-Australia
38. Canadian Institute for Health Information. Access Data and Reports – Abortion [Internet]. Ottawa (CAN): CIHI; 2018 [cited 2018 Nov 11]. Available from: https://www.cihi.ca/en/access-data-reports/results?query=abortion&Search+Submit=
39. Statistics Denmark. Abortions by Age – Discontinued [Internet]. Copenhagen (DNK): Government of Denmark; 2015 [cited 2018 Aug 16]. Available from: http://www.statbank.dk/ABORT
40. Finnish Institute for Health and Welfare. Induced Abortions in 2014 [Internet]. Helsinki (FIN): THL; 2015 [cited 2018 Aug 16]. Available from: https://www.thl.fi/en/web/thlfi-en/statistics/statistics-by-topic/sexual-and-reproductive-health/abortions/induced-abortions
41. Federal Statistical Office. Statistics on Termination of Pregnancy [Internet]. Berlin (GER): In: www.gbe-bund.de; 2018 [cited 2018 Aug 16]. Available from: http://www.gbe-bund.de/gbe10/hrecherche.prc_herkunft_rech?tk=51310&tk2=51311&p_fid=424&p_uid=gast&p_aid=82665885&p_sprache=E&cnt_ut=1&ut=51311
42. Netherlands HealthCare and Youth Inspection. 2016 Annual Report of the Termination Pergnancy Law.
43. Løkeland M, Heiberg-Andersen R, Akerkar R, Pedersen Y, Bøyum B, Hornæs M, et al. Report on Termination of Pregnancy for 2017. Bergen (NOR): Norwegian Institute of Public Health; 2018.
44. The National Board of Social Service. Statisitcs on Abortion [Internet]. Stockholm (SWE): Board and Departments; 2015 [cited 2018 Aug 16]. Available from: http://www.socialstyrelsen.se/omsocialstyrelsen/organisation
45. Department of Health and Social Care. Collection - Abortion Statistics in England and Wales [Internet]. Government of United Kingdom; 2018 [cited 2018 Aug 23]. Available from: https://www.gov.uk/government/collections/abortion-statistics-for-england-and-wales
Adolescent Health Adolescent abortion data in high-income countries

582 Australian and New Zealand Journal of Public Health 2019 vol. 43 no. 6© 2019 The Authors
Access to healthcare is an important social determinant of health. Barriers to healthcare for young people in
Australia and internationally are well known, with confidentiality concerns consistently cited as the most important.1-3 Technology has the potential to improve access to healthcare; for example, through enhancing access to information about health and health services as well as young people’s ability to communicate with services.3 However, relatively few studies have examined its role in these activities.4
To achieve equitable health outcomes across populations, including those who are marginalised, access must also be equitable.5 Marginalised young people experience access barriers common to all young people, such as lack of suitable services, cost and lack of health literacy.3 However, these are exacerbated for certain marginalised young people. For example, structural barriers have been highlighted for homeless young people6 and confidentiality concerns have been identified as a significant concern by rural young people.7 Further, some marginalised groups of young people also experience barriers around language and culture, discrimination and stigmatisation.3
This study aimed to quantify young people’s barriers to healthcare access and their predictors to examine how these vary by
socio-demographic and socio-cultural factors, including marginalisation, and the role of technology in help-seeking.
Methods
DesignA cross-sectional survey was conducted as one component of a larger study, known as Access 3. The detailed Access 3 study protocol
paper has been published.8 Youth consultants provided advice on the survey instrument, recruitment methods, interpretation of findings, policy translation and dissemination.
SampleParticipants were a non-probability sample of young people aged 12 to 24 years living in New South Wales (NSW), Australia, with oversampling of five marginalised groups:
Predictors of young people’s healthcare access in the digital ageFiona Robards,1 Melissa Kang,1,2 Georgina Luscombe,3 Lena Sanci,4 Katharine Steinbeck,5 Stephen Jan,6 Catherine Hawke,3 Marlene Kong,7 Tim Usherwood1,6
1. Department of General Practice, The University of Sydney, Westmead Clinical School, New South Wales2. Australian Centre for Public and Population Health Research, University of Technology Sydney, New South Wales3. School of Rural Health, The University of Sydney, New South Wales4. Department of General Practice, University of Melbourne, Victoria5. Discipline of Child and Adolescent Health, The University of Sydney, New South Wales6. The George Institute for Global Health, University of New South Wales 7. The Kirby Institute, University of New South WalesCorrespondence to Ms Fiona Robards, Department of General Practice, The University of Sydney, PO Box 154, Westmead, New South Wales 2145;
e-mail: [email protected]: December 2018; Revision requested: August 2019; Accepted: August 2019The authors have stated they have no conflict of interest.This is an open access article under the terms of the Creative Commons Attribution-NonCommercial-NoDerivs License, which permits use and distribution in any medium,
provided the original work is properly cited, the use is non-commercial and no modifications or adaptations are made.
Aust NZ J Public Health. 2019; 43:582-8; doi: 10.1111/1753-6405.12936
Abstract
Objective: To quantify barriers to healthcare for young people (12–24 years) and identify socio-demographic correlates and predictors.
Methods: This cross-sectional survey targeted young people living in New South Wales, Australia, with oversampling of marginalised groups. Principles Component Analysis (PCA) identified clusters of barriers. Ordinal regression identified predictors of each barrier cluster.
Results: A total of 1,416 young people completed surveys. Participants with chronic conditions and increasing psychological distress reported a greater number of barriers. Of 11 potential barriers to visiting a health service, cost was most common (45.8%). The PCA identified three clusters: structural barriers (61.3%), attitudinal barriers (44.1%) and barriers relating to emerging autonomy (33.8%).
Conclusions: Barriers to healthcare reported by young people are multi-dimensional and have changed over time. Structural barriers, especially cost, are the most prominent among young people. Approaches to overcome structural barriers need to be addressed to better support marginalised young people’s healthcare access.
Implications for public health: Understanding predictors of different barrier types can inform more targeted approaches to improving access. Equitable access to healthcare is a priority for early diagnosis and treatment in young people, especially reducing out of pocket costs.
Key words: young people, adolescents, access to healthcare, marginalised youth, technologies
ADOLESCENT HEALTH

2019 vol. 43 no. 6 Australian and New Zealand Journal of Public Health 583© 2019 The Authors
Aboriginal and/or Torres Strait Islander; living in rural/remote areas; homeless; refugee or vulnerable migrants; and sexuality and/or gender diverse.
RecruitmentRecruitment comprised online and offline strategies. Online recruitment included targeted emails to youth-relevant networks, social media (Facebook, Twitter and Instagram) and opportunistic online promotion of the survey. Offline recruitment occurred face-to-face in youth accommodation services and youth forums. To purposively sample marginalised young people, we worked with networks and advocates from a range of community-based organisations using convenience and snowball sampling methods to achieve our sample size. Participants went into a draw to win one of 20 vouchers worth A$50 upon survey completion.
Data collectionThe anonymous questionnaire was administered online using LimeSurvey, a survey web application,9 or via hardcopy. The study period was from February 2016 to February 2017. Consent was implied by survey completion.
Measures/instrumentQuestionnaire development was guided by published evidence10,11 about barriers to access and health service ‘youth-friendliness’ indicators. Questions about the impact of technology on whether, when and how to access healthcare were included. Demographic data were collected and the ABS socioeconomic index for areas (SEIFA) Index for Relative Socioeconomic Advantage and Disadvantage (IRSAD) and having a Health Care Card were used as proxy measures for respondent’s socioeconomic status.
The identification of marginalised groups was based on self-reported survey responses. Rurality was calculated using postcode data and the Australian Bureau of Statistics (ABS) Australian Standard Geographic Classification (ASGC) Remoteness Structure and defined to include rural (inner and outer regional) and remote (remote and very remote). Homelessness was identified based on living situation (e.g. living with relatives, friends, in foster care, in a refuge/supported accommodation, boarding house, on the
street/outside), using the Australian cultural definition of homelessness.12
Health status was measured by self-assessed health status,13 the Kessler 10 (K10) questionnaire that measures psychological distress14 and presence of chronic physical and/or mental health conditions or disability selected from a predefined list.
Participants were asked about attitudes towards accessing healthcare and health service utilisation within the previous six months. They selected one or more responses from a list of eleven potential barriers that would prevent or stop them from accessing healthcare (see the Supplementary File for the survey questions).
Telephone numbers for youth support services were provided at the end of the survey for any young people wanting to access support. A contact number was also provided within the participant information sheet if young people wanted to get in touch about the study.
AnalysisData from paper surveys were entered into the same LimeSurvey database. Relationships among categorical demographic variables were explored using chi-square analyses (e.g. dichotomised age [12–17 years, 18–24 years] and number of marginalised groups: none, one, two or more). Where continuous data were skewed, they were reported as median and interquartile range (IQR). To examine the relationship with reported barriers, responses were explored using Principal Components Analysis (PCA) to reduce the number of items and determine if there were identifiable clusters of barriers. PCA with varimax rotation was first performed in a randomly selected ‘training set’ of 30% of the sample then repeated for independent validation in the remainder. For each, the Kaiser-Meyer-Olkin determined sample adequacy and items were retained if their eigenvalue was >1 and loading size >0.5.
To identify associations with barrier clusters or ‘types’, ordinal regression models were run, with the number of barriers identified within a cluster as the dependent variable. Model comparisons were based on likelihood ratio tests. Potential predictor variables in the model included age (years), gender (male, female, other), socioeconomic status (SEIFA IRSAD decile), had a Health Care Card, had private health insurance, marginalisation (belong to none, one or two or more of the
five marginalised groups), number of chronic health conditions, level of psychological distress (K10), number of health professional types other than general practitioners (GPs) seen in the previous six months (since most participants had visited a GP) and frequency of use of the internet to decide which health service to attend (not at all, sometimes, frequently). Analyses were conducted using IBM SPSS version 24,15 and alpha was set at 0.05 for all analyses.
EthicsEthics approval was obtained from the University of Sydney Human Research Ethics Committee and the Aboriginal Health and Medical Research Council of New South Wales Ethics Committee.
Results
Sample Of the 1,416 young people (12–24 years) who completed the survey (68.4% female, 28.7% males, and 3.0% other), 1,012 completed the survey online and 404 on hard copy. One hundred and twenty-nine (9.4%) had a parent, carer or someone from school to help them complete the survey. Eight hundred and ninety-seven participants (63.3%) belonged to at least one of the pre-defined marginalised groups (Table 1). Adolescents (12–17 years) were more likely than young adults (18–24 years) to belong to multiple marginalised groups (27.9%, 196/703 vs. 17.8%, 127/713; p<0.001). Table 1 summarises the socio-demographic characteristics of the sample.
Health statusHealth status is described in Table 1. While the majority of respondents rated their health as good to excellent (80.8%, 1,139/1,410), almost half had high or very high psychological distress according to the K10 (52.1%, 729/1,400). Male respondents were most likely to report very good to excellent health (54.7%, 221/404; female 40.0%, 386/964; other gender 26.2%, 11/42), and other gender respondents most likely to report poor to fair health (33.3%, 14/42; female 21.1%, 203/964, male 13.4%, 54/404; p<0.001). There was a significant association between gender and psychological distress (high/very high K10 scores): other gender (80.9%, n=34/42) respondents were more likely to experience significant psychological distress than female
Adolescent Health Young people’s healthcare access in the digital age
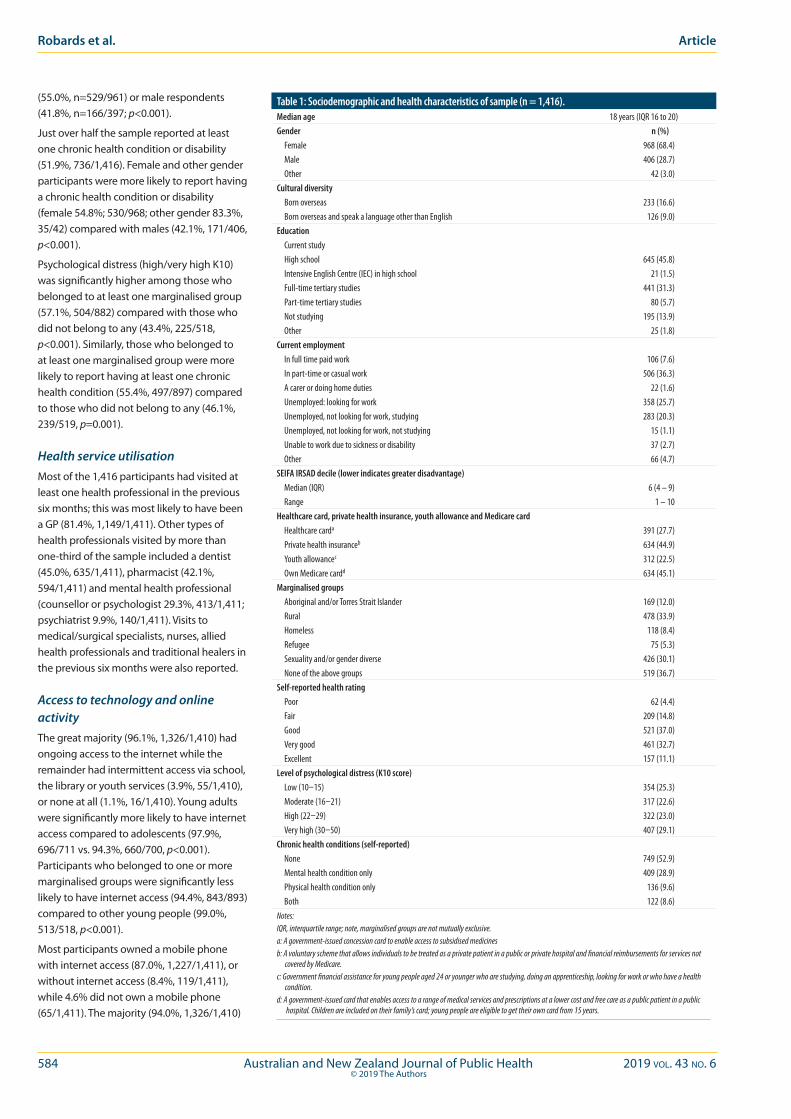
584 Australian and New Zealand Journal of Public Health 2019 vol. 43 no. 6© 2019 The Authors
(55.0%, n=529/961) or male respondents (41.8%, n=166/397; p<0.001).
Just over half the sample reported at least one chronic health condition or disability (51.9%, 736/1,416). Female and other gender participants were more likely to report having a chronic health condition or disability (female 54.8%; 530/968; other gender 83.3%, 35/42) compared with males (42.1%, 171/406, p<0.001).
Psychological distress (high/very high K10) was significantly higher among those who belonged to at least one marginalised group (57.1%, 504/882) compared with those who did not belong to any (43.4%, 225/518, p<0.001). Similarly, those who belonged to at least one marginalised group were more likely to report having at least one chronic health condition (55.4%, 497/897) compared to those who did not belong to any (46.1%, 239/519, p=0.001).
Health service utilisationMost of the 1,416 participants had visited at least one health professional in the previous six months; this was most likely to have been a GP (81.4%, 1,149/1,411). Other types of health professionals visited by more than one-third of the sample included a dentist (45.0%, 635/1,411), pharmacist (42.1%, 594/1,411) and mental health professional (counsellor or psychologist 29.3%, 413/1,411; psychiatrist 9.9%, 140/1,411). Visits to medical/surgical specialists, nurses, allied health professionals and traditional healers in the previous six months were also reported.
Access to technology and online activityThe great majority (96.1%, 1,326/1,410) had ongoing access to the internet while the remainder had intermittent access via school, the library or youth services (3.9%, 55/1,410), or none at all (1.1%, 16/1,410). Young adults were significantly more likely to have internet access compared to adolescents (97.9%, 696/711 vs. 94.3%, 660/700, p<0.001). Participants who belonged to one or more marginalised groups were significantly less likely to have internet access (94.4%, 843/893) compared to other young people (99.0%, 513/518, p<0.001).
Most participants owned a mobile phone with internet access (87.0%, 1,227/1,411), or without internet access (8.4%, 119/1,411), while 4.6% did not own a mobile phone (65/1,411). The majority (94.0%, 1,326/1,410)
Table 1: Sociodemographic and health characteristics of sample (n = 1,416).Median age 18 years (IQR 16 to 20)Gender n (%) Female 968 (68.4) Male 406 (28.7) Other 42 (3.0)Cultural diversity Born overseas 233 (16.6) Born overseas and speak a language other than English 126 (9.0)Education Current study High school 645 (45.8) Intensive English Centre (IEC) in high school 21 (1.5) Full-time tertiary studies 441 (31.3) Part-time tertiary studies 80 (5.7) Not studying 195 (13.9) Other 25 (1.8)Current employment In full time paid work 106 (7.6) In part-time or casual work 506 (36.3) A carer or doing home duties 22 (1.6) Unemployed: looking for work 358 (25.7) Unemployed, not looking for work, studying 283 (20.3) Unemployed, not looking for work, not studying 15 (1.1) Unable to work due to sickness or disability 37 (2.7) Other 66 (4.7)SEIFA IRSAD decile (lower indicates greater disadvantage) Median (IQR) 6 (4 – 9) Range 1 – 10Healthcare card, private health insurance, youth allowance and Medicare card Healthcare carda 391 (27.7) Private health insuranceb 634 (44.9) Youth allowancec 312 (22.5) Own Medicare cardd 634 (45.1)Marginalised groups Aboriginal and/or Torres Strait Islander 169 (12.0) Rural 478 (33.9) Homeless 118 (8.4) Refugee 75 (5.3) Sexuality and/or gender diverse 426 (30.1) None of the above groups 519 (36.7)Self-reported health rating Poor 62 (4.4) Fair 209 (14.8) Good 521 (37.0) Very good 461 (32.7) Excellent 157 (11.1)Level of psychological distress (K10 score) Low (10–15) 354 (25.3) Moderate (16–21) 317 (22.6) High (22–29) 322 (23.0) Very high (30–50) 407 (29.1)Chronic health conditions (self-reported) None 749 (52.9) Mental health condition only 409 (28.9) Physical health condition only 136 (9.6) Both 122 (8.6)Notes:IQR, interquartile range; note, marginalised groups are not mutually exclusive.a: A government-issued concession card to enable access to subsidised medicinesb: A voluntary scheme that allows individuals to be treated as a private patient in a public or private hospital and financial reimbursements for services not
covered by Medicare.c: Government financial assistance for young people aged 24 or younger who are studying, doing an apprenticeship, looking for work or who have a health
condition.d: A government-issued card that enables access to a range of medical services and prescriptions at a lower cost and free care as a public patient in a public
hospital. Children are included on their family’s card; young people are eligible to get their own card from 15 years.
Robards et al. Article

2019 vol. 43 no. 6 Australian and New Zealand Journal of Public Health 585© 2019 The Authors
Adolescent Health Young people’s healthcare access in the digital age
spent time online every day, and 51.6% (728/1,410) were online for 2–6 hours/day. Only 1.7% (24/1,410) did not spend time online. The times of day participants were most commonly online were evening (6–11pm, 60.9%, 856/1,405) and mid-afternoon (3–6pm, 21.3%, 299/1,405).
Barriers to accessing health services More than four-fifths (80.9%, 1,146/1,416) of the sample identified at least one barrier to accessing health services, with a median of two barriers (IQR 1–4). Frequencies of barriers are listed in Table 2. The most commonly cited barrier was ‘cost’ (45.8%, 649/1,416) and the least common was ‘language or cultural reasons’ (Table 2). When all 11 barriers were included in the PCA, a stable factor structure was not found. However, with the exclusion of ‘language or cultural reasons’ (barrier recognised by 5.9%, 83/1,416), three stable clusters of barriers emerged. Those who cited ‘language or cultural reasons’ were more likely to be older respondents (young adults 7.3%, 52/713 vs. adolescents 4.4%, 31/703, p<0.05), and those identifying as refugees (16.0%, 12/75 vs. 5.3%, 70/1,333, p=0.001).
The three clusters of barriers included: structural (61.3%), attitudinal (44.1%), and barriers relating to emerging autonomy (33.8%), see Table 2. Structural barriers included cost, opening hours and difficulty getting to the service. Attitudinal barriers included feeling embarrassed, feeling judged, the gender of the doctor/health professional and worry about confidentiality. Barriers relating to emerging autonomy included needing to ask parents/carers to take them, not having own Medicare card and not knowing which service/s to go to.
Predictors of barriers to access healthcarePredictors of barriers to access healthcare are described in Table 3. There were no substantial issues with multicollinearity between potential demographic and other predictors of barriers including psychological distress.
Predictors of structural barriers included older age (74.1%, 528/713 of young adults vs. 48.4%, 340/703 of adolescents, p<0.001), female gender (67.3%, 651/96 vs. 46.6%, 189/40 of males, p<0.001) and residing in a more socioeconomically advantaged area (higher SEIFA IRSAD, p<0.05). Those with higher psychological distress (66.0%, 481/729 vs. 56.9% 382/671], p<0.05) and an increasing number of chronic conditions or disability (p<0.01) were more likely to report structural barriers, as were participants who had seen more health professionals during the previous six months (p=0.001) and those who used the internet to decide which health service to go to (71.2%, 510/716 vs. 51.1%, 356/696, p<0.01). The model accounted for 19.2% of variance in the number of structural barriers recognised by participants (log likelihood Χ2=268.06, df=15, p<0.001).
Attitudinal barriers were more likely to be reported by female and other gender respondents (49.6%, 480/968 and 59.5%, 25/42 respectively), compared with males (29.3%, 119/406, p<0.001 and p<0.01), by those with private health insurance (50.3%, 319/634 vs. 39.2%, 305/779, p<0.05), those with more chronic conditions or disability (p<0.01) and with higher psychological distress (55.6%, 405/729 vs. 32.2%, 216/671, p<0.001). Young adults (43.9%, 313/713 vs. adolescents 44.2%, 311/703, p<0.05) and those with a Health Care Card were less likely
to report attitudinal barriers (40.2%, 157/391, vs. 45.7%, 467/1,022, p<0.01). Those who used the internet to decide which health service to go to were more likely to report attitudinal barriers (48.2%, 345/716), compared to those who did not use the internet for this purpose (40.1%, 279/696, p<0.05). The model accounted for 13.4% of variance in the number of attitudinal barriers recognised by participants (log likelihood Χ2=179.11, df=15, p<0.001).
Barriers relating to emerging autonomy were less likely to be reported with older age (young adults 22.3%, 159/713 vs. adolescents 45.5%, 320/703, p<0.001), by those with a Health Care Card (23.3%, 91/391 vs. 38.0%, 388/1,022 of those without, p<0.001) and those belonging to two or more marginalised groups (30.3%, 296/897 vs. 35.3%, 183/519 those belonging to none, p<0.05). Those with higher psychological distress were more likely to report barriers relating to emerging autonomy (42.4%, 309/729 vs. 24.9%, 167/671, p<0.001). The model accounted for 16.0% of variance in the number of barriers relating to emerging autonomy (log likelihood Χ2=196.72, df=15, p<0.001).
Discussion
This is the first Australian study to quantify barriers to healthcare among a large sample of young people, and to identify their association with a range of socio-demographic and socio-cultural factors, health status and technology use. To our knowledge, this is also the first study internationally to include substantial numbers of young people belonging to one or more marginalised groups, which allowed for measuring the effect of increasing marginalisation on access.
We found lower self-reported good health and higher psychological distress in our sample. Just 80.8% of study participants rated their health as good to excellent compared to 91.1% in a national representative sample of Australian young people (15–24 years) in 2014–2015.13 Our sample also had significantly higher levels of psychological distress compared to this population: 52.1% had high or very high K10 scores, compared to 11.7% of young Australians.13 The comparatively poor health status of our sample might be due to oversampling of marginalised groups, given the proportion with high or very high mental distress and the presence of a chronic health condition
Table 2: Final Principal Components Analysis on healthcare access barriers.Barrier N=1,416
[n %]Eigenvalue % of
varianceComponent
1Component
2Component
3
Attitudinal 624 (44.1) 2.45 24.54 I would feel embarrassed 393 (27.8) 0.77 -0.05 0.19 I would feel judged 287 (20.3) 0.78 -0.04 0.10 The gender of the doctor/health professional 267 (18.9) 0.59 0.21 -0.001 I worry about confidentiality 217 (15.3) 0.58 0.06 0.17Structural 868 (61.3) 1.47 14.72 Cost 649 (45.8) 0.01 0.64 0.21 Opening hours mean I need time off study or work 449 (31.7) 0.04 0.77 -0.16 Difficulty getting there 336 (23.7) 0.08 0.67 0.13Barriers relating to emerging autonomy 479 (33.8) 1.05 10.52 I would have to ask my parents/carers to take me 313 (22.1) 0.29 -0.04 0.52 I don’t have my own Medicare card 173 (12.2) -0.03 0.05 0.82 I don’t know which service/s to go to 165 (11.7) 0.20 0.20 0.55
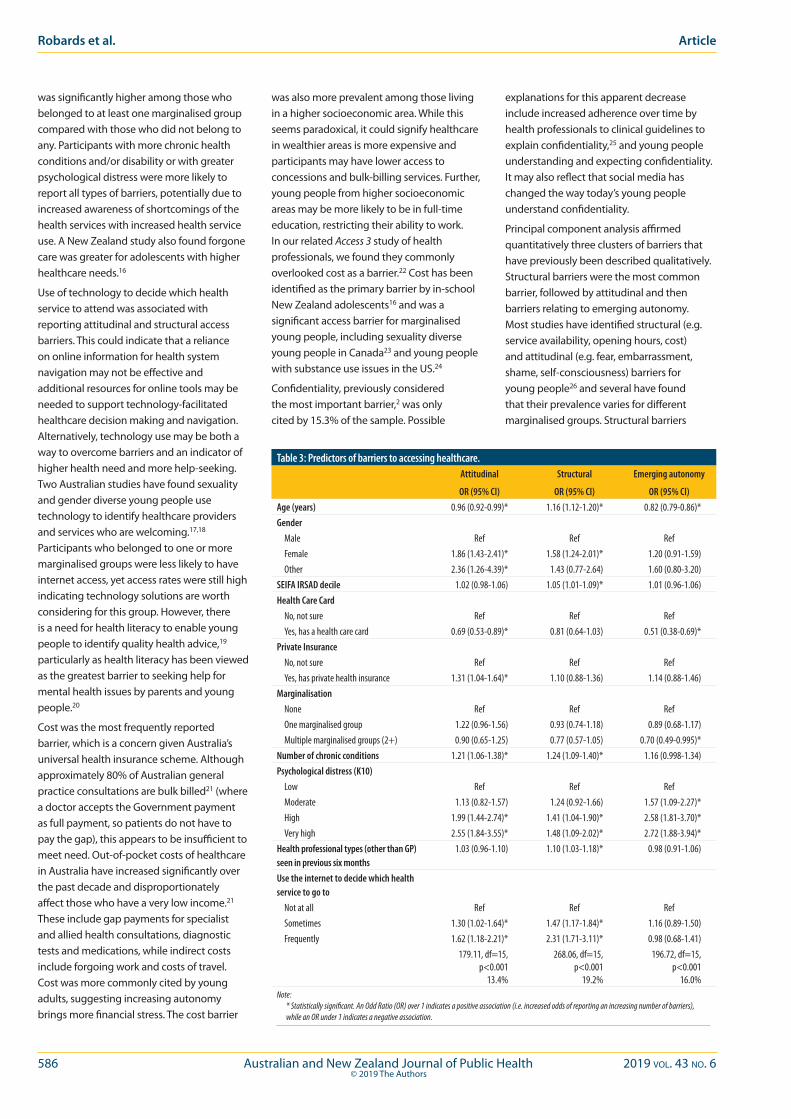
586 Australian and New Zealand Journal of Public Health 2019 vol. 43 no. 6© 2019 The Authors
was significantly higher among those who belonged to at least one marginalised group compared with those who did not belong to any. Participants with more chronic health conditions and/or disability or with greater psychological distress were more likely to report all types of barriers, potentially due to increased awareness of shortcomings of the health services with increased health service use. A New Zealand study also found forgone care was greater for adolescents with higher healthcare needs.16
Use of technology to decide which health service to attend was associated with reporting attitudinal and structural access barriers. This could indicate that a reliance on online information for health system navigation may not be effective and additional resources for online tools may be needed to support technology-facilitated healthcare decision making and navigation. Alternatively, technology use may be both a way to overcome barriers and an indicator of higher health need and more help-seeking. Two Australian studies have found sexuality and gender diverse young people use technology to identify healthcare providers and services who are welcoming.17,18 Participants who belonged to one or more marginalised groups were less likely to have internet access, yet access rates were still high indicating technology solutions are worth considering for this group. However, there is a need for health literacy to enable young people to identify quality health advice,19 particularly as health literacy has been viewed as the greatest barrier to seeking help for mental health issues by parents and young people.20
Cost was the most frequently reported barrier, which is a concern given Australia’s universal health insurance scheme. Although approximately 80% of Australian general practice consultations are bulk billed21 (where a doctor accepts the Government payment as full payment, so patients do not have to pay the gap), this appears to be insufficient to meet need. Out-of-pocket costs of healthcare in Australia have increased significantly over the past decade and disproportionately affect those who have a very low income.21 These include gap payments for specialist and allied health consultations, diagnostic tests and medications, while indirect costs include forgoing work and costs of travel. Cost was more commonly cited by young adults, suggesting increasing autonomy brings more financial stress. The cost barrier
was also more prevalent among those living in a higher socioeconomic area. While this seems paradoxical, it could signify healthcare in wealthier areas is more expensive and participants may have lower access to concessions and bulk-billing services. Further, young people from higher socioeconomic areas may be more likely to be in full-time education, restricting their ability to work. In our related Access 3 study of health professionals, we found they commonly overlooked cost as a barrier.22 Cost has been identified as the primary barrier by in-school New Zealand adolescents16 and was a significant access barrier for marginalised young people, including sexuality diverse young people in Canada23 and young people with substance use issues in the US.24
Confidentiality, previously considered the most important barrier,2 was only cited by 15.3% of the sample. Possible
explanations for this apparent decrease include increased adherence over time by health professionals to clinical guidelines to explain confidentiality,25 and young people understanding and expecting confidentiality. It may also reflect that social media has changed the way today’s young people understand confidentiality.
Principal component analysis affirmed quantitatively three clusters of barriers that have previously been described qualitatively. Structural barriers were the most common barrier, followed by attitudinal and then barriers relating to emerging autonomy. Most studies have identified structural (e.g. service availability, opening hours, cost) and attitudinal (e.g. fear, embarrassment, shame, self-consciousness) barriers for young people26 and several have found that their prevalence varies for different marginalised groups. Structural barriers
Table 3: Predictors of barriers to accessing healthcare.Attitudinal
OR (95% CI)
Structural
OR (95% CI)
Emerging autonomy
OR (95% CI)Age (years) 0.96 (0.92-0.99)* 1.16 (1.12-1.20)* 0.82 (0.79-0.86)*Gender Male Ref Ref Ref Female 1.86 (1.43-2.41)* 1.58 (1.24-2.01)* 1.20 (0.91-1.59) Other 2.36 (1.26-4.39)* 1.43 (0.77-2.64) 1.60 (0.80-3.20)SEIFA IRSAD decile 1.02 (0.98-1.06) 1.05 (1.01-1.09)* 1.01 (0.96-1.06)Health Care Card No, not sure Ref Ref Ref Yes, has a health care card 0.69 (0.53-0.89)* 0.81 (0.64-1.03) 0.51 (0.38-0.69)*Private Insurance No, not sure Ref Ref Ref Yes, has private health insurance 1.31 (1.04-1.64)* 1.10 (0.88-1.36) 1.14 (0.88-1.46)Marginalisation None Ref Ref Ref One marginalised group 1.22 (0.96-1.56) 0.93 (0.74-1.18) 0.89 (0.68-1.17) Multiple marginalised groups (2+) 0.90 (0.65-1.25) 0.77 (0.57-1.05) 0.70 (0.49-0.995)*Number of chronic conditions 1.21 (1.06-1.38)* 1.24 (1.09-1.40)* 1.16 (0.998-1.34)Psychological distress (K10) Low Ref Ref Ref Moderate 1.13 (0.82-1.57) 1.24 (0.92-1.66) 1.57 (1.09-2.27)* High 1.99 (1.44-2.74)* 1.41 (1.04-1.90)* 2.58 (1.81-3.70)* Very high 2.55 (1.84-3.55)* 1.48 (1.09-2.02)* 2.72 (1.88-3.94)*Health professional types (other than GP) seen in previous six months
1.03 (0.96-1.10) 1.10 (1.03-1.18)* 0.98 (0.91-1.06)
Use the internet to decide which health service to go to Not at all Ref Ref Ref Sometimes 1.30 (1.02-1.64)* 1.47 (1.17-1.84)* 1.16 (0.89-1.50) Frequently 1.62 (1.18-2.21)* 2.31 (1.71-3.11)* 0.98 (0.68-1.41)
179.11, df=15, p<0.001
13.4%
268.06, df=15, p<0.001
19.2%
196.72, df=15, p<0.001
16.0%Note:
* Statistically significant. An Odd Ratio (OR) over 1 indicates a positive association (i.e. increased odds of reporting an increasing number of barriers), while an OR under 1 indicates a negative association.
Robards et al. Article

2019 vol. 43 no. 6 Australian and New Zealand Journal of Public Health 587© 2019 The Authors
have been reported more frequently than personal barriers for homeless young people6; whereas, attitudinal barriers were more important for rural young people.7,27 All three groups of barriers – structural, attitudinal and barriers relating to emerging autonomy – were described in earlier Australian research among young people.11 Thus, while all clusters of barriers are important among young people, it is useful to recognise these might be influenced by psychosocial transitions that occur during adolescence.
Young people across the age spectrum experienced different types of barriers. Structural barriers were more commonly identified by young adults, while attitudinal barriers and those relating to emerging autonomy were associated with being younger. We are not aware of any studies that have quantified the effect of age on access barriers, perhaps because previous studies considered narrower age ranges.2,16,28 Barriers relating to emerging autonomy and attitudinal barriers were negatively associated with increasing age, presumably because as young people mature they are less affected by attitudinal and knowledge-based barriers. In contrast, structural barriers were positively associated with age. This may be due to adolescents gaining more independence from their parents but being challenged by taking increasing responsibility for healthcare access.
Young women had higher odds of citing an attitudinal or structural barrier, consistent with a New Zealand study where barriers were reported at higher levels by females aged 13–17.16 Since young women in our sample also reported more chronic illness and psychological distress, their presumed increased need to access healthcare could lead to identification of barriers. Females have also been found to be more likely to seek help and perceive help seeking as beneficial compared to males,29 but in doing so they may have similarly identified a range of attitudinal or structural barriers. Stigma, particularly in relation to sexuality and pregnancy, affects young women accessing healthcare.30 Other gender participants were more likely to cite attitudinal barriers and, consistent with other studies among transgender young people,18 they also had higher levels of psychological distress. We found participants who had seen a greater number of health professional types (other than GPs), during the previous six months were more likely to report structural barriers.
Similarly, it may be that these young people had more chronic illness and mental health concerns, resulting in a need to access more healthcare, leading to identification of more barriers.
Surprisingly, marginalisation was not a predictor of any barrier cluster. The paradoxical effect of increasing marginalisation being inversely associated with barriers relating to emerging autonomy was unexpected. This may be due to bias in our sample given younger participants were more likely to belong to multiple marginalised groups. Our findings might also suggest existing structural supports for marginalised people (including additional financial subsidies, specialised multidisciplinary and/or integrated services) are having some impact. We found that having a Health Care Card reduced the odds for reporting attitudinal barriers and barriers relating to emerging autonomy. US studies have also found access to healthcare insurance is beneficial for healthcare access for homeless young people31 and those living in low socioeconomic areas.32
There are recognised limitations to a study that it is both cross-sectional and based on self-report. The associations we found between a range of variables and barriers do not necessarily imply causation. The pilot testing of the questionnaire and use of validated items for health status, combined with the assistance of parents, carers, teachers or youth workers for some participants completing the survey, may have increased validity.
Our study has policy and practice implications relevant to all young people, but particularly those who are marginalised and experiencing poor health, higher psychological distress and/or chronic physical and mental health conditions.
Support is needed across the full 12 to 24 years age spectrum and responses may need to be tailored for developmental stage. Addressing health literacy through formal school curricula to increase knowledge of health services and the role of universal insurance remains critical for adolescents who may nevertheless rely on parents for the logistics of access (e.g. transport). Cost as a barrier to healthcare access needs greater attention by governments. A wider range of services could be covered by Medicare and bulk billing for young people could be increased. Locating health services in schools could be one way of addressing this
barrier. Although attitudinal or structural barriers were significantly greater for young women, the needs of young men’s access to healthcare should not be overlooked.33
This study will be of interest to service providers, especially as previous research has demonstrated their perceptions differ from young people’s descriptions of their barriers.1,7 Varying groups of young people experience barriers differently and these have been explored further in our longitudinal qualitative study in the Access 3 project. While ‘language or cultural reasons’ was removed to make the barrier clustering more robust, this is likely to be an important barrier for refugee young people.34
Implications for public health
There were three findings in this study that were counter to expectations. Structural barriers affected those living in lower socioeconomic areas less than those living in higher socioeconomic areas, marginalisation was not strongly associated with any barrier cluster and use of technology to decide which health service to go to was associated with more barriers. The first two of these findings suggest a good news story – that targeted access and concession programs are working for disadvantaged and marginalised young people. The third finding implies a need to improve not only e-health literacy but also to better integrate technology with service delivery.
Addressing barriers is important to ensure equity of access and optimal health outcomes for young people. Accessible primary healthcare is essential for early diagnosis and treatment together with prevention advice in order to reduce longer-term healthcare costs resulting from delayed access to care. This means barriers need to be addressed and young people involved in the solutions at both policy and practice levels.
Acknowledgements
We acknowledge and thank NSW Health for funding the study, Youth Consultants, Urban and Rural Reference Groups, Jessica Harper and Eun-Ae Cho for research support, The University of Sydney, Department of General Practice Westmead, partners who assisted with paper survey recruitment Isha Deep, Orange Aboriginal Medical Service and Jessie Hunt, Yfoundations.
Adolescent Health Young people’s healthcare access in the digital age

588 Australian and New Zealand Journal of Public Health 2019 vol. 43 no. 6© 2019 The Authors
Funding The Access 3 study was funded by the NSW Ministry of Health.
References1. Bernard D, Quine S, Kang M, Alperstein G, Usherwood
T, Bennett D, et al. Access to primary health care for Australian adolescents: How congruent are the perspectives of health service providers and young people, and does it matter? Aust N Z J Public Health. 2004;28(5):487-92.
2. Samargia LA, Saewyc EM, Elliott BA. Foregone mental health care and self-reported access barriers among adolescents. J Sch Nurs. 2006;22(1):17-24.
3. Robards F, Kang M, Sanci L, Usherwood T. How marginalised young people access, engage with and navigate health care systems in the digital age: Systematic review. J Adolesc Health. 2018;62:365–81.
4. Kauer SD, Mangan C, Sanci L. Do online mental health services improve help-seeking for young people? A systematic review. J Med Internet Res. 2014;16(3):e66.
5. Patton GC, Sawyer SM, Santelli JS, Ross DA, Afifi R, Allen NB, et al. Our future: A Lancet commission on adolescent health and wellbeing. Lancet. 2016;387(10036):2423-78.
6. Chelvakumar G, Ford N, Kapa HM, Lange HLH, McRee A-L, Bonny AE. Healthcare barriers and utilization among adolescents and young adults accessing services for homeless and runaway youth. J Community Health. 2016;42(03):437–43.
7. Johnston K, Harvey C, Matich P, Page P, Jukka C, Hollins J, et al. Increasing access to sexual health care for rural and regional young people: Similarities and differences in the views of young people and service providers. Aust J Rural Health. 2015;23(5):257-64.
8. Kang M, Robards F, Sanci L, Steinbeck K, Jan S, Hawke C, et al. Access 3 project protocol: Young people and health system navigation in the digital age: A multifaceted, mixed methods study. BMJ Open. 2017;7(8): e017047.
9. Survey Monkey. Limesurvey: The Online Survey Tool. Palo Alto (CA): Survey Monkey Inc; .2019.
10. Ambresin A-E, Bennett K, Patton GC, Sanci LA, Sawyer SM. Assessment of youth-friendly health care: A systematic review of indicators drawn from young people’s perspectives. J Adolesc Health. 2013;52(6):670.
11. Booth ML, Bernard D, Quine S, Kang MS, Usherwood T, Alperstein G, et al. Access to health care among Australian adolescents young people’s perspectives and their sociodemographic distribution. J Adolesc Health. 2004;34(1):97-103.
12. MacKenzie D, Chamberlain C. Youth homelessness 2006. Youth Stud Aust. 2008;27(1):17-25.
13. Australian Bureau of Statistics. National Health Survey: First Results, 2014–15 — Australia. Canberra (AUST): ABS; 2015.
14. Kessler RC, Andrews G, Colpe LJ, Hiripi E, Mroczek DK, Normand SLT, et al. Short screening scales to monitor population prevalences and trends in non-specific psychological distress. Psychol Med. 2002;32(6):959-76.
15. SPSS: Statistical Package for the Social Sciences. Version 24.0. Armonk (NY): IBM Corp; 2016.
16. Denny S, Farrant B, Cosgriff J, Harte M, Cameron T, Johnson R, et al. Forgone health care among secondary school students in New Zealand. J Prim Health Care. 2013;5(1):11.
17. Byron P, Rasmussen S, Wright Toussaint D, Lobo R, Robinson K, Paradise B. ‘You Learn from Each Other’: LGBTIQ Young People’s Mental Health Help-seeking and the RAD Australia Online Directory. Sydney (AUST): Western Sydney University Young and Well Cooperative Research Centre; 2016.
18. Robinson KH, Bansel P, Denson N, Ovenden G, Davies C. Growing Up Queer: Issues Facing Young Australians Who are Gender Variant and Sexually Diverse. Melbourne (AUST): Young and Well Cooperative Research Centre; 2014.
19. Freeman JL, Caldwell PHY, Bennett PA, Scott KM. How adolescents search for and Appraise online health information: A systematic review. J Pediatrics. 2018;195:244-55.e1.
20. Lawrence D, Johnson S, Hafekost J, Boterhoven De Haan K, Sawyer M, Ainley J, et al. The Mental Health of Children and Adolescents. Report on the Second Australian Child and Adolescent Survey of Mental Health and Wellbeing. Canberra (AUST): Australian Department of Health; 2015.
21. Laba T-L, Usherwood T, Leeder S, Yusuf F, Gillespie J, Perkovic V, et al. Co-payments for health care: What is their real cost? Aust Health Rev. 2015;39(1):33.
22. Robards F, Kang M, Tolley K, Hawke C, Sanci L, Usherwood T. Marginalised young people’s healthcare journeys: Professionals’ perspectives. Health Educ J. 2018;77(6):692-704.
23. Hadland SE, Kerr T, Li K, Montaner JS, Wood E, Hadland SE, et al. Access to drug and alcohol treatment among a cohort of street-involved youth. Drug Alcohol Depend. 2009;101(1/2):1-7.
24. Williams KA, Chapman MV. Comparing health and mental health needs, service use, and barriers to services among sexual minority youths and their peers. Health Soc Work. 2011;36(3):197-206.
25. beyondblue. Clinical Practice Guidelines: Depression in Adolescents and Young Adults. Melbourne (AUST): beyondblue; 2010.
26. Hudson AL, Nyamathi A, Greengold B, Slagle A, Koniak-Griffin D, Khalilifard F, et al. Health-seeking challenges among homeless youth. Nurs Res. 2010;59(3):212-18.
27. Hernan A, Philpot B, Edmonds A, Reddy P. Healthy minds for country youth: Help-seeking for depression among rural adolescents. Aust J Rural Health. 2010;18(3):118-24.
28. Perry L, Steinbeck KS, Dunbabin JS, Lowe JM. Lost in transition? Access to and uptake of adult health services and outcomes for young people with type 1 diabetes in regional New South Wales. Med J Aust; 2010;193(8):444.
29. Rughani J, Deane FP, Wilson CJ. Rural adolescents’ help-seeking intentions for emotional problems: The influence of perceived benefits and stoicism. Aust J Rural Health. 2011;19(2):64-9.
30. Whitley R, Kirmayer LJ. Perceived stigmatisation of young mothers: An exploratory study of psychological and social experience. Soc Sci Med. 2008;66(2):339-48.
31. Winetrobe H, Rice E, Rhoades H, Milburn N. Health insurance coverage and healthcare utilization among homeless young adults in Venice, CA. J Public Health (Oxf). 2016;38(1):147-55.
32. Klein JD, Shone LP, Szilagyi PG, Bajorska A, Wilson K, Dick AW. Impact of the State Children’s Health Insurance Program on adolescents in New York. Pediatrics. 2007;119(4):e885-92.
33. Pirkis J, Currier D, Carlin J, Degenhardt L, Dharmage SC, Giles-Corti B, et al. Cohort profile: Ten to Men ( the Australian Longitudinal Study on Male Health). Int J Epidemiol. 2017;46(3):793.
34. de Anstiss H, Ziaian T. Mental health help-seeking and refugee adolescents: Qualitative findings from a mixed-methods investigation. Aust Psychol. 2010;45(1):29-37.
Supporting Information
Additional supporting information may be found in the online version of this article:
Supplementary File 1: NSW Youth Health Access Survey.
Robards et al. Article
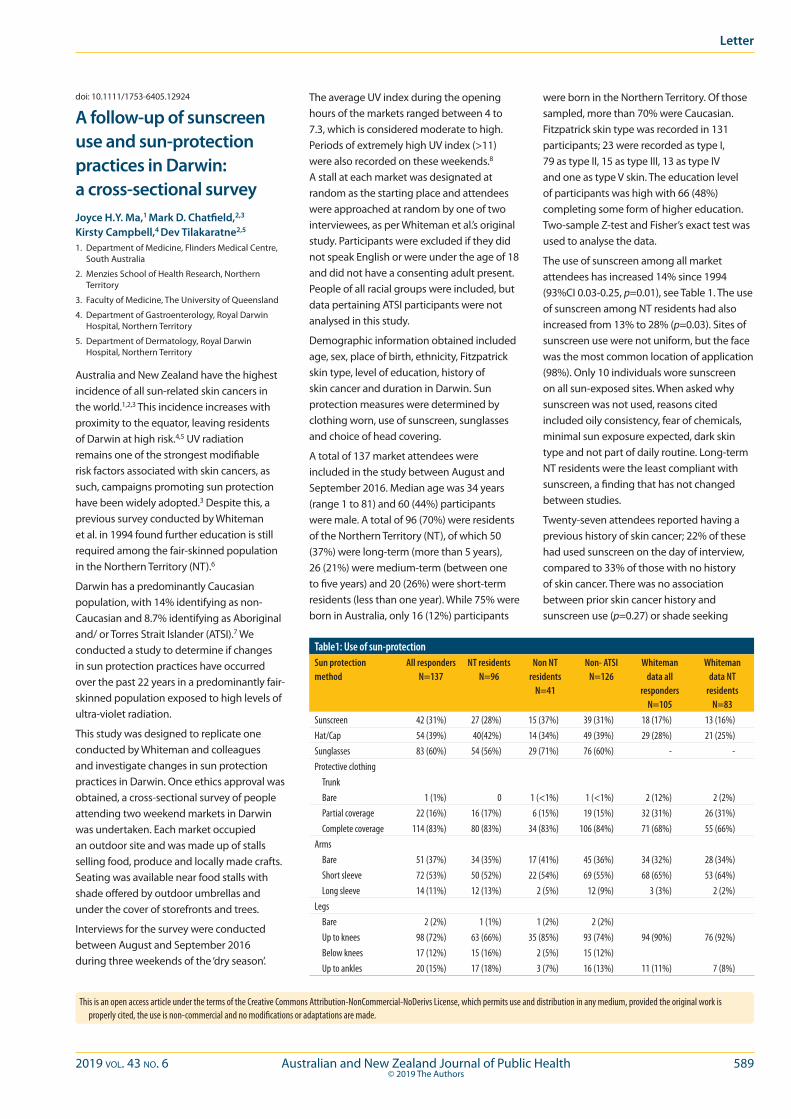
2019 vol. 43 no. 6 Australian and New Zealand Journal of Public Health 589© 2019 The Authors
This is an open access article under the terms of the Creative Commons Attribution-NonCommercial-NoDerivs License, which permits use and distribution in any medium, provided the original work is properly cited, the use is non-commercial and no modifications or adaptations are made.
doi: 10.1111/1753-6405.12924
A follow-up of sunscreen use and sun-protection practices in Darwin: a cross-sectional surveyJoyce H.Y. Ma,1 Mark D. Chatfield,2,3
Kirsty Campbell,4 Dev Tilakaratne2,5
1. Department of Medicine, Flinders Medical Centre, South Australia
2. Menzies School of Health Research, Northern Territory
3. Faculty of Medicine, The University of Queensland
4. Department of Gastroenterology, Royal Darwin Hospital, Northern Territory
5. Department of Dermatology, Royal Darwin Hospital, Northern Territory
Australia and New Zealand have the highest incidence of all sun-related skin cancers in the world.1,2,3 This incidence increases with proximity to the equator, leaving residents of Darwin at high risk.4,5 UV radiation remains one of the strongest modifiable risk factors associated with skin cancers, as such, campaigns promoting sun protection have been widely adopted.3 Despite this, a previous survey conducted by Whiteman et al. in 1994 found further education is still required among the fair-skinned population in the Northern Territory (NT).6
Darwin has a predominantly Caucasian population, with 14% identifying as non-Caucasian and 8.7% identifying as Aboriginal and/ or Torres Strait Islander (ATSI).7 We conducted a study to determine if changes in sun protection practices have occurred over the past 22 years in a predominantly fair-skinned population exposed to high levels of ultra-violet radiation.
This study was designed to replicate one conducted by Whiteman and colleagues and investigate changes in sun protection practices in Darwin. Once ethics approval was obtained, a cross-sectional survey of people attending two weekend markets in Darwin was undertaken. Each market occupied an outdoor site and was made up of stalls selling food, produce and locally made crafts. Seating was available near food stalls with shade offered by outdoor umbrellas and under the cover of storefronts and trees.
Interviews for the survey were conducted between August and September 2016 during three weekends of the ‘dry season’.
The average UV index during the opening hours of the markets ranged between 4 to 7.3, which is considered moderate to high. Periods of extremely high UV index (>11) were also recorded on these weekends.8 A stall at each market was designated at random as the starting place and attendees were approached at random by one of two interviewees, as per Whiteman et al.’s original study. Participants were excluded if they did not speak English or were under the age of 18 and did not have a consenting adult present. People of all racial groups were included, but data pertaining ATSI participants were not analysed in this study.
Demographic information obtained included age, sex, place of birth, ethnicity, Fitzpatrick skin type, level of education, history of skin cancer and duration in Darwin. Sun protection measures were determined by clothing worn, use of sunscreen, sunglasses and choice of head covering.
A total of 137 market attendees were included in the study between August and September 2016. Median age was 34 years (range 1 to 81) and 60 (44%) participants were male. A total of 96 (70%) were residents of the Northern Territory (NT), of which 50 (37%) were long-term (more than 5 years), 26 (21%) were medium-term (between one to five years) and 20 (26%) were short-term residents (less than one year). While 75% were born in Australia, only 16 (12%) participants
were born in the Northern Territory. Of those sampled, more than 70% were Caucasian. Fitzpatrick skin type was recorded in 131 participants; 23 were recorded as type I, 79 as type II, 15 as type III, 13 as type IV and one as type V skin. The education level of participants was high with 66 (48%) completing some form of higher education. Two-sample Z-test and Fisher’s exact test was used to analyse the data.
The use of sunscreen among all market attendees has increased 14% since 1994 (93%CI 0.03-0.25, p=0.01), see Table 1. The use of sunscreen among NT residents had also increased from 13% to 28% (p=0.03). Sites of sunscreen use were not uniform, but the face was the most common location of application (98%). Only 10 individuals wore sunscreen on all sun-exposed sites. When asked why sunscreen was not used, reasons cited included oily consistency, fear of chemicals, minimal sun exposure expected, dark skin type and not part of daily routine. Long-term NT residents were the least compliant with sunscreen, a finding that has not changed between studies.
Twenty-seven attendees reported having a previous history of skin cancer; 22% of these had used sunscreen on the day of interview, compared to 33% of those with no history of skin cancer. There was no association between prior skin cancer history and sunscreen use (p=0.27) or shade seeking
Table1: Use of sun-protection Sun protection method
All responders N=137
NT residents N=96
Non NT residents
N=41
Non- ATSI N=126
Whiteman data all
responders N=105
Whiteman data NT
residents N=83
Sunscreen 42 (31%) 27 (28%) 15 (37%) 39 (31%) 18 (17%) 13 (16%)Hat/Cap 54 (39%) 40(42%) 14 (34%) 49 (39%) 29 (28%) 21 (25%)Sunglasses 83 (60%) 54 (56%) 29 (71%) 76 (60%) - -Protective clothing Trunk Bare 1 (1%) 0 1 (<1%) 1 (<1%) 2 (12%) 2 (2%) Partial coverage 22 (16%) 16 (17%) 6 (15%) 19 (15%) 32 (31%) 26 (31%) Complete coverage 114 (83%) 80 (83%) 34 (83%) 106 (84%) 71 (68%) 55 (66%)Arms Bare 51 (37%) 34 (35%) 17 (41%) 45 (36%) 34 (32%) 28 (34%) Short sleeve 72 (53%) 50 (52%) 22 (54%) 69 (55%) 68 (65%) 53 (64%) Long sleeve 14 (11%) 12 (13%) 2 (5%) 12 (9%) 3 (3%) 2 (2%)Legs Bare 2 (2%) 1 (1%) 1 (2%) 2 (2%) Up to knees 98 (72%) 63 (66%) 35 (85%) 93 (74%) 94 (90%) 76 (92%) Below knees 17 (12%) 15 (16%) 2 (5%) 15 (12%) Up to ankles 20 (15%) 17 (18%) 3 (7%) 16 (13%) 11 (11%) 7 (8%)
Letter
590 Australian and New Zealand Journal of Public Health 2019 vol. 43 no. 6© 2019 The Authors
Letter
(p=0.56). In this study, higher rates of skin cancers were seen among those with type II skin (27%) followed by type III (20%) and type I (8%). There was no difference in sunscreen use or shade seeking between skin types.
The use of protective long-sleeved clothing has improved with increased prevalence of trunk coverage (p=0.006) and use of long-sleeved shirts. The prevalence of long pants (p=0.4) and hats remained unchanged. In the present study, there was no significant difference in long-sleeved clothing use between NT and non-NT residents.
There was no statistical significance amongst Non-NT residents (76%) and NT residents (89%) seeking shade (p=0.05).
This study demonstrates that the use of sunscreen and protective clothing among Darwin Market attendees has improved over the past 22 years. In April 2016, all Northern Territory schools were mandated to implement a Sun Safety policy.9 In comparison, 71% of all Victorian primary schools were accredited as sun smart schools by December 2000.10 This recent implementation in Darwin may see even further uptake of sun protection practices among residents in the future as children adopt sun safe practices and implement them as adults. The reasons mentioned for lack of sunscreen could be made targets for further health education.
Since the last study, there have been significant environmental changes to the markets. Rapid Creek markets have installed thicker shade for patrons seated outdoors. Similarly, Parap markets have erected awnings and covered pathways for market attendees. The availability of shade provides an additional source of sun protection that was previously unavailable, highlighting the importance of environmental support in skin cancer prevention.
While there has been an increased prevalence of long-sleeved clothing since 1994, it is unlikely this practice will change dramatically in the foreseeable future in an environment that is both hot and humid. Thus, focusing on the promotion of sunscreen, hat, sunglasses and shade seeking behaviours remains a crucial point in education in a population exposed to high ambient UV radiation.
Limitations of this study include sampling bias, which precludes generalisation of results.
Our study demonstrated that the use of sunscreen has increased among non-Aboriginal market attendees. However, campaigns to address misconceptions regarding sunscreen are required. Unfortunately, long-term residents remain the group requiring most education.
References 1. Staples MP, Elwood M, Burton RC, Williams JL, Marks
R, Giles GG. Non-melanoma skin cancer in Australia: The 2002 national survey and trends since 1985. Med J Aust. 2006;184:6-10.
2. Sneyd MJ, Cox B. A comparison of trends in melanoma mortality in New Zealand and Australia: The two countries with the highest melanoma incidence and mortality in the world. BMC Cancer. 2013;13:372.
3. Apalla Z, Lallas A, Sotiriou E, Lazaridou E, Ioannides D. Epidemiological trends in skin cancer. Dermatol Pract Concept. 2017;7(2):1-6.
4. Staples M, Elwood M, Burton RC, Williams JL, Marks R, Giles GG. Non-melanoma skin cancer in Australia: The 2002 national survey and trends since 1985. Med J Aust. 2006;184:6–10.
5. Pollack A, McGrath M, Henderson J, et al. Skin cancer by state and territory. Aust Fam Physician. 2014;43(8):507.
6. Whiteman DC, Frost CA, Whiteman CA, Green AC. A survey of sunscreen use and sun-protection practices in Darwin. Aust J Public Health. 1994;18:47-50.
7. Australian Bureau of Statistics. Greater Darwin, 2016 [Internet]. Canberra (AUST): ABS; 2016 [cited 2018 Jan 12]. Available from: http://www.censusdata.abs.gov.au/census_services/getproduct/census/2016/quickstat/7GDAR
8. Australian Radiation Protection and Nuclear Safety Agency. Ultraviolet Radiation Index- Darwin [Internet]. Sydney (AUST): ARPANSA; 2018 [cited 2019 Jan 1]. Available from: https://data.gov.au/dataset/ultraviolet-radiation-index-darwin
9. Northern Territory Department of Education. Sun Safety in Schools [Internet]. State Government of NT; 2016 [cited 2018 Oct 27]. Available from: https://education.nt.gov.au/__data/assets/pdf_file/0006/268899/Sun-Safety-in-Schools-policy.pdf
10. Redman K, Sinclair C, Stent S. SunSmart–Twenty Years On. June 2001 [edited extract] from: Montague M, Borland R, Sinclair C, editors. SunSmart–Twenty Years On Slip! Slop! Slap! and SunSmart 1980 to 2000: Skin Cancer Control and 20 Years of Population Based Campaigning. Health Educ Behav. 2001;28(3).
Correspondence to: Dr Joyce Ma, Dermatology Department, Flinders Medical Centre, Flinders Drive, Bedford Park, SA 5042; e-mail: [email protected]
2019 vol. 43 no. 6 Australian and New Zealand Journal of Public Health 591© 2019 The Authors
doi: 10.1111/1753-6405.12961
Prof. Max Abbott*
Dr Meg Adam*
Dr Mick Adams
Dr Karen Adams*
Prof. Joanne Aitken
Ms Jaithri Ananthapavan*
Dr Anneka Anderson
Prof. Ross Andrews
Dr Blake Angell*
Dr Olga Anikeeva
Prof. Edoardo Aromataris*
Dr Julie Arsenault
Ms Karen Ashby*
Dr Jenny Atkins
Dr Peter Azzopardi
Dr Peter Baade*
Dr Adrian Barnett*
Prof. Melanie Barwick
Mr Ramez Bathish
Prof. Fran Baum*
Prof. Catherine Bennett
Dr Christina Bernardes
Prof. Beverley-Ann Biggs
Ms Vanessa Bobongie
Mr Devin Bowles*
Prof. Julia Bowman
Mr Shane Bradbrook*
Dr Lori Bradford
Dr Kate Bramfeld*
Dr Jonathan Broadbent*
Dr Graham Brown*
Dr Geoffrey R Browne
Dr Matthew Browne*
Dr Dominique Cadilhac
Mrs Hannah Carter*
Dr Philippa Chidgzey
Dr Teresa Ching
Dr Hsueh-wen Chow
Ms Jody Church*
Dr Stephen Conaty
Ms Julieann Coombes*
Ms Sheri Cooper*
Ms Joanna Coutts*
The following reviewers generously gave their time and expertise to provide reviews during 2019.The * denotes reviewers who provided multiple reviews or other exceptional assistance.
Dr Christine Cowie*
Prof. Brian Cox*
Dr Daniel Lavanchy
Dr Adrian Davis
Prof. Caroline de Costa*
Ms Hayley Denison*
Dr Abbey Diaz
Prof. Paul Dietze*
Dr Kia Ditleven
Prof. Timothy Dobbins
Ms Joanne Dono
Ms Bridget Draper
Mr Aaron Drovandi*
Dr Wei Du*
Dr Graeme Duke*
Ms Amalie Dyda
Ms Debra El Saadi
Dr Charlene Elliott
Prof. Elizabeth Elliott
Prof. Adrian Esterman*
Dr Ben Ewald*
Dr Michael Falster
Ms Sara Farnbach
Dr Penny Field
Dr Karen File
Dr Summer Finlay*
Dr Ruth Fitzgerald
Dr Lai Heng Foong
Dr Alice S. Forster
Dr Richard Franklin*
Dr Becky Freeman*
Prof. Danielle Gallegos*
Dr Alison J. Gibberd
Dr Katherine Gibney*
Dr John Gilroy
Ms Deborah Gleeson*
Dr Judith Gomersall*
Dr Karen Grace
Dr Stephen Graves
Dr Shannon Gray
Mr Andrew Gray*
Dr Lara Greaves
Dr Jason Gurney
Dr Jill Guthrie*
Ms Karina Hall
Dr Mark Hanly
Dr Jeremy Hapeta
Prof. Carolyn Heckman
Dr Cybele Heddle*
Ms Naomi Hendrickson*
Ms Patricia Hepworth
Dr Sophie Hickey
Dr Katie Hirono
Dr Vincent Ho
Ms Rebecca Hodder
Dr Samantha Hollingworth
Dr Zakia Hossain
Dr Martin Howell
Dr Jessica Howell*
Dr Paul J Huggan
Dr Husein Husein-El Ahmed*
Dr Patrick Ingiliz
Dr Michelle Irving*
Dr Monika Janda*
Dr Santosh Jatrana*
Dr Fransisco Huertas Delgado
Dr Ruth Jeanes
Ms Sandra Johnson*
Ms Nikki Johnston*
Dr Natalia Jones
Dr Xiangqun Ju
Dr Jenni Judd*
Dr Saffron Karlsen
Dr Therese Kearns*
Dr Sacha Kendall
Prof. Michael Kimlin*
Prof. Lesley King
Ms Melanie Kingsland*
Mr Gary Kirby*
Prof. Scott Kitchener
Dr Jennifer Lacy-Nichols
Dr Ngan Kuen Lai
Dr Tina Lam*
Dr Erika Langham
Dr Sharon Lawn*
Prof. Mark Lawrence
Reviewers in 2019
592 Australian and New Zealand Journal of Public Health 2019 vol. 43 no. 6© 2019 The Authors
PUBLIC HEALTH ASSOCIATION OF AUSTRALIA
Working together for better health outcomes
Join today and be part of it! Public Health Association
A U S T R A L I A
www.phaa.net.au
Ms Victoria Lazenby*
Prof. Tess Lea
Dr Justine Leavy
Dr Martin Lee
Prof. David Legge*
Ms Eveline Lensvelt
Dr Catherine Leviten-Reid*
Mr andrew levula
Dr Meron Lewis
Prof. Winston Liauw
Dr Penny Love*
Ms Yolanda Lovie-Toon
Dr Tony Lower*
Prof. Robyn Lucas*
Dr Rona Macniven*
Dr Jen Makin*
Ms Joanne Malcolm
Dr Jennifer Marino
Ms Jane Martin*
Dr Marianne Martinello
Dr Erin Mathieu*
Ms Louisa Matwiejczyk
Dr Sue McAllister
Dr Brad McCall
Dr Janya McCalman*
Dr Malcom McDonald*
Ms Fiona McGaughey*
Prof. Rob McGee*
Ms Lisa McHugh
Dr Bridgette McNamara*
Dr Rebekah McWhirter
Dr Diana Mendez*
Ms Samantha Menezes
Dr Robert Menzies*
Dr Caroline Miller*
Dr Allison Milner
Dr Rebecca Mitchell*
Dr Julie Mooney-Somers*
Mr Michael Moore*
Dr Carly Moores
Dr Monica Moran
Dr Jacqueline Murdoch
Dr Heather M. Murphy
Dr Gregory Murphy*
Dr Rachel Neale
Dr Sandra Neate
Dr Alison Nelson
Prof. Neville Nicholls
Prof. Terry Nolan*
Dr Vili Nosa*
Dr Mary Nowlan
Dr Meredith O’Connor
Prof. Tony Okely
Prof. Peter O’Leary
Dr Timothy Ore
Prof. Peter Orris
Prof. Neville Owen
Dr Kate Parker
Prof. Douglas Paton
Prof. John Pearn
Prof. Sallie-Anne Pearson*
Dr Amy Pennay*
Prof. Simone Pettigrew*
Dr Dawid Pieper
Ms Hannah Pierce*
Ms Leanne Pilkington
Ms Rhiannon Pilkington*
Ms Anne Polley
Prof. Kevin Pottie
Dr Tamara Power*
Dr Jenny Proimos
Dr Edward Raby
Dr Shanthi Ramanathan*
Dr Rachel Reilly*
Dr Kim D. Reynolds*
Prof. Ann Roche*
Mrs Kim Rounsefell
Prof. Grant Russell
Dr Ewelina Rydzewska
Ms Ainslie Sartori
Ms Ainslie Sartori*
Prof. Andrea Schaffer*
Prof. Philip Schluter
Dr Fabian Schwarz
Ms Michelle Scollo*
Dr Holly Seale*
Prof. Doug Sellman*
Dr Linda Selvey*
Prof. John Skerritt
Mr Terry Slevin*
Dr Mitchell Smith
Dr D. E. Smith
Dr Centaine Snoswell*
Dr Rebecca Soole*
Mr Jason Soon
Prof. Jeff Spickett*
Dr Jayadevan Sreedharan
Dr Paulina Stehlik
Dr John Stevens
Prof. Mark Stevenson*
Dr Adam Stewart
Mr Jay Stiles
Mrs Nicole Stormon
Dr Ruth Stringer
Prof. Elizabeth Sullivan
Dr Melissa Sweet
Prof. Angela Taft*
Dr Peter Tait*
Dr Kathy Tannous
Prof. Judy Taylor
Dr Paul Taylor
Prof. Sandra Thompson*
Dr George Thomson*
Mr Michael Thorn*
Dr Alec Thornton
Dr Katherine Thurber
Dr Stephanie M. Topp
Dr An Duy Tran
Dr Gareth Treharne
Dr Joshua Trigg
Dr Christina Tsou
Dr Cristian Udovicich*
Dr Amy Vassallo
Prof. Jacob Veerman
Dr Mark Veitch*
Dr Elvina Viennet
Dr Zoe Wainer
Dr Darren Walton
Dr Robert Ware*
Ms Wendy Watson*
Mr Jonathon Webber
Dr Mark Wenitong*
Dr Bethany White*
Dr Pauline Williams
Dr Susan Williams
Dr Anna Williamson*
Dr Matthew Winslade*
Prof. Heather Yeatman*
Dr Kader Yildiz
Dr Megan Young
Dr Yuejen Zhao*
Reviewers in 2019
2019 vol. 43 no. 6 Australian and New Zealand Journal of Public Health 593© 2019 The Authors
PUBLIC HEALTH ASSOCIATION OF AUSTRALIA
Working together for better health outcomes
Join today and be part of it! Public Health Association
A U S T R A L I A
www.phaa.net.au

PHAA MEMBER BENEFITS
BENEFITS OF INDIVIDUAL MEMBERSHIP
� Online access to the Australian and New Zealand Journal of Public Health, Australia’s premier public health publication
� The PHAA e-newsletter intouch and other electronic mailings and updates � The right to vote and hold office in PHAA � Opportunity to join up to 17 national Special Interest Groups (SIGs) (fees apply) � Access to State/Territory branch events and professional development opportunities � Reduction in fees to the PHAA annual conference and other various special interest
conferences � Access to PHAA forums and input into developing policies � Access to emailed list of public health job vacancies and opportunities � Networking and mentoring through access to senior public health professionals at branch
meetings, as well as through SIGs and at conferences and seminars � Eligibility to apply for various scholarships and awards � The ability to participate in, benefit from, or suggest and promote public health advocacy
programs
ADDITIONAL BENEFITS OF ORGANISATIONAL MEMBERSHIP (All the above benefits of individual membership apply to the nominated representative)
� Up to two staff members may attend PHAA Annual Conference and special interest conferences, workshops and seminars at the reduced member registration rate
� Discounted rates for advertising or for placing inserts in our current publications intouch and the Australian & New Zealand Journal of Public Health (does not apply to job vacancies and event promotional e-campaigns)
Australian and New Zealand Journal of Public HealthNotes for contributors
Copies of the full Notes, including referencing of electronic sources, and of the ‘Uniform requirements’ are available from the Australian and New Zealand Journal of Public Health website at
http://onlinelibrary.wiley.com/page/journal/17536405/homepage/ForAuthors.html
Submission procedure Manuscripts are subject to assessment by independent referees and editorial
revision. When a submitted manuscript is received, it is given a reference number and an acknowledgment is sent to the corresponding author. The appropriateness of the topic area and treatment is then considered by the Editors, sometimes with advice from members of the Editorial Board. If appropriate, the manuscript is sent for review. A decision, including referees’ comments, is usually sent to the authors within two or three months. The paper may be accepted or rejected, or authors may be invited to revise the paper and resubmit it. In the latter case, the Journal does not undertake to publish the paper as pressure of space may make acceptance and publication impossible.
All manuscripts are to be submitted online via our online submission service at: http://mc.manuscriptcentral.com/anzjph.
All manuscripts accepted for publication will incur a fee of $600 if the first author is a member of the Public Health Association of Australia or Public Health Association of New Zealand, and $1,800 if the first author is not a member of either organisation. The PHAA will invoice authors when the paper is accepted; the invoice must be paid prior to the accepted manuscript being processed and made available online. Invited Editorials and Book Reviews will not be subject to fees.
Papers will be made Open Access once they are published in an issue. Papers published in Early View, prior to publication in an issue, will only be available to PHAA members.
LengthBrief, pithy articles are preferred to long, wordy ones. Substantive findings
from a study are preferred to multiple minor papers. Pilot studies will only be considered if they are novel or add substantially to the existing literature.
Research Articles should be no longer than 5,000 words, including title, abstract, all references. This word count allows for three figures or tables (each equivalent to 500 words [half a Journal page]). Articles that do not include figures or tables have a word limit of 6,500 words. A structured abstract must be included.
Brief Reports should be no longer than 1,500 words and can include one table or figure. References must be included in the overall word count. A structured abstract must be included.
A Commentary should be no more than 2,500 words, including any references. A maximum of one table or figure may be included.
Editorials are limited to 1,500 words, including title and references. A maximum of one table or figure may be included.
Letters to the Editor are limited to 1,000 words, including references. A maximum of one table or figure may be included.
Abstract: The Abstract has a word limit of 200 words and must be structured using the headings Objective, Methods, Results, Conclusions, Implications for public health. An alternative format may be considered, if authors provide good justification. Please make sure you also address the implications for public health, including public health references, within the body of the manuscript.
Presenting your manuscript Authors intending to submit a paper should read the general guidelines of
the International Committee of Medical Journal Editors (ICMJE) ‘Uniform Requirements for Manuscripts Submitted to Biomedical Journals: Writing and Editing for Biomedical Publication’, available on http://www.icmje.org.
ANZJPH does not consider material that has been published at any length elsewhere or that is under consideration for another publication. It is prohibited by copyright law and can result in distortion of systematic
evidence. Particular attention should be paid to simultaneous or previous media reports or reports to funding bodies. Material that is readily accessible by internet search is considered to be a publication.
All authors must be prepared to take full responsibility for the content of a paper. All authors must certify that they satisfy at least the following three requirements: they contributed substantially to the conduct of the study, to both drafting and revision of the paper, and that they approve the final version. We may require each author to sign a statement describing their individual contributions, which will be included in the published paper.
We limit the number of authors for a paper to six in most cases. Justification for a larger number can be provided at submission. Additional contributions short of authorship can be addressed briefly under Acknowledgements. The maximum number of authors for a Letter to the Editor is three.
A separate title page must be uploaded with the manuscript files, listing all authors with a maximum of two affiliations each. Give full contact details for the corresponding author, including postal and e-mail addresses, and telephone number. Provide e-mail addresses for all other authors. Acknowledgements should be listed on the title page.
Tables must be submitted in Word format. Graphics should be in a suitable format (e.g. EPS, 300dpi JPG, or print resolution PDF) to provide clear, high resolution images in print.
ReferencesThe reference system used by the Journal is that recommended by
International Committee of Medical Journal Editors (ICMJE) and commonly known as ‘Vancouver style’. References are numbered in the text in the order in which they are first cited, and listed after the text of the manuscript in that order. An individual reference carries the same number each time it is cited and therefore appears in the list of references just once; ‘ibid’ and ‘op cit’ are not used. Please do not use automatic numbering of references. Examples of how to cite sources of various kinds can be found at http://authorservices.wiley.com/bauthor.
CopyrightAll articles published by ANZJPH are fully open access: freely available
to read, download and share, including to those who do not subscribe to the journal. The author, the author's funding agency, or the author's institution pays a fee to ensure that the article is made open access. Authors retain copyright in their articles, and are permitted to post the final, published PDF of their article on their personal website, and in an institutional repository or other free public server immediately after publication.
Authors have the option of publishing under the following Creative Commons License terms:
• Creative Commons Attribution License (CC BY)• Creative Commons Attribution Non-Commercial-NoDerivs License
(CC BY NC ND).To preview the terms and conditions of these open access agreements, please
visit the Copyright FAQs hosted on Wiley Author Services and visit http://www.wileyopenaccess.com/details/content/12f25db4c87/Copyright--License.html.
Disclaimer The Publisher, Association and Editors cannot be held responsible for errors or any consequences arising from the use of information contained in this journal; the views and opinions expressed do not necessarily reflect those of the Publisher, Association and Editors, neither does the publication of advertisements constitute any endorsement by the Publisher, Association and Editors of the products advertised.

Public Health Association A U S T R A L I A
The Journal of the Public Health Association of Australia Inc.
Editorial
509 Grace under fire Priscilla Robinson
Commentary
510 Public Health in an Open Society: how society and language shape prevention, Gordon Oration, Public Health Prevention Conference, 2019Tarun Weeramanthri
516 Pathways to responding and preventing alcohol-related violence against women: why a gendered approach matters Angela Taft, Ingrid Wilson, Anne-Marie Laslett, Sandra Kuntsche
Advertising
519 Discretionary food advertising on television in 2017: a descriptive study Lisa G. Smithers, Xinyue Wang, Dandara Haag, Benjamin Agnew, John Lynch, Matthew Sorell
522 Public health job advertisements in Australia and New Zealand: a changing landscape Rory D. Watts, Devin C. Bowles, Colleen Fisher, Ian W. Li
529 Anti-smoking advertisements are perceived differently by smokers and individuals with health or advertising knowledge Natalia Lizama, Terry Slevin, Simone Pettigrew
Indigenous Health
532 Case study of a decolonising Aboriginal community controlled comprehensive primary health care response to alcohol-related harm Toby Freeman, Fran Baum, Tamara Mackean, Anna Ziersch, Juanita Sherwood, Tahnia Edwards, John Boffa
538 Holistic primary health care for Aboriginal and Torres Strait Islander prisoners: exploring the role of Aboriginal Community Controlled Health Organisations Simon Pettit, Paul Simpson, Jocelyn Jones, Megan Williams, M. Mofizul Islam, Anne Parkinson, Bianca Calabria, Tony Butler
544 The impact of hearing impairment on Aboriginal children’s school attendance in remote Northern Territory: a data linkage study Jiunn-Yih Su, Vincent Yaofeng He, Steven Guthridge, Damien Howard, Amanda Leach, Sven Silburn
551 Supporting healthy drink choices in remote Aboriginal and Torres Strait Islander communities: a community-led supportive environment approach Emma Fehring, Megan Ferguson, Clare Brown, Kirby Murtha,
Cara Laws, Kiarah Cuthbert, Kani Thompson, Tiffany Williams,
Melinda Hammond, Julie Brimblecombe
Indigenous Health cont.
558 What isn’t measured isn’t done – eight years with no progress in Aboriginal and Torres Strait Islander adult influenza and pneumococcal vaccination Fleur Webster, Heather Gidding, Veronica Matthews, Richard Taylor, Robert Menzies
563 Barriers to vaccination service delivery within general practice: opportunity to make a sustainable difference in Aboriginal child health? Rebecca Carman, Lesley Andrew, Amanda Devine, Jacques Oosthuizen
570 The real divide: the use of algorithm-derived Indigenous status to measure disparities in sudden unexpected deaths in infancy in Queensland Rebecca A. Shipstone, Jeanine Young, John M.D. Thompson
Adolescent Health
577 Adolescent abortion in 11 high-income countries including Australia: towards the establishment of a minimum data set Anisa R. Assifi, Elizabeth A. Sullivan, Melissa Kang, Angela J. Dawson
582 Predictors of young people’s healthcare access in the digital ageFiona Robards, Melissa Kang, Georgina Luscombe, Lena Sanci, Katharine Steinbeck, Stephen Jan, Catherine Hawke, Marlene Kong, Tim Usherwood
Letter
589 A follow-up of sunscreen use and sun-protection practices in Darwin: a cross-sectional survey Joyce H.Y. Ma, Mark D. Chatfield, Kirsty Campbell, Dev Tilakaratne
Reviewers
591 Reviews in 2019
Related Documents