June 23, 2016 Australia: Small Companies Equity Research Milking ANZ’s reputation for quality; Initiate A2M (CL-Buy), BAL (Neutral) China’s IMF market opens up for Australia’s leading brands Penetration into China’s US$20 bn infant formula market is driving outsized earnings growth for Australia’s leading brands (A2M FY16E EBITDA is up 11x on FY15, BAL is up 4x) and strong share price performance (A2M +180%, BAL +160% yoy). Despite this we believe the potential for A2M at current valuations is still not fully priced in and initiate coverage with CL-Buy for its 25% upside, secure supply arrangements, and defensible margins. Key drivers of growth: online over offline, foreign over domestic, premium niche over mainstream Both A2M and BAL are growing in China due to: (1) The shift from offline channels (modern trade and mother & baby stores) to online; (2) The shift from domestic to foreign brands; and (3) A shift from established foreign brands to players like A2M and BAL with differentiated propositions (for A2M, A2-only milk and for BAL, organic ingredients). We forecast the online segment to grow 10% (in value) over FY16E-FY20E vs. market growth of 3% and expect BAL and A2M to increase online share to 6.8% and 7.5% by FY20E, from c. 4% each, driving total revenue CAGR of 20% for both. Winning formulas: A2M rated Buy (on CL), Bellamy’s rated Neutral We view A2M’s valuation on 20x/17x FY17E/FY18E P/E as attractive on 2 yr EPS CAGR of 49%. Our 12 month PT (on 50/50 DCF and EV/GCI) implies a 25% total return. Our investment thesis on A2M is based on: (1) A strongly growing infant formula brand in China; (2) Secure access to supply with Synlait; and (3) A solidly growing dairy business in ANZ. We view the risk/reward for BAL as balanced and initiate with Neutral given valuation, 20x/16x FY17E/FY18E P/E on 2 yr EPS CAGR of 33%. Our 12 month price target (50/50 DCF and EV/GCI) implies a 12% total return. We expect: (1) good, but slower growth vs. A2, in China given a more mature brand; (2) Solid growth in Australia from a broader product range. We believe supply risks are slightly higher than for A2M given the economics of securing organic milk, but expect BAL to have sufficient supply as per our forecasts given that it consumes <1% of the world’s organic milk. Recent farmgate price falls should also keep costs manageable. Key risks: Adverse regulatory outcomes for cross-border trade in China i.e. labelling changes or customs tightening up on ‘daigou’s’, more intense competition from other brands; supply constraints, IP risks for A2M. Summary of stocks in our SMID coverage group leveraged to the Chinese consumer *ATM.NZ and A2M.AX are on the ANZ Conviction List Source: Goldman Sachs Global Investment Research. Prices as of market close of 20 June, 2016. We forecast BAL and A2M to increase online IMF share to 6.8% and 7.5% by FY20E, from c.4% each Source: Euromonitor, Goldman Sachs Global Investment Research. Andrea Chong, CFA +61(3)9679-1126 [email protected] Goldman Sachs Australia Pty Ltd Goldman Sachs does and seeks to do business with companies covered in its research reports. As a result, investors should be aware that the firm may have a conflict of interest that could affect the objectivity of this report. Investors should consider this report as only a single factor in making their investment decision. For Reg AC certification and other important disclosures, see the Disclosure Appendix, or go to www.gs.com/research/hedge.html. Analysts employed by non- US affiliates are not registered/qualified as research analysts with FINRA in the U.S. Aaron Yeoh +61(3)9679-1996 [email protected] Goldman Sachs Australia Pty Ltd The Goldman Sachs Group, Inc. Global Investment Research Ticker Rating Last Price Price Target Div Yield Total Return ATM.NZ Buy 1.77 2.20 1.1% 25% A2M.AX Buy 1.70 2.10 1.2% 25% BKL.AX Neutral 135.77 160.00 3.7% 22% BAL.AX Neutral 10.76 12.00 1.0% 12% 0.0% 1.0% 2.0% 3.0% 4.0% 5.0% 6.0% 7.0% 8.0% 2014 2015 2016E 2017E 2018E 2019E 2020E BAL ‐ China Online Market Share A2M ‐ China Online Market Share

Welcome message from author
This document is posted to help you gain knowledge. Please leave a comment to let me know what you think about it! Share it to your friends and learn new things together.
Transcript
June 23, 2016
Australia: Small Companies
Equity Research
Milking ANZ’s reputation for quality; Initiate A2M (CL-Buy), BAL (Neutral)
China’s IMF market opens up for Australia’s leading brands
Penetration into China’s US$20 bn infant formula market is driving outsized
earnings growth for Australia’s leading brands (A2M FY16E EBITDA is up
11x on FY15, BAL is up 4x) and strong share price performance (A2M +180%,
BAL +160% yoy). Despite this we believe the potential for A2M at current
valuations is still not fully priced in and initiate coverage with CL-Buy for its
25% upside, secure supply arrangements, and defensible margins.
Key drivers of growth: online over offline, foreign over domestic, premium niche over mainstream
Both A2M and BAL are growing in China due to: (1) The shift from offline
channels (modern trade and mother & baby stores) to online; (2) The shift
from domestic to foreign brands; and (3) A shift from established foreign
brands to players like A2M and BAL with differentiated propositions (for
A2M, A2-only milk and for BAL, organic ingredients). We forecast the online
segment to grow 10% (in value) over FY16E-FY20E vs. market growth of
3% and expect BAL and A2M to increase online share to 6.8% and 7.5% by
FY20E, from c. 4% each, driving total revenue CAGR of 20% for both.
Winning formulas: A2M rated Buy (on CL), Bellamy’s rated Neutral
We view A2M’s valuation on 20x/17x FY17E/FY18E P/E as attractive on 2 yr
EPS CAGR of 49%. Our 12 month PT (on 50/50 DCF and EV/GCI) implies a
25% total return. Our investment thesis on A2M is based on: (1) A strongly
growing infant formula brand in China; (2) Secure access to supply with
Synlait; and (3) A solidly growing dairy business in ANZ.
We view the risk/reward for BAL as balanced and initiate with Neutral given
valuation, 20x/16x FY17E/FY18E P/E on 2 yr EPS CAGR of 33%. Our 12
month price target (50/50 DCF and EV/GCI) implies a 12% total return. We
expect: (1) good, but slower growth vs. A2, in China given a more mature
brand; (2) Solid growth in Australia from a broader product range. We
believe supply risks are slightly higher than for A2M given the economics of
securing organic milk, but expect BAL to have sufficient supply as per our
forecasts given that it consumes <1% of the world’s organic milk. Recent
farmgate price falls should also keep costs manageable.
Key risks: Adverse regulatory outcomes for cross-border trade in China i.e.
labelling changes or customs tightening up on ‘daigou’s’, more intense
competition from other brands; supply constraints, IP risks for A2M.
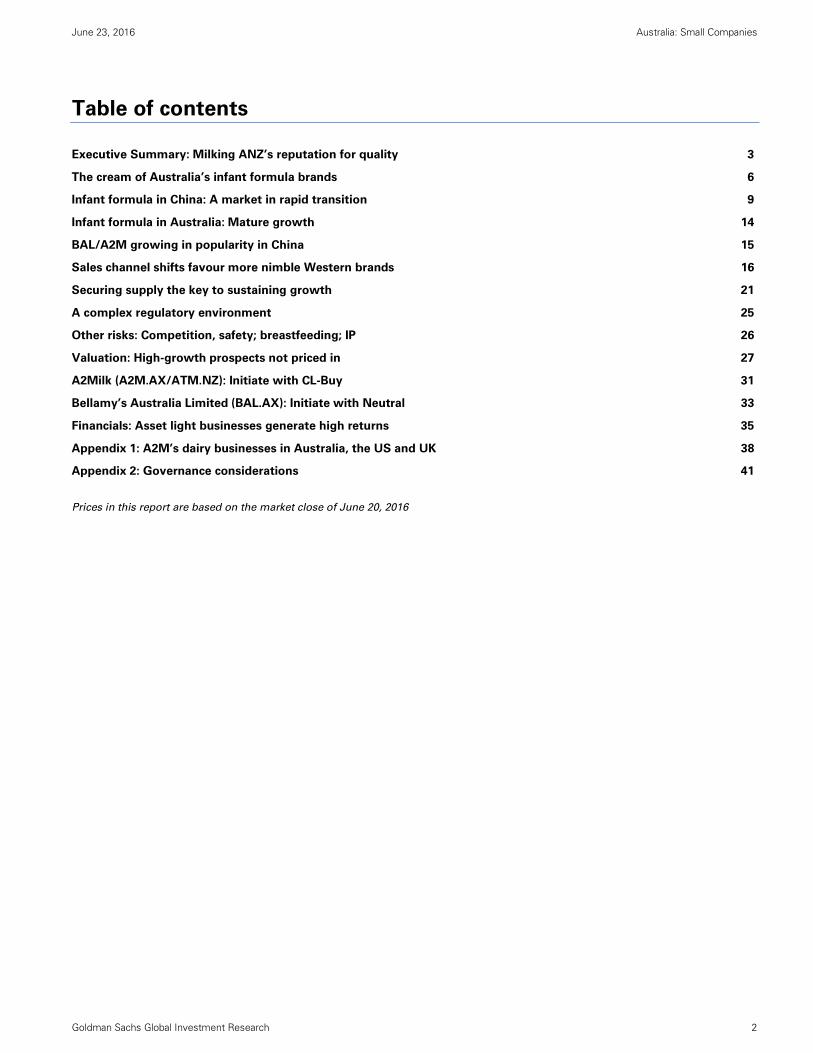
Summary of stocks in our SMID coverage
group leveraged to the Chinese consumer
*ATM.NZ and A2M.AX are on the ANZ Conviction List
Source: Goldman Sachs Global Investment Research. Prices as of market close of 20 June, 2016.
We forecast BAL and A2M to increase online IMF
share to 6.8% and 7.5% by FY20E, from c.4% each
Source: Euromonitor, Goldman Sachs Global Investment Research.
Andrea Chong, CFA +61(3)9679-1126 [email protected] Goldman Sachs Australia Pty Ltd Goldman Sachs does and seeks to do business with
companies covered in its research reports. As a result, investors should be aware that the firm may have a conflict of interest that could affect the objectivity of this report. Investors should consider this report as only a single factor in making their investment decision. For Reg AC certification and other important disclosures, see the Disclosure Appendix, or go to www.gs.com/research/hedge.html. Analysts employed by non-US affiliates are not registered/qualified as research analysts with FINRA in the U.S.
Aaron Yeoh +61(3)9679-1996 [email protected] Goldman Sachs Australia Pty Ltd
The Goldman Sachs Group, Inc. Global Investment Research
Ticker Rating
Last Price
Price Target Div Yield
Total Return
ATM.NZ Buy 1.77 2.20 1.1% 25%
A2M.AX Buy 1.70 2.10 1.2% 25%
BKL.AX Neutral 135.77 160.00 3.7% 22%
BAL.AX Neutral 10.76 12.00 1.0% 12%
0.0%
1.0%
2.0%
3.0%
4.0%
5.0%
6.0%
7.0%
8.0%
2014 2015 2016E 2017E 2018E 2019E 2020E
BAL ‐ China Online Market Share A2M ‐ China Online Market Share
June 23, 2016 Australia: Small Companies
Goldman Sachs Global Investment Research 2
Table of contents
Executive Summary: Milking ANZ’s reputation for quality 3
The cream of Australia’s infant formula brands 6
Infant formula in China: A market in rapid transition 9
Infant formula in Australia: Mature growth 14
BAL/A2M growing in popularity in China 15
Sales channel shifts favour more nimble Western brands 16
Securing supply the key to sustaining growth 21
A complex regulatory environment 25
Other risks: Competition, safety; breastfeeding; IP 26
Valuation: High-growth prospects not priced in 27
A2Milk (A2M.AX/ATM.NZ): Initiate with CL-Buy 31
Bellamy’s Australia Limited (BAL.AX): Initiate with Neutral 33
Financials: Asset light businesses generate high returns 35
Appendix 1: A2M’s dairy businesses in Australia, the US and UK 38
Appendix 2: Governance considerations 41
Prices in this report are based on the market close of June 20, 2016

June 23, 2016 Australia: Small Companies
Goldman Sachs Global Investment Research 3
Executive Summary: Milking ANZ’s reputation for quality
We initiate coverage on two leading ANZ infant milk formula (IMF) brands that are carving
a niche in China’s premium IMF market. Both are set to grow earnings on the back of rapid
sales growth as the value of China’s fragmented IMF market continues to expand with
growing urbanization and wealth, and sustainable premium pricing power for ‘trusted’
foreign brands amid still-reverberating health concerns around local IMF supply.
A2M: Buy (Conviction List) – unique seller of ‘A2’ milk formula - which (its own)
research suggests is easier to digest and may have health benefits.
Bellamy’s: Neutral – the only organic milk formula from Australia.
A2M is our key pick amongst the China exposed names in our coverage (A2M, BAL and
BKL). We make the following comparisons against Blackmores (BKL.AX):
1. Clearer regulatory path with the Chinese FDA: The risks around product
registration/filing for vitamins and health supplements beyond the government’s
May 2017 deadline does not apply to infant formula. Infant formula brands have
until January 2018 to register with the CFDA. Based on details released so far, we
believe both A2M and BAL should have sufficient time to obtain FDA registration
by January 2018 for the bonded warehouse channel.
2. Lower market shares but in a more concentrated, lower growth market: We
estimate A2M and BAL’s share of the online market (FY16E) to be c. 4% each,
equating to c. 1% each of the overall infant formula market. In contrast, for BKL,
we estimate its share online to be c. 11% and c. 1.6% of the overall market. Online
penetration in vitamins and health supplements is lower – c. 15% of the total
market for vitamins/health supplements vs. 30% for infant formula. Accordingly,
we forecast stronger growth for the online channel for vitamins and health
supplements (c. 18% p.a. vs. infant formula online at c. 12%).
3. But valuation more attractive: At current share prices, A2M is trading on an
FY17E / FY18E P/E of 20x/17x vs. BKL on 20x/19x for 2 year EPS CAGR of 49%/11%.
Underpinnings of our high-growth thesis
The Chinese infant formula market is transitioning rapidly and we believe both A2M and
BAL are well-placed to benefit.
Growth in the overall market is driven chiefly by growing wealth, relatively low rates of
breastfeeding and by premiumisation, a function of health scandals around Melamine-
tainted formula. At the same time, consumers are moving increasingly online, particularly
in higher-tier cities, as this gives them access to the more-trusted foreign brands, which
facilitates A2M and Bellamy’s market share gains – predominantly from local brands as
well as larger multinational brands.
A2M and Bellamy’s both have capital-light business models and have diverse sales
channels – chiefly through Chinese traders and online retailers via direct mail or bonded
warehouses.

June 23, 2016 Australia: Small Companies
Goldman Sachs Global Investment Research 4
Main risks
Supply is an important risk - although we believe both firms have secured sufficient supply
to meet our volume growth forecasts for the next few years. In our view, Bellamy’s risk is
slightly more elevated given the economics of organic milk farming i.e. fewer certified
‘organic’ dairy farms, high costs for organic milk vs. regular milk and a 3 year conversion
process to organic. ‘A2’ milk has fewer supply risks, as about 30% of the overall herd dairy
in farms across Australia and New Zealand are ‘A2’ cows.
Competition from other brands is also increasing with many new brands entering the
market and existing multi-national players increasing investments in online. Branding is
critical and we expect further investments by BAL and A2M to support its growth.
Regulation is also a risk – given evolving regulatory and governmental considerations
around the quality and formulations of formula; licensing of foreign manufacturers;
Chinese labelling for products sold through cross-border e-commerce; and additional
tax/compliance requirements for cross-border sales (although not just for IMF).
Recent news sources (AFR 10 May 2016, 26 May 2016, Weibo) suggest the government is
tightening its enforcement of taxes/compliance through the direct mail channel
(including at airports, express parcels). We think this may create some short-term
disruption for both BAL/A2M given that a number of B2C businesses were likely avoiding
taxes previously. Our view based on official customs statements and other channel checks
suggest that the direct mail channel will continue to remain open but be subject to higher
taxes and potentially greater regulatory oversight. Given the non-discretionary nature of
infant formula, and strong demand for these brands, we believe that the medium-term
investment thesis remains intact.
Other risks: (1) Quality, safety and reputational risks; (3) Intellectual property risks for A2M
Financials and valuation
We forecast high earnings growth of 36% EPS 3yr CAGR over FY16E-19E for A2M and 25%
for Bellamy’s – driven by their China expansion. Our 12-month target prices are based on
an equal blend of DCF (to capture the longer-term growth) and EV/GCI-CROCI (for nearer
term growth). They offer potential upsides to current prices of 25% for A2M and 12% for
Bellamy’s. We prefer A2M over Bellamy’s for its more attractive valuation given its higher
growth prospects.

June 23, 2016 Australia: Small Companies
Goldman Sachs Global Investment Research 5
Our thesis in six charts
Exhibit 1: China is a US$20bn market Market for infant formula (2015)
Exhibit 2: Online is disrupting traditional channels China market – By selling channel
Source: Euromonitor, Goldman Sachs Global Investment Research.
Source: Euromonitor, Goldman Sachs Global Investment Research.
Exhibit 3: For A2M, Chinese consumer sales c. 50% in
FY16 A2M revenues – By product, by consumer (NZ$mn)
Exhibit 4: For BAL, Chinese consumer sales c. 70% in
FY16 BAL revenues – By product, by consumer (A$mn)
Source: Company data, Goldman Sachs Global Investment Research.
Source: Company data, Goldman Sachs Global Investment Research.
Exhibit 5: Supply risks slightly more elevated for BAL
Organic milk vs. Conventional milk prices - Germany
Exhibit 6: On our forecasts, A2M’s P/E premium narrows
by FY20E BAL and A2M – P/E at current prices
Source: BMELV Source: Goldman Sachs Global Investment Research.
0 2 4 6 8 10 12 14 16 18 20
China
USA
SEAsia
United Kingdom
Japan
Australia
South Korea
Germany
US$ bn
0%
10%
20%
30%
40%
50%
60%
70%
80%
90%
100%
Modern trade Mother & baby Online
$0
$100
$200
$300
$400
$500
$600
$700
2012 2013 2014 2015 2016E 2017E 2018E
Dairy ‐ Australia Formula ‐ Australia Formula ‐ China (via Aust)
Formula ‐ China (Direct) UK and USA
$0
$50
$100
$150
$200
$250
$300
$350
$400
$450
$500
2012 2013 2014 2015 2016E 2017E 2018E
Formula ‐ Australia Formula ‐ China (Indirect)
Formula ‐ China (Direct) Other/South East Asia
20
25
30
35
40
45
50
55
Jan‐13
Mar‐13
May‐13
Jul‐13
Sep‐13
Nov‐13
Jan‐14
Mar‐14
May‐14
Jul‐14
Sep‐14
Nov‐14
Jan‐15
Mar‐15
May‐15
Jul‐15
Sep‐15
Nov‐15
Jan‐16
Organic milk Farmgate milk
0.0
5.0
10.0
15.0
20.0
25.0
30.0
35.0
40.0
FY16E FY17E FY18E FY19E FY20E
BAL A2M

June 23, 2016 Australia: Small Companies
Goldman Sachs Global Investment Research 6
The cream of Australia’s infant formula brands
Leveraged to China
A2M and BAL are two of Australia’s leading infant formula brands. Since 2014, both have
seen strong revenue growth mainly from Chinese consumers who purchase products sold
in Australia (C2C or “daigou” trade). Both companies are also increasingly selling direct
into China (B2C, offline and online).
Exhibit 7: For A2M, sales to Chinese consumers account
for >50% of FY16E revenues Group revenues – NZ$mn
Exhibit 8: For BAL, sales to Chinese consumers account
for c. 70% of FY16E revenues Group revenues – A$mn
Source: Company data, Goldman Sachs Global Investment Research.
Source: Company data, Goldman Sachs Global Investment Research.
A2Milk (A2M.AX, dual-listed) – 65% infant formula / 35% dairy (FY16E revenues) A2M sells infant formula under the a2 Platinum brand and branded dairy under the a2Milk
brand in Australia, China, US and UK.
Exhibit 9: Launched infant formula in 2013, prior to this A2M was a liquid milk business Company history
Source: Company data.
$0
$100
$200
$300
$400
$500
$600
$700
2012 2013 2014 2015 2016E 2017E 2018E
Dairy ‐ Australia Formula ‐ Australia Formula ‐ China (via Aust)
Formula ‐ China (Direct) UK and USA
$0
$50
$100
$150
$200
$250
$300
$350
$400
$450
$500
2012 2013 2014 2015 2016E 2017E 2018E
Formula ‐ Australia Formula ‐ China (Indirect)
Formula ‐ China (Direct) Other/South East Asia
Year Event
2000 a2 Milk Company founded in New Zealand
2012 Listed on NZX Main Board
Commissioned milk processing facility in Sydney
Agreement with Synlait for supply of infant formula targeted at Asian markets
Launched a2Milk in the UK through a JV with Robert Wiseman Dairies (RWD)
Agreement with China State Farm for offline distribution in China
2013 a2 platinum infant formula launched in China, Australia, New Zealand
Assumes full ownership of the UK JV from RWD
2015 Listed on the ASX
Receives takeover offer from Freedom Foods and Dean Foods. Freedom Foods subsequently
sells its stake
Launched a2Milk in the Californian fresh milk market
Launches Tmall Global flagship store
June 23, 2016 Australia: Small Companies
Goldman Sachs Global Investment Research 7
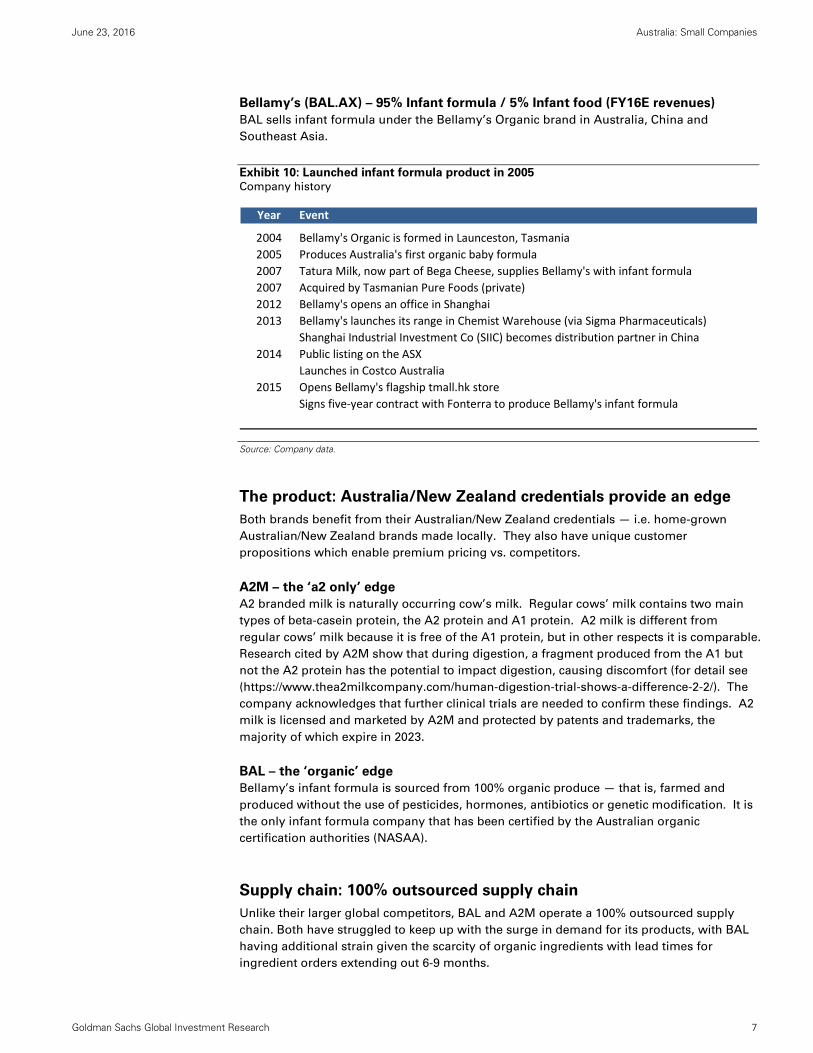
Bellamy’s (BAL.AX) – 95% Infant formula / 5% Infant food (FY16E revenues)
BAL sells infant formula under the Bellamy’s Organic brand in Australia, China and
Southeast Asia.
Exhibit 10: Launched infant formula product in 2005
Company history
Source: Company data.
The product: Australia/New Zealand credentials provide an edge
Both brands benefit from their Australian/New Zealand credentials — i.e. home-grown
Australian/New Zealand brands made locally. They also have unique customer
propositions which enable premium pricing vs. competitors.
A2M – the ‘a2 only’ edge
A2 branded milk is naturally occurring cow’s milk. Regular cows’ milk contains two main
types of beta-casein protein, the A2 protein and A1 protein. A2 milk is different from
regular cows’ milk because it is free of the A1 protein, but in other respects it is comparable.
Research cited by A2M show that during digestion, a fragment produced from the A1 but
not the A2 protein has the potential to impact digestion, causing discomfort (for detail see
(https://www.thea2milkcompany.com/human-digestion-trial-shows-a-difference-2-2/). The
company acknowledges that further clinical trials are needed to confirm these findings. A2
milk is licensed and marketed by A2M and protected by patents and trademarks, the
majority of which expire in 2023.
BAL – the ‘organic’ edge
Bellamy’s infant formula is sourced from 100% organic produce — that is, farmed and
produced without the use of pesticides, hormones, antibiotics or genetic modification. It is
the only infant formula company that has been certified by the Australian organic
certification authorities (NASAA).
Supply chain: 100% outsourced supply chain
Unlike their larger global competitors, BAL and A2M operate a 100% outsourced supply
chain. Both have struggled to keep up with the surge in demand for its products, with BAL
having additional strain given the scarcity of organic ingredients with lead times for
ingredient orders extending out 6-9 months.
Year Event
2004 Bellamy's Organic is formed in Launceston, Tasmania
2005 Produces Australia's first organic baby formula
2007 Tatura Milk, now part of Bega Cheese, supplies Bellamy's with infant formula
2007 Acquired by Tasmanian Pure Foods (private)
2012 Bellamy's opens an office in Shanghai
2013 Bellamy's launches its range in Chemist Warehouse (via Sigma Pharmaceuticals)
Shanghai Industrial Investment Co (SIIC) becomes distribution partner in China
2014 Public listing on the ASX
Launches in Costco Australia
2015 Opens Bellamy's flagship tmall.hk store
Signs five‐year contract with Fonterra to produce Bellamy's infant formula

June 23, 2016 Australia: Small Companies
Goldman Sachs Global Investment Research 8
A2M – close ties with Synlait
Processing: A2M contracts with NZ-based processor Synlait for its infant formula
production. Synlait is licensed and accredited by the Chinese regulatory authority, CNCA,
for supply into the Chinese market. Consistent with industry practice, A2M pays Synlait a
processing margin and sets its raw ingredient pricing every 3 months. Synlait also
contracts with Mead Johnson (bulk product) and New Hope Dairy (based in China, fully
finished product).
Milk supply: Synlait, with A2M’s assistance, sources a2 milk from segregated A2 only
herds. Most commercial farms worldwide will have c. 30% of cows that are naturally A2
only. Farmers receive a c. 5%-10% premium above the farmgate milk price to supply A2
only milk.
BAL – close ties with Fonterra and Bega
Processing: BAL contracts with Bega (BGA.AX, Not Covered) and Fonterra (FSF.NZ,
Coverage Suspended) for supply of finished product. Like Synlait, both are licensed and
accredited by the Chinese regulatory authorities, CNCA. Consistent with industry practice,
BAL pays Bega and Fonterra a processing margin and sets its raw material costs out 3-6
months in advance. Bega also makes product for Mead Johnson, Blackmores and others;
Fonterra for Danone, Beingmate and others.
Milk supply: Fonterra and Bega, with BAL’s assistance, source organic inputs from
Australia, New Zealand, Germany and Austria. Given higher farming costs and lower
yields, the premium paid for organic milk inputs is typically 30% more than standard milk
inputs, although given strong demand and recent falls in the farm gate price for standard
milk this premium is on the rise.
Exhibit 11: BAL and A2M outsource their supply, unlike many more vertically integrated
competitors
Supply chain of major players vs. BAL and A2M
Source: Company Data, Goldman Sachs Global Investment Research.
Milk collection &
processing
Manufacturing ‐ processing,
blending, packingSelling & marketing
Fonterra Fonterra
Bega Bega
Synlait Synlait A2
Bega Bega Blackmores
Various
Various
Various
Various
Various
Various
Various
Various Yashili
Bellamy's
Mead Johnson
Danone
Abbott
Beingmate
Biostime
Nestle
Heinz
ANZ brands
Multi‐nationals
Chinese brands
June 23, 2016 Australia: Small Companies
Goldman Sachs Global Investment Research 9
Infant formula in China: A market in rapid transition
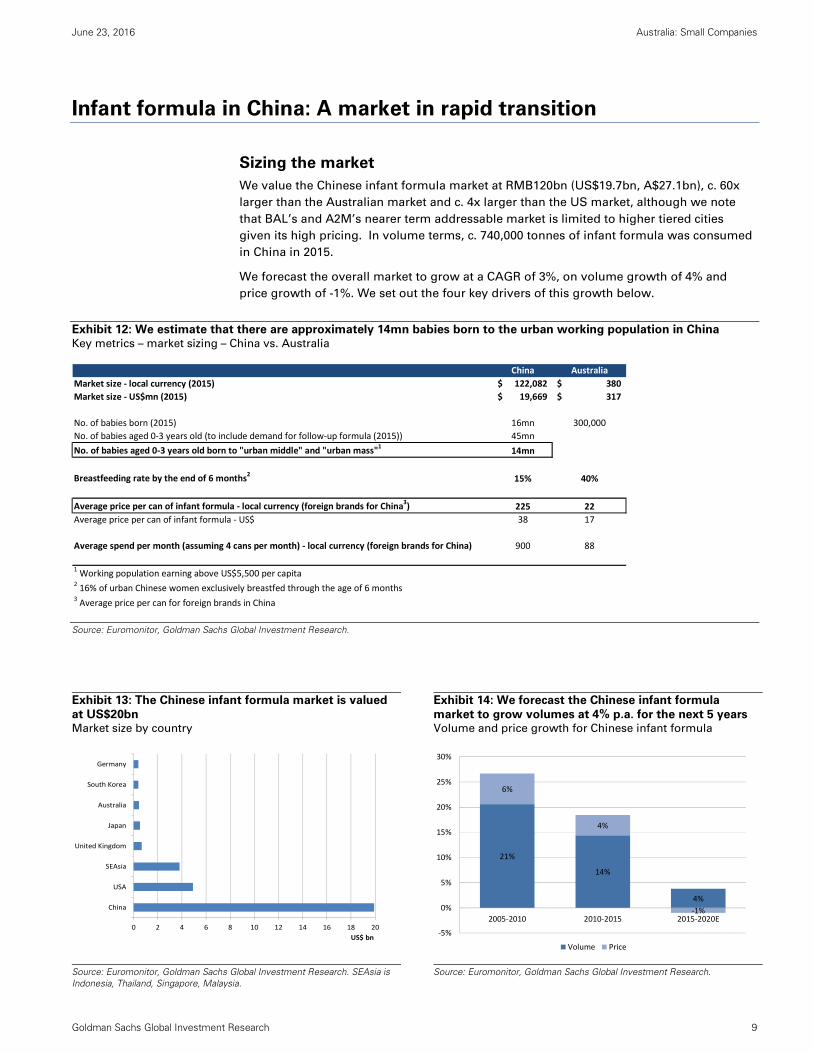
Sizing the market
We value the Chinese infant formula market at RMB120bn (US$19.7bn, A$27.1bn), c. 60x
larger than the Australian market and c. 4x larger than the US market, although we note
that BAL’s and A2M’s nearer term addressable market is limited to higher tiered cities
given its high pricing. In volume terms, c. 740,000 tonnes of infant formula was consumed
in China in 2015.
We forecast the overall market to grow at a CAGR of 3%, on volume growth of 4% and
price growth of -1%. We set out the four key drivers of this growth below.
Exhibit 12: We estimate that there are approximately 14mn babies born to the urban working population in China
Key metrics – market sizing – China vs. Australia
Source: Euromonitor, Goldman Sachs Global Investment Research.
Exhibit 13: The Chinese infant formula market is valued
at US$20bn Market size by country
Exhibit 14: We forecast the Chinese infant formula
market to grow volumes at 4% p.a. for the next 5 years Volume and price growth for Chinese infant formula
Source: Euromonitor, Goldman Sachs Global Investment Research. SEAsia is Indonesia, Thailand, Singapore, Malaysia.
Source: Euromonitor, Goldman Sachs Global Investment Research.
China Australia
Market size ‐ local currency (2015) 122,082$ 380$
Market size ‐ US$mn (2015) 19,669$ 317$
No. of babies born (2015) 16mn 300,000
No. of babies aged 0‐3 years old (to include demand for follow‐up formula (2015)) 45mn
No. of babies aged 0‐3 years old born to "urban middle" and "urban mass"1
14mn
Breastfeeding rate by the end of 6 months2
15% 40%
Average price per can of infant formula ‐ local currency (foreign brands for China3) 225 22
Average price per can of infant formula ‐ US$ 38 17
Average spend per month (assuming 4 cans per month) ‐ local currency (foreign brands for China) 900 88
1 Working population earning above US$5,500 per capita
2 16% of urban Chinese women exclusively breastfed through the age of 6 months
3 Average price per can for foreign brands in China
0 2 4 6 8 10 12 14 16 18 20
China
USA
SEAsia
United Kingdom
Japan
Australia
South Korea
Germany
US$ bn
21%
14%
4%
6%
4%
‐1%
‐5%
0%
5%
10%
15%
20%
25%
30%
2005‐2010 2010‐2015 2015‐2020E
Volume Price

June 23, 2016 Australia: Small Companies
Goldman Sachs Global Investment Research 10
Four key drivers of market growth
(1) Volume growth: Urbanisation and higher income levels to drive higher
consumption per capita (not relaxation of the one child policy)
We expect increasing consumption per capita growth to be underpinned by rising income
levels, increasing urbanization and more women entering the workforce.
We expect overall consumption per capita to grow even against the backdrop of falling
birth numbers in China. The end of the one child policy is in our view unlikely to generate
a country-wide baby boom given that there are now fewer mothers; to keep births flat,
births per marriage would have to increase by c. 50% to closer to two births per marriage.
Key points
Births in top-tier cities to rise with urbanization: Births and school enrolment in
Beijing and Shanghai have been growing above national trends as migrants put down
roots. Millennials are a big driver of this migration; only 23% were born in urban areas
but 59% live there.
Babies are born to parents with higher incomes: Urbanisation and rising income
levels mean that babies are increasingly born to older and wealthier working parents
willing to spend more.
Low and declining breastfeeding rates in urban areas: Social and cultural factors
such as the lack of maternity leave policies in workplaces, low community support for
breastfeeding and aggressive marketing by IMF brands translate to low breastfeeding
rates. In 2014, c. 16% of urban Chinese women exclusively breastfed their child to 6
months. Breastfeeding rates are higher in rural China at c. 30%, but in both cases they
continue to decline (Source: National Health and Family Planning Commission).
Exhibit 15: We expect the number of births in China to
fall even with relaxation of the one child policy No. of births and births per marriage in China
Exhibit 16: But market volume should be supported by
increasing consumption per capita, even though the
numbers of infants may decline….
Source: NBS, CEIC, Goldman Sachs Global Investment Research.
Source: Bloomberg, Euromonitor, Goldman Sachs Global Investment Research
5
8
11
14
17
20
23
26
29
1.0
2.0
3.0
1970
1975
1980
1985
1990
1995
2000
2005
2010
2015E
2020E
2025E
2030E
Births per marriage
Births
Marriages
Births per marriage
Millions Scenarios(1) Births stay flat(2) Births per marriage increases 1% p.a.(3) Births per marriage stays constant
(1)
(2)(3)
(1)(2)(3)
0.00
0.20
0.40
0.60
0.80
1.00
1.20
0 10000 20000 30000 40000 50000 60000 70000 80000 90000
KG per cap
ita
International $ per capita
USA
Canada
New Zealand
United Kingdom
Germany
Australia
Japan
Singapore
China
South Korea
Indonesia Malaysia

June 23, 2016 Australia: Small Companies
Goldman Sachs Global Investment Research 11
Exhibit 17: While overall birth rates are flat, there are
more babies being born in urban areas Number of live births – Beijing, Shanghai, China.
Exhibit 18: More children entering school in key cities Number of primary school entrants – Beijing, Shanghai,
China.
Source: CEIC, China NBS.
Source: CEIC, China NBS.
(2) Pricing growth: Online-led deflation and competition offset by premiumisation
Pricing growth has been positive in the last five years as consumers traded up. We expect
this premiumisation trend to continue and to more than offset by the deflationary forces
from competition and the shift to online.
Key points
Premiumisation/uptrading to continue: As income levels rise, we expect Chinese
mothers to continue to trade up to premium Western brands, which are widely
perceived to have greater nutritional benefits/safety profiles.
Exhibit 19: Safety and brand are paramount for Chinese consumers given contamination
scares in recent years Key decision-making factors for Chinese infant formula consumers
Source: Shanghai International Baby Maternity Industry Expo (CBME China), September 2014.
0
3
6
9
12
15
18
21
‐
50
100
150
200
250
300
350
2000 2001 2002 2003 2004 2005 2006 2007 2008 2009 2010 2011 2012 2013
mn births
000
births
Beijing (lhs) Shanghai (lhs) National (rhs)
0
3
6
9
12
15
18
21
‐
50
100
150
200
250
300
350
2000 2001 2002 2003 2004 2005 2006 2007 2008 2009 2010 2011 2012 2013
mn entran
ts
000s entran
ts
Beijing (lhs) Shanghai (lhs) National (rhs)
11%
17%
20%
22%
32%
49%
64%
Price
Other
Raw Materials
Taste
Place of Origin
Brand
Safety
June 23, 2016 Australia: Small Companies
Goldman Sachs Global Investment Research 12
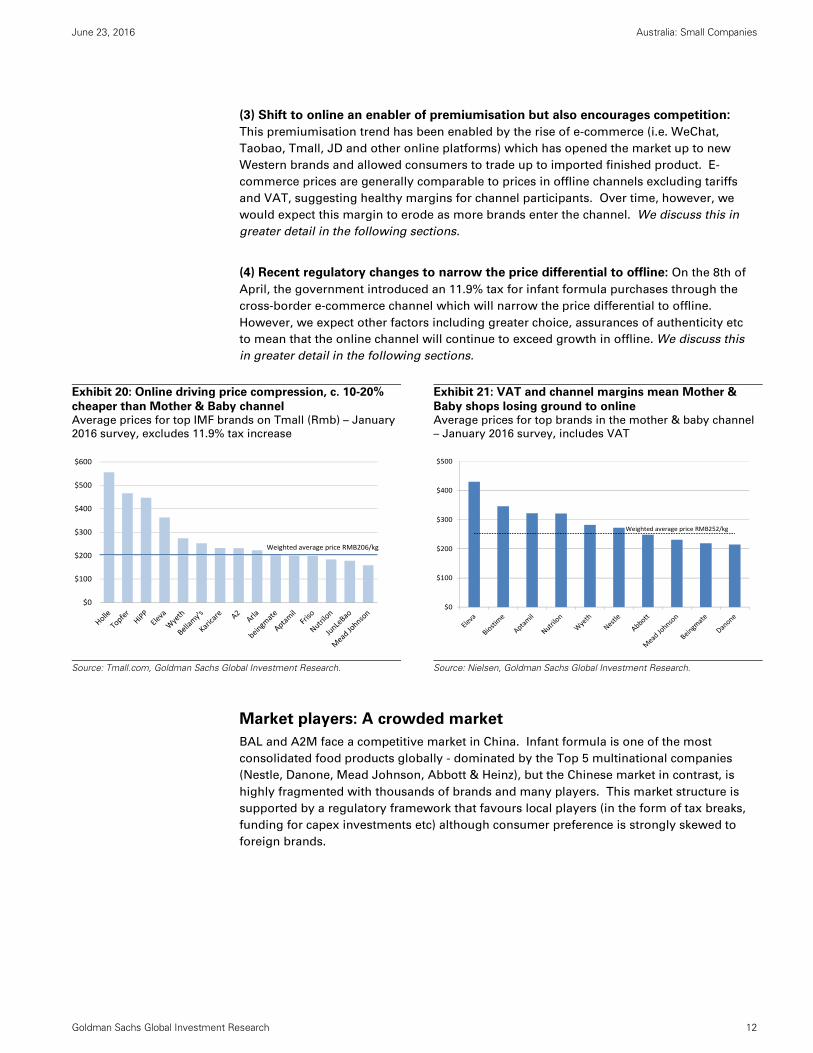
(3) Shift to online an enabler of premiumisation but also encourages competition:
This premiumisation trend has been enabled by the rise of e-commerce (i.e. WeChat,
Taobao, Tmall, JD and other online platforms) which has opened the market up to new
Western brands and allowed consumers to trade up to imported finished product. E-
commerce prices are generally comparable to prices in offline channels excluding tariffs
and VAT, suggesting healthy margins for channel participants. Over time, however, we
would expect this margin to erode as more brands enter the channel. We discuss this in
greater detail in the following sections.
(4) Recent regulatory changes to narrow the price differential to offline: On the 8th of
April, the government introduced an 11.9% tax for infant formula purchases through the
cross-border e-commerce channel which will narrow the price differential to offline.
However, we expect other factors including greater choice, assurances of authenticity etc
to mean that the online channel will continue to exceed growth in offline. We discuss this
in greater detail in the following sections.
Exhibit 20: Online driving price compression, c. 10-20%
cheaper than Mother & Baby channel Average prices for top IMF brands on Tmall (Rmb) – January
2016 survey, excludes 11.9% tax increase
Exhibit 21: VAT and channel margins mean Mother &
Baby shops losing ground to online Average prices for top brands in the mother & baby channel
– January 2016 survey, includes VAT
Source: Tmall.com, Goldman Sachs Global Investment Research.
Source: Nielsen, Goldman Sachs Global Investment Research.
Market players: A crowded market
BAL and A2M face a competitive market in China. Infant formula is one of the most
consolidated food products globally - dominated by the Top 5 multinational companies
(Nestle, Danone, Mead Johnson, Abbott & Heinz), but the Chinese market in contrast, is
highly fragmented with thousands of brands and many players. This market structure is
supported by a regulatory framework that favours local players (in the form of tax breaks,
funding for capex investments etc) although consumer preference is strongly skewed to
foreign brands.
$0
$100
$200
$300
$400
$500
$600
Weighted average price RMB206/kg
$0
$100
$200
$300
$400
$500
Weighted average price RMB252/kg
June 23, 2016 Australia: Small Companies
Goldman Sachs Global Investment Research 13
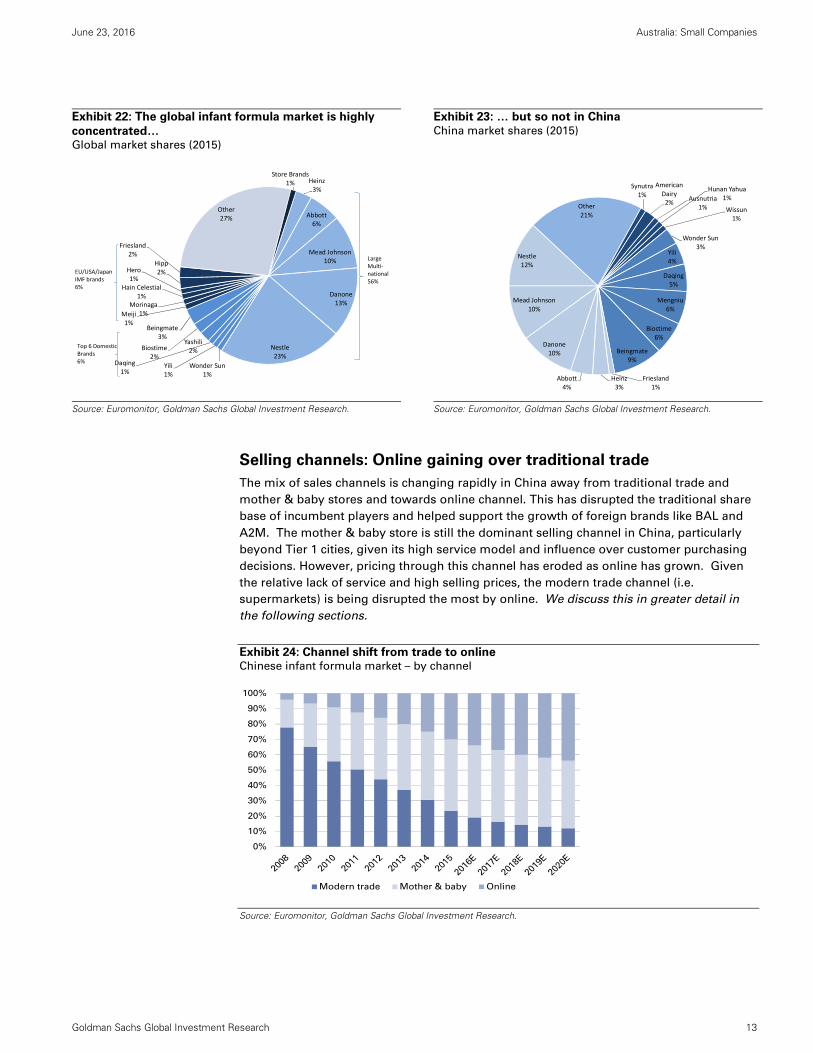
Exhibit 22: The global infant formula market is highly
concentrated… Global market shares (2015)
Exhibit 23: … but so not in China
China market shares (2015)
Source: Euromonitor, Goldman Sachs Global Investment Research.
Source: Euromonitor, Goldman Sachs Global Investment Research.
Selling channels: Online gaining over traditional trade
The mix of sales channels is changing rapidly in China away from traditional trade and
mother & baby stores and towards online channel. This has disrupted the traditional share
base of incumbent players and helped support the growth of foreign brands like BAL and
A2M. The mother & baby store is still the dominant selling channel in China, particularly
beyond Tier 1 cities, given its high service model and influence over customer purchasing
decisions. However, pricing through this channel has eroded as online has grown. Given
the relative lack of service and high selling prices, the modern trade channel (i.e.
supermarkets) is being disrupted the most by online. We discuss this in greater detail in
the following sections.
Exhibit 24: Channel shift from trade to online Chinese infant formula market – by channel
Source: Euromonitor, Goldman Sachs Global Investment Research.
Heinz3%
Abbott6%
Mead Johnson10%
Danone13%
Nestle23%
Wonder Sun1%
Yili1%
Daqing1%
Yashili2%Biostime
2%
Beingmate3%
Meiji1%
Morinaga1%
Hain Celestial1%
Hero1%
Hipp2%
Friesland2%
Other27%
Store Brands1%
LargeMulti‐national56%
Top 6 DomesticBrands6%
EU/USA/Japan IMF brands6%
Nestle12%
Other21%
Synutra1%
American Dairy2%
Ausnutria1%
Hunan Yahua1%
Wissun1%
Wonder Sun3%
Yili4%
Daqing5%
Mengniu6%
Biostime6%
Beingmate9%
Friesland1%
Heinz3%
Abbott4%
Danone10%
Mead Johnson10%
0%
10%
20%
30%
40%
50%
60%
70%
80%
90%
100%
Modern trade Mother & baby Online

June 23, 2016 Australia: Small Companies
Goldman Sachs Global Investment Research 14
Infant formula in Australia: Mature growth
In Australia, underlying demand is mature given stable birth numbers and breastfeeding
rates. We forecast category growth of 5%, with vol 2% and price 3%.
How do A2M/BAL sell in Australia?
In Australia, infant formula is sold mainly through grocery outlets and pharmacies. 80% is
sold through the supermarket channel (of which Coles and Woolworths have a c. 70%
share). Leading discount pharmacy chain Chemist Warehouse has also grown in
importance for both BAL and A2M given its prominence as a destination for Chinese
consumers/traders.
Exhibit 25: Stable birth numbers in Australia Australia – Number of Births and Birth Rate
Exhibit 26: Supermarkets dominant but losing some
ground to health specialists and online Australian market by selling channel
Source: ABS.
Source: Euromonitor.
Niche brands have been gaining share
The Australian market, like most other markets ex-China, is dominated by large global
players. In recent years, however, niche brands with differentiated selling points like BAL
and A2M have been gaining share, even after adjusting for Chinese grey market demand.
Exhibit 27: Niche brands like BAL with differentiated
selling points have been gaining share Market shares – Australian consumers (adjusted for Chinese
demand)
Exhibit 28: BAL and A2M command premium pricing in
Australia Pricing by brand
Source: Euromonitor, Goldman Sachs Global Investment Research.
Source: Goldman Sachs Global Investment Research.
11.5
12.0
12.5
13.0
13.5
14.0
14.5
0
50,000
100,000
150,000
200,000
250,000
300,000
350,000
2000 2001 2002 2003 2004 2005 2006 2007 2008 2009 2010 2011 2012 2013 2014
Births Birth Rate (births per 1000 population)
0%
10%
20%
30%
40%
50%
60%
70%
80%
90%
100%
2008 2009 2010 2011 2012 2013 2014 2015
Supermarkets Health Specialist Online Other
$0
$5
$10
$15
$20
$25
$30
$35
A$/kg

June 23, 2016 Australia: Small Companies
Goldman Sachs Global Investment Research 15
BAL/A2M growing in popularity in China
Why are Bellamy’s and a2 Platinum popular? Can this continue?
A crisis of consumer confidence: Serious contamination scares (from 2008 and as
recently as 2012), corruption scandals and price fixing allegations created a high level
of distrust towards the safety and quality of local product among Chinese consumers.
Wealthier consumers turned to foreign markets to satisfy their requirements; buying
fully finished formula from other countries. They source product via a multitude of
ways: through friends and relatives, small traders, directly from foreign websites or
more recently through cross-border e-commerce (via Chinese online
retailers/marketplaces). The Chinese government has overhauled the domestic
industry and is encouraging consolidation and better supply chain transparency, but
we expect it will take many years before the Chinese industry wins back the trust of its
consumers.
“Brand ANZ”: Australia and New Zealand have a strong reputation in China for
producing quality food produce. Germany and the Netherlands are also popular. The
growing numbers of Chinese students (c. 170,000 in total vs. 300,000 in the US),
tourists (now annualizing c. 1mn a year) and residents in Australia and New Zealand
also contribute towards “Brand ANZ’s” popularity. We note that ANZ was the fourth-
best selling source for products sold on Tmall during Single’s Day 2015 (after the US,
Korea and Japan).
Premium leading brands: Chinese consumers tend to gravitate towards premium
local brands that are perceived to be popular in their home country. We believe A2M’s
success can be partly explained by its high pricing in the Australian market, which is
associated with quality and prestige. Consumption of organic produce is also on the
rise in China which supports BAL’s brand.
The rise of “cross-border e-commerce”: The Chinese government introduced a pilot
program for cross-border e-commerce platforms in 2014 which saw the creation of
preferential tax and regulation zones for the importation of foreign goods. These
goods are imported through government-owned bonded warehouses and sold to
consumers via China’s major online retailers (Tmall/Taobao, JD etc). Our estimates
suggest that this bonded warehouse model now accounts for c. RMB40bn of trade,
comprising c. 20% of overall cross-border trade (including direct mail/parcel trades).
Exhibit 29: Cross-border e-commerce (CBEC) has been
growing fast in China China’s CBEC market (US$bn)
Exhibit 30: CBEC already accounts for c.10% for
mother/baby and cosmetics products’ sales in China CBEC by product category (%)
Source: CECRC.
Source: CECRC, Euromonitor, Goldman Sachs Global Investment Research.
1.8 3.9
7.1
11.3
24.2
38.7
-
5.0
10.0
15.0
20.0
25.0
30.0
35.0
40.0
45.0
2010 2011 2012 2013 2014 2015E
11.9%
8.3%7.6%
4.1%
0.3%0.0%0%
2%
4%
6%
8%
10%
12%
14%
Mother/baby Cosmetics Healthcare Luxury Apparel & footwear Food, Alcohol &
Tobacco
% of China retail (2014)
Cross-border e-commerce (CBE)

June 23, 2016 Australia: Small Companies
Goldman Sachs Global Investment Research 16
Sales channel shifts favour more nimble Western brands
Selling channels for infant formula are evolving rapidly in China influencing channel and
brand profitability. We expect the online channel to continue to take share away from
traditional trade given lower ‘cost to serve’ for suppliers, assurances of authenticity and
better convenience for customers. We would also expect the trader route-to-market to
remain significant (particularly if labelling changes are required) although direct sales will
grow in importance given higher selling margins.
Three main routes into China
1. Indirectly via Australian retailers via direct mail or bonded warehouse, the main
route to market (c. 70%-80% of sales to Chinese consumers): Product purchased
from Australian retailers (pharmacy chains and supermarkets) by Chinese traders and
sold online via WeChat, Taobao/Tmall, JD and other online platforms. We expect this
indirect trade from Australia will remain an important way of accessing product for the
Chinese consumer given lingering concerns over authenticity of product sold in
onshore channels. Based on Tmall/Taobao data, we estimate that c. 20%-50% is sold
through the bonded warehouse, the remainder being sold through direct mail,
although the lack of clear data makes estimating this challenging.
Recent news sources (AFR 10 May 2016, 26 May 2016, Weibo) suggest the government
is tightening its enforcement of taxes/compliance through the direct mail channel
(including at airports, express parcels). We think this may create some short-term
disruption for both BAL/A2M given that a number of B2C businesses were likely
avoiding taxes previously. Our view, which is based on official customs statements, is
that the direct mail channel will continue to remain open but will be subject to greater
regulatory oversight. Given the non-discretionary nature of infant formula, and strong
demand for these brands, we believe that the medium-term investment thesis remains
intact.
2. Directly in China via e-commerce, growing in importance: A key focus for BAL/A2M
going forward, subject to meeting the appropriate regulatory requirements, and
involves product sold via own online stores. BAL earns high selling margins from this
channel (43% China EBIT margin in 1H16) and can exert greater control over its pricing
architecture, advertising and brand. Based on our channel checks, A2M sells through
distribution partners, and we therefore believe it realises a lower GM than BAL in this
channel.
3. Directly via Chinese offline retailers, and likely to remain small: Issues over
authenticity as well as higher prices due to taxes (VAT + tariffs) and middlemen
margins mean that this channel is likely to remain small in the absence of more direct
investment to improve its on-the-ground presence in the country.
The importance of traders in moving product
The retail price differential in China vs. Australia and strong demand has seen a lucrative
informal trade mushroom between the two countries. These traders serve as a marketing
tool helping to promote, market and educate consumers and are influential in determining
which brands flourish and which do not.
Understanding the motivations and profitability of the vast web of traders/resellers (from
students using third party courier services to larger businesses with in-house logistics and
warehousing) are key in understanding BAL and A2M’s future prospects. We see profit
margins as well as availability/regularity of supply as being two critical motivators.

June 23, 2016 Australia: Small Companies
Goldman Sachs Global Investment Research 17
Our profitability analysis suggests lucrative profits for channel participants:
Larger traders with better access to supply and who pay closer to wholesale prices
earn the highest margin, although margins are still solid even for smaller traders who
pay closer to retail prices margins.
We expect the trader route to remain significant but expect more growth from direct
sales into the Free Trade Zone/bonded warehouse given BAL/A2M would earn higher
margins.
Exhibit 31: Price in China (based on Tmall) are c. 75% higher (value-weighted) than retail
prices in Australia Tmall vs. Aus retail ave (Coles, Woolworths, Chemist Warehouse) price – January 2016 survey –
pre 11.9% tax increase
Source: Tmall, Goldman Sachs Global Investment Research. A$ prices translated at 4.6 AUD/CNY.
$0
$50
$100
$150
$200
$250
$300
Aus Retail Average Tmall
RMB/kg

June 23, 2016 Australia: Small Companies
Goldman Sachs Global Investment Research 18
Exhibit 32: A2M – Sizable profit margins for the trader A2M – profitability by distribution channel (CNY) – for Level 3 formula
Source: Tmall.com, Goldman Sachs Global Investment Research.
Exhibit 33: BAL - Sizable profit margins for the trader, BAL makes highest margin from
direct selling BAL – profitability by distribution channel (CNY) – For Level 3 formula
Source: Tmall.com, Goldman Sachs Global Investment Research.
41 41 41 41 41
51 51 51
8163
29 29 20
23 522014
16 239 64
60 71
0
50
100
150
200
250
Australia China ‐ C2C China ‐ Free TradeZone ‐ Trader
China ‐ Free TradeZone ‐ A2M
Mother and BabyStore
COGS ATM GP Aus Retailer GP
China VAT + Import Tax Logistics and Platform Costs Trader/retailer GP
Trader profit: RMB64
Trader profit: RMB39
RMB180
RMB190
RMB220RMB230
RMB121
47 47 47 47 47
34 34 31
112
6224 24 22
23
24
54
2415
16
285 78
3074
0
50
100
150
200
250
300
Australia China ‐ C2C China ‐ Free TradeZone ‐ Trader
China ‐ Free TradeZone ‐ Bellamy's
Mother and BabyStore
COGS BAL GP Aus Retailer GP
China VAT + Import Tax Logistics and Platform Costs Trader/retailer GP
RMB106
Trader profit: RMB85
Trader profit: RMB78
RMB215 RMB216RMB230
RMB240
June 23, 2016 Australia: Small Companies
Goldman Sachs Global Investment Research 19
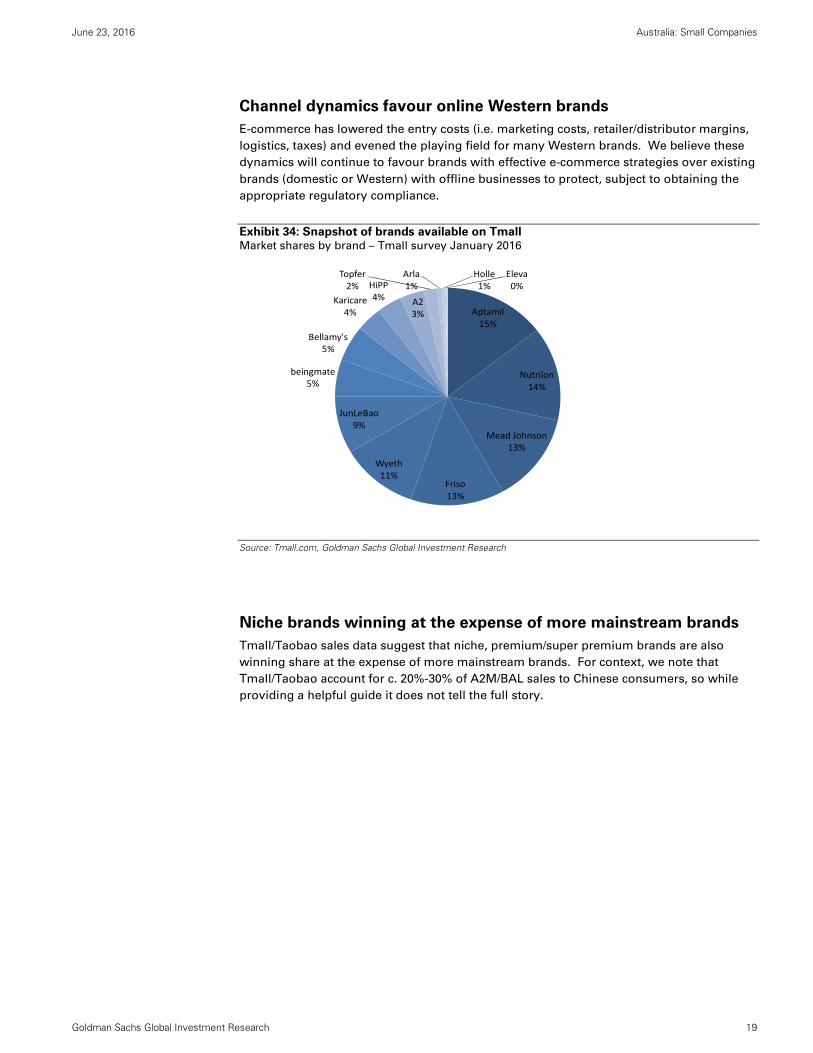
Channel dynamics favour online Western brands
E-commerce has lowered the entry costs (i.e. marketing costs, retailer/distributor margins,
logistics, taxes) and evened the playing field for many Western brands. We believe these
dynamics will continue to favour brands with effective e-commerce strategies over existing
brands (domestic or Western) with offline businesses to protect, subject to obtaining the
appropriate regulatory compliance.
Exhibit 34: Snapshot of brands available on Tmall Market shares by brand – Tmall survey January 2016
Source: Tmall.com, Goldman Sachs Global Investment Research
Niche brands winning at the expense of more mainstream brands
Tmall/Taobao sales data suggest that niche, premium/super premium brands are also
winning share at the expense of more mainstream brands. For context, we note that
Tmall/Taobao account for c. 20%-30% of A2M/BAL sales to Chinese consumers, so while
providing a helpful guide it does not tell the full story.
Aptamil15%
Nutrilon14%
Mead Johnson13%
Friso13%
Wyeth11%
JunLeBao9%
beingmate5%
Bellamy's5%
Karicare4%
HiPP4% A2
3%
Topfer2%
Arla1%
Holle1%
Eleva0%

June 23, 2016 Australia: Small Companies
Goldman Sachs Global Investment Research 20
Exhibit 35: Tmall/Taobao data suggest that niche brands
are taking share away from more mainstream brands Market share - % of category
Exhibit 36: Positive category growth for both infant
formula and vitamins/health supplements Turnover – RMB mn
Source: Tmall.com, Taobao.com.
Source: Tmall.com, Taobao.com
Exhibit 37: A2M has seen strong growth…
Monthly turnover – A2M and BAL
Exhibit 38: … partially price driven
Average price – A2M and BAL
Source: Tmall.com, Taobao.com
Source: Tmall.com, Taobao.com
0%
5%
10%
15%
20%
25%
Jan‐15
Feb‐15
Mar‐15
Apr‐15
May‐15
Jun‐15
Jul‐15
Aug‐15
Sep‐15
Oct‐15
Nov‐15
Dec‐15
Jan‐16
Feb‐16
Mar‐16
Apr‐16
May‐16
Nutrilon BAL A2M Aptamil Mead Johnson hipp
RMB
RMB200
RMB400
RMB600
RMB800
RMB1,000
RMB1,200
RMB1,400
Jan‐15
Feb‐15
Mar‐15
Apr‐15
May‐15
Jun‐15
Jul‐15
Aug‐15
Sep‐15
Oct‐15
Nov‐15
Dec‐15
Jan‐16
Feb‐16
Mar‐16
Apr‐16
May‐16
Monthly sales ‐ IMF Monthly sales ‐ Vits/health supp
RMB
RMB5
RMB10
RMB15
RMB20
RMB25
Jan‐15
Feb‐15
Mar‐15
Apr‐15
May‐15
Jun‐15
Jul‐15
Aug‐15
Sep‐15
Oct‐15
Nov‐15
Dec‐15
Jan‐16
Feb‐16
Mar‐16
Apr‐16
May‐16
BAL A2M
100
120
140
160
180
200
220
240
260
280
300
Jan‐15
Feb‐15
Mar‐15
Apr‐15
May‐15
Jun‐15
Jul‐15
Aug‐15
Sep‐15
Oct‐15
Nov‐15
Dec‐15
Jan‐16
Feb‐16
Mar‐16
Apr‐16
May‐16
BAL A2M
June 23, 2016 Australia: Small Companies
Goldman Sachs Global Investment Research 21
Securing supply the key to sustaining growth
The ability to supply the market is key to growth. Both BAL and A2M have experienced
product shortages in the Australian market mainly due to the unexpected surge in demand
and long lead times for ingredient sourcing and production (typically 3-6 months). For BAL,
there is also the additional cost and constraint from the sourcing of organic raw ingredients.
BAL’s organic supply chain is fragmented
The organic milk market is highly fragmented so forecasting the amount of milk available
to BAL is challenging. BAL has not provided this information to the market but the
company has noted that it will be increasing its investment to encourage more farmers to
convert to organic farming.
Conversion to organic farming takes three years: Conversion to organic farming from
conventional farming takes c. 3 years and is considered a risky proposition for many
farmers in the interim. During the first year of conversion, produce is sold at conventional
prices and many incur losses given lower yields. In years two and three, “in conversion”
produce can be sold at a small premium. Farm yields can rise to pre-conversion levels
over time, delivering financial returns which exceed conventional farming given the
premiums paid for organic produce.
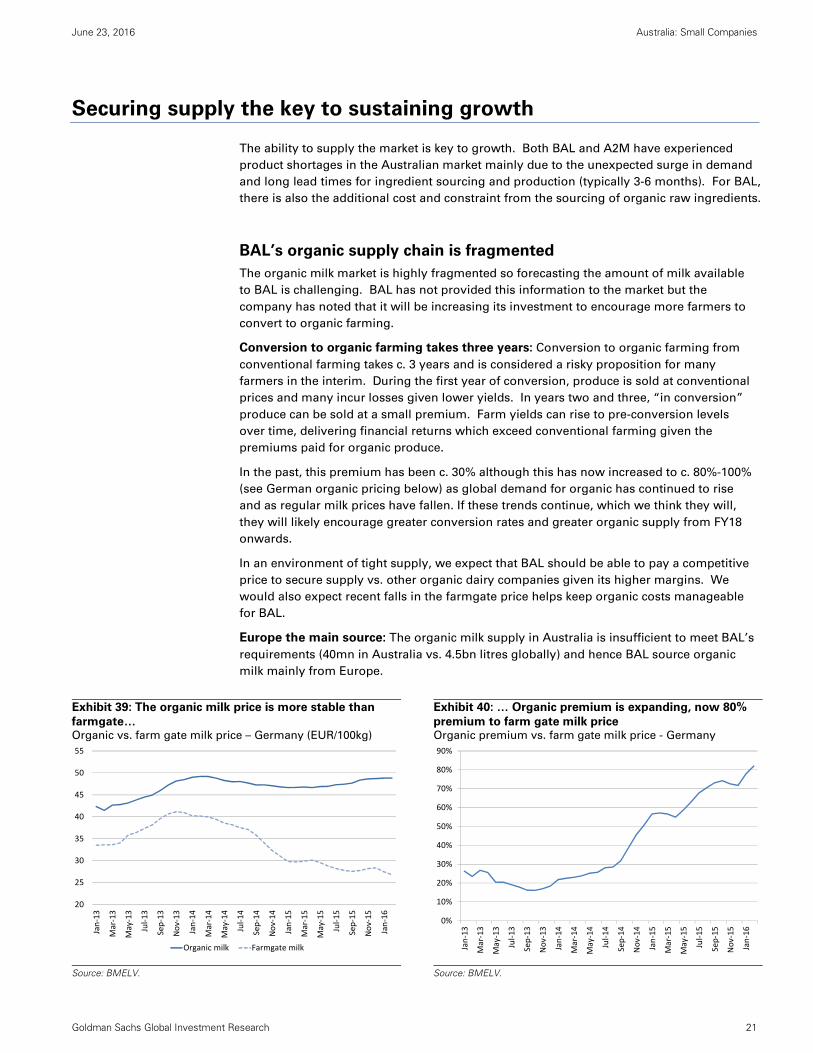
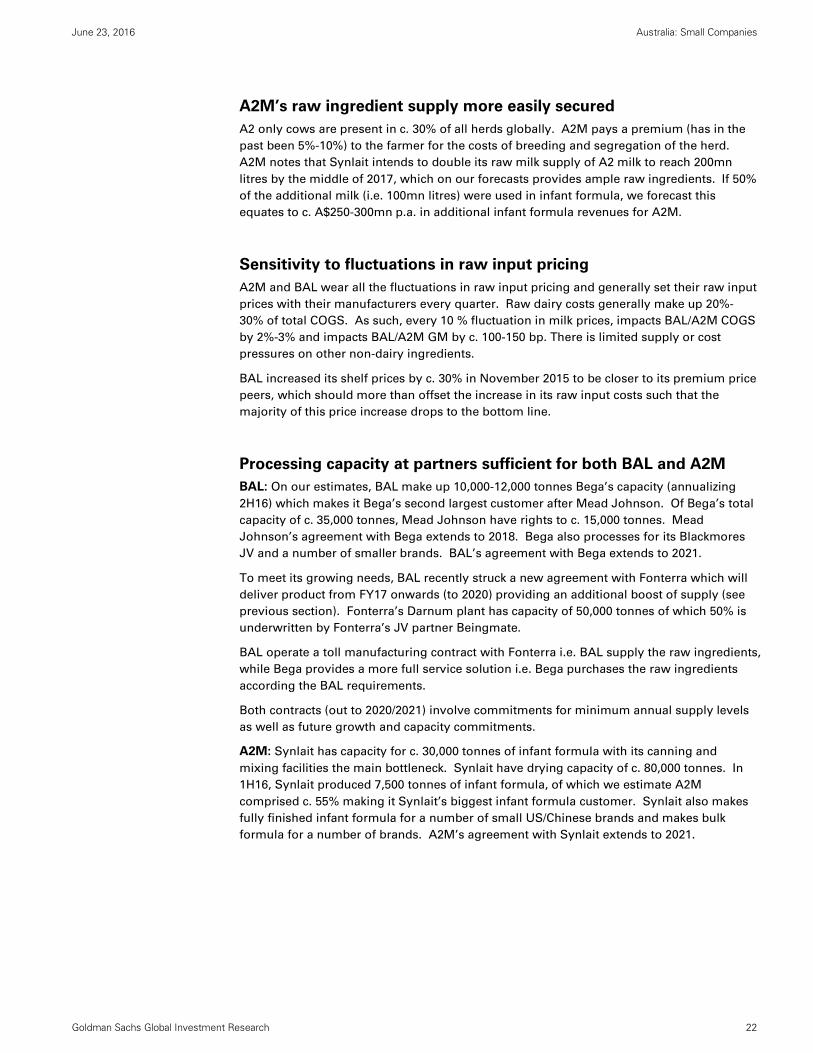
In the past, this premium has been c. 30% although this has now increased to c. 80%-100%
(see German organic pricing below) as global demand for organic has continued to rise
and as regular milk prices have fallen. If these trends continue, which we think they will,
they will likely encourage greater conversion rates and greater organic supply from FY18
onwards.
In an environment of tight supply, we expect that BAL should be able to pay a competitive
price to secure supply vs. other organic dairy companies given its higher margins. We
would also expect recent falls in the farmgate price helps keep organic costs manageable
for BAL.
Europe the main source: The organic milk supply in Australia is insufficient to meet BAL’s
requirements (40mn in Australia vs. 4.5bn litres globally) and hence BAL source organic
milk mainly from Europe.
Exhibit 39: The organic milk price is more stable than
farmgate… Organic vs. farm gate milk price – Germany (EUR/100kg)
Exhibit 40: … Organic premium is expanding, now 80%
premium to farm gate milk price Organic premium vs. farm gate milk price - Germany
Source: BMELV.
Source: BMELV.
20
25
30
35
40
45
50
55
Jan‐13
Mar‐13
May‐13
Jul‐13
Sep‐13
Nov‐13
Jan‐14
Mar‐14
May‐14
Jul‐14
Sep‐14
Nov‐14
Jan‐15
Mar‐15
May‐15
Jul‐15
Sep‐15
Nov‐15
Jan‐16
Organic milk Farmgate milk
0%
10%
20%
30%
40%
50%
60%
70%
80%
90%
Jan‐13
Mar‐13
May‐13
Jul‐13
Sep‐13
Nov‐13
Jan‐14
Mar‐14
May‐14
Jul‐14
Sep‐14
Nov‐14
Jan‐15
Mar‐15
May‐15
Jul‐15
Sep‐15
Nov‐15
Jan‐16
June 23, 2016 Australia: Small Companies
Goldman Sachs Global Investment Research 22
A2M’s raw ingredient supply more easily secured
A2 only cows are present in c. 30% of all herds globally. A2M pays a premium (has in the
past been 5%-10%) to the farmer for the costs of breeding and segregation of the herd.
A2M notes that Synlait intends to double its raw milk supply of A2 milk to reach 200mn
litres by the middle of 2017, which on our forecasts provides ample raw ingredients. If 50%
of the additional milk (i.e. 100mn litres) were used in infant formula, we forecast this
equates to c. A$250-300mn p.a. in additional infant formula revenues for A2M.
Sensitivity to fluctuations in raw input pricing
A2M and BAL wear all the fluctuations in raw input pricing and generally set their raw input
prices with their manufacturers every quarter. Raw dairy costs generally make up 20%-
30% of total COGS. As such, every 10 % fluctuation in milk prices, impacts BAL/A2M COGS
by 2%-3% and impacts BAL/A2M GM by c. 100-150 bp. There is limited supply or cost
pressures on other non-dairy ingredients.
BAL increased its shelf prices by c. 30% in November 2015 to be closer to its premium price
peers, which should more than offset the increase in its raw input costs such that the
majority of this price increase drops to the bottom line.
Processing capacity at partners sufficient for both BAL and A2M
BAL: On our estimates, BAL make up 10,000-12,000 tonnes Bega’s capacity (annualizing
2H16) which makes it Bega’s second largest customer after Mead Johnson. Of Bega’s total
capacity of c. 35,000 tonnes, Mead Johnson have rights to c. 15,000 tonnes. Mead
Johnson’s agreement with Bega extends to 2018. Bega also processes for its Blackmores
JV and a number of smaller brands. BAL’s agreement with Bega extends to 2021.
To meet its growing needs, BAL recently struck a new agreement with Fonterra which will
deliver product from FY17 onwards (to 2020) providing an additional boost of supply (see
previous section). Fonterra’s Darnum plant has capacity of 50,000 tonnes of which 50% is
underwritten by Fonterra’s JV partner Beingmate.
BAL operate a toll manufacturing contract with Fonterra i.e. BAL supply the raw ingredients,
while Bega provides a more full service solution i.e. Bega purchases the raw ingredients
according the BAL requirements.
Both contracts (out to 2020/2021) involve commitments for minimum annual supply levels
as well as future growth and capacity commitments.
A2M: Synlait has capacity for c. 30,000 tonnes of infant formula with its canning and
mixing facilities the main bottleneck. Synlait have drying capacity of c. 80,000 tonnes. In
1H16, Synlait produced 7,500 tonnes of infant formula, of which we estimate A2M
comprised c. 55% making it Synlait’s biggest infant formula customer. Synlait also makes
fully finished infant formula for a number of small US/Chinese brands and makes bulk
formula for a number of brands. A2M’s agreement with Synlait extends to 2021.

June 23, 2016 Australia: Small Companies
Goldman Sachs Global Investment Research 23
Exhibit 41: Australian and New Zealand manufacturers and their current and announced capacity expansions, and a
large number of disclosed brands – a number are planning large capacity expansions Australian/New Zealand manufacturers of infant formula
Source: Company data, Goldman Sachs Global Investment Research.
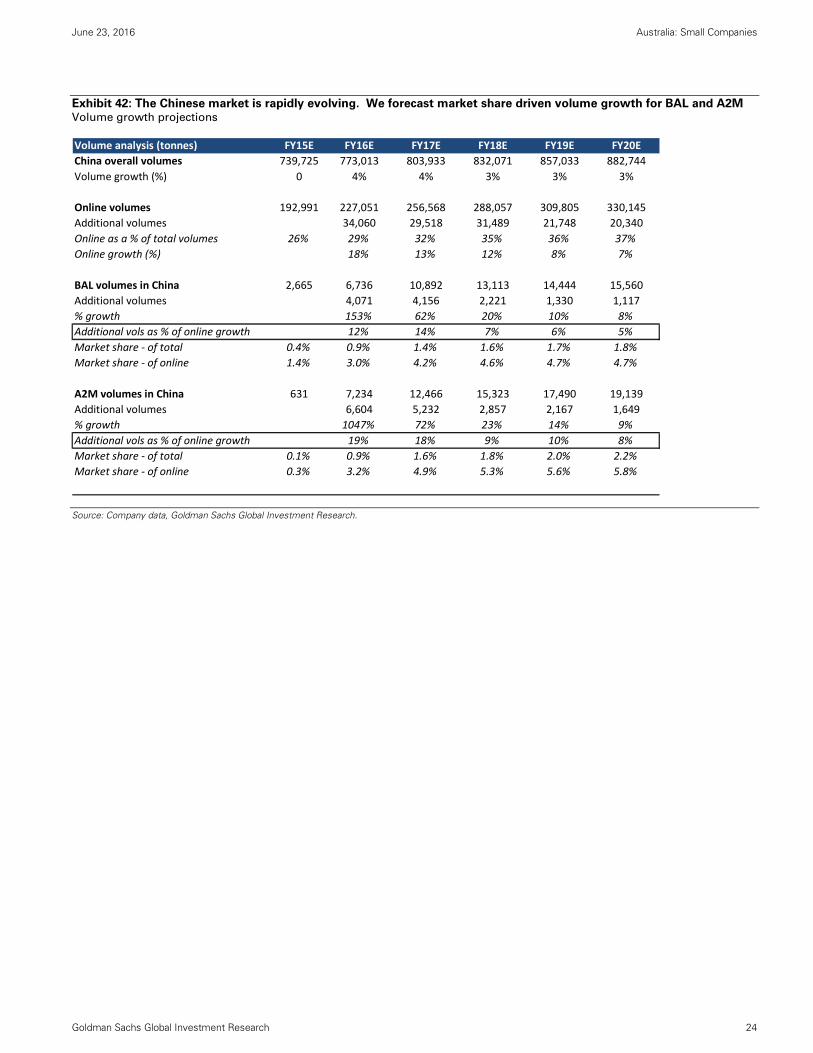
Our volume growth forecasts and assumptions
Bringing this together, we outline our volume growth forecast for the market and for BAL
and A2M. We forecast market share driven volume growth from:
The shift from offline to online as e-commerce penetration grows;
The shift from local to foreign brands as cross-border trade expands;
The shift from mainstream foreign to niche foreign brands as Chinese consumers
search for premium niche alternatives.
China is a 740,000 tonne market by volume. Of this, the online channel (c. 25% of total
volumes) is growing rapidly while the traditional trade channel is shrinking. We estimate
the online channel to grow by c. 20,000 – 35,000 tonnes per year.
For BAL and A2M, we estimate they will each grow volumes by 1,000 – 6,600 tonnes
respectively each year. In FY16E, this makes up 30% of overall volume growth in the online
channel. We acknowledge that at first glance this appears to be outsized growth vs. their
market share in the channel (combined c. 6.5% share of volumes online in FY16). However,
as we have noted above a number of mainstream brands are shrinking rapidly as their
branding and channel strategies have not been as successful. By FY20E, we expect growth
to reach a more steady state such that their contribution to growth (11% combined) more
closely matches their combined market shares (11%).
We forecast market share gains for both, but forecast slower growth for BAL given tighter
constraints on organic raw materials.
Australia
Manufacturer Brands Current capacity (kt) Announced capacity expansions (kt)
Camperdown Powder Duribaby, Camperdown 9
VIPlus Dairy VIPlus 5 10
Farmland Dairy Farmdaisy Formula 5
Australian Dairy Park Oz Farm Infant Formula, O'Milk Premium Gold 20
Burra Foods Burra Foods 10
Tatura Milk Industries Mead Johnson, Bellamy's, Blackmores, Snow 35
Murray Goulburn Co‐op Natrastart, Mead Johnson, Kalbe 18 90
Blend and Pack Bellamy's 5
107
New Zealand
Manufacturer Brands Current capacity (kt)
Nutricia Karicare 40
Canpac (Fonterra) Anmum 60
SynlaitA2 Platinum, Danone Nutricia, New Hope
Nutritionals, Nouriz30
Blue River Blue River Sheep Milk Powder 5
Sutton Group (Danone) Danone Brands 20
New Image International Babysteps, Symbiotics, Bioactive Small
Dairy Goat Co‐operative Karihome Small
New Zealand New Milk Small
155
Capacity ‐ Australia
Capacity ‐ NZ
June 23, 2016 Australia: Small Companies
Goldman Sachs Global Investment Research 24
Exhibit 42: The Chinese market is rapidly evolving. We forecast market share driven volume growth for BAL and A2M Volume growth projections
Source: Company data, Goldman Sachs Global Investment Research.
Volume analysis (tonnes) FY15E FY16E FY17E FY18E FY19E FY20E
China overall volumes 739,725 773,013 803,933 832,071 857,033 882,744
Volume growth (%) 0 4% 4% 3% 3% 3%
Online volumes 192,991 227,051 256,568 288,057 309,805 330,145
Additional volumes 34,060 29,518 31,489 21,748 20,340
Online as a % of total volumes 26% 29% 32% 35% 36% 37%
Online growth (%) 18% 13% 12% 8% 7%
BAL volumes in China 2,665 6,736 10,892 13,113 14,444 15,560
Additional volumes 4,071 4,156 2,221 1,330 1,117
% growth 153% 62% 20% 10% 8%
Additional vols as % of online growth 12% 14% 7% 6% 5%
Market share ‐ of total 0.4% 0.9% 1.4% 1.6% 1.7% 1.8%
Market share ‐ of online 1.4% 3.0% 4.2% 4.6% 4.7% 4.7%
A2M volumes in China 631 7,234 12,466 15,323 17,490 19,139
Additional volumes 6,604 5,232 2,857 2,167 1,649
% growth 1047% 72% 23% 14% 9%
Additional vols as % of online growth 19% 18% 9% 10% 8%
Market share ‐ of total 0.1% 0.9% 1.6% 1.8% 2.0% 2.2%
Market share ‐ of online 0.3% 3.2% 4.9% 5.3% 5.6% 5.8%

June 23, 2016 Australia: Small Companies
Goldman Sachs Global Investment Research 25
A complex regulatory environment
Regulation of infant formula
In response to serious contamination issues and price-fixing cases, the government
launched a large scale regulatory review culminating in a landmark document in 2013
(Working Opinion on How to Improve the Quality and Safety of China’s IMF Industry),
which outlines its broad-based goals for the industry. However, we note that the policy
details and fine print continue to evolve. These goals include:
1. Consolidation of domestic manufacturers to ensure adequate supply to meet
demand and restore public confidence. The government’s target is for the top 10
players to comprise 80% of the market, to reduce the number of players from 80 to 50
and to nurture a group of 3-5 domestic players with annual sales of RMB 5bn by 2018;
and
From a BAL/A2M perspective, despite these significant changes, market share data
suggests that demand has not yet returned to domestic brands. We believe it may take
a number (if not many) years before consumer confidence in domestic manufacturers
is restored. However, government support for domestic companies in the form of tax
breaks, funding for capex investments etc, plus forced consolidation, will likely mean
that a more crowded market structure will continue to prevail.
2. Safety & quality: Increase regulatory oversight of the production process to ensure
supply chain integrity from cow to can (including introducing strict licensing
requirements for all IMF manufacturers that export to China) and stream-lining
domestic supply chains (including banning OEM production). Every foreign
manufacturer needs to be compliant according to strict standards set by the CNCA and
audits are conducted regularly. BAL and A2M’s manufacturers have CNCA approval.
3. Three brands per manufacturer: To promote supply chain transparency, the
government is also requiring each domestic and foreign manufacturer to reduce the
number of brands produced to only 3 product lines and 9 formulas. All brands have
until October 2016 to comply with these rules.
We expect this to have a limited impact on BAL and A2M given their importance to
their respective manufacturers. The elimination of the long tail of brands will be
overall positive for the industry. A2M’s position with Synlait is secure given that it is
Synlait’s biggest customer, although having only 1 supplier raises the risks of potential
safety/contamination issues. BAL is also a substantial customer for Bega - on our
estimates, Bega’s second largest customer. BAL is also an important customer for
Fonterra. Fonterra will begin supplying BAL from FY17 onwards from its Australian
Darnum plant which is 50% owned by China’s Beingmate.
Regulation of the cross-border e-commerce channel
New regulation has also been introduced for the cross-border e-commerce/bonded
warehouse channel in recent months. We believe the key issues for A2M/BAL are:
1. Formula registration by 2018: By 2018, infant formula brands sold through the
bonded warehouse will be required to register their formulas with the CFDA. Before
then, all infant formula with registration from the CNCA (includes both BAL and A2M
product) will still be allowed through the cross-border e-commerce channel.
2. Chinese labelling by 2018: Chinese labelling for all cross-border e-commerce infant
formula will be required by 2018 and could have significant impacts on consumer
perceptions. BAL and A2M both have a Chinese labelled product available for sale in
the offline channel, however, sales remain small. If Chinese consumers perceive the
Chinese label product as inferior to an English label product, we expect sales to divert

June 23, 2016 Australia: Small Companies
Goldman Sachs Global Investment Research 26
away from the bonded warehouse channel to direct mail which is less scalable. BAL
and A2M will need to rely more on its direct relationships with distributors/traders to
sell a Chinese label product through the bonded warehouse.
3. Higher taxes, but still lower than offline: From April 8 2016, an 11.9% effective tax
(calculated as 70% of the 17% offline VAT) increase from all infant formula sales will
apply through the bonded warehouses. This narrows the price differential between the
online and offline channels but we believe that this is unlikely to impact demand
through online materially given: (1) prices are still 10%-20% more expensive offline
(given import tariffs and selling margins); (2) consumers are willing to pay a premium
for foreign made imported product vs. in-store product; and (3) greater range available
online.
4. Tightening of the direct mail channel: Recent news sources (source: AFR (10-May
2016, 26 May 2016), Weibo) suggest the government is tightening its enforcement of
taxes/compliance through the direct mail channel (including at airports, express
parcels). We think this may create some short-term disruption for both BAL/A2M given
that a number of B2C businesses were likely avoiding taxes previously. Our view,
based on official customs statements and other channel checks, is that the direct mail
channel will continue to remain open but be subject to higher taxes and greater
regulatory oversight. There is not yet a requirement for compliance with CFDA
registration in the direct mail channel, although this cannot be ruled out.
Other risks: Competition, safety; breastfeeding; IP
Competition from other brands
The growth in the online channel has encouraged many new brands to enter the Chinese
market and competition is increasing. The Australian market has also seen a number of
new entrants (Devondale, Blackmores, Faulding, Nature’s Way) looking to capitalize on
strong Chinese demand. Branding is critical and we expect further investments by BAL
and A2M to support its growth. The increased regulatory oversight by the Chinese
regulatory authorities through the cross-border channel (i.e. product formulation
registration, 3 brands per manufacturer) will, however, raise the barriers to entry,
insulating more established/larger players to a degree.
Quality, safety and reputational risks
Product quality, safety and brand reputation is critical. Any threats to this will be extremely
damaging for any infant formula brand.
Higher breast feeding rates in China
The Chinese government is making a bigger effort to promote breast-feeding rates in China.
Over time, we would expect awareness of the benefits of breast feeding to grow with better
education which will limit overall market growth, although BAL and A2M’s small market
share in China still means positive growth opportunities, in our view.
Intellectual property risks for A2M
A number of A2M’s competitors have launched competing “containing A2 protein” milks,
although with limited success. We note that A2M’s ability to source, market and sell A2
only milk is protected by trademarks and patents. The first of A2M’s supply chain patents
expired in late 2015, although the majority of patents expire by the end of 2023. A2M also
has trademark registrations or applications covering 57 territories and has secondary
trademarks associated with key beneficial messaging.

June 23, 2016 Australia: Small Companies
Goldman Sachs Global Investment Research 27
Valuation: High-growth prospects not priced in
We use a 50/50 blend of DCF (upside, base, downside) and EV/GCI for our price target
methodology. We cross-check this valuation to P/E, PEG and EV/EBITDA vs. BAL and
A2M’s other high growth, dairy and China-exposed peers.
Exhibit 43: BAL 12-month target price of A$12.00 is based on a 50/50 of: (1) weighted
average DCF of our base/upside/downside case and (2) EV/GCI. Summary of our valuation methodology (A$) – 3 year EPS CAGR (FY16E-FY19E)
Source: Goldman Sachs Global Investment Research.
Exhibit 44: A2M/ATM 12-month target prices of A$2.10/NZ$2.20 are based on a 50/50 of:
(1) weighted average DCF of our base/upside/downside case and (2) EV/GCI. Summary of our valuation methodology (A$) – FY16E-FY19E EPS CAGR
Source: Goldman Sachs Global Investment Research.
BAL
Methodology Metric Comment
Primary methodology
(1) Weighted average DCF (WACC 10.2%, Beta 1.2, Rf rate 5%, MRP 5%, TGR 3%)
Base case (50%) $11.76
Upside case (25%) $15.44
Downside case (25%) $8.17
DCF valuation $11.78
(2) EV/GCI
EV/GCI (x) 11.3 Versus high CROCI consumer, retail, healthcare peers
3 year average GCI (A$mn) 101
Implied EV (A$mn) 1,139
Adjusted for FY17E net debt (A$mn) ‐24
Implied equity value (A$mn) 1,164
Valuation per share $12.15
Blend of (1) and (2) = Target Price $12.00 Rounded
A2M
Methodology Metric Comment
Primary methodology
(1) Weighted average DCF (WACC 10.2%, Beta 1.15, Rf rate 5%, MRP 5%, TGR 3%)
Base case (50%) $2.07
Upside case (25%) $2.87
Downside case (25%) $1.55
DCF valuation $2.14
(2) EV/GCI
EV/GCI (x) 7.5 Vs high CROCI consumer, retail, healthcare peers
3 year average GCI (A$mn) 168
Implied EV (A$mn) 1,260
Adjusted for FY17E net debt (A$mn) ‐69
Implied equity value (A$mn) 1,329
Valuation per share $1.97
Blend of (1) and (2) = Target Price $2.10 Rounded
June 23, 2016 Australia: Small Companies
Goldman Sachs Global Investment Research 28
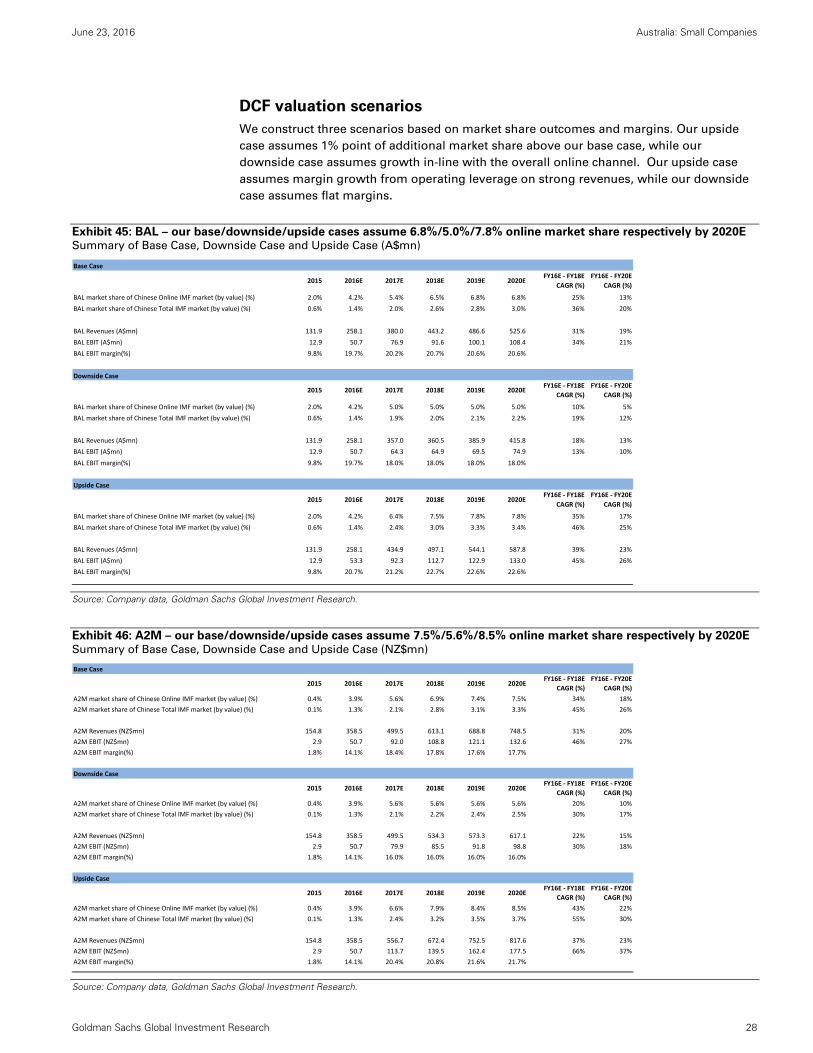
DCF valuation scenarios
We construct three scenarios based on market share outcomes and margins. Our upside
case assumes 1% point of additional market share above our base case, while our
downside case assumes growth in-line with the overall online channel. Our upside case
assumes margin growth from operating leverage on strong revenues, while our downside
case assumes flat margins.
Exhibit 45: BAL – our base/downside/upside cases assume 6.8%/5.0%/7.8% online market share respectively by 2020E Summary of Base Case, Downside Case and Upside Case (A$mn)
Source: Company data, Goldman Sachs Global Investment Research.
Exhibit 46: A2M – our base/downside/upside cases assume 7.5%/5.6%/8.5% online market share respectively by 2020E Summary of Base Case, Downside Case and Upside Case (NZ$mn)
Source: Company data, Goldman Sachs Global Investment Research.
Base Case
2015 2016E 2017E 2018E 2019E 2020EFY16E ‐ FY18E
CAGR (%)
FY16E ‐ FY20E
CAGR (%)
BAL market share of Chinese Online IMF market (by value) (%) 2.0% 4.2% 5.4% 6.5% 6.8% 6.8% 25% 13%
BAL market share of Chinese Total IMF market (by value) (%) 0.6% 1.4% 2.0% 2.6% 2.8% 3.0% 36% 20%
BAL Revenues (A$mn) 131.9 258.1 380.0 443.2 486.6 525.6 31% 19%
BAL EBIT (A$mn) 12.9 50.7 76.9 91.6 100.1 108.4 34% 21%
BAL EBIT margin(%) 9.8% 19.7% 20.2% 20.7% 20.6% 20.6%
Downside Case
2015 2016E 2017E 2018E 2019E 2020EFY16E ‐ FY18E
CAGR (%)
FY16E ‐ FY20E
CAGR (%)
BAL market share of Chinese Online IMF market (by value) (%) 2.0% 4.2% 5.0% 5.0% 5.0% 5.0% 10% 5%
BAL market share of Chinese Total IMF market (by value) (%) 0.6% 1.4% 1.9% 2.0% 2.1% 2.2% 19% 12%
BAL Revenues (A$mn) 131.9 258.1 357.0 360.5 385.9 415.8 18% 13%
BAL EBIT (A$mn) 12.9 50.7 64.3 64.9 69.5 74.9 13% 10%
BAL EBIT margin(%) 9.8% 19.7% 18.0% 18.0% 18.0% 18.0%
Upside Case
2015 2016E 2017E 2018E 2019E 2020EFY16E ‐ FY18E
CAGR (%)
FY16E ‐ FY20E
CAGR (%)
BAL market share of Chinese Online IMF market (by value) (%) 2.0% 4.2% 6.4% 7.5% 7.8% 7.8% 35% 17%
BAL market share of Chinese Total IMF market (by value) (%) 0.6% 1.4% 2.4% 3.0% 3.3% 3.4% 46% 25%
BAL Revenues (A$mn) 131.9 258.1 434.9 497.1 544.1 587.8 39% 23%
BAL EBIT (A$mn) 12.9 53.3 92.3 112.7 122.9 133.0 45% 26%
BAL EBIT margin(%) 9.8% 20.7% 21.2% 22.7% 22.6% 22.6%
Base Case
2015 2016E 2017E 2018E 2019E 2020EFY16E ‐ FY18E
CAGR (%)
FY16E ‐ FY20E
CAGR (%)
A2M market share of Chinese Online IMF market (by value) (%) 0.4% 3.9% 5.6% 6.9% 7.4% 7.5% 34% 18%
A2M market share of Chinese Total IMF market (by value) (%) 0.1% 1.3% 2.1% 2.8% 3.1% 3.3% 45% 26%
A2M Revenues (NZ$mn) 154.8 358.5 499.5 613.1 688.8 748.5 31% 20%
A2M EBIT (NZ$mn) 2.9 50.7 92.0 108.8 121.1 132.6 46% 27%
A2M EBIT margin(%) 1.8% 14.1% 18.4% 17.8% 17.6% 17.7%
Downside Case
2015 2016E 2017E 2018E 2019E 2020EFY16E ‐ FY18E
CAGR (%)
FY16E ‐ FY20E
CAGR (%)
A2M market share of Chinese Online IMF market (by value) (%) 0.4% 3.9% 5.6% 5.6% 5.6% 5.6% 20% 10%
A2M market share of Chinese Total IMF market (by value) (%) 0.1% 1.3% 2.1% 2.2% 2.4% 2.5% 30% 17%
A2M Revenues (NZ$mn) 154.8 358.5 499.5 534.3 573.3 617.1 22% 15%
A2M EBIT (NZ$mn) 2.9 50.7 79.9 85.5 91.8 98.8 30% 18%
A2M EBIT margin(%) 1.8% 14.1% 16.0% 16.0% 16.0% 16.0%
Upside Case
2015 2016E 2017E 2018E 2019E 2020EFY16E ‐ FY18E
CAGR (%)
FY16E ‐ FY20E
CAGR (%)
A2M market share of Chinese Online IMF market (by value) (%) 0.4% 3.9% 6.6% 7.9% 8.4% 8.5% 43% 22%
A2M market share of Chinese Total IMF market (by value) (%) 0.1% 1.3% 2.4% 3.2% 3.5% 3.7% 55% 30%
A2M Revenues (NZ$mn) 154.8 358.5 556.7 672.4 752.5 817.6 37% 23%
A2M EBIT (NZ$mn) 2.9 50.7 113.7 139.5 162.4 177.5 66% 37%
A2M EBIT margin(%) 1.8% 14.1% 20.4% 20.8% 21.6% 21.7%

June 23, 2016 Australia: Small Companies
Goldman Sachs Global Investment Research 29
Exhibit 47: Our 12-month target prices imply 22x/25x for
BAL/A2M on FY17E P/E A2M/BAL implied P/Es at our 12M-PT
Exhibit 48: At current prices, BAL/A2M is trading on
20x/20x FY17E A2M/BAL P/Es at current prices
Source: Goldman Sachs Global Investment Research.
Source: Goldman Sachs Global Investment Research.
Exhibit 49: EV/GCI vs CROCI – High CROCI consumer, retail and healthcare peers
Source: Goldman Sachs Global Investment Research.
0.0
5.0
10.0
15.0
20.0
25.0
30.0
35.0
40.0
45.0
50.0
FY16E FY17E FY18E FY19E FY20E
BAL A2M
0.0
5.0
10.0
15.0
20.0
25.0
30.0
35.0
40.0
FY16E FY17E FY18E FY19E FY20E
BAL A2M
y = 18.175xR² = 0.8099
0.0
2.0
4.0
6.0
8.0
10.0
12.0
0% 10% 20% 30% 40% 50% 60% 70%
CROCI (FY1-3 avg)
EV
/GC
I (F
Y1-
3av
g)
BAL.AX
A2M.AXBKL.AX
DMP.AX
BRG.AX
CSL.AX
SRX.AX
RMD.AX
COH.AX
FPH.NZ
TPM.AX
BTT.AX
090430.KS
ALL.AX
051900.KSBABA
2020.HK
VOC.AX
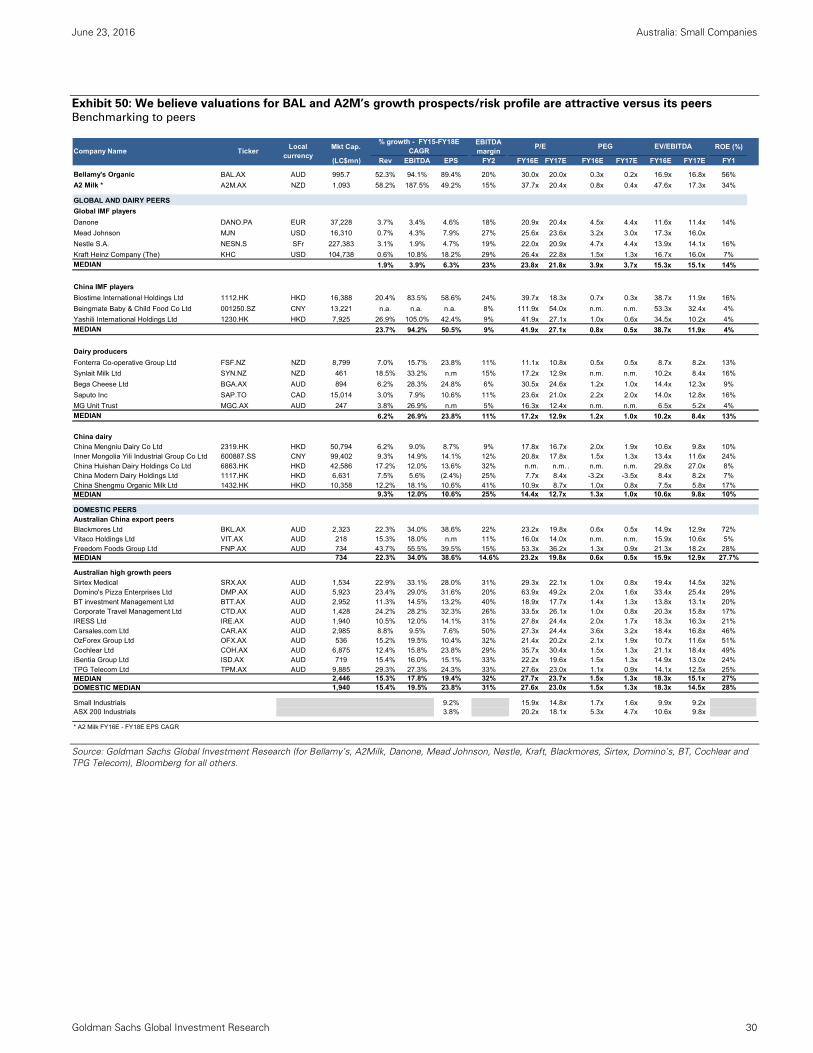
June 23, 2016 Australia: Small Companies
Goldman Sachs Global Investment Research 30
Exhibit 50: We believe valuations for BAL and A2M’s growth prospects/risk profile are attractive versus its peers Benchmarking to peers
Source: Goldman Sachs Global Investment Research (for Bellamy’s, A2Milk, Danone, Mead Johnson, Nestle, Kraft, Blackmores, Sirtex, Domino’s, BT, Cochlear and TPG Telecom), Bloomberg for all others.
Mkt Cap.EBITDA margin
ROE (%)
(LC$mn) Rev EBITDA EPS FY2 FY16E FY17E FY16E FY17E FY16E FY17E FY1
Bellamy's Organic BAL.AX AUD 995.7 52.3% 94.1% 89.4% 20% 30.0x 20.0x 0.3x 0.2x 16.9x 16.8x 56%
A2 Milk * A2M.AX NZD 1,093 58.2% 187.5% 49.2% 15% 37.7x 20.4x 0.8x 0.4x 47.6x 17.3x 34%
GLOBAL AND DAIRY PEERS
Global IMF players
Danone DANO.PA EUR 37,228 3.7% 3.4% 4.6% 18% 20.9x 20.4x 4.5x 4.4x 11.6x 11.4x 14%
Mead Johnson MJN USD 16,310 0.7% 4.3% 7.9% 27% 25.6x 23.6x 3.2x 3.0x 17.3x 16.0x
Nestle S.A. NESN.S SFr 227,383 3.1% 1.9% 4.7% 19% 22.0x 20.9x 4.7x 4.4x 13.9x 14.1x 16%
Kraft Heinz Company (The) KHC USD 104,738 0.6% 10.8% 18.2% 29% 26.4x 22.8x 1.5x 1.3x 16.7x 16.0x 7%
MEDIAN 1.9% 3.9% 6.3% 23% 23.8x 21.8x 3.9x 3.7x 15.3x 15.1x 14%
China IMF players
Biostime International Holdings Ltd 1112.HK HKD 16,388 20.4% 83.5% 58.6% 24% 39.7x 18.3x 0.7x 0.3x 38.7x 11.9x 16%
Beingmate Baby & Child Food Co Ltd 001250.SZ CNY 13,221 n.a. n.a. n.a. 8% 111.9x 54.0x n.m. n.m. 53.3x 32.4x 4%
Yashili International Holdings Ltd 1230.HK HKD 7,925 26.9% 105.0% 42.4% 9% 41.9x 27.1x 1.0x 0.6x 34.5x 10.2x 4%
MEDIAN 23.7% 94.2% 50.5% 9% 41.9x 27.1x 0.8x 0.5x 38.7x 11.9x 4%
Dairy producers
Fonterra Co-operative Group Ltd FSF.NZ NZD 8,799 7.0% 15.7% 23.8% 11% 11.1x 10.8x 0.5x 0.5x 8.7x 8.2x 13%
Synlait Milk Ltd SYN.NZ NZD 461 18.5% 33.2% n.m 15% 17.2x 12.9x n.m. n.m. 10.2x 8.4x 16%
Bega Cheese Ltd BGA.AX AUD 894 6.2% 28.3% 24.8% 6% 30.5x 24.6x 1.2x 1.0x 14.4x 12.3x 9%
Saputo Inc SAP.TO CAD 15,014 3.0% 7.9% 10.6% 11% 23.6x 21.0x 2.2x 2.0x 14.0x 12.8x 16%
MG Unit Trust MGC.AX AUD 247 3.8% 26.9% n.m 5% 16.3x 12.4x n.m. n.m. 6.5x 5.2x 4%
MEDIAN 6.2% 26.9% 23.8% 11% 17.2x 12.9x 1.2x 1.0x 10.2x 8.4x 13%
China dairy
China Mengniu Dairy Co Ltd 2319.HK HKD 50,794 6.2% 9.0% 8.7% 9% 17.8x 16.7x 2.0x 1.9x 10.6x 9.8x 10%Inner Mongolia Yili Industrial Group Co Ltd 600887.SS CNY 99,402 9.3% 14.9% 14.1% 12% 20.8x 17.8x 1.5x 1.3x 13.4x 11.6x 24%China Huishan Dairy Holdings Co Ltd 6863.HK HKD 42,586 17.2% 12.0% 13.6% 32% n.m. n.m. . n.m. n.m. 29.8x 27.0x 8%China Modern Dairy Holdings Ltd 1117.HK HKD 6,631 7.5% 5.6% (2.4%) 25% 7.7x 8.4x -3.2x -3.5x 8.4x 8.2x 7%China Shengmu Organic Milk Ltd 1432.HK HKD 10,358 12.2% 18.1% 10.6% 41% 10.9x 8.7x 1.0x 0.8x 7.5x 5.8x 17%MEDIAN 9.3% 12.0% 10.6% 25% 14.4x 12.7x 1.3x 1.0x 10.6x 9.8x 10%
DOMESTIC PEERSAustralian China export peers
Blackmores Ltd BKL.AX AUD 2,323 22.3% 34.0% 38.6% 22% 23.2x 19.8x 0.6x 0.5x 14.9x 12.9x 72%Vitaco Holdings Ltd VIT.AX AUD 218 15.3% 18.0% n.m 11% 16.0x 14.0x n.m. n.m. 15.9x 10.6x 5%Freedom Foods Group Ltd FNP.AX AUD 734 43.7% 55.5% 39.5% 15% 53.3x 36.2x 1.3x 0.9x 21.3x 18.2x 28%MEDIAN 734 22.3% 34.0% 38.6% 14.6% 23.2x 19.8x 0.6x 0.5x 15.9x 12.9x 27.7%
Australian high growth peers
Sirtex Medical SRX.AX AUD 1,534 22.9% 33.1% 28.0% 31% 29.3x 22.1x 1.0x 0.8x 19.4x 14.5x 32%Domino's Pizza Enterprises Ltd DMP.AX AUD 5,923 23.4% 29.0% 31.6% 20% 63.9x 49.2x 2.0x 1.6x 33.4x 25.4x 29%BT investment Management Ltd BTT.AX AUD 2,952 11.3% 14.5% 13.2% 40% 18.9x 17.7x 1.4x 1.3x 13.8x 13.1x 20%Corporate Travel Management Ltd CTD.AX AUD 1,428 24.2% 28.2% 32.3% 26% 33.5x 26.1x 1.0x 0.8x 20.3x 15.8x 17%IRESS Ltd IRE.AX AUD 1,940 10.5% 12.0% 14.1% 31% 27.8x 24.4x 2.0x 1.7x 18.3x 16.3x 21%Carsales.com Ltd CAR.AX AUD 2,985 8.8% 9.5% 7.6% 50% 27.3x 24.4x 3.6x 3.2x 18.4x 16.8x 46%OzForex Group Ltd OFX.AX AUD 536 15.2% 19.5% 10.4% 32% 21.4x 20.2x 2.1x 1.9x 10.7x 11.6x 51%Cochlear Ltd COH.AX AUD 6,875 12.4% 15.8% 23.8% 29% 35.7x 30.4x 1.5x 1.3x 21.1x 18.4x 49%iSentia Group Ltd ISD.AX AUD 719 15.4% 16.0% 15.1% 33% 22.2x 19.6x 1.5x 1.3x 14.9x 13.0x 24%TPG Telecom Ltd TPM.AX AUD 9,885 29.3% 27.3% 24.3% 33% 27.6x 23.0x 1.1x 0.9x 14.1x 12.5x 25%MEDIAN 2,446 15.3% 17.8% 19.4% 32% 27.7x 23.7x 1.5x 1.3x 18.3x 15.1x 27%DOMESTIC MEDIAN 1,940 15.4% 19.5% 23.8% 31% 27.6x 23.0x 1.5x 1.3x 18.3x 14.5x 28%
Small Industrials 9.2% 15.9x 14.8x 1.7x 1.6x 9.9x 9.2xASX 200 Industrials 3.8% 20.2x 18.1x 5.3x 4.7x 10.6x 9.8x
* A2 Milk FY16E - FY18E EPS CAGR
% growth - FY15-FY18E CAGRCompany Name Ticker
Local currency
P/E EV/EBITDAPEG

June 23, 2016 Australia: Small Companies
Goldman Sachs Global Investment Research 31
A2Milk (A2M.AX/ATM.NZ): Initiate with CL-Buy
Source of opportunity
We initiate on A2M with a Buy rating and add it to our ANZ Conviction
List. Our 12-month price targets of A$2.10/NZ$2.20 suggest potential
upside of 25%, including dividend. A2M has been gaining share in the
branded milk category in Australia, and more recently has seen outsized
growth in infant formula revenues from Chinese consumers.
We forecast continued market share gains in China and believe the
market has yet to recognize the multi-year growth opportunity that
China represents for A2M.
Catalyst
We expect A2M to deliver revenue and earnings growth above market
expectations as it expands its reach in China, mainly through online
channels (largely indirect via Australia, but increasingly direct to China)
as cross-border e-commerce penetration grows and Chinese consumers
increasingly look for premium niche alternatives. Its manufacturing
partner Synlait has, in our view, sufficient processing capacity and raw
ingredient supply to meet our FY16-18E forecasts.
Valuation
Our 12-month price target of A$2.10 is based on a 50/50 blend of DCF
and FY17 EV/GCI vs. CROCI. We forecast 36% EPS CAGR over the next 3
years (FY16E to FY19E), implying a PEG of 0.55x on FY17E/FY18E P/E of
20x/17x. For ATM.NZ, we also have a CL-Buy and translate the A$ target
price to NZ$ at spot rates. This gives a 12-month target price of NZ$2.20.
Key risks
Key risks: (-) Safety and quality risks given A2M contracts exclusively
with Synlait for manufacture; intense competition from other foreign
brands; adverse regulatory outcomes in China.
INVESTMENT LIST MEMBERSHIPAustralia & New Zealand Buy listAustralia & New Zealand Conviction Buy list
Coverage View: Neutral
Growth
Returns *
Multiple
Volatility Volatility
Multiple
Returns *
Growth
Investment Profile
Low High
Percentile 20th 40th 60th 80th 100th
* Returns = Return on Capital For a complete description of the investment
profile measures please refer to the
disclosure section of this document.
A2 Milk Co. (A2M.AX)
Australia Small & Mid Cap Peer Group Average
Key data Current
Price (A$) 1.70
12 month price target (A$) 2.10
Market cap (A$ mn) 1,093.2
6/15 6/16E 6/17E 6/18E
NPAT preNRIs (NZ$ mn) (0.9) 32.8 63.3 76.2
EPS adj (NZ¢) (0.1) 4.7 8.7 10.5
EPS growth (%) (9,059.5) 3,558.6 84.7 20.5
PER (X) NM 37.5 20.3 16.9
DPS (NZ¢) 0.0 0.0 4.5 6.3
Dividend yield (%) 0.0 0.0 2.5 3.6
Frank/Imput (%) 100.0 100.0 100.0 100.0
P/FCFPS (X) (39.5) 168.3 40.4 31.2
EV/EBITDA (X) 73.2 21.9 12.6 10.6
P/BV (X) 6.3 9.7 7.8 6.6
Avg shares (fd) (mn) 643.1 691.7 723.3 723.3
Debt/equity (%) -- -- -- --
4,600
4,800
5,000
5,200
5,400
5,600
5,800
0.0
0.5
1.0
1.5
2.0
2.5
3.0
Jun-15 Sep-15 Dec-15 Apr-16
Price performance chart
A2 Milk Co. (L) S&P/ASX 200 (R)
Share price performance (%) 3 month 6 month 12 month
Absolute (1.7) 22.7 233.3
Rel. to S&P/ASX 200 (3.1) 19.2 254.9
Source: Company data, Goldman Sachs Research estimates, FactSet. Price as of 6/20/2016 close.
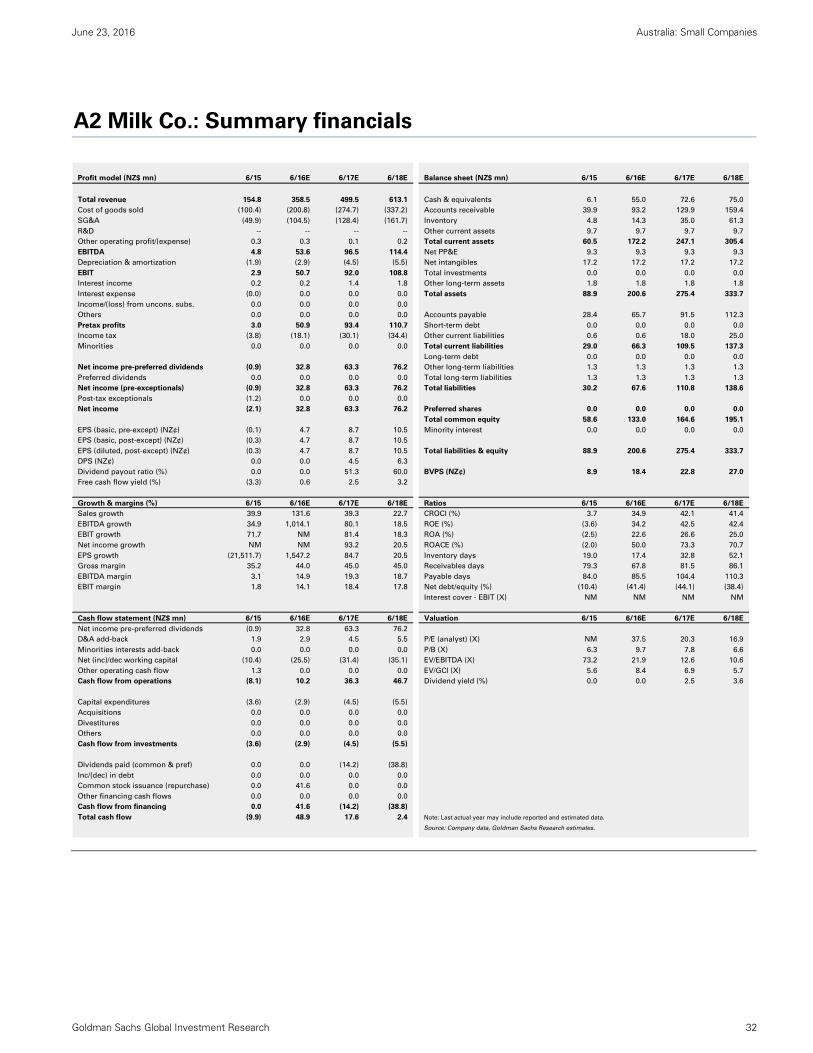
June 23, 2016 Australia: Small Companies
Goldman Sachs Global Investment Research 32
A2 Milk Co.: Summary financials
Profit model (NZ$ mn) 6/15 6/16E 6/17E 6/18E Balance sheet (NZ$ mn) 6/15 6/16E 6/17E 6/18E
Total revenue 154.8 358.5 499.5 613.1 Cash & equivalents 6.1 55.0 72.6 75.0
Cost of goods sold (100.4) (200.8) (274.7) (337.2) Accounts receivable 39.9 93.2 129.9 159.4
SG&A (49.9) (104.5) (128.4) (161.7) Inventory 4.8 14.3 35.0 61.3
R&D -- -- -- -- Other current assets 9.7 9.7 9.7 9.7
Other operating profit/(expense) 0.3 0.3 0.1 0.2 Total current assets 60.5 172.2 247.1 305.4
EBITDA 4.8 53.6 96.5 114.4 Net PP&E 9.3 9.3 9.3 9.3
Depreciation & amortization (1.9) (2.9) (4.5) (5.5) Net intangibles 17.2 17.2 17.2 17.2
EBIT 2.9 50.7 92.0 108.8 Total investments 0.0 0.0 0.0 0.0
Interest income 0.2 0.2 1.4 1.8 Other long-term assets 1.8 1.8 1.8 1.8
Interest expense (0.0) 0.0 0.0 0.0 Total assets 88.9 200.6 275.4 333.7
Income/(loss) from uncons. subs. 0.0 0.0 0.0 0.0
Others 0.0 0.0 0.0 0.0 Accounts payable 28.4 65.7 91.5 112.3
Pretax profits 3.0 50.9 93.4 110.7 Short-term debt 0.0 0.0 0.0 0.0
Income tax (3.8) (18.1) (30.1) (34.4) Other current liabilities 0.6 0.6 18.0 25.0
Minorities 0.0 0.0 0.0 0.0 Total current liabilities 29.0 66.3 109.5 137.3
Long-term debt 0.0 0.0 0.0 0.0
Net income pre-preferred dividends (0.9) 32.8 63.3 76.2 Other long-term liabilities 1.3 1.3 1.3 1.3
Preferred dividends 0.0 0.0 0.0 0.0 Total long-term liabilities 1.3 1.3 1.3 1.3
Net income (pre-exceptionals) (0.9) 32.8 63.3 76.2 Total liabilities 30.2 67.6 110.8 138.6
Post-tax exceptionals (1.2) 0.0 0.0 0.0
Net income (2.1) 32.8 63.3 76.2 Preferred shares 0.0 0.0 0.0 0.0
Total common equity 58.6 133.0 164.6 195.1
EPS (basic, pre-except) (NZ¢) (0.1) 4.7 8.7 10.5 Minority interest 0.0 0.0 0.0 0.0
EPS (basic, post-except) (NZ¢) (0.3) 4.7 8.7 10.5
EPS (diluted, post-except) (NZ¢) (0.3) 4.7 8.7 10.5 Total liabilities & equity 88.9 200.6 275.4 333.7
DPS (NZ¢) 0.0 0.0 4.5 6.3
Dividend payout ratio (%) 0.0 0.0 51.3 60.0 BVPS (NZ¢) 8.9 18.4 22.8 27.0
Free cash flow yield (%) (3.3) 0.6 2.5 3.2
Growth & margins (%) 6/15 6/16E 6/17E 6/18E Ratios 6/15 6/16E 6/17E 6/18E
Sales growth 39.9 131.6 39.3 22.7 CROCI (%) 3.7 34.9 42.1 41.4
EBITDA growth 34.9 1,014.1 80.1 18.5 ROE (%) (3.6) 34.2 42.5 42.4
EBIT growth 71.7 NM 81.4 18.3 ROA (%) (2.5) 22.6 26.6 25.0
Net income growth NM NM 93.2 20.5 ROACE (%) (2.0) 50.0 73.3 70.7
EPS growth (21,511.7) 1,547.2 84.7 20.5 Inventory days 19.0 17.4 32.8 52.1
Gross margin 35.2 44.0 45.0 45.0 Receivables days 79.3 67.8 81.5 86.1
EBITDA margin 3.1 14.9 19.3 18.7 Payable days 84.0 85.5 104.4 110.3
EBIT margin 1.8 14.1 18.4 17.8 Net debt/equity (%) (10.4) (41.4) (44.1) (38.4)
Interest cover - EBIT (X) NM NM NM NM
Cash flow statement (NZ$ mn) 6/15 6/16E 6/17E 6/18E Valuation 6/15 6/16E 6/17E 6/18E
Net income pre-preferred dividends (0.9) 32.8 63.3 76.2
D&A add-back 1.9 2.9 4.5 5.5 P/E (analyst) (X) NM 37.5 20.3 16.9
Minorities interests add-back 0.0 0.0 0.0 0.0 P/B (X) 6.3 9.7 7.8 6.6
Net (inc)/dec working capital (10.4) (25.5) (31.4) (35.1) EV/EBITDA (X) 73.2 21.9 12.6 10.6
Other operating cash flow 1.3 0.0 0.0 0.0 EV/GCI (X) 5.6 8.4 6.9 5.7
Cash flow from operations (8.1) 10.2 36.3 46.7 Dividend yield (%) 0.0 0.0 2.5 3.6
Capital expenditures (3.6) (2.9) (4.5) (5.5)
Acquisitions 0.0 0.0 0.0 0.0
Divestitures 0.0 0.0 0.0 0.0
Others 0.0 0.0 0.0 0.0
Cash flow from investments (3.6) (2.9) (4.5) (5.5)
Dividends paid (common & pref) 0.0 0.0 (14.2) (38.8)
Inc/(dec) in debt 0.0 0.0 0.0 0.0
Common stock issuance (repurchase) 0.0 41.6 0.0 0.0
Other financing cash flows 0.0 0.0 0.0 0.0
Cash flow from financing 0.0 41.6 (14.2) (38.8)
Total cash flow (9.9) 48.9 17.6 2.4 Note: Last actual year may include reported and estimated data.
Source: Company data, Goldman Sachs Research estimates.

June 23, 2016 Australia: Small Companies
Goldman Sachs Global Investment Research 33
Bellamy’s Australia Limited (BAL.AX): Initiate with Neutral
Source of opportunity
We initiate on BAL.AX with a Neutral rating. Our 12-month price target
of A$12.00 suggests 12% potential return, including dividend. BAL is a
pure play infant formula/baby food company. Its Australia-made and
organic credentials are popular among Chinese consumers, delivering
outsized revenue growth in the last two years. We forecast continued
market share gains in China but see this as already captured in the
market’s estimates.
Growth drivers
We expect BAL to deliver strong revenue and earnings growth as it
expands its reach in China, mainly through online channels (largely
indirect via Australia, but increasingly direct to China) as cross-border e-
commerce penetration grows and Chinese consumers increasingly look
for premium niche alternatives. Compared to A2M, however, we believe
its organic milk supply requirements could pose a greater constraint to
growth, both in volumes and in gross margin. Our FY17E-18E forecasts
also sit -13%/-22% below consensus (Bloomberg) but we note that recent
share price underperformance (-30% from the peak in December 2015)
means that this downside risk is already partly captured in market
expectations.
Valuation
Our 12-month price target of A$12.00 is based on a 50/50 blend of DCF
and FY17 EV/GCI vs. CROCI. We forecast 25% EPS CAGR over the next 3
years, implying a PEG of 0.74x on FY17E/FY18E P/E of 19x/16x.
Key risks
Key risks: (-) Raw ingredient shortfalls vs. market expectations; higher
raw ingredient costs; competition from other organic/foreign brands;
adverse regulatory outcomes in China. (+) Strong demand from Chinese
consumers.
INVESTMENT LIST MEMBERSHIPNeutral
Coverage View: Neutral
Growth
Returns *
Multiple
Volatility Volatility
Multiple
Returns *
Growth
Investment Profile
Low High
Percentile 20th 40th 60th 80th 100th
* Returns = Return on Capital For a complete description of the investment
profile measures please refer to the
disclosure section of this document.
Bellamy's Australia Ltd. (BAL.AX)
Australia Small & Mid Cap Peer Group Average
Key data Current
Price (A$) 10.84
12 month price target (A$) 12.00
Market cap (A$ mn) 1,003.1
6/15 6/16E 6/17E 6/18E
NPAT preNRIs (A$ mn) 9.1 35.9 54.3 64.5
EPS adj (A¢) 9.8 37.5 56.2 66.7
EPS growth (%) 404.5 282.2 50.0 18.6
PER (X) 22.7 28.9 19.3 16.2
DPS (A¢) 2.9 10.5 28.2 40.0
Dividend yield (%) 1.3 1.0 2.6 3.7
Frank/Imput (%) 0.0 100.0 100.0 100.0
P/FCFPS (X) 46.0 71.0 152.0 26.0
EV/EBITDA (X) 13.7 19.4 13.0 10.9
P/BV (X) 4.3 14.1 10.3 8.2
Avg shares (fd) (mn) 92.5 95.8 96.6 96.6
Debt/equity (%) (65.0) (52.5) (27.1) (27.8)
4,600
4,800
5,000
5,200
5,400
5,600
5,800
4
6
8
10
12
14
16
Jun-15 Sep-15 Dec-15 Apr-16
Price performance chart
Bellamy's Australia Ltd. (L) S&P/ASX 200 (R)
Share price performance (%) 3 month 6 month 12 month
Absolute 1.5 (21.0) 161.2
Rel. to S&P/ASX 200 (0.6) (23.5) 177.2
Source: Company data, Goldman Sachs Research estimates, FactSet. Price as of 6/21/2016 close.

June 23, 2016 Australia: Small Companies
Goldman Sachs Global Investment Research 34
Bellamy's Australia Ltd.: Summary financials
Profit model (A$ mn) 6/15 6/16E 6/17E 6/18E Balance sheet (A$ mn) 6/15 6/16E 6/17E 6/18E
Total revenue 125.3 258.1 380.0 443.2 Cash & equivalents 32.0 39.1 27.7 35.5
Cost of goods sold (84.1) (149.8) (224.4) (266.1) Accounts receivable 20.9 42.9 71.7 92.9
SG&A (28.9) (57.6) (78.9) (85.6) Inventory 17.1 35.2 67.7 79.0
R&D -- -- -- -- Other current assets 0.6 0.6 0.6 0.6
Other operating profit/(expense) 0.0 0.2 0.2 0.2 Total current assets 70.7 117.9 167.7 208.0
EBITDA 12.7 51.7 78.2 93.2 Net PP&E 0.6 0.8 0.8 0.8
Depreciation & amortization (0.4) (0.9) (1.4) (1.6) Net intangibles 0.1 0.1 0.1 0.1
EBIT 12.3 50.7 76.9 91.6 Total investments 0.0 0.0 0.0 0.0
Interest income 0.7 0.8 1.0 0.7 Other long-term assets 1.0 1.0 1.0 1.0
Interest expense (0.1) (0.2) (0.2) (0.2) Total assets 72.4 119.8 169.7 210.0
Income/(loss) from uncons. subs. 0.0 0.0 0.0 0.0
Others 0.0 0.0 0.0 0.0 Accounts payable 19.1 37.9 51.8 55.8
Pretax profits 13.0 51.3 77.6 92.1 Short-term debt 0.1 0.1 0.1 0.1
Income tax (3.9) (15.4) (23.3) (27.6) Other current liabilities 3.8 7.3 16.1 26.6
Minorities 0.0 0.0 0.0 0.0 Total current liabilities 23.1 45.3 68.0 82.5
Long-term debt 0.1 0.1 0.1 0.1
Net income pre-preferred dividends 9.1 35.9 54.3 64.5 Other long-term liabilities 0.3 0.3 0.3 0.3
Preferred dividends 0.0 0.0 0.0 0.0 Total long-term liabilities 0.4 0.4 0.4 0.4
Net income (pre-exceptionals) 9.1 35.9 54.3 64.5 Total liabilities 23.5 45.8 68.4 82.9
Post-tax exceptionals 0.0 0.0 0.0 0.0
Net income 9.1 35.9 54.3 64.5 Preferred shares 0.0 0.0 0.0 0.0
Total common equity 48.9 74.0 101.2 127.0
EPS (basic, pre-except) (A¢) 9.8 37.5 56.2 66.7 Minority interest 0.0 0.0 0.0 0.0
EPS (basic, post-except) (A¢) 9.8 37.5 56.2 66.7
EPS (diluted, post-except) (A¢) 9.8 37.5 56.2 66.7 Total liabilities & equity 72.4 119.8 169.7 210.0
DPS (A¢) 2.9 10.5 28.2 40.0
Dividend payout ratio (%) 29.2 28.0 50.2 60.0 BVPS (A¢) 51.5 76.6 104.7 131.4
Free cash flow yield (%) 2.1 1.4 0.7 3.8
Growth & margins (%) 6/15 6/16E 6/17E 6/18E Ratios 6/15 6/16E 6/17E 6/18E
Sales growth 156.3 105.9 47.3 16.6 CROCI (%) 40.5 59.7 62.6 60.2
EBITDA growth 447.0 305.7 51.5 19.1 ROE (%) 28.1 58.4 62.0 56.5
EBIT growth 497.0 312.9 51.5 19.2 ROA (%) 19.1 37.4 37.5 34.0
Net income growth 616.7 295.8 51.3 18.6 ROACE (%) 59.9 135.9 98.8 77.5
EPS growth 404.5 282.2 50.0 18.6 Inventory days 54.0 63.8 83.7 100.6
Gross margin 32.9 41.9 41.0 40.0 Receivables days 39.8 45.1 55.0 67.8
EBITDA margin 10.2 20.0 20.6 21.0 Payable days 55.6 69.4 73.0 73.8
EBIT margin 9.8 19.7 20.2 20.7 Net debt/equity (%) (65.0) (52.5) (27.1) (27.8)
Interest cover - EBIT (X) NM NM NM NM
Cash flow statement (A$ mn) 6/15 6/16E 6/17E 6/18E Valuation 6/15 6/16E 6/17E 6/18E
Net income pre-preferred dividends 9.1 35.9 54.3 64.5
D&A add-back 0.4 0.9 1.4 1.6 P/E (analyst) (X) 22.7 28.9 19.3 16.2
Minorities interests add-back 0.0 0.0 0.0 0.0 P/B (X) 4.3 14.1 10.3 8.2
Net (inc)/dec working capital (8.5) (21.3) (47.4) (28.5) EV/EBITDA (X) 13.7 19.4 13.0 10.9
Other operating cash flow 3.7 0.0 0.0 4.3 EV/GCI (X) 3.6 13.3 9.9 7.7
Cash flow from operations 4.7 15.5 8.2 41.9 Dividend yield (%) 1.3 1.0 2.6 3.7
Capital expenditures (0.4) (1.1) (1.4) (1.6)
Acquisitions 0.0 0.0 0.0 0.0
Divestitures 0.0 0.0 0.0 0.0
Others 0.0 0.0 0.0 0.0
Cash flow from investments (0.4) (1.1) (1.4) (1.6)
Dividends paid (common & pref) 0.0 (7.3) (18.4) (32.5)
Inc/(dec) in debt (0.2) 0.0 0.0 0.0
Common stock issuance (repurchase) 23.4 0.0 0.0 0.0
Other financing cash flows 0.0 0.0 0.0 0.0
Cash flow from financing 23.2 (7.3) (18.4) (32.5)
Total cash flow 27.6 7.1 (11.5) 7.8 Note: Last actual year may include reported and estimated data.
Source: Company data, Goldman Sachs Research estimates.

June 23, 2016 Australia: Small Companies
Goldman Sachs Global Investment Research 35
Financials: Asset light businesses generate high returns
Asset/capital returns are high for both given both operate a fully outsourced, cash
generative and low-debt business model. We note the following:
1. Net cash: Both have net cash positions. BAL of A$32mn at end of FY15, A2M of
A$6mn at end of FY15.
2. Limited PP&E and intangible assets: BAL/ A2M carry minimal PP&E on balance sheet
given fully outsourced model. Its intangible assets largely relate to IP and trademarks.
3. Limited provisions on balance sheet
4. BAL/A2M should deliver good cashflow conversion given minimal provisions or
capitalized expenses. We note the following:
Working capital drag from inventory build and less attractive debtor terms:
We expect BAL’s/A2M’s working capital requirements, more specifically the need
to improve its supply and inventory position, to be a drag on cashflow. As it
grows, we also expect their mix of customers to skew larger (i.e. to those that
enjoy more generous payment terms). We also expect BAL may have to shorten
payment terms to creditors to secure supply
Limited capex requirements
Dividend payout ratio of 30% in FY16E, increasing to 70% in FY19E for BAL.
Whilst ATM has historically not paid a dividend, given its strong cash flow
generation ability, we think that it could sustain a dividend payout ratio of 50%-
70%, based on its low capex requirements.
Benchmarking margins to peers
Exhibit 51: Most vertically integrated infant formula
companies have gross margins of c.60%
Gross margins – infant formula (%)
Exhibit 52: The larger, more vertically integrated players
have operating margins of 15-35%
Operating margins – infant formula (%)
Source: Company data, Goldman Sachs Global Investment Research.
Source: Company data, Goldman Sachs Global Investment Research.
0%
10%
20%
30%
40%
50%
60%
70%
FY14 FY15
0%
5%
10%
15%
20%
25%
30%
35%
40%
FY14 FY15
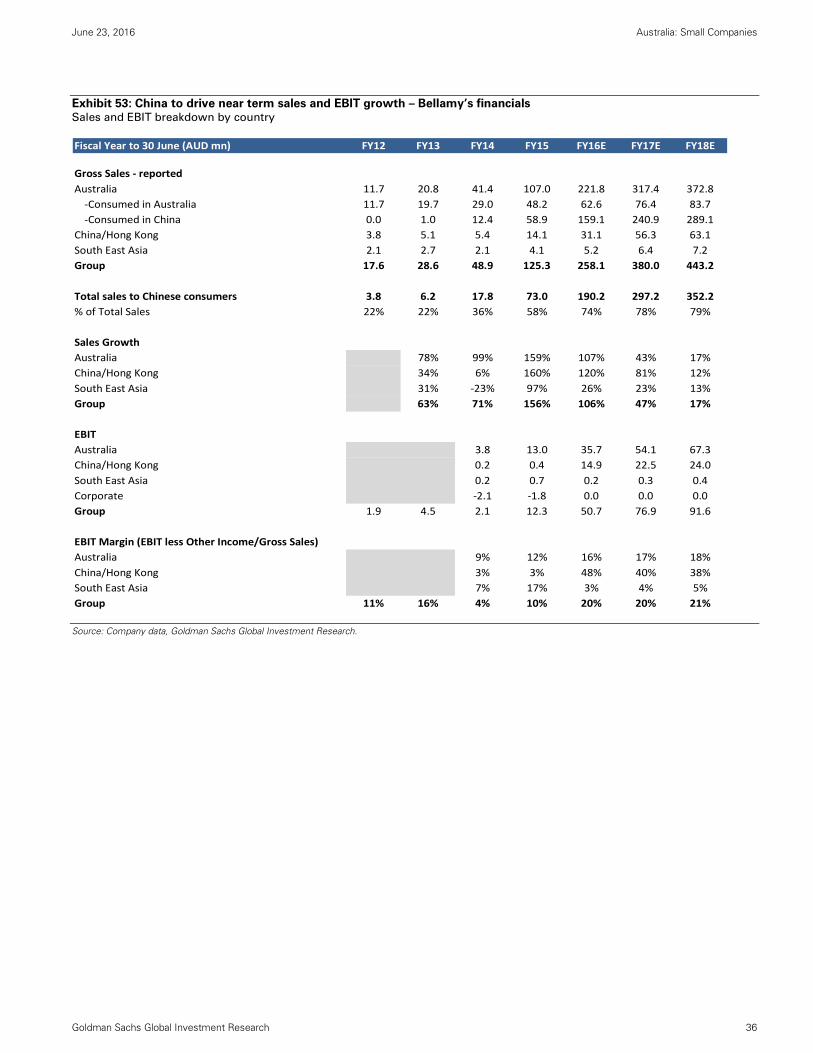
June 23, 2016 Australia: Small Companies
Goldman Sachs Global Investment Research 36
Exhibit 53: China to drive near term sales and EBIT growth – Bellamy’s financials Sales and EBIT breakdown by country
Source: Company data, Goldman Sachs Global Investment Research.
Fiscal Year to 30 June (AUD mn) FY12 FY13 FY14 FY15 FY16E FY17E FY18E
Gross Sales ‐ reported
Australia 11.7 20.8 41.4 107.0 221.8 317.4 372.8
‐Consumed in Australia 11.7 19.7 29.0 48.2 62.6 76.4 83.7
‐Consumed in China 0.0 1.0 12.4 58.9 159.1 240.9 289.1
China/Hong Kong 3.8 5.1 5.4 14.1 31.1 56.3 63.1
South East Asia 2.1 2.7 2.1 4.1 5.2 6.4 7.2
Group 17.6 28.6 48.9 125.3 258.1 380.0 443.2
Total sales to Chinese consumers 3.8 6.2 17.8 73.0 190.2 297.2 352.2
% of Total Sales 22% 22% 36% 58% 74% 78% 79%
Sales Growth
Australia 78% 99% 159% 107% 43% 17%
China/Hong Kong 34% 6% 160% 120% 81% 12%
South East Asia 31% ‐23% 97% 26% 23% 13%
Group 63% 71% 156% 106% 47% 17%
EBIT
Australia 3.8 13.0 35.7 54.1 67.3
China/Hong Kong 0.2 0.4 14.9 22.5 24.0
South East Asia 0.2 0.7 0.2 0.3 0.4
Corporate ‐2.1 ‐1.8 0.0 0.0 0.0
Group 1.9 4.5 2.1 12.3 50.7 76.9 91.6
EBIT Margin (EBIT less Other Income/Gross Sales)
Australia 9% 12% 16% 17% 18%
China/Hong Kong 3% 3% 48% 40% 38%
South East Asia 7% 17% 3% 4% 5%
Group 11% 16% 4% 10% 20% 20% 21%

June 23, 2016 Australia: Small Companies
Goldman Sachs Global Investment Research 37
Exhibit 54: Like BAL, we expect China to drive near term sales and EBIT growth for A2M Sales and EBIT breakdown by country
Source: Company data, Goldman Sachs Global Investment Research.
Fiscal Year to 30 June (NZD mn) FY12 FY13 FY14 FY15 FY16E FY17E FY18E
Total Sales ‐ reported
Australia 64.0 92.7 106.9 149.1 321.9 429.4 518.0
‐Consumed in Australia 64.0 92.7 106.9 136.5 161.6 172.2 194.5
‐Consumed in China 0.0 0.0 0.0 12.6 160.3 257.2 323.5
China ‐ Direct 0.0 2.0 2.7 4.0 31.2 63.3 87.3
UK and USA 0.0 0.0 1.1 1.9 5.8 6.9 8.0
Group 64.0 94.7 110.7 155.1 358.9 499.6 613.3
Sales Growth
Australia 45% 15% 40% 116% 33% 21%
China ‐ Direct n.m. 39% 47% 671% 103% 38%
UK and USA n.m. n.m. 74% 200% 20% 15%
Group 48% 17% 40% 131% 39% 23%
Total sales to Chinese consumers 0.0 2.0 2.7 16.7 191.4 320.5 410.8
% of Total Sales 0% 2% 2% 11% 53% 64% 67%
Other Income 1.6 0.4 0.2 0.3 0.3 0.1 0.2
Gross Sales 62.5 94.3 110.5 154.8 358.5 499.5 613.1
EBITDA
Australia 5.2 10.4 18.7 30.0 78.6 118.3 131.5
China ‐ Direct 0.0 ‐0.1 ‐3.3 ‐3.1 5.6 13.3 19.2
UK and USA 0.0 ‐0.2 ‐4.3 ‐12.1 ‐11.6 ‐10.4 ‐8.0
Corporate 0.1 ‐0.2 ‐7.5 ‐10.0 ‐19.0 ‐24.7 ‐28.4
Group 5.3 9.8 3.6 4.8 53.6 96.5 114.4
EBITDA Margin
Australia 8% 11% 17% 20% 24% 28% 25%
China ‐ Direct n.m. ‐7% ‐120% ‐77% 18% 21% 22%
UK and USA n.m. n.m. ‐388% ‐627% ‐200% ‐150% ‐100%
Group 8% 10% 3% 3% 15% 19% 19%

June 23, 2016 Australia: Small Companies
Goldman Sachs Global Investment Research 38
Appendix 1: A2M’s dairy businesses in Australia, the US and UK
Australia: Strong share gains in competitive market
Since entering the market in 2007 (initially via JV with Freedom Foods) A2M has reached c.
9% market (by value drinking milk).
The Australian drinking milk market is valued at A$3.3bn (Euromonitor estimate, 2015).
From 2009 to 2014 the drinking milk market grew at a 2.1% CAGR. This modest growth was
partly due to intense competition between Australia’s two dominant supermarket chains,
Coles and Woolworths, cutting the price of white drinking milk to A$1 / litre, which
materially impacted value growth.
Exhibit 55: A2M has grown share in a soft market
Australian drinking milk market growth (incl. alternatives)
Exhibit 56: Branded products dominate the Australian
market Milk market value share by category (2015)
Source: Euromonitor, Goldman Sachs Global Investment Research.
Source: Euromonitor, Goldman Sachs Global Investment Research.
A2M has been able to win market share due to:
1. Rapid breadth and depth of store penetration
A2M achieved national distribution with Coles and Woolworths (c. 70% combined share of
the Australian food retail market) within 2-3 years. Once it achieved store penetration,
ATM was able to increase the rate of sale and in-store shelf space rapidly. ATM’s premium
price point provides retailers a healthy gross margin per sqm in a commoditised product
category which helps drive larger shelf space.
2. Combined with brand development through consumer education and advertising
A2M developed a differentiated brand through consumer education and TV advertising
(Thank you A2 campaign), spending 5% of sales on marketing, which justifies its premium
pricing.
-2%
-1%
0%
1%
2%
3%
4%
5%
0
500
1,000
1,500
2,000
2,500
3,000
3,500
4,000G
row
th Y
oY
Re
tail
sa
les A
UD
mil
lio
ns
Retail sales Value growth Volume growth
Milk "price war"
Private
label
33%
Niche
branded
23%
Branded
mainstream
33%
Others
3%
Milk
alternatives
8%
AUD 3.3bnmarket value
(2015)

June 23, 2016 Australia: Small Companies
Goldman Sachs Global Investment Research 39
Exhibit 57: Niche branded and milk alternatives have led
in growth … Retail CAGR (2009-2015) by milk category
Exhibit 58: … and ATM sales demonstrate a strong
relationship to milk alternatives a2 Milk retail sales vs. milk alternative sales
Source: Euromonitor, Goldman Sachs Global Investment Research.
Source: Euromonitor, Goldman Sachs Global Investment Research.
UK – Private label dominance means challenging markets
A2M entered the UK market in November 2011 through a 50/50 joint venture with Robert
Wiseman Dairies (RWD). In January 2014, following the acquisition of RWD by the Muller
Group in early 2012, A2M acquired RWD’s interest in the JV.
Since assuming full ownership ATM has established an end-to-end supply chain in the UK
and is growing its retail distribution (products sold in Tesco, Waitrose, Morrisons, Ocado, J
Sainsbury and Wholefoods). A2M is also repositioning the brand from mainstream to the
premium specialty segment.
The UK drinking milk market is worth GBP3.1bn in retail sales (2014, Euromonitor). From
2009-14 the market grew at a -0.1% CAGR, reflecting underlying volume growth of -0.4%
and pricing growth of 0.3%. Private label dominates the UK milk market with c.70% market
share (2014). This level of market share has been broadly consistent over the last five years.
The UK market is less attractive in Australia given: (1) The milk alternatives market in the
UK has seen slower growth rates that Australia, although it is still the best performing
category in the market; (2) Gross margins are lower in the UK given lower retail prices.
-15%
-10%
-5%
0%
5%
10%
15%
20%
25%
Niche
branded
Milk
alternatives
Private
label
Branded
mainstream
Others
Sale
s C
AG
R (
09-1
4)
a2 Milk share
of growth
R² = 0.98
0
50
100
150
200
250
300
350
400
140 160 180 200 220 240 260
Re
tail
va
lue
of
a2
Mil
k s
ale
s A
UD
mn
Retail value of milk alternatives sales AUD mn

June 23, 2016 Australia: Small Companies
Goldman Sachs Global Investment Research 40
Exhibit 59: The UK is a challenging milk market… UK liquid milk market growth
Exhibit 60: …Given private label dominates UK liquid milk market share by value
Source: Euromonitor, Goldman Sachs Global Investment Research.
Source: Euromonitor, Goldman Sachs Global Investment Research.
US --- Small, niche opportunities, also dominated by private label A2M started selling A2 Milk in California in H2 FY15. A2M’s US business plan assumes an
initial investment of c.US$20m over three years to fund market entry and working capital
requirements.
Euromonitor estimates that the US drinking milk market is worth US$15.5bn in 2014. From
2009-14 the market grew at a 2.0% CAGR, reflecting underlying volume growth of -2.1%
and pricing growth of 4.2%. However, taking share from branded competitors will be
difficult given branded milk represents only 13% market share, of which 5% is branded
mainstream.
The US market is also fragmented with the three largest players representing c.8% of the
market. The remaining branded players have less than 1% market share. This
fragmentation points to the challenges of building scale, even at the state level, and
suggests only small niche opportunities for A2M.
Exhibit 61: Small niche opportunities available…
USA liquid milk market growth
Exhibit 62: … But private label dominance
USA liquid milk market share by category (by value; 2015)
Source: Euromonitor, Goldman Sachs Global Investment Research.
Source: Euromonitor, Goldman Sachs Global Investment Research.
-5%
-4%
-3%
-2%
-1%
0%
1%
2%
3%
4%
5%
0
500
1,000
1,500
2,000
2,500
3,000
3,500
Gro
wth
Yo
Y
Re
tail
sa
les G
BP
mil
lio
ns
Retail sales Volume growth Pricing growth
Private label
72%
Milk
alternatives
5%
Niche
branded
7%
Branded
mainstream
9%
Others
7%
Market valueGBP 2.9bn (2015)
-20%
-15%
-10%
-5%
0%
5%
10%
0
2,000
4,000
6,000
8,000
10,000
12,000
14,000
16,000
18,000
Gro
wth
Yo
Y
Ma
rke
t v
alu
e U
S$
mil
lio
ns
Milk Milk alternatives
Value growth Volume growth
Private label
59%
Others
13%
Branded
Niche
5%
Branded
mainstream
11%
Milk
alternatives
12%
Retail market value USD 15.5bn
(2015)
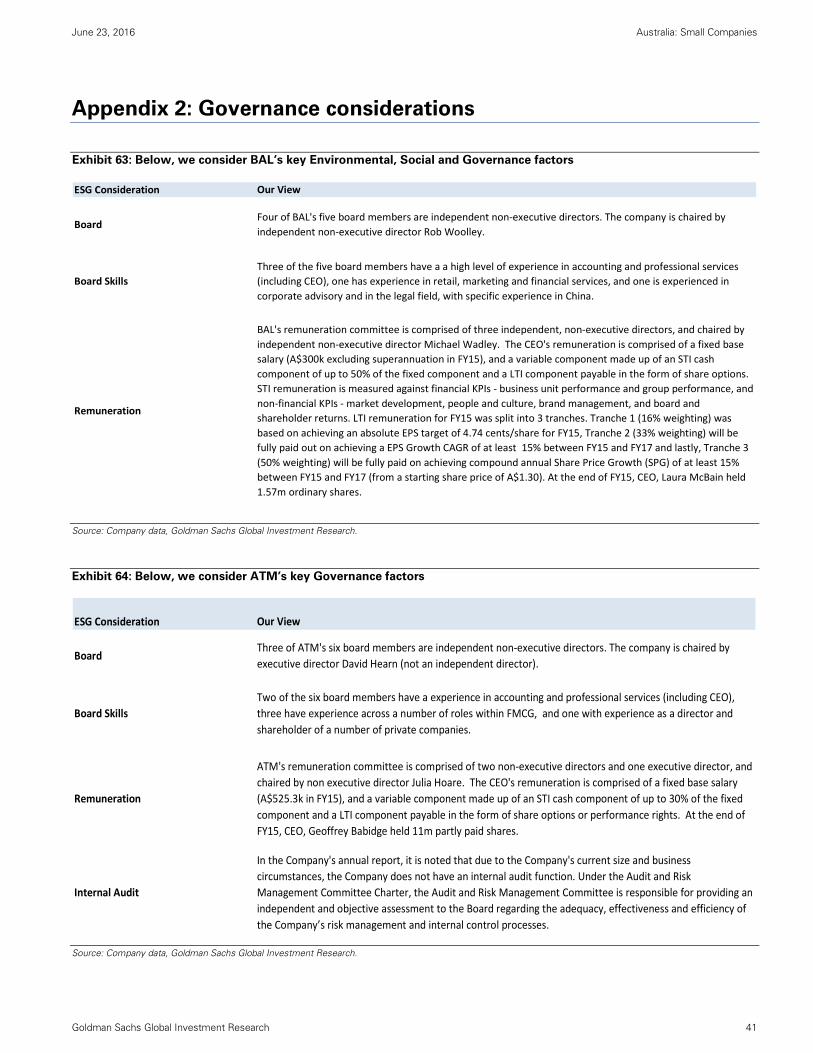
June 23, 2016 Australia: Small Companies
Goldman Sachs Global Investment Research 41
Appendix 2: Governance considerations
Exhibit 63: Below, we consider BAL’s key Environmental, Social and Governance factors
Source: Company data, Goldman Sachs Global Investment Research.
Exhibit 64: Below, we consider ATM’s key Governance factors
Source: Company data, Goldman Sachs Global Investment Research.
ESG Consideration Our View
BoardFour of BAL's five board members are independent non‐executive directors. The company is chaired by
independent non‐executive director Rob Woolley.
Board Skills
Three of the five board members have a a high level of experience in accounting and professional services
(including CEO), one has experience in retail, marketing and financial services, and one is experienced in
corporate advisory and in the legal field, with specific experience in China.
Remuneration
BAL's remuneration committee is comprised of three independent, non‐executive directors, and chaired by
independent non‐executive director Michael Wadley. The CEO's remuneration is comprised of a fixed base
salary (A$300k excluding superannuation in FY15), and a variable component made up of an STI cash
component of up to 50% of the fixed component and a LTI component payable in the form of share options.
STI remuneration is measured against financial KPIs ‐ business unit performance and group performance, and
non‐financial KPIs ‐ market development, people and culture, brand management, and board and
shareholder returns. LTI remuneration for FY15 was split into 3 tranches. Tranche 1 (16% weighting) was
based on achieving an absolute EPS target of 4.74 cents/share for FY15, Tranche 2 (33% weighting) will be
fully paid out on achieving a EPS Growth CAGR of at least 15% between FY15 and FY17 and lastly, Tranche 3
(50% weighting) will be fully paid on achieving compound annual Share Price Growth (SPG) of at least 15%
between FY15 and FY17 (from a starting share price of A$1.30). At the end of FY15, CEO, Laura McBain held
1.57m ordinary shares.
ESG Consideration Our View
BoardThree of ATM's six board members are independent non‐executive directors. The company is chaired by
executive director David Hearn (not an independent director).
Board Skills
Two of the six board members have a experience in accounting and professional services (including CEO),
three have experience across a number of roles within FMCG, and one with experience as a director and
shareholder of a number of private companies.
Remuneration
ATM's remuneration committee is comprised of two non‐executive directors and one executive director, and
chaired by non executive director Julia Hoare. The CEO's remuneration is comprised of a fixed base salary
(A$525.3k in FY15), and a variable component made up of an STI cash component of up to 30% of the fixed
component and a LTI component payable in the form of share options or performance rights. At the end of
FY15, CEO, Geoffrey Babidge held 11m partly paid shares.
Internal Audit
In the Company's annual report, it is noted that due to the Company's current size and business
circumstances, the Company does not have an internal audit function. Under the Audit and Risk
Management Committee Charter, the Audit and Risk Management Committee is responsible for providing an
independent and objective assessment to the Board regarding the adequacy, effectiveness and efficiency of
the Company’s risk management and internal control processes.
June 23, 2016 Australia: Small Companies
Goldman Sachs Global Investment Research 42
Disclosure Appendix
Reg AC
We, Andrea Chong, CFA and Aaron Yeoh, hereby certify that all of the views expressed in this report accurately reflect our personal views about the
subject company or companies and its or their securities. We also certify that no part of our compensation was, is or will be, directly or indirectly,
related to the specific recommendations or views expressed in this report.
Unless otherwise stated, the individuals listed on the cover page of this report are analysts in Goldman Sachs' Global Investment Research division.
Investment Profile
The Goldman Sachs Investment Profile provides investment context for a security by comparing key attributes of that security to its peer group and
market. The four key attributes depicted are: growth, returns, multiple and volatility. Growth, returns and multiple are indexed based on composites
of several methodologies to determine the stocks percentile ranking within the region's coverage universe.
The precise calculation of each metric may vary depending on the fiscal year, industry and region but the standard approach is as follows:
Growth is a composite of next year's estimate over current year's estimate, e.g. EPS, EBITDA, Revenue. Return is a year one prospective aggregate
of various return on capital measures, e.g. CROCI, ROACE, and ROE. Multiple is a composite of one-year forward valuation ratios, e.g. P/E, dividend
yield, EV/FCF, EV/EBITDA, EV/DACF, Price/Book. Volatility is measured as trailing twelve-month volatility adjusted for dividends.
Quantum
Quantum is Goldman Sachs' proprietary database providing access to detailed financial statement histories, forecasts and ratios. It can be used for
in-depth analysis of a single company, or to make comparisons between companies in different sectors and markets.
GS SUSTAIN
GS SUSTAIN is a global investment strategy aimed at long-term, long-only performance with a low turnover of ideas. The GS SUSTAIN focus list
includes leaders our analysis shows to be well positioned to deliver long term outperformance through sustained competitive advantage and
superior returns on capital relative to their global industry peers. Leaders are identified based on quantifiable analysis of three aspects of corporate
performance: cash return on cash invested, industry positioning and management quality (the effectiveness of companies' management of the
environmental, social and governance issues facing their industry).
Disclosures
Coverage group(s) of stocks by primary analyst(s)
Andrea Chong, CFA: Australia-Small & Mid Cap.
Australia-Small & Mid Cap: A2 Milk Co., A2 Milk Co., Adairs Ltd., Ardent Leisure Group, AUB Group, Bellamy's Australia Ltd., Blackmores Ltd.,
Breville Group, Cabcharge Australia Ltd., Cleanaway Waste Management Ltd, Domino's Pizza, DuluxGroup Ltd., FlexiGroup Ltd, G.U.D. Holdings,
GWA Group, McMillan Shakespeare, Reject Shop, Select Harvests Ltd., SG Fleet Group, Sirtex Medical, Super Retail Group, Tassal Group, Tegel
Group Holdings.
Company-specific regulatory disclosures
The following disclosures relate to relationships between The Goldman Sachs Group, Inc. (with its affiliates, "Goldman Sachs") and companies
covered by the Global Investment Research Division of Goldman Sachs and referred to in this research.
Goldman Sachs has received compensation for investment banking services in the past 12 months: A2 Milk Co. (A$1.72)
Goldman Sachs expects to receive or intends to seek compensation for investment banking services in the next 3 months: A2 Milk Co. (A$1.72)
Goldman Sachs had an investment banking services client relationship during the past 12 months with: A2 Milk Co. (A$1.72)
Goldman Sachs had a non-securities services client relationship during the past 12 months with: A2 Milk Co. (A$1.72) and Bellamy's Australia Ltd.
(A$10.95)
Goldman Sachs has managed or co-managed a public or Rule 144A offering in the past 12 months: A2 Milk Co. (A$1.72)
Goldman Sachs makes a market in the securities or derivatives thereof: Bellamy's Australia Ltd. (A$10.95)
Distribution of ratings/investment banking relationships
Goldman Sachs Investment Research global Equity coverage universe
Rating Distribution Investment Banking Relationships
Buy Hold Sell Buy Hold Sell
Global 32% 53% 15% 65% 58% 51%
As of April 1, 2016, Goldman Sachs Global Investment Research had investment ratings on 3,029 equity securities. Goldman Sachs assigns stocks as
Buys and Sells on various regional Investment Lists; stocks not so assigned are deemed Neutral. Such assignments equate to Buy, Hold and Sell for
the purposes of the above disclosure required by the FINRA Rules. See 'Ratings, Coverage groups and views and related definitions' below. The
Investment Banking Relationships chart reflects the percentage of subject companies within each rating category for whom Goldman Sachs has
provided investment banking services within the previous twelve months.

June 23, 2016 Australia: Small Companies
Goldman Sachs Global Investment Research 43
Price target and rating history chart(s)
Regulatory disclosures
Disclosures required by United States laws and regulations
See company-specific regulatory disclosures above for any of the following disclosures required as to companies referred to in this report: manager
or co-manager in a pending transaction; 1% or other ownership; compensation for certain services; types of client relationships; managed/co-
managed public offerings in prior periods; directorships; for equity securities, market making and/or specialist role. Goldman Sachs trades or may
trade as a principal in debt securities (or in related derivatives) of issuers discussed in this report.
The following are additional required disclosures: Ownership and material conflicts of interest: Goldman Sachs policy prohibits its analysts,
professionals reporting to analysts and members of their households from owning securities of any company in the analyst's area of
coverage. Analyst compensation: Analysts are paid in part based on the profitability of Goldman Sachs, which includes investment banking
revenues. Analyst as officer or director: Goldman Sachs policy prohibits its analysts, persons reporting to analysts or members of their
households from serving as an officer, director, advisory board member or employee of any company in the analyst's area of coverage. Non-U.S. Analysts: Non-U.S. analysts may not be associated persons of Goldman, Sachs & Co. and therefore may not be subject to FINRA Rule 2241 or FINRA
Rule 2242 restrictions on communications with subject company, public appearances and trading securities held by the analysts.
Distribution of ratings: See the distribution of ratings disclosure above. Price chart: See the price chart, with changes of ratings and price targets in
prior periods, above, or, if electronic format or if with respect to multiple companies which are the subject of this report, on the Goldman Sachs
website at http://www.gs.com/research/hedge.html.
Additional disclosures required under the laws and regulations of jurisdictions other than the United States
The following disclosures are those required by the jurisdiction indicated, except to the extent already made above pursuant to United States laws
and regulations. Australia: Goldman Sachs Australia Pty Ltd and its affiliates are not authorised deposit-taking institutions (as that term is defined in
the Banking Act 1959 (Cth)) in Australia and do not provide banking services, nor carry on a banking business, in Australia. This research, and any
access to it, is intended only for "wholesale clients" within the meaning of the Australian Corporations Act, unless otherwise agreed by Goldman
Sachs. In producing research reports, members of the Global Investment Research Division of Goldman Sachs Australia may attend site visits and
other meetings hosted by the issuers the subject of its research reports. In some instances the costs of such site visits or meetings may be met in part
or in whole by the issuers concerned if Goldman Sachs Australia considers it is appropriate and reasonable in the specific circumstances relating to
the site visit or meeting. Brazil: Disclosure information in relation to CVM Instruction 483 is available at
http://www.gs.com/worldwide/brazil/area/gir/index.html. Where applicable, the Brazil-registered analyst primarily responsible for the content of this
research report, as defined in Article 16 of CVM Instruction 483, is the first author named at the beginning of this report, unless indicated otherwise at
the end of the text. Canada: Goldman Sachs Canada Inc. is an affiliate of The Goldman Sachs Group Inc. and therefore is included in the company
specific disclosures relating to Goldman Sachs (as defined above). Goldman Sachs Canada Inc. has approved of, and agreed to take responsibility for,
this research report in Canada if and to the extent that Goldman Sachs Canada Inc. disseminates this research report to its clients. Hong Kong: Further information on the securities of covered companies referred to in this research may be obtained on request from Goldman Sachs
(Asia) L.L.C. India: Further information on the subject company or companies referred to in this research may be obtained from Goldman Sachs
(India) Securities Private Limited, Research Analyst - SEBI Registration Number INH000001493, 951-A, Rational House, Appasaheb Marathe Marg,
Prabhadevi, Mumbai 400 025, India, Corporate Identity Number U74140MH2006FTC160634, Phone +91 22 6616 9000, Fax +91 22 6616 9001. Goldman
Sachs may beneficially own 1% or more of the securities (as such term is defined in clause 2 (h) the Indian Securities Contracts (Regulation) Act,
1956) of the subject company or companies referred to in this research report. Japan: See below. Korea: Further information on the subject
company or companies referred to in this research may be obtained from Goldman Sachs (Asia) L.L.C., Seoul Branch. New Zealand: Goldman
Sachs New Zealand Limited and its affiliates are neither "registered banks" nor "deposit takers" (as defined in the Reserve Bank of New Zealand Act
1989) in New Zealand. This research, and any access to it, is intended for "wholesale clients" (as defined in the Financial Advisers Act 2008) unless
otherwise agreed by Goldman Sachs. Russia: Research reports distributed in the Russian Federation are not advertising as defined in the Russian
legislation, but are information and analysis not having product promotion as their main purpose and do not provide appraisal within the meaning of
the Russian legislation on appraisal activity. Singapore: Further information on the covered companies referred to in this research may be obtained
from Goldman Sachs (Singapore) Pte. (Company Number: 198602165W). Taiwan: This material is for reference only and must not be reprinted
without permission. Investors should carefully consider their own investment risk. Investment results are the responsibility of the individual
investor. United Kingdom: Persons who would be categorized as retail clients in the United Kingdom, as such term is defined in the rules of the
Financial Conduct Authority, should read this research in conjunction with prior Goldman Sachs research on the covered companies referred to
herein and should refer to the risk warnings that have been sent to them by Goldman Sachs International. A copy of these risks warnings, and a
glossary of certain financial terms used in this report, are available from Goldman Sachs International on request.
European Union: Disclosure information in relation to Article 4 (1) (d) and Article 6 (2) of the European Commission Directive 2003/125/EC is available
at http://www.gs.com/disclosures/europeanpolicy.html which states the European Policy for Managing Conflicts of Interest in Connection with
Investment Research.
Japan: Goldman Sachs Japan Co., Ltd. is a Financial Instrument Dealer registered with the Kanto Financial Bureau under registration number Kinsho
69, and a member of Japan Securities Dealers Association, Financial Futures Association of Japan and Type II Financial Instruments Firms
0.79
2,000
2,200
2,400
2,600
2,800
3,000
3,200
3,400
0.00
0.50
1.00
1.50
2.00
2.50
3.00
A2 Milk Co. (ATM.NZ)
Goldman Sachs rating and stock price target history
Stock Price Currency : New Zealand Dollar
Source: Goldman Sachs Investment Research for ratings and price targets; FactSet closing prices as of 3/31/2016.
The price targets show n should be considered in the context of all prior published Goldman Sachs research, which may or may not have included price targets, as w ell as developments relating to the company, its industry and financial markets.
Rating
Price target
Price target at removal
Covered by current analyst
Not covered by current analyst
NZX 50
Inde
xPr
ice
Sto
ckPr
ice
Apr 22, 2015 B
Jun 22 Dec 21NR
MCS
J J A S O N D J F M A M J J A S O N D J F M A M J J A S O N D J F M
2013 2014 2015 2016

June 23, 2016 Australia: Small Companies
Goldman Sachs Global Investment Research 44
Association. Sales and purchase of equities are subject to commission pre-determined with clients plus consumption tax. See company-specific
disclosures as to any applicable disclosures required by Japanese stock exchanges, the Japanese Securities Dealers Association or the Japanese
Securities Finance Company.
Ratings, coverage groups and views and related definitions
Buy (B), Neutral (N), Sell (S) -Analysts recommend stocks as Buys or Sells for inclusion on various regional Investment Lists. Being assigned a Buy
or Sell on an Investment List is determined by a stock's return potential relative to its coverage group as described below. Any stock not assigned as
a Buy or a Sell on an Investment List is deemed Neutral. Each regional Investment Review Committee manages various regional Investment Lists to a
global guideline of 25%-35% of stocks as Buy and 10%-15% of stocks as Sell; however, the distribution of Buys and Sells in any particular coverage
group may vary as determined by the regional Investment Review Committee. Regional Conviction Buy and Sell lists represent investment
recommendations focused on either the size of the potential return or the likelihood of the realization of the return.
Return potential represents the price differential between the current share price and the price target expected during the time horizon associated
with the price target. Price targets are required for all covered stocks. The return potential, price target and associated time horizon are stated in each
report adding or reiterating an Investment List membership.
Coverage groups and views: A list of all stocks in each coverage group is available by primary analyst, stock and coverage group at
http://www.gs.com/research/hedge.html. The analyst assigns one of the following coverage views which represents the analyst's investment outlook
on the coverage group relative to the group's historical fundamentals and/or valuation. Attractive (A). The investment outlook over the following 12
months is favorable relative to the coverage group's historical fundamentals and/or valuation. Neutral (N). The investment outlook over the
following 12 months is neutral relative to the coverage group's historical fundamentals and/or valuation. Cautious (C). The investment outlook over
the following 12 months is unfavorable relative to the coverage group's historical fundamentals and/or valuation.
Not Rated (NR). The investment rating and target price have been removed pursuant to Goldman Sachs policy when Goldman Sachs is acting in an
advisory capacity in a merger or strategic transaction involving this company and in certain other circumstances. Rating Suspended (RS). Goldman
Sachs Research has suspended the investment rating and price target for this stock, because there is not a sufficient fundamental basis for
determining, or there are legal, regulatory or policy constraints around publishing, an investment rating or target. The previous investment rating and
price target, if any, are no longer in effect for this stock and should not be relied upon. Coverage Suspended (CS). Goldman Sachs has suspended
coverage of this company. Not Covered (NC). Goldman Sachs does not cover this company. Not Available or Not Applicable (NA). The
information is not available for display or is not applicable. Not Meaningful (NM). The information is not meaningful and is therefore excluded.
Global product; distributing entities
The Global Investment Research Division of Goldman Sachs produces and distributes research products for clients of Goldman Sachs on a global
basis. Analysts based in Goldman Sachs offices around the world produce equity research on industries and companies, and research on
macroeconomics, currencies, commodities and portfolio strategy. This research is disseminated in Australia by Goldman Sachs Australia Pty Ltd
(ABN 21 006 797 897); in Brazil by Goldman Sachs do Brasil Corretora de Títulos e Valores Mobiliários S.A.; in Canada by either Goldman Sachs
Canada Inc. or Goldman, Sachs & Co.; in Hong Kong by Goldman Sachs (Asia) L.L.C.; in India by Goldman Sachs (India) Securities Private Ltd.; in
Japan by Goldman Sachs Japan Co., Ltd.; in the Republic of Korea by Goldman Sachs (Asia) L.L.C., Seoul Branch; in New Zealand by Goldman Sachs
New Zealand Limited; in Russia by OOO Goldman Sachs; in Singapore by Goldman Sachs (Singapore) Pte. (Company Number: 198602165W); and in
the United States of America by Goldman, Sachs & Co. Goldman Sachs International has approved this research in connection with its distribution in
the United Kingdom and European Union.
European Union: Goldman Sachs International authorised by the Prudential Regulation Authority and regulated by the Financial Conduct Authority
and the Prudential Regulation Authority, has approved this research in connection with its distribution in the European Union and United Kingdom;
Goldman Sachs AG and Goldman Sachs International Zweigniederlassung Frankfurt, regulated by the Bundesanstalt für
Finanzdienstleistungsaufsicht, may also distribute research in Germany.
General disclosures
This research is for our clients only. Other than disclosures relating to Goldman Sachs, this research is based on current public information that we
consider reliable, but we do not represent it is accurate or complete, and it should not be relied on as such. The information, opinions, estimates and
forecasts contained herein are as of the date hereof and are subject to change without prior notification. We seek to update our research as
appropriate, but various regulations may prevent us from doing so. Other than certain industry reports published on a periodic basis, the large
majority of reports are published at irregular intervals as appropriate in the analyst's judgment.
Goldman Sachs conducts a global full-service, integrated investment banking, investment management, and brokerage business. We have
investment banking and other business relationships with a substantial percentage of the companies covered by our Global Investment Research
Division. Goldman, Sachs & Co., the United States broker dealer, is a member of SIPC (http://www.sipc.org).
Our salespeople, traders, and other professionals may provide oral or written market commentary or trading strategies to our clients and principal
trading desks that reflect opinions that are contrary to the opinions expressed in this research. Our asset management area, principal trading desks
and investing businesses may make investment decisions that are inconsistent with the recommendations or views expressed in this research.
The analysts named in this report may have from time to time discussed with our clients, including Goldman Sachs salespersons and traders, or may
discuss in this report, trading strategies that reference catalysts or events that may have a near-term impact on the market price of the equity
securities discussed in this report, which impact may be directionally counter to the analyst's published price target expectations for such stocks. Any
such trading strategies are distinct from and do not affect the analyst's fundamental equity rating for such stocks, which rating reflects a stock's
return potential relative to its coverage group as described herein.
We and our affiliates, officers, directors, and employees, excluding equity and credit analysts, will from time to time have long or short positions in,
act as principal in, and buy or sell, the securities or derivatives, if any, referred to in this research.
The views attributed to third party presenters at Goldman Sachs arranged conferences, including individuals from other parts of Goldman Sachs, do
not necessarily reflect those of Global Investment Research and are not an official view of Goldman Sachs.
Any third party referenced herein, including any salespeople, traders and other professionals or members of their household, may have positions in
the products mentioned that are inconsistent with the views expressed by analysts named in this report.
This research is not an offer to sell or the solicitation of an offer to buy any security in any jurisdiction where such an offer or solicitation would be
illegal. It does not constitute a personal recommendation or take into account the particular investment objectives, financial situations, or needs of
individual clients. Clients should consider whether any advice or recommendation in this research is suitable for their particular circumstances and, if
appropriate, seek professional advice, including tax advice. The price and value of investments referred to in this research and the income from them

June 23, 2016 Australia: Small Companies
Goldman Sachs Global Investment Research 45
may fluctuate. Past performance is not a guide to future performance, future returns are not guaranteed, and a loss of original capital may occur.
Fluctuations in exchange rates could have adverse effects on the value or price of, or income derived from, certain investments.
Certain transactions, including those involving futures, options, and other derivatives, give rise to substantial risk and are not suitable for all investors.
Investors should review current options disclosure documents which are available from Goldman Sachs sales representatives or at
http://www.theocc.com/about/publications/character-risks.jsp. Transaction costs may be significant in option strategies calling for multiple purchase
and sales of options such as spreads. Supporting documentation will be supplied upon request.
All research reports are disseminated and available to all clients simultaneously through electronic publication to our internal client websites. Not all
research content is redistributed to our clients or available to third-party aggregators, nor is Goldman Sachs responsible for the redistribution of our
research by third party aggregators. For research, models or other data available on a particular security, please contact your sales representative or
go to http://360.gs.com.
Disclosure information is also available at http://www.gs.com/research/hedge.html or from Research Compliance, 200 West Street, New York, NY
10282.
© 2016 Goldman Sachs.
No part of this material may be (i) copied, photocopied or duplicated in any form by any means or (ii) redistributed without the prior written consent of The Goldman Sachs Group, Inc.
Related Documents