SEPTEMBER 2017 AUSTRALIA FOCUSED EXPLORATION & PRODUCTION COMPANY TSX: BNG

Welcome message from author
This document is posted to help you gain knowledge. Please leave a comment to let me know what you think about it! Share it to your friends and learn new things together.
Transcript

SEPTEMBER 2017
AUSTRALIA FOCUSED
EXPLORATION &
PRODUCTION
COMPANY
TSX: BNG

36%Insider holdings
CORPORATE PROFILE
2
Financial
Shares Outstanding (TSX:BNG) 102.3 MM
Total Debt US $12.5 MM
Market Capitalization @ $0.10/share (Sept. 18, 2017) $10.2 MM
Funds Flow from Operations (FFO)(2) (Q1 FY 2018) $1.8 MM
Corporate Reserves Values Btax PV10 (Mar. 31 2017)*
Proved + Probable (P+P)(1) $108.5 MM
Equivalent Value per Basic Share $1.06 / share
Operational Results
Average daily light oil production (Q1 FY 2018) 369 bopd
Operating netback(2) including hedging (Q1 FY 2018) $78.02 / bbl
Operating netback(2) excluding hedging (Q1 FY 2018) $44.58 / bbl
(1) Details for all reference notes on this slide are located at the end of this presentation under “Endnotes”. See also "Cautionary Statements" in the Appendix and Notes to this document.
(2) See "Fundamental Resource Definitions, Cautionary Statements“ and “Oil and Gas Advisories” in the Appendix and Notes to this document.
* Independent third party reserves

Barta Cuisinier
Wompi
Barrolka
Tookoonooka
COOPER BASIN
WOMPI
TOOKOONOOKA
BARTA
Existing pipelines
HIGHLY PROSPECTIVE1.1 MILLION GROSS ACRES (72% operated)
ATP 934
BARROLKA
Australian Growth Platform
Fiscal stability and low government take.
Attractive commodity pricing.
High impact gas exploration - Barrolka (ATP 934)
Production of ultralight oil with 2P OIIP(1) over 100 million barrels.
High netback production at Cuisinier with 27 of 28 wells successful.
Significant oil & gas exploration acreage at Tookoonooka.
3
Operated
Non-operated
A STRONG PLATFORM FOR FUTURE GROWTH
CUISINIER
(1) Details for all reference notes on this slide are located at the end of this presentation under “Endnotes”. See also "Fundamental Resource Definitions and Cautionary Statements“ in the Appendix and Notes to this document.
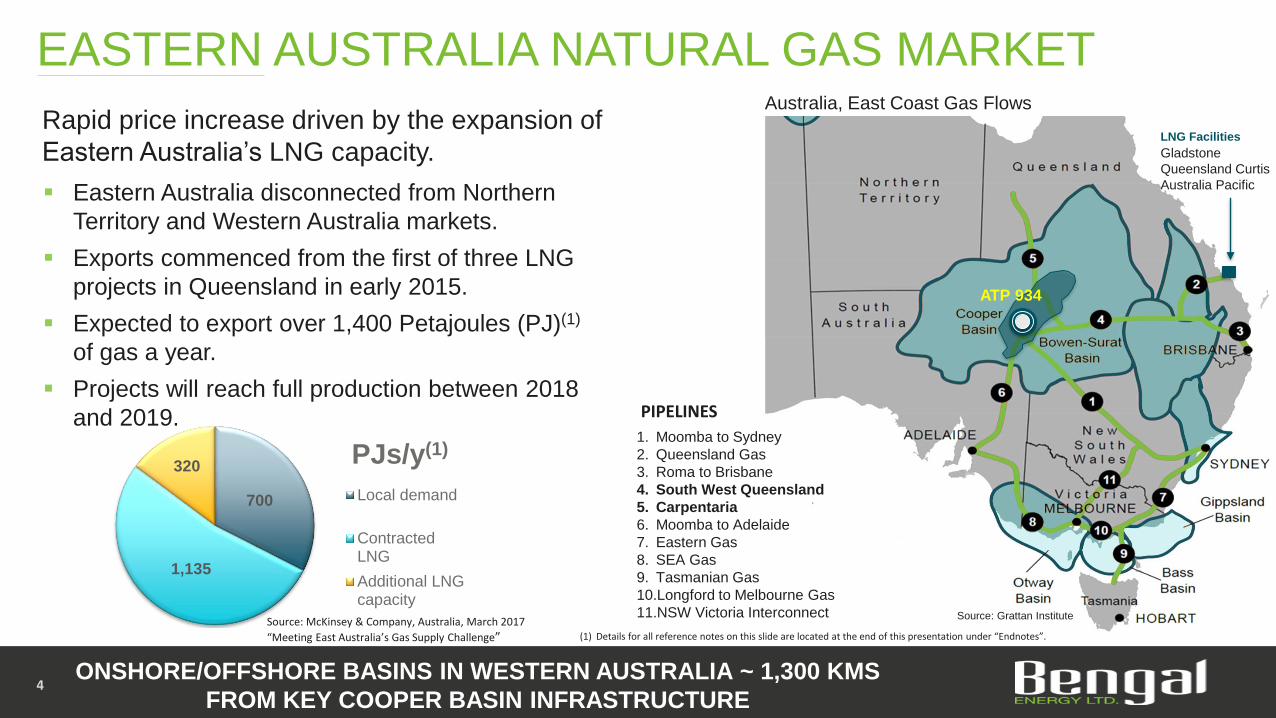
EASTERN AUSTRALIA NATURAL GAS MARKET
4
Eastern Australia disconnected from Northern
Territory and Western Australia markets.
Exports commenced from the first of three LNG
projects in Queensland in early 2015.
Expected to export over 1,400 Petajoules (PJ)(1)
of gas a year.
Projects will reach full production between 2018
and 2019.
Australia, East Coast Gas Flows
1. Moomba to Sydney
2. Queensland Gas
3. Roma to Brisbane
4. South West Queensland
5. Carpentaria
6. Moomba to Adelaide
7. Eastern Gas
8. SEA Gas
9. Tasmanian Gas
10.Longford to Melbourne Gas
11.NSW Victoria Interconnect
Rapid price increase driven by the expansion of
Eastern Australia’s LNG capacity.
PIPELINES
Source: Grattan Institute
Gladstone
Queensland Curtis
Australia Pacific
LNG Facilities
ONSHORE/OFFSHORE BASINS IN WESTERN AUSTRALIA ~ 1,300 KMS
FROM KEY COOPER BASIN INFRASTRUCTURE
ATP 934
700
1,135
320 PJs/y(1)
Local demand
ContractedLNG
Additional LNGcapacity
Source: McKinsey & Company, Australia, March 2017
“Meeting East Australia’s Gas Supply Challenge” (1) Details for all reference notes on this slide are located at the end of this presentation under “Endnotes”.

WHY GAS? WHY NOW?
5
Current spot pricing ex Sydney of greater than $12/GJ with a noticeable upward trend.
“On the east coast, spot prices on the Brisbane Short Term Trading Market (STTM) more than doubled from an average of $3.13 per gigajoule (GJ) in Q4 2015 to an average of $7.36/GJ in Q4 2016, and have since climbed sharply higher to $10/GJ or more.”
(1) Details for all reference notes on this slide are located at the end of this presentation under “Endnotes”.
0
2
4
6
8
10
12
14
16
18
20
12/1/2016 1/1/2017 2/1/2017
$A
U/G
J
Sydney Spot Gas PriceSpot Natural Gas Market (Sydney)
TIGHTENING GAS MARKET DRIVING EASTERN AUSTRALIAN GAS
PRICE INCREASES
Coal Seam Gas assets require ~AUS $40 Billion to maintain flat production to 2030.
New investment of at least AUS $10 Billion in new developments required.
Source G. Bethune, EnerQuest Mar 7/17
Source: McKinsey, Australia, March 2017 “Meeting East Australia’s Gas Supply Challenge”
East Australia projected supply demand dynamics, 2017–2030, PJ
1 Assumes capability to produce above nameplate capacity developed between 2020-25
SOURCE: CEDIGAZ; Wood Mackenzie—Upstream Data Tool Q3 2016
PJ

QUEENSLAND – World Class Gas Economics
6
Source: The Gas Price Trends Review Report by Oakley Greenwood Pty Ltd. Feb 2016.
* Prices shown, do not include transportation
1. NWQ INDUSTRIAL ZONE
2. GLADSTONE
INDUSTRIAL ZONE
3. SEQ INDUSTRIAL ZONE
US$8.29/MCF
US$7.48/MCF
US$7.38/MCF
2015 COMMERCIAL GAS
PRICES
One commercial gas user has been quoted AUS $20/GJ for a two year contract starting July 1, 2017 (Australian Financial Review, Mar 8, 2017)
EXPECTED WELLHEAD
ECONOMICS
SPOT PRICING:
AUS $10-12/Mcf
WELLHEAD PRICING:
AUS $7-10/Mcf
NETBACK:
AUS $4-8/Mcf(1)ATP 934 situated near
intersection of major pipelines(1) See "Fundamental Resource Definitions, Cautionary Statements“ and “Oil and Gas Advisories” in the Appendix and Notes to this document.

NATURAL GAS
EXPLORATION
7
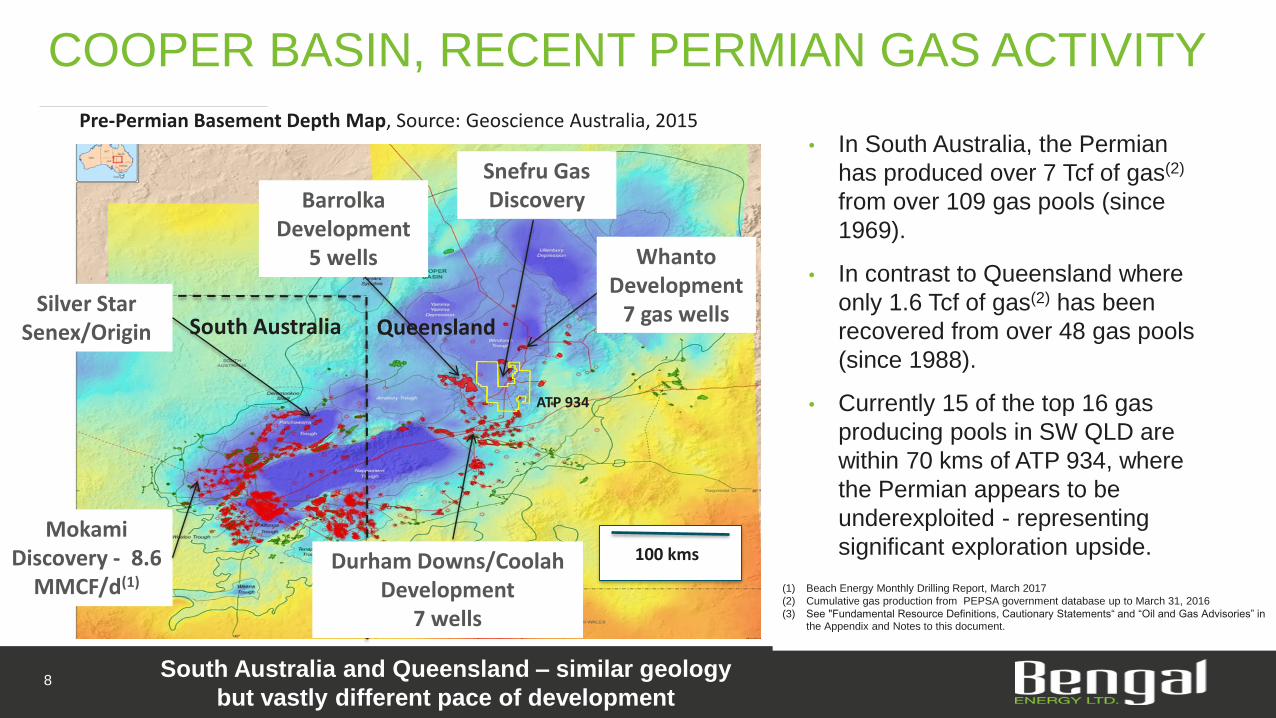
COOPER BASIN, RECENT PERMIAN GAS ACTIVITY
• In South Australia, the Permian
has produced over 7 Tcf of gas(2)
from over 109 gas pools (since
1969).
• In contrast to Queensland where
only 1.6 Tcf of gas(2) has been
recovered from over 48 gas pools
(since 1988).
• Currently 15 of the top 16 gas
producing pools in SW QLD are
within 70 kms of ATP 934, where
the Permian appears to be
underexploited - representing
significant exploration upside.
Pre-Permian Basement Depth Map, Source: Geoscience Australia, 2015
ATP 934
South Australia and Queensland – similar geology
but vastly different pace of development
Barrolka Development
5 wells
QueenslandSouth Australia
Mokami Discovery - 8.6
MMCF/d(1)
Silver Star Senex/Origin
100 kms
(1) Beach Energy Monthly Drilling Report, March 2017
(2) Cumulative gas production from PEPSA government database up to March 31, 2016
(3) See "Fundamental Resource Definitions, Cautionary Statements“ and “Oil and Gas Advisories” in the Appendix and Notes to this document.
8
Whanto Development
7 gas wells
Snefru Gas Discovery
Durham Downs/Coolah Development
7 wells

ATP 934 BARROLKA PERMIT (BNG 71% AND OPERATOR)(3)
Barrolka: 20.2 BCF(1)
Durham Downs/Durham Downs North: 46 BCF(1)
Coolah
Ramses
Coonaberry6.4 BCF (1)
Wareena7.7BCF(1)
Ghina
Tartulla13.4BCF(1)
Whanto Large, undrilled 1,462 km2 permit in gas jurisdiction.
Active drilling around permit with 20 gas wells drilled in the last 2 years.
Producing gas fields offsetting with numerous gas pipelines crossing the
permit.
5 existing gas pools offsetting ATP 934 are producing 17.7 MMcfd with
396 bbls condensate per day.(1)
Whanto wells now tied-in with anticipated initial rate of ~28-30 MMcfd.
Management has mapped 6 prospects/leads on this permit, based on
2D seismic interpretation - covering a total area of ~29 km2.
Surrounding analog Permian Toolachee gas pools show an average
‘conventional’ pay zone thickness of approx. 9.6 m, (based on
logs/tests/production data from 28 wells across a range of offsetting
pools).(2)
9
(1) Production volumes cited are cum. to June 2016. Source: State of Queensland Department of Employment, Economic Development and Innovation (DEEDI).
(2) See "Fundamental Resource Definitions and Cautionary Statements" in the Appendix and End Notes to this document.
PERMIT NEIGHBOURING PRODUCING GAS FIELDS & GAS PIPELINES FEEDING EASTERN AUSTRALIA
Prospects
Gas Pools
15km
Cum Prod to June 2016(1)
Snefru Discovery

ATP 934 – QI RESULTS & HIGH GRADED TRENDSThe AVO / inversion work was able to characterize sand, coal and shale within the targeted Permian section.
Accuracy was 75% in zones that were 15-20m thick.
Progress:
Areas with fault bound structures showing favorable reservoir characteristics have been high graded.
The top ranked prospect (Han Solo/Rogue) is drill ready - a robust feature with approx. 40m of structural relief.
This prospect is considered a good place to test gas resource play concept.
Next Steps:
Bengal is working on consolidating its position on the play.
Finalize farm-in partner and set course to shoot or drill:
3D acquisition costs estimated to be approximately $4.5M for 260 km2.
To drill, case, test and complete is approximately $4.0M (drill & case only – $2.7 M)
10
Zero EdgeToolachee P2 Sand
Interbedded SandAnd Shale
PredominantlyCoal
PredominantlyShale
??
??
PredominantlySand
Han Solo / Rogue Prospects
Recent Snefru-1 Gas
Discovery

LIGHT OIL
DEVELOPMENT
11

Barta permit approx. 2.7 MMbbls production to date with 2P
oil in place of 101 MMbbls(1) and expected to increase
substantially.
52 degree API oil with oil price at significant premium to Brent.
Currently producing 1,315 BOPD (399 BOPD Net).
5 well drill campaign 100% successful, including exploration
discovery at Shefu.
2P area increased by approximately 20%(1) .
Shefu-1 exploration success has de-risked an area of over
950 acres immediately offsetting the well.
Established oil column now greater than 51 meters.
28 wells drilled to date – 27 oil (approx. 160 acre spacing).
JV now reviewing options for a water injection pilot.
BNG management view:
21,000 acres of Murta closure within permit.
Limit of existing 3D
GLJ 2P Areal Assignment (1)
Mar. 31, 2017 (8,069 Acres)
GLJ 3P Areal AssignmentMar. 31, 2017 (11,702Acres) (1)
Lowest Known Oil (LKO)(21,350 Acres)
SHEFU-1 DISCOVERY
Existing Wells
2016 Wells
BARTA PERMIT (~154,000 ACRES)
(1) Details for all reference notes on this slide are located at the end of this presentation under “Endnotes”. See also "Fundamental Resource Definitions and Cautionary Statements" in the Appendix and Notes to this document.
12 HISTORY OF DRILLING SUCCESS AND POOL EXPANSION
Cuisinier PL 303 (15,815 acres)
METERS
0 250 500 750
PETRA 09/09/2016 11:06:16 AM
1 km

CUISINIER - BARTA WEST 3D
13
10 kmsShefu
Barta
Shefu-1 encountered a well developed Murta DC70
sand with 7m of net oil pay.(1)
Shefu-1 Murta oil discovery further expands upon
Cuisinier success further highlighting the prospective
adjacent land position within the same permit.
Structures mapped on permit including LKO-based
Murta closures define prospects covering ~115 km2.
Barta West 3D acquisition commenced the July 27th ,
2017, now 100% complete (as of Sept 10th.) .
Currently expecting ‘fast track’ processed volume by
about late October.
Anticipate 1-2 wells in 2018.
CONVERTING 3P RESERVES INTO 2P & 1P,
WITH SIGNIFICANT EXPLORATION UPSIDE
(1) See "Fundamental Resource Definitions and Cautionary Statements" in the Appendix and End Notes to this document.
CookCuisinier

TYPE WELL CURVE –
AVERAGE PRODUCING VERTICAL WELL
(w/o pressure maintenance – assuming virgin
reservoir pressure)
CUISINIER DEVELOPMENTIMMEDIATE GROWTH POTENTIAL
14
Cuisinier well economics
Breakeven(1) US$ 31-35/bbl ($10-12 F&D + $21-23 Ops costs)
NPV(1) AUD$3.9 million (forward strip price)
IRR / Payout(1) 61% / 16 months
Netback(1) AUD$34/bbl (@ current Brent price)
MANAGEMENT SEES SUBSTANTIAL UPSIDE BEYOND INDEPENDENT
EVALUATOR’S VALUE UPSIDE
0
60
120
240
180
0 20 40 60 80 100 120 140 160 180 200
Cale
nd
ar
Day O
il R
ate
Bb
ls/d
ay
Cumulative oil production (Mbbl)
Calendar Daily Oil Rate(CDOR)
(1) See "Fundamental Resource Definitions, Cautionary Statements“ and “Oil and Gas Advisories” in the Appendix and Notes to this document.(2) Details for all reference notes on this slide are located at the end of this presentation under “Endnotes”.
ANNUAL PROVED PLUS PROBABLE(1) CORPORATE RESERVES
AS AT YEAR END MARCH 31(2)
2P Volumes: 47.3% 4yr. CAGR
0
20
40
60
80
100
120
140
0
1000
2000
3000
4000
5000
6000
7000
8000
2013 2014 2105 2016 2017
NP
V1
0 (
CA
D $
Mill
ion
s)
MM
bb
ls
2P Volume 2P Values

15
BENGAL - CATALYSTS & OPPORTUNITIES
ACQUISITION OPPORTUNITIES Increased deal flow involving Australia onshore conventional oil and
gas assets backed by reputed financial partners.
Potential for accretive producing asset acquisitions.
EXPLORATION AT ATP 934 1,462 km2 permit in gas rich jurisdiction.
Significant upside value due to Eastern Australia gas demands.
Possible basin centered gas play identified in neighboring permits
with successful wells continuing to be drilled.
EXPLORATION AT ATP 752 3D seismic underway beyond Shefu and offsetting proven productive
trend.
1-2 exploration wells planned on 3D in 2018.
OTHER EXPLORATION
OPPORTUNITIES
Tookoonooka – several oil and gas prospects currently being
evaluated.
WELL POSITIONED WITH SIGNIFICANT GROWTH OPPORTUNTIES
IN THE NEAR AND LONGER TERM

DISCUSSION
Attractive exploration opportunity on large gas resource at ATP 934.
Very compelling gas market conditions with spot prices of $10-$12/GJ.
Large, stable, well established light oil reserves base with history of growth leading to vast development opportunity (only ~ 2.7% of 2P STOIP(1) produced to date).
Successful drilling results including Shefu-1 plus Barta West 3D, expanding the proven productive area at Cuisinier.
Maintaining healthy netbacks and cash flow despite downward commodity price pressure.
Company actively pursuing attractive producing and cash-flowing, operated opportunities to generate accretive growth.
16
High margin, strong cash generating operations
Looking to expand portfolio of producing properties
(1) Details for all reference notes on this slide are located at the end of this presentation under “Endnotes”. See also "Fundamental Resource Definitions, Cautionary Statements and Oil and Gas Advisories" in the Appendix and Notes to this document.
LARGE POOL OF HIGH IMPACT EXPLORATION SUPPORTED BY
GROWING RESERVE BASE
Rapidly growing reserves in a light oil pool
High impact, drill ready, gas opportunity in exciting gas market
APPENDIX
17
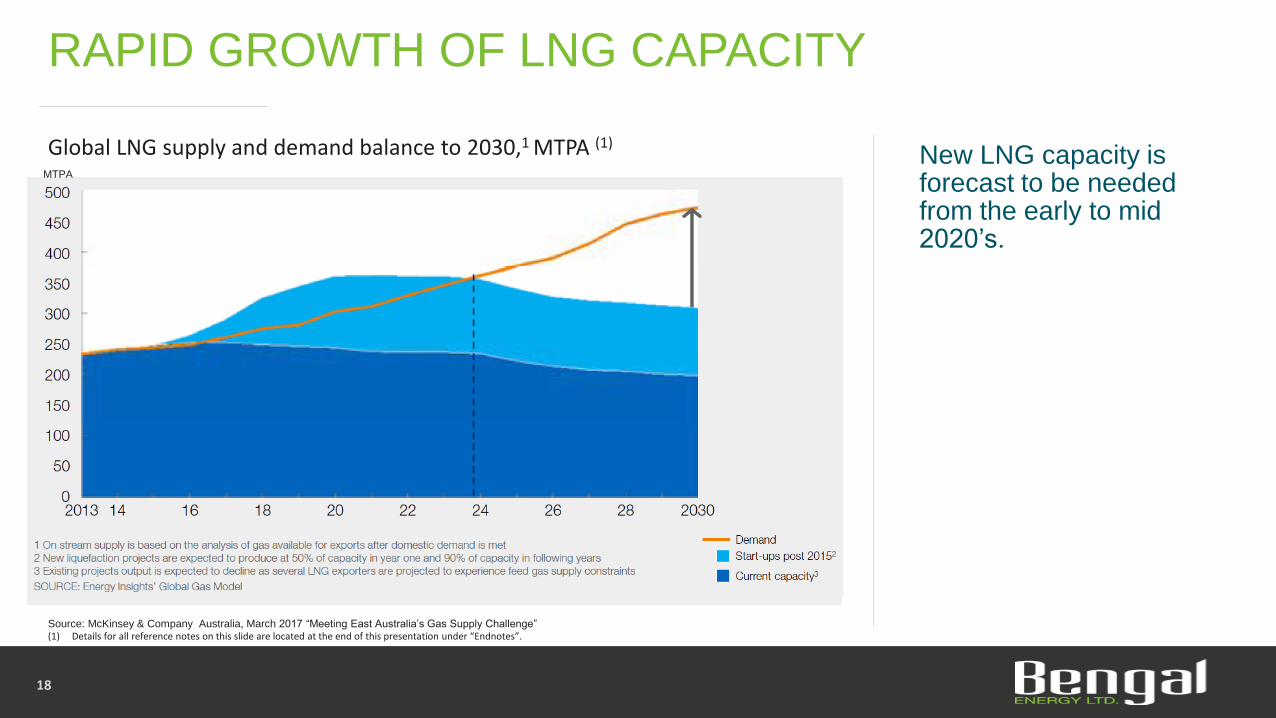
RAPID GROWTH OF LNG CAPACITY
New LNG capacity is forecast to be needed from the early to mid 2020’s.
18
Global LNG supply and demand balance to 2030,1 MTPA (1)
MTPA
Source: McKinsey & Company Australia, March 2017 “Meeting East Australia’s Gas Supply Challenge”(1) Details for all reference notes on this slide are located at the end of this presentation under “Endnotes”.
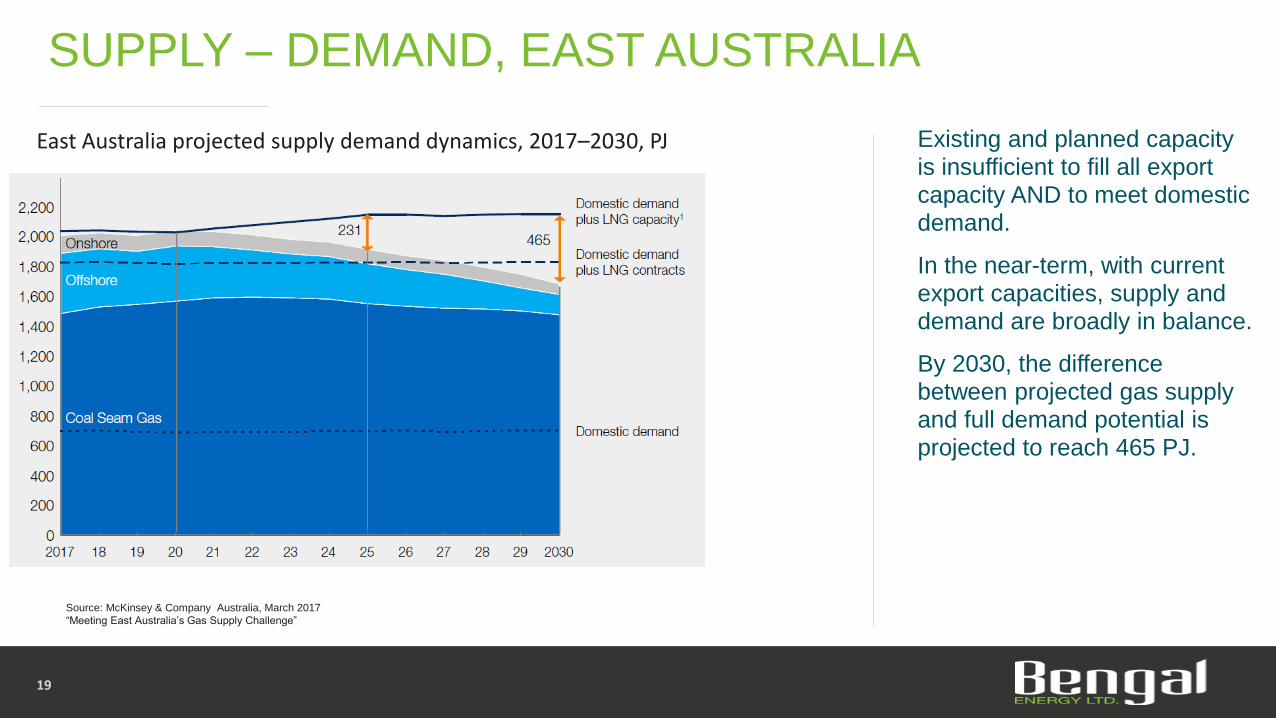
SUPPLY – DEMAND, EAST AUSTRALIA
Existing and planned capacity is insufficient to fill all export capacity AND to meet domestic demand.
In the near-term, with current export capacities, supply and demand are broadly in balance.
By 2030, the difference between projected gas supply and full demand potential is projected to reach 465 PJ.
19
East Australia projected supply demand dynamics, 2017–2030, PJ
Source: McKinsey & Company Australia, March 2017
“Meeting East Australia’s Gas Supply Challenge”

EASTERN AUSTRALIA GAS DEMAND SUMMARY
20
GAS DEMAND BCF/YR BCF/YR
Local Demand 644 Trans 6
Contracted LNG 1,044 Mining 17
Additional LNG Capacity 294 Rec/Com 208
TOTAL 1,982 Ind 234
Power Gen 180
TOTAL 645
644
1,044
294
BCF/YR
Local demand
Contracted LNG
Additional LNG capacity
Source: McKinsey & Company Australia, March 2017
“Meeting East Australia’s Gas Supply Challenge”

SHEFU-1 EXPLORATION DISCOVERY
Near field exploration well approx. 3.6
kms west of Cuisinier-17.
Encountered 8.1m of gross sand with 7m
of net pay(1) and virgin pressure.
Result has establish a new Lowest
Known Oil (“LKO”) for the area.
The Murta reservoir in the Shefu-1 area
is thicker than expected and situated well
outside of Bengal’s currently booked
reserves areas.
Bengal’s internal review suggests that the
Shefu-1 result has the potential to
materially increase the Cuisinier area oil
in place and reserves.(1)
21
Murta Depth Structure (viewed from NW)
Lowest Known Oil (LKO)
POOL SIZE AND RESERVES EXPECTED TO INCREASE FURTHER
C17 Shefu-1
(1) See "Fundamental Resource Definitions and Cautionary Statements" in the Appendix and Notes to this document.

22
Slide 2
(1) Based on independent, qualified reserves evaluator GLJ Petroleum Consultants Ltd.’s report dated March 31, 2017 entitled ReservesAssessment and Evaluation of Canadian and Australian Oil and Gas Properties dated May 25, 2017, prepared in accordance with NationalInstrument 51-101 – Standards of Disclosure for Oil and Gas Activities ("NI 51-101") and the Canadian Oil and Gas Evaluation Handbook (the"COGEH") with Cuisinier 30.357% WI.
(2) Funds Flow from Operations - Funds from operations represents cash from operating activities as presented in the consolidated statement ofcash flows and adding back changes in non-cash working capital and the settlement of decommissioning liabilities. Funds from operations pershare is calculated based on the weighted average number of common shares outstanding consistent with the calculation of net income (loss) pershare. Funds from operations is not intended to represent operating profit for the period nor should it be viewed as an alternative to operatingprofit, net income, cash from operations or other measures of financial performance calculated in accordance with IFRS. Funds from operations,commonly referred to as cash flow by research analysts, is used to value and compare oil and gas companies and is frequently included inpublished research when providing investment recommendations.
(3) Corporate Operating Netback Q1 2018 of $78.02/bbl.
Slide 3
(1) “OIIP”– Oil initially-in-place.(2) Corporate Operating Netback Q1 2018 of $78.02/bbl.
Slide 4
(1) Petajoule is defined as an SI unit of energy, work, and heat equal to 1015 joules; PJs/y = Petajoules per year; 1 Petajoule = 163398.6928 BarrelsOf Oil Equivalent (BOE).
Slide 5
(1) Gigajoule (GJ) is defined as an SI unit of energy and work equal to one billion (109) joules. 6 GJ is about the amount of potential chemical energyin 160 L (approximately one US standard barrel) of oil, when combusted.
Slide 6
(1) Gigajoule (GJ) is defined as an SI unit of energy and work equal to one billion (109) joules. 6 GJ is about the amount of potential chemical energyin 160 L (approximately one US standard barrel) of oil, when combusted.
Slide 9
(1) Billion Cubic Feet” or “Bcf” is a volume measurement used by the oil and gas industry. A billion cubic feet (1,000,000,000 cubic feet) is a volumemeasurement of natural gas.
(2) Million Cubic Feet” or “MMcf” is a volume measurement used by the oil and gas industry. A million cubic feet (1,000,000 cubic feet) is a volumemeasurement of natural gas.
(3) Australia Gas Ltd. – 29% W/I partner at ATP 934.
Slide 12
(1) “Million Barrels” or “MMbbls” is a volume measurement used by the oil and gas industry. A million barrels is a volume measurement of oil.
(2) Based on independent, qualified reserves evaluator GLJ Petroleum Consultants Ltd.’s report dated March 31, 2017 entitled “ReservesAssessment and Evaluation of Canadian and Australian Oil and Gas Properties” effective as off May 25, 2017, prepared in accordance with NI51-101 and the COGEH with Cuisinier 30.357% WI.
(3) “BOPD” = Barrels of oil per day.
.
ENDNOTESSlide 14
(1) Based on independent, qualified reserves evaluator GLJ Petroleum Consultants Ltd.’s report dated March 31,
2017 entitled “Reserves Assessment and Evaluation of Canadian and Australian Oil and Gas Properties”
effective as off May 25, 2017, prepared in accordance with NI 51-101 and the COGEH with Cuisinier 30.357%
WI.
Slide 16
(1) Based on independent, qualified reserves evaluator GLJ Petroleum Consultants Ltd.’s report dated March 31,
2017 entitled “Reserves Assessment and Evaluation of Canadian and Australian Oil and Gas Properties”
effective as off May 25, 2017, prepared in accordance with NI 51-101 and the COGEH with Cuisinier 30.357%
WI.
Slide 18
(1) Metric tonnes per annum, (MTPA) which is defined as a typical measurement unit in liquefied natural gas
(LNG) markets for production and facility capacity.
Slide 19
(1) Petajoule is defined as an SI unit of energy, work, and heat equal to 1015 joules.
Slide 20
(1) Billion Cubic Feet” or “Bcf” is a volume measurement used by the oil and gas industry. A billion cubic feet
(1,000,000,000 cubic feet) is a volume measurement of natural gas.

FORWARD-LOOKING STATEMENTS
23
• Certain information regarding Bengal Energy Ltd (“Bengal” or the “Company”) set forth in this document contains forward-looking statements or financial outlooks (collectively, "forward-
looking statements") under applicable securities law. The use of any of the words “plan”, “expect”, “project”, “intend”, “believe”, “should”, “anticipate”, “estimate” or other similar words, or
statements that certain events or conditions “may” or “will” occur are typically intended to identify forward-looking statements. Forward-looking statements are not based on historical facts,
but rather on Bengal’s internal projections, estimates or beliefs concerning, among other things, future growth, results of operations, production, future capital and other expenditures
(including the amount, nature and sources of funding thereof), competitive advantages, regulatory hurdles, plans for and results of drilling activity, environmental matters, business
prospects and opportunities. These statements are only predictions, not guarantees, and actual events or results may differ materially. In particular, forward-looking statements included in
this document include, but are not limited to, statements with respect to: Bengal’s corporate strategy, growth strategy and future work programs; the Company’s well drilling programs; the
timing to reach full production of the Company’s projects; the volume of annual exports of gas from Australia; the amount of investment required to maintain production in Australia; future
seismic; the drilling, completion, performance of future wells; infrastructure development; the timing of the full field development plan on the Barta permit; the expansion of 2P areas on the
Barta permit; the potential of the Shefu-1 results; performance of current wells; estimates of resources, reserves and ultimate recovery per well; demand for oil and natural gas in Australia
and globally; results of operations; future production, current production, including production targets from current and future wells and pool sizes; production decline rates; future production
capacity; exploration opportunities of ATP 934 and 752; anticipated flow rates of Whanto wells; future acquisitions and exploration opportunities; future netbacks, royalties, operating and
transportation costs and drilling and completion costs; and oil and gas prices. In addition, statements relating to “reserves” or “resources” are by their nature forward-looking statements, as
they involve the implied assessment, based on certain estimates and assumptions, that the resources described can be profitably produced in the future.
• The forward-looking statements contained herein are subject to numerous known and unknown risks and uncertainties that may cause actual results to vary, including but not limited to risks
associated with: the impact of general economic conditions in Canada, Australia and globally; industry conditions, including changes in laws and regulations, including adoption of new
environmental laws and regulations, and changes in how they are interpreted and enforced, in Canada and Australia; competition; lack of availability of qualified personnel; the results of
exploration and development drilling and related activities; imprecision in reserve and resource estimates; the production and growth potential of Bengal’s assets; production, transportation
and marketing constraints; failure to obtain required approvals of regulatory authorities, in Canada, Australia and India; risks associated with negotiating with foreign governments as well as
country risk associated with conducting international activities; volatility in market prices for oil and natural gas; fluctuations in foreign exchange or interest rates; environmental risks;
changes in income tax laws or changes in tax laws and incentive programs relating to the oil and natural gas industry; ability to access sufficient capital from internal and external sources;
and other factors, many of which are beyond the control of the Company.

FORWARD-LOOKING STATEMENTS cont’d
24
Readers are cautioned that the foregoing list of factors is not exhaustive. Additional information on these and other factors that could effect Bengal’s operations and financial results are included in
reports on file with Canadian securities regulatory authorities and may be accessed through the SEDAR website (www.sedar.com).
With respect to forward-looking statements contained in this document, Bengal has made assumptions regarding: current and future commodity prices and royalty regimes; availability of skilled
labour; timing and amount of capital expenditures; access to capital to fund the Company’s exploration programs; future exchange rates; the impact of increasing competition; conditions in
general economic and financial markets; availability of drilling and related equipment; effects of regulation by governmental agencies; royalty rates; future operating and transportation costs; and
other matters. Although the forward-looking statements contained in this document are based upon assumptions which management believes to be reasonable, the Company cannot assure
investors that actual results will be consistent with these forward-looking statements.
Management has included the above summary of assumptions and risks related to forward-looking statements provided in this document in order to provide shareholders with a more complete
perspective on Bengal’s current and future operations and such information may not be appropriate for other purposes. Bengal’s actual results, performance or achievement could differ materially
from those expressed in, or implied by, these forward-looking statements and, accordingly, no assurance can be given that any of the events anticipated by the forward-looking statements will
transpire or occur, or if any of them do so, what benefits that Bengal will derive there from. These forward-looking statements are made as of the date of this document and Bengal disclaims any
intent or obligation to update publicly any forward-looking statements, whether as a result of new information, future events or results or otherwise, other than as required by applicable securities
laws.
The estimates of capital requirements, reserves and net present value of future net revenues ("NPV") contained in such slides are based on information for the Company’s booked locations in
respect of which reserves have been assigned as well as analogous public information. Readers are cautioned that there is no certainty that any development on Bengal's unbooked locations will
be successful to the same extent as its booked locations, or at all, and therefore, the estimates of capital requirements, reserves and NPV should not be relied upon as necessarily indicative of
future results or values. The information is also based on certain key assumptions including, without limitation, the assumptions set forth above under this "Forward-Looking Statements" advisory
statement. Actual results and values may vary, with such variations being material, as a result of a number of risks and uncertainties, including, without limitation, the risks and uncertainties noted
under this "Forward-Looking Statements" advisory.

25
“Million Cubic Feet” or “Mcf” is a volume measurement used by the oil and gas industry. A million cubic feet (1,000,000 cubic feet) is a volume measurement of natural gas.
“Trillion Cubic Feet” or “Tcf” is a volume measurement used by the oil and gas industry. A trillion cubic feet (1,000,000,000,000 cubic feet) is a volume measurement of natural gas.
Pay Thickness or Pay Zone- This document includes estimates of pay thickness, which are considered to be anticipated results or information that indicate the potential value or quantities of resources under NI 51‐101. Such estimates
have been prepared by management of the Company and have not been prepared or reviewed by an independent qualified reserves evaluator or auditor. The risks associated with estimates of pay thickness include, but are not limited
to, the risk that the Company's exploration and development drilling and related activities may provide different results; the risk that the Company may encounter unexpected drilling results the occurrence of unexpected events involved
in the exploration for, and the operation and development of, oil and gas; delays in anticipated timing of drilling and completion of wells; geological technical, drilling and processing problems and other difficulties in producing petroleum
reserves.
“LKO” is the lowest known oil in a reservoir.
“Stock Tank Oil Originally-In-Place” or “STOIP” "Stock Tank Oil Originally-In-Place" or "STOIP" is that quantity of petroleum that is estimated to exist originally in naturally occurring accumulations. It includes that quantity of
petroleum that is estimated, as of a given date, to be contained in known accumulations, prior to production, plus those estimated quantities in accumulations yet to be discovered. All STOIP set forth in this document are based on
management's internal estimates.
"TCF of gas in place", STOIP, “Oil in Place”, pay thickness and other resource disclosures contained in this document are not indicative of reserves, nor are they categories of resources recognized by the Canadian Oil and Gas
Evaluation Handbook. These volumes are based upon Bengal's internal estimates only and are not derived from an independent resources evaluation prepared pursuant to NI 51-101 and are not accompanied by a discussion of the
significant positive and negative factors relevant to the estimated volumes, or the estimated total costs, timeline and technology applicable to achieving commercial production from the project. There may be more specific sub-categories
of resources applicable to these estimates that would provide a more accurate description of the resources and the work programs, technology and capital required to exploit such resources, but these have not been prepared by the
Company. In addition, these volumes represent "best" case estimates however "low" and "high" case estimates have not been prepared by the Company. There is no certainty that any portion of the noted volumes or resources
will be discovered. If discovered, there is no certainty that it will be commercially viable to produce any portion thereof.
The risks associated with these estimates and the other resource estimates contained in this document include, but are not limited to, the risk that Bengal's exploration and development drilling and related activities may provide different
results; the risk that Bengal may encounter unexpected drilling results; the occurrence of unexpected events involved in the exploration for, and the operation and development of, oil and gas; delays in anticipated timing of drilling and
completion of wells; geological, technical, drilling and processing problems and other difficulties in producing petroleum reserves; and the risk that if any resources are discovered that it will not be commercially viable to produce any
portion thereof. There is no certainty that Bengal will achieve the estimated results from the Cuisinier oil field or that any portion of the resources will be discovered. If discovered, there is also no certainty that it will be commercially
viable to produce any portion of the resources.
FUNDAMENTAL RESOURCE DEFINITIONSAND CAUTIONARY STATEMENTS

CAUTIONARY STATEMENTS AND OIL & GAS ADVISORIES
26
• Certain oil and gas metrics: Finding and development costs and netbacks do not have standardized meanings or standard methods of calculation and therefore such measures may not be
comparable to similar measures used by other companies and should not be used to make comparisons. Such metrics have been included in documents provided by Bengal to give readers
additional measures to evaluate the Bengal's performance; however, such measures are not reliable indicators of the future performance of the Bengal and future performance may not compare to
the performance in previous periods and therefore such metrics should not be unduly relied upon.
• Other than the reserves estimates disclosed on the slides 2, 3, 12, 13, 14 and 16 the recovery, reserves and resources estimates provided herein are internal estimates only. The reserve estimates
disclosed on slides 2, 3, 12, 13, 14 and 16 were prepared by GLJ Petroleum Consultants Ltd. with an effective date of March 31, 2017 in accordance with NI 51-101 and the Canadian Oil and Gas
Evaluation Handbook and using GLJ Petroleum Consultants Ltd.'s forecast prices at March 31, 2017. There is no guarantee that the estimated reserves or resources will be recovered. As a
consequence, actual results may differ materially from those anticipated in the forward-looking statements.
• Analogous Information: Certain noted drilling, completion, production, reserve and resource data provided in this document may constitute “analogous information” under applicable securities
legislation, such as reserve and resource estimates or the reserves and resources present on the Company’s lands, and near by lands, total production and production-rates from wells drilled by the
Company or other industry participants located in geographical proximity to lands held by the Company. This information is derived from publicly available information sources (as at the date of this
document) that the Company believes are predominantly independent in nature. The Company believes this information is relevant as it helps to define the reservoir characteristics in which the
Company may have an interest. The Company is unable to confirm that the analogous information was prepared by a qualified reserves evaluator or auditor or in accordance with the Canadian Oil
and Gas Evaluation Handbook and therefore, the reader is cautioned that the data relied upon by the Company may be in error, may not be analogous to the Company’s land holdings and/or may not
be representative of actual results of wells anticipated to be drilled or completed by the Company in the future.
• Certain other information contained in this presentation has been prepared by third-party sources, which information has not been independently audited or verified by the Company. No
representation or warranty, express or implied, is made by the Company as to the accuracy or completeness of the information contained in this document, and nothing contained in this presentation
is, or shall be relied upon as, a promise or representation by the Company.
• Certain type curves referred to in this presentation represent estimates of the production decline and ultimate volumes expected to be recovered from wells over the life of the well. The type curves
disclosed herein are management-generated type curves based on a combination of historical performance of older wells and management's expectation of what might be achieved from future wells.
The type curves represent what management thinks an average well will achieve. Individual wells may be higher or lower but over a larger number of wells management expects the average to come
out to the type curve. Over time type curves can and will change based on achieving more production history on older wells or more recent completion information on newer wells.

CAUTIONARY STATEMENTS AND OIL & GAS ADVISORIES cont’d
27
• Finding and Development Costs: Refers to the anticipated full exploration and development costs associated with each barrel of oil equivalent expected to be recovered from a well based on the
type curves and economics presented. F&D are calculated as the sum of development capital (plus the change in future development capital, where indicated) for the period divided by the change in
reserves for the period. The aggregate of the exploration and development costs incurred in the most recent financial year and the change during that year in estimated future development costs
generally will not reflect total finding and development costs related to reserve additions for that year. F&D is utilized by Bengal as Bengal believes it is a metric that demonstrates its capital efficiency
in adding reserves. Readers are cautioned that there is no standardized meaning or calculation for F&D and as a result, Bengal's reported F&D may not be comparable to F&D as reported by other
industry participants. Additionally, F&D may not be a reliable indicator of the future performance of Bengal and future performance may not compare to the performance in previous periods.
• Barrels of Oil Equivalent: When converting natural gas to equivalent barrels of oil, Bengal uses the widely recognized standard of 6 thousand cubic feet (mcf) to one barrel of oil (boe). However, a
boe may be misleading, particularly if used in isolation. A boe conversion ratio of 6 mcf: 1 bbl is based on an energy equivalency conversion method primarily applicable at the burner tip and does not
represent a value equivalency at the wellhead. Given that the value ratio based on the current price of crude oil as compared to natural gas is significantly different from the energy equivalency of 6:1,
utilizing a conversion on a 6:1 basis may be misleading as an indication of value. MMboe means a million barrels of oil equivalent. MMbbls means a million barrels.

CAUTIONARY STATEMENTS AND OIL & GAS ADVISORIES cont’d
28
• IRR: Rate of return. IRR is the discount rate required to arrive at a NPV equal to zero. Rates of return set forth in this document are for illustrative purposes. There is no guarantee that such rates of return
will be achieved in the future.
• Netbacks: Netback is a term that is not defined under International Financial Reporting Standards and is used by Bengal as a supplemental measure in evaluating Bengal’s financial position and
performance. Bengal calculates netbacks as revenues minus royalties and transportation and operation costs.
• Funds Flow from Operations: Funds from operations represents cash from operating activities as presented in the consolidated statement of cash flows and adding back changes in non-cash working
capital and the settlement of decommissioning liabilities. Funds from operations per share is calculated based on the weighted average number of common shares outstanding consistent with the
calculation of net income (loss) per share. Funds from operations is not intended to represent operating profit for the period nor should it be viewed as an alternative to operating profit, net income, cash from
operations or other measures of financial performance calculated in accordance with IFRS. Funds from operations, commonly referred to as cash flow by research analysts, is used to value and compare oil
and gas companies and is frequently included in published research when providing investment recommendations.
• Net Present Value (NPV): Estimates of the net present value of the future net revenue from Bengal's reserves do not represent the fair market value of Bengal's reserves and are based on information for
the Company’s booked locations in respect of which reserves have been assigned as well as analogous public information. The estimates of reserves and future net revenue from individual properties or
wells may not reflect the same confidence level as estimates of reserves and future net revenue for all properties and wells, due to the effects of aggregation.
• Future Oriented Financial Information. This document, in particular the information contained in the slides entitled “Eastern Australia Natural Gas Market”, “Why Gas? Why Now? “,"Queensland – World
Class Gas Economics", “ATP 934 – QI Results & High Graded Trends”, "Cuisinier Development" , “Rapid Growth of LNG Capacity”, “Supply – Demand, East Australia”, and “Eastern Australia Gas Demand
Summary” contains future oriented financial information (FOFI) within the meaning of applicable securities laws. The FOFI has been prepared by Bengal's management to provide an outlook of the
Company's activities and results. The FOFI has been prepared based on a number of assumptions including the assumptions discussed under the heading "Forward-looking Statements" and assumptions
with respect to the costs and expenditures to be incurred by the Company, capital equipment and operating costs, foreign exchange rates, taxation rates for the Company, general and administrative
expenses and the prices to be paid for the Company's production. Management does not have firm commitments for all of the costs, expenditures, prices or other financial assumptions used to prepare the
FOFI or assurance that such operating results will be achieved and, accordingly, the complete financial effects of all of those costs, expenditures, prices and operating results are not objectively
determinable. The actual results of operations of the Company and the resulting financial results will likely vary from the amounts set forth in the analysis presented in this document, and such variation may
be material. The Company and its management believe that the FOFI has been prepared on a reasonable basis, reflecting management's best estimates and judgments. However, because this information
is highly subjective and subject to numerous risks including the risks discussed under the heading "Forward-looking Statements", it should not be relied on as necessarily indicative of future results. Except
as required by applicable securities laws, Bengal undertakes no obligation to update such FOFI and forward-looking statements and information.
• This presentation is provided for informational purposes only as of September 20, 2017 is not complete, and may not contain certain material information about Bengal, including important disclosures and
risk factors associated with an investment in Bengal. This presentation does not take into account the particular investment objectives or financial circumstances of any specific person who may receive it
and does not constitute an offer to sell or a solicitation of an offer to buy any security in Canada, the United States or any other jurisdiction. The contents of this presentation have not been approved or
disapproved by any securities commission or regulatory authority in Canada, the United States or any other jurisdiction, and Bengal expressly disclaims any duty on Bengal to make disclosure or any filings
with any securities commission or regulatory authority, beyond that imposed by applicable laws.
Related Documents