www.oecd.org/eco/surveys/economic-survey-australia.htm Follow us : OECD OECD Economics 2014 OECD ECONOMIC SURVEY OF AUSTRALIA CHARTBOOK: BASIC STATISTICS This chartbook compares Australia to other OECD countries

Australia compare-to-oecd-economies
Jul 14, 2015
Welcome message from author
This document is posted to help you gain knowledge. Please leave a comment to let me know what you think about it! Share it to your friends and learn new things together.
Transcript

www.oecd.org/eco/surveys/economic-survey-australia.htm Follow us :
OECD OECD Economics
2014 OECD ECONOMIC SURVEY OF AUSTRALIA
CHARTBOOK: BASIC STATISTICS This chartbook compares Australia to other OECD countries
Presenter
Presentation Notes
Slide 1: I crafted all the bullet points by combining the titles of key recommendations to make sentences.
LIVING STANDARDS, EQUALITY AND POPULATION
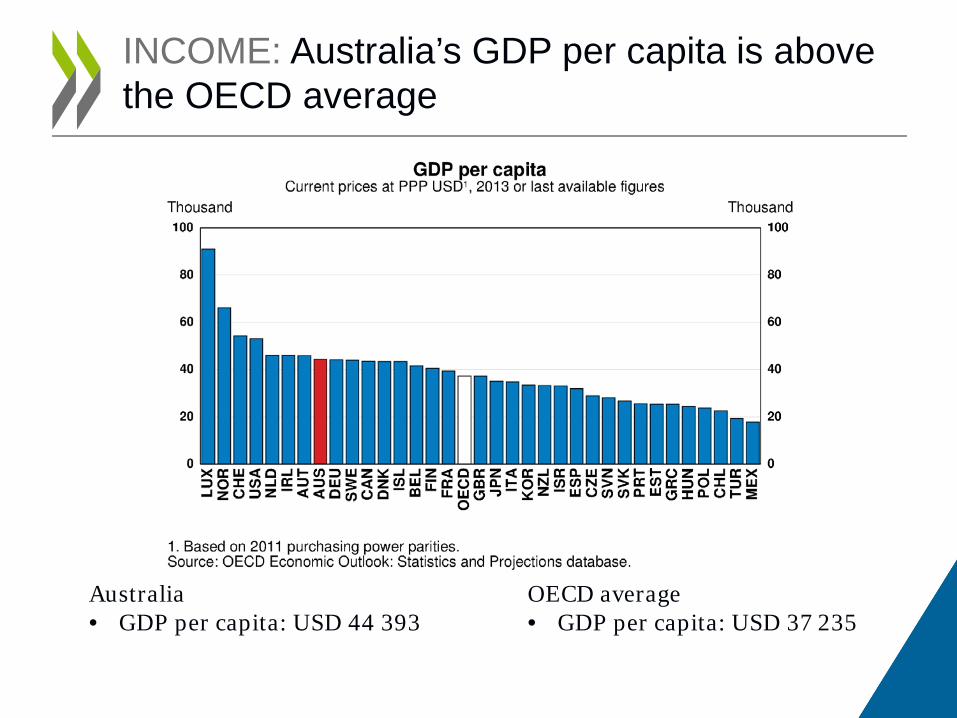
INCOME: Australia’s GDP per capita is above the OECD average
Australia • GDP per capita: USD 44 393
OECD average • GDP per capita: USD 37 235
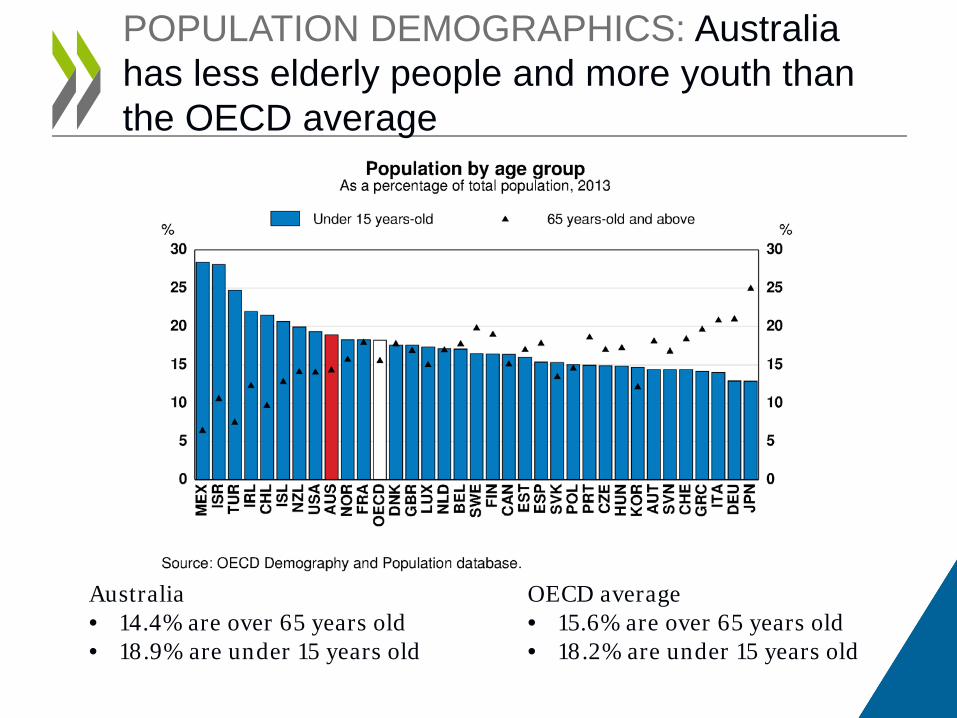
POPULATION DEMOGRAPHICS: Australia has less elderly people and more youth than the OECD average
Australia • 14.4% are over 65 years old • 18.9% are under 15 years old
OECD average • 15.6% are over 65 years old • 18.2% are under 15 years old
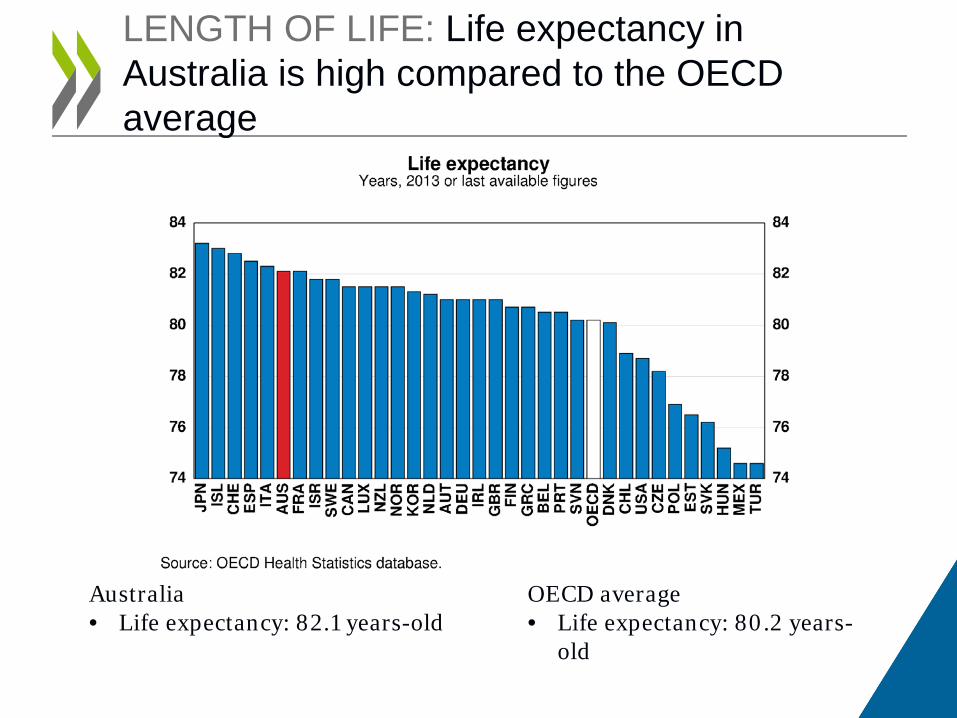
LENGTH OF LIFE: Life expectancy in Australia is high compared to the OECD average
Australia • Life expectancy: 82.1 years-old
OECD average • Life expectancy: 80.2 years-
old
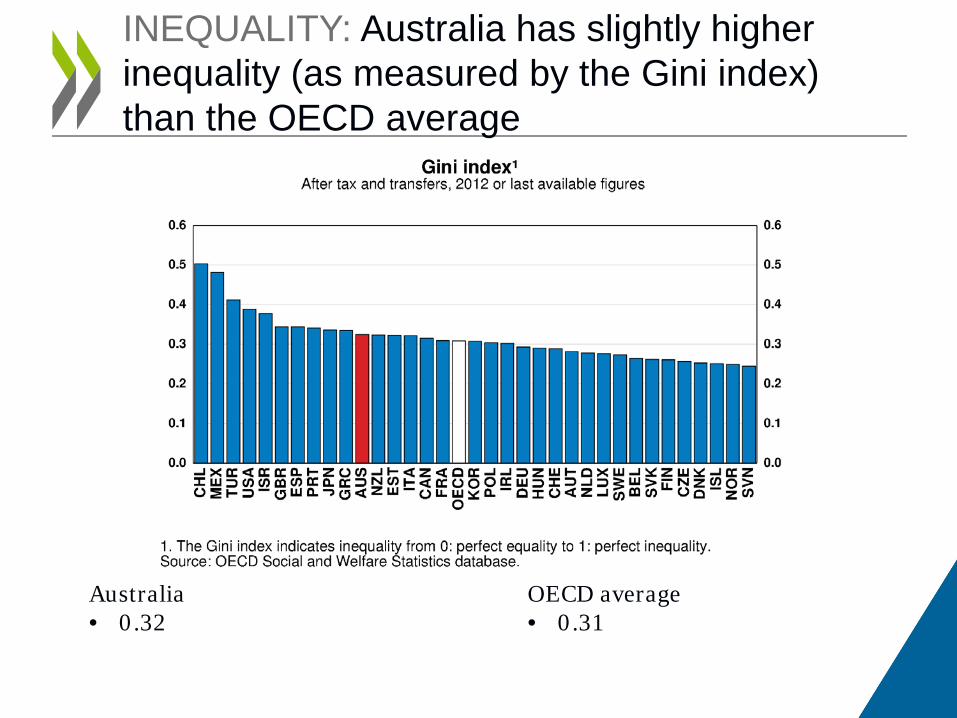
INEQUALITY: Australia has slightly higher inequality (as measured by the Gini index) than the OECD average
Australia • 0.32
OECD average • 0.31

WOMEN IN GOVERNMENT: In Australia, women represent a slightly higher share of parliament than in most OECD countries
Australia • 30% of women in Parliament
OECD average • 27% of women in Parliament

OUTPUT GROWTH AND THE BUSINESS CYCLE
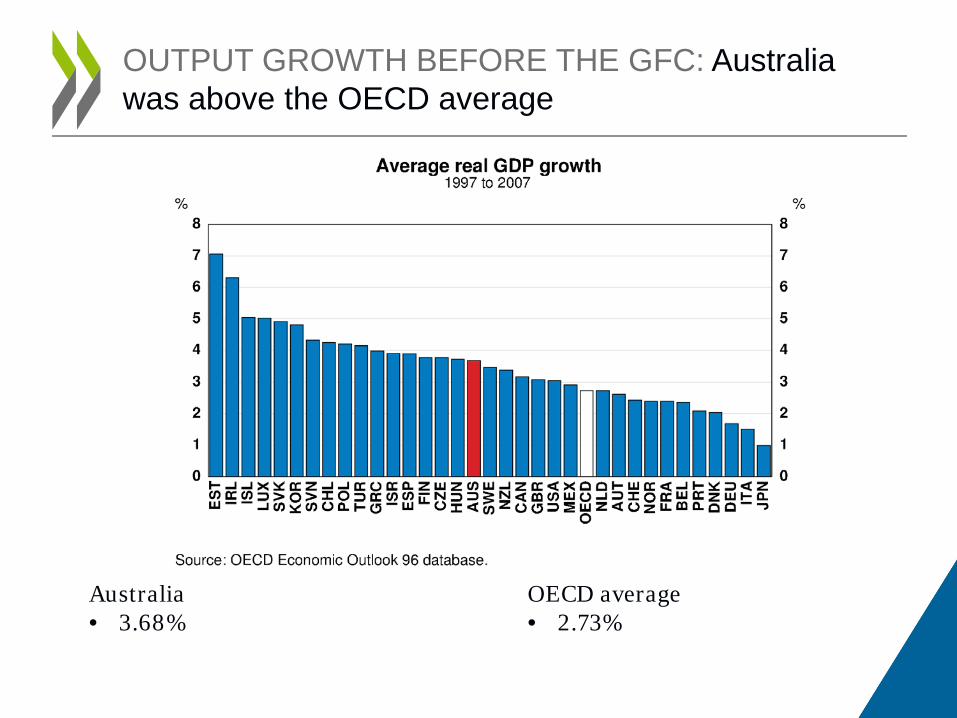
OUTPUT GROWTH BEFORE THE GFC: Australia was above the OECD average
Australia • 3.68%
OECD average • 2.73%

OUTPUT GROWTH SINCE THE GFC: Australia has remained above the OECD average
Australia • 2.48%
OECD average • 0.84%

PROJECTED OUTPUT GROWTH : Australia is projected to remain above the OECD average
OECD average • 2.43%
Australia • 2.72%
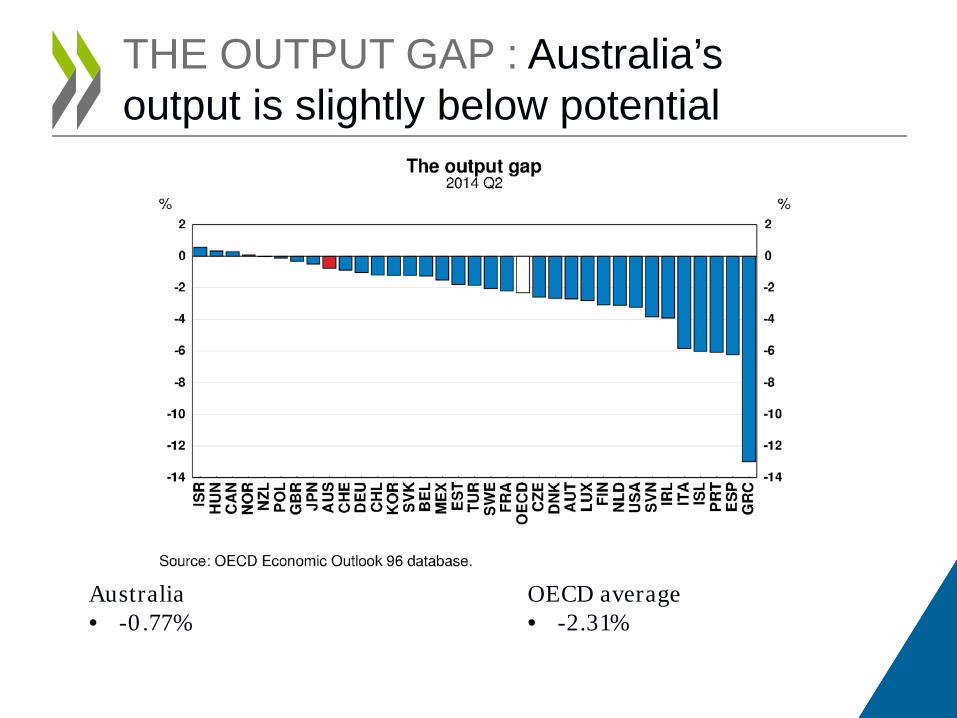
THE OUTPUT GAP : Australia’s output is slightly below potential
Australia • -0.77%
OECD average • -2.31%
INFLATION AND INTEREST RATES

INFLATION : Consumer prices in Australia have been rising faster than in most OECD countries
Australia • 3.01%
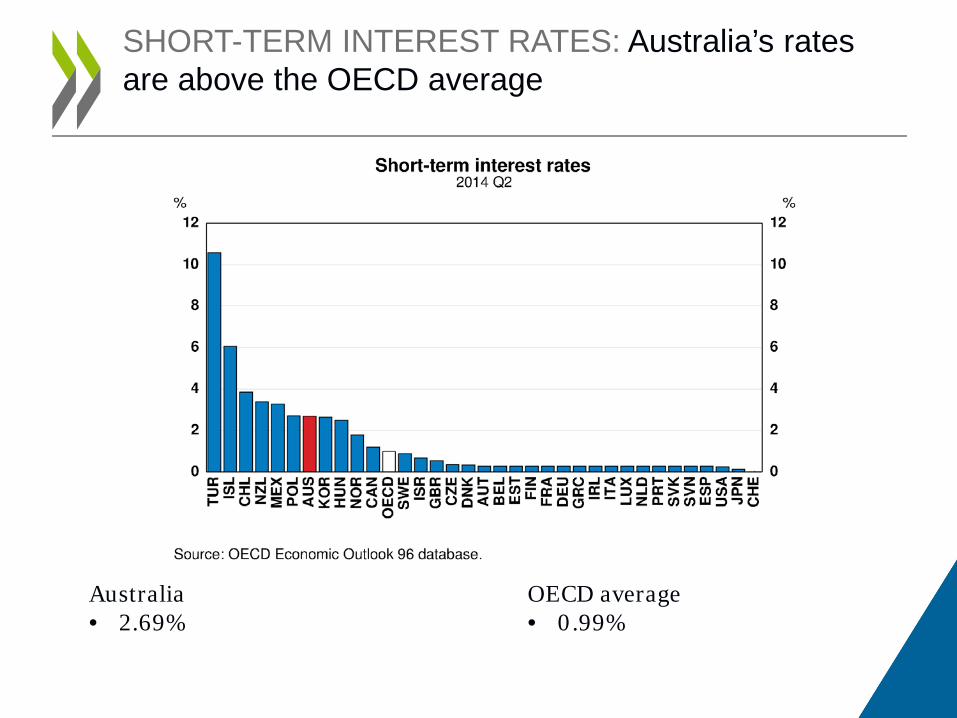
SHORT-TERM INTEREST RATES: Australia’s rates are above the OECD average
OECD average • 0.99%
Australia • 2.69%

LONG-TERM INTEREST RATES: Australia’s rates are above than in most OECD countries
Australia • 3.84%

FISCAL BALANCES
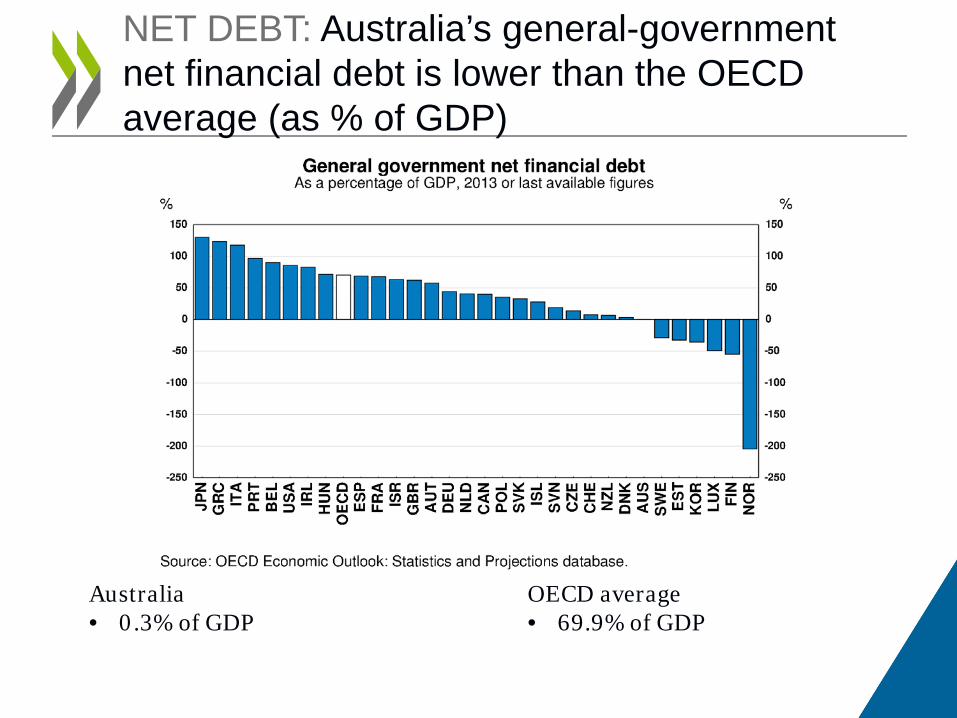
NET DEBT: Australia’s general-government net financial debt is lower than the OECD average (as % of GDP)
Australia • 0.3% of GDP
OECD average • 69.9% of GDP

GROSS DEBT: Australia’s general-government gross financial debt is lower than in most OECD countries (as % of GDP)
Australia • 33.06% of GDP
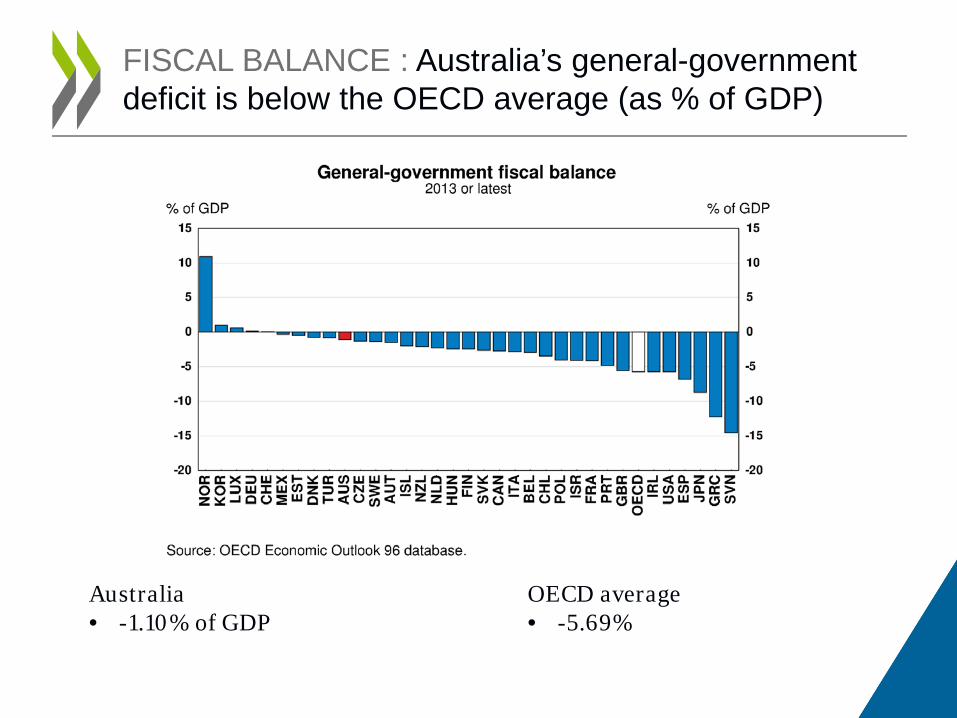
FISCAL BALANCE : Australia’s general-government deficit is below the OECD average (as % of GDP)
OECD average • -5.69%
Australia • -1.10% of GDP

BUSINESS ENVIRONMENT
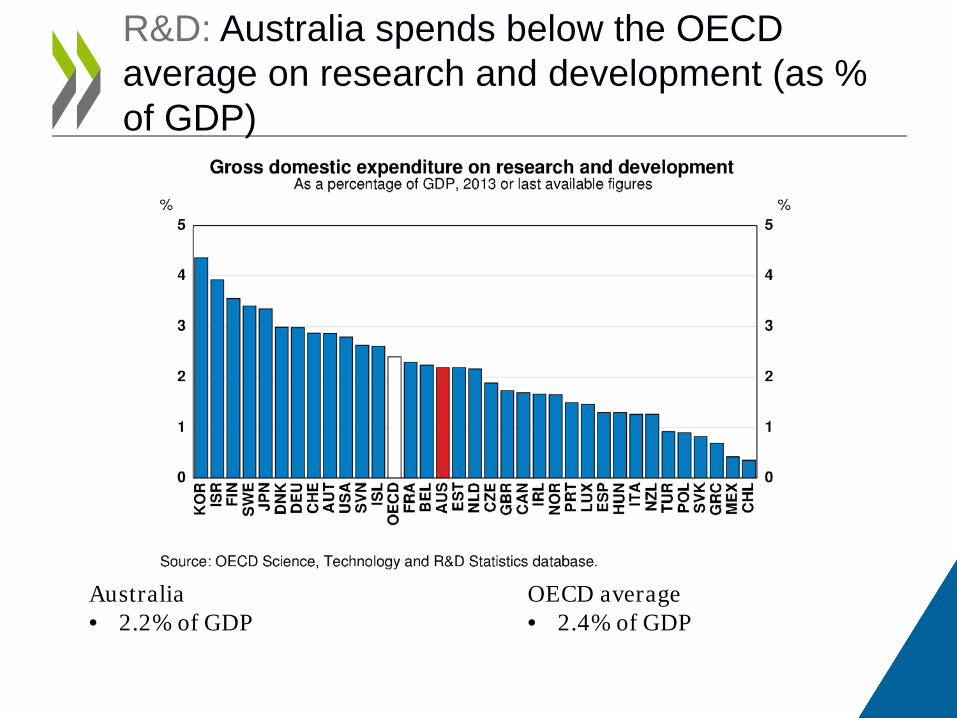
R&D: Australia spends below the OECD average on research and development (as % of GDP)
Australia • 2.2% of GDP
OECD average • 2.4% of GDP

PRODUCT MARKET REGULATION: Australia’s regulation is comparatively light
Australia • 1.29% of GDP

LABOUR MARKET
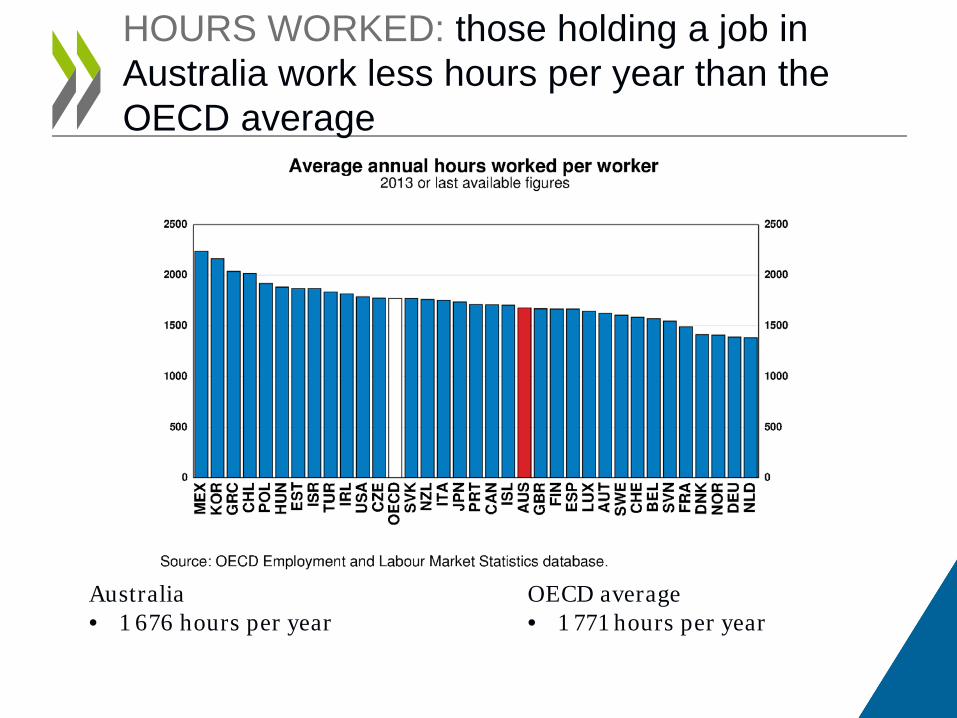
HOURS WORKED: those holding a job in Australia work less hours per year than the OECD average
Australia • 1 676 hours per year
OECD average • 1 771 hours per year

EMPLOYMENT: Australia’s employment rates for women and men are above the OECD average.
Australia • Women: 66.4% • Men: 77.6%
OECD average • Women: 57.4% • Men: 73.1%

UNEMPLOYMENT: Australia has a lower unemployment rate than the OECD average
Australia • 5.7%
OECD average • 7.8%

UNEMPLOYMENT: Australia has a lower youth unemployment rate than the OECD average
Australia • 12.2%
OECD average • 16.1%

EDUCATION, HEALTH CARE, PENSIONS
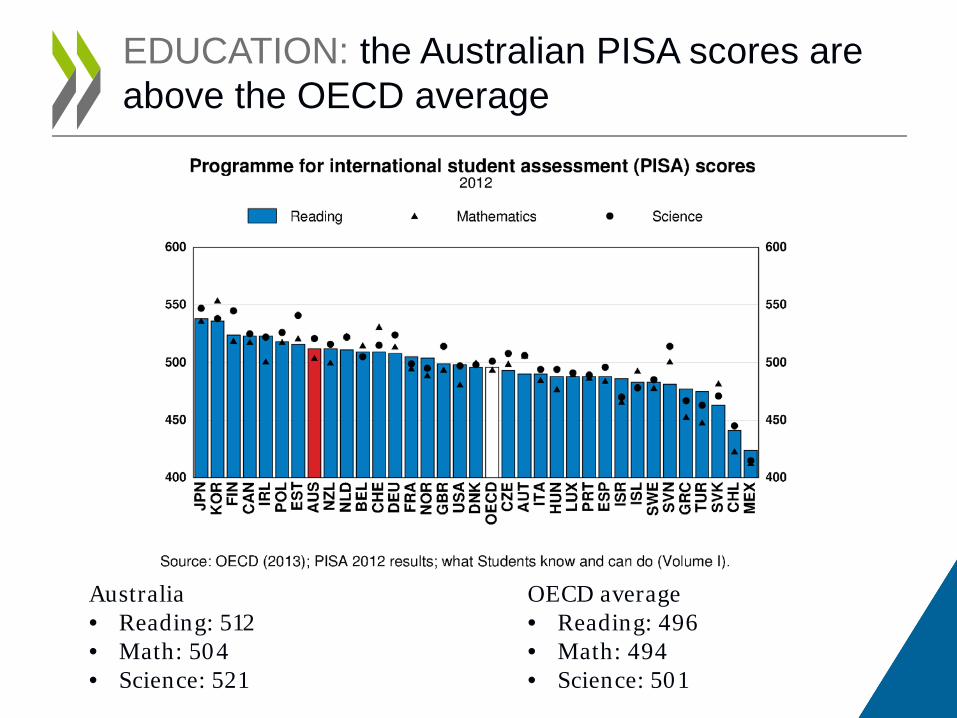
EDUCATION: the Australian PISA scores are above the OECD average
Australia • Reading: 512 • Math: 504 • Science: 521
OECD average • Reading: 496 • Math: 494 • Science: 501
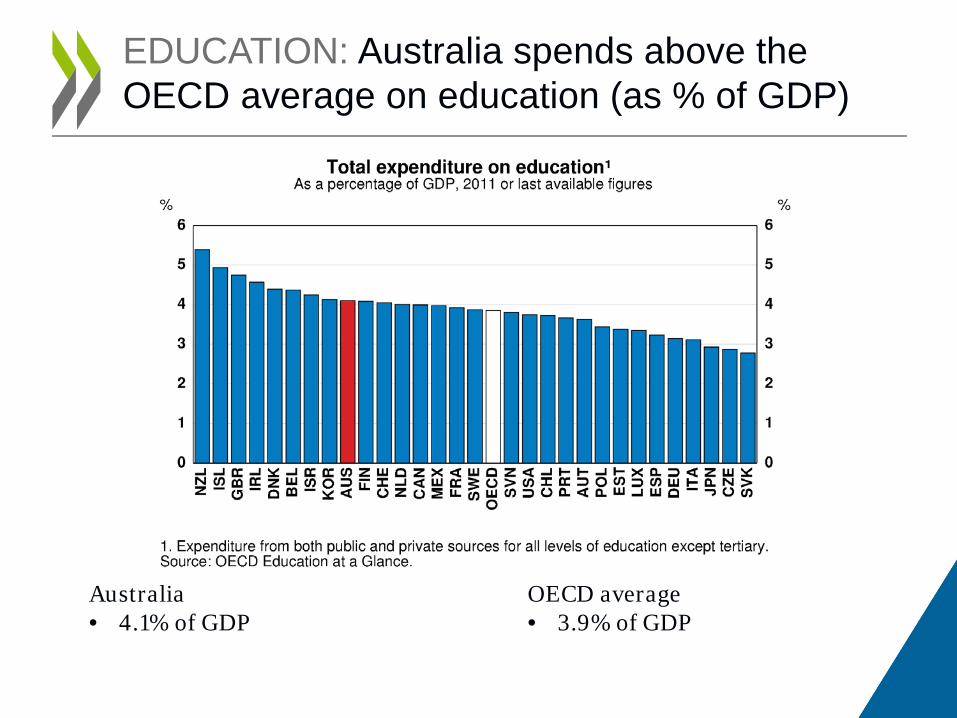
EDUCATION: Australia spends above the OECD average on education (as % of GDP)
Australia • 4.1% of GDP
OECD average • 3.9% of GDP
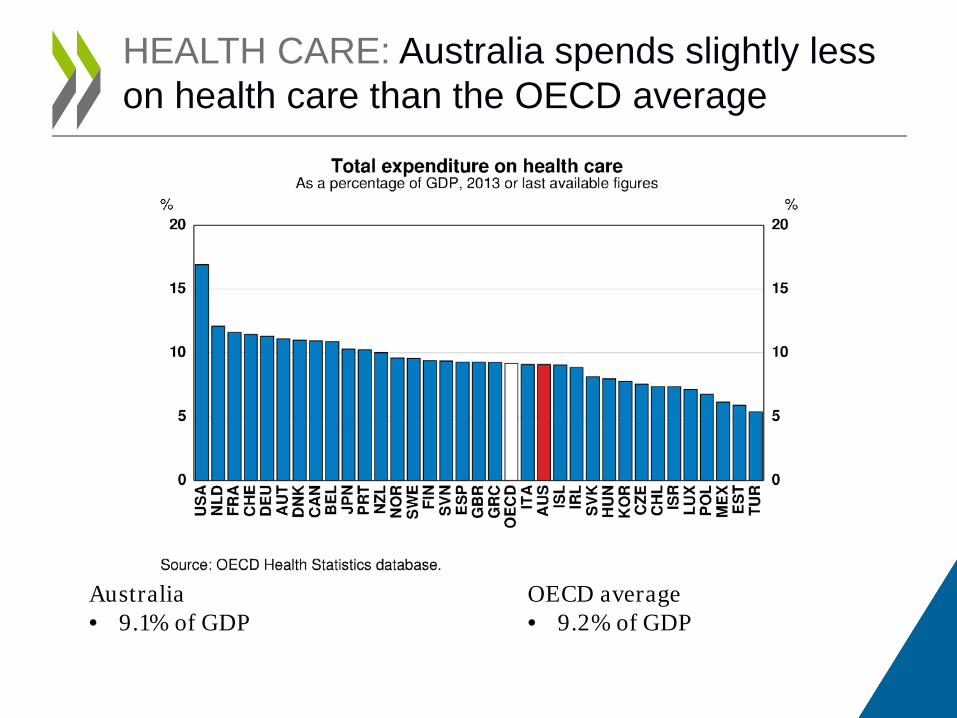
HEALTH CARE: Australia spends slightly less on health care than the OECD average
Australia • 9.1% of GDP
OECD average • 9.2% of GDP
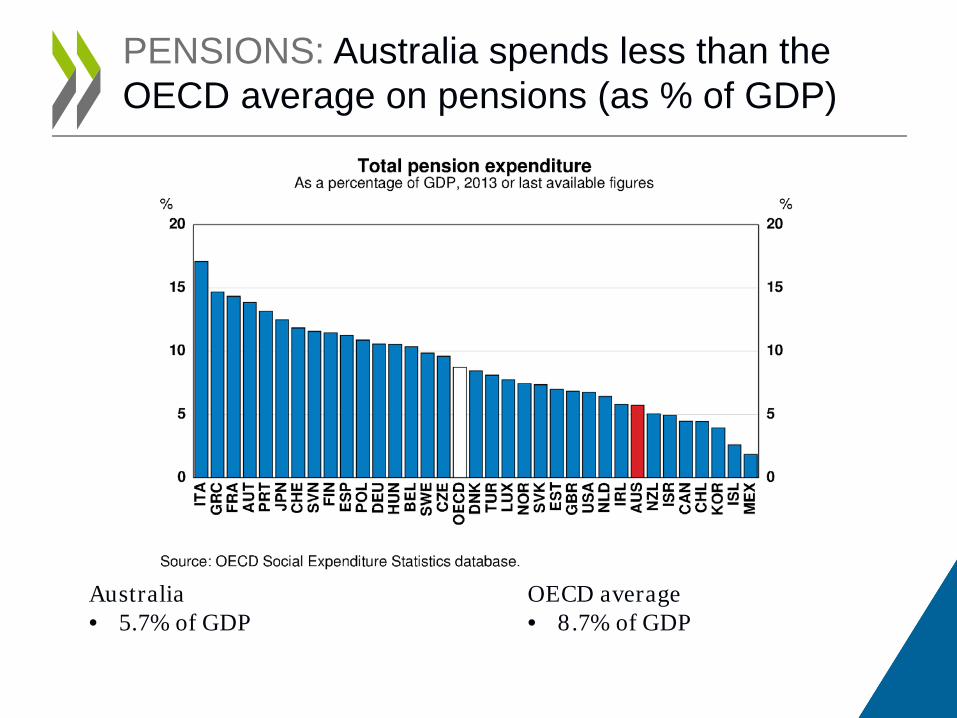
PENSIONS: Australia spends less than the OECD average on pensions (as % of GDP)
Australia • 5.7% of GDP
OECD average • 8.7% of GDP

ENVIRONMENT

ENVIRONMENT: Australia’s CO2 emissions per capita from fossil fuel combustion are higher than in most OECD countries
Australia • 18 tonnes of CO2
OECD average • 11 tonnes of CO2
List of country abbreviations
JPN Japan KOR Korea LUX Luxembourg MEX Mexico NLD Netherlands NZL New Zealand NOR Norway POL Poland PRT Portugal SVK Slovak Republic SVN Slovenia ESP Spain SWE Sweden CHE Switzerland TUR Turkey GBR United Kingdom USA United States OECD OECD average
AUS Australia AUT Austria BEL Belgium CAN Canada CHL Chile CZE Czech Republic DNK Denmark EST Estonia FIN Finland FRA France DEU Germany GRC Greece HUN Hungary ISL Iceland IRL Ireland ISR Israel ITA Italy JPN Japan

More Information…
Compare your country data visualization tool
OECD Economic Surveys: United States 2014
• Read this publication
• Website with additional information
www.oecd.org/eco/surveys/economic-survey-australia.htm
OECD OECD Economics
Disclaimers: The statistical data for Israel are supplied by and under the responsibility of the relevant Israeli authorities. The use of such data by the OECD is without prejudice to the status of the Golan Heights, East Jerusalem and Israeli settlements in the West Bank under the terms of international law. This document and any map included herein are without prejudice to the status of or sovereignty over any territory, to the delimitation of international frontiers and boundaries and to the name of any territory, city or area.
Related Documents