aus dem Fachbereich Geowissenschaften der Universität Bremen Nr.51 BleiI, U., M. Breitzke, K. Däumler, L. Dittert, J. Ewert, K. Gohl, B. Heesemann, W.-D. Heinitz, P. Helmke, H. Keil, T. Merkei, B. Pioch, F. Pototzki, U. Rosiak, R. Schneider, T. Schwenk, V. Spieß, G. Uenzelmann-Neben BERICHT UND ERSTE ERGEBNISSE DER SONNE-FAHRT SO 86 BUENOS AIRES - KAPSTADT, 22.4.1993 - 31.5.1993 REPORT AND PRELIMINARY RESULTS OF SONNE CRUISE SO 86 BUENOS AIRES - CAPETOWN, 22.4.1993 - 31.5.1993 Berichte, Fachbereich Geowissenschaften, Universität Bremen, Nr. 51, 116 S., 58 Abb., 7 Tab., Bremen 1994. ISSN 0931-0800

Welcome message from author
This document is posted to help you gain knowledge. Please leave a comment to let me know what you think about it! Share it to your friends and learn new things together.
Transcript

aus dem Fachbereich Geowissenschaftender Universität Bremen
Nr.51
BleiI, U., M. Breitzke, K. Däumler, L. Dittert, J. Ewert,
K. Gohl, B. Heesemann, W.-D. Heinitz, P. Helmke, H. Keil,
T. Merkei, B. Pioch, F. Pototzki, U. Rosiak, R. Schneider,
T. Schwenk, V. Spieß, G. Uenzelmann-Neben
BERICHT UND ERSTE ERGEBNISSE DER SONNE-FAHRT SO 86
BUENOS AIRES - KAPSTADT, 22.4.1993 - 31.5.1993
REPORT AND PRELIMINARY RESULTS OF SONNE CRUISE SO 86
BUENOS AIRES - CAPETOWN, 22.4.1993 - 31.5.1993
Berichte, Fachbereich Geowissenschaften, Universität Bremen, Nr. 51,
116 S., 58 Abb., 7 Tab., Bremen 1994.
ISSN 0931-0800

Die "Berichte aus dem Fachbereich Geowissenschaften" werden in unregelmäßigen
Abständen vom Fachbereich 5, Universität Bremen, herausgegeben.
Sie dienen der Veröffentlichung von Forschungsarbeiten, Doktorarbeiten und
wissenschaftlichen Beiträgen, die im Fachbereich angefertigt wurden.
Die Berichte können beim:
Fachbereich 5 Geowissenschaften
Universität Bremen
Klagenfurterstr.
28334 BREMEN
Telefon: (0421) 218-4124
Telefax: (0421) 218-3116
angefordert werden.
Zitat:
BleU, U., M. Breitzke, K. Däumler, L. Dittert, J. Ewert,
K. Gohl, B. Heesemann, W-D. Heinitz, P. Helmke, H. Keil,
T. Merkei, B. Pioch, F. Pototzki, U. Rosiak, R. Schneider,
T. Schwenk, V. Spieß, G. Uenzelmann-Neben
Bericht und erste Ergebnisse der SONNE-Fahrt SO 86, Buenos Aires - Kapstadt, 22.4.1993
31.5.1993.
Report and Preliminary Results of SONNE Cruise SO 86, Buenos Aires - Capetown, 22.4.1993
31.5.1993.
Bremen, Nr. 51, 116 S., 58 Abb., 7 Tab., Bremen 1995.
ISSN 0931-0800

Table of Contents
Page
1 Participants 3
2 Research Program 4
3 Narrative of the Cruise 5
4 Underway Geophysics 9
4.1 Data Acquisition 9
4.2 On Board Data Processing 9
4.3 Congo Fan Area 15
4.3.1 Introduction 15
4.3.2 Strategy of Site Survey 16
4.3.3 Bathymetry 16
4.3.4 Seismostratigraphy 19
4.3.5 PARASOUND Acoustostratigraphy 23
4.3.6 Proposed Drill Sites in the Congo Fan Area 26
4.4 Angola Diapir Field at 12°S 35
4.4.1 Introduction 35
4.4.2 Strategy of Site Survey 36
4.4.3 Bathymetry 36
4.4.4 Seismostratigraphy 36
4.4.5 PARASOUND Acoustostratigraphy 42
4.4.6 Proposed Drill Sites 42
4.5 Namibia - Angola Upwelling at 17°S 52
4.5.1 Introduction 52
4.5.2 Strategy of Site Survey 52
4.5.3 Bathymetry 52

2
4.5.4 PARASOUND Acoustostratigraphy 55
4.5.5 Seismostratigraphy and Proposed Drill Sites 55
4.6 Additional Seismic Surveys 60
5 Sediment Sampling 63
5.1 Multicorer 63
5.2 Gravity Corer 66
5.3 Sediment Pattern 66
5.4 Physical Properties Studies 82
5.4.1 Introduction 82
5.4.2 Physical Background and Experimental Techniques 82
5.4.2 Shipboard Results 87
5.5 Accelerator Monitored Coring 104
5.5.1 Introduction 104
5.5.2 Measuring System 105
5.5.3 Shipboard Results 105
6 Hydroacoustic System Development with the SEL-90 Echosounder 108
7 Plankton Sampling 110
8 References 113
9 Acknowledgements 116

3
1 Participants
Name
Bleil, Ulrich, Prof. Dr. (Chief Scientist)Breitzke, Monika, Dr.Däumler, Katharina, StudentDittert, Lars, StudentEwert, Jörn, Dipl.-Ing.Gohl, Karsten, Dr.Heesemann, Bernd, Dipl.-Ing.Heinitz, Wolf-Dieter, Dr.Helmke, Peer, StudentKeil, Hanno, StudentMerkei, Tobias, StudentPioch, Bernd, TechnicianPototzki, Frank, TechnicianRosiak, Uwe, TechnicianSchneider, Ralph, Dr.Schwenk, Tilmann, StudentSpieß, Volkhard, Dr.Uenzelmann-Neben, Gabriele, Dr.
Discipline
GeophysicsGeophysicsGeophysicsGeologyGeoacousticsGeophysicsMarine TechnologyGeoacousticsGeologyGeophysicsGeoacousticsGeophysicsGeophysicsGeophysicsGeologyGeophysicsGeophysicsGeophysics
Institution
GeoBGeoBGeoBGeoBINIRAWIGeoBINIRGeoBGeoBIN IRGeoBGeoBGeoBGeoBGeoBGeoBAWI
AWI Alfred-Wegener-Institut für Polar- und MeeresforschungColumbus Straße, 27568 Bremerhaven / FRG
GeoB Fachbereich GeowissenschaftenUniversität BremenKlagenfurter Straße, 28359 Bremen / FRG
INIR Institut für Nachrichtentechnik und InformationselektronikUniversität RostockRichard Wagner Straße, 18119 Warnemünde / FRG

4
2 Research Program
The eastern South Atlantic is still poorly eovered by Deep Sea Drilling Praject (DSDP)and Ocean Drilling Pragram (ODP) drill holes at present. Only DSDP Sites 364 and 365on the southwest African continental margin off Angola and several sites in the WalvisRidge area have been studied in greater detail. High resolution information remainssparse however for the Cenozoic and in partieular the Neogene sedimentation historyof the region. Modern high quality coring teehniques have not yet been applied anddata sets relevant to analyse the development and variability of the Benguela CurrentSystem since Miocene times remain fragmentary.
The pre-site survey cruise SO 86 with RjV SONNE was primarily projected to collectseismic and echographie data fram three different areas which have been identified asadequate drilling targets for a paleoeeanographic reconstruetion of the BenguelaCurrent and Upwelling Systems.
The first area is located between 4 and 70 S off the mouth of the Congo River whichis the second largest river of the world with respeet to water discharge. Thedepositional regime is eharacterized by a signifieant sediment influx from the continentmost of which finds its way through the unique Congo Canyon directly into the deepsea. The canyon opens already several kilometers inshore and guides almost all of thecoarser grained sedimentary components into a narrow and in some sections morethan 1000 m deep channel which opens into the Congo Cone in water depths greaterthan 2500 m. There, typical fan deposits and channeljlevee systems associated withmore or less chaoti6 sedimentary structures are found.
The hemipelagic input mainly originates fram river transported, fine grainedsuspended material and a related high biologie productivity. The latter results in asignificant flux of organie matter to the sea floar. Calcareous micrafossils are only aminor constituent, while the biosiliceous fraetion is of the same order as theterrigenous clay sedimentation. The Benguela Current System in combination withupwelling processes caused by the regional wind pattern eontrals the distribution andaccumulation of the pelagic components which therefore are useful indicators for thedevelopment and intensity of the current system.
The second working area in the Angola Diapir Field at about 12°S represents thetypical depositional regime at a continental margin with anormal terrigenous input andminor coastal upwelling, but relatively high oeeanic productivity influenced by theBenguela Current. Available evidenee fram several gravity cores indicates a betterpreservation of organic matter than in the more southern Namibia Upwelling Systemcontributing to relatively high late Quaternary sedimentation rates of up to 4 cmjkyr.The regional basement structure is charaeterized by a ritt basin which developedduring the early opening phase of the South Atlantie and filled with Aptian and Albian

5
evaporites of several hundred meters thickness. Since then, vertical movement of thesalt and associated tectonism has featured the regional morphology and largelyinfluenced the sedimentation pattern.
The third area is located between the Angola Diapir Field and the Walvis Ridge at17°S. Any relict of a rift basin is absent here and the continental margin rather narraw,therefore. Due to an intense current activity on the shelf and the steepness of thecontinental slope, gravitational sediment transport by slides, debris flows and turbiditycurrents to a large extent dominates the sedimentary regime. Although the rate ofpelagic sedimentation is rather high in this northernmost part of the Angola/NamibiaUpwelling Cell, only a few piaces could be identified with an undisturbed sedimentpattern. The morphology is further complicated by sediment tectonism and giantsediment slides.
Complementary to a recording of the sediment structures with high resolutionseismic techniques, a second objective of SONNE Cruise 86 was to recover sedimentsampies fram the sea floor in the different working areas with a multicorer and a gravitycorer. After preliminary analyses and measurements on board, their detailedmicropaleontological, geochemical, geophysical and isotopic characteristics will bedetermined subsequently to the cruise in shore based laboratories. These materialsare also to supplement the core collection of the long-term prajectSonderforschungsbereich 261 at Bremen University aimed at reconstructing the massbudget and current systems of the South Atlantic during the late Quaternary.
3 Narrative of the Cruise
The German Research Vessel SONNE departed Buenos Aires, Argentina, according toschedule on Thursday, 22 April 1993 at 11 a.m. local time beginning its 86th cruise.The scientific crew on board included 12 geophysicists and 3 geologists from theGeoscience Department of Bremen University and the Alfred-Wegener-Institute forPolar and Marine Research, Bremerhaven. It was completed by 3 colleagues fram theInstitute for Telecommunication Engineering and Information Electranics at RostockUniversity. The planned participation of a guest scientist fram the Republic of Congowas ultimately cancelled.
Financial support for cruise SO 86 was pravided by the German Federal Ministeryfor Research and Technology (Bundesministerium für Forschung und Technologie,BMFT) under contract "PROBOSWA" (PROjektstudie für eine geplante Bohrkampagnedes Ocean Drilling Program (ODP) vor SüdWestAfrika) . Main objective was a pre-sitesurvey for the Ocean Drilling Program (OOP) to define aseries of suitable deep drillsites at the southwest African continental margin on basis of high resolution seismicand echographic measurements as weil as the sampling of the sedimentary deposits.

6
These scientific activities are closely related to a long-term interdisciplinary researchprogram of the Geoscience Department at Bremen University aimed at reconstructingthe late Quaternary mass budget and current systems of the South Atlantic (Sonderforschungsbereich 261 sponsored by the German Research Foundation, DFG).
Several German and American groups have been involved in the original planningof a scientific deep drilling project off southwest Africa. Their joint interests focus on theclimatic evolution during Neogene and Quaternary times. Its detailed reconstructionfrom ocean floor sediments is achieved with a wide variety of modern analyticalmethods. The western South Atlantic and in particular the African continental marginare key regions for this purpose. First of all, it documents the variations of a mainlynorth - south directed water mass and heat energy transport system which is of globalimportance as it links both hemispheres. The second feature of direct climaticrelevance are nearshore upwelling and high productivity zones sustained by theprevailing regional wind systems and an upwelling cell induced by the Congo Riverwhose fluvial sediment load additonally reflects changes in vegetation on the Africancontinent.
After leaving the Argentinian waters at the La Plata River mouth, R/V SONNEheaded northeastward along the South American coast (Fig. 1) to enter the harbor ofVit6ria/Brazil on 26 April. During the five hours visit a container with the entiregeophysical laboratory equipment was taken on board which had not been deliveredto Buenos Aires in time. Thanks to a most efficient support by the German Ambassiesat Brasilia and Buenos Aires it was possible to obtain the landing permission to Vit6riaat very short notice. With course to the first working area, the Congo Sediment Fan, weafterwards crossed the South Atlantic enjoying good to excellent weather and seaconditions. A seminar of several days served to prepare for the research activitiesduring this journey.
Beginning at the Brazilian 200 mile zone boundary, a continuous, round-the-clocksurvey with the two shipboard echographie systems PARASOUND and HYDROSWEEP wasestablished which ended only after almost 11.500 km just before reaching the finaldestination of the cruise, Cape Town, South Africa. Both devices proved to beextremely reliable and only a few short failures occurred. Also along most of the cruisetrack a large number of sampies were taken from the surface waters for planktonanalyses.
The seismic survey in the northern part of the Congo Sediment Fan began in theafternoon of 8 May with the lauching of the streamer und the airgun. The initialprogram at about 50 S comprised aseries of profiles of about 300 nm total length. Apreliminary shipboard evalution of the data, which are supplemented by a set of highquality echographie records, suggests various options to define suitable drill sitesdespite widespread intensive salt tectonism. To finish the work in this area, the gravitycorer was used three times in water depths of around 1400, 1800 and 2500 m.

7
(l)....::::lO'li.L
,...
c.oCO(l)(fJ
°5owzzoCI)
o(fJc:o~t:iO'lc:0-ECl3(fJ
Uc:Cl3
.::t:UCl3.........(fJ~O-
:cCI)
0°
40°1'1
30°1'1
60°1'1
'"
j
).... )
\
'"oo01
Uloo01
"C
o....er::
UlooC\J
UloiG
Ulo~
oo
....................1. .....)...... ···I·············:·········l··············,
oo
0°
60°1'1 L--l------t------t----==j=======r"'p0
0
"

8
Recoveries ranging from 14 to 18 m were higher than expeeted. The multieorer, whichwas employed at all stations, also yielded exeellent results. Ouring the night of 13 Maythe activities were then transferred to about rs, south of the Congo Canyon. A lessextended seismic profiling than in the northern area indieated a mueh more complexdepositional regime offering almost no appropriate drilling loeations, though. For thisreason, the originally planned sediment sampling was caneelled.
From 16 to 21 May an extensive seismie and echographie survey was performed inthe large field of salt diapirism at about 12°S off the coast of Angola. In spite of oncemore very pronounced salt tectonies, a seleetion of OOP drill sites should be possiblehere without major problems. As before, the seientists from Rostock Universitysuccessfully used their own eehosounding system in this region along most of thecruise track for a detailed recording of the uppermost sediment struetures. For the firsttime during the seismic measurements a sonobuoy was suecesfully launchedfollowing persistent efforts to repair the reeeiving unit. On 18 and 19 May the profilingprogram was interrupted three times for station work. In most cases optimum resultswere obtained with the multieorer. Although the recoveries of the gravity eorer did notreach the reeord lengths of the northern Congo Sediment Fan, no real failures wereexperienced. A new sensor system, which direetly monitors the eoring process in situ,again operated absolutely perfect and apparently provided most interesting data sets.
On transit to the last major working area of Cruise SO 86 additional sediments weresampled at about 14,5°S in around 3000 m water depth. Seismic profils across theAfrican continental margin at 17°S off Namibia were begun in the early morning of 22May. Although this area has not been affeeted by salt tectonism, the sedimentsequences appear to be largely disturbed due to very steep slopes and related massmovements. Suitable drilling locations could thus only be identified in water depthsbetween about 1900 und 2700 m, were sediments were reeovered at two station withthe multicorer and gravity eorer. A further intensive seareh for alternative drill sites bothin shallower and deeper waters unfortunately had no striking sueeess.
After 25 May seismie profiles were positioned over Sites 530 and 532 in the WalvisRidge area which have been oecupied 1980 by the former Deep Sea Drilling Projeet(DSDP). The results obtained from these holes should provide important elues for aquantitative acoustostratigraphic interpretation of the present seismic data sets.Station work of the cruise was terminated in the night of 27 May at elose to 22°S inabout 1000 m water depth. Final seismic profiling near 25°S had to be abandonedbecause of rapitly deteriorating weather and sea states in the afternoon of 28 May. R/VSONNE took course towards Cape Town, South Afriea, reaching port and safelyending Cruise SO 86 in the early morning of 31 May, 1993.

9
4 Underway Geophysics
V. Spieß, U. Bleil, M. Breitzke, K. Gohl, B. Heesemann, H. Keil, B. Pioch,F. Pototzki, U. Rosiak, T. Schwenk, G. Uenzelmann-Neben
4.1 Data Acquisition
The seismic equipment used during Cruise SO 86 consisted of a streamer of 600 mactive length with 24 channels and a group spacing of 25 meters. The source was a GIGUN of 150 in3 total volume with a generator volume of 45 in3. It produces a signal ofbroad spectral bandwidth with maximum frequencies around and above 500 Hz. Thelow frequency bubble signal is suppressed by injection of air from a second chamber.The resulting short wavelet was optimized for highest resolution of the upper fewhundred meters of the sedimentary column. The multichannel data were recorded witha GEOMETRICS ES-2420 at a sampling rate of 0.5 ms and an anti-alias filter of 720 Hz.The recording length varied from 2 to 8 seconds depending on the water depth. Theshot distance was 10 seconds at a ship's speed of 4.9 knots, providing a shot distanceof 25 meters and a CMP distance of 12.5 meters.
Digital data were also recorded with the PARASOUND echosounder system of R/VSONNE which was routinely run with a signal of 4 kHz and 250 J.LS total length. Asound generation based on the parametrie acoustic effect restriets the main lobe to anangle of 4°. The resulting normal incidence seismograms were sampled at a rate of 25J.l.S over a length of 266 ms. The shot interval is discontinuous and depends on thewater depth. After emission of aseries of pulses at 400 ms intervals, the burst isreceived by the echosounder before the next sequence is sent forth. On average, aseismogram is recorded every 1 - 2 seconds providing a spatial resolution on the orderof a few meters on the seismic profiles.
Table 1 summarizes navigation data, length, start and end time of all seismic linesGeoB 93-001 to 93-045. The technical and storage parameters for each profile aregiven in Table 2.
4.2 On Board Data Processing
For an immediate quality control, the data were provisionally processed with a PCbased system on board. After demultiplexing from the original SEG-D tape, the datawere sorted in CMPs of 12.5 m distance according to a shot interval of 10 seconds anda ship's speed of 4.9 knots. To circumvent a velocity analysis at present, a brute stackof the first 4 traces of each CMP was made to reduce the noise and to enhance inparticular the deeper reflectors. Before stacking, the data were filtered with a bandpass filter from 30 to 700 Hz with a slope of 24 db/octave. Although a significant noiselevel is observed at the power line frequency of 50 Hz and all multiples, no sharp notchfilters were applied at this stage.

Table 1 Navigation data, length, start and end time of seismic lines GeoB 93-001 to 93-045.
Profile 8tart of Profile End of Profile Length Date Time Date TimeGeoB Latitude Longitude Latitude Longitude [nm] 8tart 8tart End End93-000 1r 50,7' 8 32° 05,0' W 1r 45,0' 8 31° 51, l' W 15,6 29.04.1993 15:37 29.04.1993 18:56
93-001 05° 29,4' 8 08° 33,3' E 05° 00,9' 8 11°24,9'E 173,2 08.05.1993 14:59 10.05.1993 02:2593-002 04°41,6'8 11° 09,2' E 04° 48,0' 8 09° 50,0' E 79,2 10.05.1993 06:32 10.05.1993 22:4493-003 04° 48,0' 8 09° 49,9' E 05° 07,0' 8 10° 22,0' E 37,2 10.05.1993 23:22 11.05.1993 06:5793-004 05° 07,0' 8 10° 22,0' E 05° 15,0' 8 10° 22,0' E 8,0 11.05.1993 06:57 11.05.1993 08:3393-005 05° 15,0' 8 10° 22,0' E 05° 15,0' 8 10° 25,8' E 3,8 11.05.1993 08:33 11.05.1993 09:2293-006 05° 15,0' 8 10° 25,8' E 04° 42,4' 8 10° 25,3' E 32,6 11.05.1993 09:22 11.05.1993 16:0093-007 04° 42,4' 8 10° 25,3' E 05°11,9'8 10° 56,4' E 42,8 11.05.1993 16:00 12.05.1993 00:4893-008 05°11,9'8 10° 56,4' E 05° 09,0' 8 11°06,2'E 10,2 12.05.1993 00:48 12.05.1993 02:5593-009 05° 09,0' S 11° 06,2' E 05° 00,0' 8 11° 06,4' E 9,0 12.05.1993 02:45 12.05.1993 04:45
93-010 06° 42,2' 8 10° 45,6' E 07° 05,0' 8 10° 10,0' E 42,1 13.05.1993 10:13 13.05.1993 18:4693-011 or 05,0' 8 10° 10,0' E or 05,0' 8 11° 30,0' E 79,4 13.05.1993 19:10 14.05.1993 11:2393-012 or 05,0' S 11°30,0'E 06° 40,0' 8 11°15,O'E 29,1 14.05.1993 11:47 14.05.1993 17:4193-013 06° 40,0' S 11° 15,0' E or 50,0' 8 10° 10,0' E 95,2 14.05.1993 18:04 15.05.1993 13:27
93-014 11° 01,8' 8 12° 28,3' E 12° 07,3' 8 11°27,4'E 88,6 16.05.1993 10:38 17.05.1993 04:4293-015 12° 07,3' S 11° 27,4' E 11° 54,6' 8 13° 30,0' E 120,6 17.05.1993 04:42 18.05.1993 05:2893-016 11° 54,6' S 13° 30,0' E 12° 06,4' 8 13° 24,8' E 12,8 18.05.1993 06:00 18.05.1993 08:3493-017 12° 06,4' 8 13° 24,8' E 12° 22,3' S 12° 30,0' E 55,9 18.05.1993 08:34 18.05.1993 20:18
93-018 11°51,6'8 13° 21,8' E 12° 01,5' 8 13° 21,8' E 9,9 19.05.1993 13:01 19.05.1993 15:0293-019 12° 01,5' S 13° 22,4' E 12° 01,5' 8 13° 19,0' E 3,3 19.05.1993 16:08 19.05.1993 16:47
93-020 12° 01,5' 8 13° 19,0' E 11°51,8'8 13° 19,0' E 9,7 19.05.1993 16:47 19.05.1993 18:44
93-021 11° 51,8' 8 13° 19,0' E 11° 52,9' S 13° 07,0' E 11,8 19.05.1993 18:44 19.05.1993 21:09
93-022 11° 52,9' S 13° 07,0' E 12° 02,8' S 13° 07,0' E 9,9 19.05.1993 21:09 19.05.1993 23:10
93-023 12° 02,8' 8 13° 07,0' E 12° 02,8' S 13° 02,0' E 4,9 19.05.1993 23:10 20.05.1993 00:1593-024 12° 02,8' S 13° 02,0' E 11°51,5'8 13° 02,0' E 11,3 20.05.1993 00:15 20.05.1993 02:34
......o

Table 1 continued
Profile 8tart of Profile End of profile Length Date Time Date TimeGeoB Latitude Longitude Latitude Longitude [nml 8tart 8tart End End
93-025 11°51,5'8 13° 02,0' E 11° 52,0' 8 12° 56,7' E 5,2 20.05.1993 02:34 20.05.1993 03:4193-026 11° 52,0' 8 12° 56,7' E 12° 03,9' 8 12° 56,3' E 11,9 20.05.1993 03:41 20.05.1993 06:1093-027 12° 03,9' 8 12° 56,3' E 12° 03,9' S 12° 53,2' E 3,0 20.05.1993 06:10 20.05.1993 06:4793-028 12° 03,9' 8 12° 53,2' E 11° 54,4' 8 12°53,1'E 9,5 20.05.1993 06:47 20.05.1993 08:4593-029 11° 54,4' 8 12° 53, l' E 13° 00,0' 8 11° 30,0' E 104,3 20.05.1993 09:28 21.05.1993 06:43
93-030 16° 15,5' 8 10° 26,0' E 1]0 03,2' 8 11°27,4'E 75,4 22.05.1993 06:28 22.05.1993 21:5293-031 1]0 06,5' 8 11° 27,3' E 1]0 11,8' 8 100 51,1'E 35,0 22.05.1993 22:34 23.05.1993 05:4093-032 1]011,7'8 10° 50,5' E 16° 45, l' S 10° 15,1' E 43,1 23.05.1993 05:48 23.05.1993 14:3593-033 16° 45, l' S 10° 15, l' E 16° 31,6' 8 10° 55,9' E 41,4 23.05.1993 14:35 23.05.1993 23:0693-034 16° 31,6' 8 10° 55,9' E 16° 45,9' S 10° 56,0' E 14,3 23.05.1993 23:06 24.05.1993 02:0393-035 16° 45,9' 8 10° 56,0' E 16° 55,0' S 11°07,O'E 13,9 24.05.1993 02:03 24.05.1993 04:5393-036 19° 05, l' 8 09° 25,9' E 19° 15,9' 8 09° 21,0' E 11,7 25.05.1993 06:12 25.05.1993 08:3493-037 19° 15,9' S 09° 21,0' E 19° 13,4' S 09° 15, l' E 6,1 25.05.1993 08:34 25.05.1993 09:5093-038 19° 13,4' S 09° 15, l' E 19° 08,9' S 09° 17,9' E 5,2 25.05.1993 09:50 25.05.1993 10:5493-039 19° 08,9' 8 09° 17,9' E 19° 47,4' S 10° 36,6' E 83,6 25.05.1993 10:54 26.05.1993 04:0393-040 19° 47,4' 8 10° 36,6' E 19° 42,3' S 10° 39,7' E 5,9 26.05.1993 04:03 26.05.1993 05:1593-041 19° 42,3' S 10° 39,7' E 19° 39, l' S 10° 33,3' E 6,8 26.05.1993 05:15 26.05.1993 06:4093-042 19° 39, l' 8 10° 33,3' E 19° 56,9' S 10° 26,5' E 18,9 26.05.1993 06:40 26.05.1993 10:32
93-043 24° 49,8' 8 13° 59,9' E 25° 09,9' S 14° 00,0' E 20,1 27.05.1993 20:58 28.05.1993 01:0493-044 25° 09,9' 8 14° 00,0' E 25° 37,0' S 13° 21,0' E 44,4 28.05.1993 01:04 28.05.1993 10:0593-045 25° 37,0' 8 13° 21,0' E 25° 27,5' 8 13° 03,5' E 18,4 28.05.1993 10:05 28.05.1993 13:50
..........

Table2 Technical and storage parameters of seismic reflection profiles GeoB 93-000 (AWI93010) to 93-045(AWI 93082).
Profile Profile Lead-in Channel Group Record Length Sampie Rate Shot Interval Delay Field-Tape RemarksGeoB AWI fml [m] fsl rmsl fsl fsl No.93-000 93010 24+3 25 6 0,25 12 0 001-008 streamer test93-001 93021 194 24+3 25 8 0,5 10 0 009-092
194 24+3 25 6 0,5 10 0 092-107194 24+3 25 4 0,5 10 0 107-112
93-002 93022 194 24+3 25 4 0,5 10 0 113-117194 24+3 25 6 0,5 10 0 118-126194 24+3 25 8 0,5 10 0 127-157
158 ful! turn93-003 93023 194 24+3 25 8 0,5 10 0 159-18393-004 93024 194 24+3 25 8 0,5 10 0 183-188 185: crossing 193-005 93025 194 24+3 25 8 0,5 10 0 188-19193-006 93026 194 24+3 25 8 0,5 10 0 191-212 194: crossing 293-007 93027 194 24+3 25 8 0,5 10 0 212-219
194 24+3 25 6 0,5 10 0 220-23693-008 93028 194 24+3 25 6 0,5 10 0 236-24193-009 93029 194 24+3 25 6 0,5 10 0 241-243 243: crossing 6
194 24+3 25 4 0,5 10 0 244-24593-010 93030 194 24+3 25 6 0,5 10 0 246-251
194 24+3 25 8 0,5 10 0 252-271 272: full turn93-011 93031 194 24+3 25 8 0,5 10 0 273-299
194 24+3 25 6 0,5 10 0 300-313194 24+3 25 4 0,5 10 0 314-317
93-012 93032 194 24+3 25 4 0,5 10 0 318-32893-013 93033 194 24+3 25 4 0,5 10 0 329-332
194 24+3 25 6 0,5 10 0 333-347
194 24+3 25 8 0,5 10 0 348-383
93-014 93040 194 24+3 25 6 0,5 10 0 384-393
194 24+3 25 8 0,5 10 0 394-438
93-015 93041 194 24+3 25 8 0,5 10 0 438-459 change of profile on tape
194 24+3 25 6 0,5 10 0 460-491194 24+3 25 4 0,5 10 0 492-501 502: full turn
.....l'\)

Table 2 continued
Profile Profile Lead-in Channel Group Record Length Sampie Rate Shot Interval Delay Field-Tape Remark5GeoB AWI [m] [m1 [51 [m5] [5] [51 No.93-016 93042 194 24+3 25 4 0,5 10 0 502-50693-017 93043 198 24+3 25 4 0,5 10 0 506-517
198 24+3 25 6 0,5 10 0 518-52993-018 93044 198 24+3 25 4 0,5 10 0 530-53393-019 93045 198 24+3 25 4 0,5 10 0 533-53493-020 93046 198 24+3 25 4 0,5 10 0 534-53793-021 93047 198 24+3 25 4 0,5 10 0 538-54193-022 93048 198 24+3 25 4 0,5 10 0 542-54593-023 93049 198 24+3 25 4 0,5 10 0 545-54793-024 93050 198 24+3 25 4 0,5 10 0 547-55193-025 93051 198 24+3 25 4 0,5 10 0 551-552
198 24+3 25 6 0,5 10 0 55393-026 93052 198 24+3 25 6 0,5 10 0 553-55893-027 93053 198 24+3 25 6 0,5 10 0 558-559 557: change airgun array93-028 93054 198 24+3 25 6 0,5 10 0 560-564 565: change to airgun array93-029 93055 209 24+3 25 6 0,5 10 0 565-584 566-581: 50nobuoy auX#3
209 24+3 25 8 0,5 10 0 585-62893-030 93060 220 24+3 25 8 0,5 10 0 629-658
220 24+3 25 6 0,5 10 0 659-665220 24+3 25 4 0,5 10 0 666-671
93-031 93061 220 24+3 25 4 0,5 10 0 672-680220 24+3 25 6 0,5 10 0 681-683220 24+3 25 8 0,5 10 0 684-687
93-032 93062 220 24+3 25 8 0,5 10 0 688-71493-033 93063 220 24+3 25 8 0,5 10 0 715-742 737: crossing 193-034 93064 220 24+3 25 8 0,5 10 0 742-75193-035 93065 220 24+3 25 8 0,5 10 0 752-76093-036 93070 215 24+3 25 8 0,5 10 0 761-768 765: DSDP 530
93-037 93071 215 24+3 25 8 0,5 10 0 768-77293-038 93072 215 24+3 25 8 0,5 10 0 772-775
....w

Table 2 continued
Profile Profile Lead-in Channel Group Record Length Sampie Rate Shot Interval Delay Fjeld-Tape Remark5GeoB AWI [m] [m] [5] [m5] [5] [5] No.93-039 93073 215 24+3 25 8 0,5 10 0 775-790 779: DSDP 530
195 24+3 25 " 0,5 10 0 791-801195 24+3 25 6 0,5 10 0 802-803195 24+3 25 4 0,5 10 0 804-806195 24+3 25 6 0,5 10 0 807-823 820: DSDP 532
93-040 93074 195 24+3 25 6 0,5 10 0 823-82593-041 93075 195 24+3 25 6 0,5 10 0 826-82993-042 93076 195 24+3 25 6 0,5 10 0 829-839 832: DSDP 53293-043 93080 219 24+3 25 4 0,5 10 0 840-846 843: NCB 193-044 93081 219 24+3 25 4 0,5 10 0 846-86293-045 93082 219 24+3 25 4 0,5 10 0 862-867
219 24+3 25 6 0,5 10 0 868 868: NCB 2.....~

15
It was not possible to proeess the eomplete data set. The shipboard proeessingfoeussed on a first evaluation of data quality, the signal penetration and resolution asweil as the loeal sedimentary and basement struetures at the seleeted drill sites. Astandard proeessing of all relevant seismie lines will be earried out after the eruise atthe Alfred-Wegener-Institute, Bremerhaven.
The seismie data presented here shall primarily i1lustrate that the sedimentation iseontinuous at the proposed drill sites and the sedimentary struetures do not giveindieations for mass movements. A preliminary stratigraphie assignment wasattempted, but will require further detailed analyses.
The digital PARASOUND data were immediately proeessed with the PARADIGMA dataacquisition system using a band pass filter from 10 to 100 kHz whieh preserves thetotal bandwidth of 10kHz of the souree signal. The data were plotted online in 8eolors. A eonstant normalization faetor was chosen to aehieve maximum penetrationand to image at least the upper 50 to 100 meters of the sediment cover. In all plots thetwo-way traveltime has been eonverted to an "echogram depth" using a eonstantvelocity of 1500 m/s whieh should be a reasonable approximation for surfaeesediments.
4.3 The Congo Fan Area
4.3.1 Introduction
Delta and fan deposits are typieally found at the mouth of large river systems withconsiderable sediment discharge. Delta facies develop in shallow waters byconsecutively moving the shelf break towards the open sea. At the edge of the delta,slides, slumps, debris flows and turbidity eurrents are initiated and represent thepredominant downslope transport and depositional meehanisms. The entirecontinental margin from shallow water to the deep sea is affeeted and overprinted bythis type of river aetivity.
In eontrast, the Congo River is assoeiated with a deep ineision into the eontinentalmargin, the Congo Canyon (HEEZEN et al. , 1964; SHEPARD & EMERY, 1973). Thecanyon extends far into the lower stretches of the river with water depths of severalhundred meters already inshore. The sediment is guided through the shelf andaccumulates in small basins. From time to time these materials are released and movedown the canyon (PETERS, 1978) whieh in plaees has steep flanks of more than 1000meters. Within the deep-sea fan, the sediment is transported further downslopethrough numerous distributary ehannels to the topographie lows. Where eonsiderableportions of fine material are included, ehannel/levee systems have developed andlayered sediments are produced on the flanks by loeal spill over. In the working area

16
typical fan deposits are found only below ~2500 meters water depth after the canyonhas opened into the channel system.
Available geologie and oceanographic data indicate significant differences betweenthe southern and northern part of the Congo Fan. Surface currents cause a seasonalnorth - south migration of the river plume, but the regional circulation pattern leads to anorthward shift of the suspended sediment discharge near the coast (EISMA & VANBENNEKOM, 1978). On the other hand, there are indications that the recent fansedimentation by turbidity currents was generally directed southwestward (VANWEERING & VAN IPEREN, 1984; JANSEN et al., 1984).
4.3.2 Strategy of Site Survey
Major scientific targets on the northernmost drilling transect prajected at 50 S arerelated to the interdependence of the Benguela Current with local upwelling andproductivity which should result in a characteristic sedimentary record. Changes in theBenguela Current System will have a direct impact on the sediment composition andaccumulation rates. Due to the general northward shift of the river plume relative to theCongo Canyon, the main effort was to define adequate drilling sites on the northernflank of the Congo Cone. The southern flank was covered only with a few seismic Iinesand generally found to be much more complex in morphology and sedimentarystructures. This part will be excluded from a further discussion at present.
The original selection of drill sites oriented along the seismic line #62 of EMERY etal. (1975b). The published data are insufficient, however, to identify fine scalesedimentary structures, in particular disturbances. Prime objective, therefore, was tosurvey the area in greater detail and with a higher resolution. Those localities on theinitial line GeoB 93-001 which were identified as potential drill sites fram the onlineseismic records were crossed by additional profiles (Fig. 2).
4.3.3 Bathymetry
The bathymetric data collected with the HYDROSWEEP swath sounder system along allseismic and PARASOUND lines are compiled in Figure 3. The general morphology of theworking area is rather smooth. The lower Congo Cone is disrupted however bynumerous small and a few larger distributary channels. Upslope, the general characterof the sea floor changes at around 2500 m water depth from a rough, diffractingsurface to a continuous layering with numeraus parallel internal reflectors. Noindications of channels, downslope transport or slumping were found in the surfacesediments above 2500 m of water depth.

17
.....o
om
..........o
m
.....ru
om
70 S
i\io
m
(" .
'\ ~
\ \.\\ .
, ..... '.....•.,..... .,.\,:,.:
"".
..........o
m
..~~..
.'.rC?J~"• \i?"
.cr\~
...........,...•,
\.
\.
.. ~\)~ ....~
~"*"\
.....o
om
Q
~
.1'°0<9 ... ~
:;"'>a '. J:i"........ \:0."\,,"'\
!\\\
\
.. \ ... 1.... ·...... ··\\'!
Geo6
Figure 2 SO 86 track ehart in the northern Congo Sediment Fan area. Thick linesdenote seismic and echographie profiles, thin Iines echographie profilesonly. Seismic profile #62 of EMERY et al. (1975b) is indicated by abroken straight line. Oots mark potential OOP drill sites and GeoBsediment sampling locations.

-----,. r m '" '" 'I! !!! I
~ I I !I .
I I
: :<J' 0: p
co,- 10'
,0' 20'
11..I
Jn'
S.'h: .
"I: 'P' 10 110 )e (0' bO' 10' 20
Figure 3 Bathymetry in the northern Congo Sediment Fan area.

19
4.3.4 Seismostratigraphy
Altogether 9 seismic Iines were recorded in the northern Congo Fan area with 6crossings at potential drill sites in water depths between 1400 and 3000 m (Fig. 2).Connecting profiles will later allow a detailed regional seismic correlation. The firstprofile (GeoB 93-001) started at 8°30'E / 5°30'8 to cover the depositional environmentof the fan and in particular its change to a predominantly (hemi-) pelagic sedimentationat the continental slope.
The area of the seismic survey generally shows similar overall acousticcharacteristics, but a few significant differences exist. The southern profile GeoB93-001 has basically recorded the same features as line #62 of EMERY et al. (1975b).The basement near the continent is deeply buried and no salt diapirs are observedclose to the surface. Deep reflectors are undulating, however, indicating minordeformation of deeper layers by salt movement or an early tectonism. Theseundulations are smoothed out towards the surface and do not control the ocean floormorphology. Already on profile GeoB 93-002, which is about 25 nm further to thenorth, intense salt diapirism is apparent and numerous disturbed sequences areobserved near the surface. For this reason, the crossing Iines were concentrated onthose sections of lines GeoB 93-001 and 93-002, where penetration was high and adistinct layering observable.
For paleoceanographic drilling objectives only sites with longer intervals ofundisturbed, continuous sedimentation are of major interest. The early phase of theinitially developing current system may weil have been associated with increasedterrigenous input and considerable downslope transport, though.
Figure 4 shows a typical example of fan deposits dominated by diffractions fromsubsurface structures. They represent the chaotic fan deposition regime with turbiditycurrents, slumps and debris flows and a variable paleosurface morphology. Frequentlythe diffractions appear to mask lower, more regularly deposited sequences. The upperunit of more distinctly layered sediments is about 100 ms thick.
Above a water depth of ~2250 meters the characteristic pattern of fan deposits hascompletely disappeared in the upper sedimentary column. It is replaced by aseries ofseismostratigraphic units (Fig. 5) which will subsequently be used as a type sequencefor the working area. These seismostratigraphic units are described as folIows:
Unit I Acoustically transparent layers with a few weak, parallel internal reflectors. Thethickness of the unit fluctuates between 80 and 120 ms. Its base is easilyidentified by a relatively strong reflector which is present on all profiles in thestudy area. Another interbedded reflector at ~30 to 50 ms can be tracedalong several lines. The interval between these two reflectors mostly containsonly low and incoherent seismic energy.

20
Digital Sediment Eehograp/ly / Parasolh'ld, Univ. Bremen, Dept. of GeoscieneeSeismic Seetion Plot IIFE: 1 Seale: 4 Pixel Page: 26 cm Ampl:Sh Ip: SQNNE crui se: SO-66 Author: -,-V,-,-"S",P.c:is",B,---=:-:-::-:=-Time: Apr! \/Msy 1993 Ares: congO Fan Oate: 09.05.93
Sediment
~u
Echograp/lyUNI HB
Cf)(I)
w'3(''5' 5:45....(I)(')0....0-0 5:50-+.
()0::J
<00
5:55."ß>::J0-(I)'U0 6:00(f);::+(f)
-=5'(I)
6:05Ci)(I)0OJ<0VJ 6:10I
00......
10<0 6:15
~""':!
JJJ6:20
Selsmic I ins GeoR 93-001Figur. 2.3Processlng: No 100.0, Thr 50%,
Fan deposits
System S E l',Ol. ?8.02.911,00 28,06,93 1,j4~
Fi le: PROPY.CPSlnt/lnlcr: 601· 4600 / 1

""Tl<6'c...,([)
CJ1
Sedi""",t Digital Sedi""",t Echography / Paresound, Univ. Br"""",. Dopt. of Geo.cience System S E (2.0)' 28,02,91
~n Seismic Section Plot . I!IFE: 1 Seale: 6 Pixel Page: 28 cm A"l'l: 1.00 20,06,93 11 :#
Ship: SOHNE Cruise: SO'!l6 Author: V, Spieß File: PROP001B,CPSTime: Apri l/May 1993 Aree: Conga Fm Dat.: ~ lnt/lnkr: 401· 4400 I 1
- Seismlc Line GeoB 93·001 Undisturbed stope sedllllll'l'ltsEehography Figur" 2,4
UNI HB Processlng: No 150.0, Thr 5DX.
"D Cf)..., ([)(l) _.= CI>3 3 [13:15S' Ö·s:u ...,-< ([)
0Cf) 0(l) ...,
W· a..3 0.....0 Cf)
113:20Cf)
0.....a"D_. ([)
CO a.....,s:u ([)"D"D::r 0ö' CI>
;:::;:0 CI>
[13:25s:u::::lCf)
Cf) .....:::;; ::rÖ· ([)
~ 0Ö' 0::::l ::::l
CO0""Tls:u::::l
s:u 113:30.,([)s:u---::::l(l)
Ci)(l)
0113:35lJJ
<0CA)
60.......I......
00
I\)
~JIJ~;:::;:::::l'"
s:u
~G

22
Unit 11 This unit shows a large number of reflectors of significantly higher amplitudethan in Unit I. Its thickness varies between 180 and 300 ms. The reflectors areslightly undulating, but parallel. In some intervals onlap structures seem tooccur, however the identification of these fine scale features is yet uncertain. Itcannot completely be excluded that the top of Unit 11 is an unconformity.Unit 11 is subdivided into two subunits by a zone of high reflection amplitudesat -150 ms TWT. The general reflection pattern does not change across thisinterface.
Unit 111 The transition between Units 11 and 111 is marked by a change in reflectionpattern, not a distinct reflector. While continuous reflectors are found above,disrupted reflectors and diffractions prevail below and the reflectionamplitudes are significantly lower. The number of diffracting elements is ratherhigh, their lateral extent generally not as wide as in the fan deposits. In someintervals, where the width of hyperbolae increases considerably, theydominate the section.The thickness of Unit 111 varies between 100 and 200 ms. Its base is identifiedas the most prominent reflector in the region which most Iikely corresponds tothe "lost" Horizon A of EMERY et al. (1975b), who were unable to trace thisfeature in the Congo Cone area. In greater water depth indications of achaotic deposition and, in places, buried channel/levee systems are seen.The top of Unit 111 is sometimes observed in PARASOUND records as the"acoustic basement" with a rough subsurface.
Unit IV A penetration of the seismic signal of more than 3 seconds below Horizon A isrepeatedly observed along line GeoB 93-001 and on other profiles. Somereflectors seem to be continuous, but a final evaluation of these strata, whichare prabably of Paleocene and Cretaceous age, has to be postponed untilfurther data processing.Because of the predominant Neogene drilling objectives, an interpretation ofseismostratigraphic Unit IV was not attempted at present.
In order to define suitable Neogene drill sites on the seismic lines, achronostratigraphic concept was developed and tentatively applied to theseismostratigraphic units. It was derived from different published sources, primarilyfrom the scientific results obtained at DSDP Sites 364/365 and several other drill holesin the Walvis Ridge area (EMERY et al., 1975b; JANSEN, 1985; BRICE et al. , 1982;BOLU, RYAN et al., 1978).
Gravity core material fram the Congo Fan was found to contain very high contentsof organic matter (SCHNEIDER, 1991). Partly because of a considerable biosiliceouscomponent, the water content is also very high in the surface sediments. Both findingsare indicative of high sedimentation rates caused by upwelling and an associatedincreased productivity. The resulting sediment composition is rather homogenous and

23
therefore shows a trend to be acoustically transparent. Seismostratigraphic Unit I isassigned to the typical upwelling situation which was probably most intense duringPleistocene, when current activity was at a maximum. The TWT of 80 to 120 mscorresponds to a thickness of around 80 to 120 meters for this unit. Sedimentationrates of 5 to 8 cmjkyr observed in gravity cores covering the last 200,000 years(SCHNEIDER, 1991) are weil within the range.
Due to a less intense global circulation, upwelling may have been reduced in thearea during Pliocene (the regional paleoceanographic history is poorly known,however). At DSDP Site 364 Pliocene sediments have higher carbonate contents thanthose of Pleistocene age, an indication for a limited coastal upwelling and relatively lowproductivity. The large number of high amplitude reflectors characterizingseismostratigraphic Unit 11 are thus interpreted as representing a highly variablecarbonate deposition associated with pronounced acoustic impedance contrasts. Unit11 most likely reflects rapid and numerous changes in location andjor intensity of boththe Benguela Current and the local upwelling system during Pliocene and late Miocenetimes.
Seismostratigraphic Unit 111 documents a distinct shift in depositional environmentfrom a more pelagic sedimentation to processes which produce rough, scatteringsurfaces. The different widths of the diffraction hyperbolae suggest variations in themicrotopography between short sediment waves and a chaotic distribution ofdiffraction elements. This unit is interpreted as representing fan deposits (see Fig. 4) orat least an intense downslope sediment transport by slumping or turbidity currents. Itmay be associated with the tectonically driven development of the Congo Riverdrainage system in earlyjmiddle Miocene (EMERY & UCHUPI, 1984) which shouldhave significantly increased the influx of terrigenous material. At the same time, amajor transgression due to global warming may have initiated erosional activity on theshelf and at the coast (KENNETT, 1982; EMERY & UCHUPI, 1984). The onset of anintensified terrigenous sedimentation can possibly be related to the termination of amajor global hiatus at the EocenejOligocene boundary which was identified in theworking area as the Horizon A reflector (EMERY et al. , 1975b; EMERY & UCHUPI,1984; BOLLI, RYAN et al., 1978).
4.3.5 PARASOUND Acoustostratigraphy
As the processing of digital PARASOUND echosounder data had only second priorityduring this cruise, a final evaluation has to await further processing ashore. Tooptimize for penetration, a variable scaling factor was applied to the online recordings.Nevertheless, there are still substantial deficiencies in the graphical output whichcomplicate an immediate detailed interpretation. The processing of the digital data setwill particularly result in a significant improvement of the acoustostratigraphicresolution of sedimentary structures. Although the length of the echosounder signal

24
11:50 5~12,78/
11:40 _._~_
12:30 5:"12.18 / ~oo17.6E
6002650
. :.,
Water depth [m] (Vp:::: 1500 mjs)
2800 2750 2700
11:20
12:20
12:10
11:30
2850
()o::J
(Qo~::JC.CD"0oCf)
~
~::0(f;oczCl.....CD
8.....c.o....C"0"0CD.....
"cö'c.....CDCf)
-::::5"CDCi)CDoOJCDCJ.)
8-"
-"oo-"
~J:!J

...-,-~
. ..... :'-~
"~"''1,:';:''.
~':"\~"~'~" .
.__:~::;~~,
.;."'::".~::
': l
14:00:
13:50:
14:20: 5°1~.7S / :W26.~E
13:30:
14:30:
13:40: 5°1~.2S/ :lOo23.;3E
14:40:
14:10:
13:20:
14:50:
Water depth [m] (Vp= 1500 mjs)
~vv j ~~vv i 2~00 i 2~50 j 2~00 i 2150 i 2100 i 2~50 ~9J~~00
"'TlcO·c....(!)
-....J
-iIJ::::J »CD :0() »CD (J):J 0..... c.... z0) Cl
"0 ....0) (!)~ ()
o 0;:0.::::J 0CD .....(/) (/)CD () 0~"Oo CD:J 0() (!)o "0=l 0CD (/)(/) ;:::+:"0 (/)o _.:J :JQ. .....(/) ::::J..... (!)
;: ()::::J 0CD :J(/) COCD 0ü)" "'Tl3 0)ö· :J.... 0)CD ....() (!)o 0)....Q. -::::::(/) ::i"::::J (!)o Ci):E (!):J 0S' OJ"'Tl CD_. (,,)co I
C 0.... 0CD .......01 -
.......orJ~
-!!J
90

26
was extraordinarily short (250 j..Ls), a penetration of 70 to 150 meters could generally bereached.
In the Congo Fan area the upper sedimentary unit shows a very low acousticreflectivity with only a few pronounced reflectors. To a first approximation, the upper~70 meters can be described as acoustically transparent. Only one prominentreflector is found at -20 m sub-bottom depth which was also identified in the seismicrecords. This acoustic unit is easily correlated to seismostratigraphic Unit I.
Below -70 m sub-bottom depth a clear change in reflectivity occurs on Une GeoB93-001. In water depths below 2600 m an about 30 - 40 m thick band with numerousreflectors is observed (Fig. 6). In places, there is evidence for fan deposition withdisturbed sedimentation and rough subsurfaces. The band disappears in watersshallower than 2600 m (Fig. 7). Upslope, the rough subsurface, which is usually relatedto a marked contrast in grain size and wet bulk density, is replaced in the seismicrecord by a more regular reflection pattern. The impedance contrasts are apparentlysubdued and cannot be imaged with the PARASOUND system any further. Therefore,seismostratigraphic Units land 11 can no longer be distinguished in the onlineprocessed echographic data. Exceptions are a few intervals at -1550 and 1750 waterdepth, where again a rough subsurface with high reflection amplitudes wasencountered.
Nowhere in the working area a slumping of surface sediments was observed. Onthe other hand, the microtopography shows a large number of furrows or holes,producing overlapping hyperbolic reflections. They may partly result framthreedimensional features. The wavy surface morphology with an amplitude of a fewmeters extends to greater sub-bottom depth presumably indicating a long-term lowintensity current activity. As the reflection amplitudes in the upper acoustostratigraphicunit are generally low, an enrichment of coarse grained material by current activity canprobably be excluded. A possible explanation for the observed furrows could be slowcreep processes in the upper sediment cover which is known to have very high watercontents. The echosounder data clearly show, however, that the sedimentarysequences have not been significantly disturbed.
4.3.6 Proposed Drill Sites in the Conga Fan Area
Seven potential drill sites have been identified in the upper Congo Fan area north ofthe Congo Canyon in water depths between 1400 and 3000 meters (Table 3). They allrepresent basically the same depositional environment in varying distance to the shelfbreak, varying water depth and at different positions with respect to the Congo Riverplume. For 6 sites, CF-1 to CF-6, cross profiles are available. In all cases the sites areunaffected by sediment slumping or local threedimensional basement structures.

27
Table 3 Proposed drill sites in the northern Congo Fan area. For each site thegeographical coordinates and seismic line numbers as weil as the date,time and water depth at crossings are Iisted.
8ite Geographie 8eismic Date Time WaterLatitude Longitude Une Depth
(m)
CF-1 5°11.4'8 100 22.0'E GeoB 93-001 09.05.93 13:24 2506GeoB 93-004 11.05.93 7:50 2506
CF-2 5°10.8'8 100 25.9'E GeoB 93-001 09.05.93 14:12 2403GeoB 93-006 11.05.93 10:14 2400
CF-3 4°45.3'8 100 25.3'E GeoB 93-002 10.05.93 15:30 2522GeoB 93-006 11.05.93 15:24 2522
CF·4 4°45.0'8 100 29.3'E GeoB 93-001 10.05.93 14:40 2430GeoB 93-007 11.05.93 17:04 2432
CF-5 5° 6.6'8 10°51.1 'E GeoB 93-001 09.05.93 19:25 1832GeoB 93-007 11.05.93 23:18 1826
CF·6 5° 4.1'8 11°6.4'E GeoB 93-001 09.05.93 22:34 1397GeoB 93-009 12.05.93 3:54 1397
CF-7 4°47.1'8 10° 4.6'E GeoB 93-002 10.05.93 19:48 3001
8ites CF-1 and CF-2 (Figs. 8, 9) are located in water depths of 2400 to 2500 m. Theseismic records do not show any apparent basement structures. Horizon A is clearlyidentified at 650 and 550 ms TWT, respectively. 8ites CF-3 and CF-4 (Figs. 10, 11) arelocated on the northern Une GeoB 93-002 in water depths between 2430 and 2520 m.Compared to 8ites CF-1 and CF-2 no major differences are observed but slightchanges in thickness of the seismostratigraphic units. The diffractions in Unit I1I areless pronounced here which may be related to the greater distance of these sites tothe Congo River mouth.
The proposed 8ites CF-5 and CF-6 (Figs. 12, 13) are closer to the shelf break in waterdepths of 1830 and 1400 m, respectively. At 8ite CF-5, the acoustic transparency ofUnit I is very pronounced, perhaps indicating a higher accumulation rate. The internalmicrotopography of Unit 11 is somewhat enhanced, but still seems to reflect a mostlyregular sedimentation pattern. In several short intervals the site may already beaffected by downslope transport and thin interbedded turbidites or slumps. In Unit 111

11cO'e.....CDCD
........Echollraphy
UNI HB
28
Digital Sed;ment Echography I Parasound, Un;v. Bremen, Oept. of Geoscienee System~~ ISeismic Section Plot HFE: 1 Seale: 6 Pixel Pa9~: 28 cm Ampl: 1.00 ~a~ !Ship: SONNE Cruise: SO·86 Author: V, SehB Fi le: PROP0016.CPSTime: Apr;\lMay 1993 Ara.: Congo fan Date: ~ lntllnkr: 401 - 4400 I 1
Seismic line Geoll 93-001 Proposed drill site Cf'1Figura 2.7Procassing: No 150.0, Thr 50X,
Cf)~.cn3ö'.....CDoo.....0-
a-::TCD"C.....o"CocnCD0-0-
::::J(0
o~o'::J()11
I......

."<ö'c.....Cl)
<.0
Cf)Cl)
w'30'.....Cl)()o.....0.
el--::TCl)
-0.....o-0oCf)Cl)
0.0.~,
S'coo()
eler::l(")."r\)-Cf)Cl)Cl)
-10)0Ci)W
Ö.....0.~~,
~
Sediment Digital Sediment Echography / Parasound. Univ. Breml!l'\, Oept, of Gaoscience System $ E ".Ol. 28,02.91-! Seismie Section Plot IlFE: 1 Seale: 6 Pixel Page: 28 ern Ampl: 1,00 20.~,93 11:54Ship: SQIlNE Cruise: SQ-B6 Autnor: v, Spieß File: PROPOD1B.CPSTime: AprilfHaY 1993 !lreg: CQ!l!!Q fan Dats: ~ Intllfll:r: 1 - 4000 I 1 I
....... Seismic I ine Ge08 93-001 Proposed drill site CF-2Echography Figure 2.8
UII1 HB Processing: No 150.0, Thr 50%,
14:05
6<::

TIcO'c-.Cl>......o
Echo;raphyUMl HB
Sei smic Li ne GeoB 93-002Fi;ure 2.9Processing: No 150.0, ihr 50%,
30
Cf)Cl>w"30"-.Cl>
8-.0-
e-::TCl>U..,ouocnCl>0-0-
:::J
<0
ooeö':J
o"'Tl~
Ci)(I)(I)
-fß)C'"CDcuÖ..,0$2e?~

Proposed drill site CF-4
11cO'ero..........
cnCl>(i;'
3er....Cl>
8....Q.
~.-+::TCl>-0....o-0oCIlCl>Q.
Q.~.
S'(Q
o()
~e':::l
o71~
Ci)Cl>Cl>-jPol0-Cl>c.uÖ....Q.Cl>.-+
~,
JE.-
Sediment Digital Sediment Echography / Parasound, Univ, Bremen. Dept. of Gaosclanca System! ti (2,01. 23,22,91
~Seismic Sectlon Plot IIFE: 1 Scale: 6 Pixel Page: 28 cm Aepl: 1.00 22.06,93 12:10Ship: SONNE Cruise: 50-86 Author: V. Spieß File: PROP001B.CPSTime: April/May 1993 Area: CQQ!IQ F!ln Oste: ~ lntllnkr: 1 • 4000 I 1
- Seismic llne GeoB 93-002Eel1ograp'ly Figure 2.10
UNI HB Proeessing: Ho 150,0, Thr 50%•
14:30
~8

"cö'c.,(1) Ecnography
UNI H8
s~ismic lin~ GeoS 93-001Figur. 2.11Processing: Ho 150_0, Tnr 50%,
32
Proposed dril t si te CF-5
Cf)(1)(i)'
3c=r.,(1)oo.,a.a....::::r(1)
"0.,o"0o(f)(1)a.a.::::!.
sCO
ooao'::J()
~Vi(1)(1)
"iiierCi)v:>Ö'"'a.e~.
!!!.-

"cö'c....Cl)
......u.:>
Cf)Cl)(ij'
3ö'....Cl)(")o....0..
~.....::JCl)
\J....o\JoCf)Cl)0..0..:::l.
S'coo(")
~o'::J
o"Cn(j)Cl)Cl)
-l0>0Cl)
u.:>
Ö....0..m.~.
.!!2-
.Echography
UM! HB
22:20
22:25
22:30
22:35
22:40
22:45
Seismic tiM GeoR 93-001Figura 2.12Processing: No 150.0, Thr SO%,
("("v()

"T1eö·c:....<D
.Eehography
UNI HB
Stlsmle Iine Geoe 93-002Figure 2.13Proeessing: No 150,0, Thr sax,
34
Proposed drill site CF·7
Cf)<Dc;;'3ö'....<Doo....0.
a-::T<D
-0....o-0oCf)(l)0.0.
::::J
(0
ooaö·::J()
"~1ii"(l)(l)
-I~CDc.>Ö...0-
~SE.

35
several stronger refleetors are observed which probably originate from thickersedimentary units each deposited during a single event. As this unit is significantlythieker than at deeper sites, downslope transport may in fact have been a majordepositional process.
Site CF-6 in 1400 m water depth shows a seismic pattern which is apparentlyaffected by the proximity to the shelf break and a high terrigenous sediment input.Reflection amplitudes are generally high indicating a strong variability in acoustieimpedanee. Diffractions are already observed in Unit I. Units II and 111 are difficult todistinguish, but further data processing should provide better information about thecontinuity of reflectors and the internal microtopography. Sediments at Site CF-6probably were quite directly influenced by the development of the Congo Canyonsystem and related changes in coastal current intensity, sea level and downslopesediment transport.
Site CF-7 (Fig. 14) is the most distant location with respect to the Congo Canyon.Although the water depth is around 3000 m, only minor indications are found fortypical fan deposits. All seismostratigraphic units can be c1early identified. Ascompared to the shallower water sites, their thickness is redueed. A zone of diffuseechoes between Units 11 and 111 may be interpreted as an interbedded slump deposit.Unit 111 is much more regular in refleetor geometry than at all other sites and perhapswould allow a more detailed analysis of early stages of the regional Cenozoic paleooceanographic development.
4.4 Angola Diapir Field at 12°5
4.4.1 Introduction
The seeond working area was in the Angola Diapir Field at 12°S. It is located betweenthe upwelling center off the Congo River and the Angola - Namibia upwelling cell. Theloeation represents a typical (hemi-) pelagie depositional regime which is still under theinfluenee of the Benguela Current. The sedimentation rates are expected to begenerally lower than in the Congo Fan area due to a reduced coastal upwelling.
The regional morphology is controlled by a ritt basin which developed during theearly opening of the South Atlantie. In Aptian - Albian times a shallow water basin wasrepeatedly flooded and evaporitic layers of altogether several hundred meter thieknessaceumulated (BAUMGARTNER &VAN ANDEL, 1971; LEYDEN et al., 1972; EMERYetal. , 1975b; KENNETT, 1982; EMERY & UCHUPI, 1984). The subsequent phase of seafloor spreading disrupted this basin. A major portion between the equator and about13°S remained at the African continental margin forming a plateau in water depthsabove 2500 to 3000 meters. Its seaward boundary, the Angola Esearpment, ean betraeed as a prominent morphologieal and structural feature.

36
Soon after deposition of the salt layers buyoant forces already initiated verticalmovements which are also observed in the coastal basins (BRICE et al., 1982; EMERYet al., 1975b). They continued during the late Cretaceous and Cenozoic, when severalkilometers of sediments were accumulated on the eontinental margin and the plateau.This salt teetonism has shaped the morphology of the area and dominates the regionalsedimentation pattern. Numerous diapirie struetures in the reliet rift basin were imagedand analysed in some detail by the seismie surveys of BAUMGARTNER & VAN ANDEL(1971), LEYDEN et al. (1972) and BRICE et al. (1982). Intensive salt teetonism isassoeiated with the diapirism. Beeause of the short average distanee between diapirs,the identifieation of suitable potential drill sites with undisturbed sedimentarysequenees was rather eomplieated.
4.4.2 Strategy of Site Survey
The preliminary site proposals in this region were based on seismie line #44 of EMERYet al. (1975b). As the new bathymetrie map of CHERKIS et al. (1989) indieatesrelatively eomplex topographie struetures around this profile, an area further to thesouth at about 12°S was surveyed. All drill sites proposed here are on line GeoS93-015 for whieh 6 erossings are available (Fig. 15). Additional high resolution seismieprofiles were reeorded aeross DSDP Sites 364 and 365 to establish a seismostratigraphie eorrelation with the former drilling results.
4.4.3 Bathymetry
A bathymetrie ehart of the HVDROSWEEP tracks is shown in Figure 16. The water depthin the seleeted area amounts to less than 2000 meters. West of about 12°40'E on theouter plateau and less pronouneed on the inner plateau to about 12°50'E, themorphology is irregular with slightly elongated NNW - SSE trending features of 50 to100 m amplitude. Salt diapirism, whieh reaehes elose to the surfaee and thereby alsoaffeets the topography, has created this sequence of peaks and troughs. As the basinsbetween the diapiric structures are only around 10 km wide, appropriate locations forfirst priority paleoeeanographic drill sites eould not be identified. East of 12°50'E theupper continental slope is smooth. The proposed drill sites are all located between 550and 1560 m water depth in this area.
4.4.4 Seismostratigraphy
Vertical salt movements, the predominant tectonic process in the Angola Diapir Fieldhave directly affected the regional morphology and sediment deposition. In thewestern part of the plateau diapiric structures nearly reach the surfaee. The sedimentstructures on top and on the flanks are deformed, indicating postdepositional salt

~
~"
'""'"8...
"'"~m
..."'"8'"
..."'"~m
120 00'S
11·30'5
--
11°30'5 .i1m.. ;i: ..
":~Yn: -- 384 , /\;, ,J \ · ,· ~ --1 · · ",~ -'· ~~f" DroP .~ ······ __~·~~I~~:~~)\i-)~·~·--,'e c - - :~~!l~ .~;".~.~ , .
\
° :_-;-- \"00" _ " , #
. : I
Geo6 ~93-0).5 0';
w-...j
....
: ....
I\\\\
Q~'./
12°30'5 I I I A ,9 I l I ...t><s... i ) I I '2"30'5
"'0
~
'"
N
80
'"
"'0gm
'"g"m
""0l:';m
R!V SONNE Scientific Cruise SO-86 - OOP Pre 5ite SurveyWest African Continental Margin: Angola Oiapir Field (125)
....All 2:_
sedilllltllt~lIPhl"lkl1ver.1teot flre....n
Figure 15 SO 86 track chart in the Angola Oiapir Field area. Thick lines denote seismic and echographieprofiles, thin lines echographie profiles only. Seismic profiles #44 and #53 of EMERY et al.(1975b) are indicated by a broken straight lines, Oots mark potential OOP drill sites and GeoB
sediment sampling locations,

roCf)
10'
20'
wo
'"~i:l
12'27'J1'.n4s
30'
3Q'
30'
U'!G',0485
so' ~!
t 10'
I=~ ~("\!\!II.I""
Field20'

39
tectonics. Nevertheless, major reflectors can be correlated along the profiles even oververtical steps of 500 to 1000 ms. Apparently many of the small basins between thediapirs are almost unaffected by deformation and faulting, but their uplift may havecaused local slumping of minor sediment packages.
The most obvious similarities between the seismic results at 12°8 and the CongoFan area are found in small basins on the western plateau. Figures 17 and 18 i1lustratetwo examples from 12°26'E and 12°45'E, respectively. The first shows alternatelycontinuous layering and irregular reflector surfaces, in some cases associated withsmall hyperbolae. The upper ~200 ms are undisturbed. Below severallayers appear toreveal a basin fill from slumping events whereas other rough reflectors can be traced tothe tops of the diapirs. In the second example a deep penetration into a thicksequence of regularly deposited sediments is observed. The sub-bottom depth to thebase of the trough amounts to 1.5 - 2 seconds. Hyperbolic echoes indicating roughinternal surfaces are of minor importance.
A subdivision into seismostratigraphic units is less straightforward than in theCongo Fan area, not the least, because the alternation of pelagic sedimentation andmass flow/fan deposition is missing here. A distinct marker for the seismostratigraphicinterpretation should again be Horizon A of EMERY et al. (1975b) which was tentativelyidentified, e.g. at ~400 ms TWT in Figure 18. This is shallower than in the Congo Fan,where the depth of Horizon A varies between 520 and 920 ms TWT at the proposeddrill sites. The following preliminary seismostratigraphic classification has beendeveloped for this working area.
Unit lAseries of distinct reflectors, on some seismic lines cut by V-shaped troughsor channels producing wide angle diffractions. The internal surfaces aresometimes rough or undulating. Thickness 100 - 220 ms.
Unit 11 Unit 11 can be subdivided into two subunits. Unit lIa is acoustically transparent.Unit IIb comprises aseries of reflectors with a strong reflector at the base. Insome intervals this base reflector is clearly identified as an unconformity. Itscharacteristics are very similar to Horizon A in the Congo Fan area, but anunequivocal interpretation is not yet possible at present. Thickness 100 to 220ms.
Unit 111 Acoustically almost transparent unit showing significant variations in thicknessfrom 0 to 150 ms.
Unit IV In some intervals this unit of mostly weaker reflectors clearly resides on anerosional contact. Thickness ~250 ms.
Unit V Irregularly deposited sedimentary sequence with a large number of smallhyperbolae.

11<0'e.....(I)
Cf)(I)(i)'
3o'.....(I)()o.....0.
9»:::l
COotuo5)'
"'0:::;.
11m'0.0.(I)
"'0oC/)
$0-e.-+(I).....
"'0
e(I)tue
:5'(I)
Ci)(I)oOJ
~6.....(]I
40
Sf>dlment Digital Sediment Eehography I Parasaund. Univ. Bremen, Dept. af Oeosci ence System S E (6,91· ;;:!Uia.91
~=Selsmie saction Plot ItFE: 1 Seale: 4 Pixel Page: 28 em AffPl: 1.00 ;;:0,96,93 16i18Ship: SONNE Crulse: SO-86 Author: V. Spieß FHe: PROP001C.CPSTime: April/May 1993 Area: Angola DiBP;r Field Date: ~ lntllnkr: 1 - 4000 I 1
- Selsmie llne 0"09 93-015 Exa"l'leEchOllraphy Figure 3.f'
UNI HB Proeessing: No 150,0, Thr 50%,
20:15
20:20
20:25
20:30
20:35
20:40
120 :45
i
20:50
20:55

."<0'e:....(l)
-I.
CX>
Sediment Digital Sediment Echography I Parasound, Univ. Bremen, Dept. of Geosclence System S E (2,0). 28,02,91
=~==Seismic Section Plot #FE: 1 Seale: 4 Pixel Page: 28 cm A~l: 1.00 20,06,93 16;18Ship: SONNE Cruise: SO-ß6 Author: V. Spieß File: PROPOO1C.CPSTime: I\prillNay 1993 Area: Angola Diapir Fiald Date: ~ IntlInkr: 1·4000/ 1
- Selsmic lfne GeoB 93·015 Exa~le
Echogrephy Figure 3,foUNI HB Proeessing: No 150,0, Thr SOl',
~ (J);:::;: (l)::r 00'0> 3'Q ö'(l) ....3 ~ 120:15_.0::J ....0> Q.
-< 0.......CI>CD):> 120:20_. ::JCI> CO3 0o -CI> 0>::::t 0~ ii)' 120:25
CO -0.... _.0> ....\J ."::r _._. (l)() -Q.() Q. 120:300> (l)
~-o=+: 0_. Cf)() _.0> ............. Cf)
Ö· --:=-,::J ::J
ä5 120:35....-0
S(l)
~ 120:40
S'(l)
(j)
~ i20 : 45
CO i<.0U)
6~ 120:50
I-I.
f\)
~~ 120:55
J:!J
~v

42
A detailed correlation of these units to the seismostratigraphic sequence defined in theCongo Fan area is not yet possible at present. Horizon A, which was tentativelyassigned to the base of seismostratigraphic Unit 11 here, is the only available marker. Ifits identification is correct, the resulting average sedimentation rates are by 10 to 30%lower than off the Congo River. Some support for this interpretation is provided bystudies on Quaternary sediments resulting in rates of up to 4 cmjkyr as compared to 5to 8 cmjkyr in the Congo Fan area (SCHEIDER, 1991). The sediment thickness aboveHorizon A at the proposed drill sites varies between 300 and 400 ms which should beweil within the range of hydraulic piston coring.
4.4.5 PARASOUND Acoustostratigraphy
Analyses of the digital PARASOUND data revealed some most interesting details withrespect to the impact of salt tectonism on the overlying sediments. Frequently a strongdeformation with faulting and folding is observed. On top of the diapiric structures theuplifted sediment series are sometimes eroded and a cover of recent sediments couldnot always be identified. Many of the small basins on the outer and inner plateau allowa penetration of the high frequency signal of more than 100 m. There, the sedimentsshow parallel layering without distortion or indications of slumping (Fig. 19) andtherefore should be weil suited to drill several shallow holes with penetrations on theorder of 100 m.
Further upslope, between 1600 and 1200 m water depth, sediment waves or smallchannelsjtroughs are found (Fig. 20) which produce hyperbolic echoes in the seismicrecords. From water depths shallower than 1200 meters layered sediments can betraced up to the shelf edge. The signal penetration is mostlyon the order of 80 to 100meters. No evidence for downslope transport by mass movements is observed below400 meter water depth.
4.4.6 Proposed Drill Sites
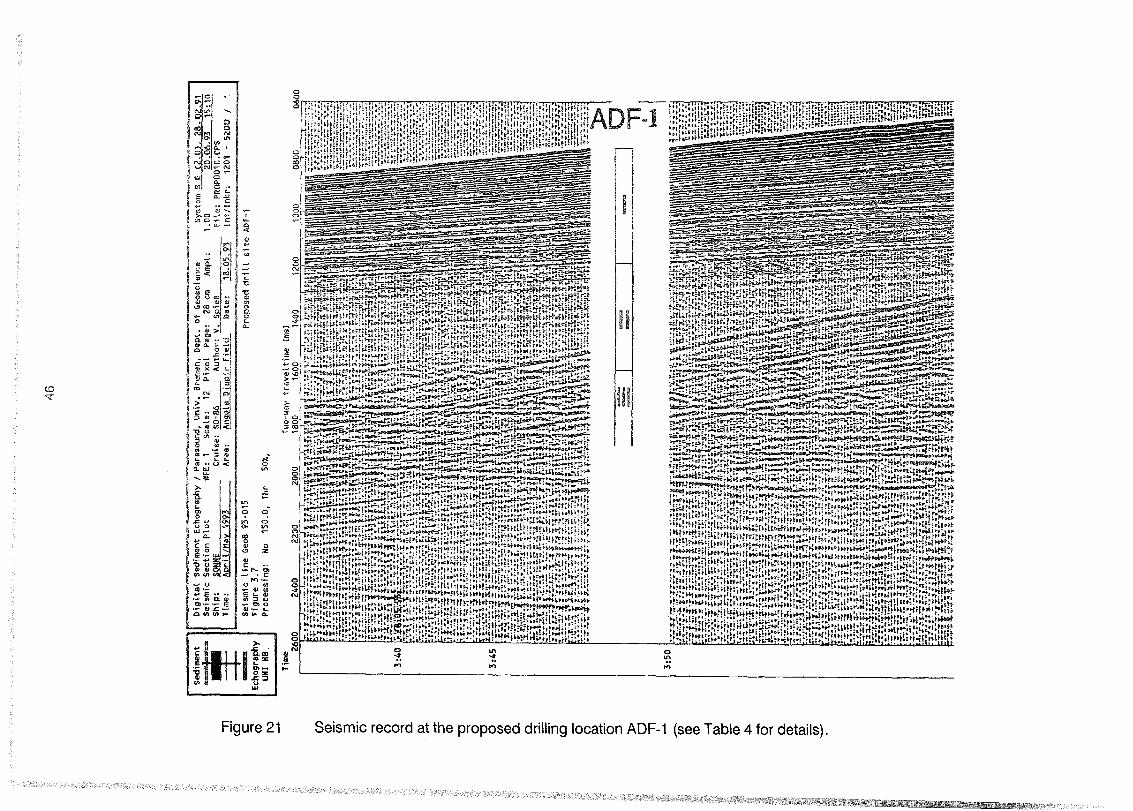
All drill sites proposed in the Angola Diapir Field are located on seismic line GeoB93-015, because the sediments were found to be significantly influenced by slumpingof shelf deposits and turbidity currents along the more southerly profile GeoB 93-017.Only smooth changes in near surface reflection patterns are observed on line GeoB93-015 indicating the absence of mass flow deposition. For each of the six sitesproposed, a crossing seismic profile was shot perpendicular to line GeoB 93-015. Theycover a depth range from 550 to 1560 m over a distance of 28 nm. Also numerousother places were found both on the upper continental slope and in the plateau regionin about 2000 m water depth, where the penetration of the PARASOUND signal is on theorder of 100 m showing an undisturbed sedimentary regime. Table 4 summarizes allrelevant data of the proposed drill sites ADF-1 to ADF-6.

43
....c ro° .c.....-0 .c.... 0)0 .;::0 (l)(]).... .c
I-Clz W:::;)
0 ,....C/) C\J« 0
a: C\J« .,....a..
LÖr...:.,.... .,....od> ~0) ::l
0)
COLL° c(])(!) c
~~ 0._ .c=- (J)
-o-e.~ 8Il.. (l).....~ U0.. .-co E.- (J)
o 'Q)co (J)
o~0) .....
c 0c::( .....
(J)(]) "0.c c-- 0'0 g.
(l)
::l t:co 0(]) U--co c- 00.. ._.... t5(]) (l)
-- (J)::l (l)0.c(]) ......co.....
(])....::l0)
ü:
Ov:9~
OO:9~
O~:9~
..09:9~
OG:9~
Ov:9~
.; .,~
" .,.
\". :.~
: ~.
3~'LGoGi I S~·~ o~~ 09:9~
' .. '
OOO~ 090~
(s/w 009 ~ =df\) [w] ludap Jal8M
.\;~,.. ~~~~;~. [:1· :" \:;;i1t.i:: :
: : ~~...~.:: : :'\~>;· .. , ..~ ~ ~ .. ,-:.~.•..... -· .· .· .· .· .· .· .· .· .· .· .· .· .· .· .· .· .· .· .· .· .· .· .· .· .
~. :.......
096~
. ...................~.
006

44
'Y.,..... .. --L.._.__.. _'. .
....... "-"-'-~--
Water depth [m] (Vp::: 1500 mjs)
1600 1550 1500.',.~
;JI':
-'.'i.,.
.~. -- .{.-:... ' .......· ~-.
.: \::..- . --t-
, .1?o. 2-;38 f ~2°56:4E"'-;---
. ,
1~053,68 I ?2°56.4E :
· . . .11°51.98 I ~2°57,5E :.- ';-'-:'-~:.:;'~~~). . . ~ '---.:'-~"-:O' ,,",~.,,~~"t .· . .
4:50
4:10
4:30._ 1t,5-?,1.~ I
5:50
4:00
5:20
6:00
5:10
3:30
3:50
5:40
5:00
3:40
3:10
3:00
3:20
1650
o5)'-0::;.
."tB·c.....(l)
I\)o
-S'(l)
Ci)(l)oOJ<.0UJ
~
~j\):odifn",,!Om~::J 0(l)0> .......... (l)
-0 0..... 0o .....-00.o 0en ......8.00.:E:::::!. (l).....S' (/)
CO 0- -0g (l)
~o._. (l)
0-0::J 0»en0;:::;:."encJ, S'en .(l) :J'"(l) (l)
::!1»CO ::J. CO1\)0(J'l_0>

45
Table 4 Proposed drill sites in the Angola Diapir Field area. For each site thegeographical coordinates and seismjc line numbers as weil as the date,time and water depth at crossings are listed.
8ite Geographie 8eismic Date Time WaterLatitude Longitude Une Depth
(m)
ADF-1 11°55.4'8 13°21.5'E Ge0893-015 18.05.93 3:50 550Ge0893-019 19.05.93 13:48 552
ADF-2 11°55.7'8 13°19.0'E Ge0893-015 18.05.93 3:15 719Ge0893-021 19.05.93 17:56 715
ADF-3 11°56.9'8 13° 7.0'E Ge0893-015 18.05.93 0:50 1178Ge0893-023 19.05.93 21:58 1175
ADF-4 11°57.7'8 13° 1.9'E Ge0893-015 17.05.93 23:50 1351Ge0893-025 20.05.93 1:18 1346
ADF-5 11 °58.0'8 12°56.4'E Ge0893-015 17.05.93 22:45 1530Ge0893-027 20.05.93 4:54 1532
ADF-6 11 °58.4'8 12°53.1 'E Ge0893-015 17.05.93 22:05 1559Ge0893-029 20.05.93 7:56 1559
8ites ADF-1 and ADF-2 in about 550 and 720 m water depth are the shallowest on theselected transect (Figs. 21 and 22). Unit 1 comprises a dense sequence of parallelinternal reflectors of 180 to 220 ms thickness. A few thin transparent intervals interruptthis pattern. The about 150 to 200 ms thick Unit 11 is mostly transparent with severalrather diffuse parallel layers. 8elow, more prominent reflectors are encounteredbeneath a relatively transparent zone. This Unit 111 is disturbed by hyperbolic echoesfurther downslope. The base of Unit 11 is tentatively interpreted as Horizon A, theMiocene to OligocenejEocene unconformity. Assuming an age of ~23 Ma for itstermination, the average sedimentation rate would amount to ~4 cmjkyr, an aboutidentical value as found in the Quaternary sediments. At present, it cannot beexcluded, therefore, that the base of Unit I may coincide with Horizon A.
8ites ADF-3 and ADF-4 are located in water depths between 1350 and 1530 meters(Figs. 23 and 24). The general appearance of the seismostratigraphic units is similar tothe shallower sites. A pronounced reflector markes the transition between Units land11, while the base of Unit 11 is less easily identified. The average thicknesses amount to~140 ms for Unit I and ~210 ms for Unit 11.
'<=tttt"I~a"~ f:C] g';;;CI> 'fi~
w
,~j;~1
• --i; tJi. ,.:~:trr,'.~.F ~-~:~~~~~~~~~~~tiJ~;:~"'i~U:tl~:~~f::t!~mF;r;p~~J,"q~~' .'~t~~~~U~""'t""""L"'~_lll-lrr.. H,
ttt.d~hf-- I
'~;"';:i~~~;'~"E~·w...'t. :J.~~~.',~~.....~_.~ 'Ti....;::;.;;.~ ~~F,,&~~~~: •. ~ ..~;r;t~,"";r ~.......-:.~...,...:.:~~ ....;~~•.u-i·~~t.~t~1l:&If1~:r:t~~~~. '~~/h~",~""f"'".jrw.a~~~~:.:.;r~8ft.~..~~~~~'~~.....~;~':"'~.~-.~"""" .' ,~...... -~~'."--' ."~""""".' .. ~e~;.o">t'::::;'~."'''''''_~~.. '~ ...'..... ' "·.~f"~~t"i.:..~~~ ~lllJla ~.t~~~~~~"...~_t.~:'''':$~~~~;'G"E~~~p:;.a.:.-f'~fi~~~:~~t:t~R~Ilo:r~~~i'~~~~·!'. ~~;.~r-~~roi~:~·~~~ c. ...~~~~~~hfter~~*~~:;?~~~~~..~rr~~~~:i:.. ~. .~~~t;.~.~~;.~f~~~OIiM. '.~;J'.~..._w::.~_::'::"_Ii't"!.-""~f!'~r,..f'\o.~~....~ .. ''':~~~''rr''t.-r.. ~~.,{J+4-~~~~rr'1'&';~t~~"C6oI'P'~::::~1~~~:~.:.t.~ht.::r~~b"~~1t4;'~~t:·;';i."l·ll~t~fo;;t?~:;:..:::tD~~~'"lI't~~;:;rtpi!Ul~;rr~n l'r;:~G-t~M~~;t~itt:~~~t~~;:;~tW;':'~~tl.r;ittHko~~..t,=~;r;:.::Hf::i~~~~&oi~~"1t1re"~b· - .. , -. f ,~", ·~" .... t~~·"~~""""'I/II01.!'''b'' t e t"'4!Of~~~~tJ$.."1.... l.~rt~~t;'~~~,."I.~ltltK.tJl ..;;.c; •• ; ~.Up~a ..~"t~f;.t'~l>:~~~~~ttt\!Il!~~t.l1-t"~~~r~lö~f~~r~l w~.~~~~~r!~~JI: ~:~\ltm:t:e.t. ~.~ 0
i f!1'ht~;H~; ll',~'~Ii "s:~j,~:i !Nt' ~:t"~~.Ut{~ ·!'~r; rt.'I.,"*l~: t~1~~fll r~;:r. ...[~ ..~;&r~irU~t !-'t~ ~I ~~ .. r~ !I'::i:Htth"';':! .... ~. ~t~~~!:~lt.' Ij".~f ii:"'~Hk ~"l~ ~~''';'D':~Ht r~t>"~/II:~~~:~t.:; i.~t~tlo~:rr~r;.:t'~;f ~tJii~t hB!f~:f~: :r~"~~t:~~B ::~ f;"~;.ttte~':~pt!~! vtt I>P!'~g.'r! ~~.t r..::r1~f,"h ~t-Lklb~UeUr,f;!htt.e r'1~ '~n~~~( ~!t~:':t~.:~~:fkt-u4!a~:~l~~~i~ ~tn.t~ t~'n~i~:~re!~~~~~m~:J~trh' ~!l tH~~~i-.! i~Jpt.P'Il~~D;.~~~r;l\o;~rtP~~ff~~: tf"~~~~[~~t~rtit~~~~~t~~~t~"~I~to{t~~h.i~!~D.ib~l.:.~!'!~tll.a~~:t~~t:'"~[r~t"t"I"... .,.a.htl.""'·~.l~&~ ....t""Iol'!foDotJh .. ,.",",.....,pt't'fU:"ftprl'M~"~:~1tt~n~~H~!!~;&~ ~ ~~'1n ~~~~ ~;rh!. t~::~~~:~b~r::~~~'~!'H;b':f~t; ~t ~~t:H~p'~~~t:~;nli,U~tt!ir:!li~H~.t:;[:~f~~;:;~!r,,~t~rr:»t:;:;U;:t1e!&11~1t..n;::~;t~-:'t~ ~ h;ti i: tr; ~~ t~~ ~~,t~ i! ""Ht:"~~::~t>l rt~~~t ..tflrtit~~~ t;i~; 0r:, ~i "'J~;;t;t~:~i t....~I~~~" t. tt('~, ; ~t rttlh~"::~ ..~. 'i-~~::~. 'ti :llJt.t~";'tt;';h~~~I-:".a.*!."n;~t•. :tJ.,. ! lvi• ~rfl t-"t ""'·'Ff'O"r .~,~.Pf" .rit,..,.'", "!tof.:-P.!'I rl;;"r lr~"f'liUi:tlmH,ut~'.. r:~ ..lri.tt•~ ~ ...,~~ ... ~ ~~ ~~LI.! ~ ~,.~t~io~~.r"~.~ ~, t.r·l: ~:t.....'1~IoH.~~.:I "!HhhH ""f~J~" ~ ~J) i ~r~~~~~~:~F~~rt~~~~·~~~~~Il:~~~,~::·~·~t~t~t~trlt;~~~;tt"!":~ntf~"~:~~~"'.~~1;~~, ~ r~:{ :~H i ,t i ii ii ~,.~;;tt:~I'!r~n ~ ~~~t~~II:;:rtrH~! ::.~~::: ;;lf~~~i lt~::~'tn~t~',!i r~;;,,, :"', ~ ~ ~ I. t;;~f.~ Ii.h;'~~"'t rhn,t! a! I"r~~( ni ~~I: "~~,,,t'l.~'tf.~~it~.t{!taH{!t:! ..!'r~, i ~~~Ilh"'t~! r! ::ra:lt"'"'t.:~-,:"rr!'t;,:lif.I.~ h...~ .. 1 ~.t! ••.•• _.
~ IT~ :~: :iHf.41; t- rr: :r .. ~~, .....:;;;:1:;!H~:HH:~nmBiH:;~Hl:irr~~~~~ini~~th~~g~~;·if!· ..:';!t~:~Wij~~~:Gln~p.1 HI tal.,I" ..I"' ,"i"r' ,.t~t ',' .,!,.;,,::!,ao:.;·:'i'''·t· ~".""r
m
't,!":...1."..!i' .t'. ,: ;0:1,.ff'",,;'.'" .!;r:......;:":,,:::".m~.•I!"rl·"!~'.!""':
o'!l'"
u
111
....\1\
'to'f.....
oo
;gi [li[1l;!;it;Ht:HHIi:::l;:!p:;:[tL:;:i::'d1iW':" ,..... ,p ,f,:, i11~t!!;' t l~ rlf ~:i t,kd,f!'l~ll"· :~~I :r~:.nl tf r' ,. r· ,: tJ!P·:II.ll~t +! I ~.i'f'''.ff!''''.'.!.,.! 'HI,.,:I.",' ,"1'.1. ".' ,.. ! ,. ,.,,1."'" ,'" .".""!:!., •• I.'I
I,,,.:~it-~~U- ~r'I·'! ,,~l. ~c~1 ~i!t!-r:t r~ ~r:~t ~~r ':I:'}:;·I' l'Ii'~t ,.'I'd,'.fl ~~I'f~t~~!",·~~":tdr~ L['" ADF.H,""" 'Hr.'.!••".,.... ' "·t';'· .1;· ,;" " "1 .(, ,"·','1" ,,'I',. "~ tt t;.~,11 ,hM~ ~ I it
tr~! ~ir :i:~,':':ti:f~~ 1-: f~:~!t;i r~ tl ! .•rlt~r i:~lr& ~., l·~t f~' I t."" ~r, t.!! Ill'!'. -1tf~ti-~~,~I:!PtLH~f~ ~t. d
t~1I. '1~1t. ~t : ..;r'·prit'. t~:.I~~"~DI·.;r',..!t;,.thhH. f'~
"! '.' ,,'11""" 'b ~~",!,'" .'L"'" ,,::. ,,:; '.!l f' ,!. I. ~;if"1
" 'itt" '. ,.,...,,'!"",1:~:::::lt;~!i~:!mH:t:a;;i:;!;:t::!lf::!:lii!I!.H;.H'!.i,n.l',!.ll'''''''!'!>! ,"
~ ... .. ~ ..~~~ ... :rir:;......;;~r.~l;:-·~J~~~~;;~h~?t~;f~~~ttr(~~~f".'nHtf;:itt~"l~~~[~Nli:[L;;~!~~~F~1r;-~,~, ..!~r. ;~".jj·tv.,~rfi~rJ~r~r~~t~ :"~i'U:':I>t.re+~~:r~~j.f~~:~~~"f~t-~~ttll'f~l~;.i~:':t~:.tltj.$ r~i.t;'[ ö! rt~'h'''~~:::::l:t !F\;, ~., ,'i '.: .j.t;,!' >1ft'~;.~t~~t~! r~ r....,["~:~.. t~t~H~l-f~ro;~tttli.lr~~~~t~tt.t.~:::- tr!~~;;;~ti~~:[ft~reh~~~~}tk~fttt!; ~rr~ni r;ri:;:~t:'tPf;ftt li t
,i;,;:;~; i: r;l ~*~;~~ f;;~ 4'il':' ~!n:~tl~r'1'Htlr,~,t; :1~Jlt!!i,.;~t~riJ~~f~~~t2~fJ~hf·~~~[~H;t~n:~~~~:~'trt~~r:~~fg~H?~Hl~t.~i~i ~~~~~, ~f~n r:1 ~:t~f:~~ ·r;~~ ~~; t~~j.;;~cH":!r~ri-~&"!~.[ l~~t:i~~~.f.~}~~~r~~~~~&t!.;;:-~io"~~·~~~~~t~;;.:;:~~R ..~~jt:I>:!~~Jffl';;:=irt'~~tl:"""'~~~·~~::· _.:UJ.~~;:~,..~H~~~;:r~~~~~~~~~. ~:~~;~~~~~~Ii~tpt:~~~"1-;",- !;,JErr
lllr·~ ~-.- ..... -'W_"~f..n. =-~"":"""I"""" -~,J;sIJta
~·'tpm·~~::r;:"'!"4~!~~f!;;:;;;;'';'' . ~~~:,,'f";"'.>- ,_••..--..... >Ot"'~ ..-:::.~::=,~~.. ~"-~"70.. ~.;;;..~~ .. ,:.!,,~;' 01 ~";",,~~:"":''"'.:Q~~''''i~''.'[~~ .~~
~~r~~~~~~~~~e.l1L~";"'~~>h~......- .., •• ,;:;..~,._",,,,!.-:_. .,-....~~~ ...,,~Ü'I=l~~t ....:t~~;;.r~rt"~~~~~~!" :~~;-~'~fP";'~~~p~.G:;r;rr~;~~~~~~~~~=-:~·o.:~·~-""~'!ft'l-~"';;'m'~''''':'::'''::~i.~~~. I·r~ ..~ ..c.:. "t:'~ j""-h' ",«"~"'~".\"O."lrt"",,'"""t... ~ .~~ii*~,.~ti:t~!1':r;,,:-,.3ra-;.a-r'I.~·;::qf'itt.:t~~ltllofr.i."'~~c~~:~:~:~~:"~~~..r;"'ti~~~~~;~~kt;i!,.t~~i.:s...~~.~~~6;::lt~n~~tHr,:i:;..... ·~·f'r~H~ ... t~:....~~.~.P .. f N~"tf .. :"b~ • a{i~~* "IC~.;I/o~i.,.tif~~il~ll'r~h:r;;~;t~;'~!":r~lr::HF~~!~t~.~~:.;.r~'"!'~t.';""trt~~r",,-?ti,.Wlonl'~~~!"~'~"'~.o.~~,,~ ..~~~ .."",..z.~lt'r~"fo~";j.~r""h""~ •• r.t.' sr' ',.:~l'W"fr~H~~~""~·l.(r~trJ-p~..... r-tr".wu.~ct..,..... I...... :.r1rttoU poIo."i..lot~H~l~.!t-..Pu.., "'~--:~~'~:ti;.t.~r~~r~LrriJ~!~~io{!~:rn::~;~tU~t~:t!""l~r~H~~fi ..t::~*"~i"~l ..tt~t~ ..t"IPO>OI!!"cltt1l~~L~l{[r;f,~p.ttrl,r~'''I' .......,r tl>t ~~.iB'J~I't't'e"t ~h"~~c+~~~;·~~;:iIl·~~I~flJie,;~~;;.i ~~Pf:t ;~t-~D;~;~"~~ti i~t ~~;~,,;:tl""" ...~~:~~~~u"fl'ffUtof "r"ri:~i"t1 St! ;rt ;t\lr:~~t'"'! ~~·il :.~".HI ;;r'f"'~~' a,.~~:i;:::~ ~'''''f!-; ;:~1 t:~~:.''!;:t;:H ::-[:1;11:;"~~,!:: ~t iH:~;; t11 :':;;,.p. t ~41', [:,. ~.......~;·,"[tttht."o>tot .. ' ....,,!1H~ I;,' ..:r·~ .rt, ,tl t:":h~filt.~;n,t·'"~it:~·."..' ~l~.~lta1,...:t~~J &4~~.h. ~[rb.i,":"'l ,f.1t
l~r: .. ;..t~:~;r0....' Fi ~ l.t'.ill· 'i:'L .[:;: ~~' L!1'Jo!liitr;t ;.r~:t~:,,·· ..~e,. ..I,·tPi·fo!'·a;~;'c.'r·r.',~.ilr~~~'., f ....~t.I.·!. &.U ....'::it1H.;.;: ...Il...,'l~~.I~ ~I. 1.1, t~·H ", : ~l ~r ~, .. f. t~ ~I' "It~r'-t,ft. t·, r,.. Ht af:»"r~:,.JIttlW!',t 'h... t"'~.It~~'H'.t~~;"':'~rt:t~r:t":-t'~r"''''.~htr'!t.h.rt.''''~'L''~''",~tH.I••,".,.p.~'';ir'~L.~""':lt;'~·';!l. ':~'r.!~~lrf)""~"'L"'~;'l••!tIlimt~t't!"'IP.'p$EI<>r.t ...........r. .~: ~:.:~.U :~i:'''.I~:~ti~:'tA;~i :~ir :~~;i:~;:! i:1 ~!'t".r:;.hrli;;..t ~i :.;.tw;:~ ..i ~t~.~.:...,..~t';H""U ..".h""p'''iJt4J)." ~ "' ...... r: '-f" ••• _ t:tr.h..,,.t't.,.rt .. t',.~rl~~! •• ~t:t:; ';fHt. ,~;l i~:~·,:, "'::;l:~tq;!.t i~ ;HIl r:~ti!!'4~t"'j.:: .iolii :~;:;:;.. :~::t;;;:Ji~"::,,L.{I~."~ r~Irt r~ r~r:~"~"""f ~k IW>~~ t"'t!~"'~i~~tlrit;~;f~ ,.:. 'i;;g ~'f't • . 1;. .. , ....trh~ ....Plt ..... ir • , ..... ,.... • .•• .. , .. •
.~ ;e...
....o
'"<-.c
'"....
;; Q
'" 00- '"
.~~
'"'"'0
'8'" 0Cl z
"C ••,_,.... 01
- . c"'u '".- 41) «IE .....iIi:>u
..... C) 0(p._ L"' .......
11VIoa.o<Cl.
~
.....
wVI,
g'"
1"'1~j I~c<~'"" ~
~ 5 <Jl. ~<.!J(;Q ..... ~
N '"'+-0o• ~ >'"'"0.="-0UQ..t-_o 0"~_ i: ;:
c " "~~<'@'- "m '_..~ 01
> c;§ •• ~c;~6 [!l
... Cl V) <:
1~~.. -"=_:::l:&.I... ... ...CVoeUC::
"-:i'.......>-"li...<-~ ~.c v auo ~
.... -~Q.. ~ce :E::
~.~w~;.- ~z·-11 a: ~ 5(I)(I)cn<
-u.,.-.~.~.~~-- 111'&:"-0(1)(1) ....
<.0"<t
Figure 21 Seismic record at the proposed drilling location ADF-1 (see Table 4 for details).

47
'e'0'0(])Cf)
o0..o....0..(])..c.....10'0...o()(])...()
ECf)
"Q)Cf)
C\I,LLo«co~()oOlC-- ........ -. ....... _-_._ ... ... - _..... - _._ ..
........- _---------. _......._ ............._..- .......•-_.~ --_ ...._... - ........._....._4_ .....~:::o:~_'"':";.
fifll~i1tt
~.-...........
~7!'..-t~~f:--- .._ ....
~l~~~i:
~~~.·~r::~:~._.."' .......
I!'";":.~-.::...:.~..~.•~.'":...."...--::.....
I1Nlit\~.?'T~=:~:'1
0080
~ :3,eo Pl&!~ J!(f§!Q ejollü'l' :eaJ'I' 5:66L Xew/llJdV :aw!lsa!ds '/I :Joy,nv 99-0S :as!nJJ 3HNOS :d!yS
:,dlJV 11109' :aBed I&Xld GL :&1905 L :3.# ,old uo!,Oes o!Wslesa:ll.l&losoeo fO ',dao 'UWl'aJll 'Alun 'punoSeJed I AljdeJ6oyo3 <Uauqpas le'1610
L I 0095 - L09L :J~UI!~UI
~~~~S~d~3~'3~LOOdOUd :al~'9P5L r6'90'OG 00' LL6',O'9, '(0',) 3 s ~~sAS
'X05 J41 'O'05L ON :6ulsSaOOJd8'( aJn6 1.
5LO.r6 soao au q 0 lllls las
SH IHnAljdeJ60Lp
lE1E!!lEl
-iC\IC\I(])...:::lOlLi:

48
Digital sedil1l$f\t Echogroplly / Paroaownd, Univ. Br~, OepL Qf GtilOSc;IlnC0 Syste1i\.li ~ (6,9)' 2!},~.21
Seismic S<1Iction Plot iIlfE: 1 Scale: 12 Pixel Page: 28 cm J\rr.pl: 1.00 20.06.93 14:15Ship: SOONE Cruise: 50-86 _ Author: kV....""""~"'p"'"ie"'Il'---:-;:-::':::-~::::- File, pROrOO1C.cPSTime: A!1rilf!'!sy 199~_ Are,,: Anl1:o!m Di"pir field Date: .1!}.,~ Intllnkr: 2801 - 6800 /."
cO'c:.....(l)
~
Cf)(l)00'3o'.....(l)
8.....0..
~.-..::Y(l)
"0a"0o(J)(l)0..0..~.
S'coo(')
~ö':::l
»o.."c:..,Ci)(l)(l)
-I0>C'"CD~
Ö.....0..ss~.
.!E.-
sedime<1t
.!f~
'""""""'"EchographyUNI HB
0:40
0:45
0:50
Seismic llne GeoB 93-015Figure 3.9Processing: No 150.0, Thr 50%,
-----------_......Proposed drill site ADF·3
Two'way travel t ime [InS]
2600 2400 2200

"11cö'c....CDI\)~
Cf)CD(i)"
3ö"....CD(")o....0.
~....::::J"CD
""0o""0ocnCD0.0.:::!.
::JCO
o(")
~ö'::J
»o"11,~
Ci>CDCD-lrocrCD~
0'-.0.CD....~.
.!!2-
Sediment Digital Sediment Echography I Parasound, Univ. Brem&n, Dopt. of Geoscience System S e <2,0). 28.02,91
.~Selamlc S*Ction Plot #FE: 1 Scale: 6 Pixel Page: 28 cm Ampl: 1.00 20·Q§.93 12:34Shfp: SONNe Cruise: 50·86 Author: V. Spieß File: PROP001B.CPSTI .... : April/Mey 1993 Area: Congo Fan Date: ~ Intllnkr: 1201 • 5200 I 1
.- Sefsmlc !ine GeoB 93'015 Proposed drfll slte lIDF-'Echography Flgure 3.10
UNI HB Processlng: No 150.0, Thr 5OX,
23:40
23:45
23:50
23:55
617

."cD'c.....(!)
I\)CJl
Cf)(!)00'3o'.....Cl>(')o.....0-
e.-::TCl>
"'0.....o"'0oeh(!)00:::!.
:5"c.oo(')
eö'::J
»o."0,(j)Cl>Cl>-il»CJ<D~
Ö.....0-
~.!!!.-
50
......---,r---------------,---- --.S&diment Digital Sediment Eehography I Parasound, Univ. Bremen, Dopt. of Geoscience System i-E (2.0~, 28.02.91
~... IIL.:.s::e:isrn~i.,.;,CS~@=e:t:lo:;n=p:lO;:t:===:.tI_F.,:E:::1:._S=C'l:I:;e::=::6;;;:p:i:;x:e:l::p:ll;;,ge
=:...:2::8::cm~=~:=I::=_1~.OO~,.:::~~:.:,:o::.=O§:...:9:3::=1~:i'=~..:'...JShip: lffijINli Crui.e: §O-I}§ Author: ~l,-""",ß_-=~ fl te: PROP001C.cpsTime: ARril/Msy 1993 Aras: Angola Dlaplr Field Oote: 17,OS:91 lnt/lnkr: 1601· 5600 / 1
- Seismic Une GeoS 93-015 Proposed drill slt" ADF-?~chogr8phy Figure 3.11
UNI HB Processlng: No 150.0, Thr 50%,

"cO"c.....CDI\.)(j)
(J)CD00"3o'.....CDoo.....0-
a......::::JCD
'"'0(3
'"'0oCf)CD0-0~"
5'CO
ooro......ö"::J
»o71(j)
Ci>CDCD
n;lCYCD.J:>-
a.....0CD......Q?
J!2-
Sediment Digital Sediment Echography / Parasound, Univ" Bremen, Oept. of Geoscience System S E (2.0l, 28.02.91.~.. Seismic Section Plot #FE: 1 Scale: 6 Pixel Page: 28 cm A~l: 1.00 20.06,93 12;43
Ship: SONNE Crui se: SO-86 Author: V. Splaß File; PROP001B,CPSTime: Apri l!May 1993 Area: Congo Fan Date: .1l....Q2..,21 Int/lnkr: 2001 - 6000 / 1
.......... Seismic line GeoB 93·015 Proposed drill site AOF-6Echography Figure 3.12
UNI HB Processing: 110 150,0, Thr 50".
~9

52
At Sites ADF-5 and ADF-6 in araund 1500 to 1600 m water depth, sediment wavesor small channels produce hyperbolic echoes in seismostratigraphic Unit I (Figs. 25and 26). Furthermore, the character of Unit II has somewhat changed as aseries ofreflectors with increasing amplitudes appear in its central portion. There are indications
for an erosional contact at the base of Unit 11. The thicknesses of Units land 11 amountto ~ 130 ms and 180 to 200 ms, respectively.
4.5 Namibia - Angola Upwelling at 1rs
4.5.1 Introduction
The northern part of the Angola - Namibia coastal upwelling cell (SCHELL, 1970;NELSON & HUTCHINS, 1983; STRAMMA & PETERSON, 1989) is located at ~17°S
between the Angola Diapir Field and the Walvis Ridge. The continental margin is rathernarrow as the relict of a rift basin is absent here and may eventually be traced at theSouth American side. Due to an intense current activity on the shelf and the steepnessof the continental slope, downslope sediment transport by slides, debris flows andturbidity currents has shaped the area (EMBLEY & MORLEY, 1980). The morphology
is further complicated by sedimentary tectonism and giant sediment slides. Althoughthe pelagic sedimentation rates are high due to coastal upwelling off Namibia andAngola, only a few places could be identified with a clear pelagic sediment pattern.
4.5.2 Strategy of Site Survey
As multiple major and minor slides are documented in the survey region, highestpriority was given to the identification of areas with an apparently undisturbed
sedimentation. Because of the generally steep slopes, the most promising depthranges were expected in the mid and lower stretches of the continental margin. Theinitial seismic line was oriented along an earlier PARASOUND profile (R/V METEOR CruiseM20/2) which had revealed undisturbed near surface sediments in a number ofplaces. Only two suitable drill sites could be identified in water depths between 2200and 3000 meters and were crossed by additional seismic lines (Fig. 27). All areasshallower than 2200 m and deeper than 3000 m were found to be affected by intensiveslumping.
4.5.3 Bathymetry
The bathymetric records (Fig. 28) confirmed the complex nature of the depositionalenvironment. Although the survey was not sufficient to analyse all structures in detail, itbecame clear fram the combined HYDROSWEEP and PARASOUND echosounder datasets that only very few potential drill sites may be found in the region. The locationsselected for additional seismic lines are apparently protected fram mass movementsby the local topography, perhaps featuring an underlying basement high.

"'0l!lm
..o
80
m
°0~,,;
....8
0
...::~o
.,j
..No
8.,j
j
....... . :
.............: ~ .i : . ' ••
"',,., i :, . ······»F",i ! /
. /, -' () ,..".,
,~oo·, ,..... ,.~ ,.•.•.••...........•...•..•...•.••. ,\':..••..•....... ,
...............; ,... .- i~, .... .... .... •.... _, • ,~oo·,
".".,'}O~ .......: y >O~c::~,
, '" '_ _ _~,E~3! ~~\,t~-j :~ - - -\:~~\-:,,..,' ,~'"
01cu
'"im
00
oom
ÖDl!l,,;
ooom
o
lSm
"'08m
R/V SONNE Scientific Cruise SO-86 - ODP Pre 5ite SurveyWest African Continental Margi~ Angola/Namibia Upwelling (175) Sedl..."t.IIctlograph1.
lA'l1veraltaet Bremen
Figure 27 SO 86 track chart in the Namibia - Angola Upwelling area. Thick lines denote seismic andechographie profiles, thin lines echographie profiles only. Seismic profile #40 of EMERY et al.
(1975b) is indicated by a broken straight line. Oots mark potential OOP drill sites.

50'
40'
i!
3D'
JO'
''!'O,.~_
20'10'
~fl'IIA'IJlI~\I\ \ \
FS SONNEso 86South Angola Basin
Isolines: 20 mScala: 1:500.000 •Mareator projaetion at 16 'S~" ~
Date: 24.05,93
l'
5C'
50'
40'
40'
30'
30'
20'
20'
-~
'1" 10' 20']
Bathymetry in the Namibia - Angola Upwelling area.
10'
lO'
!:'~
iJi2
1MI·..t".tC1S
10'
50'
Figure 28
30'
40'
Jl/Bi
<::tt.{)

55
4.5.4 PARASOUND Acoustostratigraphy
The selection of drill sites in the Angola - Namibia Upwelling region was primarilybased on digital PARASOUND data. Only they allowed a c1ear distinction betweenchaotic and regular sediment structures on a meter scale. 8eismic data often showeda continuous layering, while the PARASOUND system was imaging a microtopographywith rough, scattering surfaces. The signal penetration on the order of 50 to 75 meterswas generally lower than in the survey areas further north, possibly resulting framlower clay and higher silt/sand concentrations. This may indicate an intensifieddeposition of planktic foraminifera or, more likely, higher proportions of shelf materialstransported downslope. The selected drill sites (Figs. 29 and 30) show undisturbedsediment structures which should represent a continuous and primarily hemipelagicsedimentation documenting the regional praductivity and upwelling history.
4.5.5 Seismostratigraphy and Proposed Drill Sites
Figures 31 and 32 show sections of seismic line GeoB 93-030 across the twoproposed drill sites (Table 5). The reflection pattern is predominantly regularcomprising several stronger continuous reflectors. Occasionally small hyperbolicechoes indicate undulating surfaces or a rough microtopography which cannot bedistinguished due to the Iimited resolution of the seismic data. It should be taken intoaccount, however, that the frequency band of the source as weil as the recordingsystem extends to several hundred Hz providing a comparatively detailed image of thesedimentary structures. If only the frequency band below 100 Hz had been considered- as for usual multichannel seismic surveys - the reflection pattern would appear muchmore regular.
Table 5 Praposed drill sites in the Angola - Namibia Upwelling area. For each sitethe geographical coordinates and seismic line numbers as weil as the date,time and water depth at crossings are listed.
8ite Geographie 8eismic Date Time WaterLatitude Longitude Une Depth
(m)
ANU-1 16°33.6'8 100 49.3'E GeoB 93-030 22.05.93 12:20 2775GeoB 93-033 23.05.93 21:45 2770
ANU-2 16°38.8'8 100 56.0'E GeoB 93-030 22.05.93 14:00 2423GeoB 93-034 24.05.93 0:35 2425

"cö·c::..,(0
{g
zß)
3c;:ni·e]:rco
3ü50 3000
56
.Edw-gniffi rtepUl [m:29~O ..::':'.;9:.0:.0::.. . ••...__ ,_~:,:JG~5,,:'). ,.. ,"' .. ,.

250
,~'~
~-'
.......... ....:. ...~.._:;..-
...--~-
Water depth [m] (Vp= 1500 m/s)
2550 2500 2450 2400
10?56.0E
: ,.- .,:-~.-
2600
16°~2.4~>;
1:10 .-- --.---.
16°:35.85) 10 56.0E
0:1~ 16°:36.65: / 10 56.0~
0:20 16°37.45:/ 10 56.0E
0:30
0:40- ,
0:50160:39-.9-5:'/- ._'____A
-_... " -.--
1:0Q
2650.-
......:::JCl>
»::::l
CO
°n>
'Tlcö'c~
Cl>c.vo
Zn>3crö.)'
c~Cl>
S'CO
n> ""U~ »Cl> ::0n> »
-:::::CIJS' 0Cl> CG)ZCl> Cl° ~OJ~<00c.v~,0.o n>U) .......j::> ......- :::Jcn Cl>Cl> "'0Cl> ~
-j0n>"'O0- 0-cnCl> Cl>Ulo.0'0...... ::::!.0.=Cl> ::J
or CO
=0!!?..O
~<:,-::::l
»Zcr\:>S"
L9

Seismic record at the proposed drilling location ANU-1 (see Table 5 for details).
°':'!~
:0N
oN
N
.• _ I~i~-r~~~••~i.;~r:f!;::"~trrt0l thmt~ü~ E~~:~ t~.I to~ ~i l i~· "';~::
.;:;:0;;:.-" _ ••~.n ~, _ ,:,*.... ,,~,'''W=;;;:i .__.--." ..._' ." ",... '" ........-........._:; .t= _: ::: .:::T.'.t= : :::...-.:;.. ..•tw,~"', ......,:?~~·..r......, t I.>t......" ••·_· """"_!•.;' f;~, oi" .;. •..,...·" '~1 , ••••., " "~r.>+f';~;...W;;;:~~:;;>!,ft;;;.;f:~~:~~~I~t~~;;.t;:;f!J.,'~~H;;.;.it;;'~'~rm'~1'-"lii'~UULt;mI~a:..ai.f.lci.U'a~~&o!k!-.~<lI:iol~:lH;t.:'••II!""
.:r;;,!~~~~r.;$;::;~;r..trtn~~~u~mm~~'f:;r:~f;;~;::1~;.~..:.;:-~:~~;.t:t;;:~;;~:m:~~i~w.;~~;.l.;:;~;1:u4;;~t!:;!.;.i..r~I.:;....!!...li.;UI1414I;,t.,~;;.:.u""itJ,l.~~"I"I~fm1lllt>t..t::.!ft::iffl'
:m:'7U;~~~;S:r:~:lr.:;rrr;r:l;~~7:~~rrr~t~::z;;m:;~;..............._.._._ -- " ,~~~::kt"i~;:i-;:=;;;:;;::::~::t:,::;;:;::~:;:;:;;;:r::::;:i:f:::f;;;:i:::4::~:,"'i'ii' "......I";iHt••• ";lI',,· .... 'P,',.··H,P ,. "l""'! -,r" •.\",;:, I'.,';'.r!;lrt••,f"';"""''''!''''Fi''i'i';'I'i''tii\,,:!.'!r'!"!'r,lt,,·,!·I"I!,i'ti;t
l
'iit., .!..;r'1:1 ••i:f ~t :'i'1,;: ~ I;~l t.;. t. i;;II!1;1 ~:•••~;.Il.{ l:I'" ·:i;:·1h; I" ,I, i "\~:::n~~:;~!~.:t~I;~;l:;~[[i;;;;~t:tt:;;!.::::;:t1r~,:%,:'tt;;l.:::;;;:::~ .... lt••w."... t ....,o r.~:ft •..,..I .._.. r''''''.~''~'Ii: ... t.'':4\1.""-,,,~''~·~ ..rl·l.''-. ~ ..t •• _.l.t."'."·IoQ~~......-~kt..~r~'f ••• r-.l>t>l\oi'"Il ...;:'hr ....pl' •• Pb>"'~...~uv:.. ~~tOO'l'''' ...a>b-IO''~'~~loll..... t..s..,:::~~~~~~!::~:~~:;~~~:::~;g~::~:::::;~m:~~:=:::::::;:·",,,""f! t S ULt,t u' I,H R10ft I>~I~ i'"t~ lll>t"r: ~·II·~' tU'. c,&.t"'r t ~tl-·' , , .. l.o-1>too4..,.~~'U"'t-~'tbl.... "",0 tJ,!t :~tl' '1 t[t,,,r ;.!l ......... ~.I ~ .., i uh"Le...tn.c.l!r .....'" rnr h.;'..,u \>o.H .r_tob"to~Jj J"
:1::1:~~::nfl~ ::;:::~mi1:,t~ti~:ltt!~~::rt·rr:~m*·::::t."~;;t:::;r:::mmi.~I h. !.~t.{. ig i .5 •.••.•" ,"""" •• 1PI"f"U'" ,"r,llt"r t'l'~!-LF 'e9
IIoa'\I"· .. ·t 1.•.'''1I":. t"if' FHi~1 !•.tn r.tt;! I'H:i '>;;:i i IH ..1lt",.ll. ,11 H:1~11:.i! ;!,t.,!:::i:,,,~,~i;l"I ••,r".t,..~h"t""If'''!;ff'''!''>i""",,~,.~.'''''''II , ~n'r:'~I1*·,••!"......' ...I...."'.,t:,..rlll't ...,r..... f''',••" ...." ..01" '11'1.;"., ..':::::r~~ :~jmm ~mmt1:!/:::i!t:; :tr:~; :rl t!! t:!:' :t::t:::j!~t!1 :tI;::~~ [1:: tfl'~! tIri'!!!i: f'l;" "~i!! '!~i~t .:W,~!1[;i!nitt 'I: t::! 11' t;ti:til;i, IH;f~~.t,s,!h ~il :;. ::ti,.:~~ l!,~:.r ~t "ttf?-J 1
1t"'t ~tPt"t: 11 :i.~,i ~Hl fif t: [hi h+"lt{.ta;,i-J~!i"ft:~ttbfi'~r1l-tti,
f •• : t u rh. l~ "~t f'. ~1.1 ~j, l·u'l r t~ i H"';.ft ~t·t :-g. ~fi.~!t ~I 11" {I t.· pP rIo.' f" HpI II ~",:;,,:1'1 !:::~~;,r::"~;" :i:"l,mrl!I,:;I;! i til:'· :::'''.:""; ~.hf'·1 'i;;! ff t~t ~:t"~l:~t~h.:fl.t.i' ..lt'hOII tt"t~h~ t~H!l.ito".t".'I.H.i'lP.il'~~~:'.I>Ultt ~~ff~lrtHt~hllt;'t: a:~r~tj.~tl!r !. f'~ 1~ ..",.. ,,~1r !l>l':l~&l:t.r' ..... ~t' ,.Hr"u~t> I·U l '.' tP :1 .~~ ~IUJ.,,~'1W:lt!:~:;.I~:;>'t:!',"."f~"I!!"":'n~:-:::-:.I,,1 ., ,:'mlldh,[H·,j'W·'W
r'
.~!.t~t! ~t"''':!"tfl~•• ~rll~ L~:~t;al,,$.:tti ,h~!tf:!-!:"":~ r,I tU,:tI rlP~ tt H' P;~h1f~:lt!f ~ ...~: ••,:':~;"fJ ':Hl:1 tiU.~: ';I! ~~[i~'H ~"J:t.t'ih; ,ttPdo~: r~1 trr.~ t.: rt't' ~;i:1, ~~riri tHiit~; t '11t:'i"l 'l::I:';" ql ..(i".-t1 F.t,lt'dillfll·t ,~::t:: :l:::::':':lfl~""'" ~!'. h
tt.il~ '\'i u,d o~'lll:uIHIHUHt,ttl'lltr.~tHt"~"r·;.·,····i~'lP:n:~:~~'tl f:.' LoftHH! t. ftH~LH 'lI! \fl~~ti-~ tPt~u ...6~ I~F;t~ tt ~::~ ~~ ~.u. ~I i ~~ j j Itt·,·
:.::,:tri1fI; i t::~:~ II tt1i H':~: tt::l ri:;~! HIrm:!i ':::!I:timr'H::!::!::';;:;;iI;:~i"'i"ttt:t.:f:.,!::~,I;n.!tt:,,!lr'i.I ••t:,lh.,.lil.,t:t!:I:PW;W:l"l!i.i.,."h.t:!:trr::r1:r:lt!Hi;p;:;HI:H;,,1;liHt:;n;:~Ht:lH~::tt:~,:j;;:lt;i~F't:i::;::;ti:~:: lt! ti:l:~i:i!:::1 f;:Hn:;;u:;~;l :~;:!:::r: ~I~;\: :~:t;a! i!l fi~;.; t:! ;;f:: i: ~ r1
I
H~ ~:i,H ~l o~~l~l !:-::.I !:~ ~~i ~ i!"!:~ rl ~:rl' ii~Hr:t!Htt ~tt: :lHUI n~~ ~~~:;.;··u ~t~t!~ ;.ge
!<I,;I>;. :' •.•••!'" ••! l'I"'["""': ,.. ll!l'i'·l·h·.·,"l· ··"t"""
.;!!:H~;IHt~Ha!t:;!:;1f;tH::~'~r:rr;1t·!I\!!irH!!:mli!hl;;f!H!l~imfl;~l;tl!!!!ii.~t~Ih-..,:-r.!.f~~!,~'iatt:'l/tl.Ht)IHP' t"hlr!t\: .t$;l...1 :.Il~P'· {'~ i!\'f!~e.~t.r~:~'::'.;::d[':t:!il .1!i:;1il f11! Ii!~!.i iI.'~lrr'lt'd i'~lt ~I·l":i.n tt:~ ,Hf.}H:::i! !~1rrl': ~'i H:~::'I:~:: I'::t:'.lt'tlti i[, ii t::t \ii:l I1 ij 1'.1:." .t·, fI i" !~fi :i: i 1'1 t
iZt:;
!H;r.lt,": lr ~!'''''I'1.1 ;,'!::!I•.•;[.I'rll"I':::..,11[, i ~ t:'ll:'! .!Il.:t:;!mIi I!: i•'I.! ".: rl' ::1'\: [! t:: ;:~f:~;:.;:~~;'l! l:1[1 n,:11 :tlit:,f\::a:i i~::ri [:l;r!i:.:, ,;.;;.:
. " ,I" .!.~~jJh.'trp,~~.f1nrH:~~h:t!~~~;~~~~H!H~
mu
ANU-1
~
N~
o
<:>
~ ,' .. ··f .\. i,1' t "1;' T!Tr~'fTTIl'T"-ICfi'I'if'l'f~"'tT'T"aillffiTITI~~l•• t T~'.'I ~f 1!.I1Hff i! l;~. 'lll! IjI fl h~'~.t'II"II'I!,,' ll"!I;'1' ;~: r ~, .. hf/'.rif,:h, pPt ~ .. -+tl·r:I t' I: H 'd, tt ~1"~'''''h.H t ; ~ • t "t' ~I' tU, ."t IluIr'l~ II.ll "iI.. ,r/,i'..l i'1.'!;'iil;"t!IU;'r[.l,il,h·tllh:.f'.: ,tfh, '..11.,.1",01'u:r~lr.(,;'~ttrl 'r t:t ~'i Flau 'tl hl ~,l~tr.! ~~l' ,rhit.! f"I1"! .'[.H.~ htt~hlll hq "L!~'!:i~ft,t:;HI:H:L'1!l1 t::::~tH~ir~an;~ntHl~!tli~, "TI t'~ .. f '.~c, hrl h. ,10, .: " .• ~ r I • ~ .' " , ~ o. '. ". :". .
~~~;--I-~:~. wo t.Io~C.rM' .,.C_-IIli\:rF;,~~,;I~~~.~r~:1';_I!~tl:h!1''''~~'.:'~~'''t~..;.~~rt'''''-'~'!'l:tl':'tl'tti-t;R~r.~f:$'i"1"ti;r;;=rtir:!~:t:~~::-;t~~~~F~::t:r~:?"f~··'.I;t:)"";·~~'hJ:~i.~~::g "-=!?::?9-:';~i~"teL ;: ·~~';;V'·~· ß." ...... "'.- t ;......,.~.....
N ".~..J'~~~~=M::t·;~~ "~t'Gt:II$l':"I:"~~-.3' i .. :.e:,.t:.o-:~I1.':;';'.";"'c.t.::tt.-.s..u~";~f:.;~,~;r:~~t.!."'J'\J".'1"hlt~U,.,,•• ~'~F ...gt~
j:!~~~Hl~~~~f~~~~~fJt~"1:~ttfr..:~;t.~r~~tll~~~!t:i~~:;~~~~l~:~~~~~~J.9.~r~tet~~~ ..,,;tn~'fnmUf;uki;t:Ui.k"~E!U:'!"~~~~t.:r~jt~;~t~"~~:'·FJ.~~~~-..n:"~rllt'tterTVfttr!'!t:tEat~rt t Frt;.i~ttt r; ~~; r:r!r~;:: lt;.~~!:t.~t:f~:;;'~ t IM ~~.~! tkl.i:",~,,;, Io4~Hf!~" ~rOo!'tr,a6-:"'tt:l.4~~~~~~"~~~~Z~I~~[[~n"~~';tr~t-H~\>i'~~t.~tl~;~&t~:~:~:.tt.;~t:l~t~;t;~:!t'~F',,"~;..s.tt~~ .~"'~i ~Itt(l-tkff~~t.tH~r~;~~tt 1"1"~_ t:~~~rn;.,biit:.Li ui t;.J.o.: "fi4U·itLb.~,~~P.lH'trrt,":'~~~~~'l~tl t~..t~J' ..~I.r".~ .~_~U"""'''''1IoO.rto'~,,,1l
~;;:8~j;;H[H~~;tl~;;r;R~~~~;H;i~[ll!ir;im;;;!m:~m§m:gf:r~~,~"~l1:~"P'Lt! 'I hHf '''~P-Ll.f.t'''.t't.t9'hll.t:1>i'''''~htf...f 1-;;,.'1' !.rj •Cl'l!,!'i> ........ ,1" ...·"rr·I"Il'''F;i~irHn~~U~t~ü ;f:~ r~:~ ~ ~ii~;~!~~~~ i[~~H~l Hirt~tftH~:H~! :t!tlt!tf ~:n·in~t
~ o~t~; ~t~~f ~~ ütH:;: f~E~t~ ~i f; fr~hrt~~~~r::t Hi;~~~rrf;~n:i ~t r~;;;~ r~:;t: ~Hr~: ~L:~~~~~~ =:1 i h' ~rt.r....'~r- ....I ut.· :~~·;.I.:..tH:.··I~' ;.ttIHt~~iht~h~lt ... rt~~!·~f~...~,ti:ltff~hl ..f:r;ce .\ t ~.: .. ~ I~.I ~""t·· tOt: Ir :tr li ~~f'::+. t, t't't .. ,"".......t.~t...,...H::l"·~ .. ,.t.· .. l h;:rtHta~!o.. ;.u.:I'I u;; ~~~~t:~iri~~~~:tt:it~;~~~~~tt!t~~~h::l.t:j~~a~~r;In-:~~~,t~~~~~~>- 1':~:t~i'Hii;i~;r::~d.r~~'I~i'!;~f:'!:~.==~~~r:~;:;r~:it:::~;7:::
,~,~);H. ,,; ..;Hf'"'r.!fr1- ,'H\.'{~~~:":-.·\. ""'"". t;'t"vt".· !,,!"ll:.~ ;.p ra!"tt'H~,kt.'·t·~ Hu+ro.t tiU .....~ ~~.~ ,f'~LFr~: t ~~: ~!.' If.;r-u~t, ~ :~'."f1I ..~'.t;.~:t "'t tf,,~·"L,l"~!;' ~t""P' .. t, j'f 0 '", t;" , II.L:. • .... :",.~.ll .:.~..,J~.~lof.h",....... ,t""';"L"Ik.n ·tl.~H'L.lolo·t·""Plfl'o 0 L.!' ~ii:lr: tnt;:f~::i~1 ~~f!I· ~t :·f ;.c;flll'~ Pt! f;t~ ..'H ,;1 f+~:1 t;I ~itt~.tf let rtf, .~j. ~~r!-~x: co ~ lf1\:;. tf~ °
1' 'hi ~ttl ~:.:rr; .1:lt:l\.rt~~.~~'r,.t j,li·i ..n·.;i ,.t i tÜi.·;'''iÜ~ "t~h I, !t'~l;l~
.- ~ t ll .. ~tt~~f. ~l~~P~ t~~;~~;'~~~f~t! :'",!=lttl~iJ ~Lt~:f! tL\~t .~t !~l:l! änt~.~f'f~ ~~f ~ r' ~~!.~"tt"~"r.~!"'~Uoi"Io~. ~"'S'"l~~i-f .'"~W""fC~~ hdo~"tt!'l t Ho!"' "~"I ,.;.,.I.t-! Dr'f'~~"~·f.~I.H!,r"t•• ,~ :tl~r"~ ,~ .... f ;~a.tr"t'! "u+IiM'rtW:"tIoll>!*rr"hto'! .~!rtt •••• "\.~"~I!~UI"'40,..: ll.! r~! t lf!..l fI r!HP:"!.r",!rrrt~! ;H.'''t'R.,m~r.tH J.i!I.~ I r:.:I' I",~h~t ~ ",,·;.~t! ~ t ..afit fl.;!I itll !:\ ~:.:~'!!~:IH~:i t;~i, i::1 fi l:;~~ti:~ i::i~~"f:! t~~:-, 'l r~ I':' t.\I.! t'lo;trl ; t· ~~I ~ {"~it! ..~ t~ ~ ~t,.~~u h tt1n"':Ltui;ö,i ~t ~!If~hwi.aM"!~~r~'~!'c~!~!t'ht~1'~1' ~~:..~tf' tJ t:"l,~tptl tt~ t; Ef t : ;~:U ~;i ;;f;;;~! ~~; ji~!.n~;t~:rt t n~ ttati; :~:t~~ii ~~i! ~~:;n~:!~t: ::;~t:l: r~~r: ~ ;J~ tf~~! ~!i ~ ,i:t; .c!:.r! I ~ :.t~ ,.H ..~H ~t~hL;fT!:J f t&!:~Jl~;f;:lt':h IItr~f~: ~,t!~H~:lj~:~; ::~;t!! ~~~!rt:! ~!H! ~; }~~r;~. ~HH! trI~:! ~ ~:n:: ~~~!~:~!t ::;~~:~~tr:~~~t; ~ r:~:;~ ~:~...;t-t t~!i ~ ~~ t~~ ~t~~ ~ \ ~ ~ l tf~ ~ ~ ~H ~f 'Hl'~rt~S.f i ~ H·t:, f· ~! i'ti4 ~ ~ "'t :"'·f::J'! ~~FltPin!;, ~ tr~:~:;"I ,i t '~;!'h1 r ftU~a ~.r.!: ~~1 ~~tf.·t~tr:i~~': ntt:~~;r,tH! ,.~tr~:~! ~ :~Ht t~i~~: ~~ ~:.;t"Ir~ Hi~ I : u~! i ~ ,"1:: L; l.r:-,=~;:n:~l PI t.~.1 i ~i' HII ~r·, ptl."'rh ~.~ ~ht· h~~ ~I'''t r .~l"illn0Hq ~ ;!;..~ l~ u~'~~i~'~ ~t~ ~:'~'f ~t:: li~:r;:i.p:\l:~~i ~ithHI.~i~t'.i ~fo~~u: ~l tt~J ~ tr ft •• :~{
o I'HtH~~~rUh~tatrr •. =JU'~","r.. l:'l:IC.·~Hj.··r; '1" tO·t~ '1, J.... ttlo~! .. l! .. h":'!.!t~ ~nt~t:~ti.n~t~rt:t:t~:;iUt::t~~Ü;:~ntt;~:tt~n~;1 ::~~t6~H":r:~:t:~r~ j:~: :~l~:;tt ~n'~~ ·.I~:t ij ~~I i.~~ti;, t! t ~lo' iP=q r1 i~tJ~1 f;' ·~I t i r ;: t:t J,j ~~r!:!1 t t~! Iot~11 rt 'hl t .t:~ t
J{[~ ir~~;; tHH~~t t~q iitU U~f;;i ~~~~nii:~;ngt~~tr~~~ :tHH~::~;:~~itiii ~~:;; t:::tr, ~il.H~H\!h! WüfHHmtt;~::mmm!n;!~1l::!:~;:HtfH:!i:;~Him~~ F;l::;!~r!;l; iIt'r iIr jlt!-lpttU ~ :..~rh~Ll ~~i :.Lt.rr: :a~:nt~r~ ~H. : t11r~Y~-~ !'r ~it#H; ... ~~ t,:~Ul t
!~ PI~~I;H t~t;1 rt~I,: ~ntt;i fi i~~, t;t ;::~lr~~HHth H:I~~; ~·l.~h;' ~ :~l~: ttH ~ii ;~, ri:. ~:~:; ~;Ple l , ....... ,t:~n., •... ".r.~·~ ·..h.t: .. t ."t 'r., hi ••• j, 1>10, ,,,'.f.tlh h'l t IIt tH"fi :11 i. _ti~; "r~ :~;t~~l Ir tt rDi-"sr"t(i ~i~tlt ~~'rt';tl· "~ih t~,.P·11 (! 1'_" ~~. t ~~r.t~~t' ;,tt I; ~~ ~~; :~,.~~~~ ~I ",;It.t:::ttit::1n't·r~ .rt~::h. :~ptit.r:i ~H ~ t ~;t~;~ ~ r~~r1!",1~~mlin1[jliir:WHl~lml;;lü!H!l;liiIH[ligt;mn..:Hf~ig~!m~\l~,!iffH01'1 "lllt "till t"'~"::'t'::'t .·trllftl···..ll·l ..lp~ '~'f'f'('~1 I'· ·l··~h' 'I. r'.~o "J Jh! ~,. 11. ::Io! ~',t I 'rrittot~;.n'i:. ti~i"',iltl;rrtlir.tl.f,[t .... ~ [' t.~ thH!';';rr~ ;:!Il~ . __,~ ..•.. ,l.t " ••• t ... " •• ~, ~~; ;.~hlitih.l~;~;D
l!
'"~ .. -<n 0 ....... '_>'0- 4>J IU')O·... c: :;:)
'IJ-_ Z
'".,
ii~~""'":::;:
u."
" E "l'lo U'" ••
" " .. '"t-' CO ........
~N .."" "'00 ...
. ">l>.
'il. ~ •• glUo.tt-_Cl o-!
.,t;-"i....... +' <V
e ~ ~ ~a) I ~.- :>LC) '- l>. .öl
CO -.~ ~!
> :z:'c .. ~ '.::;) e I ~
-oe.. Q (I) oe
].i:;;'"
" ...- '"l1i~:3 IV I ....'- ... '-10 ··u< <:>"":;: '"... '\0
>- '--a .c
'" <:>....
'- .... 0'" 00
~.,;.c;""
u 0 '"w~
CO~
... "-CIce '"
g 0
~2w_ '" z
-~%-..
'2~:Z:" e-It\ '"
"Hit '" ~ • e0
.....-~o "G- en~eu ..';;;.::!.2- ~
.,:10
- '" 0..... <I.l'.z:::. .... .,._ L.O(l)(/)"- "' .... 0.
11 >-
ttlttl~m~ EX.... m-il 0:11:
"<:::::l
'" "w
Figure 31

"TIcO'e.....Cl>c.vI\.)
Cf)
~,Cf)
3ö'.....Cl>()o.....0..
~.-+::::JCl>
'"0.....o
'"0oCf)
Cl>0..0..~,
S'CO
o()
~0':::::l
»ZcrI.>Ui'
Cl>Cl>-lll>0-Cl>(Jl-ho.....0..Cl>.-+
~,
.!!!.-
Sediment Digital sediment Echography I Parasound, Univ. Bremen, Dept. of Geoscience System S E (2.0). 28.02,91
~==z Seismic Section Plot #FE: 1 Scale: 6 Pixel Page: 28 cm Ampl: 1,00 20.06,93 12:52
Ship: SONNe Crulse: 50-86 Author: v, Spieß File: PROP001B,CPSTime: April/May 1993 Ares: Congo Fan Date: ~ int/inkr: 1401· 5400 I 1
~ Seismic line GeoB 93-030 Proposed drill alte ANU·2Echography Flgure 4,6
UNI HB Procesaing: No 150.0, Thr 50%,
13:50
13:55
14:00
69

60
The local and small scale disturbances in the sedimentary sequences produced bythe depositional environment might possibly complicate an interpretation of the drillingresults. On the other hand, the selected sites are among the very few places in thearea with a reasonably clear, parallel reflector pattern which should allow thereconstruction of the regional sedimentation history.
At this stage, the available evidence to identify seismostratigraphic units in theseismic records is even more tenuous than at the other survey areas. Tentativelyassigning the distinct high amplitude reflectors marking the base of Unit 11 at 230 and350 ms, respectively, to Horizon A would result in relatively low average sedimentationrates of 2.5 - 4 cm/kyr since earliest Miocene. The base of Unit I is associated with ageneral change in reflection pattern to lower amplitudes. The upper series of sedimentmay thus represent upwelling conditions, while the mainly transparent packages beloware affected and to a large extent deposited by turbidity currents. Similarcharacteristics were also observed at DSDP Site 530 in the southernmost AngolaBasin.
4.6. Additional Seismic Surveys
Two additional areas were investigated with seismic lines at the end of Cruise SO 86which should be of substantial interest for the future planned drilling operations.
On the northern flank of the Walvis Ridge a detailed survey was performed in thevicinity of DSDP Sites 530 and 532 and connected by a line over the ridge flanks (Fig.33). The data will be used to calibrate the actual seismostratigraphies with previousdrilling results using lithologie, sedimentologic and physical core logs as weil aslogging data. Compared to available multichannel seismic data, the resolution couldnow be increased by a factor of 5 to 10.
A second survey (Fig. 34) was carried out across proposed drill sites NCB-1 andNCB-3 in the Northern Cape Basin (EMERY et al., 1975a), where multichannel datahave been provided by the University of Texas (AUSTIN & UCHUPI, 1982). Thecrossing of Site NCB-1 shows undisturbed sedimentary sequences almost withoutlateral changes. Immediately after passing over Site NCB-3 further seismicmeasurements had to be abandoned due to problems with the seismic source.Although the crossing line could not be completed, the results obtained also indicatean undisturbed sedimentation in the vicinity of this site.

·;··········t ········1···1··········:·········11······ .. .. . .. ··1···· \ (' ~{ .Cll..
8..."'.I!:...
~
o
tl...
o.~,,;
..~
~;
'"
01-"
.............. ': "':!"
!.lIR4
:r c·····
y'"
.....; , T ; ::..,' . \ L ··:~r;·::/·.. .. '(', i ..
190 30'S: ! ...! : , 19"3O'S
':~E::J:;F;~~~;=~r:I·~/[~F:, · "~,, ····1· ··.. · ·,···;, ·· .. ·; · 1
"l -.•......- -' ~ :" ······-7·······::··:·~~···!· ::.~~- .. - : <> ••••;. • ••• __ •••••••~ ..
~ \ j ~ ~ j
20°00'5 ;; ; '-, i. :: 2O"00'S
\;; : l·.'i'" "'0 ~
0 000 ...
0 0 0
,,; ,,; 0
'"
..0
0
~m
80
m
R/V SONNE Scientific Cruise 50-86 - DDP Pre Site SurveyWest African Continental Margin: Walvis Ridge. OSDP Sites 530/532
._.a;-e---.-ü
Slld1...tel::hDlIrllPh1elkllveraHaet BreNn
Figure 33 SO 86 track chart at the Walvis Ridge in the vicinity of DSDP Sites 530 and 532. Thick Iinesdenote seismic and echographie profiles, thin lines echographie profiles only.

"'0g,.,"'0~,.,
Wo
g
'"
Wo
~,.;
....g
'"
Io.~
'"
'"
"'0l!:
················f·
··············..r············ .. ··;··· ....
...g....
········~······ ....·..r··· .. ··· ..·· r·· ..··..·..·y....···· ..·····(
"'0l!:'"
\.\........... ··t........········!········\··
Wooo,.;
\ ..\~
"'0!'!'"
- , ~ '." ....• ~ .
..............; ·······f
Nooom
I······ .. ··,· .. ···.... ······J··........····!···
I··········'···············~········ ~ ~ \'-:
)rl1T_;j-;:~ ::;;~~~-J~:'.::25°30-5 ~ \ j,. :: :
\. ~ ", ,.. .:: 268
3O"S
'\ ~ ""."., : i;.. \ :..............,.. :. ", ., ../ ! .......\~... ......
................; -{;-- : ··..,·,:·y·······..····.. ···· ..····r.. ·········T···········~ ..·· t~··~· ;.;~~ ., " ,~\ 'J, '! ~! ~ /1 "-,,.,
25·00'5 : 00 M'.
/
I ... 'I]:::;,;<:\t1 (i/'rl!"26·00·S I i I .' : , " I I 26.00'5/.: ':i
............c//'\' L , \~ .
Nco
R/V SONNE Sc1entific Cruise SO-86 - ODP Pre Site SurveyWest African Continental Margin: Northern Cape Basin
......"*- ltIIIm"
SIIiIllllltl1t~lllllkllvfH'Bltaat llNIllI8n
Figure 34 SO 86 track ehart in the northern Cape Basin in the vieinity of proposed drill sites NBC-1 andNBC-3. Thiek lines denote seismie and echographie profiles, thin Iines echographie profilesonly. An echographie profile obtained during R/V METEOR Cruise M23/1 is indicated by abroken line.

63
5 Sediment Sampling
R. Schneider, L. Oittert, P. Helmke, U. Rosiak
A multicorer and a gravity carer were used to recover surface and late Quaternarysediments at 10 stations on the southwest African continental margin off Congo,Angola and Namibia from water depths between 400 and 3000 m. Aseries of in eachcase 3 stations was positioned along transects across the northern flank of the CongoFan (Fig. 2) and in the Angola Diapir Field (Fig. 15). One station is located just north,another 2 are located just south of the Angola Benguela Front. The last station of thiscruise was sampled in the Cape Basin near the upwelling center off Walvis Bay. Allrelevant details of the sediment sampling operation are summarized in the station list(Table 6).
5.1 Multicorer
The multicorer is designed to recover undisturbed surface sediment sections togetherwith the overlying bottom water. The device used during Cruise SO 86 was equippedwith 4 small (6 cm diameter) and 10 large (8 cm diameter), 60 cm long plastic tubes. Atmost stations all tubes successfully retrieved the uppermost 22 to 45 cm of sedimentcovered with bottom water. In general, the following sampling scheme was applied:
· 3 large tubes for the investigations of planktic and benthic foraminiferal assem·blages were cut into 1 cm slices;
- 1 large tube for organic carbon geochemistry was also cut into 1 cm slices andfrozen;
· 0 - 2 cm of surface sediment from 2 large tubes was sampled for the investigation ofradiolarian assemblages;
- 0 - 3 cm of surface sediment from 1 small and 2 large tubes was sampled tosupplement the Atlantic surface water reference data set based on plankticforaminiferal transfer functions (Pflaumann, Kiel);
· 2 small tubes were stored for investigations of magnetic bacteria;
- 1 small and 2 large tubes were frozen as archive cores;
- 2 bottom water sampies (250 and 100 ml) for analyses of stable oxygen and carbonisotopes were stored in glass bottles.

Table 6 List of Sampling Stations, SONNE Cruise 86
GeoB Date Coring Bottom Latitude Longitude Water Core RemarksNo. 1993 Device Contact Depth Recovery
(UTe) (m) (cm)
NORTHERN CONGa FAN
2301-1 12.05. MC 05:25 5°04,O'S 11°06,TE 1377 38 homogeneous mud, olive-green,4 small / 7 large tubes
2301-2 12.05. SU2 06:27 5°04,O'S 11°06,TE 1379 - surface sediment in weight2301-3 12.05. SU8 10:47 5°04,0'8 11°06,7'E 1378 1532
2302-1 12.05. MC 14:00 5°06,4'S 100
05,5'E 1830 37 homogeneous mud, olive-green,Hß, bioturbated, 4 small / 9 !arge tubes
2302-2 12.05. 8U8 14:24 5°06,4'8 100
50,9'E 1830 1418 277 to 301 cm disturbed during sampling,CC: homogeneous mud, olive-green, H28
0),.J:>.
2303-1 12.05. MC 19:53 5°11,5'S 100
22,0'E 2491 45 homogeneous mud, olive-green,3 small / 10 !arge tubes
2303-2 12.05 8U8 21:35 5°11,418 100
22,O'E 2494 1736 CC: homogeneous mud, olive-green, H28,°-15 cm missing
ANGOLA DIAPIR FIELD 12°8
2304-1 18.05. MC 23:13 12°01,3'8 12°27,0'E 1998 35 homogeneous mud, dark olive-green, hard, H28,- 5 cm oxidated layer, 4 small / 9 large tubes
2304-2 19.05. 8L12 00:43 12°01,2'8 12°27,1'E 2003 554 CC: homogeneous mud, olive-green, hard, H28
2305-1 19.05. MC 06:16 11 °56,1'8 13°15,1 'E 897 26 homogeneous mud, olive-green,4 small / 10 large tubes
2305-2 19.05. 8U2 07:02 11°56,1'8 13°15,1'E 897 495 CC: homogeneous mud, olive-green
2306-1 19.05. MC 09:01 11°55,3'8 13°23,O'E 476 28 homogeneous mud, olive-green, foraminifers,
4 small /10 large tubes2306-2 19.05. 8U2 09:51 11°55,3'8 13°23,0IE 479 358 CC: homogeneous mud, olive-green, hard, H2S

Table6 continued
GeoB Date Goring Bottom Latitude Longitude Water Gore RemarksNo. 1993 Device Gontact Depth Recovery
(UTq (m) (cm)
ANGOLA BENGUELA FRONT
2307-1 21.05. MG 15:40 14°13,8'S 11°31,1'E 2888 33 homogeneous mud, grey-green,brown oxidated layer, 4 small / 10 large tubes
2307-2 21.05. SL12 17:30 14°13,9'S 11°31,1'E 2892 724 GG: homogeneous mud, grey-green hard,foraminifers rare
2308-1 24.05. MG 07:19 16°43,6'S 11°02,3'E 2121 24 homogeneous mud, olive-green, foraminifers,fluffy-Iayer, 4 small / 10 large tubes
2308-2 24.05. SL12 08:44 16°43,7 S 11°02,3'E 2114 1133 GG: homogeneous mud, olive-green, H2S,foraminifers 0)
01
2309-1 24.05. MG 12:29 16°34,7'S 100
50,6'E 2672 29 homogeneous mud, olive-green, foraminifers,green fluffy-Iayer, 4 small / 10 large tubes
2309-2 24.05. SL18 14:14 16°34,7'S 100
50,5'E 2675 878 GG: homogeneous mud, olive-green, H2S
GAPE BASIN
2310-1 27.05. MG 03:22 22°15,9'S 12°32,4'E 1019 22 carbonate-rich mud, olive-green,foraminifers abundant, 4 small / 10 large tubes
2310-2 27.05. SL18 04:17 22°16,O'S 12°32,3'E 1024 686 GG: homogeneous mud, olive-green, H2S,foraminifers
Goring Device: MG Multicorer (10 tubes)SL12 Gravity Gorer (Schwerelot), 12 mSL18 Gravity Gorer (Schwerelot), 18 m

66
5.2 Gravity Corer
With the gravity corer between 4 and 18 m long late Quaternary sediment sequenceshave been retrieved at 10 stations (Table 6). Immediately after recovery, the cores weresawed into sections of about 1 m length and stored in the laboratory to equilibrate toambient temperature. Subsequent to the shipboard whole-core geophysicalmeasurements (Chapter 5.4), the core sections were cut lengthwise into an archiveand a working half. The sediments were described from the archive half (Figs. 35 to 44)which was then frozen and stored at -15°C. The working half was stored in the coolingroom at 4 °C after the electrical conductivity had been measured at 2 cm depthintervals.
With the exception of core GeoB 2307-2, the cores will be subsampled in Bremenfor measurements and analyses of physical properties, stable isotopes, faunalassemblages and organic geochemistry. Core GeoB 2307-2 recovered near thepresent northern boundary of the Angola Benguela Front (ABF) at 14°14'8 wasextensively sampled on board. Two parallel series of syringe sampies (10 ccm) weretaken from the working half at intervals of 5 cm. This procedure will allow to start theplanned shore based work on the ABF variability immediately after the cruise. The corewas also sampled for a detailed paleomagnetic study.
5.3 Sediment Pattern
According to the visual inspection and core descriptions the sediments recovered withthe multicorer and the gravity corer are probably all of late Quaternary age. They wereburied under anoxic conditions as indicated by a strong H28 odor emitted by all coresduring opening. The sediments can be subdivided into five groups related to thespecific oceanic environments which prevailed in the different working areas.
CongoFan
In the northern part of the Congo Fan, where the longest cores of this cruise wereobtained (Table 6), the sediments consist of homogeneous, dark olive-green,hemipelagic muds throughout the cores. The dark color hints to high organic carbonconcentrations, while the carbonate content is presumably low. Only small numbers offoraminifers could be detected visually. The muds are very soft down to 10 - 12 metersand are characterized by large burrows which sometimes are open or filled with verysoft sediments containing large amounts of water. Open burrows have been observeddown to about 6 m core depth.
These muds are typical for the deposits in the upper part of the Congo Fan andhave also been described from the area south of the Conga Canyon (JAN8EN et al.,1984; SCHNEIDER, 1991). They reflect the high concentration of fine terrigeneous

67
GeoB 2301 ...3
Litho.. Struc.. Colorlogy lure
o 1:-.__=-••=-;_--:_......; _....; _-r;---..,..-----4- - - - - - ce I- - -
::~:7:7:7:~:7 ..:>..:> 5 Y 3/2- ... ... .. ... ..........................------~.':'.':'-':'-':-':-':.- .
... OB
1- ::7:-::::7:7::_ ---..... m _ .... ...
...................... _._.-._._.
.. GO ... ... ... ...........................
._ _._ ... ............- _ .
............-........... _---........................... co ... _
3 - ._;:-;:-;:-;:-;:-;:........................
0- 19 cm: oxidized brownish layer (10YR 3/3)
0- 670 cm: foram-bearlng hemlpelagic mud,olive-green, upper 340 cm very soft, occasionallycontaining shell fragments, strongly bioturoated, burrows(0 0,5 - 2 cm) open or filled with soupy, water-rich mud
upper 100 cm disturbed by sampling operation
148 cm: peaVwood reliets
.....- _.....-_ ---............. -._ ....... ... ... ... - ................. _0_'..................
4 - '-,:,-.:.-,:,-,:,-.:.-.:.~:::7:7:7:7:7-----......... -._ ........ 0------v,:,-,:,-,:,-,:,-,:,-,:,._._._._ .......... ,
... ... ... ... ... .........................
55........................... ... ... .. ........... _.-._ .... ... .. ... ...
... _----......... - .......................... ... ... ... ... ....
6 ::::::::-:::::
5S670 -1350 cm: hemipelaglc mud, olive-green,very low foram content, shell fragments, H2S odor
697 - 702 cm: disturbed during coring operation,sediment sucession o.k,
5Y3I2
SS
~'-:.:.:. .':.;;'
7 -1!1!1!1!I!ili >D:...:-:.:-:...:-:-:-:-:-:-:-:- S
~~~~~~~j~jjj~' SS10 ..J.::..::..::..;::"'::".;;;.J...~_.L-_---l
m (depth in cere)
Figure 35 Gravity cere GeoB 2301-3 (northern Cenge Fan area): Cere description.

68
GeoB 2301 ..3
lithom Struc- Colorlogy ture
10 """"=,,,,=,,,=,,,=,,=,~---r-----f
5V 3/2
55
SO
670 -1350: hemipelagic mud, olive-green, lowforam content,shell fragments, strongly bioturbated,H2S odor, increasing hardness to the bottom
55
1350 cm - core base: foram·bearing hemipelagicmud, olive-green, shell fragments, stronglybioturbated, H2S odor
1532 cm cora base
5 V 3/2557:7::';;::;;;:------ .................... '_ .... ... ... ... .. ................ "" .
............................ ... .. ... ... ..,. ...
........................... .... .,. ................................. _... ... ... ... .... OS> ...
............................ ... ... ... ... ... ..................... _.- ... .,. -
....... m .
16 -'--__-'--__-'--_---1
m (depth in core)
lithologie boundary, sharpor bioturbated
··origin of burrows sometimes not clear:gas cracks or bioturbation ?
silt/sand layer
foram-rich calcareous ooze
.. foram content estimated by eye
Summary 01 symbols used in the graphie eore deseriptionsLllhology Structure
~.:.:.:.:.:.:.:.:.:~ hemipelagic mud, very Iow ~ bioturbation.................. foraminifera content· L.::.-Jg~;~;-;jj foram-bearing hemipeJagic mud ~ burrows'" open or filled with
~ with water-rich sediment
lIIillII] foram·rich hemipelagic mud ~ mollusk shells, intact or broken
~ plant debris
§
Figure 35 continued.

69
GeoB 2302..2
ssSO
....................................- ........................... _..... _..............- --'"'" CO> ......... .,. ...
CI ...._ .---_ -17:-::-::-::-::-::-:- ............ .,. .-- ... ---................. "' .....
SS~
ss
5V 3/2
o-9 cm: oxidized brownish layer (10VR 3/3)
0- 820 cm: hemlpelagic mud, olive-green, soft, fewshell fragments, strongly bioturbated, burrows (0 0,5 2 cm) open or filled with soupy, water-rich mud downto900 cm
277- 301 cm: slightly disturbed by coring operations,sediment sucession is o.k.
beginning at -300 cm: H2S odor
334 and 386 cm: Layer with intact mollusk shells
-450 cm: mud becoming harder
820 - 880 cm: foraminiferal hemlpelagic mud, sandydue to high foram and shell content, no open burrowsbelow this level
820 - 1418 cm: foram-bearing hemipelagic mud,increasing hardness to the bottom, few shell fragments,bioturbated, H2S odor
10 -------m (depth in core)
Figure 36 Gravity cora GeoB 2302-2 (northern Congo Fan area): Core description.

GeoB 2302...2
70
lltho- Struc- Colorlogy lure
10 -------._ .. -..... - ..................................... -----....._ .... ... .. ............................. _-_ --....... ,_ -.- ....... -----...... - .... ... IM ...
. _-_ .... .......................
........._ _... ... ... .. ........................... ... ... ... .. ... ..... _--_ .. ........................................
-------....... m .- .. _----...................... _--_ .. -.",.",.",.-"",."... ... ... .. ... ... ........................ _."'-----.......................
.. ... ... .. .. -....... - .
._._ .
... .. ...._ _ _... ...- __ -
..... -----14 - ::~:~:~:::~::
s
s
s
5 Y3/2 820·1418 cm: foram-bearlng hemlpelaglc mud,increasing hardness to the bottom, bioturbated, H2Sodor
1418 cm core base
15~__--I..__-1.-..__.....I
m (depth in cors)
(For graphie symbols see care 2301)
Figure 36 continued.

71
GeoB 2303..2
lItho.. Struc- Colorlogy tureo +_~_~_~_~_~_::r----'-----1
............- -.... ... ... ...
.........................------._ .-----.......... _.-.-._.
- _---._ .... ...~:~:<~:~:~:~... ... ... ... ... ........... _.- .........------
... GO ....- - .-- .. -_ .......................... ... ... .... ... ...
... ... ... ... ................. _ .3 - ._~-~-~-::-::-::
............................ ... ... ........ _ -._.- .... ... ... ..._.'-''''''''''''''''-_ ... - .. .........................-----......................-----.........................
os ... a ........
.... _ ... ...
.......................
5 ·..z...~ ..::-:...~-;......._ .... ... .. ...
... .., -.------.................... , .... ... ... ... ... ...
... -----._ .... .. .. ...~-.:-.:-:.-.:-:.-:.......... _.- .... _.
.... ... ... ... ... ..........................._ ... _---
... ... es ... ... ............................-----.............-.........-_ ... --............................. ... ... ... ... ...
... ... ........... ""0_ 0 .
8 _._~-::-::-::-~-~._._ _.-.,. .. .. ...
.... 0_0 .... _ .---_ ................- ..:-:.-;-:.-.:-.:-:......... _.-._._.
55 f-- - -
5Y 3/2
Cl1J::rb
0@
(:;j
55
55
55
55
55
upper -15 cm lost during coring operations, oxidizedlayer missing
15 - 1736 cm: foram-bearing hemipelagic mud,olive-green, soft, occasionally containing shell fragments,strongly biolurbated, burrows (0 0,5 - 2 cm) open or filledwith saupy, waler-rich mud
beginning at -200 cm: strong H2S odor
9- ::~:7:~:~:~:7
:=±=±=±=i=~=± j~:-::~:7:~:~:~.......................... oe .
10 ------m (dapth in cera)
Figure 37 Gravity core GeoB 2303-2 (northern Congo Fan area): Care description.

GeoB 2303..2
------......._....--------0 0 ... .. .. .. -0._ ..... 0., •••.......... 0"'''.''-------
72
1040 - 1058 cm: burrows filled with pteropodsand pellets
15 - 1736 cm: foram-bearing hemipelagic mud,olive-green, soft, occasionally containing shellfragments, strongly bioturbated, burrows (ß 0.5 2 cm) open or filled with soupy, water-rich mud,strang H2S odor.
12 -~~~±!.........................................:':':"-::":':'::':':':.. _","_,_,,,._,
--- ---..._ .13 -;:-;:-;:-;:-;:.;:.;:
,.,'''"-,''',''','''.------17:::::7:::7::---- ..... -------......................-----._.""-,'''.,,,'''.
14 - :~~~~~~~~jj;.:.:.; ....;.;.;..:.:.:.;......._ .-------
._."""""0"-'"------....................------."'0"'-'.''''''''------_.-_ ......... _._-- ............. -16 -7:::7:7:7:::7-------.... _ .. .. .. .._.0-'''''''0_0_'-----.................. -.-------
17 - Z:~:::~:::~:~••• """""'."'0""---_ ..... -
55
55
55
~1200 cm: increasing hardness, no open belowthis level
1190 - 1250 cm and 1390 - 1420: foram-richsections
1736 cm core base
18 ~__--'-__.L.-_----I
m (depth in core)
(For graphie symbols see core 2301)
Figure 37 continued,

73
material originating from fluvial input of the Congo River. High organic carbon contentsare derived from the combination of terrigeneous plant detritus and an intense marineproductivity. The latter results from a river-induced upwelling and nutrient supply, asweil as a local coastal upwelling.
Angola Diapir Field
The three cores taken along a profile at 12°S also consist of hemipelagic muds, but thesediments are not as soft those found off Congo. The numbers of foraminifers seem tobe in the same range as in the Congo Fan deposits. From the dark olive-green colorand the H2S smell it can be assumed that the sediments also contain high amounts oforganic carbon, although the existence of coastal upwelling during the last 200,000years off central Angola is highly improbable. The origin of the organic carbon is ratherrelated to high fertility in the surface waters induced by the doming of nutrient-richsubsurface waters with the eastern Angola Basin Gyre (SCHNEIDER, 1991).
Angola Benguela Front
Core GeoB 2307-2 was taken at 14°14'S to study late Quaternary northward shifts ofthe Benguela Coastal Current (BBC) cold-water boundary. In the modern ocean thisboundary, the Angola Benguela Front, fluctuates seasonally between 14 and 16°S. Thesediments recovered at this location were dark-gray to greenish-gray hemipelagicmuds. A 5 cm thick brownish horizon at the top of the multicorer indicates weiloxygenated bottom water and surface sediment conditions. The older sedimentcolumn in the gravity core exhibits prominent cycles, starting at the core top with alight greenish-gray sediment sequence which changes to a dark gray and back to alight section again, repeating this pattern to about 5 m depth in the core. As the lightersections are characterized by higher numbers of foraminifers than the dark intervals, itcan be assumed that these light - dark cycles represent the change from sedimentsrelatively rich in carbonate and poor in organic carbon during interglacials to theopposite sediment composition within glacial periods. This pattern can be explainedby the back and forth of the front driven by alternating warm and cold climatic periods.During warm stages the ABF was presumably located more to the south restricting theinfluence of cold and nutrient-rich waters associated with the BBC at the samplingloeation. As a consequence, high productivity and organic carbon flux was reduced inthe interglaeials and carbonate dissolution was not as high as during glacials. Below5 m core depth this light - dark sequence is disturbed by the occurrence of intercalatedlayers of muds which can be differentiated by their color change from black to lightgray or greenish-blue. Also Iittle sand lenses were observed in this deepest sedimentsection. It is not bioturbated and lacks the high amounts of foraminifers recognized inthe upper part of the core. Thus we assume that the core GeoB 2307-2 contains aturbiditic sequence originating from mudflows below 5 m core depth.

74
GeoB 2304·2
493 - 508 cm: burrows filled with sand
554 cm core base
beginning at -300 cm: strang H2S odor
0- 12 cm not opened, disturbed surtace. soupy mud
12 - 61 cm: hemipelagic mud, olive-green. verysoft, strongly bioturbated, burrows filled with blackmud
61 - 63 cm: foram-rich sand layer, gray-green
63 - 115 cm: foraminiferal hemlpelaglc mud,gray-green
115 - 554 cm: foram-bearing hemipelagic mud.olive-green, shell fragments, strongly bioturbated•burrows (00.5 - 2 cm) open or filled with soupy,water-rich rnud
55 5 Y3I2
5 5Y 4/2
f----
55 5Y3/2
0
55e
S
0
55
......................_._ ....
.- ........_.........'-------
'_''''0'''''''''' ••.... _----._ ......._........... -----........ -... _._-.... -----......._.- ..... _.'------''''''''0_.'''''''''''------.........-........
------........ _......... _.-------
""'----......... -._._.-.lm _
._ _ .."""------
......... "0-'''.''''... -----.
.......................... _-----._ _.- .
.... _-----
.... _0"'._'''''_.'*-----._ ........._.... _.... _-----..... _.-._ ..... -.-------
.- .... -----......................... ------
.... ------..._ .
.... _----..............'-------
litho- Struc- Colorlogy tu re
op~~XXX]~xxx:::=l~~~m~mm
2 - ~:_7:7:7:7:7:-:... ------
6-L----I.---.l.----J
m (depth in core)
(For graphie symbols see cere 2301)
Figure 38 Gravity core GeoB 2304-2 (Angola Diapir Field area): Core description.

75
GeoB 2305..2
1- 495 cm: faram-bearlng hemipelaglc mud,strongly bioturbated (burrows often dark colored),few shell fragments1 - 37 cm: mud olive-green37 - 250 cm: mud gray-green, burrows olive-green
5y::; 5 V 3/21---
5V 4/355
._ _ ....... _----...._._ ..-------._._ ........ _-- .._ .-------.- _...-._ _----._ _.-._.-.
1 - ~:~:~:~:~:~:~..... _-----
litho- Struc- Colorlogy tureo ~ _
._._ .-------... _----'.''''0''''.''''''''------._ ....... _.......""'------
2 - i:i:±:±:i::::...................
.... _-----._ .-------................ _._."" _..._._ _.
.............. CD ...._ .... - - _ .........................
3 - ~-~-~-~-:-~-:.- ......... _.....-............................................------............... 'CO .....------............ _..........-------._ ..... _._ .. -._.------.'''''''' .. 0 ..... _---_ ...
o
55---
SO 5V3/2
~
55
163 cm: single coral (05 cm)
250·495 cm: mud dark olive-green
beginning at -300 cm: strong H2S odor
321 - 329 cm: open burrows (or gas cracks?)partly filled w~h very soft, water-rich sediment
495 cm core base
(For graphie symbols see core 2301)55
..... _........ _._ ..... _-----'_'_'''0''''''''''''.................. ......................
... ------'-"-''''''-'-'-'... _ _ ...._ .s..:t===:t::::==:::I::::===l
m (depth in core)
Figure 39 Gravity core GeoB 2305-2 (Angola Diapir Field area): Core description.

76
GeoB 2306..2
upper -15 em dark olive-green layer, very soft withhigh water content
o-358 cm: foram-bearing hemipelagic mud,olive-green, soft, oceasionally containing shellfragments, strongly bioturbated, burrows filled withsoupy, water-rich blaek mud
ss
SS 1-5Y3
/4_
5 Y 3/2
..... _.-._ ..... _.-------._ .
._ - ...... ---_ ..
-----_ ............... - ... ... ... ... ..'''''''''._'''''-''''..---_ ..._.. _._ .... .. ... ..,,,.,,,-,,,,,-,,,,,..................
........ - .... -._.---- .. - .
litho- Struc- Colorlogy tu re
o -------
'''.''-'''''''''-''''.---_ ......
._ _._.- .... .. .. .. ..3 - ~:~:~:;:;:;:~-----_ .....................-----_ ...
SS
4-l....__----A__-.l..__--l
m (dapth in cora)
358 em cere base
(For graphie symbols see eare 2301)
Figure 40 Gravity core GeoB 2306-2 (Angola Diapir Field area): Core description.

77
GeoB 2307..2
beginning at -250 cm: strong H2S odor
285 - 336 em: Typ 1
336 - 390 cm: Typ 2
390 - 426 cm: Typ 1
426 - 480 cm: Typ 2
480 - 518 cm: interealated layers (1 to 5 emthickness) 01 different greenish-eolored (ge)hemipelagic muds (5Y4/3, 5Y5/1, 5Y4/4'5Y3/2)and sand lenses containing Qz, mica, and forams=> TYP 3
518 - 542 cm: Typ 2542 - 571cm: Typ 3571 - 593 em: Typ 1593 - 724 cm: Typ 3
724 cm core base
upper -1cm oxidized layer, about 10 cm of thissurface layer were lost0- 49 cm: foraminiferal hemipelaglc mud, lightgray-green, strongly bioturbated, burrows (ß 0,5 - 2cm) open or filled with soupy, water-rich mud =>TYP 149 - 285 cm: foram-bearlng hemipelagic mud,olive-green, strongly bioturbated, lower 10ram(higher TOC ?) content than above => TYP 2
SY3I2
SY 411
S Y3/2
SY 4/1
SY 4/1
5Y3I2
gc
90 .
& S Y 3/2
SS 5 Y 4/1
s9C __111
s
55
~
55ß55555555
55
.............................._.•......... ,. ................
.-.".",-.•. -.............
-----_ ............ _. __ ..
' ...... 0 •• _ ....- - - --
_ -------
....... -.. _... --------
................-------- .~-~
1 ~:~:~:~:~:~:.---_ .... -
3
2 ------
Litho- Struc- Colorlogy ture
o .
4 :~:~:~:~:~:~:..............:-:.:..:::-:=-:..:...-:...................------.....•._...... -.-------
:!II!!I8-l-__-I-__J--_--.J
m (depth in core)(For graphie symbols see core 2301)
Figure 41 Gravity core GeoB 2307-2 (Angola Benguela Front areal: Core
description.

78
GeoB 2308..2
Utno- Struc- Colorlogy ture
0-1.-,....;:..;:...........,.,.--------1
..-..----"" ...----~~~~~~~~~~~~~
3-J!~!mm:.-:.-:.-:.-:.-:.-:.... _._._.- ......-----........................
:.-:.-:.-,;.-,;.-,;.-:._ .------4 - -::-::-::-::-::-:::-----.................... _.
-::-::-::-::-::-::~------.............._......
5 ------................ _._.-----................ _....-----.........................------
............................. _.... _...
.........................
7 -:=:=i:i:±:::.:............................... .,.._ ........------........... _._ ....-----.............. _.......
8 - :-:~-:-:-:-.
-----............. _._._.
.....................------9 - -::-::-::-::-::-:::
.... _ ... _ -._._._._ _.- - - -._._._._._ .....
55 5 Y3/2o-300 cm: hemipelagic mud, olive-green, stronglybioturbated, burrows (ra 0,5 - 3 cm) open or filled with
~soupy, water-rich mud
55
~300 -1133 cm: foram-bearing hemipelagic mud,
~olive-green, shell fragments, H2S odor, stronglybioturbated, burrows (0 0,5 - 3 cm) open or filled withsoupy, water-rich mud
55
503 -505 cm: silt layer, dark gray (5Y 3/1),
~5 Y3/2
containing mica and shell fragments
55672 - 673cm: silt layer, dark gray (5Y 3/1), enrichedin mollusk shells
6'5 Y 3/2
below -750 cm no occurence of open burrows,
S5 increasing hardness downcore
854·857 cm: silt/sand layer, dark gray (5Y 3/1),enriched in mica, forams and shell fragments
~
5S10 -----m (depth in core)
Figure 42 Gravity core GeoB 2308-2 (Angola Benguela Front area): Coredescription.

GeoB 2308..2
79
Litho- Struc- Colorlogy ture
10 -------....._......... -.....-----..................-----....................... .. ... .. ... .. ...................... _.7:7:7:7:7:7:7--- ...... - ...
11 -7:7:7:7:7:7:7... .. ... ... ... .................. - .... .. .. .. ... ...
SV 3/2 300 -1133 cm: foram-bearlng hemipelagic mud,olive-green, shell fragments, H2S odor, stronglybioturbated, relatively hard
1133 em core base
12 ~__...I-__.l.--_---J
m (depth in cora)
(For graphie symbols see core 2301)
Figure 42 continued.

80
GeoB 2309..2
Struc- Colorture
o
4
Lltho..logy
ss
ss
ss
ss
5 Y 3/2
0- 878 cm: hemipelagic mud, olive-green, upper3 cm very soft. soupy, very low foram content,occasionally containing shell fragments, stronglybioturbated, burrows (0 0,5 - 4 cm) open or filledwith soupy, water-rieh mud
beginning at -82 cm: strong H2S odor
beginning at -260 em: only small burrows (ra 0.2 1 cm)
below -410 cm no open burrows, increasinghardness of mud downcore
648 - 656 cm: slightly higher foram content
684 - 694 cm; slightly higher foram content
878 cm eore base
9-1----L--.l..-.---J
m (depth in core)
(For graphie symbols see cora 2301)
Figure 43 Gravity core GeoB 2309-2 (Angola Benguela Front area): Coredescription.

81
GeoB 2310...2
litho- Struc- Colorlogy ture
0 ........".+.+..... SY 4/3 o-668 cm: foraminlferal calcareous ooze, light+ ......... +................. 55 olive-green, high foram content, occasionally shell+++++............................. fragments, strongly bioturbated, burrows (0 0.1 - 1++++++.......
............ + ... cm) often filled with dark olive-green ooze, H2S odor•+..........~.+...... ++ .........
1 .... ++ .......................106 - 408 cm: ooze dark olive-green, lower..................
+++ ....... + + + .......+ ....... + foram content than above..............+++++...... ++ <7>..............
...... +++ ......................................................2 +..............................
... ++++ ....................
...... ++++.................................................++ .........................55++++++............... +++++++++..................
3... ++++............................
.... + ... ++++++ ....... ++++.:::'::... Sb...... + .....................................++++ .........+.+.:"...+.......... +++
4 .................+++ .....
408 - 482 cm: ooze light olive-green, higher....................................... +++++ 55......... foram conten than above.... +++++++ .... +............+ .... +++
...... ++ ..................... 482 - 511 cm: ooze dark olive-green, lower foram.............. ++................++++++ cootem than above5 ... ++++......................... + ...+++++ ...
55............... sv 4/3 511 - 668 cm: ooze light olive-green. higher..................................... ++ ......
foram conten than above.............................+++ .......................................................
6 ........+ .....+...+++++++..............+++++ 637 cm: section enriched in shell fragments+++ .........++++++++ ..... ++.............................. +....... +++
7 (For graphie symbols see core 2301)
m (depth in care)
Figure 44 Gravity care GeoB 2310-2 (northeastern Cape Basin): Core description.

82
Homogeneous, olive-green, hemipelagic muds were found off southern Angola at16.rS. These deposits are in general comparable with those found north of the CongaRiver mouth. They contain a little higher amounts of sand, however, which originatefrom an eolian input coming from the Namibian desert and/or fram a fluvial input bythe Cunene River which enters the Angola Basin at about 1rs. The source for the highorganic carbon contents (dark color, anoxie conditions thraughout the core) shouldhave been the Southwest African coastal upwelling cell during the whole LateQuaternary which at presEint is confined between 15 and 1rs.
Cape Basin
The last core of this cruise was taken in the northeastern Cape Basin. The upper slopesediments at this station, which under modern surface water conditions lies at thewestern boundary of the upwelling cell located above the shelf, consist of carbonaterich muds with high amounts of foraminifers. Their olive-green color and the H2S odorpoint to high organic carbon concentrations. The terrigeneous input appears to belower than in the Angola Basin presumably because the winds and eolian transport arepredominantly directed alongshore towards the north and also no larger river systemreaches the northern Cape Basin coast. The high carbonate content may be explainedby a weaker carbonate dissolution in the Cape Basin as compared to the semi-c1osedAngola Basin and also a lower dilution by terrigeneous components.
5.4 Physical Properties Studies
M. Breitzke, K. Däumler, H. Keil, B. Pioch, F. Pototzki, T. Schwenk
5.4.1 Introduction
Ten gravity cores with a total length of 95 m were retrieved during the Cruise SO 86and investigated with respect to their physical properties, comprising measurements ofP-wave velocity, wet bulk density and magnetic susceptibility. P-wave velocities andmagnetic susceptibilities were determined from the unsplit cores, wet bulk densitiesfrom the split core halves.
5.4.2 Physical Background and Experimental Techniques
P-wave velocity
P-wave velocities were measured with an automated full wave form logging system(BREITZKE & SPIEß, 1993). Figure 45 shows a diagram of the system configuration. Itmainly consists of three units,

83
i) a signal generation and recording unit, inciuding two equivalent ultrasonictransducers, a broad-banded high-voltage pulse generator, an analogueamplifier and a programmable, digital 8-bit storage oscilloscope;
ii) an automated transducer movement and distance/diameter measurement unit,including a stepping motor, two digital measuring tools and a multiplexer;
iii) a PC based data storage and system control unit, including a PC with differentinterface cards, floppy, 100 MByte hard disc and a printer.
The unsplit (or split) cores are analysed by transmission seismograms travellingradially through the sediment cores. Signal emission and reception is performed by apair of equivalent, diametrically arranged wheel probes of 374kHz dominant frequency(C.N.S. ELECTRONICS LTD.) which are mounted in a carriage. A spring-loaded jigpresses them onto the core liner. A sufficient coupling is achieved by plastic tiressurrounding the wheel probes. After analogue amplification the received transmissionseismograms are digitized, recorded and stored by means of an oscilloscope (NICOLET320) and transferred to the PC's hard disco Recording parameters, e. g., sampie rate,recording length and delay as weil as data transfer to the PC's hard disc are controlledvia a HPIB interface.
The wheel probe carriage is automatically moved along the core liner by a steppingmotor. It stops at arbitrary, equidistant spacings to record a quasi-continuous sectionof transmission seismograms along the core segment. Stepping rate, acceleration anddeceleration are controlled by a special PC interface (PCL 738B). Axial travel distanceand core diameter are determined by digital measuring tools (MITUTOYO DigimaticScale Unit 572) with an accuracy of 0.01 mm. The data are transferred to the recordingand control program via two channels of a multiplexer (MITUTOYO Mux 10) and aserialinterface.
The logging process, data transfer and data storage are controlled by an IBMcompatible PC (HEWLETT PACKARD VECTRA OS/16S, 80386SX processor). Thephysical, geometrical and recording parameters of each core segment can be setindividually in a menu driven FORTRAN control program. After assigning theseparameters to a seismogram header, the transmission data are stored on the PC'shard disc using the Dos Real*4 format and - similar to the industry standard SEGYheader - an 800 Byte header per trace.
P-wave velocities are evaluated from the first arrivals of the transmissionseismograms and the core diameter by an on-line routine. It is based on a crosscorrelation of the transmission seismogram with the 'zero-offset' signal, i. e. the signalwhich is recorded before the logging process by bringing both wheel probes into closecontact. Only a short wavelet of this 'zero-offset' signal with one or two periodsduration is used for the cross- correlation so that the instant of the first arrival can

• .---1------4----11 .---4---lI
High VoltagePulse Generator
S Tr Trigger
84
Digital StorageOscilloscope
Ch 1 Ch 2 AnalogueAmplifier
I
UltrasonicTransducer (Source) -
?" 1111111111!1!1!1!!I!!!I!!!!!!!!I!!!!!!!!I!!!I!!!!!!!!!li!!II::~:~I~ß~:~~~ffi:II!I!I!II!I!!I!I!II!I!I!!!!II!I!1!~II!I!I!!I!!!!!!III!~!I!I!iili!i!}T
Ultrasonic ====
Transducer (Receiver)
Distance Measuring Tool
Core Diameter Measuring Tool
11 11
11 11
Stepping Ch 1 Ch 2Motor Control Multiplexer
HPIB-Interface
Stepping Motor Card
PC Serial Interface I---
Printer I Parallel Interface ~
Hard Disc/Floppy
Figure 45 Block diagram of the P-wave logging system.

85
accurately be assigned to the first significant peak of the cross-correlogram resultingfrom the first maximum coherence between both signals. Numerically, this maximum
is determined as the first positive excursion whose amplitude exceeds a givenpercentage amplitude threshold. In practice threshold values of 10 to 15% of the crosscorrelogram's maximum proved to be suitable for a stable first arrival detection. Sincethe cross-correlogram only depends on the phase difference between the transmission
seismogram and the 'zero-offset' wavelet, it is independent of the internal pulse delaywithin the wheel probes and only a correction for the travel times through the liner wallsmust be taken into account. Explicitly, if t is the picked first arrival time, tL the pulsetravel time across both liner walls, d the outside diameter of the core liner and dL thedouble liner wall thickness, the P-wave velocity can be calculated from
P-wave velocity measurements on board are usually carried out only after the coresegments have reached ambient temperature. Due to varying weather conditionstemperature differences of up to 10 oe may occur from one core (segment) to anotherresulting in P-wave velocity variations of up to 30 m/s. To enable a precise comparisonbetween the P-wave velocity profiles of different cores (or care segments), thesediment temperature is determined once per core segment with an accuracy of 0.1 oeand a correction of all laboratory P-wave velocities values to a constant temperature of20 oe is applied using the approximation of SeHULTHEISS & McPHAIL (1989)
v20 = vT + 3· (20 - T)
where v20 is the P-wave velocity at 20 oe (in m/s), vT the P-wave velocity at T oe(in m/s), and T the temperature (in 0c) of the core segment when logged.
Wet-bulk density
Wet bulk densities were derived from electrical resistivity measurements on the splithalves of the sediment cores. Figure 46 shows a block diagram of the system. A probecomprising a miniature WENNER configuration is manually inserted into the sedimentperpendicular to the core axis so that the integrating effect of the electrical field mainly
acts in an about constant core depth. Four platinum wires (0 0.6 mm) which are castinto the solid plastic body of the probe with a spacing of 4 mm serve as electrodes. An
NTe (SIEMENS, K29) is additionally integrated into the probe. It allows a fastdetermination of the sediment temperature with an accuracy of 0.1 oe while theresistivity is measured. Including this temperature sensor, the total dimensions of theprobe are 22.3 x 4 x 135 mm. To improve the coupling to the sediment, the lower partof the probe is shaped to a triangular cross-section. A waveform generator and acurrent drive supply a constant, low-frequency alternating square wave current of330 Hz and 400 /JA. The potential difference depending on the sediment's resistivity isdetermined across the inner pair of electrodes by means of a voltmeter after passing adifferential amplifier and a phase sensitive detector.

Current Drive
86
Voltage Measurement
WaveformGenerator
ConstantCurrentDrive
DifferentialAmplifier
PhaseSensitiveDetector
Voltmeter
TemperatureSensor -(NTC)
1-
Wenner .I. Configuration
1~~lllilil!il!l!l!llli!II!lllllil!il!il!llilill!!liliil!i!!::~:~!~=~::~~~~::i!il!I!!!I!I!i!lli!l!i!i!!!I!III!i!!1!1!iill!!!!I!I!!!!!III!!!II!
HPIB-Interface
PC Parallel Interface
Hare Disc/Floppy
Data Acquisltion·Unit
'--------lI Printer \
Figure 46 Block diagram of the electrical resistivity logging system.

87
The resistivity logging process is controlled and recorded by a menu drivenFORTRAN program running on an IBM compatible, portable PC (EsCOM BLACKMATENOTEBOOK, 386SX processor). Potential and temperature values are transferred to thePC's hard disc (40 MByte) via a data acquisitionjcontrol unit (HP 3421 A) and a HPIBinterface. An on-line routine converts the measured resistivity data to porosity anddensity. This conversion is based on ARCHIE's empirical equation
R jR = k· q)-ms w
which relates the ratio of the sediment resistivity Rs and the interstitial water resistivityRw to porosity q). According to BOYCE (1968), appropriate values for theproportionality constant k and the power mare k = 1.30 and m = 1.45. The interstitialwater resistivity Rw is derived from a calibration curve which describes the temperature- conductivity relation of sea water by the following fourth power law (SIEDLER &
PETERS, 1986)
The coefficients Co to C4 depend on the geometry of the probe and are determined bya least-square approximation to the measured calibration values.
Assuming a two component model for the sediment with homogeneous sedimentmatrix and interstitial water densities Pm and Pw' the wet bulk density Pwet is computedusing the porosity as weighting factor (BOYCE, 1976)
Values of Pm = 1030 kgjm3 and Pm = 2670 kgjm3 were used here for the interstitialwater and the grain density.
Magnetic susceptibility
Magnetic susceptibilites were determined from the unsplit cores using a BARTINGTONmagnetic susceptibility meter type MS2.C combined with a whole-core sensor.
5.4.3 Shipboard Results
P-wave velocities and wet bulk densities were determined at a spacing of 2 cm,magnetic susceptibilities at 1 cm intervals.
The transmission seismograms for the P-wave velocity determination were sampledat a rate of 20 MHz. The recording length was 200 j1S, starting after a delay of 50 j1s. A'zero-offset' signal was measured before each gravity core. Cross-correlograms for the

88
first arrival detection were calculated with the first period (25 to 30 JLs) of this 'zerooffset' signal. The first peak of the cross-correlogram exceeding a threshold of 20% ofthe cross-correlogram's maximum was picked as the first arrival.
Electrical resistivities for the wet bulk density determination were measured at eachdepth point after waiting for 10 s to achieve stable potential differences.
The magnetic susceptibility measurements should provide a preliminary insight intothe magnetic characteristics of the cores and were therefore done only with the lowsensitivity option (1.0' 10-6 SI).
Figures 47 to 56 show the three physical property logs for each gravity core. Tofacilitate a core to core comparison they are all plotted to the same depth scale. The Pwave velocity measurements occasionally suffered from coupling problems betweenthe sediment and the liner wall, probably due to gas (H 2S) so that no transmissionsignal could be received for several depth intervals.
Congo Fan (GeoB 2301-03,2302-02,2303-02)
The P-wave velocity logs reveal only smooth variations of about 20 mjs per core. Themean values slightly increase with increasing water depth from 1493 mjs for theshallowest core GeoB 2301-03 to 1496 mjs for GeoB 2302-02 and to 1502 mjs for thedeepest core GeoB 2303-02.
In contrast, the wet bulk density logs show a distinct increase from very low values(about 1100 kgjm3) at the sea floor to values varying around 1400 kgjm3 at greaterdepth. This density contrast is especially pronounced in gravity cores GeoB 2301-03and 2302-02. A level of around 1400 kgjm3 is reached at about 3.5 m depth in coreGeoB 2301-03 coinciding with a density increase of the clayey mud visually identified inthe core description. In gravity core GeoB 2302-02 the 1400 kgjm3 level is alreadyreached at about 2.0 m depth. In core GeoB 2303-02 the density values start at about1200 kgjm3, slightly decrease to about 1100 kgjm3 at 1.7 m depth and then increaseto about 1400 kgjm3 at around 5.2 m depth. The corresponding porosity values rangefrom about 90 to 95% at the sea floor to about 75 to 80% at greater depths.
The magnetic susceptibility logs displaya distinct decrease at about 4.2 m depth incore GeoB 2301-03 and at about 2.9 m depth in core GeoB 2302-02 which does notcoincide with the pronounced variations in wet bulk density logs. For the deepest core,GeoB 2303-02, this decrease can still be identified at about 1.4 depth but it is muchless obvious as the mean susceptibility only amounts to about 40 . 10.6 SI compared toabout 70 . 10.6 and 60· 10-6 SI in cores GeoB 2301-03 and 2302-02, respectively.

89
GeoB 2301-03Date: 12.05.93 Pos: 05°04,0' S 11 °06,7' EWater Depth: 1378 m Core Length: 1532 cm
7
8
2
3
1
Susceptibility [ 10-6 SI ],.,--,-- 0
Density [kg/m3 ]Vp [m/s]
9 ~ 9
L10 100 0 0 0 0 0 0 0 0 0 0 0ro 0"> 0 ..... 0 0 0 0 L[) 0 L[)"'t "'t L[) L[) 0 N ~ <.D ..... .......... ..... ..... ..... ..... ..... ..... .....
4 4
E.J::.....0- S 5(J)
Cl(J)'-0()
-=J 66 -I
Figure 47 Gravity core GeoB 2301-3 (northern Cogo Fan area): Physical propertylogs.

90
GeoB 2301-03 Date: 12.05.93 Pos: 05°04,0' S 11°06,7' EWater Depth: 1378 m Core Length: 1532 cm
Susceptibility [ 10-6 SI],.,.-,.,.-~,,-,-,-,-,-,...,.-, 10
Density [kg/m 3 ]Vp [m/s]
11 11~
12 - 12.......E..--..c:~
c.Q) 13 130Q)'-0ü
14 14
151-
15
16 ~L..L L. I I I I J 160 0 0 0 0 0 0 0 0 0 0 0ro (J) 0 ..- 0 0 0 0 L.() 0 L.()~ ~ L.() L.() 0 N ~ tO ..- ...--...-- ..- ..- ..- ..- ...-- ..- ..-
Figure 47 continued.

91
GeoB 2302-02 Date: 12.05.93 Pos: 05°06,4' S 10°50,9' EWater Depth: 1830 m Core Length: 1418 cm
7
8
9
1
2
- 3
Susceptibility [ 10-6 SI ]I I I I I'"'-'-'-'-~r-r-l 0
L--l---L...l-L..L...J~L...L-l---'---J---'---J---' 10o 0 0 0 0o L[) 0 L[)<.D ........-..-
ooN..-
Density [kg/m3 ]
3
7
Vp [m/s]
9
8
10 LLL..L.LJ---"--l-LL.-L-L.L.l--'--L-LLL-LJ
coo ~ 0 000VI 0 ...... N 0
~ ~ l,() l,() l,() 0or- ~ ~.,......-r-~
4 4.--.E........c:-0-
50) 500)L-
0Ü
6 6
Figure 48 Gravity core GeoB 2302-2 (northern Cogo Fan area): Physical propertylogs.

92
GeoB 2302-02 Date: 12.05.93 Pos: 05°06,4' S 10°50,9' EWater Depth: 1830 m Core Length: 1418 cm
Vp [ m/s ] Density [ kg/m3 ] Susceptibility [ 10-6 SI]10 --, 10,nT'p'" '11'.- r'T-l'T I I I I I I I
f=
11 11
......E
12 12.........r=.....a.Q)
ClQ)
13 13'-0()
14 14
15 .L1..LL ' ~~'-U I LU J~" L t I I I I 150 0 0 0 0 0 0 0 0 0 0 0 0co (j) 0 T"""' ('\J 0 0 0 0 L{) 0 L{)-.::t -.::t L{) L{) L{) 0 ('\J -.::t c.o T"""' T"""'
T"""' T"""' T"""' T"""' T"""' T"""' T"""' T"""' T"""'
Figure 48 continued.

93
GeoB 2303-02Date: 12.05.93 Pos: 05°11,4' S 10°22,0' EWater Depth: 2494 m Core Length: 1736 cm
9
7
8
3
2
1
Susceptibility [ 10-6 SI ]
~~O
'---L...---L---'---"~-L--'---'--'---' 10o 0 0 0o L() 0ro ...-~
oo<D~
Density [kg/m3 ]
[TTTTIl ··\ TTT·'T"'l
~. 1i~ ,r ~..l
o 0N 0L() 0~ ~
Vp [m/s]
2
o rr-rT-.--rT'-lrrl"I1-'1,,"~l
1
3
7
9
8
10 L.L.L.LLL-L..L.L-'-"4-Ll-LL_
000 0ro (j) 0 ~-.:;t -.:;t L() L()~ ~ --c- ~
4 4.......E.......
.r::::......0..
5 5Q)
0Q)
~L-00
6 6
Figure 49 Gravity care GeoB 2303-2 (northern Cogo Fan area): Physical propertylogs.

94
GeoB 2303-02Date: 12.05.93 Pos: 05°11,4' S 10°22,0' EWater Depth: 2494 m Core Length: 1736 cm
17
16
11
l--L--l--L.-L------l----L-.L--'-----'----' 18o 0 0 0o L.() 0co ............
oo<.0......
oo">t......
ooN......
Density [kg/m3 ] Susceptibility [ 10-6 SI ]
10
Vp [m/s]
11
16
17
18 L..L.L.L.L.L--'--L.JU-.LLLL--L.Ll--L..L.W
000 000
~ ~ ß U; ~ 8.,- ~ or- ~ ~ or-
12 12
~1-
~
13 13r-"I
E.......s:::.....0-
14 14Q)
0Q)'-0ü
15 15
Figure 49 continued.

95
Angola Diapir Field (GeoB 2304-02, 2305-02, 2306-02)
Apart from a thin sandy layer at about 0.62 m depth, the P-wave velocity log of coreGeoB 2304-02 does not show any prominent variations. A slight increase fram about1490 to 1505 m/s is observed downcore. Over the same range P-wave velocities ofgravity core GeoB 2306-02 decrease from the top to around 2 m core depth.
All cores in the Angola Diapir Field area essentially reveal a trend of Iinearlyincreasing densities downcore. In contrast to the Congo Fan, values of about 1400kg/m3 are typical at the sea floar, they increase to 1600 or 1700 kg/m3 at the base ofthe cores. The corresponding porosity data vary between 70 and 80% in the upperparts of the cores and decrease to about 60 to 65% in deeper layers. The thin sandyhorizon at about 0.62 m depth in gravity core GeoB 2304-02 yields a very high densityof around 2100 kg/m3.
The magnetic susceptibility logs of cores GeoB 2304-02 and 2305-02 showpronounced maxima of 130 to 140· 10-6 SI in the upper part of the cores. Below about1.2 and 1.5 m depth an almost constant level araund 50· 10-6 SI is reached whichprevails in the whole sediment sequence of gravity care GeoB 2306-02.
Angola Benguela Front (GeoB 2307-02, 2308-02, 2309-02)
In gravity core GeoB 2307-02 P-wave velocities slightly increase from about 1490 m/sat the top of the core to 1500 m/s at 3.0 m depth. Beneath cyclic variations fram about1490 to 1510 m/s between 4.0 and 5.0 m depth for which there is no obviousexplanation in the core description P-wave-velocities increase again fram about 1490to 1510 m/s atthe base of the core.
Apart from two thin silty/sandy layers in gravity core GeoB 2308-02 with values ofup to 1550 m/s, the P-wave velocity logs of the two other cores display only relativelysmooth variations between 1490 and 1510 m/s.
In the upper part of the core 2307-02 wet bulk densities slightly decrease fram about1400 to 1300 kg/m3 at 2.7 m core depth. Following a rapid rise to some 1600 kg/m3,
they further increase downcore to about 1750 kg/m3. A peak at 6.9 m depth, whichalso appears in the P-wave velocity log, prabably results from a small sandy lensmentioned in the core description. Porosity values vary between 70 and 85% down to2.7 m depth and then decrease to values between 50 and 60% to the base of the core.
In the two other cores of this area, wet bulk densities oscillate at relatively highfrequency around mean values of 1440 kg/m3 in the shallower (GeoB 2308-02) and1270 kg/m3 (GeoB 2309-02) in the deeper waters. Mean porasities for these two coresamount to 75% (GeoB 2308-02) and to 85% (GeoB 2309-02), respectively.

96
GeoB 2304-02Date: 19.05.93 Pos: 12°01,2' S 12°27,1' EWater Depth: 2003 m Core Length: 554 cm
1
5
Susceptibility [ 10-6 SI]-'TT 0
Density [kg/m 3 ]Vp [m/s]
2 2......E......
..c:.....a.
3Q) 30Q)'-0()
4 4
6 LLLL-LLLL-LLLL.LLLl.LLulul.LLL
o 0 000
~ SS ~ ~ ~~ ~ ~ ~ ~
~--,--"-.L.L.J....L--'--l.-'--L-L...J.-'--'6
00000o L() 0 l()N ~ ~
N
Figure 50 Gravity core GeoS 2304-2 (Angola Diapir Field area): Physical propertylogs.

97
GeoB 2305-02Date: 19.05.93 Pos: 11°56,1' S 13°15,1' EWater Depth: 897 m Core Length: 495 cm
6 LLLLUJ..LLLLL.LLLL.LLLL.LLLL-Ll..LLL '--'--'--'--'-....L--'...-L-'---L---'--L--l L.L-L....L-L....L-L.....L..L-.L..L-.L..L-.L..-L-I 6o 0 000 0 0 0 0 000~ ß ~ ~ ~ ~ g g ~ ~ ~~ ~ or- ~ ~ ~ -r- ~
5
1
Susceptibility [ 10-6 SI ],.-r-r,-,-r-'···,.,.:::P'.,.....,--,,-,-, 0
Density [kg/m3 ]Vp [m/s]o fTTTTTTTTTJITT'TlTnlT1T I1 II rl~
1
5
2 2......E......
..c.....0-a> 3 30a>~
0Ü
4 4
Figure 51 Gravity core GeoB 2305-2 (Angola Diapir Field area): Physical propertylogs.

98
GeoB 2306-02 Date: 19.05.93 Pos: 11°55,3' S 13°23,0' EWater Depth: 479 m Core Length: 358 cm
Susceptibility [ 10-6 SI ]o
Density [kg/m3 ]Vp [m/s]
1 1........E.........c: ~......0..
2 -3 2Q)
ClQ)I-0()
3 3
- I I I I I 40 0 0 0 0 0 0 0N 0 0 0 0 L() 0L() N ">t <D co ~
...- ...- ...- ...- ...-
ooL()...-
4 '-'-'-~-'-'-.l-L-L-'-L-'-L-L.L.L..L-'-'
oco">t...-
Figure 52 Gravity core GeoB 2306-2 (Angola Diapir Field area): Physical propertylogs.

99
GeoB 2307-02 Date: 21.05.93 Pos: 14°13,9' S 11 °31,1' EWater Depth: 2892 m Core Length: 724 cm
1
7
6
2
Susceptibility [ 10-6 SI ],r,,,,,.,-,...,.,"""---'--'='" 0
~..L.L.L-LLJLL.L-'-L.L-L.Ll---"--'---LJ 8000 0 0 0o L() 0 L() 0-..::t ..-..- NN
oooN
oo<.0..-
Density [kg/m3 ]Vp [m/s]
1
2
7
6
8 ~-L.LL-L..L...LL.L-'-L.L-L.Ll--'--'-.L.J
~~8~~8-..::t -..::t L() L() L() N~ 'oe- .,.- ~ ~ ~
3 3.-.E~
.c:.....a.
4cv 4Cl
~0
Ü5 5
Figure 53 Gravity core GeoB 2307-2 (Angola Benguela Front area): Physicalproperty logs.

100
GeoB 2308-02 Date: 24.05.93 Pos: 16°43}' S 11°02,3' EWater Depth: 2114 m Core Length: 1133 cm
1
3
2
8
9
7
Susceptibility [ 10-6 SI ]o
Density [kg/m3 ]Vp [m/s]
7
8
9
10 ~.LJ 100 0 0 0 0 0 0 0 0 0 0 0 0co 0 N '<;f" CD 0 0 0 0 L() 0 L()'<;f" L() L() L() L() N '<;f" CD co ~ ~
~ ~ ~ ~ ~ ~ ~ ~ ~
Figure 54 Gravity core GeoB 2308-2 (Angola Benguela Front area): Physicalproperty logs.
4 4r-"I
E.......c......0-Q) 5 50Q)'-0ü
6 6

101
GeoB 2308-02 Date: 24.05.93 Pos: 16°43,7' S 11 °02,3' EWater Depth: 2114 m Core Length: 1133 cm
-
l_Ll_L.LLL.L.I ...L .1 1 I..L . ..l_L.1 L..L .1 L 1. ..1..... 1. ·_I.-J....i_.L.LL.LL 120 0 0 0 0 0 0 0 0 0 0 00 N ..;;t c.o 0 0 0 0 L() 0 L()L() L() L() L() N ..;;t c.o co ..- ...-..- ..- ..- ..- ..- ..- ...- ...-
11
Susceptibility [ 10-6 SI ],T 10
Density [kg/m 3 ]Vp [m/s]10......
E........c:-0..(1) 110~0()
120co..;;t..-
Figure 54 continued.

102
GeoB 2309-02Date: 24.05.93 Pos: 16°34,7' S 10°50,5' EWater Depth: 2675 m Core Length: 878 cm
2
1
Susceptibility [ 10-6 SI]
.1====r::=t=:r.;=r-'--r-::::] 0
Density [kg/m3 ]Vp [m/s]
8
L_8
9 90 0 0 0 0 0 0 0 0 0co 0 N 0 0 0 0 L.() 0~ L.() L.() 0 N ~ <.0 ...-...- ..- ..-- ..-- ..-- ..-- ...-
3 3
......E
4 4.........c:......c.
~Q.)
Cl
rQ.)
5 5L-
0Ü
6 6
1 ~7 7
Figure 55 Gravity core GeoB 2309-2 (Angola Benguela Front area): Physicalproperty logs.

103
GeoB 231 0-02Date: 27.05.93 Pos: 22°16,0' S 12°32,3' EWater Depth: 1024 m Core Length: 675 cm
5
4
3
1
2
Susceptibility [ 10-6 SI ]
~~'l0
1
Density [kg/m3 1
rr~
Vp [m/s 1
6 t:_- -< 6
~J-j
t~~" ~ L7 .L j [ [ J 70 0 0 0 0 0 0 0 0 00 ..- N ('f) 0 0 0 0 L()L() L() L() L() 0 N <q- <.D..- ..- ..- ..- ..- ..- ..- ..-
5
1
2
E........ 3..c:-c..Q)
Cl
~ 4oü
Figure 56 Gravity core GeoB 2310-2 (northeastern Cape Basin): Physical propertylogs.

104
Magnetic susceptibilities decrease in the upper 0.5 m of core GeoS 2307-02 from190.10-6 to about 50.10-6 SI. Smooth changes between 30 .10-6 and 80.10-6 SI in thedeeper parts to some extent appear to be positively correlated to density variations.
The magnetic susceptibilities logs of the two other cores show no pronouncedvariations, their mean values amount to 50 .10-6 (GeoS 2308-02) and 40.10-6 SI (GeoB2309-02), respectively.
Cape Basin (GeoB 2310-02)
P-wave velocities ranging between about 1505 and 1530 mjs reveal aseries of cyclicvariations and on average are significantly higher than those of the other coresrecovered during this cruise.
Wet bulk densities essentially vary between 1200 and 1500 kgjm3. Correspondingporosities range between about 75 and 90%. Low-frequency density variations withminima at about 1.5 and 5.5 m and maxima at about 0.8, 3.4 and 6.3 m show nopersistent correlation to changes in P-wave velocity.
Magnetic susceptibilities are very low reaching maximum values of only 50· 10-6 SI.Low-frequency variations in the upper parts are negatively, near the base of the corepositively correlated to wet bulk densities.
5.5 Accelerator Monitored Coring
B. Heesemann and H. Villinger
5.5.1 Introduction
Gravity er piston coring is the standard method for obtaining long sediment cores fromthe bottom of the ocean. These cores provide the material to study the depositionalprocesses of the past. One of the basic assumptions when interpreting the depthvariations of sediment parameters is that the core is an undisturbed sampie of the insitu sedimentary sequences. Investigations have shown, however, that the process ofcoring itself may result in a more or less severe disturbance of the core causing acompression of the core or even a selective sampling by which certain layers areomitted by the coring process. Such core disturbances have serious consequences onthe calculation of sedimentation or accumulation rates as weil as on the spectralanalysis of cyclic variations in sediment parameters.
One possibility to reconstruct the total penetration of the core barrel into thesediment is to monitor the penetration process by measuring and recording the

105
acceleration. As the core barrel and core head move essentially only in a verticaldirection, the system described below measures vertical accelerations and tilt(deviation from the vertical) during penetration.
5.5.2 Measuring System
The measuring system used during Cruise SO 86 consisted of a vertical accelerometer,a tilt sensor and a data logger. The electronics are housed in apressure case which isdesigned for operation in water depth up to 6000 m. The signals of the accelerometerand the tilt sensor are digitized and stored after passing the anti-aliasing filter and theamplifier of a signal conditioning module. The range of the accelerometer is 3 9 with asensitivity of 0.001 g. The sensor can survive a maximal shock of 10000 9 according tothe specifications of the manufacturer. The tilt sensor covers a range of ± 20° with asensitivity of 0.5 seconds of an are. The resolution of the A/D converter is 13 bits at asampie rate of 100 Hz. At this rate the data logger can record two channels of data for22 minutes.
To house the pressure case in the weight stand of the gravity core, five of the usuallead disks were replaced by steel disks of identical dimensions, containing a holeslightly larger than the outside diameter of the pressure case. Lining up the holes ofthe individual steel disks creates an opening large enough to house the pressure case.Additional set screws press the pressure case again the steel disks to avoid relativemovement between the two. This arrangement guarantees that the sensors in thepressure case records the true motion of the core head.
Two prototypes of the instrument were used during Cruise SO 86 with differenttriggering systems to start the recording of data. One simply used a shorteningconnector. This has the consequence that the sampling rate has to be reduced to50 Hz in order to obtain a large enough recording window to monitor the penetration ofthe core. The other prototype contained apressure sensor whose pressure ismonitored continuously by the data logger. If the pressure exceeds a certain presetlimit, the high-frequency sampling and recording of acceleration and tilt is initiated.
5.5.3 Shipboard Results
The system was successfully used at eight gravity core stations, GeoB 2301 and 2304to 2310. Only one measurement failed because of a water leak at a damagedconnector in 1000 m water depth.
Figure 57 shows the acceleration and tilt during penetration of the gravity core atstation GeoB 2301. The time origin (t :::: 0) is arbitrary. Before penetration the gravitycore is accelerated up and down due to the heave of the ship with periods of around

106
2 6
Bagln 01 End ofPanel ration Penelratlon 5
4-~ 0
.......(/)- 3 Q)
c: Q)...~
ClQ)"0-.Ql 2 :t=
Q) -1 i=~ Tin
-2
0
-3 -10 5 10 15 20 25 30 35
Time (sec)
Figure 57 Acceleration and tilt versus time during penetration of gravity core GeoB2301-3.
1
..- 0.5~
Cl>~E-c:
00~"-Cl>ä>8« ·0.5
·1o 1 2 3 4 5 6 7 8
Depth (m)9 10 11 12 13
Figure 58 Acceleration versus penetration depth of gravity core GeoB 2301-3.

107
10 seconds and smaller accelerations in the range of ± 0.5 m/s2. The magnitude ofthese accelerations mainly depends on the sea state while the care is taken. The prepenetration tilt data show similar periodic variations as acceleration with amplitudes of± 0.5°. On top of this signal are high-frequency changes which may be associated withthe wire strum. Picking the exact instant when the core cutter hits the ocean floar issometimes difficult, especially in case of very soft sediments without a sharp but agradual change in physical properties Iike density or shear strength at thesediment/water boundary. In Figure 1 the moment of penetration is c1early identifiedby an obvious change in acceleration pattern as weil as a clear shift in tilt signalcharacteristics. It is interesting to note how the frequency of the tilt signal changesfrom lower to higher values as the barrel penetrates deeper and deeper and the part ofthe barrel which still sticks out of the sediment becomes shorter and shorter. Thisspecific behaviour was clearly observed at most coring stations. The tilt suddenlyincreases in the moment of penetration to values of up to ± 01 and ends at a value ofabout 10 after the core has come to a stop in the sediment. Accelerations amount tomaximal values of ± 1 m/s2 about 12 sec after the beginning of the penetration whichmay be due to the decreasing porosity at the base of a section of hemipelagic mud asindicated in the sedimentological core description. The total penetration time is about17.5 sec.
The result of the double integration of the acceleration is shown in Figure 58. Notethat a reversed depth scale is used with the maximum penetration depth at the origin.According to this calculation the total penetration depth amounts to only about 12.5 mwhich falls considerably short of the core recovery of 15.34 m. The major accelerationpeak near the bottom of the core is most Iikely related to the change in lithology fromhemipelagic mud to foram-bearing hemipelagic mud (see Fig. 35).
At present the discrepancy between calculated penetration depth and recoveredcare length remains to be explained. A potential source of this problem could be thecalibration of the acceleration sensor which will inspected in further detailedexperimental work. Nevertheless, the discussion of the data shows very c1early thataltogether the new system performed very weil and gives meaningful results.

108
6 Hydroacoustic System Development with the SEL-90 Echosounder
w.-O. Heinitz, J. Ewert, T. Merkel
The sediment echosounder SEL-90 was developed at the University of Rostock by thehydroacoustics working group in the Department of Electrical Engineering. Up to nowit has predominantly been used in shallow water research. The main purpose of participating in R/V SONNE Cruise SO 86 was the continued technical modification of theinstrument for deep sea applications initially begun during R/V SONNE Cruise SO 82in October 1992.
The varying water depths and sedimentary deposits in the Angola Basin and at theAfrican continental margin are an ideal area for the system testing with respect tostructural resolution and frequency dependant signal penetration under deep waterconditions. Also direct comparisons with the PARASOUND/PARADIGMA System as weilas the GI-GUN high frequency seismic source could be carried out.
During the first week of the cruise, the SEL-90 system was completely set up andthe transducer array installed with a new acoustical window which is reduced inthickness to lower sound attenuation for high signal frequencies. The comparison withearlier versions used on Cruise SO 82 showed a major improvement of the sourcelevel in particular for the most common signal frequency of 10kHz.
In preparing the cruise, substantial modifications of the hardware and software weremade to adapt the system for the Ionger sound travel times in deep waters. Specificalgorithms for on-line and off-Iine signal processing were tested. The full computercontrol of the timing scheme allowed a very high repetition rate of the transmittedpulses. By manually adjusting the sounding trigger and the reception window to theactual water depth, both steps could be mixed to obtain an optimum spatial coverageof the sea floor. It is much higher than for other conventional echosounders includingthe PARASOUND system and can arbitrarily be chosen down to a few hundred milliseconds.
A new calibrated frequency compensation between the transducer array and thetransmitter and receiver of SEL-90 was added to improve the sensitivity. The signaldynamic range was increased by a new controlled amplifier and filter in combinationwith a new data acquisition unit wh ich were installed during the cruise and tested. Thenew interface boards include four special notch filters to reduce acoustic disturbancesfrom other echosounders.
The notch filters were successful in eliminating the 15.5 kHz signal of theHVDROSWEEP system, but in the 5 kHz and 20 kHz operation mode of the SEL-90 thePARASOUND signals of 4, 18 and 22 kHz could not be completely erased. This wascaused by the broader bandwidth of the standard one pulse PARASOUND signal at 4

109
kHz which cannot be covered by notch filters only. In the 10kHz operation mode ofthe SEL-90 all noise signals were significantly reduced.
According to the original plans, the basic technical work could be finished witharrival in the working area at the Southwest African continental margin, and data wereroutinely recorded during geophysical surveying. For immediate use and later quantitative analyses the data were acquired as an on-Une color printout of the echo amplitudes and digitallyon a magnetooptical disc drive and a digital audio tape recorder.
For profiles of about 860 nm length color echoprints and digital data on MO discswere collected during the cruise. In addition, for about 240 nm the signals of the SEL90 and the PARASOUND system were stored in parallel on digital audio tapes.
The direction of the sound emission beam significantly affects the signal quality andthe imaging characteristics of an echosounder. The detection of the sea bottom andthe vertical resolution can be improved by beam steering according to changes in themorphology and inclination of the sea bed. To test the influence of this parameter, theSEL-90 system was equipped with a computer controlled electronic beam steeringmodule. Several experiments yielded a major improvement in particular for slopeangles steeper than 4°. It turned out, however, that the present version of SEL-90 doesnot provide sufficiently small steering angle increments to allow an imaging of theobserved topography with constant quality.
In addition to the main activities described above, several new features were built inthe SEL-90 system during the cruise:
integration of the ship's navigation data into the SEL·90 system and in eachseismogram header;generation of a special digital data strings for analog recordings to improvesubsequent laboratory tests with real analog signals;expanded data record structure for digital data recording to allow for animproved post processing;the printer driver was suplemented to work with both the color printerMannesmann Tally MT92C and Hewlett Packard Paint Jet;a new online algorithm for high resolution echo signal detection was written andsucessfully tested.
Summarizing the results of the cruise, it can be stated that the sonar system SEL-90has proved to be suitable for measurements under deep sea conditions. Signal penetration into the sea floor and the resolution of sediment structures was comparable toconventional sediment echosounder systems. Under optimum conditions a penetration depth of up to 100 m was reached. Special algorithms for on-line signalprocessing to optimize the graphical resolution were successfully tested.

110
The system design of the sonar system 8EL-90 is based on full computer contral ofall boards, modules and system features and thereby pravides extraordinary flexibility.Recording parameters can be easily changed, scales of the echodrawings arbitrarilyselected for screen and printer according to the requirements of the survey. Theversion of 8EL-90, which was successively modernized for a complete integration ofhigh speed computers and digital electranic equipment, is a further step towards a fullyadaptive echosounder system which optimizes signal transmission/reception byaccounting for water depth, morphology of the sea floor, penetration depth orobserved sediment structures.
7 Plankton Sampling
R. Schneider, L. Oittert, P. Helmke
Marine plankton has been collected from the surface waters during the entire cruise(Table 7). For this purpose the shipboard clean seawater pump system was used tofilter some 2000 to 5000 I each day, mostly during daylight hours. The seawater waspumped through a net with a mesh size of 10 microns, the amount of water filtered wasdetermined on basis of the plankton mass caught in the net. In case the water flowstopped due to material closing the net openings, the plankton was washed intoplastic bottles and the sampling resumed with the c1eaned net. For each day the wetplankton sampies were combined into one bottle and frazen at -15°C.
On the transit from Buenos Aires to the eastern Angola Basin only relatively lowamounts of plankton were obtained. In contrast, the recovery was high within thefreshwater plume of the Congo River and in the coastal upwelling areas north of theCongo and off Namibia. Intermediate amounts of plankton were caught off Angolabetween 8 and 15°8, and in those parts of the cruise track which crossed the coastalupwelling centers at distances greater than about 50 miles fram the African continent.
The plankton material will be investigated for the bulk composition of the biogenicdetritus in order to determine the ratios between opal, organic carbon and carbonateproduced by near surface water plankton communities. In particular, the marineorganic material will be investigated in more detail. Planned work includes analyses ofstable isotopes and individual organic compounds wh ich can be related to specificphytoplankton organisms. This type of data is required for a comparison of marineplanktic production in the surface waters to fluxes of biogenic particles caught insediment traps and found in the surface sediments beneath different productivitysystems.

Table 7 Plankton Sampling, SONNE Cruise 86
Start Filtration Stop Filtration
Date Time Latitude Longitude Salinity Temperature Time Latitude Longitude Salinity Temperature Liters(o/oo) CC) (o/oo) CC) pumped
26.04.93 10:45 24°04,8'S 41°39,9'W 37.10 27.8 16:40 23°12,9'8 40041,OW 36.91 26.7 2360
28.04.93 10:35 19°27,1'8 36°44,7W 37.26 28.2 17:16 19°05,5'8 35°21,5W 37.35 28.0 255529.04.93 08:43 18°01,5'8 32°32,7W 37.31 27.8 16:59 1r44,7'8 31°50,4W 37.40 27.5 4126
30.04.93 08:30 16°37,7'8 29°02,9'W 37.33 27.0 16:41 16°01,9'8 37°33,6W 37.30 27.0 4623
01.05.93 08:40 14°56,6'8 24°48,4W 37.30 27.0 16:54 14°28,9'8 23°15,2'W 37.30 26.7 424902.05.93 08:30 13°42,5'8 20
012,9W 36.90 25.9 16:43 13°29,9'8 18°36,0'W 36.80 26.0 4230
03.05.93 08:30 13°05,0'8 15°23,6W 36.80 26.0 16:45 12°46,5'8 13°43,1W 36.70 25.8 4391 ......04.05.93 08:15 12°10,8'8 10
040,1'W 36.70 25.7 16:43 11°50,2'8 09°04,4W 36.50 26.1 4631
......
......
05.05.93 08:30 11 °12,3'8 05°57,7'W 36.60 25.8 16:37 10°52,3'8 04°18,9'W 36.50 25.9 4230
06.05.93 08:45 10°13,1'8 Or05,6 W 36.40 26.1 16:40 09°46,1'8 00027,9'E 36.20 26.6 4229
07.05.93 08:45 08°25,2'8 03°09,8 E 35.30 26.7 17:01 07°41,3'8 04°37,7'E 34.20 27.6 3579
08.05.93 08:50 06°06,8'8 07°25,7'E 33.10 27.8 18:30 05°27,3'8 08°45,3'E 34.60 26.4 4420
09.05.93 07:30 05°16,9'8 09°48,5'E 35.40 25.8 19:45 05°07,1'8 10048,3'E 32.24 25.9 3496
10.05.93 08:45 04°42,2'8 11°02,6'E 34.35 25.7 20:05 04°46,9'8 10007,6'E 34.03 26.5 3366
11.05.93 08:55 05°11,7'8 10022,O'E 31.40 25.8 20:15 04°52,7'8 10
037,O'E 31.50 26.5 3400
12.05.93 07:45 05°04,1'8 11°06,7'E 29.85 25.4 20:05 05°11,5'8 10022,O'E 28.20 26.5 4686
13.05.93 08:30 06°28,3'8 10°40,2'E 33.65 26.8 19:00 Or02,9'8 10013,2'E 35.54 26.6 4196
14.05.93 08:30 Or04,5'8 11°10,7'E 35.63 26.8 20:10 06°44,6'8 11 °1 0,5'E 34.38 27.3 4163
15.05.93 08:05 Or26,5'8 10031,1'E 34.80 27.2 20:48 08°39,8'8 11°04,4'E 35.88 26.4 3638
16.05.93 08:10 10°27,3'8 12°14,9'E 35.80 26.5
17.05.93 19:00 11°59,9'8 12°37,5'E 36.24 26.9 6864

Table 7 continued
8tart Filtration 8top Filtration
Date Time Latitude Longitude 8alinity Temperature Time Latitude Longitude 8alinity Temperature Liters
(%o) CC) (o/oo) CC) pumped
18.05.93 09:10 12°04,4'8 13°26,O'E 35.80 26.7 17:20 12°21,9'8 12°31,4'E 36.23 26.2 5461
19.05.93 06:00 12°00,2'8 13°08,9'E 35.78 27.0 19:00 11°55,4'8 13°19,O'E 35.80 27.0 4736
20.05.93 08:00 12°03,0'8 12°53,1'E 35.80 26.8 20:55 12°26,6'8 12°12,3'E 36.05 26.7 4604
21.05.93 08:30 13°05,7'8 11°28,9'E 36.00 24.8 21:30 14°41,0'8 11°17,5'E 36.24 22.3 3720
22.05.93 08:10 16°07,8'8 10028,9'E 36.00 20.4 18:30 16°49,6'8 11°09,9'E 36.01 17.8 1921
22.05.93 18:40 16°50,1'8 11°10,5'E 35.89 17.6 0:00 17"06,7'8 11°24,9'E 35.66 15.7 717
23.05.93 08:30 17"06,3'8 10043,3'E 35.82 17.2 20:15 16°37,6'8 10
037,3'E 35.97 19.8 2457 ......
07:15 16°47,8'8 11°03,9'E 35.86 17.4 19:00 17"03,5'8 100 29,3'E 35.81 17.5 3427......
24.05.93 I"V
25.05.93 08:45 19°12,1'8 09°22,8'E 35.68 20.5 21:30 19°30,5'8 10001,9'E 35.77 18.9 4857
26.05.93 08:30 19°42,5'8 10031,9'E 35.83 19.0 19:40 21°06,3'8 11°28,9'E 35.66 17.5 2506
27.05.93 03:30 22°11,2'8 12°27,9'E 35.50 16-.6 20:40 24°41,6'8 13°55,2'E 35.20 13.2 3188
28.05.93 08:30 25°29,3'8 13°32,1'E 35.32 15.0 18:30 25°40,1'8 12°38,7'E 35.38 16.5 1687

113
8 References
AUSTIN, Jr., J.A. and E. UCHUPI, 1982. Continental - oceanic crustal transition offSouthwest Africa. Am. Ass. Petr. Geol. Bull. 66, 1328-1347.
BAUMGARTNER, T.R. and T.H. VAN ANDEL, 1971. Diapirs of the continental margin ofAngola, Africa. Geol. Soc. Am. Bull. 82, 793-802.
BOLLJ, H.M., W.B.F. RYAN et al., 1978. Initial Reports of the Deep Sea Drilling Project40, Washington, U.S. Govt. Printing Office, 1079 p.
BOYCE, R.E., 1968. Electrical resistivity of modern marine sediments from the Beringsea.J.Geophys. Res. 73,4759-4766.
BOYCE, R.E., 1976. Sound velocity-density parameters of sediment and rock framDSDP drill sites 315 - 318 on the Une Island Chain, Manihiki Plateau, andTuamotu Ridge in the Pacific Ocean. In: S.O. Schlanger, E.D. Jackson et al.(Eds.), Initial Reports of the Deep Sea Drilling Project 33, Washington, U.S. Govt.Printing Office, 695-728.
BREITZKE, M. and V. SPIEß, 1993. An automated full waveform logging system forhigh-resolution P-wave profiles in marine sediments. Mar. Geophys. Res. 15,297-321.
BRICE, S.E., M.D. COCHRAN, G. PARDO and A.D. EDWARDS, 1982. Tectonics andsedimentation of the South Atlantic Ritt Sequence: Cabinda, Angola. In: J.S.Watkins and C.L. Drake (Eds.), Studies in Continental Margin Geology. Am. Ass.Petr. Geol. Mem. 34, 5-18.
CHERKIS, N.Z., H.S. FLEMING and J.M. BROZEAN, 1989. Bathymetry of the SouthAtlantic Ocean, Naval Research Laboratory, Map and Chart Series MCH-069,Geol. Soc. Am.
EISMA, D. and A.J. VAN BENNEKOM, 1978. The Zaire River and Estuary and the Zaireoutflow in the Atlantic Ocean. Neth. J. Sea Res. 12,255-272.
EMBLEY, R.W. and J.J. MORLEY, 1980. Quaternary sedimentation and paleoenvironmental studies off Namibia (South-West Africa). Mar. Geol. 36, 183-204.
EMERY, K.O. and E. UCHUPI, 1984. The Geology of the Atlantic Ocean. New York,Springer, 925 p.

114
EMERY, K.O., E. UCHUPI, C. BOWIN, J. PHILLIPS and E.S.W. SIMPSON, 1975a.Continental margin off western Africa: Cape St. Fracis (South Africa) to WalvisRidge (South-West Africa). Am. Ass. Petr. Geol. Bull. 59,3-59.
EMERY, K.O., E. UCHUPI, J. PHILLlPS, C. BOWIN and J. MASCLE, 1975b, Continental margin off western Africa: Angola to Sierra Leone, Am. Ass. Petr. Geol.Bull. 59, 2209-2265.
HEEZEN, B.C., R.J. MENZIES, E.D. SCHNEIDER, W.M. EWING and N.C.l.GRANELLI, 1964. Congo submarine canyon. Am. Ass. Petr. Geol. Bull. 48, 11261149.
JANSEN, J.H.F., 1985. Middle and late Quaternary carbonate praduction and dissolution, and paleoceanography of the eastern Angola Basin, South AtlanticOcean. In: K.J. Hsu and H.J. Weissert (Eds.), South Atlantic Paleoceanography,Cambridge, University Press, 25-46.
JANSEN, J.H.F., T.C.E. VAN WEERING, R. GIELES and J. VAN IPEREN, 1984. Middleand late Quaternary oceanography and climatology of the Zaire-Congo Fan andthe adjacent eastern Angola Basin. Neth. J. Sea Res. 17,201-249.
KENNETT, J., 1982. Marine Geology, Englewood Cliffs, Prentice-Hall, 813 p.
LEYDEN, R., G. BRYAN and M. EWING, 1972. Geophysical reconaissance on AfricanShelf: 2. Margin sediments fram Gulf of Guinea to Walvis Ridge. Am. Ass. Petr.Geol. Bull. 56,682-693.
NELSON, G. and L. HUTCHINS, 1983. The Benguela upwelling area. Prog. Oceanog.12, 333-356.
PETERS, J.J., 1978. Discharge and sand transport in the braided zone of the ZaireEstuary. Neth. J. Sea Res. 12, 273-292.
SCHELL, 1.1., 1970. Variability and persistence in the Benguela Current and upwellingoff Southwest Africa. J. Geophys. Res. 75, 5225-5241.
SCHNEIDER, R., 1991. Spätquartäre Produktivitätsänderungen im östlichen AngolaBecken: Reaktion auf Variationen im Passat-Monsun-Windsystem und in derAdvektion des Benguela-Küstenstroms. Berichte Fachbereich Geowissenschaften, Universität Bremen 21, 198 p.
SCHULTHEISS, P. J. and S.O. McPHAIL, 1989. An automated P-wave logger forrecording fine-scale compressional wave velocity structures in sediments. In:W. Ruddiman, M. Sarnthein et al. (Eds.), Praceedings of the Ocean Drilling

115
Program, Scientific Results 108, College Station, Ocean Drilling Program, 407413.
SHEPARD, F.P. and K.O. EMERY, 1973. Congo submarine canyon and fan valley. Am.Ass. Petr. Geol. Bull. 57,1679-1691.
SIEDLER, G., and H. PETERS, 1986. Properties of sea water. In: K. H. Hellwege and O.Madelung (Eds.), Landolt-BÖrnstein. Zahlenwerte und Funktionen aus Naturwissenschaften und Technik, Band V/3a, Berlin, Springer, 233-264.
STRAMMA, L. and R.G. PETERSON, 1989. Geostrophic transport in the BenguelaCurrent region. J. Phys. Oceanography 19, 1440-1448.
VAN WEERING, T.C.E. and J. VAN IPEREN, 1984. Fine-grained sediments of the Zairedeep-sea fan, southern Atlantic Ocean. In: D.A.V. Stow and D.J.W. Piper (Eds.),Fine-Grained Sediments, Deep Water Processes and Facies. Oxford, Blackwell,95-113.

116
.9 Acknowledgements
The scientific party aboard R/V SONNE during Cruise No. 86 gratefully acknowledgesthe friendly cooperation and efficient technical assistance of Captain Bruns and hiscrew.
We also appreciate the most valuable help of ship's managing owners, the RFReedereigemeinschaft Forschungsschiffahrt, Bremen and the German Embassies atBrasilia and Buenos Aires, in particular Drs. Matthes and Geipel, in the realization ofthe cruise.
The work was funded by the German Federal Ministery for Research andTechnology (Bundesministerium für Forschung und Technologie, BMFT) undercontract "PROBOSWA" (PROjektstudie für eine geplante Bohrkampagne des OceanDrilling Program (ODP).

Publications of this Series
No. 1 Wefer, G., E. Suess und Fahrtteilnehmer, 1986. Bericht über die POLARSTERN-FahrtANT IV/2, Rio de Janeiro - Punta Arenas, 6.11. - 1.12.1985.60 S.
NO.2 Hoffmann, G., 1988. Holozänstratigraphie und Küstenlinienverlagerung an der andalusischen Mittelmeerküste. 173 S.
No. 3 Wefer, G., U. Blei!, P.J. Müller, H.D. Schulz, W.H. Berger, U. Brathauer, L. Brück,A. Dahmke, K. Dehning, M.L. Duarte-Morais, F. Fürsich, S. Hinrichs, K. Klockgeter,
A. Kölling, C. Kothe, J.F. Makaya, H. Oberhänsli, W. Oschmann, J. Posny, F. Rostek,H. Schmidt, R. Schneider, M. Segl, M. Sobiesiak, T. Soltwedel, V. Spieß, 1988. Berichtüber die METEOR-Fahrt M 6/6, Libreville - Las Palmas, 18.2. - 23.3.1988. 97 S.
NO.4 Wefer, G., G.F. Lutze, T.J. Müller, O. Pfannkuche, W. Schenke, G. Siedler, W. Zenk,1988. Kurzbericht über die METEOR-Expedition Nr. 6, Hamburg - Hamburg,28.10.1987 - 19.5.1988. 29 S.
No. 5 Fischer, G., 1989. Stabile Kohlenstoff-Isotope in partikulärer organischer Substanz ausdem Südpolarmeer (Atlantischer Sektor). 161 S.
No. 6 Berger, W.H. und G. Wefer, 1989. Partikelfluß und Kohlenstoffkreislauf im Ozean.Bericht und Kurzfassungen über den Workshop vom 3.-4. Juli 1989 in Bremen. 57 S.
NO.7 Wefer, G., U. Blei!, HD. Schulz, W.H. Berger, T. Bickert, L. Brück, U. Claussen,A. Dahmke, K. Dehning, Y.H. Djigo, S. Hinrichs, C. Kothe, M. Krämer, A. Lücke,S. Matthias, G. Meinecke, H. Oberhänsli, J. Pätzold, U. Pflaumann, U. Probst,A. Reimann, F. Rostek, H. Schmidt, R. Schneider, T. Soltwedel, V. Spieß, 1989.
Bericht über die METEOR-Fahrt M 9/4, Dakar - Santa Cruz, 19.2. - 16.3.1989. 103 S.
No. 8 Kölling, M., 1990. ModelIierung geochemischer Prozesse im Sickerwasser und Grundwasser. 135 S.
NO.9 Heinze, P.-M., 1990. Das Auftriebsgeschehen vor Peru im Spätquartär. 204 S.
No. 10 Willems, H., G. Wefer, M. Rinski, B. Donner, H.-J. Bellmann, L. Eißmann, A. Müller,B.W. Flemming, H.-C. Höfle, J. Merkt, H. Streif, G. Hertweck, H. Kuntze, J. Schwaar,
W. Schäfer, M.-G. Schulz, F. Grube, B. Menke, 1990. Beiträge zur Geologie undPaläontologie Norddeutschlands: Exkursionsführer. 202 S.
No. 11 Wefer, G., N. Andersen, U. Bleil, M. Breitzke, K. Dehning, G. Fischer, C. Kothe,G. Meinecke, P.J. Müller, F. Rostek, J. Sagemann, M. Scholz, M. Segl, W. Thießen,
1990. Bericht über die METEOR-Fahrt M 12/1, Kapstadt - Funchal, 13.3.1990 14.4.1990.66 S.
No. 12 Dahmke, A., HD. Schulz, A. Kölling, F. Kracht, A. Lücke, 1991. Schwermetallspuren
und geochemische Gleichgewichte zwischen Porenlösung und Sediment imWesermündungsgebiet. BMFT-Projekt MFU 0562, Abschlußbericht. 121 S.

No. 13 Rostek, F., 1991. Physikalische Strukturen von Tiefseesedimenten des Südatlantiksund ihre Erfassung in Echolotregistrierungen. 209 S.
NO.14 Baumann, M., 1991. Die Ablagerung von Tschernobyl-Radiocäsium in der Norwegischen See und in der Nordsee. 133 S.
No. 15 Kölling, A., 1991. Frühdiagenetische Prozesse und Stoff-Flüsse in marinen und ästuarinen Sedimenten. 140 S.
NO.16 SFB 261 (Hrsg.), 1991. 1. Kolloquium des Sonderforschungsbereichs 261 der Universität Bremen: Der Südatlantik im Spätquartär - Rekonstruktion von Stoffhaushalt und
Stromsystemen. Kurzfassungen der Vorträge und Poster. 66 S.
No. 17 Pätzold, J., T. Bickert, L. Brück, C. Gaedicke, K. Heidland, G. Meinecke, S. Mulitza,
1993. Bericht und erste Ergebnisse über die METEOR-Fahrt M 15/2, Rio de Janeiro Vit6ria, 18.1. - 7.2.1991. 46 S.
No. 18 Wefer, G., N. Andersen, W. Balzer, U. Blei!, L. Brück, D. Burda, A. Dahmke,B. Donner, T. Felis, G. Fischer, H. Gerlach, L. Gerullis, M. Hauf, R. Henning,S. Kemle, C. Kothe, R. Melyooni, F. Pototzki, H. Rode, J. Sagemann, M. Schlüter,M. Scholz, V. Spieß, U. Treppke, 1991. Bericht und erste Ergebnisse über die
METEOR-Fahrt M 16/1, Pointe Noire - Recife, 27.3. - 25.4.1991.120 S.
No. 19 Schulz, H.D., N. Andersen, M. Breitzke, D. Burda, K. Dehning, V. Diekamp, T. Felis,H. Gerlach, R. Gumprecht, S. Hinrichs, H. Petermann, F. Pototzki, U. Probst, H. Rode,J. Sagemann, U. Schinzel, H. Schmidt, R. Schneider, M. Segl, B. Showers,M. Tegeler, W. Thießen, U. Treppke, 1991. Bericht und erste Ergebnisse über dieMETEOR-Fahrt M 16/2, Recife - Belem, 28.4. - 20.5.1991.149 S.
No. 20 Berner, H., 1991. Mechanismen der Sedimentbildung in der Fram-Straße, im
Arktischen Ozean und in der Norwegischen See. 167 S.
No. 21 Schneider, R., 1991. Spätquartäre Produktivitätsänderungen im östlichen AngolaBecken: Reaktion auf Variationen im Passat-Monsun-Windsystem und in der Advektion des Benguela-Küstenstroms. 198 S.
No. 22 Hebbeln, D., 1991. Spätquartäre Stratigraphie und Paläozeanographie in der FramStraße. 174 S.
No. 23 Lücke, A., 1991. Umsetzungsprozesse organischer Substanz während der Frühdiagenese in ästuarinen Sedimenten. 137 S.
No. 24 Wefer, G., D. Beese, W.H. Berger, U. Blei!, H. Buschhoff, G. Fischer, M. Kalberer,S. Kemle-von Mücke, B. Kerntopf, C. Kothe, D. Lutter, B. Pioch, F. Pototzki,V. Ratmeyer, U. Rosiak, W. Schmidt, V. Spieß, D. Völker, 1992. Bericht und ersteErgebnisse der METEOR-Fahrt M 20/1, Bremen - Abidjan, 18.11.1991 - 22.12.1991.74 S.

No. 25 Schulz, H.D., D. Beese, M. Breitzke, L. Brück, B. Brügger, A. Dahmke, K. Dehning,V. Diekamp, B. Donner, I. Ehrhardt, H. Gerlach, M. Giese, R. Glud, R. Gumprecht,J. Gundersen, R Henning, H. Petermann, M. Richter, J. Sagemann, W. Schmidt,R Schneider, M. Segl, U. Werner, M. Zabel, 1992. Bericht und erste Ergebnisse derMETEOR-Fahrt M 20/2, Abidjan - Dakar, 27.12.1991 - 3.2.1992. 173 S.
NO.26 Gingeie, F., 1992. Zur klimaabhängigen Bildung biogener und terrigener Sedimenteund ihrer Veränderung durch die Frühdiagenese im zentralen und östlichen Südatlantik. 202 S.
No. 27 Bickert, T., 1992. Rekonstruktion der spätquartären Bodenwasserzirkulation im östlichen Südatlantik über stabile Isotope benthischer Foraminiferen. 205 S.
No. 28 Schmidt, H., 1992. Der Benguela-Strom im Bereich des Walfisch-Rückens imSpätquartär. 172 S.
No. 29 Meinecke, G., 1992. Spätquartäre Oberflächenwassertemperaturen im östlichen äquatorialen Atlantik. 181 S.
No. 30 Bathmann, U., U. Bleil, A. Dahmke, P. Müller, A. Nehrkorn, E.-M. Nöthig, M. Olesch,J. Pätzold, H.D. Schulz, V. Smetacek, V. Spieß, G. Wefer, H. Willems, 1992. Berichtdes Graduierten Kollegs "Stoff-Flüsse in marinen Geosystemen". BerichtszeitraumOktober 1990 - Dezember 1992. 396 S.
No. 31 Damm, E., 1992. Frühdiagenetische Verteilung von Schwermetallen in Schlicksedimenten der westlichen Ostsee. 115 S.
No. 32 Antia, E.E., 1993. Sedimentology, Morphodynamics and Facies Association of aMesotidal Barrier Island Shoreface (Spiekeroog, Southern North Sea). 370 p.
No. 33 Duinker, J. und G. Wefer (Hrsg.), 1993. Bericht über den 1. JGOFS-Workshop. 1./2.Dezember 1992 in Bremen. 83 S.
No. 34 Kasten, S., 1993. Die Verteilung von Schwermetallen in den Sedimenten eines stadtbremischen Hafenbeckens. 103 S.
No. 35 Spieß, V., 1993. Digitale Sedimentographie. Neue Wege zu einer hochauflösendenAkustostratigraphie. 199 S.
No. 36 Schinzel, U., 1993. Laborversuche zu frühdiagenetischen Reaktionen von Eisen (111) Oxidhydraten in marinen Sedimenten. 189 S.
NO.37 Sieger, R, 1993. CoTAM - ein Modell zur ModelIierung des Schwermetalltransports inGrundwasserleitern. 56 S.
No. 38 Willems, H. (ed.) 1993. Geoscientific Investigations in the Tethyan Himalayas. in prep.

No. 39 Hamer, K., 1993. Entwicklung von Laborversuchen als Grundlage für die ModelIierung
des Transportverhaltens von Arsenat, Blei, Cadmium und Kupfer in wassergesättigten
Säulen. 147 S.
No. 40 Sieger, R., 1993. ModelIierung des Stofftransports in porösen Medien unter Anko pplung kinetisch gesteuerter Sorptions- und Redoxprozesse sowie thermischer Gleichgewichte. 158 S.
No. 41 Thießen, W., 1993. Magnetische Eigenschaften von Sedimenten des östlichen Südatlantiks und ihre paläozeanographische Relevanz. 170 S.
No. 42 Spieß, V., A. Abelmann, T. Bickert, I. Brehme, A. Cavalcanti de C. Laier, R. Cordes,K. Dehning, T. v. Dobeneck, B. Donner, I. Ehrhardt, M. Giese, J. Grigel, W. Haie,R. Haese, S. Hinrichs, S. Kasten, H. Petermann, R. Rapp, J. Rogers, M. Richter,A. Schmidt, M. Scholz, F. Skowronek, M. Teixeira de Oliveira, M. Zabel, 1994. Reportand Preliminary Results of METEOR-Cruise M 23/1, Capetown - Rio de Janeiro,4.2.1993 - 25.2.1993. 139 p.
No. 43 Bleil, U., A. Ayres Neto, D. Beese, M. Breitzke, K. Dehning, V. Diekamp,T. v. Dobeneck, A. Figueiredo, M. Pimentel Esteves, M. Giese, R. Glud, J. Grigel,J. Gundersen, R. Haese, S. Hinrichs, S. Kasten, G. Meinecke, S. Mulitza,H. Petermann, R. Petschik, R. Rapp, M. Richter, C. Rühlemann, M. Scholz,K. Wallmann, M. Zabel, 1994. M 23/2, Rio de Janeiro - Recife, 27.2.1993 - 19.3.1993.133 p.
NO.44 Wefer, G., D. Beese, W.H. Berger, K. Buhlmann, H. Buschhoff, M. Cepek,V. Diekamp, G. Fischer, E. Holmes, S. Kemle-von Mücke, B. Kerntopf, C.B. Lange,S. Mulitza, W.-T. Ochsenhirt, R. Plugge, V. Ratmeyer, C. Rühlemann, W. Schmidt,M. Schwarze, C. Wallmann, M. Zabel, 1994. Report and Preliminary Results ofMETEOR-Cruise M 23/3, Recife - Las Palmas, 21.3.1993 - 12.4.1993. 71 p.
NO.45 Giese, M. und G. Wefer (Hrsg.), 1994. Bericht über den 2. JGOFS-Workshop. 18./19.November 1993 in Bremen. 93 S.
No. 46 Balzer, W., M. Bleckwehl, H. Buschhoff, G. Fischer, F.G. Palma, M. Kalberer,U. Kuller, V. Ratmeyer, U. Rosiak, D. Schneider, A. Zimmermann, 1994. Report andPreliminary Results of METEOR-Cruise M 22/1, Hamburg - Recife, 22.9. - 21.10.1992.24 p.
No. 47 Stax, R., 1994. Zyklische Sedimentation von organischem Kohlenstoff in der Japan
See: Anzeiger für Änderungen von Paläoozeanographie und Paläoklima im Spätk~no
zoikum. 150 S.
No. 48 Skowronek, F., 1994. Frühdiagenetische Stoff-Flüsse gelöster Schwermetalle an derOberfläche von Sedimenten des Weser Ästuares. 107 S.
No. 49 Dersch-Hansmann, M., 1994. Zur Klimaentwicklung in Ostasien während der letzten 5Millionen Jahre: Terrigener Sedimenteintrag in die Japan See (ODP Ausfahrt 128).149 S.

No. 50 Zabel, M., 1994. Frühdiagenetische Stoff-Flüsse in Oberflächen-Sedimenten des äquatorialenund östlichen Südatlantik. 129 S.

Related Documents


