1 Keyera uses certain “Non-GAAP Measures” such as EBITDA, adjusted EBITDA, funds from operations, distributable cash flow, distributable cash flow per share and payout ratio. See section titled “Non-GAAP Financial Measures”, “Dividends: Funds from Operations and Distributable Cash Flow” and “EBITDA” of the MD&A for further details. 2 Realized margin is a “Non-GAAP Measure” and excludes the effect of $63 million in non-cash losses from commodity-related risk management contracts. 3 Net earnings for 2019 have been restated. Refer to the “Voluntary Change in Accounting Policy” section of the MD&A for further details. August 5, 2020 2020 Second Quarter Report For the period ended June 30, 2020 HIGHLIGHTS • Keyera delivered strong results in the second quarter despite the ongoing COVID-19 pandemic and low commodity prices that continue to affect the global economy and energy industry. To date, Keyera has successfully implemented its pandemic response and business continuity plans resulting in safe and reliable operations. • During the second quarter, Keyera made significant progress to enhance its long-term competitive positioning by reducing its overall cost structure. Keyera expects these efforts to contribute a total annual improvement in earnings before tax of between $45 million and $65 million, with the majority to begin in 2021. • Keyera’s capital projects are progressing well and the company now expects to invest growth capital in 2020 of between $500 million and $550 million. In addition, Keyera expects to invest approximately $70 million in 2020 related to the butane distribution infrastructure at Kinder Morgan’s Galena Park facility. Keyera plans to fund its 2020 capital program without issuing common equity and expects to adhere to this funding model for growth capital projects in the short to medium term. • Keyera maintains its strong financial position, with a net debt to adjusted EBITDA 1 ratio of 2.5x as of June 30, 2020, a conservative year to date payout ratio 1 of 51%, two investment grade corporate credit ratings, access to a $1.5 billion line of credit, and minimal long-term debt maturities over the next five years. • During the second quarter, all three business segments performed well. The Gathering and Processing segment reported operating margin of $69 million, similar to the same period last year (Q2 2019 – $70 million), reflecting Keyera’s strong customer relationships that helped ensure only modest volumes were shut in during the quarter. • The Liquids Infrastructure segment generated $100 million in operating margin (Q2 2019 – $93 million) demonstrating the resilience of Keyera’s storage, transportation and fractionation assets. • The Marketing segment earned realized margin of $54 million 2 (Q2 2019 – $115 million) as Keyera’s effective risk management program protected margins and inventory values from the sharp decline in commodity prices that began in March. Keyera now expects the Marketing segment to generate realized margin between $300 million and $340 million in 2020, exceeding previous guidance of $270 million to $310 million. • Keyera’s adjusted EBITDA 1 was $182 million (Q2 2019 – $249 million) and distributable cash flow 2 increased over the same period last year to $158 million or $0.71 per share (Q2 2019 – $144 million or $0.67 per share), resulting in a year to date payout ratio 1 of 51%. Keyera plans on maintaining its current monthly dividend of $0.16 per share or $1.92 per share annually. • Net earnings 3 for the second quarter were $18 million or $0.08 per share (Q2 2019 – $225 million or $1.05 per share) and included unrealized non-cash losses associated with risk management contracts from the Marketing segment, severance costs, and a lower income tax recovery than in 2019.

Welcome message from author
This document is posted to help you gain knowledge. Please leave a comment to let me know what you think about it! Share it to your friends and learn new things together.
Transcript

1 Keyera uses certain “Non-GAAP Measures” such as EBITDA, adjusted EBITDA, funds from operations, distributable cash flow, distributable cash flow per share and payout ratio. See section titled “Non-GAAP Financial Measures”, “Dividends: Funds from Operations and Distributable Cash Flow” and “EBITDA” of the MD&A for further details. 2 Realized margin is a “Non-GAAP Measure” and excludes the effect of $63 million in non-cash losses from commodity-related risk management contracts. 3 Net earnings for 2019 have been restated. Refer to the “Voluntary Change in Accounting Policy” section of the MD&A for further details.
August 5, 2020
2020 Second Quarter Report
For the period ended June 30, 2020
HIGHLIGHTS
• Keyera delivered strong results in the second quarter despite the ongoing COVID-19 pandemic and low commodity prices that continue to affect the global economy and energy industry. To date, Keyera has successfully implemented its pandemic response and business continuity plans resulting in safe and reliable operations.
• During the second quarter, Keyera made significant progress to enhance its long-term competitive positioning by reducing its overall cost structure. Keyera expects these efforts to contribute a total annual improvement in earnings before tax of between $45 million and $65 million, with the majority to begin in 2021.
• Keyera’s capital projects are progressing well and the company now expects to invest growth capital in 2020 of between $500 million and $550 million. In addition, Keyera expects to invest approximately $70 million in 2020 related to the butane distribution infrastructure at Kinder Morgan’s Galena Park facility. Keyera plans to fund its 2020 capital program without issuing common equity and expects to adhere to this funding model for growth capital projects in the short to medium term.
• Keyera maintains its strong financial position, with a net debt to adjusted EBITDA1 ratio of 2.5x as of June 30, 2020, a conservative year to date payout ratio1 of 51%, two investment grade corporate credit ratings, access to a $1.5 billion line of credit, and minimal long-term debt maturities over the next five years.
• During the second quarter, all three business segments performed well. The Gathering and Processing segment reported operating margin of $69 million, similar to the same period last year (Q2 2019 – $70 million), reflecting Keyera’s strong customer relationships that helped ensure only modest volumes were shut in during the quarter.
• The Liquids Infrastructure segment generated $100 million in operating margin (Q2 2019 – $93 million) demonstrating the resilience of Keyera’s storage, transportation and fractionation assets.
• The Marketing segment earned realized margin of $54 million2 (Q2 2019 – $115 million) as Keyera’s effective risk management program protected margins and inventory values from the sharp decline in commodity prices that began in March. Keyera now expects the Marketing segment to generate realized margin between $300 million and $340 million in 2020, exceeding previous guidance of $270 million to $310 million.
• Keyera’s adjusted EBITDA1 was $182 million (Q2 2019 – $249 million) and distributable cash flow2 increased over the same period last year to $158 million or $0.71 per share (Q2 2019 – $144 million or $0.67 per share), resulting in a year to date payout ratio1 of 51%. Keyera plans on maintaining its current monthly dividend of $0.16 per share or $1.92 per share annually.
• Net earnings3 for the second quarter were $18 million or $0.08 per share (Q2 2019 – $225 million or $1.05 per share) and included unrealized non-cash losses associated with risk management contracts from the Marketing segment, severance costs, and a lower income tax recovery than in 2019.

Keyera Corp. TSX: KEY 2020 Second Quarter Report August 5, 2020
KEYERA CORP.
2
Notes: 1 Net earnings for 2019 have been restated. Refer to the “Voluntary Change in Accounting Policy” section of the MD&A. 2 Payout ratio is defined as dividends declared to shareholders divided by distributable cash flow. Payout ratio, funds from operations, and distributable
cash flow are not standard measures under Generally Accepted Accounting Principles (“GAAP”). See the section titled, “Dividends: Funds from
Operations and Distributable Cash Flow”, for a reconciliation of funds from operations and distributable cash flow to the most closely related GAAP
measure. 3 Adjusted EBITDA is defined as earnings before finance costs, taxes, depreciation, amortization, impairment expenses, unrealized gains/losses and any
other non-cash items such as gains/losses on the disposal of property, plant and equipment. EBITDA and adjusted EBITDA are not standard measures
under GAAP. See section of the MD&A titled “EBITDA” for a reconciliation of adjusted EBITDA to its most closely related GAAP measure. 4 Fractionation throughput in the Liquids Infrastructure segment is the aggregation of volumes processed through the fractionators and the de-ethanizers
at the Keyera and Dow Fort Saskatchewan facilities. 5 Long-term debt includes the total value of Keyera’s hybrid notes which receive 50% equity treatment by Keyera’s rating agencies. The hybrid notes are
also excluded from Keyera’s covenant test calculations related to the company’s credit facility and senior note agreements. 6 Working capital is defined as current assets less current liabilities.
Summary of Key Measures
Three months ended
June 30,
Six months ended
June 30,
(Thousands of Canadian dollars, except where noted) 2020 2019 2020 2019
Net earnings1 17,763 224,511 103,371 259,463
Per share1 ($/share) – basic 0.08 1.05 0.47 1.22
Cash flow from operating activities 159,647 191,221 476,331 415,030
Funds from operations2 177,366 197,414 463,714 325,980
Distributable cash flow2 157,649 143,568 410,688 251,516
Per share ($/share) 2 0.71 0.67 1.87 1.18
Dividends declared 106,091 96,085 211,303 191,384
Per share ($/share) 0.48 0.45 0.96 0.90
Payout ratio %2 67% 67% 51% 76%
Adjusted EBITDA3 182,159 249,371 509,274 413,781
Gathering and Processing
Gross processing throughput (MMcf/d) 1,261 1,471 1,323 1,543
Net processing throughput (MMcf/d) 1,029 1,146 1,085 1,222
Liquids Infrastructure
Gross processing throughput4 (Mbbl/d) 144 173 154 176
Net processing throughput4 (Mbbl/d) 66 79 73 85
AEF iso-octane production volumes (Mbbl/d) 12 15 13 13
Marketing
Inventory value 102,336 131,646 102,336 131,646
Sales volumes (Bbl/d) 134,800 139,700 152,900 145,100
Acquisitions 1,630 332 1,630 549
Growth capital expenditures 127,082 234,193 337,696 524,742
Maintenance capital expenditures 6,213 40,487 14,421 47,845
Total capital expenditures 134,925 275,012 353,747 573,136
Weighted average number of shares outstanding –
basic and diluted 220,851 213,239 219,855 212,364
As at June 30,
2020 2019
Long-term debt5 2,968,703 2,688,686
Credit facility — —
Working capital surplus6 (109,362) (84,446)
Net debt 2,859,341 2,604,240
Common shares outstanding – end of period 221,023 214,127

Keyera Corp. TSX: KEY 2020 Second Quarter Report August 5, 2020
KEYERA CORP.
3
Message to Shareholders Our world continues to experience unprecedented challenges due to the ongoing COVID-19 pandemic and its impact on the global economy. The health and safety of our employees, customers and other stakeholders continues to be Keyera’s number one priority and to date we have successfully implemented our pandemic response, resulting in continued safe and reliable operations.
Beginning in March, the energy industry was challenged not only by the pandemic but also by a sharp decrease in global oil prices. However, the global crude oil supply response was greater than initially anticipated and in June supported a recovery in commodity prices from the extreme lows experienced earlier in the year. While the economic and commodity price environment remains uncertain due to the recent surge in COVID-19 cases globally, Keyera continues to focus on what we can control and take prudent steps to address the short-term challenges and enhance the long-term success of the company and our customers. During the quarter we worked with our customers to develop mutually beneficial solutions to ensure they could continue to flow the majority of their volumes to our facilities. We maintained our strong financial position, which includes a healthy balance sheet, two investment grade credit ratings, a $1.5 billion undrawn credit facility, and minimal long-term debt obligations in the next 5 years. We believe our financial strength will allow us to maintain the stability and continuity of the business during this unprecedented economic time, while providing us with flexibility to be opportunistic.
During the quarter, we made significant progress enhancing our competitive positioning by reducing our overall cost structure. We implemented measures to reduce both our operating and general and administrative expenses, while continuing to advance the optimization plan in our Gathering and Processing business. We expect these efforts to have a meaningful impact on our bottom line beginning in 2021 and also reduce our greenhouse gas emissions.
Our second quarter results were impressive given the challenging environment, showing the resilience of our integrated business that provides essential services to producers and is backed by secure long-term contracts. Each of our business segments performed well and we delivered adjusted EBITDA of $182 million, distributable cash flow of $158 million or $0.71 per share, and net income of $18 million or $0.08 per share.
Given the resilience of our integrated business and the proactive steps we have taken to date, I am confident in Keyera’s future. We remain committed to generating value for our shareholders and plan on maintaining our current monthly dividend.
Gathering and Processing Operations
The Gathering and Processing segment delivered steady results in the second quarter despite the low commodity price environment. We worked with our customers during this time to find short-term solutions that prevented significant volumes from being shut in. As a result, Keyera generated an operating margin of $69 million in the Gathering and Processing segment, similar to the same period last year.
During the quarter, we continued to advance our optimization plan. We suspended operations at our Minnehik Buck Lake gas plant and recently announced plans to suspend gas processing operations at our Bigoray gas plant later this year and at our Brazeau North gas plant in 2021. To date, Keyera’s optimization plan includes suspending operations at six of our gas plants in 2020 and 2021, which is expected to increase utilization in the south region from less than 50% of processing capacity to approximately 70% by the end of 2021. These decisions have been difficult, as many of the facilities have contributed to Keyera’s success for decades; however, the decisions were necessary to increase the competitiveness and profitability of our gathering and processing operations.
Liquids Infrastructure Operations
Keyera’s Liquids Infrastructure segment demonstrated its resilience in the second quarter, generating operating margin of $100 million, which represents an 8% increase over the same period last year. With high take-or-pay contracts in this part of our business, our cash flow stream remained steady even though market conditions resulted in lower volumes through our fractionation capacity and condensate system. Demand for

Keyera Corp. TSX: KEY 2020 Second Quarter Report August 5, 2020
KEYERA CORP.
4
our underground storage increased during the quarter as producers contracted more capacity to improve operational flexibility during these uncertain times. We expect demand for our storage assets to continue.
Marketing Business
The Marketing segment delivered realized margin of $54 million in the second quarter, as Keyera’s effective risk management program protected margins and inventory values from the sharp decline in commodity prices that began in March. With strong contributions through the first half of the year, and an improving commodity price outlook for the remainder of the year, Keyera now expects Marketing to generate realized margin between $300 million and $340 million in 2020 compared to previous guidance of $270 million to $310 million.
Keyera’s marketing services are important to our integrated business model as they allow us to access high value markets for the natural gas liquids we handle and generate free cash flow that we can reinvest into our fee-for-service business.
Business Development
We continue to advance our 2020 capital program according to plan. In September, we expect the Pipestone gas plant to begin processing volumes as our anchor customer, Ovintiv, redirects its production from two other gas plants in the area. In the fourth quarter, we expect to commission phase two of the Wapiti gas plant and also begin operating the Wildhorse crude oil storage and blending terminal in Cushing, Oklahoma. These three projects substantially complete our current capital program, allowing us to focus on the development of the KAPS pipeline, which is expected to transport condensate and natural gas liquids from the Montney to our liquids infrastructure assets in Fort Saskatchewan beginning in 2023.
Keyera has a history of disciplined capital allocation, a track record we plan to continue. With the changing landscape of our industry and higher cost of capital, our goal is to ensure future investments improve the quality of Keyera’s cash flows. We will focus growth in our Liquids Infrastructure segment, which has high barriers to entry and assets that serve the entire Western Canada Sedimentary Basin. We will look for investments that are backed by long-term take-or-pay contracts with credit worthy counterparties and we will adhere to a funding model that does not require the issuance of common equity for growth capital projects in the short to medium term.
Outlook
While the full extent, effect and duration of the COVID-19 pandemic continues to be unknown, Keyera continues to implement measures to ensure our long-term success. To date, we have reduced our 2020 capital program by deferring the KAPS pipeline project one year; discontinued the dividend reinvestment program; reduced our overall cost structure, including both operating costs and general and administrative expenses; and continued to advance our gathering and processing optimization plan. We have also maintained our strong financial position and demonstrated a resilient business model that delivers results in the most challenging environment.
Looking ahead, it appears that commodity prices have stabilized and are now at levels that are incenting both natural gas and oil sands producers to return their production volumes to pre-COVID levels. As a result, we expect volumes moving through our facilities to continue to recover for the remainder of 2020 and into 2021.
On the world stage, I believe Canadian energy has a long and healthy future and Keyera will be an important part of this success. Keyera’s mission is “Connecting Energy for Life” and we will contribute to helping make Canada’s resource industry the most responsible in the world. We are committed to reducing our environmental footprint and creating environmentally superior energy solutions for the future.
On behalf of Keyera's board of directors and management team, I would like to thank our employees, customers, shareholders and other stakeholders for their continued support.
Please continue to stay safe and healthy.
David G. Smith Chief Executive Officer Keyera Corp.

Keyera Corp. TSX: KEY 2020 Second Quarter Report August 5, 2020
KEYERA CORP.
5
Management’s Discussion and Analysis The following management's discussion and analysis (“MD&A”) was prepared as of August 5, 2020, and is a review of the results of operations and the liquidity and capital resources of Keyera Corp. and its subsidiaries (collectively “Keyera”). The MD&A should be read in conjunction with the accompanying unaudited condensed interim consolidated financial statements (“accompanying financial statements”) of Keyera for the three and six months ended June 30, 2020 and the notes thereto as well as the audited consolidated financial statements of Keyera for the year ended December 31, 2019, and the related MD&A. The accompanying financial statements have been prepared in accordance with International Financial Reporting Standards (“IFRS”), also referred to as GAAP, and are stated in Canadian dollars. Effective December 31, 2019, Keyera voluntarily changed its accounting policy with respect to the discounting of its decommissioning liability. As a result, certain comparative information has been restated in this MD&A. Refer to the “Voluntary Change in Accounting Policy” section of this document for a description of changes and the effect on Keyera’s consolidated financial statements. Additional information related to Keyera, including its Annual Information Form, is available on SEDAR at www.sedar.com or on Keyera’s website at www.keyera.com. This MD&A contains non-GAAP measures and forward-looking statements and readers are cautioned that the MD&A should be read in conjunction with Keyera’s disclosure under “NON-GAAP FINANCIAL MEASURES” and “FORWARD-LOOKING STATEMENTS” included at the end of this MD&A.
Keyera’s Business Keyera operates an integrated Canadian-based energy infrastructure business with extensive interconnected assets and depth of expertise in delivering energy infrastructure solutions. Keyera operates assets in the oil and gas industry between the upstream sector, which includes oil and gas exploration and production, and the downstream sector, which includes the refining and marketing of finished products. Keyera is organized into three highly integrated operating segments:
1. Gathering and Processing – Keyera owns and operates raw gas gathering pipelines and processing plants, which collect and process raw natural gas, remove waste products and separate the economic components, primarily natural gas liquids (“NGLs”), before the sales gas is delivered into long-distance pipeline systems for transportation to end-use markets. Keyera also provides condensate handling services through its condensate gathering pipelines and stabilization facilities.
2. Liquids Infrastructure – Keyera owns and operates a network of facilities for the gathering, processing,
storage and transportation of the by-products of natural gas processing, including NGLs in mix form and specification NGLs such as ethane, propane, butane and condensate. In addition, this segment includes Keyera’s iso-octane facilities at Alberta EnviroFuels (“AEF”), its liquids blending facilities and its 50% interest in the crude oil storage facility at the Base Line Terminal.
3. Marketing – Keyera markets a range of products associated with its two infrastructure business lines,
primarily propane, butane, condensate and iso-octane, and also engages in liquids blending. The Gathering and Processing and Liquids Infrastructure segments provide energy infrastructure solutions to customers on a fee-for-service basis.

Keyera Corp. TSX: KEY 2020 Second Quarter Report August 5, 2020
KEYERA CORP.
6
Overview The ongoing COVID-19 pandemic has significantly affected the global economy and the full extent of the impact is still unknown at this time. To date, Keyera’s pandemic response and business continuity plans have been successfully implemented to ensure the safety of its employees, customers and other stakeholders. Keyera continues to plan for the evolving risks associated with COVID-19 and is incorporating information from public health authorities to ensure the safety of its stakeholders. Readers are referred to the section of this MD&A titled: “Risk Factors: Risks related to the COVID-19 pandemic”, for further discussion of risks associated with the COVID-19 pandemic that could affect Keyera’s business operations and financial condition. Despite the current economic situation, Keyera posted strong second quarter 2020 financial results due to the resilience of the Liquids Infrastructure business and Keyera’s disciplined and effective risk management program that protected margins in the Marketing segment. In addition, Keyera’s strong customer relationships ensured there were only modest volume shut-ins in the Gathering & Processing business. For the second quarter of 2020, net earnings were $18 million (Q2 2019 – $225 million) and Adjusted EBITDA was $182 million (Q2 2020 – $249 million).
Since the beginning of March, the energy industry has been challenged not only by the pandemic but also due to a sharp decrease in global oil prices. However, the global crude oil supply response was greater than initially anticipated and in June supported a recovery in commodity prices from the extreme lows experienced in March, April and May of this year. As the economic and commodity price environment remains uncertain due to the recent surge in COVID-19 cases globally, Keyera continues to focus on the following priorities:
• ensure the health and safety of its employees and contractors as the pandemic continues to evolve, and continue to be a safe, reliable and environmentally conscious operator of its facilities;
• maintain the current monthly dividend, while preserving Keyera’s strong financial position, investment grade credit ratings, and low dividend payout ratio. As of June 30, 2020, Keyera’s Net Debt to Adjusted EBITDA was 2.5x, including 50% of the subordinated hybrid notes, and its payout ratio was 51% year to date;
• maintain disciplined capital allocation that is focused on growth in the Liquids Infrastructure segment while adhering to a funding model that does not require the issuance of common equity for growth capital projects in the short to medium term;
• increase the competitiveness and profitability of the Gathering and Processing segment by optimizing its portfolio of assets in the south1 region; and
• reduce Keyera’s overall cost structure including its operating costs across all facilities as well as general and administrative expenses.
During the second quarter of 2020, Keyera made significant progress in enhancing its long-term competitive positioning by reducing its overall cost structure. Keyera implemented a number of measures to reduce both operating and general and administrative (“G&A”) expenses, while continuing to advance the optimization of gas plants in the Gathering and Processing segment. In the first half of 2020, Keyera decided to suspend operations at the gas plants noted in the table below. These suspensions are in addition to the facility closures at the Nevis and Gilby gas plants that occurred in 2019. 1 South region gas plants include all Keyera facilities in the Gathering and Processing segment except for the Edson, Wapiti, Simonette and
Pipestone (currently under construction) gas plants.
Keyera Corp. TSX: KEY 2020 Second Quarter Report August 5, 2020
KEYERA CORP.
7
Gas Plant Timing of Suspension
Minnehik Buck Lake Completed in May 2020
West Pembina Third Quarter 2020
Bigoray Fall 2020
Ricinus Mid-2021
Nordegg River Mid-2021
Brazeau North Mid-2021
The overall objectives associated with Keyera’s optimization of assets in the Gathering & Processing segment are as follows:
• redirect most of the existing raw gas to Keyera’s most efficient gas plants;
• increase utilization of the south1 region gas plants from less than 50% to approximately 70% by the
end of 2021;
• lower per unit operating costs, allowing Keyera to secure current volumes and pursue growth
opportunities while also improving customer netbacks; and
• reduce carbon dioxide (“CO2”) emissions by approximately 12% by the end of 2021 relative to 2019.
1 South region gas plants include all Keyera facilities in the Gathering and Processing segment except for the Edson, Wapiti, Simonette and
Pipestone (currently under construction) gas plants.

Keyera Corp. TSX: KEY 2020 Second Quarter Report August 5, 2020
KEYERA CORP.
8
The table below is a summary of the estimated costs and benefits associated with the overall reduction in operating and G&A expenses, and the optimization of gas plants in the Gathering & Processing segment.
Category of Cost Reductions
Forecasted Non- Recurring (Expense/ Capital cost) or Savings
Forecasted Annual Earnings before tax Increase (Decrease)
Commentary
G&A
Salaries, benefits, LTIP & other
$15 million to $20 million
Annual cost savings beginning in mid-2020. Reduction to salaries, benefits, short-term and long-term incentive and other costs resulting from lower staffing levels.
Severance costs ($20 million to $25 million)
Severance costs associated with corporate and facility staff reductions of which $16 million was recorded in Q2 2020.
Liquids Infrastructure
Operating cost reductions
$10 million to $15 million
Annual cost savings beginning in mid-2020.
Gathering & Processing
Optimization of gas plants and operating cost reductions
$20 million to $30 million
Majority of annual benefit begins in 2021 and is based on an increase in operating margin from optimization and operating cost reductions across all facilities. In addition, the optimization and cost reductions will result in incremental savings to customers that will improve their netbacks.
Plant closure operating expense
($5 million) Estimated to be incurred in 2020 and 2021 as facilities are suspended.
Growth capital ($20 million to $25 million)
Investment in infrastructure to redirect volumes to certain gas plants, expected to be incurred in 2020 and 2021.
Elimination of emission compliance cost
$15 million to $20 million
Eliminate compliance costs associated with emission regulations that would be incurred by 2025.
Total ($30 million to $35 million)
$45 million to $65 million
In addition to the above noted costs and savings, Keyera estimates that it will save on average approximately $3 million per year in maintenance and turnaround costs. Offsetting this benefit, are costs associated with decommissioning the facilities noted in the table above. These costs are currently estimated at $5 million per year to 2025. It typically takes 20 to 30 years to fully decommission and reclaim a gas plant, and costs are generally highest in the first 7 to 9 years with the remainder of costs spread out over the remaining period.

Keyera Corp. TSX: KEY 2020 Second Quarter Report August 5, 2020
KEYERA CORP.
9
Keyera expects the following for 2020:
• realized margin from the Marketing segment is now expected to range between $300 million and $340 million, which exceeds the previous guidance of $270 million to $310 million. Readers are referred to the section of this MD&A titled, “Segmented Results: Marketing”, for the assumptions associated with the 2020 realized margin guidance;
• a cash tax recovery of between $20 million and $30 million (2019 – $98 million cash tax expense);
• maintenance capital expenditures to range between $20 million and $25 million (2019 – $105 million), which is lower than the previous guidance of $30 million to $35 million as certain projects at the Rimbey and AEF facilities have been deferred or cancelled based on a risk-based review; and
• growth capital expenditures to range between $500 million and $550 million (previously disclosed range of $475 million and $525 million in the 2020 First Quarter Report) as well as an additional planned investment of approximately $70 million (US$50 million) related to the butane distribution infrastructure at Kinder Morgan’s Galena Park facility.
Maintenance turnarounds at the Simonette gas plant and AEF facility are now scheduled for the spring and fall of 2022, respectively. This allows for the deferral of approximately $40 million to $45 million in maintenance capital costs originally scheduled for 2021. This decision was based on a thorough risk assessment to ensure the safe and reliable operation of both facilities. Turnarounds at the Brazeau River and Zeta Creek gas plants are currently scheduled to proceed in 2021. Readers are referred to the section of the MD&A titled, “Forward-Looking Statements” for a further discussion of the assumptions and risks that could affect future performance and plans.

Keyera Corp. TSX: KEY 2020 Second Quarter Report August 5, 2020
KEYERA CORP.
10
CONSOLIDATED FINANCIAL RESULTS The following table highlights some of the key consolidated financial results for the three and six months ended June 30, 2020 and 2019:
Three months ended June 30,
Six months ended June 30,
(Thousands of Canadian dollars, except per share data) 2020 2019 2020 2019
Net earnings1 17,763 224,511 103,371 259,463
Net earnings per share1 (basic) 0.08 1.05 0.47 1.22
Operating margin 159,795 282,265 572,478 430,290
Realized margin2 222,732 279,580 555,681 468,760
Adjusted EBITDA3 182,159 249,371 509,274 413,781
Cash flow from operating activities 159,647 191,221 476,331 415,030
Funds from operations4 177,366 197,414 463,714 325,980
Distributable cash flow4 157,649 143,568 410,688 251,516
Distributable cash flow per share4 (basic) 0.71 0.67 1.87 1.18
Dividends declared 106,091 96,085 211,303 191,384
Dividends declared per share 0.48 0.45 0.96 0.90
Payout ratio5 67% 67% 51% 76% Notes: 1 Net earnings for 2019 have been restated. Refer to the “Voluntary Change in Accounting Policy” section of this MD&A. 2 Realized margin is defined as operating margin excluding unrealized gains and losses on commodity-related risk management contracts.
Realized margin is not a standard measure under GAAP. See the section titled, “Segmented Results of Operations: Marketing”, for a reconciliation of operating margin to realized margin as it relates to the Marketing segment. Realized margin for the two facilities segments (Gathering and Processing and Liquids Infrastructure) and the Corporate and Other segment excludes $350 of unrealized gains and $915 of unrealized losses from commodity-related risk management contracts for the three and six months ended June 30, 2020 (three and six months ended June 30, 2019 – $107 and $663 unrealized losses).
3 Adjusted EBITDA is defined as earnings before finance costs, taxes, depreciation, amortization, impairment expenses, unrealized gains/losses and any other non-cash items such as gains/losses on the disposal of property, plant and equipment. EBITDA and adjusted EBITDA are not standard measures under GAAP. See the section titled “EBITDA” for a reconciliation of adjusted EBITDA to its most closely related GAAP measure.
4 Funds from operations and distributable cash flow are not standard measures under GAAP. See the section titled, “Dividends: Funds from Operations and Distributable Cash Flow”, for a reconciliation of funds from operations and distributable cash flow to the most closely related GAAP measure.
5 Payout ratio is defined as dividends declared to shareholders divided by distributable cash flow and is not a standard measure under GAAP.

Keyera Corp. TSX: KEY 2020 Second Quarter Report August 5, 2020
KEYERA CORP.
11
Net Earnings Second Quarter Results For the three months ended June 30, 2020, net earnings were $18 million, $207 million lower than the same period in 2019 due to the following:
Year-To-Date Results On a year-to-date basis, net earnings were $103 million, $156 million lower than the prior year due to the following:
See the section below for more information related to operating margin. For more information related to impairment expense, please see the section of this MD&A titled, “Corporate and Other: Net Impairment Expense”. For all other charges mentioned above, please see the section of the MD&A titled, “Corporate and Other”, for more information related to these charges.
Keyera Corp. TSX: KEY 2020 Second Quarter Report August 5, 2020
KEYERA CORP.
12
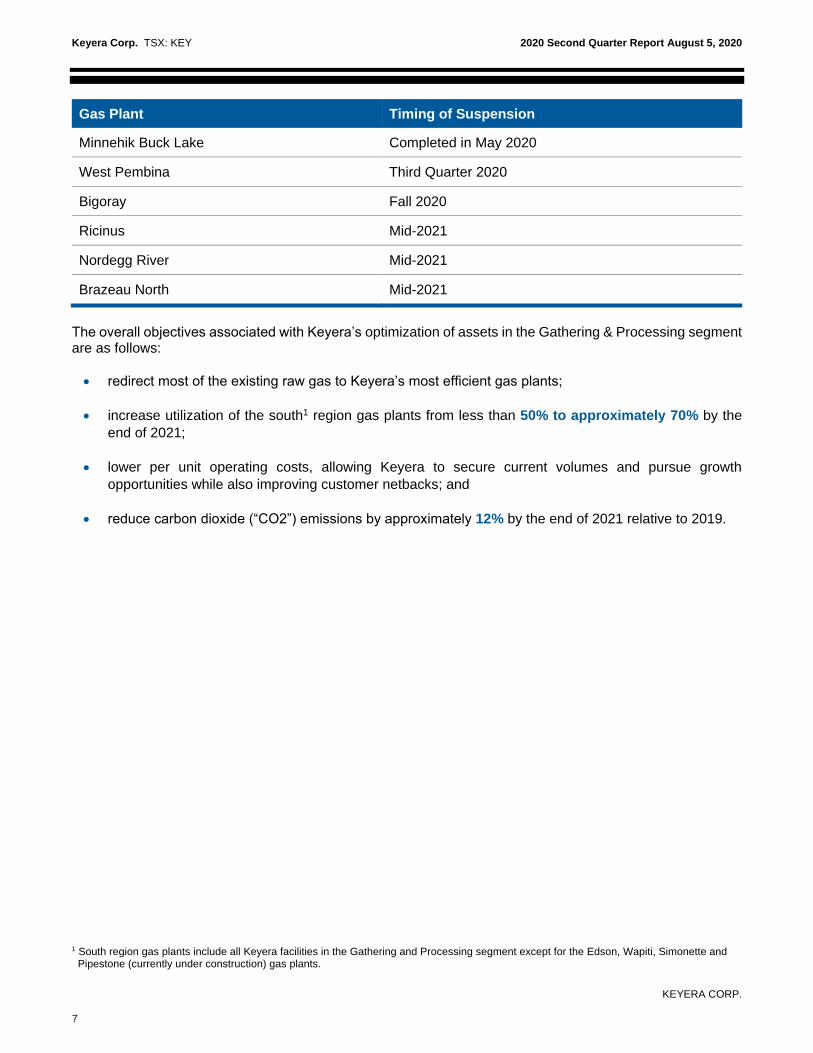
Operating Margin and Realized Margin Second Quarter Results For the three months ended June 30, 2020, operating margin was $160 million, $122 million lower than the same period in 2019 primarily due to: i) the inclusion of an unrealized non-cash loss of $63 million associated with risk management contracts from the Marketing segment in 2020 compared to an unrealized non-cash gain of $3 million in 2019; and ii) $57 million in lower realized margin primarily attributable to the Marketing segment as described in more detail below. In the second quarter of 2020, total realized margin (excluding the effect of unrealized gains and losses from commodity-related risk management contracts) was $223 million, $57 million lower than the same period in 2019 primarily due to $61 million in lower realized margin from the Marketing segment that resulted from:
• lower iso-octane margins because of higher average butane feedstock costs and weak product premiums
relative to the second quarter of 2019; and
• lower liquids blending sales volumes and margins resulting from reduced condensate demand in the
second quarter of 2020.
Partly offsetting the above factors was $7 million in higher realized margin from the Liquids Infrastructure segment due to higher storage revenues from higher contracted volumes and incremental margin associated with cavern 16 in Fort Saskatchewan which came into service in April 2020.

Keyera Corp. TSX: KEY 2020 Second Quarter Report August 5, 2020
KEYERA CORP.
13
Year-To-Date Results For the first six months of 2020, operating margin was $572 million, $142 million higher than the same period in 2019 primarily due to: i) the inclusion of an unrealized non-cash gain of $17 million associated with risk management contracts from the Marketing segment in 2020 compared to an unrealized non-cash loss of $38 million in 2019; and ii) $87 million in higher realized margin primarily attributable to the Marketing segment as described in more detail below. Realized margin for the first six months of 2020 was $556 million, $87 million higher than the same period in 2019. The higher realized margin was mainly due to the following:
• $82 million in higher realized margin from the Marketing segment due to significantly higher iso-octane
margins during the first quarter of 2020 and an effective risk management strategy that protected margins
and inventory values from the sharp decline in commodity prices that began in March 2020. Furthermore,
realized margin was unusually low in the first half of 2019 as the AEF facility had a 17-day outage that
resulted in reduced iso-octane sales and butane being sold at low market prices; and
• $15 million in higher realized margin from the Liquids Infrastructure segment resulting from: i) higher
storage revenues resulting from strong demand; ii) higher fractionation revenues in the first quarter of
2020 due to higher fees effective April 1, 2019; and iii) and an increase in volumes handled within Keyera’s
condensate network including the Norlite pipeline during the first quarter of 2020.
The above factors were partly offset by $4 million in lower operating margin from the Gathering and Processing segment primarily due to lower processing throughput across certain facilities and $7 million in lower revenues associated with Keyera’s production assets due to lower commodity prices.
See the section titled “Segmented Results of Operations” for more information on operating results by segment.

Keyera Corp. TSX: KEY 2020 Second Quarter Report August 5, 2020
KEYERA CORP.
14
Cash Flow Metrics Second Quarter Results Cash flow metrics were solid in the second quarter of 2020 despite the decrease in realized margin primarily attributable to the Marketing segment and an increase in G&A expenses associated with severance costs. As a result, cash flow from operating activities was $160 million in the second quarter of 2020, $32 million lower than the same period last year. Distributable cash flow was $158 million for the three months ended June 30, 2020, $14 million higher than the same period in 2019 due to lower current income tax and lower maintenance capital expenditures that more than offset the factors described above that reduced cash flow from operating activities.
Year-To-Date Results On a year-to-date basis, cash flow metrics were strong due to a significant increase in realized margin attributable to the Marketing and Liquids Infrastructure segments as each segment posted record results in the first quarter of 2020. As a result, cash flow from operating activities was $476 million in the first half of 2020, $61 million higher than the same period last year. Distributable cash flow for the six months ended June 30, 2020 was $411 million, $159 million higher than the same period in the prior year due to the same factors that contributed to higher cash flow from operating activities and the following factors shown in the table below:

Keyera Corp. TSX: KEY 2020 Second Quarter Report August 5, 2020
KEYERA CORP.
15
Refer to the sections of this MD&A titled, “Dividends: Funds from Operations and Distributable Cash Flow”, for a reconciliation of cash flow from operating activities to funds from operations and distributable cash flow and “Segmented Results of Operations: Marketing”, for a reconciliation of operating margin to realized margin related to the Marketing segment.
SEGMENTED RESULTS OF OPERATIONS The discussion of the results of operations for each of the operating segments focuses on operating margin. Operating margin refers to operating revenues less operating expenses and does not include the elimination of inter-segment transactions. Management believes operating margin provides an accurate portrayal of operating profitability by segment. Keyera’s Gathering and Processing and Liquids Infrastructure segments charge Keyera’s Marketing segment for the use of facilities at market rates. These segment measures of profitability for the three and six months ended June 30, 2020 and 2019 are reported in note 16, Segment Information, of the accompanying financial statements. A complete description of Keyera’s businesses by segment can be found in Keyera’s Annual Information Form, which is available at www.sedar.com.
Gathering and Processing Keyera currently has interests in 15 active gas plants1 and one gas plant that is under construction, all of which are located in Alberta. Keyera operates 13 of the 15 active gas plants and has the option to become the operator of the gas plant currently under construction, five years after the commencement of its operations. The Gathering and Processing segment includes raw gas gathering systems and processing plants strategically located in the natural gas production areas on the western side of the Western Canada Sedimentary Basin (“WCSB”). Several of the gas plants are interconnected by raw gas gathering pipelines, allowing raw gas to be directed to the gas plant best suited to process the gas. Most of Keyera’s facilities are also equipped with condensate handling capabilities. Keyera’s facilities and gathering systems collectively constitute a network that is well positioned to serve drilling and production activity in the WCSB. Keyera’s Simonette and Wapiti gas plants, as well as the non-operated Edson gas plant and the Pipestone gas plant that is currently under construction, are generally referred to as its “Northern” or “North” gas plants due to their geographic location and proximity to one another. Gas plants in the North are generally dedicated to processing gas and handling condensate from the Montney Formation. All of Keyera’s other Gathering and Processing plants are generally referred to as its “Southern” or “South” gas plants. Operating margin for the Gathering and Processing segment was as follows:
Operating Margin and Throughput Information
Three months ended June 30,
Six months ended June 30,
(Thousands of Canadian dollars) 2020 2019 2020 2019
Revenue1 124,871 120,012 253,630 236,659 Operating expenses1 (55,460) (50,305) (119,748) (98,040) Unrealized gain (loss) on electricity and other financial contracts — 6 — (584)
Total operating expenses (55,460) (50,299) (119,748) (98,624)
Operating margin 69,411 69,713 133,882 138,035
Gross processing throughput – (MMcf/d) 1,261 1,471 1,323 1,543 Net processing throughput2 – (MMcf/d) 1,029 1,146 1,085 1,222
Notes: 1 Includes inter-segment transactions. 2 Net processing throughput refers to Keyera’s share of raw gas processed at its processing facilities.
1 Excludes gas plants where Keyera has suspended operations.

Keyera Corp. TSX: KEY 2020 Second Quarter Report August 5, 2020
KEYERA CORP.
16
Second Quarter Operating Margin and Revenue
Operating Margin
$nil vs Q2 2019
• Operating margin in Q2 2020 was consistent with the same period in 2019.
• Factors that increased operating margin included higher processing throughput from phase one of the Wapiti gas plant and North Wapiti pipeline system which came into service in May and September 2019.
• The incremental operating margin from Wapiti was offset by:
• lower processing throughput across certain facilities including the Strachan, Simonette, Brazeau River, and the Alder Flats gas plants. Natural declines and lower producer activity levels caused by low commodity prices affected most of these facilities. Operating margin at the Brazeau River gas plant was further reduced due to a customer diverting volumes to their own facility.
• Fee reductions provided to customers at certain gas plants in the South effective January 1, 2020 and at the Simonette facility. Keyera’s optimization plan is intended to reduce per unit operating costs and improve competitiveness and profitability for the South gas plants as described in more detail below. In response to reduced condensate demand and pricing, short-term fee relief was also provided to customers at the Simonette facility to the end of June.
Revenue
$5 million vs Q2 2019
• The increase in revenue was due to incremental revenues at the Wapiti gas plant as well as higher ethane sales revenues. Ethane sales are generally based on index pricing and can significantly influence revenues; however, the effect on operating margin is minimal as ethane purchases from producers are also based on index pricing and are included in operating expenses.

Keyera Corp. TSX: KEY 2020 Second Quarter Report August 5, 2020
KEYERA CORP.
17
Second Quarter Year-to-Date Operating Margin and Revenue
Operating Margin
$4 million vs Q2 YTD 2019
• Operating margin was lower in the first half of 2020 compared to the same period in 2019 largely due to the same factors that affected Q2 2020. The effects of lower processing throughput across multiple facilities more than offset the incremental operating margin from the Wapiti facility on a year to date basis.
Revenue
$17 million vs Q2 YTD 2019
• The increase in revenue was primarily due to incremental revenue from the Wapiti gas plant and related infrastructure.
Gathering and Processing Activity In light of the challenges facing the energy industry in Western Canada, Keyera’s Gathering and Processing segment is committed to the following strategic priorities:
• reducing its overall cost structure and optimizing its portfolio of gas plants;
• delivering competitive full-service solutions and improving customer netbacks; and
• increasing the overall utilization of its gas plants thereby reducing carbon emissions and compliance costs, and increasing profitability.
During the second quarter of 2020, Keyera made significant progress in advancing these priorities as it undertook a reduction in operating expenses throughout its portfolio of assets, and continued to advance the optimization of gas plants in the South region. In the first half of 2020, Keyera has decided to suspend operations at the following gas plants:
Gas Plant Timing of Suspension
Minnehik Buck Lake Completed in May 2020
West Pembina Third Quarter 2020
Bigoray Fall 2020
Ricinus Mid-2021
Nordegg River Mid-2021
Brazeau North Mid-2021
Keyera will utilize its interconnected network of gathering systems to redirect volumes from these facilities to other Keyera gas plants in the area, increasing utilization of gas plants in the South from less than 50% to approximately 70% by the end of 2021. This optimization plan also aligns with Keyera's environmental efforts by reducing its overall greenhouse gas emissions by approximately 12% in 2021 relative to 2019. The operating cost reductions and optimization of gas plants are expected to result in an improvement in operating margin of $20 million to $30 million, with the majority of the annual benefit beginning in 2021. For Keyera’s customers active in the Montney, the second quarter of 2020 proved to be challenging due to the steep decline in condensate prices and low demand resulting from oil sands production cuts. In response to the challenges facing its customers in the North, Keyera provided short-term fee relief of approximately $5 million to

Keyera Corp. TSX: KEY 2020 Second Quarter Report August 5, 2020
KEYERA CORP.
18
the end of the second quarter that allowed producers to keep the majority of their volumes on-line. It was important to ensure volumes were maintained at these facilities as this creates value throughout Keyera’s integrated business segments. As condensate demand and pricing has steadily improved, the majority of fees have reverted to their original contracted amounts in July. Gross processing throughput for the Gathering and Processing segment declined in the second quarter of 2020, averaging 1,261 million cubic feet per day, 9% lower than the first quarter of 2020 and 14% lower than the same period in 2019. On a year-to-date basis, gross processing throughput was 14% lower than the first half of 2019. The lower throughput was attributable to natural declines, low producer activity levels resulting from low commodity prices, and the redirection of volumes from a customer at Keyera’s Brazeau River gas plant to their own facility beginning in April 2020. The financial effect from this volume diversion is expected to be a reduction in operating margin of approximately $10 million for 2020 relative to 2019, as previously reported in Keyera’s 2019 year-end release. With construction of phase two of the Wapiti gas plant being substantially complete, Keyera expects to commission the plant in the fourth quarter of this year. Given the revised capital plans of Keyera’s customers, the additional capacity is not anticipated to be required in 2020. The Pipestone gas plant continued to progress ahead of schedule with commissioning now underway. As a result, the plant is expected to be operational in September. Keyera has a 20-year infrastructure development and midstream service agreement with Ovintiv to support their condensate focused Pipestone Montney development near Grande Prairie, Alberta. This Montney development remains one of Ovintiv’s top three capital investment priorities. The maintenance turnaround at the Zeta Creek gas plant originally scheduled for the fall of 2020 has been deferred to 2021. As a result, no maintenance turnarounds will occur in 2020. The costs associated with maintenance turnarounds are capitalized for accounting purposes and do not have an effect on operating expenses in the Gathering and Processing segment. Distributable cash flow is reduced by Keyera’s share of the cost of the turnarounds, as these costs are included in its financial results as maintenance capital expenditures.

Keyera Corp. TSX: KEY 2020 Second Quarter Report August 5, 2020
KEYERA CORP.
19
The table below provides more detail related to major projects in the Gathering and Processing segment:
Gathering and Processing – Capital Projects Status Update
Facility/Area Project Description Project Status Update
Wapiti Wapiti Gas Plant (Phase One): Phase one includes the construction of a 150 million cubic feet per day sour gas processing plant with acid gas injection capabilities and 25,000 barrels per day of condensate processing facilities, as well as a gathering pipeline system, field compressor stations, and condensate treating facilities. Water Disposal System: This project includes the installation of high pressure injection pumps and pipeline connectivity for multiple disposal wells that are capable of disposing up to 30,000 barrels per day of produced water from the Wapiti gas plant. North Wapiti Pipeline System: The North Wapiti Pipeline System extends the capture area of Keyera’s Wapiti gas plant and includes a 12-inch sour gas gathering pipeline, an 8-inch condensate and water pipeline, and a compressor station. Gold Creek Compressor and Gathering System Expansion: This project provides additional compression and includes an expansion of the Wapiti gathering system. Wapiti Gas Plant (Phase Two): Phase two will add another 150 million cubic feet per day of sour gas processing capacity to the Wapiti gas plant.
Wapiti Gas Plant (Phase One): Phase one of the Wapiti gas plant was completed and began operating in May 2019. Water Disposal System: The water disposal system became operational with the start-up of phase one of the Wapiti gas plant in May 2019. The system is currently equipped with two disposal wells, with the second disposal well coming into service in August 2019. North Wapiti Pipeline System: The pipeline system commenced operations in September 2019. An expansion to the compressor station is scheduled to be complete by the fourth quarter of 2020. Gold Creek Compressor and Gathering System Expansion: The compressor station was complete in the first quarter of 2020. The additional compression and expansion of the Wapiti gathering system was complete at the start of the second quarter of 2020. Wapiti Gas Plant (Phase Two): Construction activities were substantially complete in the first quarter of 2020. Commissioning and completion activities are expected to occur in the fourth quarter of 2020. Estimated total cost to complete the Wapiti complex and related infrastructure:
• approximately $1 billion Total net costs to June 30, 2020:
• $13 million and $56 million for the three and six months ended June 30, 2020
• $986 million since inception

Keyera Corp. TSX: KEY 2020 Second Quarter Report August 5, 2020
KEYERA CORP.
20
Gathering and Processing – Capital Projects Status Update
Facility/Area Project Description Project Status Update
Pipestone Pipestone Gas Plant: The Pipestone gas plant will include a total of 200 million cubic feet per day of sour gas processing capacity with acid gas injection capabilities, 24,000 barrels per day of condensate processing capacity, and associated water disposal facilities.
The gas plant is mechanically complete. Commissioning activities commenced in July 2020. The Pipestone gas plant is expected to be operational in September 2020. Estimated total cost to complete:
• approximately $600 million Total net costs to June 30, 2020:
• $60 million and $176 million for the three and six months ended June 30, 2020
• $516 million since inception
Estimated costs and completion times for the projects currently under development that are discussed above assume that construction proceeds as planned, that actual costs are in line with estimates and, where required, that regulatory approvals and any other third-party approvals or consents are received on a timely basis. A portion of the costs incurred for completed and ongoing projects are based on estimates. Final costs may differ when actual invoices are received or contracts are settled. Costs for the projects described above exclude carrying charges (i.e., capitalized interest). The section of this MD&A titled, “Forward-Looking Statements”, provides more information on factors that could affect the development of these projects.

Keyera Corp. TSX: KEY 2020 Second Quarter Report August 5, 2020
KEYERA CORP.
21
Liquids Infrastructure The Liquids Infrastructure segment provides fractionation, storage, transportation, liquids blending and terminalling services for NGLs and crude oil, and produces iso-octane. These services are provided to customers through an extensive network of facilities, including the following assets:
• NGL and crude oil pipelines;
• underground NGL storage caverns;
• above ground storage tanks;
• NGL fractionation and de-ethanization facilities;
• pipeline, rail and truck terminals;
• liquids blending facilities; and
• the AEF facility.
The AEF facility has a licensed capacity of 13,600 barrels per day of iso-octane. Iso-octane is a low vapour pressure, high-octane gasoline blending component that contains virtually no sulphur, aromatics or benzene, making this product a clean burning gasoline additive. AEF uses butane as the primary feedstock to produce iso-octane. As a result, AEF’s business creates positive synergies with Keyera’s Marketing business, which purchases, handles, stores and sells large volumes of butane. Most of Keyera’s Liquids Infrastructure assets are located in, or connected to, the Edmonton/Fort Saskatchewan area of Alberta, one of four key NGL hubs in North America. A significant portion of the NGL production from Alberta raw gas processing plants is delivered into the Edmonton/Fort Saskatchewan area via multiple NGL gathering systems for fractionation into specification products and delivery to market. Keyera’s underground storage caverns at Fort Saskatchewan are used to store NGL mix and specification products. For example, propane can be stored in the summer months to meet winter demand; condensate can be stored to meet the diluent supply needs of the oil sands sector; and butane can be stored to meet blending and iso-octane feedstock requirements. Keyera’s Liquids Infrastructure assets are closely integrated with its Marketing segment, providing the ability to source, transport, process, store and deliver products across North America. A portion of the revenues earned by this segment relate to services provided to Keyera’s Marketing segment. All of the revenues in this segment that are associated with the AEF facility and the Oklahoma Liquids Terminal relate to services provided to the Marketing segment. Operating margin for the Liquids Infrastructure segment was as follows:
Operating Margin
Three months ended June 30,
Six months ended June 30,
(Thousands of Canadian dollars) 2020 2019 2020 2019
Revenue1 135,884 130,955 280,671 263,776 Operating expenses1 (36,651) (38,300) (78,356) (76,683) Unrealized gain (loss) on electricity financial contracts 360 (95) (600) (83)
Total operating expenses (36,291) (38,395) (78,956) (76,766)
Operating margin 99,593 92,560 201,715 187,010 Note: 1 Includes inter-segment transactions.
Keyera Corp. TSX: KEY 2020 Second Quarter Report August 5, 2020
KEYERA CORP.
22
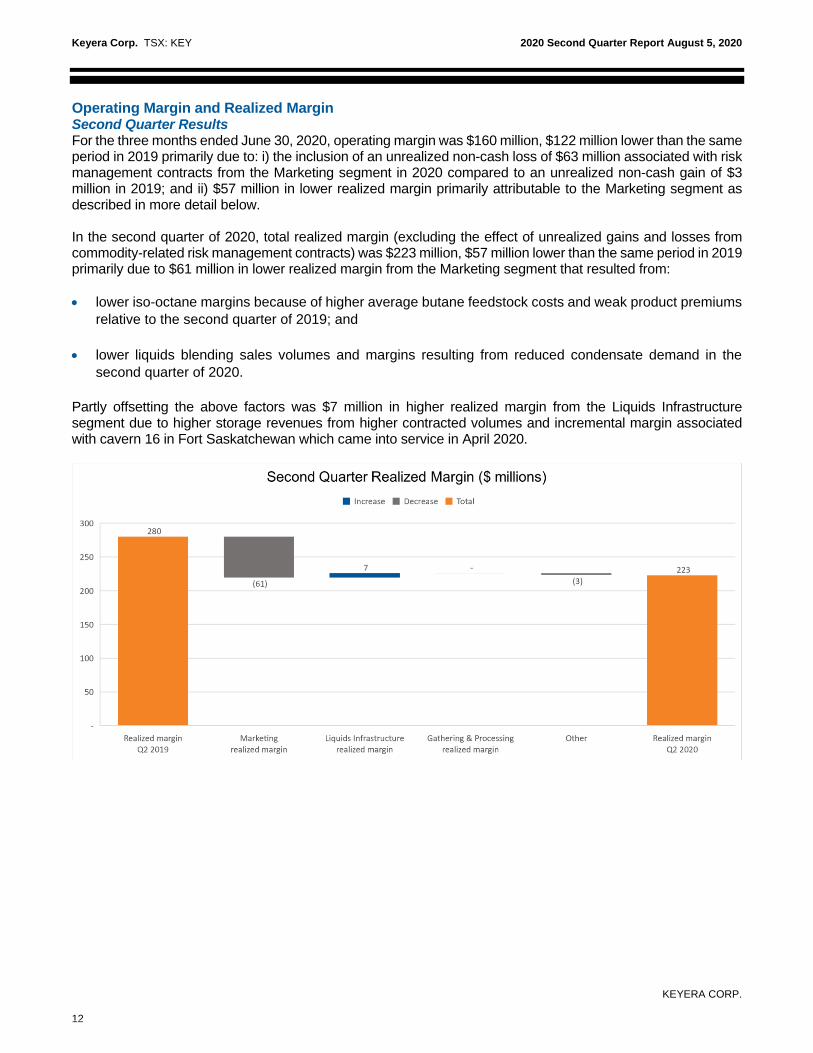
Second Quarter Operating Margin and Revenue
Operating Margin
$ 7 million vs Q2 2019
• Increase was due to higher storage revenues as strong demand resulted in higher contracted volumes and incremental margin associated with cavern 16 in Fort Saskatchewan which came into service in April 2020.
Revenue
$5 million vs Q2 2019
• Increase was due to the same factors that contributed to higher operating margin as described above.
Second Quarter Year-to-Date Operating Margin and Revenue
Operating Margin
$ 15 million vs Q2 YTD 2019
• Increase was due to higher storage revenues as strong demand resulted in higher contracted volumes and incremental margin associated with cavern 16 in Fort Saskatchewan which came into service in April 2020;
• higher fractionation revenues during the first quarter of 2020 resulting from higher fees effective April 1, 2019; and
• an increase in volumes handled within Keyera’s condensate network, including the Norlite pipeline during the first quarter of 2020.
Revenue
$17 million vs Q2 YTD 2019
• Increase is due to the same factors that contributed to higher operating margin as described above.

Keyera Corp. TSX: KEY 2020 Second Quarter Report August 5, 2020
KEYERA CORP.
23
Liquids Infrastructure Activity With a diverse range of infrastructure services available to its customers, the Liquids Infrastructure segment proved its resilience in the second quarter of 2020, posting strong financial results despite the challenges being faced by the energy industry resulting from low commodity prices and the COVID-19 pandemic. Keyera’s storage assets at Fort Saskatchewan continue to experience strong demand, providing significant operational flexibility and value for its customers during this time of low demand and commodity price volatility. The 16th underground storage cavern was put into service in April providing additional storage capacity which contributed to the strong financial results in the second quarter of 2020. Storage revenue is expected to remain strong for the remainder of 2020. As crude oil prices declined significantly prior to the start of the quarter, several oil sands producers began implementing production cuts in April with a few facilities shutting-in production in May. Accordingly, the demand for condensate declined dramatically in Alberta and continued to remain low throughout the second quarter. As a result, the volume of condensate handled within Keyera’s condensate system declined by 32% compared to the first quarter of 2020 and declined 12% compared to the second quarter of 2019. Despite the reduced volumes, the financial impact to Keyera in the second quarter of 2020 was not significant and is not expected to be significant for the remainder of 2020 due to long-term, take-or-pay arrangements in place with several major oil sands producers. Under these agreements, Keyera provides a variety of services including diluent transportation, storage and rail offload services in the Edmonton/Fort Saskatchewan area. With crude oil prices showing steady improvement throughout the second quarter into July 2020, Keyera is encouraged by early indications from several oil sands producers forecasting gradual production increases and the resumption of production for certain shut-in facilities which would return volumes to Keyera’s condensate system. Keyera operates an industry-leading condensate hub in Western Canada that includes connections to: i) all major condensate receipt points, including Enbridge’s Southern Lights pipeline and CRW pool, all the Fort Saskatchewan area fractionators, and Pembina’s Cochin pipeline and Canadian Diluent Hub; and ii) all major condensate delivery points, including Inter Pipeline’s Polaris and Cold Lake pipelines, the Norlite pipeline, Enbridge’s CRW pool, and Wolf’s Access pipeline system. In the second quarter of 2020, utilization of the two fractionation units at Keyera’s Fort Saskatchewan complex declined to 88% of its nameplate capacity as a result of production shut-ins in response to the commodity price environment. For the contract year beginning April 1, 2020, Keyera has contracted fractionation fees that are comparable to the prior year. Based on current forecasts, Keyera expects utilization rates for its fractionation units to return to levels near nameplate capacity for the remainder of the year. The AEF facility is operated by the Liquids Infrastructure segment and provides iso-octane processing services to the Marketing segment on a fee-for-service basis. Iso-octane production averaged 88% of its nameplate capacity in the second quarter of 2020 as the facility completed an unplanned 10-day maintenance outage in April. Maintenance costs related to this outage were not material. The next maintenance turnaround for the AEF facility is now scheduled to occur in the fall of 2022. This turnaround was previously scheduled for 2021; however, a decision was made to defer the turnaround after a thorough risk assessment was performed to ensure that the facility continues to operate in a safe and reliable manner. As part of Keyera’s overall cost reduction strategy, the Liquids Infrastructure segment has begun implementing a number of measures to reduce operating costs. These measures are expected to result in $10 million to $15 million of incremental operating margin on an annual basis, beginning in mid-2020. As previously disclosed in Keyera’s year-end report, in 2019 Keyera entered into an agreement to provide butane to Kinder Morgan for liquids blending service at their Galena Park facility. The capital investment associated with this butane-on-demand distribution system currently being constructed by Kinder Morgan is approximately $70 million (US$50 million) and will be reimbursed by Keyera once the project is complete. The project, which includes butane storage and pipeline connections, continued to progress on schedule through the second quarter of 2020 and is expected to be operational by the end of the fourth quarter of 2020.
Keyera Corp. TSX: KEY 2020 Second Quarter Report August 5, 2020
KEYERA CORP.
24
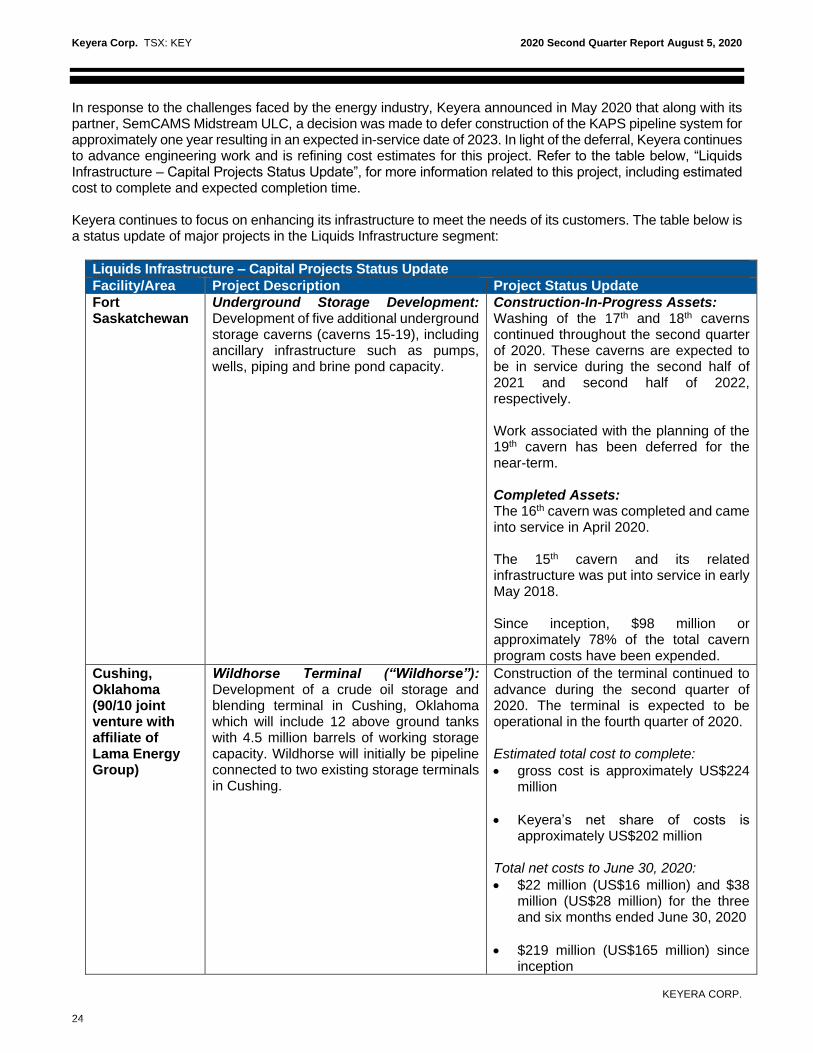
In response to the challenges faced by the energy industry, Keyera announced in May 2020 that along with its partner, SemCAMS Midstream ULC, a decision was made to defer construction of the KAPS pipeline system for approximately one year resulting in an expected in-service date of 2023. In light of the deferral, Keyera continues to advance engineering work and is refining cost estimates for this project. Refer to the table below, “Liquids Infrastructure – Capital Projects Status Update”, for more information related to this project, including estimated cost to complete and expected completion time. Keyera continues to focus on enhancing its infrastructure to meet the needs of its customers. The table below is a status update of major projects in the Liquids Infrastructure segment:
Liquids Infrastructure – Capital Projects Status Update
Facility/Area Project Description Project Status Update
Fort Saskatchewan
Underground Storage Development: Development of five additional underground storage caverns (caverns 15-19), including ancillary infrastructure such as pumps, wells, piping and brine pond capacity.
Construction-In-Progress Assets: Washing of the 17th and 18th caverns continued throughout the second quarter of 2020. These caverns are expected to be in service during the second half of 2021 and second half of 2022, respectively. Work associated with the planning of the 19th cavern has been deferred for the near-term. Completed Assets: The 16th cavern was completed and came into service in April 2020. The 15th cavern and its related infrastructure was put into service in early May 2018.
Since inception, $98 million or approximately 78% of the total cavern program costs have been expended.
Cushing, Oklahoma (90/10 joint venture with affiliate of Lama Energy Group)
Wildhorse Terminal (“Wildhorse”): Development of a crude oil storage and blending terminal in Cushing, Oklahoma which will include 12 above ground tanks with 4.5 million barrels of working storage capacity. Wildhorse will initially be pipeline connected to two existing storage terminals in Cushing.
Construction of the terminal continued to advance during the second quarter of 2020. The terminal is expected to be operational in the fourth quarter of 2020. Estimated total cost to complete:
• gross cost is approximately US$224 million
• Keyera’s net share of costs is approximately US$202 million
Total net costs to June 30, 2020:
• $22 million (US$16 million) and $38 million (US$28 million) for the three and six months ended June 30, 2020
• $219 million (US$165 million) since inception

Keyera Corp. TSX: KEY 2020 Second Quarter Report August 5, 2020
KEYERA CORP.
25
Liquids Infrastructure – Capital Projects Status Update
Facility/Area Project Description Project Status Update
South Cheecham (50/50 joint venture with Enbridge)
Sulphur Facilities: Development of sulphur handling, forming, and storage facilities at the South Cheecham rail and truck terminal.
Detailed engineering and regulatory activities continued through the second quarter of 2020. The sulphur facilities are anticipated to be operational in 2022. Estimated total cost to complete:
• gross cost is approximately $115 million
• Keyera’s net share of costs is approximately $58 million
Total net costs to June 30, 2020:
• $2 million and $3 million for the three and six months ended June 30, 2020
• $4 million since inception
KAPS (50/50 joint venture with SemCAMS)
KAPS NGL and Condensate Pipeline System: Development of a 12-inch and 16-inch NGL and condensate pipeline system that will transport Montney and Duvernay production in northwestern Alberta to Keyera’s fractionation assets and condensate system in Fort Saskatchewan. Along its route, KAPS will be connected to Keyera’s Pipestone, Wapiti, and Simonette gas plants and several third-party gas plants.
Approvals from the Alberta Energy Regulator to proceed with the construction of the main line have been received. Engineering and other regulatory work continued in the second quarter of 2020. KAPS is anticipated to be operational in 2023. In light of the one-year deferral, Keyera continues to advance engineering work and is refining cost estimates for this project. Total net costs to June 30, 2020:
• $7 million and $16 million for the three and six months ended June 30, 2020
• $27 million since inception
Estimated costs and completion times for the projects currently under development that are discussed above assume that construction proceeds as planned, that actual costs are in line with estimates and, where required, that regulatory approvals and any other third-party approvals or consents are received on a timely basis. With respect to regulatory approvals for underground storage caverns at Keyera’s Fort Saskatchewan facility, the authorization to put the wells into service is applied for after the cavern has been washed. Regarding the Wildhorse Terminal, operational regulatory permitting is applied for at construction completion or prior to startup. Regulatory approvals for KAPS and the South Cheecham Sulphur Facilities projects are expected to be in place for the start of their construction activities. A portion of the costs incurred for completed and ongoing projects is based on estimates. Final costs may differ when actual invoices are received or contracts are settled. Costs for the projects described above exclude carrying charges (i.e., capitalized interest). The section of this MD&A titled,
Keyera Corp. TSX: KEY 2020 Second Quarter Report August 5, 2020
KEYERA CORP.
26
“Forward-Looking Statements”, provides more information on factors that could affect the development of these projects.
Marketing The Marketing segment is focused on the distribution and sale of products associated with Keyera’s facilities, including NGLs, crude oil and iso-octane. Keyera markets products acquired through processing arrangements, term supply agreements and other purchase transactions. Most NGL volumes are purchased under one-year supply contracts typically with terms beginning in April of each year. In addition, Keyera has long-term supply arrangements with several producers for a portion of its NGL supply. Keyera may also source additional condensate or butane, including from the U.S., when market conditions and associated sales contracts are favourable. Keyera negotiates sales contracts with customers in Canada and the U.S. based on the volumes it has contracted to purchase. In the case of condensate sales, the majority of the product is sold to customers in Alberta shortly after it is purchased. Butane is used as the primary feedstock in the production of iso-octane at Keyera’s AEF facility and therefore a significant portion of the contracted butane supply is retained for Keyera’s own use. Propane markets are seasonal and geographically diverse. Keyera sells propane in various North American markets, often where the only option for delivery is via railcar or truck. Keyera is well positioned to serve these markets due to its extensive infrastructure and rail logistics expertise. Further, because demand for propane is typically higher in the winter, Keyera can utilize its NGL storage facilities to build an inventory of propane during the summer months when prices are typically lower to fulfill winter term-sales commitments. Keyera manages its NGL supply and sales portfolio by monitoring its inventory position and purchase and sale commitments. Nevertheless, the Marketing business is exposed to commodity price fluctuations arising between the time contracted volumes are purchased and the time they are sold, as well as pricing differentials between different geographic markets. These risks are managed by purchasing and selling product at prices based on the same or similar indices or benchmarks, and through physical and financial contracts that include energy-related forward contracts, price swaps, forward currency contracts and other hedging instruments. A more detailed description of the risks associated with the Marketing segment is available in Keyera’s Annual Information Form, which is available at www.sedar.com. Keyera’s primary markets for iso-octane are in the Gulf Coast, Midwestern United States, and Western Canada. Demand for iso-octane is seasonal, with higher demand in the spring and summer, typically resulting in higher sales prices during these months. There can be significant variability in iso-octane margins. As with Keyera’s other marketing activities, various strategies are utilized to mitigate the risks associated with the commodity price exposure, including the use of financial contracts. The section of this MD&A titled “Risk Management” provides more information on the risks associated with the sale of iso-octane and Keyera’s related hedging strategy. Keyera also engages in liquids blending, where it operates facilities at various locations, including the Oklahoma Liquids Terminal, allowing it to transport, process and blend various product streams. Margins are earned by blending products of lower value into higher value products. As a result, these transactions are exposed to variability in price and quality differentials between various product streams. Keyera manages this risk by balancing its purchases and sales and employing risk management strategies. Overall, the integration of Keyera’s business lines means that its Marketing segment can draw on the resources available to it through its two fee-for-service, facilities-based operating segments (Liquids Infrastructure and Gathering and Processing), including access to NGL supply and key fractionation, storage and transportation infrastructure and logistics expertise.
Keyera Corp. TSX: KEY 2020 Second Quarter Report August 5, 2020
KEYERA CORP.
27
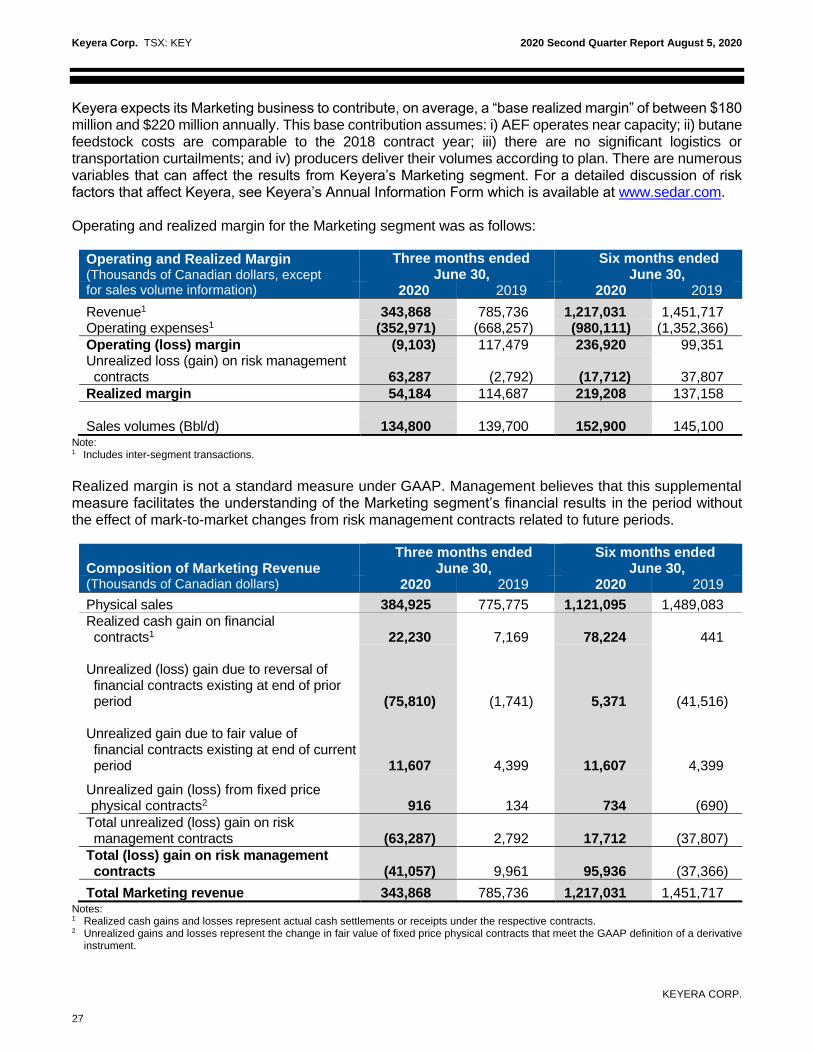
Keyera expects its Marketing business to contribute, on average, a “base realized margin” of between $180 million and $220 million annually. This base contribution assumes: i) AEF operates near capacity; ii) butane feedstock costs are comparable to the 2018 contract year; iii) there are no significant logistics or transportation curtailments; and iv) producers deliver their volumes according to plan. There are numerous variables that can affect the results from Keyera’s Marketing segment. For a detailed discussion of risk factors that affect Keyera, see Keyera’s Annual Information Form which is available at www.sedar.com. Operating and realized margin for the Marketing segment was as follows:
Operating and Realized Margin (Thousands of Canadian dollars, except
Three months ended June 30,
Six months ended June 30,
for sales volume information) 2020 2019 2020 2019
Revenue1 343,868 785,736 1,217,031 1,451,717 Operating expenses1 (352,971) (668,257) (980,111) (1,352,366)
Operating (loss) margin (9,103) 117,479 236,920 99,351 Unrealized loss (gain) on risk management contracts 63,287 (2,792) (17,712) 37,807
Realized margin 54,184 114,687 219,208 137,158
Sales volumes (Bbl/d) 134,800 139,700 152,900 145,100
Note: 1 Includes inter-segment transactions.
Realized margin is not a standard measure under GAAP. Management believes that this supplemental measure facilitates the understanding of the Marketing segment’s financial results in the period without the effect of mark-to-market changes from risk management contracts related to future periods.
Composition of Marketing Revenue Three months ended
June 30, Six months ended
June 30, (Thousands of Canadian dollars) 2020 2019 2020 2019
Physical sales 384,925 775,775 1,121,095 1,489,083
Realized cash gain on financial contracts1 22,230 7,169 78,224 441 Unrealized (loss) gain due to reversal of financial contracts existing at end of prior period (75,810) (1,741) 5,371 (41,516) Unrealized gain due to fair value of financial contracts existing at end of current period 11,607 4,399 11,607 4,399
Unrealized gain (loss) from fixed price physical contracts2 916 134 734 (690)
Total unrealized (loss) gain on risk management contracts (63,287) 2,792 17,712 (37,807)
Total (loss) gain on risk management contracts (41,057) 9,961 95,936 (37,366)
Total Marketing revenue 343,868 785,736 1,217,031 1,451,717 Notes: 1 Realized cash gains and losses represent actual cash settlements or receipts under the respective contracts. 2 Unrealized gains and losses represent the change in fair value of fixed price physical contracts that meet the GAAP definition of a derivative
instrument.

Keyera Corp. TSX: KEY 2020 Second Quarter Report August 5, 2020
KEYERA CORP.
28
Second Quarter Operating & Realized Margin and Revenue
Operating Margin
$ 127 million vs Q2 2019
• Decrease was due to $63 million in unrealized non-cash losses from risk management contracts in Q2 2020 versus a non-cash gain of $3 million in Q2 2019; and
• $61 million in lower realized margin as described in more detail below.
Realized Margin
$ 61 million vs Q2 2019
• Decrease was due to $44 million in lower iso-octane margins because of higher average butane feedstock costs and weak product premiums relative to the prior year; and
• lower liquids blending sales volumes and margins resulting from reduced condensate demand in the second quarter of 2020.
Revenue
$442 million vs Q2 2019
In general, gross revenue in the Marketing segment is influenced by NGL and iso-octane sales volumes as well as commodity prices.
• Decrease was due to lower average sales volumes and significantly lower average sales prices for all products resulting from the significant decline in commodity prices in the second quarter of 2020.

Keyera Corp. TSX: KEY 2020 Second Quarter Report August 5, 2020
KEYERA CORP.
29
Second Quarter Year-to-Date Operating & Realized Margin and Revenue
Operating Margin
$ 138 million vs Q2 YTD 2019
• Increase was due to $18 million in unrealized non-cash gains from risk management contracts in 2020 versus a non-cash loss of $38 million in 2019; and
• $82 million in higher realized margin as described in more detail below.
Realized Margin
$ 82 million vs Q2 YTD 2019
• Increase was due to significantly higher iso-octane margins that resulted from: i) exceptionally strong product premiums in the early part of 2020 that continued from the second half of 2019; and ii) low butane feedstock costs in the first quarter of 2020 relative to the first quarter of 2019; and
• an effective risk management program that protected margins and inventory values from the sharp decline in commodity prices that began in March 2020.
• Realized margin was unusually low in the first half of 2019 due to a 17-day outage at the AEF facility that reduced iso-octane production and sales volumes in that period. In addition, butane was sold at low market prices to manage inventory levels associated with this outage.
Revenue
$235 million vs Q2 YTD 2019
• Decrease was due to lower average sales volumes and significantly lower average sales prices for all products resulting from the significant decline in commodity prices in March 2020.

Keyera Corp. TSX: KEY 2020 Second Quarter Report August 5, 2020
KEYERA CORP.
30
Market Commentary Energy markets continue to evolve as the ongoing COVID-19 pandemic has caused significant changes to energy supply and demand patterns. Under normal economic conditions, the demand and price premium for iso-octane increase in the spring and summer months as driving activity and gasoline demand increase. In March and April, U.S. gasoline demand decreased by approximately 50% compared to typical demand levels. Despite this sharp decline in demand and lower motor gasoline prices, contribution from the sale of iso-octane in the second quarter of 2020 was robust because of: i) continued strong demand for iso-octane from export markets; and ii) Keyera’s effective risk management program that protected margins during this time. As several U.S. states began to reopen their economies in May, U.S. gasoline demand increased to approximately 90% of pre-COVID forecasts by early July. The combination of higher gasoline demand and refiners continuing to limit their run-rates has resulted in a significant improvement in motor gasoline prices, compared to the lows experienced in March and April. While gasoline prices have improved, the premium for iso-octane remains subdued compared to typical spring/summer levels, partly due to an increase in supply of higher-octane blending components, such as alkylates, in the market. In the near term, further improvement in gasoline demand or iso-octane premiums appears unlikely as the number of COVID-19 cases in the U.S. continues to surge and certain jurisdictions have reinstated stay at home orders. Because butane is the primary feedstock to produce iso-octane, butane costs directly affect iso-octane margins. The majority of Keyera’s butane supply is purchased on a one-year term basis. For the annual term supply contracts that began on April 1, 2020, the price for butane as a percentage of crude oil is higher than the 2019 contract year, but lower compared to the average of the previous five years. With the anticipated reduction in NGL supply in North America stemming from reduced drilling activity, Keyera will continue to seek opportunities to procure butane supply throughout North America and utilize its storage assets in Fort Saskatchewan to optimize the cost of butane for the production of iso-octane. As crude oil prices fell dramatically in March, several oil sands producers announced production cuts commencing in April. Accordingly, the demand and price for condensate declined significantly in the second quarter of 2020. Condensate margins in the Marketing segment were robust in the second quarter, as Keyera was able to source and rail-in low cost condensate barrels from the U.S. that were sold at an attractive margin. Margins from Keyera’s liquids blending business were weaker in the second quarter of 2020 due to lower condensate volumes and a reduction in the price differential between condensate and the blend product. Propane margins returned to seasonally lower levels in the second quarter of 2020 and Keyera began to build propane inventory to meet the upcoming winter heating demand. Access to Keyera’s cavern storage and Josephburg Terminal provides the Marketing segment with a competitive advantage as it can rail product to the highest value markets in North America throughout the year. For 2020, Keyera now expects annual realized margin for the Marketing segment to range between $300 million and $340 million. This is compared to prior guidance for 2020 of $270 million to $310 million. The revised range for 2020 reflects Keyera’s effective risk management program, Marketing’s strong financial contribution in the first half of the year and the following assumptions: i) an improvement in forward commodity pricing for any unhedged volumes in the remainder of 2020; ii) AEF operating near capacity; and iii) no significant logistics or transportation curtailments.
Risk Management When possible, Keyera uses hedging strategies to mitigate risk in its Marketing business, including foreign currency exchange risk associated with the purchase and sale of NGLs and iso-octane. Keyera’s hedging objective for iso-octane is to secure attractive margins and mitigate the effect of iso-octane price fluctuations on its future operating margins. Iso-octane is generally priced at a premium to the price of Reformulated Blendstock for Oxygen Blending (“RBOB”). RBOB is the highest volume refined product sold in the U.S. and has the most liquid forward financial contracts. Accordingly, Keyera expects to continue to utilize RBOB-based financial contracts to hedge a portion of its iso-octane sales.
Keyera Corp. TSX: KEY 2020 Second Quarter Report August 5, 2020
KEYERA CORP.
31
To protect the value of its NGL inventory from fluctuations in commodity prices, Keyera typically uses physical and financial forward contracts. For propane inventory, contracts are generally put in place as inventory builds and may either: i) settle when products are expected to be withdrawn from inventory and sold; or ii) settle and reset on a month-to-month basis. Within these strategies, there may be differences in timing between when the contracts are settled and when the product is sold. In general, the increase or decrease in the fair value of the contracts is intended to mitigate fluctuations in the value of the inventories and protect operating margin. Keyera typically uses propane physical and financial forward contracts to hedge its propane inventory. Keyera may hold butane inventory to meet the feedstock requirements of the AEF facility. For condensate, most of the product purchased is sold within one month. The supply and sales prices for both butane and condensate are typically priced as a percentage of West Texas Intermediate (“WTI”) crude oil and in certain cases the supply cost may be based on a hub posted or index price. To align the pricing terms of physical supply with the terms of contracted sales and to protect the value of butane and condensate inventory, the following hedging strategies may be utilized:
• Keyera may enter into financial contracts to lock in the supply price at a specified percentage of WTI, as
the sales contracts for butane and condensate are also generally priced in relation to WTI. When butane
or condensate is physically purchased, the financial contract is settled and a realized gain or loss is
recorded in income.
• Once the product is in inventory, WTI financial forward contracts are generally used to protect the value
of the inventory.
Within these hedging strategies, there may be differences in timing between when the financial contracts are settled and when the products are purchased and sold. There may also be basis risk between the prices of crude oil and the NGL products, and therefore the financial contracts may not fully offset future butane and condensate price movements. For the quarter ended June 30, 2020, the total unrealized loss on risk management contracts was $63 million. Further details are provided in the “Composition of Marketing Revenue” table above. The fair value of outstanding risk management contracts as at June 30, 2020 resulted in an unrealized (non-cash) gain of $12 million that included the following significant items:
• an $8 million non-cash gain relating to iso-octane risk management contracts;
• a $1 million non-cash loss relating to propane, butane and condensate risk management contracts; and
• a $5 million non-cash gain relating to foreign currency and other financial contracts.
The fair value of financial and fixed price physical contracts will vary as these contracts are marked-to-market at the end of each period. A summary of the financial contracts existing at June 30, 2020, and the sensitivity to earnings resulting from changes in commodity prices, can be found in note 12, Financial Instruments and Risk Management, of the accompanying financial statements.

Keyera Corp. TSX: KEY 2020 Second Quarter Report August 5, 2020
KEYERA CORP.
32
CORPORATE AND OTHER
Non-Operating Expenses and Other Income
Three months ended June 30,
Six months ended June 30,
(Thousands of Canadian dollars) 2020 2019 2020 2019
Other (loss) income (operating margin) (106) 2,513 (39) 5,894 General and administrative (net of overhead recoveries on operated facilities)
(33,913)
(19,615)
(56,674)
(38,875)
Finance costs1 (30,741) (29,267) (61,877) (49,120) Depreciation, depletion and amortization expenses1 (84,919) (64,694) (137,149) (126,123) Net foreign currency gain on U.S. debt and other 14,108 15,201 2,095 19,039 Long-term incentive plan (expense) recovery (6,660) (10,594) 10,267 (16,104) Impairment expense — — (194,001) — Income tax recovery (expense)1 93 51,215 (31,768) 40,356
Notes: 1 2019 amounts have been restated. Refer to the “Voluntary Change in Accounting Policy” section of this MD&A. Other Income Keyera has acquired oil and gas reserves as part of the acquisition of ownership interests in the Minnehik Buck Lake, West Pembina, Bigoray and Cynthia facilities. Keyera reports operating margin (net of royalties and operating expenses) from the production associated with all of its reserves as other income as it has no plans to drill additional wells to offset natural production declines. Other income for the three and six months ended June 30, 2020 was $nil, $3 million and $6 million lower than the same periods in 2019, respectively. Production for the three and six months ended June 30, 2020 averaged 1,723 and 2,111 barrels of oil equivalent per day compared to 3,451 and 3,522 barrels of oil equivalent per day for the same periods in 2019. The reserves and production are not material to Keyera’s business and do not have a material effect on its financial results. General and Administrative Expenses G&A expenses for the three and six months ended June 30, 2020 were $34 million and $57 million, $14 million and $18 million higher than the same periods in 2019 primarily due to severance costs. Severance costs incurred during the second quarter of 2020 were mainly related to workforce reductions in Keyera’s corporate offices and certain field locations. These workforce reductions were part of Keyera’s overall cost reduction priority. On a year-to-date basis, severance costs were also incurred due to the closure of the Nevis and Gilby gas plants. As a result of the reduction in Keyera’s corporate workforce, G&A and long-term incentive plan expenses are expected to be reduced by $15 million to $20 million annually, with cost savings beginning in mid-2020. Finance Costs Finance costs for the three and six months ended June 30, 2020 were $31 million and $62 million, $1 million and $13 million higher than the same periods in 2019 primarily due to incremental interest expense related to the $600 million subordinated hybrid note that was issued in June 2019 as well as the $400 million public note issued at the end of May 2020. Partly offsetting this incremental interest was higher interest capitalized on qualifying projects that are a reduction to finance costs, as well as lower interest expense from short-term borrowings. Depreciation, Depletion and Amortization Expenses Depreciation, depletion and amortization (“DD&A”) expenses for the three and six months ended June 30, 2020 were $85 million and $137 million, $20 million and $11 million higher than the same periods in 2019 primarily due to an increase in Keyera’s decommissioning asset base in the second quarter of 2020 that
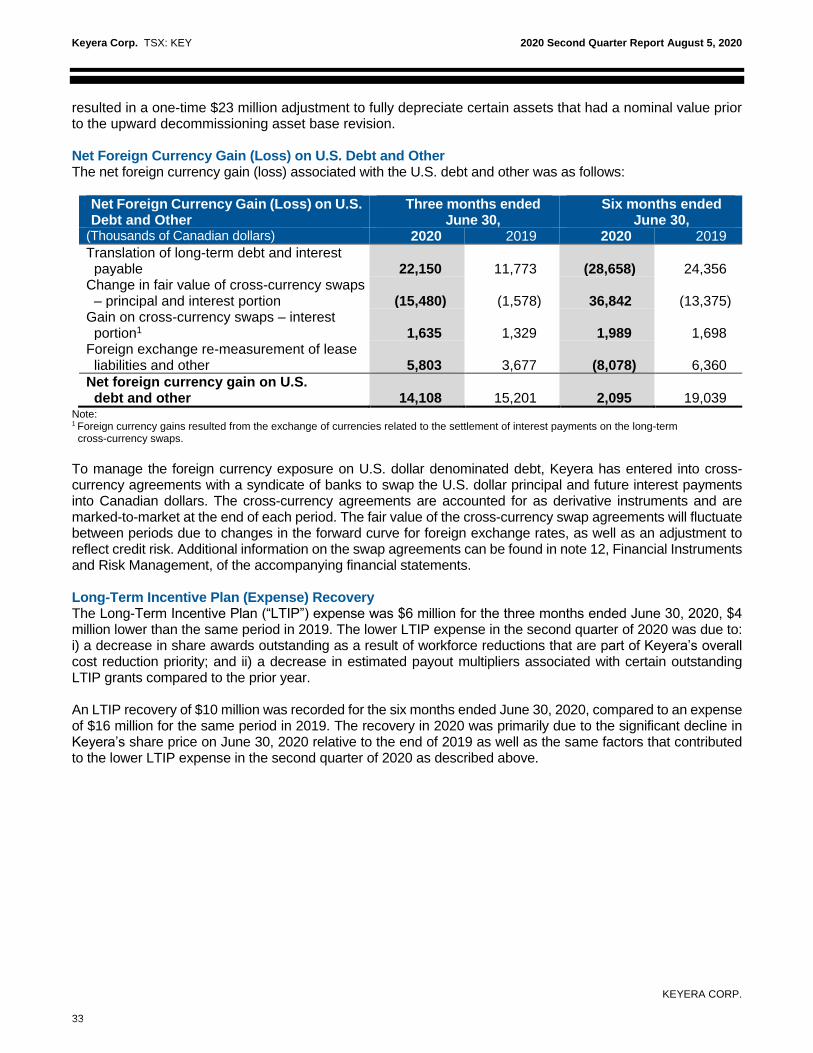
Keyera Corp. TSX: KEY 2020 Second Quarter Report August 5, 2020
KEYERA CORP.
33
resulted in a one-time $23 million adjustment to fully depreciate certain assets that had a nominal value prior to the upward decommissioning asset base revision. Net Foreign Currency Gain (Loss) on U.S. Debt and Other The net foreign currency gain (loss) associated with the U.S. debt and other was as follows:
Net Foreign Currency Gain (Loss) on U.S. Debt and Other
Three months ended June 30,
Six months ended June 30,
(Thousands of Canadian dollars) 2020 2019 2020 2019
Translation of long-term debt and interest payable 22,150 11,773 (28,658) 24,356 Change in fair value of cross-currency swaps – principal and interest portion (15,480) (1,578) 36,842 (13,375) Gain on cross-currency swaps – interest portion1 1,635 1,329 1,989 1,698 Foreign exchange re-measurement of lease liabilities and other 5,803 3,677 (8,078) 6,360
Net foreign currency gain on U.S. debt and other 14,108 15,201 2,095 19,039
Note: 1 Foreign currency gains resulted from the exchange of currencies related to the settlement of interest payments on the long-term cross-currency swaps.
To manage the foreign currency exposure on U.S. dollar denominated debt, Keyera has entered into cross- currency agreements with a syndicate of banks to swap the U.S. dollar principal and future interest payments into Canadian dollars. The cross-currency agreements are accounted for as derivative instruments and are marked-to-market at the end of each period. The fair value of the cross-currency swap agreements will fluctuate between periods due to changes in the forward curve for foreign exchange rates, as well as an adjustment to reflect credit risk. Additional information on the swap agreements can be found in note 12, Financial Instruments and Risk Management, of the accompanying financial statements. Long-Term Incentive Plan (Expense) Recovery The Long-Term Incentive Plan (“LTIP”) expense was $6 million for the three months ended June 30, 2020, $4 million lower than the same period in 2019. The lower LTIP expense in the second quarter of 2020 was due to: i) a decrease in share awards outstanding as a result of workforce reductions that are part of Keyera’s overall cost reduction priority; and ii) a decrease in estimated payout multipliers associated with certain outstanding LTIP grants compared to the prior year. An LTIP recovery of $10 million was recorded for the six months ended June 30, 2020, compared to an expense of $16 million for the same period in 2019. The recovery in 2020 was primarily due to the significant decline in Keyera’s share price on June 30, 2020 relative to the end of 2019 as well as the same factors that contributed to the lower LTIP expense in the second quarter of 2020 as described above.

Keyera Corp. TSX: KEY 2020 Second Quarter Report August 5, 2020
KEYERA CORP.
34
Net Impairment Expense Keyera reviews its assets for indicators of impairment on a quarterly basis. As well, if an asset has been impaired and subsequently recovers in value, GAAP requires the asset to be written-up (i.e., reversal of previous impairments). In the first quarter of 2020, Keyera identified through its impairment review that certain gas plants in the Gathering and Processing segment had carrying values that were greater than their recoverable amounts. As a result, a total impairment charge of $194 million was recorded in relation to the Central Foothills and Drayton Valley North Cash-Generating Units (“CGU”s). The impairment expense recorded for the Central Foothills CGU was a result of Keyera’s gathering and processing optimization strategy and the planned suspension of operations at the West Pembina gas plant in the third quarter of 2020 and expected suspensions at the Ricinus and Nordegg River gas plants forecasted to occur in mid-2021. The impairment expense recorded for the Drayton Valley North CGU was a result of underutilization of the Brazeau North and Pembina North gathering and processing complex. Impairment expenses are non-cash charges and do not affect operating margin, funds from operations, distributable cash flow, or adjusted EBITDA. Taxes In general, as earnings before taxes increase, total tax expense (current and deferred taxes) will also be higher. If sufficient tax pools exist, current taxes will be reduced and deferred income taxes will increase as these tax pools are utilized. Other factors that affect the calculation of deferred income taxes include future income tax rate changes and permanent differences (i.e., accounting income or expenses that will never be taxed or deductible for income tax purposes). Current Income Taxes A current income tax recovery of $18 million was recorded for the three months ended June 30, 2020, compared to an expense of $31 million from the same period in 2019. The recovery in the second quarter of 2020 was primarily due to lower taxable income and higher tax pool deductions relative to the same period in 2019. On a year-to-date basis, current income tax was $nil compared to an expense of $54 million in 2019, as higher tax pool deductions virtually offset the increase in taxable income in 2020. For 2020, a current income tax recovery between $20 million to $30 million is expected as approximately $1 billion of announced capital projects, primarily from the Gathering and Processing segment, became available for use in 2019, allowing for a tax loss carryback and refund in 2020. The majority of the costs associated with these capital projects attract a 25% tax depreciation rate (Capital Cost allowance or “CCA”) with some costs being eligible for accelerated first-year CCA deductions. Accelerated first-year CCA deductions were announced as part of the Accelerated Investment Incentive by the Federal Minister of Finance in November 2018, and became substantively enacted in April 2019. This incentive will remain in effect until 2023, at which point it will be gradually phased out. The current tax recovery estimates for 2020 assumes Keyera’s business performs as planned and its capital projects are completed as expected. In 2020, approximately $800 million of announced capital projects in the Gathering and Processing segment are expected to be available for use. Deferred Income Taxes A deferred income tax expense of $18 million and $32 million was recorded for the three and six months ended June 30, 2020, compared to a recovery of $82 million and $94 million during the same periods in 2019. The deferred income tax expense in 2020 is due to a reduction in tax pools available to shelter taxable income. The recovery of deferred income tax in the 2019 was primarily the result of a decrease to the Alberta corporate tax rate enacted on June 28, 2019. Keyera estimates its total tax pools at June 30, 2020 were approximately $3.6 billion.

Keyera Corp. TSX: KEY 2020 Second Quarter Report August 5, 2020
KEYERA CORP.
35
CRITICAL ACCOUNTING ESTIMATES
In preparing Keyera’s accompanying financial statements in accordance with GAAP, management is required to make estimates and assumptions that are not readily apparent from other sources, and are subject to change based on revised circumstances and the availability of new information. Actual results may differ from the estimates, which could materially affect the company’s consolidated financial statements. Management has made appropriate decisions with respect to the formulation of estimates and assumptions that affect the recorded amounts of certain assets, liabilities, revenues and expenses. Keyera has hired qualified individuals who have the skills required to make such estimates. These estimates and assumptions are reviewed and compared to actual results as well as to budgets in order to make more informed decisions on future estimates. The methodologies and assumptions used in developing these estimates have not significantly changed since December 31, 2019. A description of the accounting estimates and the methodologies and assumptions underlying the estimates are described in the 2019 annual MD&A and note 4 of the audited consolidated financial statements for the year ended December 31, 2019, which are available at www.sedar.com.

Keyera Corp. TSX: KEY 2020 Second Quarter Report August 5, 2020
KEYERA CORP.
36
LIQUIDITY AND CAPITAL RESOURCES
The following is a comparison of cash inflows (outflows) from operating, investing and financing activities for the three months ended June 30, 2020 and 2019:
Cash inflows (outflows) (Thousands of Canadian dollars)
Three months ended June 30, Increase 2020 2019 (decrease) Explanation
Operating 159,647 191,221 (31,574) Cash generated from operating activities was lower in the second quarter of 2020 primarily due to lower realized margin from the Marketing segment.
Investing (186,251) (297,394) 111,143 Capital investment in the second quarter of 2020 was primarily related to construction activities associated with the Pipestone gas plant and Wildhorse Terminal. These projects are described in more detail in the “Segmented Results of Operations” section of this MD&A. Capital spending in the second quarter of 2019 was mainly related to construction activities on phase two of the Wapiti gas plant and the Wildhorse Terminal. As the above major projects are nearing completion in 2020, capital spending has decreased relative to the prior year.
Financing 224,385 223,515 870 Cash generated from financing activities in the second quarter of 2020 was comparable to the same period in 2019. In May 2020, Keyera issued $400 million of senior unsecured medium-term notes, allowing for a net repayment of $70 million on its outstanding credit facility. The dividend reinvestment plan was also discontinued. Comparatively, in 2019 Keyera issued $600 million in subordinated hybrid notes and used the proceeds to repay $260 million under its credit facility and $56 million of long-term senior unsecured notes.
Refer to the consolidated statements of cash flows of the accompanying financial statements for more detailed information.

Keyera Corp. TSX: KEY 2020 Second Quarter Report August 5, 2020
KEYERA CORP.
37
The following is a comparison of cash inflows (outflows) from operating, investing and financing activities for the six months ended June 30, 2020 and 2019:
Cash inflows (outflows) (Thousands of Canadian dollars)
Six months ended June 30, Increase 2020 2019 (decrease) Explanation
Operating 476,331 415,030 61,301 Cash generated from operating activities was higher in the first six months of 2020 due to higher realized margin from the Marketing and Liquids Infrastructure segments.
Investing (404,920) (561,486) 156,566 Capital investment in the first six months of 2020 and 2019 was primarily related to construction activities associated with the Pipestone gas plant, and the Wapiti and Wildhorse Terminal projects as described in the “Segmented Results of Operations” section of this MD&A. As the above major projects are nearing completion in 2020, capital spending has decreased relative to the prior year.
Financing 148,610 278,168 (129,558) Funding requirements were lower during the first six months of 2020 compared to the same period in 2019 due to higher cash generated from operations and lower capital spending. In May 2020, Keyera issued $400 million of senior unsecured medium-term notes, allowing for a full repayment on its outstanding credit facility which totaled $90 million on a year-to-date basis net of borrowings. The dividend reinvestment plan was also discontinued during the second quarter of 2020. Comparatively, in 2019 Keyera issued $600 million in subordinated hybrid notes and repaid $206 million of long-term debt and outstanding borrowings under its credit facility.
Refer to the consolidated statements of cash flows of the accompanying financial statements for more detailed information.
Working capital requirements are strongly influenced by the amounts of inventory held in storage and their related commodity prices. Product inventories are required to meet seasonal demand patterns and will vary depending on the time of year. Typically, Keyera’s inventory levels for propane are at their lowest after the winter season and reach their peak in the third quarter to meet the demand for propane in the winter season. Butane inventory is maintained for the production of iso-octane. When market conditions enable Keyera to source additional butane at favourable prices, butane may be held in storage for use in future periods. Inventory

Keyera Corp. TSX: KEY 2020 Second Quarter Report August 5, 2020
KEYERA CORP.
38
levels for iso-octane may fluctuate depending on market conditions. Demand for iso-octane is typically stronger in the second and third quarters, associated with the higher gasoline demand in the summer months; however, due to the current economic situation and COVID-19 pandemic, iso-octane margins have decreased in 2020 compared to prior years.
A working capital surplus (current assets less current liabilities) of $109 million existed at June 30, 2020. This is compared to a deficit of $161 million at December 31, 2019. Keyera has access to a credit facility in the amount of $1.5 billion, of which no amounts were drawn as at June 30, 2020, to meet its current obligations and growth capital program. Refer to the section below of this MD&A, “Long-term Debt”, for more information related to Keyera’s unsecured revolving credit facility (“Credit Facility”). Dividend Reinvestment Plan In April, Keyera announced the discontinuation of the dividend reinvestment plan (the “Plan”). Shareholders who had been participating in either component of the Plan received the full cash dividend declared beginning with the dividend paid in May 2020. Prior to being discontinued, the Plan consisted of two components: a Premium DividendTM (“Premium DRIP”) reinvestment component and a regular dividend reinvestment component (“DRIP”). The DRIP component allowed eligible shareholders of Keyera to direct their cash dividends to be reinvested in additional shares issued from treasury at a discount to the Average Market Price (as defined in the Plan) on the applicable dividend date, with no incremental finance costs. The discount on the additional shares issued from treasury was 3% prior to the March 2020 dividend declaration. In March 2020, Keyera amended its Premium DividendTM and Dividend Reinvestment Plan, reducing the common share discount from 3% to 2%. The Premium DRIP component permitted eligible shareholders to elect to have the additional shares issued at a discount delivered to the designated Plan Broker in exchange for a premium cash payment equal to 101% of the regular, declared cash dividend that was reinvested on their behalf under the Plan. A copy of the Plan is available on Keyera’s website at www.keyera.com and on SEDAR at www.sedar.com. The DRIP and Premium DRIP generated cash of $16 million and $77 million for the three and six months ended June 30, 2020. In the same periods in 2019, the plan generated cash of $54 million and $107 million. Corporate Credit Ratings In light of the sharp decline in commodity prices and S&P Global’s (“S&P”) outlook for the industry, in April, S&P lowered Keyera’s corporate credit rating from “BBB/stable” to a “BBB-/stable”. At the same time, S&P lowered Keyera's medium-term notes issued in June 2018 to 'BBB-' from 'BBB', and the rating on its subordinated hybrid notes issued in June 2019 to 'BB' from 'BB+'. Keyera’s corporate credit rating and issuer rating on its medium-term notes assigned by DBRS Limited (“DBRS”) remain unchanged at “BBB” with a “stable” trend. The issuer-rating assigned by DBRS on Keyera’s subordinated hybrid notes also remain at “BB (high)”. Both credit agencies currently treat the subordinated hybrid notes as 50% equity. Credit ratings are intended to provide investors with an independent measure of credit quality of an issue of securities. Credit ratings are not recommendations to purchase, hold or sell securities and do not address the market price or suitability of a specific security for a particular investor. There is no assurance that any rating will remain in effect for any given period of time or that any rating will not be revised or withdrawn entirely by a rating agency in the future if, in its judgment, circumstances so warrant. Rating agencies will regularly evaluate Keyera, including its financial strength. In addition, factors not entirely within Keyera’s control may also be considered, including conditions affecting the industry in which it operates. A credit rating downgrade could impair Keyera’s ability to enter into arrangements with suppliers or counterparties and could limit its access to private and public credit markets in the future and increase the costs of borrowing.

Keyera Corp. TSX: KEY 2020 Second Quarter Report August 5, 2020
KEYERA CORP.
39
Long-term Debt (including Credit Facilities) Below is a summary of Keyera’s long-term debt obligations as at June 30, 2020:
As at June 30, 2020 (Thousands of Canadian dollars)
Total
2020
2021
2022
2023
2024
After 2024
Credit facilities — — — — — — —
Total credit facilities — — — — — — —
Canadian dollar denominated debt Senior unsecured notes 1,134,000 2,000 — 60,000 30,000 17,000 1,025,000
Senior unsecured medium-term notes 800,000 — — — — — 800,000
Subordinated hybrid notes 600,000 — — — — — 600,000
2,534,000 2,000 — 60,000 30,000 17,000 2,425,000
Senior unsecured U.S. dollar denominated notes 593,636 140,240 — — — 174,278 279,118
Total debt 3,127,636 142,240 — 60,000 30,000 191,278 2,704,118
Less: current portion of long- term debt
(142,240)
(142,240)
—
—
—
—
—
Total long-term debt 2,985,396 — — 60,000 30,000 191,278 2,704,118
Credit Facilities Keyera has an unsecured revolving Credit Facility with a syndicate of eight lenders under which it can borrow up to $1.5 billion, with the potential to increase that limit to $1.85 billion subject to certain conditions. As at June 30, 2020, there were no amounts drawn under this facility (December 31, 2019 – $90 million). In December 2019, the Credit Facility was amended to extend the term from December 6, 2023 to December 6, 2024. Management expects to extend the Credit Facility prior to maturity, and in the event of reaching maturity, expects an adequate replacement will be established. Keyera also has two unsecured revolving demand facilities, one with the Toronto Dominion Bank in the amount of $25 million and the other with the Royal Bank of Canada in the amount of $50 million. These facilities bear interest based on the lenders’ rates for Canadian prime commercial loans, U.S. base rate loans, LIBOR loans or bankers’ acceptances. Long-term Debt Keyera’s long-term debt structure consists of a number of senior unsecured notes, medium-term notes and subordinated hybrid notes. On May 29, 2020, Keyera issued $400 million of senior unsecured medium-term notes in the Canadian public debt market. The notes bear interest at 3.959% per annum, are payable semi-annually, and mature on May 29, 2030. The notes were issued under Keyera's short form base shelf prospectus dated November 15, 2019, as supplemented by a prospectus supplement dated November 18, 2019, and a pricing supplement dated May 26, 2020. A portion of the proceeds from the note offering was used to repay indebtedness under Keyera’s credit facility. The remaining proceeds will be used for general corporate purposes, including funding capital expenditures and repayment of debt maturing in 2020. In June 2019, Keyera issued $600 million of fixed-to-floating rate subordinated hybrid notes due June 13, 2079 in the Canadian public debt market which receive 50% equity treatment by Keyera’s rating agencies. The subordinated notes were issued under Keyera’s short form base shelf prospectus and a prospectus supplement dated June 11, 2019. The interest rate of 6.875% is payable in equal semi-annual payments for the period December 13, 2019 to June 13, 2029.

Keyera Corp. TSX: KEY 2020 Second Quarter Report August 5, 2020
KEYERA CORP.
40
As at June 30, 2020, Keyera had $2,534 million and US$436 million of long-term debt. To manage the foreign currency exposure on the U.S. dollar denominated debt existing at June 30, 2020, Keyera has entered into cross-currency agreements with a syndicate of banks to swap the U.S. dollar principal and future interest payments into Canadian dollars at foreign exchange rates of $1.0425, $0.9838 and $1.029 per U.S. dollar. The cross-currency agreements are accounted for as derivative instruments and are measured at fair value at the end of each quarter. The section of this MD&A titled, “Net Foreign Currency Gain (Loss) on U.S. Debt and Other”, provides more information. The Credit Facility, senior note agreements, and note indenture for the medium-term notes contain a number of covenants, all of which were met as at June 30, 2020. The agreements are available at www.sedar.com. Failure to adhere to the covenants may impair Keyera’s ability to pay dividends and such a circumstance could affect its ability to execute future growth plans. The primary covenant for Keyera’s private senior unsecured notes and its Credit Facility is a Net Debt to Adjusted EBITDA ratio. In the calculation of debt for the purpose of calculating this covenant, Keyera is required to: i) include senior debt; ii) deduct working capital surpluses or add working capital deficits; and iii) utilize the cross-currency swap rates in the calculation of debt rather than the spot rate as at each balance sheet date. As at June 30, 2020, Keyera’s Net Debt to Adjusted EBITDA ratio was 2.1x for covenant test purposes (December 31, 2019 – 2.2x). The covenant test used for debt purposes excludes 100% of the $600 million subordinated hybrid note in the calculation. As a long-term target, Keyera’s objective is to maintain a Net Debt to Adjusted EBITDA ratio of between 2.5x to 3.0x, including 50% of any subordinated hybrid notes and preferred shares as debt. This range results in a leverage profile that supports Keyera’s investment grade credit ratings. Using this approach, the Net Debt to Adjusted EBITDA ratio at June 30, 2020 was 2.5x (December 31, 2019 – 2.7x). Capital Expenditures and Acquisitions The following table is a breakdown of capital expenditures and acquisitions for the three and six months ended June 30, 2020 and 2019:
Capital Expenditures and Acquisitions
Three months ended June 30,
Six months ended June 30,
(Thousands of Canadian dollars) 2020 2019 2020 2019
Acquisitions 1,630 332 1,630 549 Growth capital expenditures 127,082 234,193 337,696 524,742 Maintenance capital expenditures 6,213 40,487 14,421 47,845
Total capital expenditures 134,925 275,012 353,747 573,136
Growth capital expenditures for the three and six months ended June 30, 2020 amounted to $127 million and $338 million, respectively. Refer to the section of this MD&A, “Segmented Results of Operations”, for information related to the various growth capital projects in the Gathering and Processing and Liquids Infrastructure segments, including estimated costs to complete, costs incurred in 2020 and since inception of the project, and estimated completion timeframes. Keyera has comprehensive inspection, monitoring and maintenance programs in place. The objectives of these programs are to keep Keyera’s facilities in good working order and to maintain their ability to operate reliably for many years. In addition to the maintenance capital expenditures, Keyera incurred maintenance and repair expenses of $13 million and $26 million for the three and six months ended June 30, 2020, $3 million and $7 million higher than the same period in the prior year. At December 31, 2019, Keyera had a $2.9 billion capital program underway. Excluding KAPS, the capital program has an estimated total cost of $2.2 billion with the majority of projects dedicated to establishing a strong position in the liquids-rich Montney and Duvernay development areas. Of this capital program, approximately $2.0 billion has been expended since inception. The $2.2 billion growth capital program is expected to earn an annual return on capital of 10% to 15% in 2022, once all projects achieve their annual run rate. This return on
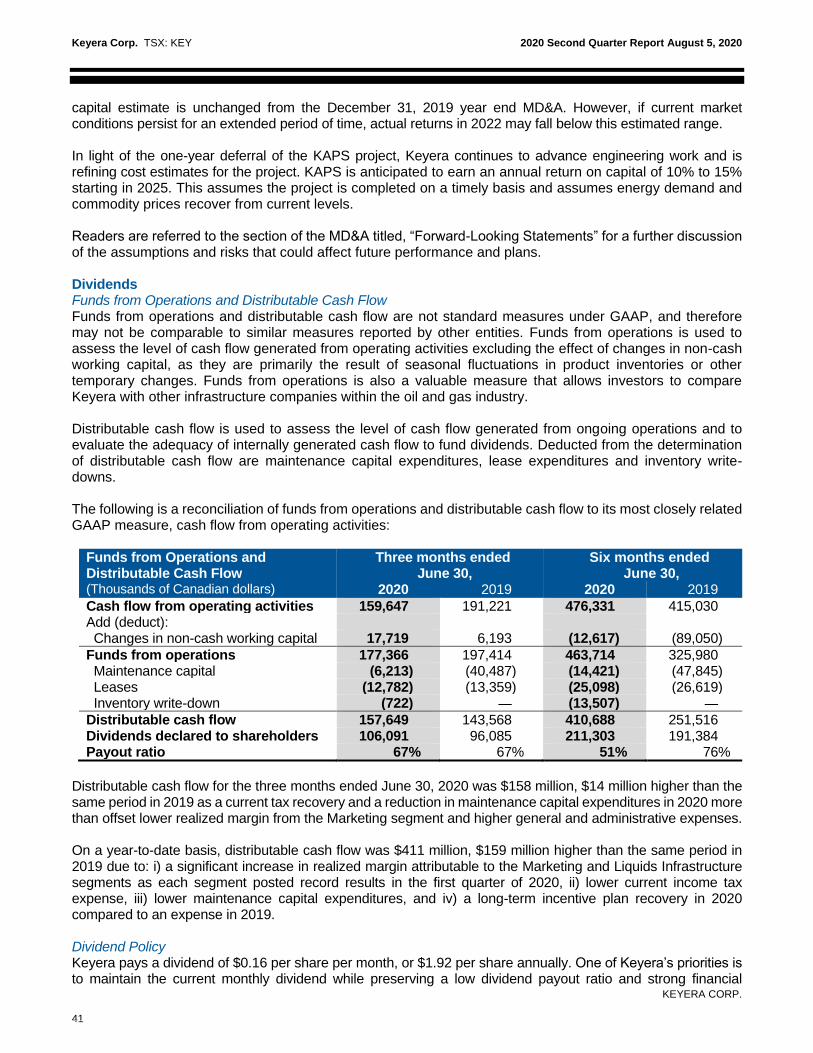
Keyera Corp. TSX: KEY 2020 Second Quarter Report August 5, 2020
KEYERA CORP.
41
capital estimate is unchanged from the December 31, 2019 year end MD&A. However, if current market conditions persist for an extended period of time, actual returns in 2022 may fall below this estimated range. In light of the one-year deferral of the KAPS project, Keyera continues to advance engineering work and is refining cost estimates for the project. KAPS is anticipated to earn an annual return on capital of 10% to 15% starting in 2025. This assumes the project is completed on a timely basis and assumes energy demand and commodity prices recover from current levels. Readers are referred to the section of the MD&A titled, “Forward-Looking Statements” for a further discussion of the assumptions and risks that could affect future performance and plans. Dividends Funds from Operations and Distributable Cash Flow Funds from operations and distributable cash flow are not standard measures under GAAP, and therefore may not be comparable to similar measures reported by other entities. Funds from operations is used to assess the level of cash flow generated from operating activities excluding the effect of changes in non-cash working capital, as they are primarily the result of seasonal fluctuations in product inventories or other temporary changes. Funds from operations is also a valuable measure that allows investors to compare Keyera with other infrastructure companies within the oil and gas industry. Distributable cash flow is used to assess the level of cash flow generated from ongoing operations and to evaluate the adequacy of internally generated cash flow to fund dividends. Deducted from the determination of distributable cash flow are maintenance capital expenditures, lease expenditures and inventory write-downs. The following is a reconciliation of funds from operations and distributable cash flow to its most closely related GAAP measure, cash flow from operating activities:
Funds from Operations and Distributable Cash Flow
Three months ended June 30,
Six months ended June 30,
(Thousands of Canadian dollars) 2020 2019 2020 2019
Cash flow from operating activities 159,647 191,221 476,331 415,030 Add (deduct): Changes in non-cash working capital 17,719 6,193 (12,617) (89,050)
Funds from operations 177,366 197,414 463,714 325,980 Maintenance capital (6,213) (40,487) (14,421) (47,845) Leases (12,782) (13,359) (25,098) (26,619) Inventory write-down (722) — (13,507) —
Distributable cash flow 157,649 143,568 410,688 251,516 Dividends declared to shareholders 106,091 96,085 211,303 191,384 Payout ratio 67% 67% 51% 76%
Distributable cash flow for the three months ended June 30, 2020 was $158 million, $14 million higher than the same period in 2019 as a current tax recovery and a reduction in maintenance capital expenditures in 2020 more than offset lower realized margin from the Marketing segment and higher general and administrative expenses. On a year-to-date basis, distributable cash flow was $411 million, $159 million higher than the same period in 2019 due to: i) a significant increase in realized margin attributable to the Marketing and Liquids Infrastructure segments as each segment posted record results in the first quarter of 2020, ii) lower current income tax expense, iii) lower maintenance capital expenditures, and iv) a long-term incentive plan recovery in 2020 compared to an expense in 2019. Dividend Policy Keyera pays a dividend of $0.16 per share per month, or $1.92 per share annually. One of Keyera’s priorities is to maintain the current monthly dividend while preserving a low dividend payout ratio and strong financial
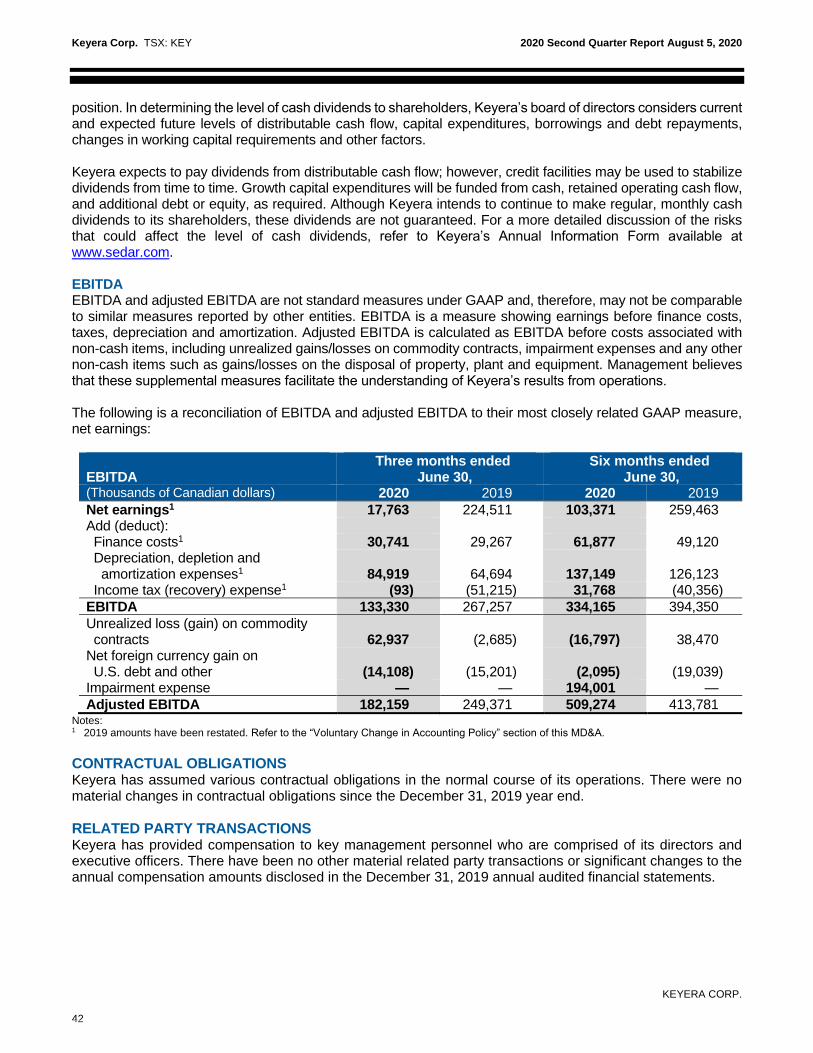
Keyera Corp. TSX: KEY 2020 Second Quarter Report August 5, 2020
KEYERA CORP.
42
position. In determining the level of cash dividends to shareholders, Keyera’s board of directors considers current and expected future levels of distributable cash flow, capital expenditures, borrowings and debt repayments, changes in working capital requirements and other factors. Keyera expects to pay dividends from distributable cash flow; however, credit facilities may be used to stabilize dividends from time to time. Growth capital expenditures will be funded from cash, retained operating cash flow, and additional debt or equity, as required. Although Keyera intends to continue to make regular, monthly cash dividends to its shareholders, these dividends are not guaranteed. For a more detailed discussion of the risks that could affect the level of cash dividends, refer to Keyera’s Annual Information Form available at www.sedar.com. EBITDA EBITDA and adjusted EBITDA are not standard measures under GAAP and, therefore, may not be comparable to similar measures reported by other entities. EBITDA is a measure showing earnings before finance costs, taxes, depreciation and amortization. Adjusted EBITDA is calculated as EBITDA before costs associated with non-cash items, including unrealized gains/losses on commodity contracts, impairment expenses and any other non-cash items such as gains/losses on the disposal of property, plant and equipment. Management believes that these supplemental measures facilitate the understanding of Keyera’s results from operations. The following is a reconciliation of EBITDA and adjusted EBITDA to their most closely related GAAP measure, net earnings:
EBITDA
Three months ended June 30,
Six months ended June 30,
(Thousands of Canadian dollars) 2020 2019 2020 2019
Net earnings1 17,763 224,511 103,371 259,463 Add (deduct): Finance costs1 30,741 29,267 61,877 49,120 Depreciation, depletion and amortization expenses1 84,919 64,694 137,149 126,123 Income tax (recovery) expense1 (93) (51,215) 31,768 (40,356)
EBITDA 133,330 267,257 334,165 394,350
Unrealized loss (gain) on commodity contracts
62,937
(2,685)
(16,797)
38,470
Net foreign currency gain on U.S. debt and other (14,108) (15,201) (2,095) (19,039) Impairment expense — — 194,001 —
Adjusted EBITDA 182,159 249,371 509,274 413,781 Notes: 1 2019 amounts have been restated. Refer to the “Voluntary Change in Accounting Policy” section of this MD&A.
CONTRACTUAL OBLIGATIONS Keyera has assumed various contractual obligations in the normal course of its operations. There were no material changes in contractual obligations since the December 31, 2019 year end.
RELATED PARTY TRANSACTIONS Keyera has provided compensation to key management personnel who are comprised of its directors and executive officers. There have been no other material related party transactions or significant changes to the annual compensation amounts disclosed in the December 31, 2019 annual audited financial statements.

Keyera Corp. TSX: KEY 2020 Second Quarter Report August 5, 2020
KEYERA CORP.
43
RISK FACTORS For a detailed discussion of the risks and trends that could affect the financial performance of Keyera and the steps that Keyera takes to mitigate these risks, see the December 31, 2019 MD&A and Keyera’s Annual Information Form, which are available on SEDAR at www.sedar.com. Risks related to the COVID-19 pandemic Keyera’s business operations and financial condition may be materially adversely affected by public health emergencies, including the COVID-19 pandemic, and related government responses. The risk of COVID-19 to Keyera includes the health and safety of its employees and contractors; the temporary suspension of operations in geographic locations in which Keyera operates; operational restrictions and restrictions on gatherings of individuals; delays in the completion, or deferral, of growth and expansion projects; counterparty credit risk; volatility in financial and commodity markets; and supply chain disruptions, all or any of which could materially adversely affect Keyera’s business operations and financial results. In the event that the spread (or fear of spreading) of COVID-19 continues, governments may increase or extend restrictions, directives, orders or regulations that could adversely affect Keyera’s operations, suppliers, customers, counterparties, shippers or partners, employee health, workforce productivity, insurance premiums and coverage, and ability to advance its existing and future growth projects or carry out its ongoing business plan. Keyera is monitoring recommendations from applicable government agencies and public health authorities to ensure the continued safe operation of its business operations and has implemented business continuity plans and steps to ensure the ongoing health of its workforce. However, such measures may not be effective, necessitating the closure of the affected facilities or projects. Such measures and mandates may increase Keyera’s expenses and limit, or potentially suspend, throughput volumes and processing handling capabilities at Keyera's facilities. The full extent, effect and duration of the COVID-19 pandemic continues to be unknown and the degree to which it may affect Keyera’s business operations and financial results will depend on future developments, which are highly uncertain and cannot be predicted with any degree of confidence. Depending on the duration and severity of the COVID-19 pandemic, such events may increase the effect of the other risks described in Keyera’s December 31, 2019 MD&A and Annual Information Form dated February 26, 2020, including, but not limited to, risks relating to the successful completion of Keyera’s growth and expansion projects and expected return on investments; its ability to maintain its credit ratings; restricted access to capital and increased borrowing costs; its ability to pay dividends and service obligations under its debt securities and other debt obligations; and otherwise complying with Keyera’s existing debt covenants.

Keyera Corp. TSX: KEY 2020 Second Quarter Report August 5, 2020
KEYERA CORP.
44
ENVIRONMENTAL REGULATION AND CLIMATE CHANGE Keyera is subject to a range of laws, regulations and requirements imposed by various levels of government and regulatory bodies in the jurisdictions in which it operates. While these legal controls and regulations affect numerous aspects of Keyera’s activities, including but not limited to, the operation of wells, pipelines and facilities, construction activities, transportation of dangerous goods, emergency response, operational safety and environmental matters, Keyera does not believe that they impact its operations in a manner materially different from other comparable businesses operating in the same jurisdictions. The midstream industry is subject to provincial and federal environmental legislation and regulations. Among other things, the environmental regulatory regime provides for restrictions and prohibitions on releases or emissions of various substances produced in association with certain oil and natural gas industry operations. Environmental regulation affects the operation of facilities and limits the extent to which facility expansion is permitted. In addition, legislation requires that facility sites and pipelines be abandoned and reclaimed to the satisfaction of provincial authorities and local landowners. A breach of such legislation may result in the imposition of fines, the issuance of clean-up orders or the shutting down of facilities and pipelines. Greenhouse gases, mainly carbon dioxide and methane, are components of the raw natural gas processed and handled at Keyera’s facilities. Operations at Keyera’s facilities, including the combustion of fossil fuels in engines, turbines, heaters and boilers, release carbon dioxide, methane and other minor greenhouse gases. As such, Keyera is subject to various greenhouse gas reporting and reduction programs. Keyera uses engineering consulting firms and internal resources to compile inventories of greenhouse gas emissions and reports these inventories in accordance with federal and provincial programs. Third party audits or verifications of inventories are conducted for facilities that are required to meet regulatory targets. Keyera is closely monitoring the ongoing development and implementation of the regulatory framework through which the federal and provincial governments are implementing their climate change and emissions reduction policies. Keyera’s year-over-year compliance costs are increasing as a result of the changes in emissions regulation and are expected to continue to increase. Overall, the increased costs are not expected to be material to Keyera; however, Keyera is looking at opportunities to reduce its costs and enhance the management of its emissions profile. For a detailed discussion of environmental regulations that affect Keyera, political and legislative developments as they relate to climate change and the risks associated therewith, see Keyera’s Annual Information Form which is available at www.sedar.com.
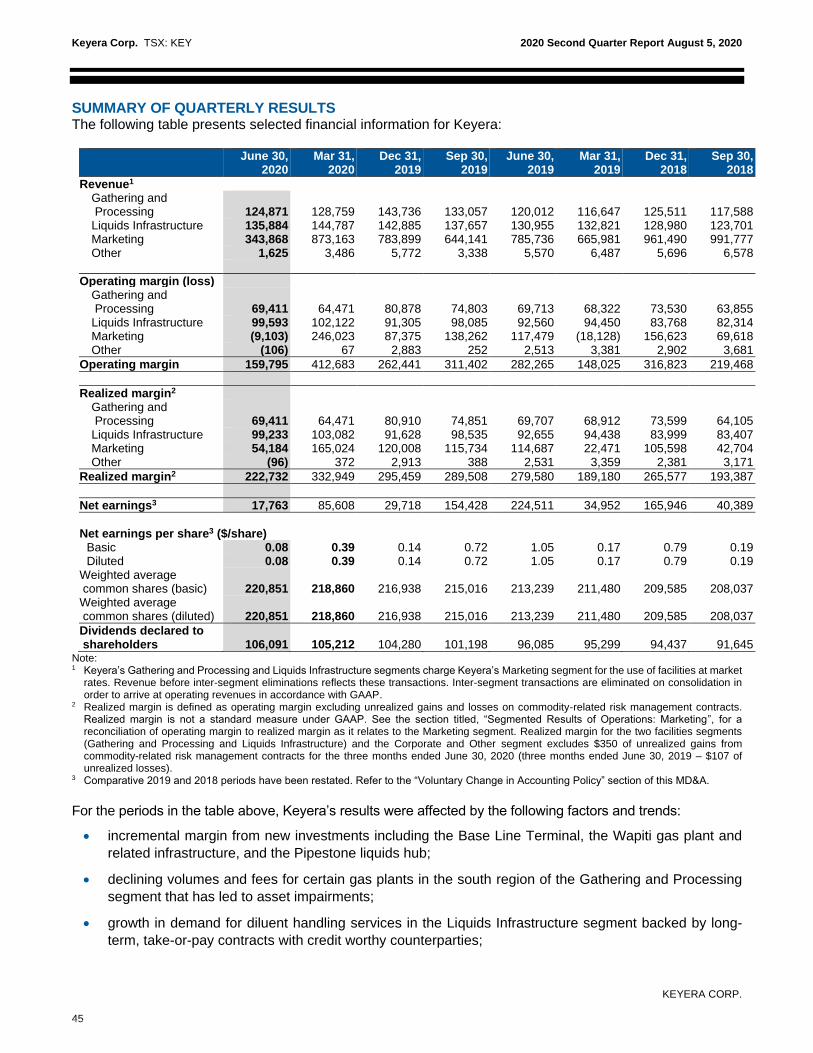
Keyera Corp. TSX: KEY 2020 Second Quarter Report August 5, 2020
KEYERA CORP.
45
SUMMARY OF QUARTERLY RESULTS The following table presents selected financial information for Keyera:
June 30, 2020
Mar 31, 2020
Dec 31, 2019
Sep 30, 2019
June 30, 2019
Mar 31, 2019
Dec 31, 2018
Sep 30, 2018
Revenue1 Gathering and Processing
124,871
128,759
143,736
133,057
120,012
116,647
125,511
117,588
Liquids Infrastructure 135,884 144,787 142,885 137,657 130,955 132,821 128,980 123,701 Marketing 343,868 873,163 783,899 644,141 785,736 665,981 961,490 991,777 Other 1,625 3,486 5,772 3,338 5,570 6,487 5,696 6,578
Operating margin (loss) Gathering and Processing
69,411
64,471
80,878
74,803
69,713
68,322
73,530
63,855
Liquids Infrastructure 99,593 102,122 91,305 98,085 92,560 94,450 83,768 82,314 Marketing (9,103) 246,023 87,375 138,262 117,479 (18,128) 156,623 69,618 Other (106) 67 2,883 252 2,513 3,381 2,902 3,681
Operating margin 159,795 412,683 262,441 311,402 282,265 148,025 316,823 219,468
Realized margin2 Gathering and Processing 69,411
64,471
80,910
74,851
69,707
68,912
73,599
64,105
Liquids Infrastructure 99,233 103,082 91,628 98,535 92,655 94,438 83,999 83,407 Marketing 54,184 165,024 120,008 115,734 114,687 22,471 105,598 42,704 Other (96) 372 2,913 388 2,531 3,359 2,381 3,171
Realized margin2 222,732 332,949 295,459 289,508 279,580 189,180 265,577 193,387
Net earnings3 17,763 85,608 29,718 154,428 224,511 34,952 165,946 40,389
Net earnings per share3 ($/share)
Basic 0.08 0.39 0.14 0.72 1.05 0.17 0.79 0.19 Diluted 0.08 0.39 0.14 0.72 1.05 0.17 0.79 0.19
Weighted average common shares (basic) 220,851 218,860 216,938 215,016 213,239 211,480 209,585 208,037 Weighted average common shares (diluted) 220,851 218,860 216,938 215,016 213,239 211,480 209,585 208,037
Dividends declared to shareholders
106,091
105,212
104,280
101,198
96,085
95,299
94,437
91,645
Note: 1 Keyera’s Gathering and Processing and Liquids Infrastructure segments charge Keyera’s Marketing segment for the use of facilities at market
rates. Revenue before inter-segment eliminations reflects these transactions. Inter-segment transactions are eliminated on consolidation in order to arrive at operating revenues in accordance with GAAP.
2 Realized margin is defined as operating margin excluding unrealized gains and losses on commodity-related risk management contracts. Realized margin is not a standard measure under GAAP. See the section titled, “Segmented Results of Operations: Marketing”, for a reconciliation of operating margin to realized margin as it relates to the Marketing segment. Realized margin for the two facilities segments (Gathering and Processing and Liquids Infrastructure) and the Corporate and Other segment excludes $350 of unrealized gains from commodity-related risk management contracts for the three months ended June 30, 2020 (three months ended June 30, 2019 – $107 of unrealized losses).
3 Comparative 2019 and 2018 periods have been restated. Refer to the “Voluntary Change in Accounting Policy” section of this MD&A.
For the periods in the table above, Keyera’s results were affected by the following factors and trends:
• incremental margin from new investments including the Base Line Terminal, the Wapiti gas plant and
related infrastructure, and the Pipestone liquids hub;
• declining volumes and fees for certain gas plants in the south region of the Gathering and Processing
segment that has led to asset impairments;
• growth in demand for diluent handling services in the Liquids Infrastructure segment backed by long-
term, take-or-pay contracts with credit worthy counterparties;
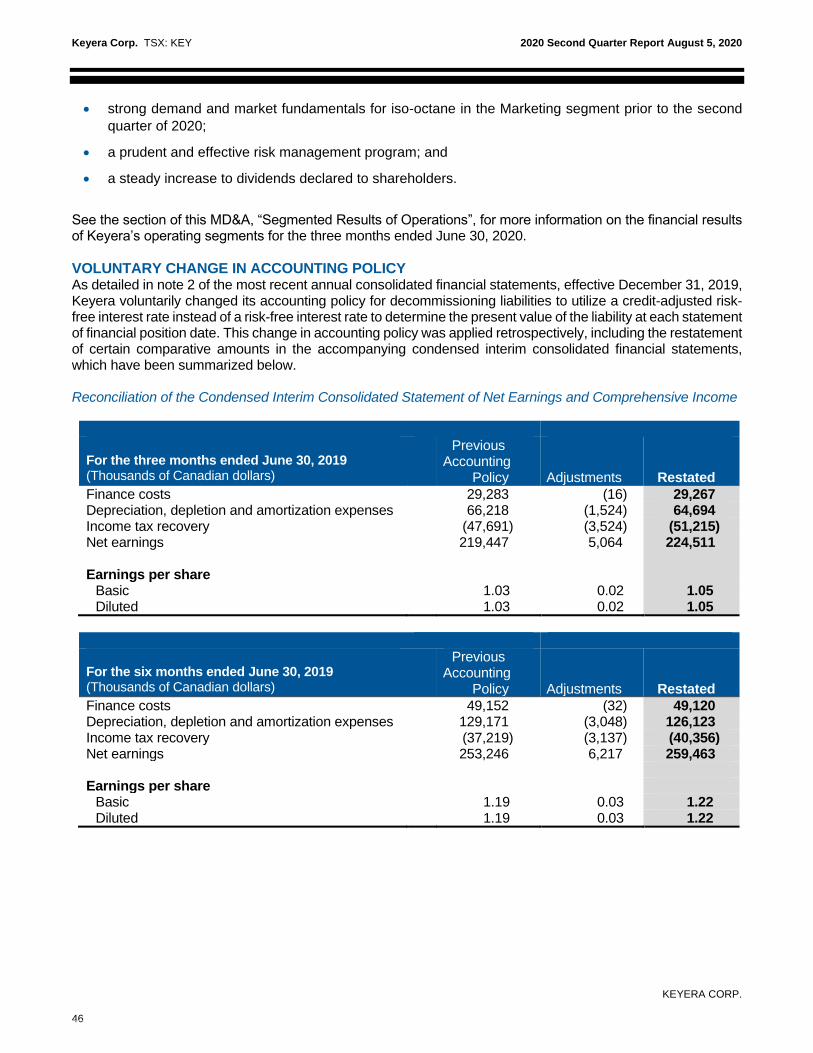
Keyera Corp. TSX: KEY 2020 Second Quarter Report August 5, 2020
KEYERA CORP.
46
• strong demand and market fundamentals for iso-octane in the Marketing segment prior to the second
quarter of 2020;
• a prudent and effective risk management program; and
• a steady increase to dividends declared to shareholders.
See the section of this MD&A, “Segmented Results of Operations”, for more information on the financial results of Keyera’s operating segments for the three months ended June 30, 2020.
VOLUNTARY CHANGE IN ACCOUNTING POLICY As detailed in note 2 of the most recent annual consolidated financial statements, effective December 31, 2019, Keyera voluntarily changed its accounting policy for decommissioning liabilities to utilize a credit-adjusted risk-free interest rate instead of a risk-free interest rate to determine the present value of the liability at each statement of financial position date. This change in accounting policy was applied retrospectively, including the restatement of certain comparative amounts in the accompanying condensed interim consolidated financial statements, which have been summarized below. Reconciliation of the Condensed Interim Consolidated Statement of Net Earnings and Comprehensive Income
For the three months ended June 30, 2019 (Thousands of Canadian dollars)
Previous Accounting
Policy Adjustments Restated
Finance costs 29,283 (16) 29,267 Depreciation, depletion and amortization expenses 66,218 (1,524) 64,694 Income tax recovery (47,691) (3,524) (51,215) Net earnings 219,447 5,064 224,511 Earnings per share
Basic 1.03 0.02 1.05 Diluted 1.03 0.02 1.05
For the six months ended June 30, 2019 (Thousands of Canadian dollars)
Previous Accounting
Policy Adjustments Restated
Finance costs 49,152 (32) 49,120 Depreciation, depletion and amortization expenses 129,171 (3,048) 126,123 Income tax recovery (37,219) (3,137) (40,356) Net earnings 253,246 6,217 259,463 Earnings per share
Basic 1.19 0.03 1.22 Diluted 1.19 0.03 1.22
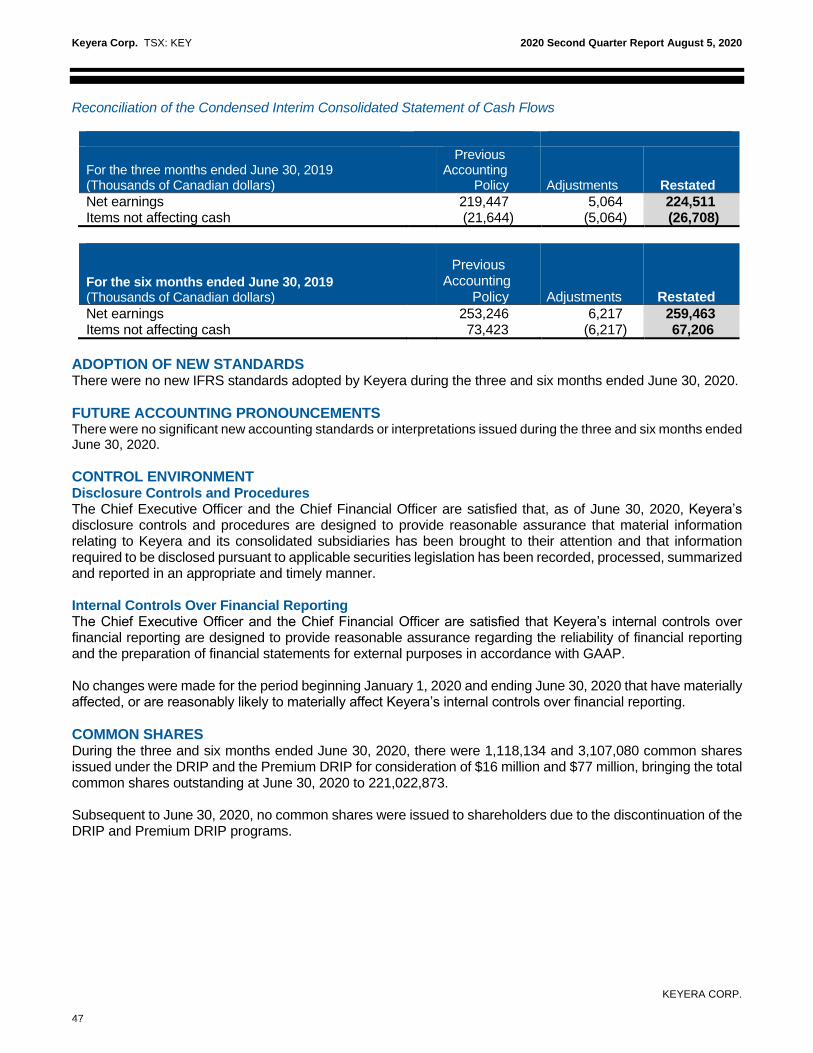
Keyera Corp. TSX: KEY 2020 Second Quarter Report August 5, 2020
KEYERA CORP.
47
Reconciliation of the Condensed Interim Consolidated Statement of Cash Flows
For the three months ended June 30, 2019 (Thousands of Canadian dollars)
Previous Accounting
Policy Adjustments Restated
Net earnings 219,447 5,064 224,511 Items not affecting cash (21,644) (5,064) (26,708)
For the six months ended June 30, 2019 (Thousands of Canadian dollars)
Previous Accounting
Policy Adjustments Restated
Net earnings 253,246 6,217 259,463 Items not affecting cash 73,423 (6,217) 67,206
ADOPTION OF NEW STANDARDS There were no new IFRS standards adopted by Keyera during the three and six months ended June 30, 2020.
FUTURE ACCOUNTING PRONOUNCEMENTS There were no significant new accounting standards or interpretations issued during the three and six months ended June 30, 2020.
CONTROL ENVIRONMENT Disclosure Controls and Procedures The Chief Executive Officer and the Chief Financial Officer are satisfied that, as of June 30, 2020, Keyera’s disclosure controls and procedures are designed to provide reasonable assurance that material information relating to Keyera and its consolidated subsidiaries has been brought to their attention and that information required to be disclosed pursuant to applicable securities legislation has been recorded, processed, summarized and reported in an appropriate and timely manner. Internal Controls Over Financial Reporting The Chief Executive Officer and the Chief Financial Officer are satisfied that Keyera’s internal controls over financial reporting are designed to provide reasonable assurance regarding the reliability of financial reporting and the preparation of financial statements for external purposes in accordance with GAAP. No changes were made for the period beginning January 1, 2020 and ending June 30, 2020 that have materially affected, or are reasonably likely to materially affect Keyera’s internal controls over financial reporting.
COMMON SHARES During the three and six months ended June 30, 2020, there were 1,118,134 and 3,107,080 common shares issued under the DRIP and the Premium DRIP for consideration of $16 million and $77 million, bringing the total common shares outstanding at June 30, 2020 to 221,022,873. Subsequent to June 30, 2020, no common shares were issued to shareholders due to the discontinuation of the DRIP and Premium DRIP programs.

Keyera Corp. TSX: KEY 2020 Second Quarter Report August 5, 2020
KEYERA CORP.
48
NON-GAAP FINANCIAL MEASURES This discussion and analysis refers to certain financial measures that are not determined in accordance with GAAP. Measures such as funds from operations (defined as cash flow from operating activities adjusted for changes in non-cash working capital); distributable cash flow (defined as cash flow from operating activities adjusted for changes in non-cash working capital, inventory write-downs, maintenance capital expenditures and lease payments); distributable cash flow per share (defined as distributable cash flow divided by weighted average number of shares – basic); payout ratio (defined as dividends declared to shareholders divided by distributable cash flow); EBITDA (defined as earnings before finance costs, taxes, depreciation, and amortization); adjusted EBITDA (defined as EBITDA before costs associated with non-cash items, including unrealized gains/losses on commodity-related contracts, net foreign currency gains/losses on U.S. debt and other, impairment expenses and any other non-cash items such as gains/losses on the disposal of property, plant and equipment); realized margin (defined as operating margin excluding unrealized gains and losses on commodity-related risk management contracts); annual return on capital (defined as realized margin divided by weighted average in-service growth capital including maintenance capital and excluding decommissioning assets, depreciation, impairments, and work-in-progress capital); annual return on capital for the growth capital program excluding KAPS (defined as expected operating margin divided by the estimated capital cost for the Simonette projects, the Wapiti and Pipestone gas plants and associated gathering infrastructure, the Wildhorse Terminal, the South Cheecham sulphur handling project, and storage cavern capital projects that are currently under development); annual return on capital for the KAPS project (defined as expected operating margin divided by the estimated capital cost for the development of the KAPS project); and compound annual growth rate for distributable cash flow per share, calculated as:
are not standard measures under GAAP and, therefore, may not be comparable to similar measures reported by other entities. Management believes that these supplemental measures facilitate the understanding of Keyera’s results of operations, leverage, liquidity and financial position. Funds from operations is used to assess the level of cash flow generated from operating activities excluding the effect of changes in non-cash working capital, as they are primarily the result of seasonal fluctuations in product inventories or other temporary changes. Funds from operations is also a valuable measure that allows investors to compare Keyera with other companies within the midstream oil and gas industry. Distributable cash flow is used to assess the level of cash flow generated from ongoing operations and to evaluate the adequacy of internally generated cash flow to fund dividends. EBITDA and adjusted EBITDA are measures used as an indication of earnings generated from operations after consideration of administrative and overhead costs. Realized margin is used to assess the financial performance of Keyera’s ongoing operations without the effect of unrealized gains and losses on commodity-related risk management contracts related to future periods. Annual return on capital and annual return on capital for the KAPS project are used to reflect the expected profitability and value-creating potential for: (i) certain growth projects that have been sanctioned and are currently under development as of the date hereof, and (ii) for the KAPS project. Compound annual growth rate provides investors with the rate at which distributable cash flow per share has grown over a defined period of time. Investors are cautioned, however, that these measures should not be construed as an alternative to net earnings determined in accordance with GAAP as an indication of Keyera’s performance.
Keyera Corp. TSX: KEY 2020 Second Quarter Report August 5, 2020
KEYERA CORP.
49
FORWARD-LOOKING STATEMENTS In order to provide readers with information regarding Keyera, including its assessment of future plans, operations and financial performance, certain statements contained herein (and in the documents incorporated by reference) are forward-looking. These forward-looking statements relate to future events or Keyera’s future performance. Such statements are predictions only and actual events or results may differ materially. Forward-looking statements are typically identified by words such as “anticipate”, “continue”, “estimate”, “expect”, “may”, “will”, “project”, “should”, “plan”, “intend”, “believe”, and similar expressions, including the negatives thereof. All statements other than statements of historical fact contained in this document are forward-looking statements. The forward-looking statements reflect management’s current beliefs and assumptions with respect to such things as the outlook for general economic trends, industry trends, commodity prices, capital markets, the integrity and reliability of Keyera’s assets, and the governmental, regulatory and legal environment. In some instances, forward-looking statements contained herein may be attributed to third party sources. Management believes that its assumptions and analysis herein are reasonable and that the expectations reflected in the forward-looking statements contained herein are also reasonable based on the information available on the date such statements were made, and the process used to prepare the information. However, Keyera cannot assure readers that these expectations will prove to be correct. All forward-looking statements involve known and unknown risks, uncertainties and other factors that may cause actual results, events, levels of activity and achievements to differ materially from those anticipated in the forward-looking statements. Such factors include but are not limited to: Keyera’s ability to implement its strategic priorities and business plan and achieve the expected benefits; general economic, market and industry conditions; activities of customers, producers and other facility owners; operational hazards and performance; the effectiveness of Keyera’s risk management programs; competition; changes in commodity composition and prices, inventory levels, supply/demand trends and other market conditions and factors; global pandemics (including COVID-19); regional or global conflicts; processing and marketing margins; climate change risks, including the effects of unusual weather and natural catastrophes; climate change effects and regulatory and market compliance and other costs associated with climate change; variables associated with capital projects, including costs and timing; fluctuations in interest, tax and foreign currency exchange rates; counterparty performance and credit risk; changes in operating and capital costs; costs and availability of financing; ability to expand, update and adapt infrastructure on a timely and effective basis; decommissioning, abandonment and reclamation costs; reliance on key personnel and third parties including joint venture partners and third-party facility owners; relationships with external stakeholders, including Indigenous stakeholders; technology, security and cybersecurity risks; potential litigation and disputes; uninsured and underinsured losses; ability to service debt and pay dividends; changes in credit rating; reputational risks; changes in environmental and other laws and regulations; actions by government authorities; and other factors, many of which are beyond the control of Keyera, some of which are discussed in this MD&A and in Keyera’s Annual Information Form dated February 26, 2020, filed on SEDAR at www.sedar.com and available on the Keyera website at www.keyera.com. Further, because there is interconnectivity between many of the risks Keyera faces, it is possible that different constellations of risk could materialize which could result in unanticipated outcomes or consequences. Proposed construction and completion schedules and budgets for capital projects are subject to many variables, including weather; availability and prices of materials; labour; customer project schedules and expected in-service dates; contractor productivity; contractor disputes; quality of cost estimating; decision processes and approvals by joint venture partners; changes in project scope at the time of project sanctioning; regulatory approvals, conditions or delays (including possible intervention by third parties); Keyera’s ability to secure adequate land rights and water supply; and macro socio-economic trends. As a result, expected timing, costs and benefits associated with these projects may differ materially from the descriptions contained herein. Further, some of the projects discussed are subject to securing sufficient producer/customer interest and may not proceed if sufficient commitments are not obtained. Typically, the earlier in the engineering process that projects are sanctioned, the greater the likelihood that the schedule and budget may change. In addition to the factors referenced above, Keyera’s expectations with respect to future returns associated with: (i) the growth capital projects that have been sanctioned and are in development as of the date hereof,

Keyera Corp. TSX: KEY 2020 Second Quarter Report August 5, 2020
KEYERA CORP.
50
and (ii) the KAPS project, are based on a number of assumptions, estimates and projections that have been developed based on past experience and anticipated trends, including but not limited to: capital cost estimates assuming no material unforeseen costs; timing for completion of growth capital projects; customer performance of contractual obligations; reliability of production profiles; commodity prices, margins and volumes; tax and interest rates; availability of capital at attractive prices; and no changes in regulatory or approval requirements, including no delay in securing any outstanding regulatory approvals. Any statements relating to “reserves” are deemed to be forward-looking statements as they involve the implied assessment, based on certain estimates and assumptions that the reserves described can be profitably produced in the future. Readers are cautioned that the foregoing is not exhaustive, that they should not unduly rely on these forward-looking statements, that the information contained in the forward-looking statements may not be appropriate for other purposes and that the forward-looking statements in this document speak only as of the date hereof. Unless required by law, Keyera does not intend and does not assume any obligation to update its forward-looking statements. All forward-looking statements contained herein or in the accompanying documents are expressly qualified by this cautionary statement. Further information about the factors affecting forward-looking statements and management’s assumptions and analysis thereof, is available in filings made by Keyera with Canadian provincial securities commissions, which can be viewed on SEDAR at www.sedar.com.

Keyera Corp. TSX: KEY 2020 Second Quarter Report August 5, 2020
KEYERA CORP.
51
Investor Information DIVIDENDS TO SHAREHOLDERS Dividends declared to shareholders of Keyera were $0.48 per share in the second quarter of 2020. TAXABILITY OF DIVIDENDS Keyera’s dividends are considered to be eligible dividends for the purpose of the Income Tax Act (Canada). For non-resident shareholders, Keyera’s dividends are subject to Canadian withholding tax. SUPPLEMENTARY INFORMATION A breakdown of Keyera’s operational and financial results, including volumetric and operating margin information by business segment, is available on our website at www.keyera.com/ir/reports. SECOND QUARTER 2020 RESULTS CONFERENCE CALL AND WEBCAST Keyera will be conducting a conference call and webcast for investors, analysts, brokers and media representatives to discuss the financial results for the second quarter of 2020 at 8:00 a.m. Mountain Time (10:00 a.m. Eastern Time) on Thursday, August 6, 2020. Callers may participate by dialing 888-231-8191 or 647-427-7450. A recording of the call will be available for replay until 10:00 p.m. Mountain Time (12:00 a.m. Eastern Time) on August 20, 2020 by dialing 855-859-2056 or 416-849-0833 and entering pass code 2672038. Internet users can listen to the call live on Keyera’s website at www.keyera.com/news/events. Shortly after the call, an audio archive will be posted on the website for 90 days. QUESTIONS We welcome questions from interested parties. Calls should be directed to Keyera’s Investor Relations Department at 403-205-7670, toll free at 1-888-699-4853 or via email at [email protected]. Information about Keyera can also be found on our website at www.keyera.com.

Keyera Corp. TSX: KEY 2020 Second Quarter Report August 5, 2020
KEYERA CORP.
52
Keyera Corp. Condensed Interim Consolidated Statements of Financial Position (Thousands of Canadian dollars) (Unaudited)
June 30, December 31,
As at Note 2020 2019
ASSETS
Cash 230,601 9,314 Trade and other receivables 327,797 488,587 Derivative financial instruments 12 79,847 54,144 Inventory 4 102,336 93,682 Other assets 26,999 10,550
Total current assets 767,580 656,277 Derivative financial instruments 12 125,438 95,891 Property, plant and equipment 5 6,457,326 6,365,832 Right-of-use assets 220,719 241,452 Intangible assets 80,151 80,149 Goodwill 55,761 55,761 Deferred tax assets 11 19,336 18,826
Total assets 7,726,311 7,514,188
LIABILITIES AND EQUITY Trade and other payables, and provisions 401,571 560,338 Derivative financial instruments 12 30,673 31,213 Dividends payable 35,364 34,867 Current portion of long-term debt 142,240 135,540 Current portion of decommissioning liability 8,473 16,533 Current portion of lease liabilities 39,897 38,470
Total current liabilities 658,218 816,961 Derivative financial instruments 12 2,151 — Credit facilities — 90,000 Long-term debt 7 2,968,703 2,548,468 Decommissioning liability 265,534 233,220 Long-term lease liabilities 202,202 209,987 Other long-term liabilities 6 9,575 16,912 Deferred tax liabilities 576,198 544,789
Total liabilities 4,682,581 4,460,337
Equity Share capital 8 3,150,104 3,073,200 Accumulated deficit (125,954) (18,022) Accumulated other comprehensive income 19,580 (1,327)
Total equity 3,043,730 3,053,851
Total liabilities and equity 7,726,311 7,514,188 See accompanying notes to the unaudited condensed interim consolidated financial statements. These unaudited condensed interim consolidated financial statements were approved by the board of directors of Keyera Corp. on August 5, 2020.

Keyera Corp. TSX: KEY 2020 Second Quarter Report August 5, 2020
KEYERA CORP.
53
Keyera Corp. Condensed Interim Consolidated Statements of Net Earnings and Comprehensive Income (Thousands of Canadian dollars, except share information) (Unaudited)
Three months ended June 30,
Six months ended June 30,
2020 2019 2020 2019
Note
(Restated) Note 2
(Restated) Note 2
Revenues 16 529,921 960,533 1,590,220 1,797,279
Expenses 16 (370,126) (678,268) (1,017,742) (1,366,989)
Operating margin 159,795 282,265 572,478 430,290
General and administrative expenses (33,913) (19,615) (56,674) (38,875)
Finance costs 14 (30,741) (29,267) (61,877) (49,120) Depreciation, depletion and amortization expenses (84,919) (64,694) (137,149) (126,123)
Net foreign currency gain on U.S. debt and other 13 14,108 15,201 2,095 19,039
Long-term incentive plan (expense) recovery 10 (6,660) (10,594) 10,267 (16,104)
Impairment expense 5 — — (194,001) —
Earnings before income tax 17,670 173,296 135,139 219,107
Income tax recovery (expense) 11 93 51,215 (31,768) 40,356
Net earnings 17,763 224,511 103,371 259,463
Other comprehensive (loss) income
Foreign currency translation adjustment (16,763) (9,199) 20,907 (16,578)
Comprehensive income 1,000 215,312 124,278 242,885
Earnings per share
Basic earnings per share 9 0.08 1.05 0.47 1.22
Diluted earnings per share 9 0.08 1.05 0.47 1.22 See accompanying notes to the unaudited condensed interim consolidated financial statements.

Keyera Corp. TSX: KEY 2020 Second Quarter Report August 5, 2020
KEYERA CORP.
54
Keyera Corp. Condensed Interim Consolidated Statements of Cash Flows (Thousands of Canadian dollars) (Unaudited)
Three months ended June 30,
Six months ended June 30,
2020 2019 2020 2019
Note (Restated)
Note 2 (Restated)
Note 2 Cash provided by (used in):
OPERATING ACTIVITIES
Net earnings 17,763 224,511 103,371 259,463
Adjustments for items not affecting cash:
Finance costs 14 6,063 6,888 11,930 12,205
Depreciation, depletion and amortization expenses 84,919 64,694 137,149 126,123 Unrealized loss (gain) on derivative financial instruments 12 78,417 (1,107) (53,639) 51,845
Unrealized (gain) loss on foreign exchange (27,476) (14,777) 31,937 (29,106)
Inventory write-down 4 722 — 13,507 —
Deferred income tax expense (recovery) 11 18,391 (82,406) 31,566 (93,861)
Impairment expense 5 — — 194,001 —
Decommissioning liability expenditures (1,433) (389) (6,108) (689)
Changes in non-cash working capital 15 (17,719) (6,193) 12,617 89,050
Net cash provided by operating activities 159,647 191,221 476,331 415,030
INVESTING ACTIVITIES
Acquisitions (1,630) (332) (1,630) (549)
Capital expenditures (133,295) (274,680) (352,117) (572,587)
Proceeds on disposal of property, plant and equipment — 395 — 395
Changes in non-cash working capital 15 (51,326) (22,777) (51,173) 11,255
Net cash used in investing activities (186,251) (297,394) (404,920) (561,486)
FINANCING ACTIVITIES
Borrowings under credit facility 110,000 230,000 200,000 640,000
Repayments under credit facility (180,000) (490,000) (290,000) (720,000)
Proceeds from issuance of long-term debt 7 400,000 600,000 400,000 600,000
Repayments of long-term debt — (56,019) — (126,019)
Financing costs related to credit facility/long-term debt (2,176) (5,303) (2,390) (5,335)
Issuance costs (250) — (250) —
Proceeds from issuance of shares related to DRIP 8 15,505 54,017 77,154 106,978
Lease payments (12,782) (13,359) (25,098) (26,619)
Dividends paid to shareholders (105,912) (95,821) (210,806) (190,837)
Net cash provided by financing activities 224,385 223,515 148,610 278,168 Effect of exchange rate fluctuations on foreign cash held
(459)
(714)
1,266
(1,646)
Net increase in cash 197,322 116,628 221,287 130,066
Cash (bank indebtedness) at the beginning of the period 33,279 2,578 9,314 (10,860)
Cash at the end of the period 230,601 119,206 230,601 119,206
Income taxes paid in cash 865 9,175 64,501 45,892
Interest paid in cash 59,906 43,071 75,258 60,654 See accompanying notes to the unaudited condensed interim consolidated financial statements.

Keyera Corp. TSX: KEY 2020 Second Quarter Report August 5, 2020
KEYERA CORP.
55
Keyera Corp. Condensed Interim Consolidated Statements of Changes in Equity (Thousands of Canadian dollars) (Unaudited)
Share Capital
Accumulated Deficit
Accumulated Other
Comprehensive Income Total
(Restated – Note 2) (Restated – Note 2)
Balance at December 31, 2018 2,846,496 (64,769) 19,485 2,801,212
Common shares issued pursuant to dividend reinvestment plans 106,978 — — 106,978 Net earnings — 259,463 — 259,463 Dividends declared to shareholders — (191,384) — (191,384) Other comprehensive loss — — (16,578) (16,578)
Balance at June 30, 2019 2,953,474 3,310 2,907 2,959,691
Share Capital
Accumulated Deficit
Accumulated Other
Comprehensive Income Total
Balance at December 31, 2019 3,073,200 (18,022) (1,327) 3,053,851
Common shares issued pursuant to dividend reinvestment plans 77,154 — — 77,154 Issuance costs (250) — — (250) Net earnings — 103,371 — 103,371 Dividends declared to shareholders — (211,303) — (211,303) Other comprehensive income — — 20,907 20,907
Balance at June 30, 2020 3,150,104 (125,954) 19,580 3,043,730 See accompanying notes to the unaudited condensed interim consolidated financial statements.

Keyera Corp. TSX: KEY 2020 Second Quarter Report August 5, 2020
KEYERA CORP. Notes to unaudited condensed interim consolidated financial statements
56
Keyera Corp. Notes to the Condensed Interim Consolidated Financial Statements As at and for the three and six months ended June 30, 2020 and 2019 (All amounts expressed in thousands of Canadian dollars, except as otherwise noted) (Unaudited)
1. GENERAL BUSINESS DESCRIPTION
The operating subsidiaries of Keyera Corp. include Keyera Partnership (the “Partnership”), Keyera Energy Ltd. (“KEL”), Keyera Energy Inc. (“KEI”), Keyera Rimbey Ltd. (“KRL”), Keyera RP Ltd. (“KRPL”), Rimbey Pipeline Limited Partnership (“RPLP”), Alberta Diluent Terminal Ltd. (“ADT”) and Alberta EnviroFuels Inc. (“AEF”). Keyera Corp. and its subsidiaries are involved in the business of natural gas gathering and processing; transportation, storage and marketing of natural gas liquids (“NGLs”) and iso-octane in Canada and the United States (“U.S.”); the production of iso-octane; and liquids blending in Canada and the U.S. Keyera Corp. and its subsidiaries are collectively referred to herein as “Keyera”. The address of Keyera’s registered office and principal place of business is Suite 200, Sun Life Plaza West Tower, 144 – 4th Avenue S.W., Calgary, AB, Canada. Pursuant to its Articles of Amalgamation, Keyera Corp. is authorized to issue an unlimited number of common shares (the “Shares”). The Shares trade on the Toronto Stock Exchange under the symbol “KEY”. Keyera is approved to issue two classes of preferred shares (one class referred to as the “First Preferred Shares”, a second class referred to as the “Second Preferred Shares”), and collectively both classes being referred to as the “Preferred Shares”. Each are issuable in one or more series without par value and each with such rights, restrictions, designations and provisions as the board of directors may at any time and from time to time determine, subject to an aggregate maximum number of authorized Preferred Shares. No preferred shares had been issued as at June 30, 2020.
2. BASIS OF PREPARATION These condensed interim consolidated financial statements are in accordance with IAS 34, Interim Financial Reporting, as issued by the International Accounting Standards Board (“IASB”). The accounting policies applied are in accordance with International Financial Reporting Standards (“IFRS”) and are consistent with Keyera Corp.’s consolidated financial statements as at and for the year ended December 31, 2019, except for the adoption of new IFRS standards, amendments and interpretations effective January 1, 2020. These condensed interim consolidated financial statements as at and for the three and six months ended June 30, 2020 and 2019 do not include all disclosures required for the preparation of annual consolidated financial statements and should be read in conjunction with Keyera Corp.’s consolidated financial statements as at and for the year ended December 31, 2019. As detailed in note 2 of the most recent annual consolidated financial statements, effective December 31, 2019, Keyera voluntarily changed its accounting policy for decommissioning liabilities to utilize a credit-adjusted risk-free interest rate instead of a risk-free interest rate to determine the present value of the liability at each statement of financial position date. This change in accounting policy was applied retrospectively, including the restatement of certain comparative amounts in these condensed interim consolidated financial statements, which have been summarized below.

Keyera Corp. TSX: KEY 2020 Second Quarter Report August 5, 2020
KEYERA CORP. Notes to unaudited condensed interim consolidated financial statements
57
Reconciliation of the Condensed Interim Consolidated Statement of Net Earnings and Comprehensive Income
For the three months ended June 30, 2019
(Thousands of Canadian dollars)
Previous accounting
policy Adjustments Restated
Finance costs 29,283 (16) 29,267 Depreciation, depletion and amortization
expenses 66,218 (1,524) 64,694
Income tax recovery (47,691) (3,524) (51,215)
Net earnings 219,447 5,064 224,511
Earnings per share
Basic earnings per share 1.03 0.02 1.05
Diluted earnings per share 1.03 0.02 1.05
For the six months ended June 30, 2019
(Thousands of Canadian dollars)
Previous accounting
policy Adjustments Restated
Finance costs 49,152 (32) 49,120 Depreciation, depletion and amortization
expenses 129,171 (3,048) 126,123
Income tax recovery (37,219) (3,137) (40,356)
Net earnings 253,246 6,217 259,463
Earnings per share
Basic earnings per share 1.19 0.03 1.22
Diluted earnings per share 1.19 0.03 1.22
Reconciliation of the Condensed Interim Consolidated Statement of Cash Flows
For the three months ended June 30, 2019
(Thousands of Canadian dollars)
Previous accounting
policy Adjustments Restated
Net earnings 219,447 5,064 224,511
Items not affecting cash (21,644) (5,064) (26,708)
For the six months ended June 30, 2019
(Thousands of Canadian dollars)
Previous accounting
policy Adjustments Restated
Net earnings 253,246 6,217 259,463
Items not affecting cash 73,423 (6,217) 67,206
The condensed interim consolidated financial statements were authorized for issuance on August 5, 2020 by the board of directors.
Adoption of new standards For the three and six months ended June 30, 2020, Keyera did not adopt any new IFRS standards. Future accounting pronouncements update There were no significant new accounting standards or interpretations issued during the three and six months ended June 30, 2020.

Keyera Corp. TSX: KEY 2020 Second Quarter Report August 5, 2020
KEYERA CORP. Notes to unaudited condensed interim consolidated financial statements
58
3. THE EFFECT OF RECENT DEVELOPMENTS ON FINANCIAL POSITION AND PERFORMANCE, AND CRITICAL ACCOUNTING ESTIMATES AND JUDGMENTS
In March 2020, the World Health Organization declared a global pandemic as a result of the emergence and rapid transmission of a novel strain of the coronavirus (“COVID-19”). This pandemic has significantly affected the global economy, disrupting business operations and economic activity worldwide, and drastically reducing the global demand for crude oil. In addition, the decision of certain Organization of the Petroleum Exporting Countries (“OPEC”) and non-OPEC members to temporarily increase the supply of crude oil during the first quarter of 2020 resulted in severe declines to crude oil and crude-based commodity prices. As a result of this deterioration in market conditions, an unprecedented environment of extreme volatility in financial markets has emerged.
In the application of Keyera’s accounting policies, management is required to make estimates and assumptions about the carrying amounts of assets and liabilities recorded in the condensed interim consolidated financial statements. These estimates and associated assumptions are based on historical experience and other factors that are considered to be relevant. The current fluctuations in market conditions introduce additional uncertainties, risks and complexities in management’s determination of the estimates and assumptions used to prepare Keyera’s financial results. As the COVID-19 pandemic and volatility in financial markets is an evolving situation, management cannot reasonably estimate the length or severity of the implications. Actual results may differ from estimates and the effect of such differences may be material. Examples of key estimates and judgments used to prepare the condensed interim consolidated financial statements include fair value measurements, the determination of triggering events for the impairment of non-financial assets, the measurement of the decommissioning liability, the assessment of expected credit losses, the timing and amount of revenue recognition, and the determination of the amounts to be recognized for deferred tax assets and liabilities. A full list of the key accounting estimates, and the methodologies and assumptions underlying such estimates, are described in note 4 of the annual audited consolidated financial statements for the year ended December 31, 2019. At the end of the first quarter of 2020, Keyera’s share price sharply declined when compared to December 31, 2019. While Keyera’s share price and commodity prices have partially recovered during the second quarter of 2020, the magnitude of the effect that the COVID-19 pandemic and volatility in commodity prices will have on Keyera’s operations and future financial performance remains unknown. However, as of June 30, 2020, the following effects have been observed and considered in determining Keyera’s current accounting estimates and judgments:
• Gathering and Processing Operations – Keyera’s fee-for-service business is not directly exposed to commodity prices; however, the company’s gathering and processing facilities are affected by lower volumes resulting from reduced capital investment by producers. Recognizing that Keyera provides an essential service to its customers, Keyera continues to work with its customers to find mutually beneficial solutions to help them navigate through this volatility.
• Liquids Infrastructure Operations – During the second quarter, several oil sands producers announced production cuts following the significant decline in global oil prices. As a result, demand for condensate dramatically decreased and remained low during the second quarter of 2020, resulting in lower volumes flowing through Keyera’s condensate system. While crude oil prices have steadily improved throughout the second quarter into July 2020, Keyera continues to monitor the situation. Keyera does not anticipate a material financial effect in 2020 as the company has long-term, take-or-pay arrangements in place with multiple major oil sands producers. In addition, as the market tries to balance the supply and demand of condensate and other natural gas liquids, the demand for storage services has increased significantly.
• Marketing Operations – The ongoing COVID-19 pandemic has resulted in significant changes in energy supply and demand patterns. As a result, the demand for certain products during the second quarter has been lower than what is typical during normal economic conditions. In addition, average sales prices for all products have been significantly lower than normal as a result of the substantial

Keyera Corp. TSX: KEY 2020 Second Quarter Report August 5, 2020
KEYERA CORP. Notes to unaudited condensed interim consolidated financial statements
59
decline in commodity prices. Keyera has an effective management program in place that protected margins and inventory values from the sharp decline in commodity prices that began in March 2020.
In response to the decline in economic conditions since December 31, 2019, Keyera increased its allowance for expected credit losses during the first quarter of 2020 as discussed in note 12. During the second quarter of 2020, it was determined that a further increase to the allowance was not required.
4. INVENTORY
The total carrying amount and classification of inventory was as follows: As at June 30, December 31,
(Thousands of Canadian dollars) 2020 2019
NGLs and iso-octane 91,656 83,334 Other 10,680 10,348
Total inventory 102,336 93,682
For the period ended June 30, 2020, $94,826 of inventory was carried at cost (December 31, 2019 – $93,682) and $7,510 was carried at net realizable value (December 31, 2019 – $nil). For the three and six months ended June 30, 2020, a write-down of $722 and $13,507 was recorded to adjust the carrying amount of inventory to net realizable value (three and six months ended June 30, 2019 – $nil and $nil). The cost of inventory expensed for the three and six months ended June 30, 2020 was $241,137 and $747,275 (three and six months ended June 30, 2019 – $550,421 and $1,117,086).

Keyera Corp. TSX: KEY 2020 Second Quarter Report August 5, 2020
KEYERA CORP. Notes to unaudited condensed interim consolidated financial statements
60
5. PROPERTY, PLANT, AND EQUIPMENT
Impairment expense In the first quarter of 2020, Keyera identified through its impairment review that certain gas plants had carrying values that were greater than their recoverable amounts. The recoverable amount for each asset was calculated based on value in use which represents the estimated net present value of the cash flows expected to be derived from the asset, and were nominal in value.
The following impairment expenses with a combined value of $194,001 were recognized in the Gathering and Processing segment during the three months ended March 31, 2020:
(Thousands of Canadian dollars, except rate information)
Applicable value in use
discount rate
Impairment expense
recognized Central Foothills Cash-Generating Unit Ricinus gas plant 13.0% 73,222 West Pembina gas plant 13.0% 52,634 Nordegg River gas plant 13.0% 42,167 Drayton Valley North Cash-Generating Unit
Brazeau North and Pembina North gathering and processing complex
13.0% 25,978
Total impairment expense recognized in Gathering and Processing segment 194,001
The impairment expense recorded for the Central Foothills Cash-Generating Unit (“CGU”) was a result of Keyera’s gathering and processing optimization strategy. As part of this optimization strategy, Keyera suspended operations at its Minnehik Buck Lake gas plant in May 2020 and expects to suspend operations at its West Pembina gas plant in the third quarter of 2020. The closures of the Ricinus and Nordegg River gas plants are expected to occur in 2021. An impairment expense was not recorded for the Minnehik Buck Lake gas plant as this facility was previously impaired to its salvage value in 2019. The impairment expense recorded for the Drayton Valley North CGU was a result of underutilization of the Brazeau North and Pembina North gathering and processing complex, including lower producer activity in the capture areas for this complex. No further impairments were recorded during the second quarter of 2020.
6. OTHER LONG-TERM LIABILITIES
As at June 30, December 31,
(Thousands of Canadian dollars) 2020 2019
Long-term incentive plan 5,589 11,012 Other 3,986 5,900
Total other long-term liabilities 9,575 16,912

Keyera Corp. TSX: KEY 2020 Second Quarter Report August 5, 2020
KEYERA CORP. Notes to unaudited condensed interim consolidated financial statements
61
7. LONG-TERM DEBT On May 29, 2020, Keyera closed a public note offering of 10-year senior unsecured medium-term notes to investors in Canada. The $400,000 senior unsecured notes bear interest at 3.959% per annum, paid semi-annually, and mature on May 29, 2030.
The associated financing costs of approximately $2,176 have been deferred and are amortized using the effective interest method over the remaining term of the debt. On June 13, 2019, Keyera closed a hybrid note offering of $600,000 of fixed-to-floating rate subordinated notes due June 13, 2079 to investors in Canada. The interest rate of 6.875% is paid semi-annually and is fixed from June 13, 2019 to June 13, 2029. Commencing June 13, 2029, on every interest reset date (September 13, December 13, March 13, and June 13) until June 13, 2049, the interest rate will be reset to the three-month banker’s acceptance rate plus 5.17%. Commencing June 13, 2049, on every interest rate reset date until June 13, 2079, the interest rate will be reset to the three-month banker’s acceptance rate plus 5.92%. On or after June 13, 2029, the hybrid notes are subject to optional redemption by Keyera without the consent of the holders, whereby Keyera may redeem the notes in whole at any time, or in part on any interest payment date. The hybrid notes are also subject to an automatic conversion feature under certain bankruptcy and insolvency events. Upon an automatic conversion event, the notes will automatically be converted, without the consent of the note holders, into a newly issued series of First Preferred Shares (Preference Shares, Series 2019-A), that will carry the right to receive cumulative preferential cash dividends at the same rate as the interest rate that would have accrued on the notes. The fair value of the automatic conversion feature was deemed to be nominal at inception. The associated financing costs of approximately $5,637 have been deferred and are amortized using the effective interest method over the remaining term of the debt.
8. SHARE CAPITAL
(Thousands of
Canadian dollars)
Number of
Common Shares Share Capital
Balance at December 31, 2019 217,915,793 3,073,200
Common shares issued pursuant to dividend reinvestment plans 3,107,080 77,154
Issuance costs — (250)
Balance at June 30, 2020 221,022,873 3,150,104
In April 2020, Keyera discontinued the regular and premium components of the Dividend Reinvestment Plan (“DRIP”), effective with the May 2020 dividend payout. As a result, shareholders who have been participating in either component of the DRIP will receive the full cash dividend declared beginning with the dividend paid in May 2020.

Keyera Corp. TSX: KEY 2020 Second Quarter Report August 5, 2020
KEYERA CORP. Notes to unaudited condensed interim consolidated financial statements
62
9. EARNINGS PER SHARE
Basic earnings per share was calculated by dividing net earnings by the weighted average number of shares outstanding for the related period. Three months ended
June 30, Six months ended
June 30,
2020 (Thousands of Canadian dollars, except per share amounts)
2019 (Restated)
Note 2
2020
2019 (Restated)
Note 2
Basic and diluted earnings per share 0.08 1.05 0.47 1.22 Net earnings – basic and diluted 17,763 224,511 103,371 259,463
Three months ended
June 30, Six months ended
June 30,
(Thousands) 2020 2019 2020 2019
Weighted average number of shares – basic and diluted 220,851 213,239 219,855 212,364
10. SHARE-BASED COMPENSATION AND PENSION PLANS
Long-Term Incentive Plan Keyera has a Long-Term Incentive Plan (“LTIP”) which compensates officers and key employees by delivering shares of Keyera or paying cash in lieu of shares. Participants in the LTIP are granted rights (“share awards”) to receive shares of Keyera on specified dates in the future. Grants of share awards are authorized by the board of directors. Shares delivered to employees are acquired in the marketplace and not issued from treasury. The acquired shares are placed in a trust account established for the benefit of the participants until the share awards vest. The LTIP consists of two types of share awards, the Performance Award and the Time Vested (“Restricted”) Award. The LTIP is accounted for using the liability method and is measured at fair value at each statement of financial position date until the award is settled. The fair value of the liability is measured by applying a fair value pricing model whereby one of the valuation inputs was the June 30, 2020 share price of Keyera, which was $ 20.67 per share (December 31, 2019 – $34.02 per share).
The compensation cost recorded for the LTIP was as follows:
Three months ended June 30,
Six months ended June 30,
(Thousands of Canadian dollars) 2020 2019 2020 2019
Performance Awards 6,524 9,657 (9,167) 14,052 Restricted Awards 136 937 (1,100) 2,052
Total long-term incentive plan expense (recovery) 6,660 10,594 (10,267) 16,104
Employee Stock Purchase Plan Keyera maintains an employee stock purchase plan (“ESPP”) whereby eligible employees can purchase common shares of Keyera. Keyera will contribute an amount equal to 5% of the employee’s contribution. To participate in the ESPP, eligible employees select an amount to be deducted from their semi-monthly remuneration. Employees may elect to withhold up to 25% of their base compensation for the stock purchases. The shares of Keyera are acquired on the Toronto Stock Exchange on a semi-monthly basis consistent with the timing of the semi-monthly remuneration. The cost of the shares purchased to match the employee’s contribution is expensed as incurred and recorded in general and administrative expenses.
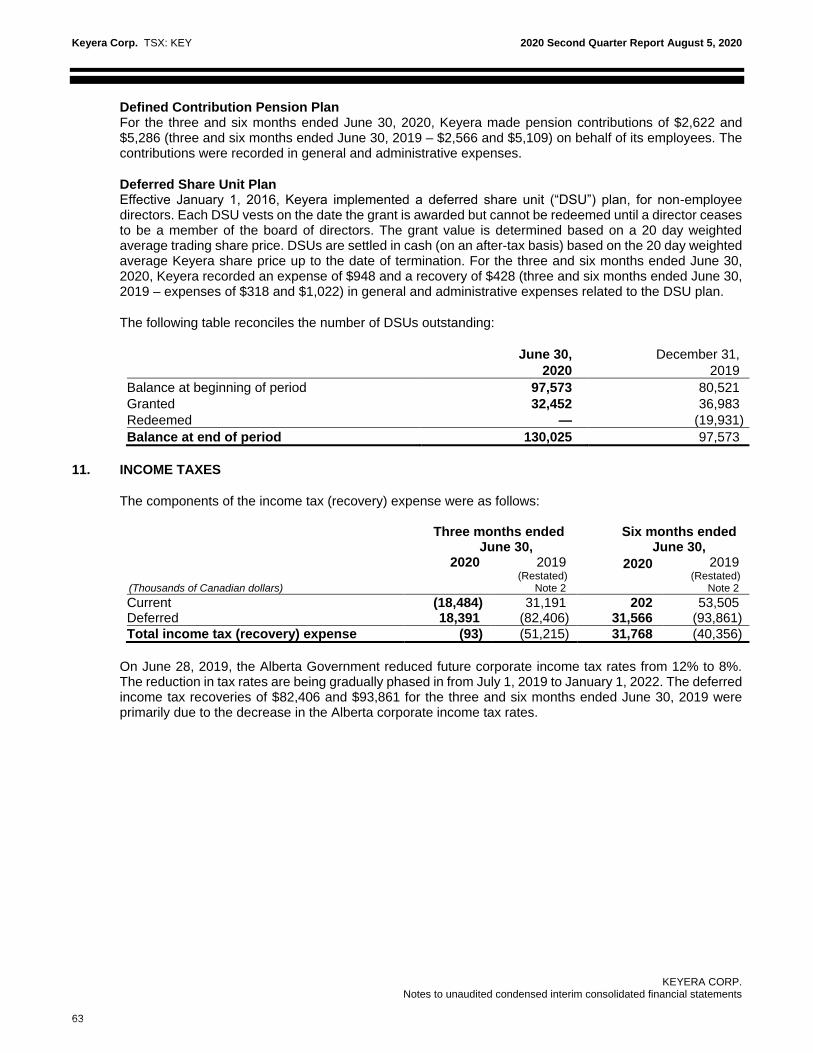
Keyera Corp. TSX: KEY 2020 Second Quarter Report August 5, 2020
KEYERA CORP. Notes to unaudited condensed interim consolidated financial statements
63
Defined Contribution Pension Plan For the three and six months ended June 30, 2020, Keyera made pension contributions of $2,622 and $5,286 (three and six months ended June 30, 2019 – $2,566 and $5,109) on behalf of its employees. The contributions were recorded in general and administrative expenses.
Deferred Share Unit Plan Effective January 1, 2016, Keyera implemented a deferred share unit (“DSU”) plan, for non-employee directors. Each DSU vests on the date the grant is awarded but cannot be redeemed until a director ceases to be a member of the board of directors. The grant value is determined based on a 20 day weighted average trading share price. DSUs are settled in cash (on an after-tax basis) based on the 20 day weighted average Keyera share price up to the date of termination. For the three and six months ended June 30, 2020, Keyera recorded an expense of $948 and a recovery of $428 (three and six months ended June 30, 2019 – expenses of $318 and $1,022) in general and administrative expenses related to the DSU plan.
The following table reconciles the number of DSUs outstanding:
June 30, December 31,
2020 2019
Balance at beginning of period 97,573 80,521
Granted 32,452 36,983
Redeemed — (19,931)
Balance at end of period 130,025 97,573
11. INCOME TAXES
The components of the income tax (recovery) expense were as follows:
Three months ended June 30,
Six months ended June 30,
(Thousands of Canadian dollars)
2020
2019 (Restated)
Note 2
2020
2019 (Restated)
Note 2 Current (18,484) 31,191 202 53,505 Deferred 18,391 (82,406) 31,566 (93,861)
Total income tax (recovery) expense (93) (51,215) 31,768 (40,356)
On June 28, 2019, the Alberta Government reduced future corporate income tax rates from 12% to 8%. The reduction in tax rates are being gradually phased in from July 1, 2019 to January 1, 2022. The deferred income tax recoveries of $82,406 and $93,861 for the three and six months ended June 30, 2019 were primarily due to the decrease in the Alberta corporate income tax rates.

Keyera Corp. TSX: KEY 2020 Second Quarter Report August 5, 2020
KEYERA CORP. Notes to unaudited condensed interim consolidated financial statements
64
12. FINANCIAL INSTRUMENTS AND RISK MANAGEMENT Financial instruments include cash, trade and other receivables, derivative financial instruments, bank indebtedness, trade and other payables, dividends payable, current and long-term lease liabilities, credit facilities, current and long-term debt, and certain other long-term liabilities. Derivative financial instruments include foreign exchange contracts, cross-currency swaps, NGLs, crude oil, motor gasoline and natural gas price contracts, electricity price contracts and physical fixed price commodity contracts. Derivative instruments are measured at fair value through profit or loss in the consolidated statements of net earnings and comprehensive income. All other financial instruments are measured at amortized cost.
Financial Instruments (a) Fair value Fair value represents Keyera’s estimate of the price at which a financial instrument could be exchanged between knowledgeable and willing parties in an orderly arm’s length transaction motivated by normal business considerations. Fair value measurement of assets and liabilities recognized on the consolidated statements of financial position are categorized into levels within a fair value hierarchy based on the nature of valuation inputs. The fair value hierarchy has the following levels: Level 1: quoted prices in active markets for identical assets or liabilities; Level 2: inputs other than quoted prices included within Level 1 that are observable for the asset
or liability, either directly or indirectly; and Level 3: inputs for the asset or liability that are not based on observable market data.
All of Keyera’s derivative instruments are classified as Level 2 as their fair value is derived by using observable inputs, including commodity price curves, foreign currency curves and credit spreads. For fixed price forward contracts, fair value is derived from observable NGL market prices. Financial instruments with fair value equal to carrying value The carrying values of cash, trade and other receivables, trade and other payables and dividends payable approximate their fair values because the instruments are either near maturity, have 5 to 30 days payment terms or have no fixed repayment terms. The carrying value of the credit facilities approximates fair value due to their floating rates of interest.
Fair value of senior fixed rate debt The fair value of long-term debt is based on third-party estimates for similar issues or current rates offered to Keyera for debt of the same maturity. The total fair value of Keyera’s unsecured senior notes, medium-term notes, and subordinated hybrid notes at June 30, 2020 was $3,339,000 (December 31, 2019 – $2,810,100) and this was determined by reference to inputs other than quoted market prices in active markets for identical liabilities under Level 2 of the fair value hierarchy.

Keyera Corp. TSX: KEY 2020 Second Quarter Report August 5, 2020
KEYERA CORP. Notes to unaudited condensed interim consolidated financial statements
65
The fair values and carrying values of the derivative instruments are listed below and represent an estimate of the amount that Keyera would receive (pay) if these instruments were settled at the end of the period.
(Thousands of Canadian dollars)
Weighted Fair Value
Notional Average Hierarchy Net Fair Carrying Value
As at June 30, 2020 Volume1 Price Level Value Asset Liability
Marketing (NGLs and Iso-octane) Financial contracts: Seller of fixed price WTI2 swaps (maturing by December 31, 2021)
3,371,014 Bbls
55.81/Bbl
Level 2
6,303
18,559
(12,256)
Buyer of fixed price WTI2 swaps (maturing by December 31, 2020)
718,000 Bbls
53.78/Bbl
Level 2
93
4,205
(4,112)
Seller of fixed price NGL swaps (maturing by March 31, 2021)
1,805,000 Bbls
32.05/Bbl
Level 2
6,910
8,288
(1,378)
Buyer of fixed price NGL swaps (maturing by December 31, 2021)
1,022,000 Bbls
35.67/Bbl
Level 2
(7,369)
1,042
(8,411)
Seller of fixed price RBOB3 basis spreads (iso-octane) (maturing by June 30, 2021)
2,370,000 Bbls
13.51/Bbl
Level 2
4,254
6,917
(2,663)
Physical contracts: Seller of fixed price NGL forward contracts (maturing by December 31, 2020)
245,000 Bbls
27.86/Bbl
Level 2
457
508
(51)
Buyer of fixed price NGL forward contracts (maturing by January 31, 2021)
230,000 Bbls
25.82/Bbl
Level 2
208
441
(233)
Currency: Seller of forward contracts (maturing by March 31, 2021)
US$189,500,000
1.36/USD
Level 2
(1,134)
1,806
(2,940)
Other foreign exchange contracts4 Level 2 2,550 2,550 —
Liquids Infrastructure
Electricity: Buyer of fixed price swaps (maturing by December 31, 2020)
66,240 MWhs
57.55/MWh
Level 2
(456)
24
(480)
Corporate and Other
Electricity: Buyer of fixed price swaps (maturing by December 31, 2021)
65,880 MWhs
54.16/MWh
Level 2
(206)
94
(300)
Long-term Debt: Buyer of cross-currency swaps (maturing September 8, 2020 – November 20, 2028)
US$524,023,650
0.98/USD
- 1.22/USD
Level 2
160,851
160,851
—
172,461 205,285 (32,824)
Notes: 1 All notional amounts represent actual volumes or actual prices and are not expressed in thousands. 2 West Texas Intermediate (“WTI”) crude oil. 3 Reformulated Blendstock for Oxygen Blending (“RBOB”). 4 Keyera has entered into other foreign exchange contracts to protect against fluctuations in the U.S. dollar to Canadian dollar exchange rate.

Keyera Corp. TSX: KEY 2020 Second Quarter Report August 5, 2020
KEYERA CORP. Notes to unaudited condensed interim consolidated financial statements
66
(Thousands of Canadian dollars)
Weighted Fair Value
Notional Average Hierarchy Net Fair Carrying Value
As at December 31, 2019 Volume1 Price Level Value Asset Liability
Marketing (NGLs and Iso-octane) Financial contracts:
Seller of fixed price WTI2 swaps (maturing by December 31, 2020)
4,419,479 Bbls
74.85/Bbl
Level 2 (13,876)
989
(14,865)
Buyer of fixed price WTI2 swaps (maturing by December 31, 2020)
1,116,000 Bbls
73.42/Bbl
Level 2
5,065
5,486
(421)
Seller of fixed price NGL swaps (maturing by December 31, 2020)
1,660,200 Bbls
37.91/Bbl
Level 2
9,651
9,777
(126)
Buyer of fixed price NGL swaps (maturing by December 31, 2020)
1,800,400 Bbls
41.44/Bbl
Level 2
(11,771)
628
(12,399)
Seller of fixed price RBOB3 basis spreads (iso-octane) (maturing by December 31, 2020)
1,920,000 Bbls
19.59/Bbl
Level 2
1,257
3,679
(2,422)
Physical contracts:
Seller of fixed price NGL forward contracts (maturing by January 31, 2020)
130,000 Bbls
24.94/Bbl
Level 2
464
464
—
Buyer of fixed price NGL forward contracts (maturing by January 31, 2020)
105,000 Bbls
27.12/Bbl
Level 2
(533)
—
(533)
Currency:
Seller of forward contracts (maturing by June 30, 2020)
US$146,500,000
1.33/USD
Level 2
4,303
4,303
—
Liquids Infrastructure
Electricity:
Buyer of fixed price swaps (maturing by December 31, 2020)
131,760 MWhs
57.55/MWh
Level 2
144
501
(357)
Corporate and Other
Electricity:
Buyer of fixed price swaps (maturing by December 31, 2020)
43,920 MWhs
56.15/MWh
Level 2
109
199
(90)
Long-term Debt:
Buyer of cross-currency swaps (maturing September 8, 2020 – November 20, 2028 )
US$534,286,100
0.98/USD
- 1.22/USD
Level 2
124,009 124,009
—
118,822
150,035
(31,213)
Notes: 1 All notional amounts represent actual volumes or actual prices and are not expressed in thousands. 2 West Texas Intermediate (“WTI”) crude oil. 3 Reformulated Blendstock for Oxygen Blending (“RBOB”).
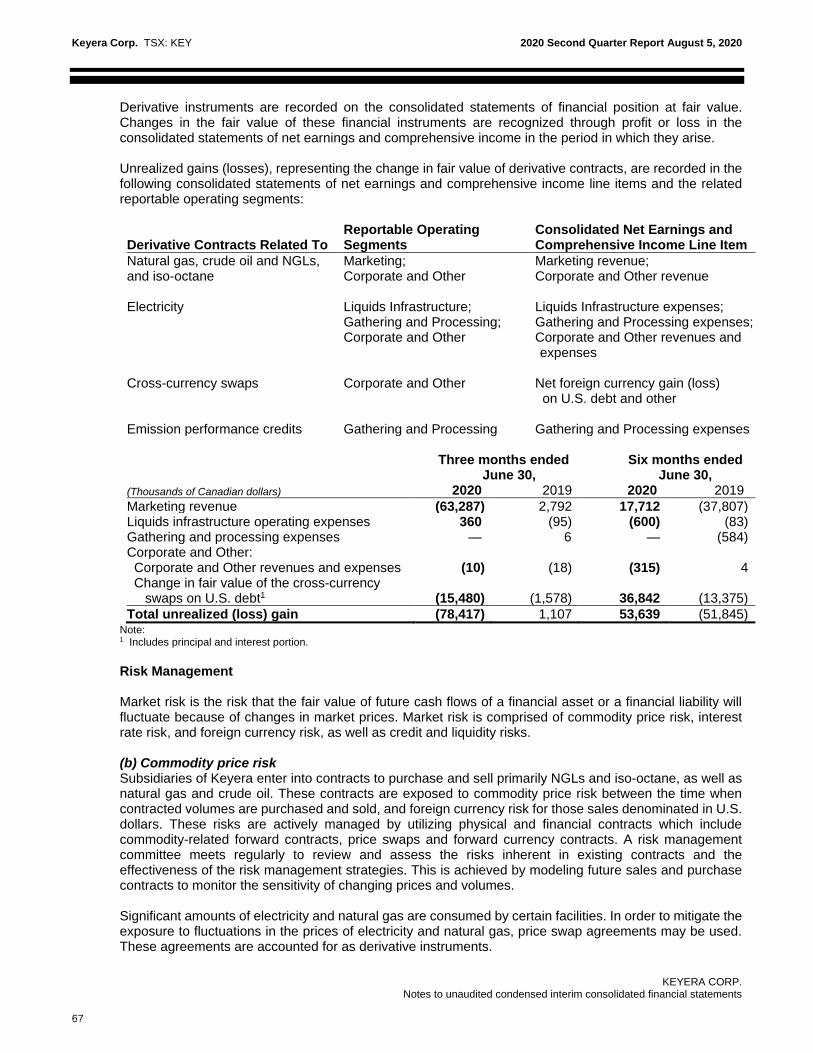
Keyera Corp. TSX: KEY 2020 Second Quarter Report August 5, 2020
KEYERA CORP. Notes to unaudited condensed interim consolidated financial statements
67
Derivative instruments are recorded on the consolidated statements of financial position at fair value. Changes in the fair value of these financial instruments are recognized through profit or loss in the consolidated statements of net earnings and comprehensive income in the period in which they arise. Unrealized gains (losses), representing the change in fair value of derivative contracts, are recorded in the following consolidated statements of net earnings and comprehensive income line items and the related reportable operating segments: Derivative Contracts Related To
Reportable Operating Segments
Consolidated Net Earnings and Comprehensive Income Line Item
Natural gas, crude oil and NGLs, and iso-octane
Marketing; Corporate and Other
Marketing revenue; Corporate and Other revenue
Electricity Liquids Infrastructure; Gathering and Processing; Corporate and Other
Liquids Infrastructure expenses; Gathering and Processing expenses; Corporate and Other revenues and expenses
Cross-currency swaps Corporate and Other Net foreign currency gain (loss)
on U.S. debt and other
Emission performance credits Gathering and Processing Gathering and Processing expenses
Three months ended
June 30, Six months ended
June 30,
(Thousands of Canadian dollars) 2020 2019 2020 2019
Marketing revenue (63,287) 2,792 17,712 (37,807) Liquids infrastructure operating expenses 360 (95) (600) (83) Gathering and processing expenses — 6 — (584) Corporate and Other: Corporate and Other revenues and expenses (10) (18) (315) 4 Change in fair value of the cross-currency
swaps on U.S. debt1 (15,480) (1,578) 36,842 (13,375)
Total unrealized (loss) gain (78,417) 1,107 53,639 (51,845) Note: 1 Includes principal and interest portion.
Risk Management Market risk is the risk that the fair value of future cash flows of a financial asset or a financial liability will fluctuate because of changes in market prices. Market risk is comprised of commodity price risk, interest rate risk, and foreign currency risk, as well as credit and liquidity risks. (b) Commodity price risk Subsidiaries of Keyera enter into contracts to purchase and sell primarily NGLs and iso-octane, as well as natural gas and crude oil. These contracts are exposed to commodity price risk between the time when contracted volumes are purchased and sold, and foreign currency risk for those sales denominated in U.S. dollars. These risks are actively managed by utilizing physical and financial contracts which include commodity-related forward contracts, price swaps and forward currency contracts. A risk management committee meets regularly to review and assess the risks inherent in existing contracts and the effectiveness of the risk management strategies. This is achieved by modeling future sales and purchase contracts to monitor the sensitivity of changing prices and volumes. Significant amounts of electricity and natural gas are consumed by certain facilities. In order to mitigate the exposure to fluctuations in the prices of electricity and natural gas, price swap agreements may be used. These agreements are accounted for as derivative instruments.
Keyera Corp. TSX: KEY 2020 Second Quarter Report August 5, 2020
KEYERA CORP. Notes to unaudited condensed interim consolidated financial statements
68
Certain NGL contracts that require physical delivery at fixed prices are accounted for as derivative instruments. (c) Foreign currency risk Foreign currency risk arises on financial instruments that are denominated in a foreign currency. Keyera’s foreign currency risk largely arises from the Marketing segment where a significant portion of sales and purchases are denominated in U.S. dollars. Foreign currency risk is actively managed by using forward currency contracts and cross-currency swaps. Management monitors the exposure to foreign currency risk and regularly reviews its financial instrument activities and all outstanding positions. The Gathering and Processing and Liquids Infrastructure segments have very little foreign currency risk as sales and purchases are primarily denominated in Canadian dollars. Keyera is also exposed to foreign currency risk related to its U.S. dollar denominated long-term debt and U.S. dollar denominated LIBOR loans when drawn under Keyera’s bank credit facility. To manage this currency exposure, Keyera has entered into long-term cross-currency swap contracts relating to the principal portion and future interest payments of the U.S. dollar denominated debt as well as short-term cross-currency swaps relating to the LIBOR loans drawn under the credit facility. These cross-currency contracts are accounted for as derivative instruments. Refer to note 13 for a summary of the foreign currency gains (losses) associated with the U.S. dollar denominated long-term debt. (d) Interest rate risk The majority of Keyera’s interest rate risk is attributed to its fixed and floating rate debt, which is used to finance capital investments and operations. Keyera’s remaining financial instruments are not significantly exposed to interest rate risk. The floating rate debt creates exposure to interest rate cash flow risk, whereas the fixed rate debt creates exposure to interest rate price risk. As at June 30, 2020, fixed rate borrowings comprised 100% of total debt outstanding (December 31, 2019 – 97%). The fair value of future cash flows for fixed rate debt fluctuates with changes in market interest rates. It is Keyera’s intention to not repay fixed rate debt until maturity and therefore future cash flows would not fluctuate. (e) Credit risk The majority of trade and other receivables are due from entities in the oil and gas industry and are subject to normal industry credit risks. Concentration of credit risk is mitigated by having a broad domestic and international customer base. Keyera evaluates and monitors the financial strength of its customers in accordance with its credit policy. Keyera does not typically renegotiate the terms of trade receivables. There were no significant renegotiated balances outstanding at June 30, 2020. With respect to counterparties for derivative financial instruments, the credit risk is managed through dealing primarily with recognized futures exchanges or investment grade financial institutions and by maintaining credit policies which significantly reduce overall counterparty credit risk. In addition, Keyera incorporates the credit risk associated with counterparty default, as well as Keyera’s own credit risk, into the estimates of fair value. The allowance for credit losses is reviewed on a monthly basis. An assessment is made whether an account is deemed impaired based on expected credit losses, which includes the number of days outstanding and the likelihood of collection from the counterparty. As a result of the recent decline in economic conditions, during the first quarter of 2020, Keyera increased its allowance for expected credit losses by $2,500. During the second quarter of 2020, it was determined that a further increase to the allowance was not required. As at June 30, 2020, the total allowance was $4,241 (December 31, 2019 – $1,741). The carrying amount of financial assets on the consolidated statements of financial position approximates Keyera’s maximum exposure to credit risk.
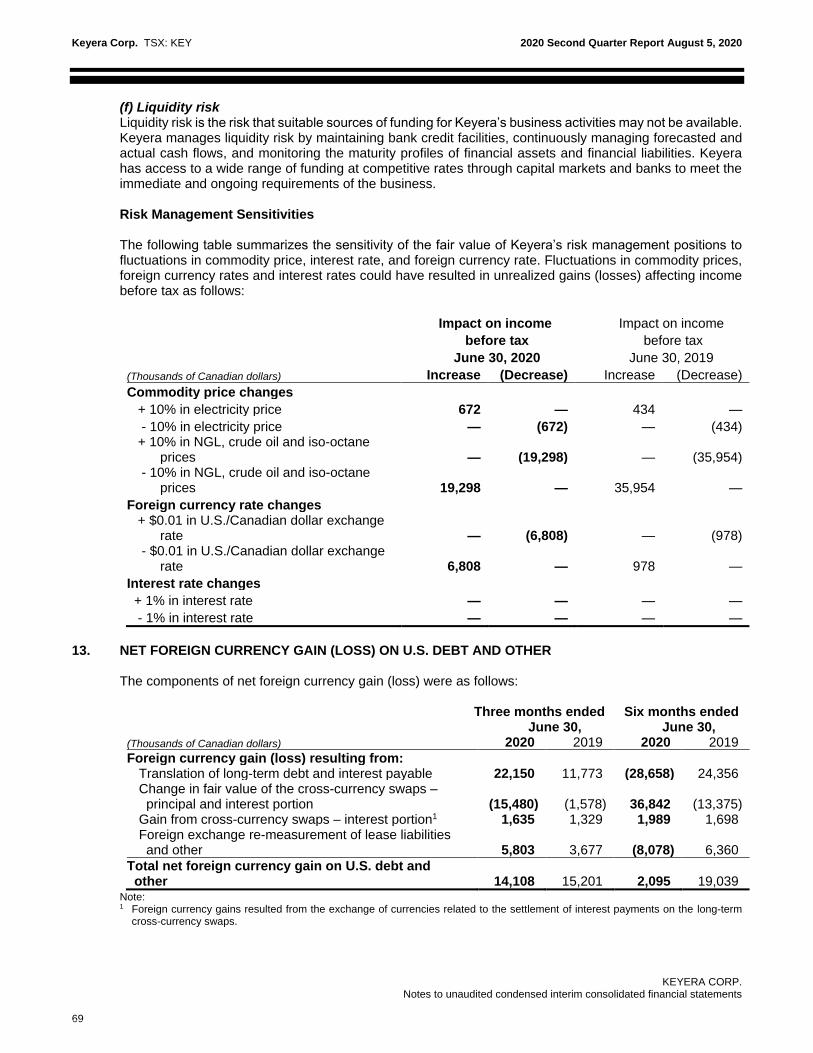
Keyera Corp. TSX: KEY 2020 Second Quarter Report August 5, 2020
KEYERA CORP. Notes to unaudited condensed interim consolidated financial statements
69
(f) Liquidity risk Liquidity risk is the risk that suitable sources of funding for Keyera’s business activities may not be available. Keyera manages liquidity risk by maintaining bank credit facilities, continuously managing forecasted and actual cash flows, and monitoring the maturity profiles of financial assets and financial liabilities. Keyera has access to a wide range of funding at competitive rates through capital markets and banks to meet the immediate and ongoing requirements of the business. Risk Management Sensitivities The following table summarizes the sensitivity of the fair value of Keyera’s risk management positions to fluctuations in commodity price, interest rate, and foreign currency rate. Fluctuations in commodity prices, foreign currency rates and interest rates could have resulted in unrealized gains (losses) affecting income before tax as follows:
Impact on income Impact on income
before tax before tax
June 30, 2020 June 30, 2019
(Thousands of Canadian dollars) Increase (Decrease) Increase (Decrease)
Commodity price changes
+ 10% in electricity price 672 — 434 —
- 10% in electricity price — (672) — (434) + 10% in NGL, crude oil and iso-octane prices — (19,298) — (35,954) - 10% in NGL, crude oil and iso-octane prices 19,298 — 35,954 —
Foreign currency rate changes + $0.01 in U.S./Canadian dollar exchange
rate
—
(6,808)
—
(978) - $0.01 in U.S./Canadian dollar exchange rate
6,808 —
978 —
Interest rate changes
+ 1% in interest rate — — — —
- 1% in interest rate — — — —
13. NET FOREIGN CURRENCY GAIN (LOSS) ON U.S. DEBT AND OTHER
The components of net foreign currency gain (loss) were as follows:
Three months ended June 30,
Six months ended June 30,
(Thousands of Canadian dollars) 2020 2019 2020 2019
Foreign currency gain (loss) resulting from: Translation of long-term debt and interest payable 22,150 11,773 (28,658) 24,356 Change in fair value of the cross-currency swaps – principal and interest portion (15,480) (1,578)
36,842
(13,375)
Gain from cross-currency swaps – interest portion1 1,635 1,329 1,989 1,698 Foreign exchange re-measurement of lease liabilities and other 5,803 3,677 (8,078) 6,360
Total net foreign currency gain on U.S. debt and other 14,108 15,201 2,095 19,039
Note: 1 Foreign currency gains resulted from the exchange of currencies related to the settlement of interest payments on the long-term
cross-currency swaps.

Keyera Corp. TSX: KEY 2020 Second Quarter Report August 5, 2020
KEYERA CORP. Notes to unaudited condensed interim consolidated financial statements
70
14. FINANCE COSTS The components of finance costs were as follows:
Three months ended
June 30, Six months ended
June 30,
(Thousands of Canadian dollars)
2020
2019 (Restated)
Note 2
2020
2019 (Restated)
Note 2 Interest on bank indebtedness and credit facilities 1,547 4,060 3,359 7,048 Interest on long-term debt 34,911 25,584 68,279 49,127 Interest capitalized (11,642) (7,194) (21,620) (19,136) Interest on leases 2,624 2,867 5,151 4,928 Other interest income (138) (71) (71) (124)
Total interest expense on leases, and current and long-term debt 27,302 25,246 55,098 41,843 Unwinding of discount on decommissioning liabilities 2,791 2,786 5,478 5,572 Unwinding of discount on long-term debt 482 466 964 936 Other 166 769 337 769
Non-cash expenses in finance costs 3,439 4,021 6,779 7,277
Total finance costs 30,741 29,267 61,877 49,120
For the three and six months ended June 30, 2020, $11,642 and $21,620 of borrowing (interest) costs were capitalized (three and six months ended June 30, 2019 – $7,194 and $19,136) at a weighted average capitalization rate of 5.0% on funds borrowed (three and six months ended June 30, 2019 – 4.8%).
15. SUPPLEMENTAL CASH FLOW INFORMATION
Details of changes in non-cash working capital from operating activities were as follows:
Three months ended June 30,
Six months ended June 30,
(Thousands of Canadian dollars) 2020 2019 2020 2019
Inventory (46,673) 50,698 (19,251) 99,704 Trade and other receivables 37,987 (15,420) 162,486 7,153
Other assets (19,265) (12,534) (16,493) (13,876) Trade and other payables, and provisions 10,232 (28,937) (114,125) (3,931)
Changes in non-cash working capital from operating activities (17,719) (6,193) 12,617 89,050
Details of changes in non-cash working capital from investing activities were as follows:
Three months ended June 30,
Six months ended June 30,
(Thousands of Canadian dollars) 2020 2019 2020 2019
Trade and other payables, and provisions (51,326) (22,777) (51,173) 11,255
Changes in non-cash working capital from investing activities (51,326) (22,777) (51,173) 11,255

Keyera Corp. TSX: KEY 2020 Second Quarter Report August 5, 2020
KEYERA CORP. Notes to unaudited condensed interim consolidated financial statements
71
16. SEGMENT INFORMATION
Keyera has the following four reportable operating segments based on the nature of its business activities: Gathering and Processing The Gathering and Processing segment includes raw gas gathering systems and processing plants located in the natural gas production areas primarily on the western side of the Western Canada Sedimentary Basin. The operations primarily involve providing natural gas gathering and processing, including liquids extraction and condensate stabilization services to customers. This segment also includes sales of ethane volumes extracted from the Rimbey facility and sold to a third-party customer under a long-term commercial arrangement. Liquids Infrastructure The Liquids Infrastructure segment provides fractionation, storage, transportation and terminalling services for NGLs and crude oil. As well, it provides processing services to Keyera’s Marketing business related to NGLs, iso-octane and liquids blending. These services are provided to customers through an extensive network of facilities that include underground NGL storage caverns, NGL fractionation and de-ethanization facilities, NGL pipelines, rail and truck terminals, the AEF facility, a 50% interest in the Base Line Terminal, and the Oklahoma Liquids Terminal. Marketing The Marketing segment is primarily involved in the marketing of NGLs, such as propane, butane, and condensate; and iso-octane to customers in Canada and the United States, as well as liquids blending. Corporate and Other The Corporate and Other segment includes corporate functions and the production of natural gas, NGLs and crude oil.
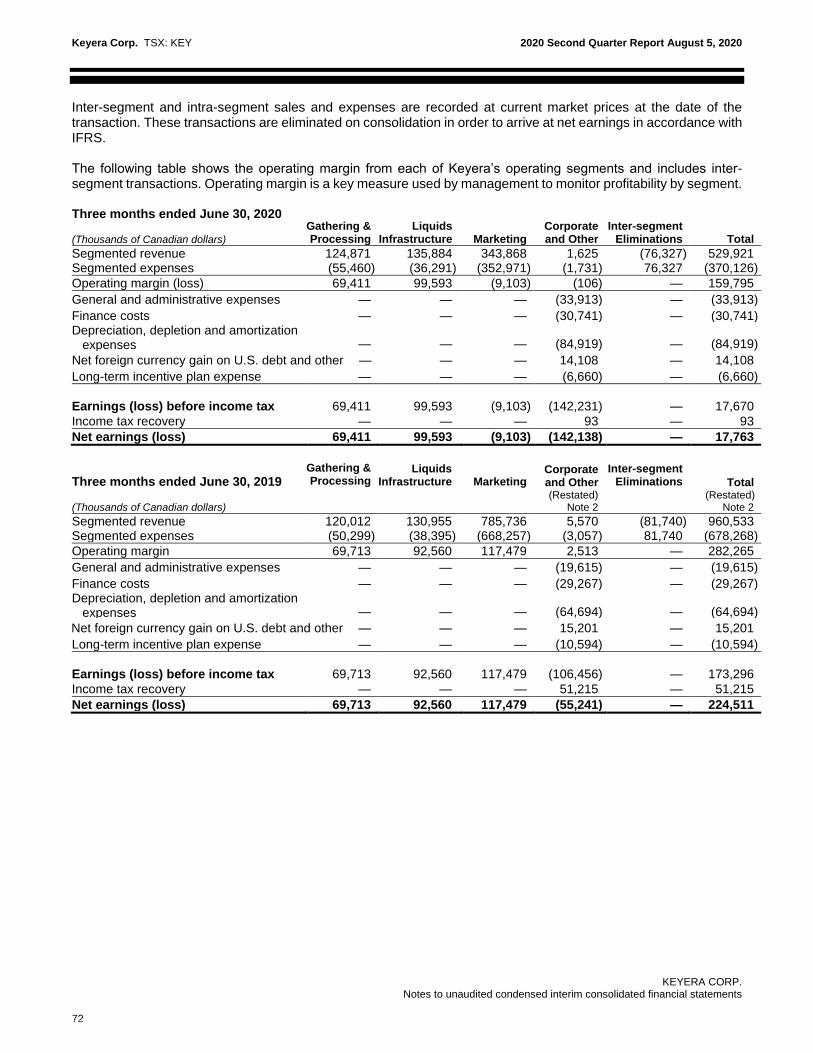
Keyera Corp. TSX: KEY 2020 Second Quarter Report August 5, 2020
KEYERA CORP. Notes to unaudited condensed interim consolidated financial statements
72
Inter-segment and intra-segment sales and expenses are recorded at current market prices at the date of the transaction. These transactions are eliminated on consolidation in order to arrive at net earnings in accordance with IFRS. The following table shows the operating margin from each of Keyera’s operating segments and includes inter-segment transactions. Operating margin is a key measure used by management to monitor profitability by segment. Three months ended June 30, 2020 (Thousands of Canadian dollars)
Gathering & Processing
Liquids Infrastructure Marketing
Corporate and Other
Inter-segment Eliminations
Total
Segmented revenue 124,871 135,884 343,868 1,625 (76,327) 529,921 Segmented expenses (55,460) (36,291) (352,971) (1,731) 76,327 (370,126)
Operating margin (loss) 69,411 99,593 (9,103) (106) — 159,795
General and administrative expenses — — — (33,913) — (33,913)
Finance costs — — — (30,741) — (30,741) Depreciation, depletion and amortization expenses — — — (84,919) — (84,919)
Net foreign currency gain on U.S. debt and other — — — 14,108 — 14,108
Long-term incentive plan expense — — — (6,660) — (6,660)
Earnings (loss) before income tax 69,411 99,593 (9,103) (142,231) — 17,670
Income tax recovery — — — 93 — 93
Net earnings (loss) 69,411 99,593 (9,103) (142,138) — 17,763
Three months ended June 30, 2019
(Thousands of Canadian dollars)
Gathering & Processing
Liquids Infrastructure
Marketing
Corporate and Other (Restated)
Note 2
Inter-segment Eliminations
Total
(Restated) Note 2
Segmented revenue 120,012 130,955 785,736 5,570 (81,740) 960,533 Segmented expenses (50,299) (38,395) (668,257) (3,057) 81,740 (678,268)
Operating margin 69,713 92,560 117,479 2,513 — 282,265
General and administrative expenses — — — (19,615) — (19,615)
Finance costs — — — (29,267) — (29,267) Depreciation, depletion and amortization expenses — — — (64,694) — (64,694)
Net foreign currency gain on U.S. debt and other — — — 15,201 — 15,201
Long-term incentive plan expense — — — (10,594) — (10,594)
Earnings (loss) before income tax 69,713 92,560 117,479 (106,456) — 173,296
Income tax recovery — — — 51,215 — 51,215
Net earnings (loss) 69,713 92,560 117,479 (55,241) — 224,511

Keyera Corp. TSX: KEY 2020 Second Quarter Report August 5, 2020
KEYERA CORP. Notes to unaudited condensed interim consolidated financial statements
73
Six months ended June 30, 2020 (Thousands of Canadian dollars)
Gathering & Processing
Liquids Infrastructure Marketing
Corporate and Other
Inter-segment Eliminations
Total
Segmented revenue 253,630 280,671 1,217,031 5,111 (166,223) 1,590,220 Segmented expenses (119,748) (78,956) (980,111) (5,150) 166,223 (1,017,742)
Operating margin (loss) 133,882 201,715 236,920 (39) — 572,478
General and administrative expenses — — — (56,674) — (56,674)
Finance costs — — — (61,877) — (61,877) Depreciation, depletion and amortization expenses — — — (137,149) — (137,149)
Net foreign currency gain on U.S. debt and other — — — 2,095 — 2,095
Long-term incentive plan recovery — — — 10,267 — 10,267
Impairment expense (194,001) — — — — (194,001)
Earnings (loss) before income tax (60,119) 201,715 236,920 (243,377) — 135,139
Income tax expense — — — (31,768) — (31,768)
Net earnings (loss) (60,119) 201,715 236,920 (275,145) — 103,371
Six months ended June 30, 2019
(Thousands of Canadian dollars)
Gathering & Processing
Liquids Infrastructure
Marketing
Corporate and Other
(Restated) Note 2
Inter-segment Eliminations
Total
(Restated) Note 2
Segmented revenue 236,659 263,776 1,451,717 12,057 (166,930) 1,797,279 Segmented expenses (98,624) (76,766) (1,352,366) (6,163) 166,930 (1,366,989)
Operating margin 138,035 187,010 99,351 5,894 — 430,290
General and administrative expenses — — — (38,875) — (38,875)
Finance costs — — — (49,120) — (49,120) Depreciation, depletion and amortization expenses — — — (126,123) — (126,123)
Net foreign currency gain on U.S. debt and other — — — 19,039 — 19,039
Long-term incentive plan expense — — — (16,104) — (16,104)
Earnings (loss) before income tax 138,035 187,010 99,351 (205,289) — 219,107
Income tax recovery — — — 40,356 — 40,356
Net earnings (loss) 138,035 187,010 99,351 (164,933) — 259,463

Keyera Corp. TSX: KEY 2020 Second Quarter Report August 5, 2020
KEYERA CORP. Notes to unaudited condensed interim consolidated financial statements
74
DISAGGREGATION OF REVENUE The following table shows revenue disaggregated by the major service lines offered by Keyera in its four reportable operating segments:
Three months ended June 30, 2020
(Thousands of Canadian dollars)
Gathering & Processing
Liquids Infrastructure Marketing
Corporate and Other
Total
Gas handling and processing services1 108,771 23,608 — — 132,379 Fractionation and storage services 2,847 59,960 — — 62,807 Transportation and terminalling services — 51,990 — — 51,990 Marketing of NGLs and iso-octane — — 343,868 — 343,868 Other2 13,253 326 — 1,625 15,204
Revenue before inter-segment eliminations 124,871 135,884 343,868 1,625 606,248
Inter-segment revenue eliminations (3,964) (67,139) (3,293) (1,931) (76,327)
Revenue from external customers 120,907 68,745 340,575 (306) 529,921
Three months ended June 30, 2019
(Thousands of Canadian dollars)
Gathering & Processing
Liquids Infrastructure Marketing
Corporate and Other
Total
Gas handling and processing services1 104,132 24,274 — — 128,406 Fractionation and storage services 2,742 53,889 — — 56,631 Transportation and terminalling services — 52,312 — — 52,312 Marketing of NGLs and iso-octane — — 785,736 — 785,736 Other2 13,138 480 — 5,570 19,188
Revenue before inter-segment eliminations 120,012 130,955 785,736 5,570 1,042,273
Inter-segment revenue eliminations (5,290) (68,165) (3,213) (5,072) (81,740)
Revenue from external customers 114,722 62,790 782,523 498 960,533 Notes: 1 Processing services revenue recognized in Keyera’s Liquids Infrastructure segment represents the processing fees charged to Keyera’s
Marketing segment for the production of iso-octane at the Keyera AEF facility. 2 Other revenue in Keyera’s Gathering and Processing segment includes sales of ethane volumes extracted from the Rimbey facility and sold
to a third-party customer, and other miscellaneous revenue. Other revenue recognized in Keyera’s Corporate and Other segment relates to the production of oil and gas reserves.

Keyera Corp. TSX: KEY 2020 Second Quarter Report August 5, 2020
KEYERA CORP. Notes to unaudited condensed interim consolidated financial statements
75
Six months ended June 30, 2020
(Thousands of Canadian dollars)
Gathering & Processing
Liquids Infrastructure Marketing
Corporate and Other
Total
Gas handling and processing services1 216,555 49,594 — — 266,149 Fractionation and storage services 6,264 118,384 — — 124,648 Transportation and terminalling services — 112,037 — — 112,037 Marketing of NGLs and iso-octane — — 1,217,031 — 1,217,031 Other2 30,811 656 — 5,111 36,578
Revenue before inter-segment eliminations 253,630 280,671 1,217,031 5,111 1,756,443
Inter-segment revenue eliminations (10,065) (142,586) (8,060) (5,512) (166,223)
Revenue from external customers 243,565 138,085 1,208,971 (401) 1,590,220
Six months ended June 30, 2019
(Thousands of Canadian dollars)
Gathering & Processing
Liquids Infrastructure Marketing
Corporate and Other
Total
Gas handling and processing services1 204,612 49,161 — — 253,773 Fractionation and storage services 4,526 109,005 — — 113,531 Transportation and terminalling services — 104,806 — — 104,806 Marketing of NGLs and iso-octane — — 1,451,717 — 1,451,717 Other2 27,521 804 — 12,057 40,382
Revenue before inter-segment eliminations 236,659 263,776 1,451,717 12,057 1,964,209
Inter-segment revenue eliminations (10,156) (137,243) (6,969) (12,562) (166,930)
Revenue from external customers 226,503 126,533 1,444,748 (505) 1,797,279 Notes: 1 Processing services revenue recognized in Keyera’s Liquids Infrastructure segment represents the processing fees charged to Keyera’s
Marketing segment for the production of iso-octane at the Keyera AEF facility. 2 Other revenue in Keyera’s Gathering and Processing segment includes sales of ethane volumes extracted from the Rimbey facility and sold
to a third-party customer, and other miscellaneous revenue. Other revenue recognized in Keyera’s Corporate and Other segment relates to the production of oil and gas reserves.
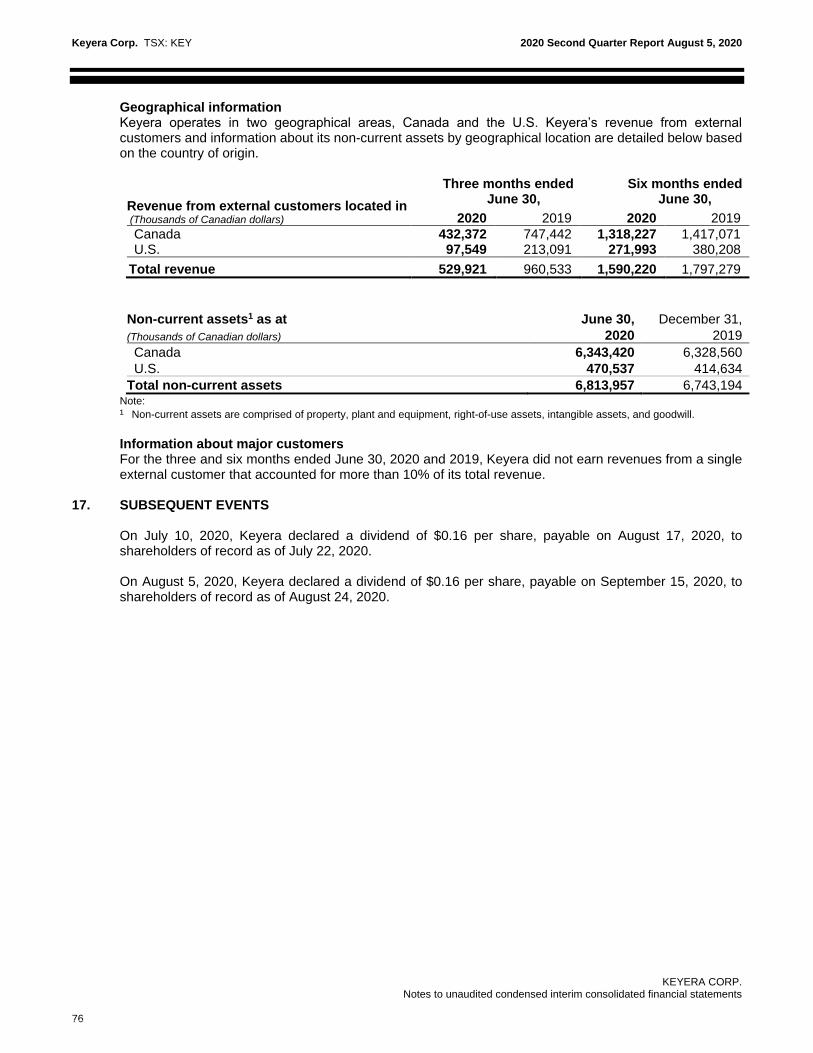
Keyera Corp. TSX: KEY 2020 Second Quarter Report August 5, 2020
KEYERA CORP. Notes to unaudited condensed interim consolidated financial statements
76
Geographical information Keyera operates in two geographical areas, Canada and the U.S. Keyera’s revenue from external customers and information about its non-current assets by geographical location are detailed below based on the country of origin.
Revenue from external customers located in (Thousands of Canadian dollars)
Three months ended June 30,
Six months ended June 30,
2020 2019 2020 2019
Canada 432,372 747,442 1,318,227 1,417,071 U.S. 97,549 213,091 271,993 380,208
Total revenue 529,921 960,533 1,590,220 1,797,279
Non-current assets1 as at June 30, December 31,
(Thousands of Canadian dollars) 2020 2019
Canada 6,343,420 6,328,560
U.S. 470,537 414,634
Total non-current assets 6,813,957 6,743,194 Note:
¹ Non-current assets are comprised of property, plant and equipment, right-of-use assets, intangible assets, and goodwill.
Information about major customers For the three and six months ended June 30, 2020 and 2019, Keyera did not earn revenues from a single external customer that accounted for more than 10% of its total revenue.
17. SUBSEQUENT EVENTS On July 10, 2020, Keyera declared a dividend of $0.16 per share, payable on August 17, 2020, to shareholders of record as of July 22, 2020. On August 5, 2020, Keyera declared a dividend of $0.16 per share, payable on September 15, 2020, to shareholders of record as of August 24, 2020.

Keyera Corp. TSX: KEY 2020 Second Quarter Report August 5, 2020
KEYERA CORP. Notes to unaudited condensed interim consolidated financial statements
77
Corporate Information Board of Directors
Officers
Jim V. Bertram (1)
Corporate Director
Calgary, Alberta
Douglas Haughey (2)(4)
Corporate Director
Calgary, Alberta
Blair Goertzen (5)
Corporate Director
Red Deer, Alberta
Gianna Manes (5)
President and CEO
ENMAX Corporation
Fort Mill, South Carolina
Donald J. Nelson (4)(5)
President
Fairway Resources Inc.
Calgary, Alberta
Michael Norris (3)
Corporate Director
Toronto, Ontario
Thomas C. O’Connor (3)
Corporate Director
Denver, Colorado
Charlene Ripley (4)
Executive Vice President
and General Counsel
SNC-Lavalin
Corporate Director
Vancouver, British Columbia David G. Smith Chief Executive Officer Keyera Corp.
Calgary, Alberta
Janet Woodruff (3)
Corporate Director
West Vancouver, British Columbia
(1) Chair of the Board (2) Independent Lead Director (3) Member of the Audit Committee (4) Member of the Compensation and Governance Committee (5) Member of the Health, Safety and Environment Committee
Head Office Keyera Corp.
Suite 200, Sun Life Plaza West Tower
144 – 4th Avenue S.W.
Calgary, Alberta T2P 3N4
Main phone: 403-205-8300
Website: www.keyera.com
David G. Smith Chief Executive Officer C. Dean Setoguchi President and Chief Commercial Officer Bradley W. Lock Senior Vice President and Chief Operating Officer Eileen Marikar Senior Vice President and Chief Financial Officer Nancy Brennan Senior Vice President, General Counsel and Corporate Secretary Dion O. Kostiuk Senior Vice President, Human Resources and Corporate Services Jarrod Beztilny Vice President, Operations, Gathering and Processing Kelly Hill Vice President, Information Technology John Hunszinger Vice President, Operations, Liquids Infrastructure Brian Martin Vice President, Business Development Bradley Slessor Vice President, New Ventures and U.S. Operations Jamie Urquhart Vice President, Marketing
Stock Exchange Listing The Toronto Stock Exchange Trading Symbol KEY
Trading Summary for Q2 2020
TSX:KEY – Cdn $
High $23.59
Low $12.43
Close June 30, 2020 $20.67
Volume 86,804,907
Average Daily Volume
1,377,856
Auditors Deloitte LLP
Chartered Professional Accountants
Calgary, Canada
Investor Relations Contact:
Lavonne Zdunich or Calvin Locke
Toll Free: 1-888-699-4853
Direct: 403-205-7670
Email: [email protected]
Related Documents