l Submitted to: Naval Facilities Engineering Command Atlantic under Contract No. N62470-15-D-8006, Task Order 33, issued to HDR, Inc. Submitted by: Virginia Beach, VA August 2017 Mid-Atlantic Humpback Whale Monitoring, Virginia Beach, Virginia: 2016/17 Annual Progress Report Prepared by Jessica M. Aschettino 1 , Dan Engelhaupt 1 , Amy Engelhaupt 2 and Michael Richlen 1 1 HDR Virginia Beach, Virginia 2 Amy Engelhaupt Consulting Virginia Beach, Virginia

Welcome message from author
This document is posted to help you gain knowledge. Please leave a comment to let me know what you think about it! Share it to your friends and learn new things together.
Transcript
l
Submitted to:
Naval Facilities Engineering Command Atlantic under Contract No. N62470-15-D-8006, Task Order 33, issued to HDR, Inc.
Submitted by:
Virginia Beach, VA
August 2017
Mid-Atlantic Humpback Whale Monitoring,
Virginia Beach, Virginia:
2016/17 Annual Progress Report
Prepared by
Jessica M. Aschettino1, Dan Engelhaupt1, Amy Engelhaupt2 and Michael Richlen1 1HDR Virginia Beach, Virginia 2Amy Engelhaupt Consulting Virginia Beach, Virginia
Suggested Citation:
Aschettino, J.M., D. Engelhaupt, A. Engelhaupt, and M. Richlen. 2017. Mid-Atlantic Humpback Whale Monitoring, Virginia Beach, Virginia: 2016/17 Annual Progress Report. Prepared for U.S. Fleet Forces Command. Submitted to Naval Facilities Engineering Command Atlantic, Norfolk, Virginia, under Contract N62470-15-8006, Task Order 33, issued to HDR, Inc., Virginia Beach, Virginia. August 2017.
Cover Photo Credit:
Humpback whale (Megaptera novaeangliae) breaching off the coast of Virginia Beach, Virginia. Cover photo by Amy Engelhaupt.
This project is funded by U.S. Fleet Forces Command and managed by Naval Facilities Engineering Command Atlantic as part of the U.S. Navy’s marine species monitoring program.
DoN | Mid-Atlantic Humpback Whale Monitoring, Virginia Beach, VA: 2016/17 Annual Progress Report
August 2017 | i
Table of Contents
Acronyms and Abbreviations .................................................................................................iii
1. Introduction and Background .......................................................................................... 1
2. Methods ............................................................................................................................. 2
3. Results ............................................................................................................................... 6
4. Discussion .......................................................................................................................43
5. Acknowledgements .........................................................................................................46
6. References .......................................................................................................................47
Appendix
Appendix A: Stable Isotope Analysis of Humpback and Fin Whales off Virginia Beach, Virginia
Figures
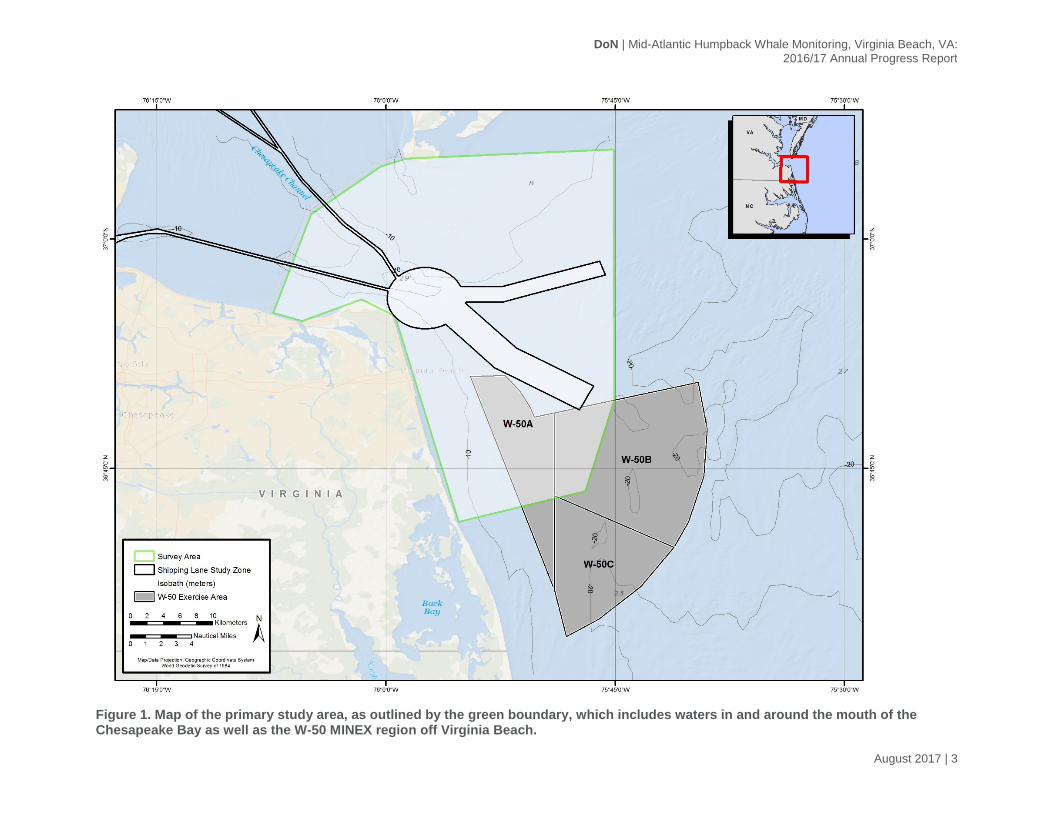
Figure 1. Map of the primary study area, as outlined by the green boundary, which includes waters in and around the mouth of the Chesapeake Bay as well as the W-50 MINEX region off Virginia Beach. .................................................................................................. 3
Figure 2. Nearshore survey vessel, Whale Research. Photo © Brian Lockwood. ....................... 4 Figure 3. LIMPET SPOT-6 tag being deployed on a humpback whale. ...................................... 6 Figure 4. Survey tracks and locations of all humpback (n=168), minke (n=3), and
unidentified large baleen whale (n=1) sightings: November 2016–March 2017. ...............13 Figure 5. Filtered locations (white dots) and track of humpback whale HDRVAMn071 over
6.7 days of tag-attachment duration. ................................................................................17 Figure 6. Filtered locations (white dots) and track of humpback whale HDRVAMn069 over
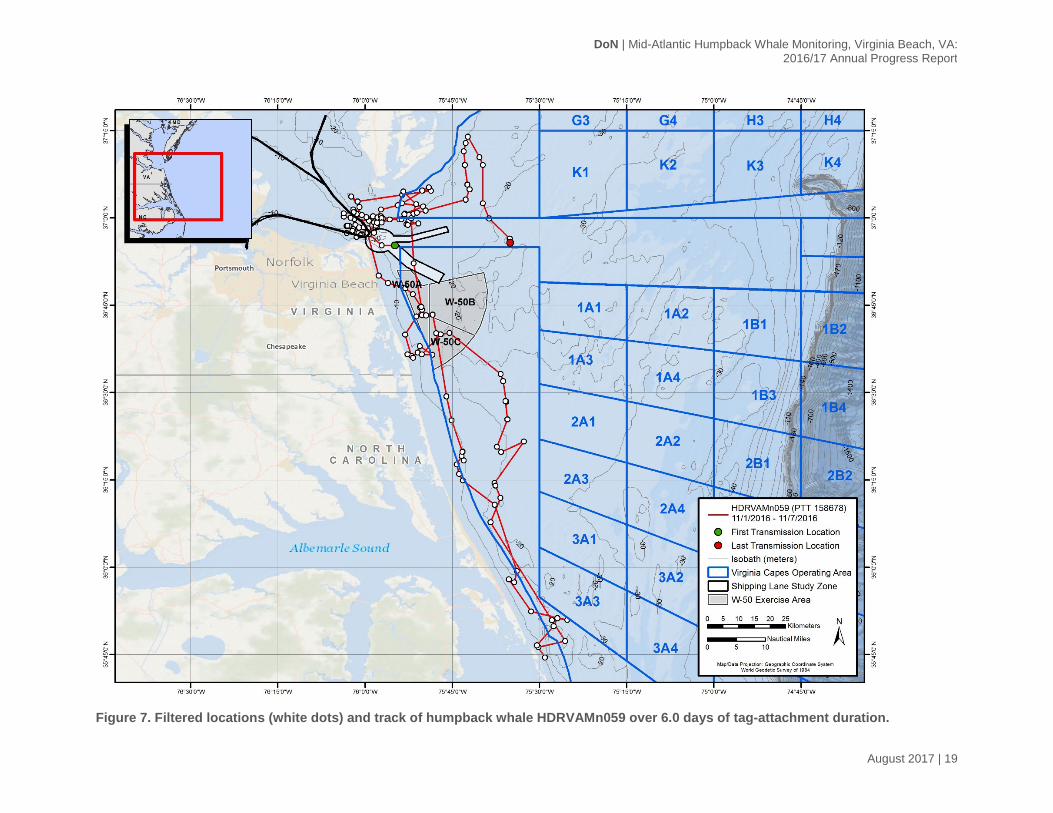
2.6 days of tag-attachment duration. ................................................................................18 Figure 7. Filtered locations (white dots) and track of humpback whale HDRVAMn059 over
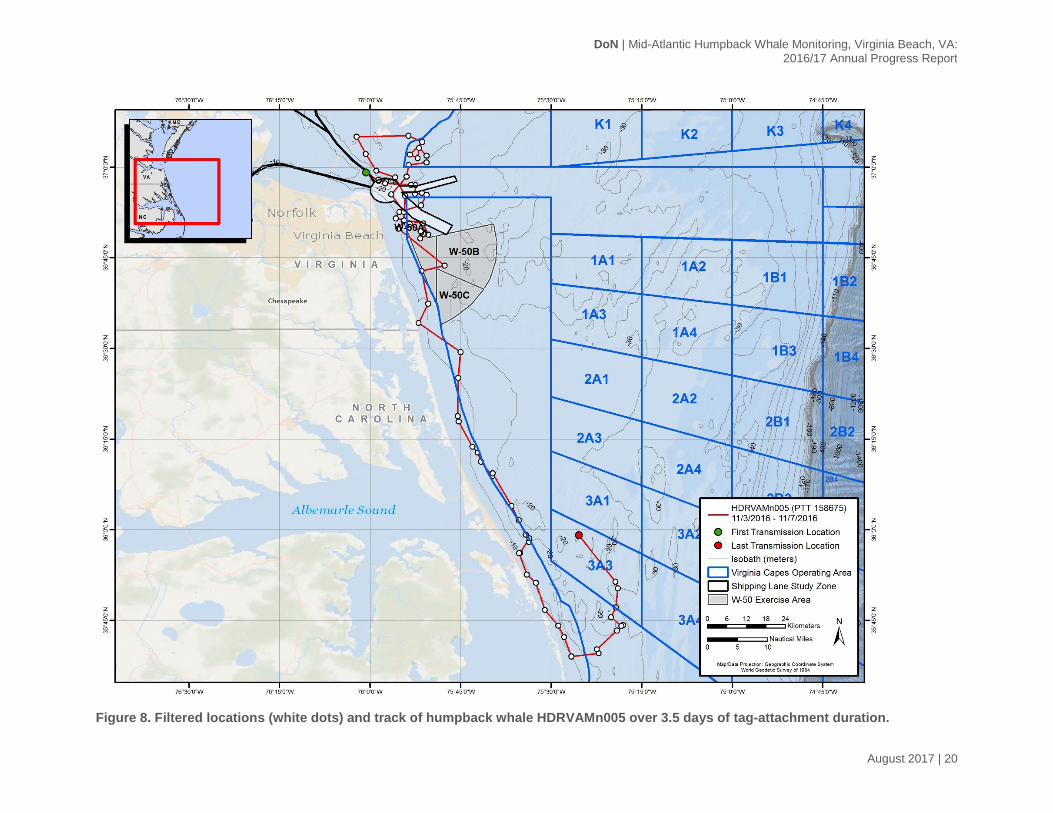
6.0 days of tag-attachment duration. ................................................................................19 Figure 8. Filtered locations (white dots) and track of humpback whale HDRVAMn005 over
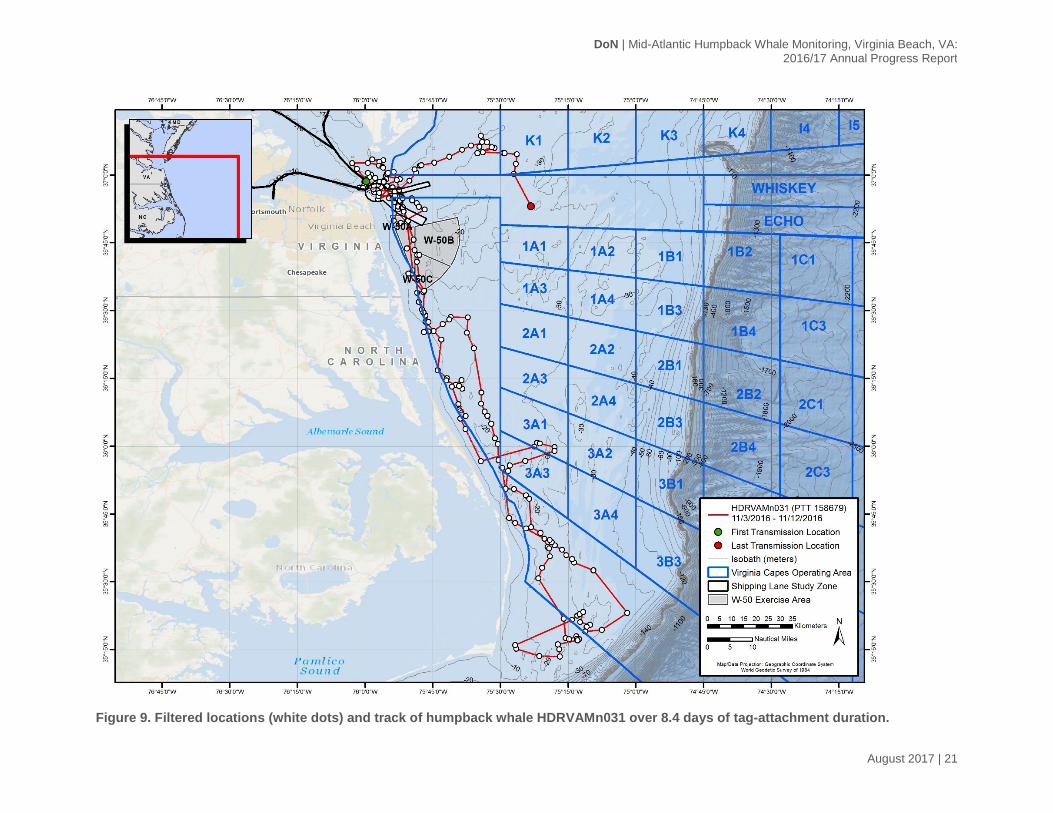
3.5 days of tag-attachment duration. ................................................................................20 Figure 9. Filtered locations (white dots) and track of humpback whale HDRVAMn031 over
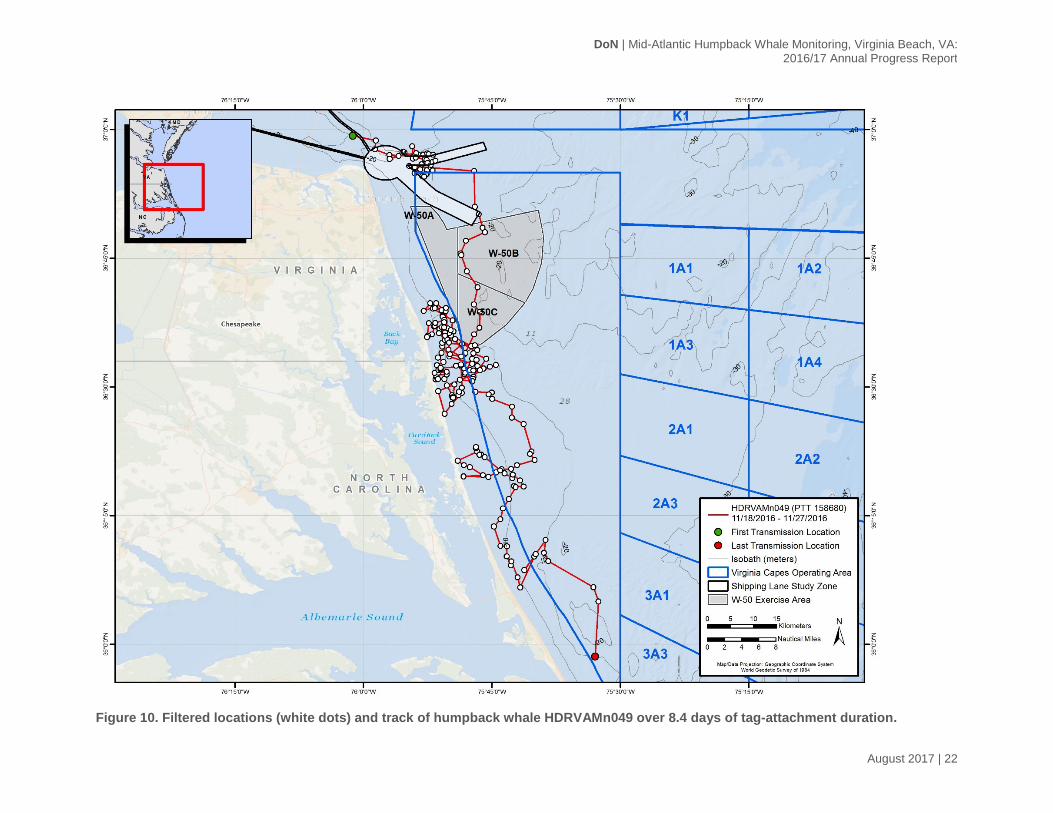
8.4 days of tag-attachment duration. ................................................................................21 Figure 10. Filtered locations (white dots) and track of humpback whale HDRVAMn049 over
8.4 days of tag-attachment duration. ................................................................................22 Figure 11. Filtered locations (white dots) and track of humpback whale HDRVAMn064 over
9.3 days of tag-attachment duration. ................................................................................23 Figure 12. Filtered locations (white dots) and track of humpback whale HDRVAMn012 over
8.4 days of tag-attachment duration. ................................................................................24

DoN | Mid-Atlantic Humpback Whale Monitoring, Virginia Beach, VA: 2016/17 Annual Progress Report
August 2017 | ii
Figure 13. Filtered locations (white dots) and track of humpback whale HDRVAMn082 over 12.9 days of tag-attachment duration. ..............................................................................25
Figure 14. Filtered locations (white dots) and track of humpback whale HDRVAMn084 over 19.6 days of tag-attachment duration. ..............................................................................26
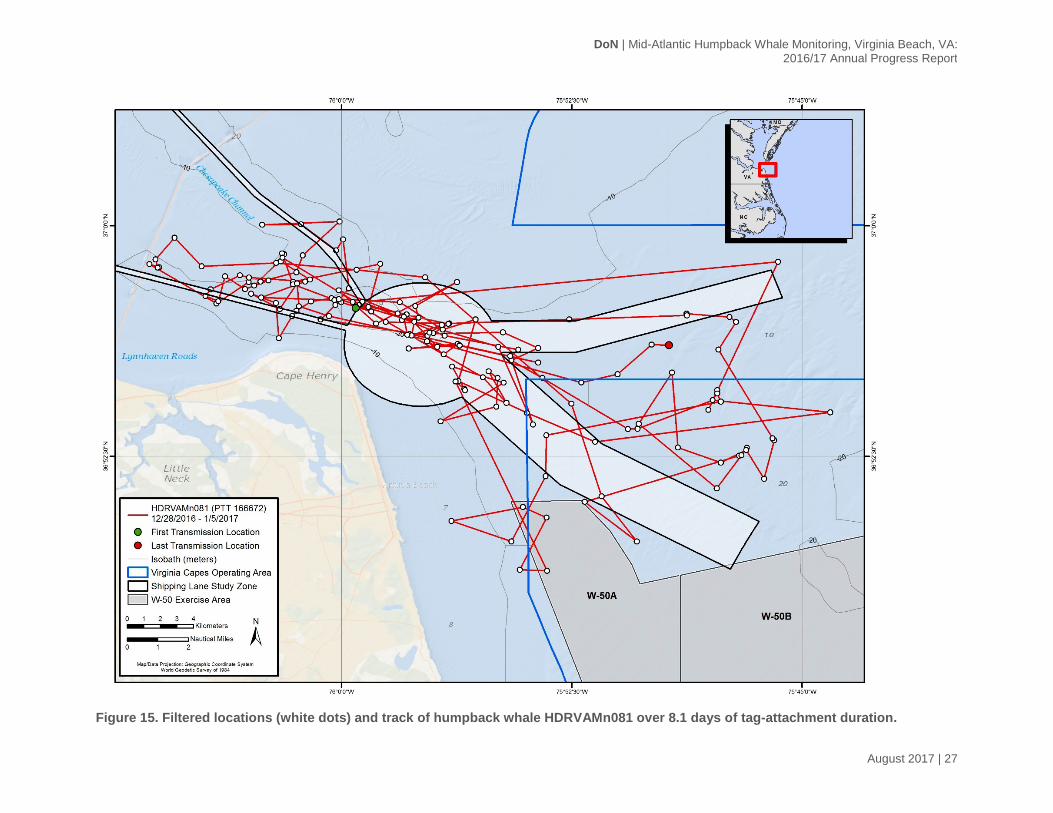
Figure 15. Filtered locations (white dots) and track of humpback whale HDRVAMn081 over 8.1 days of tag-attachment duration. ................................................................................27
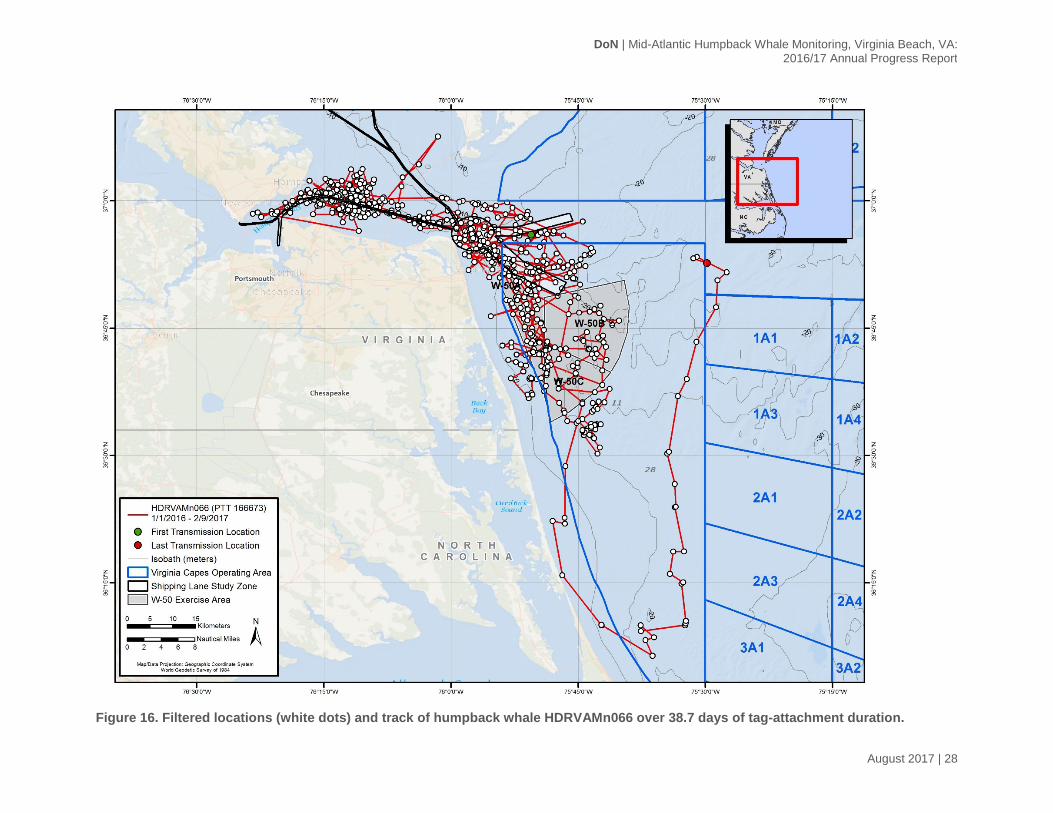
Figure 16. Filtered locations (white dots) and track of humpback whale HDRVAMn066 over 38.7 days of tag-attachment duration. ..............................................................................28
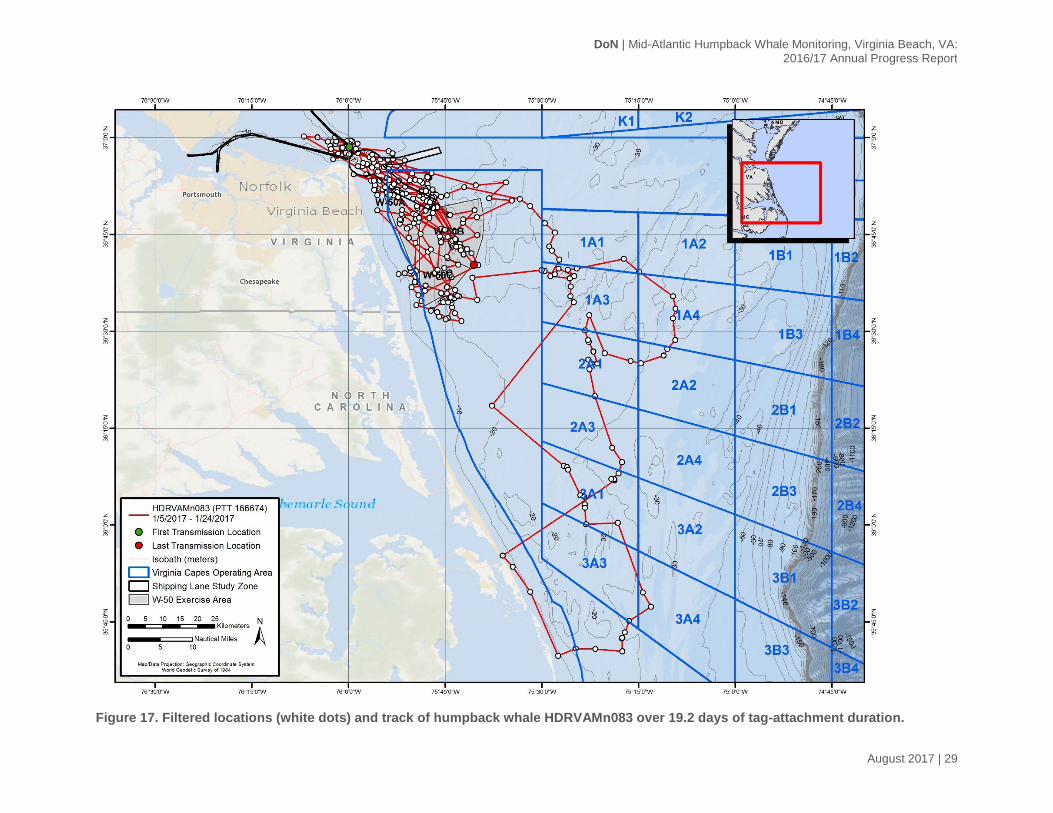
Figure 17. Filtered locations (white dots) and track of humpback whale HDRVAMn083 over 19.2 days of tag-attachment duration. ..............................................................................29
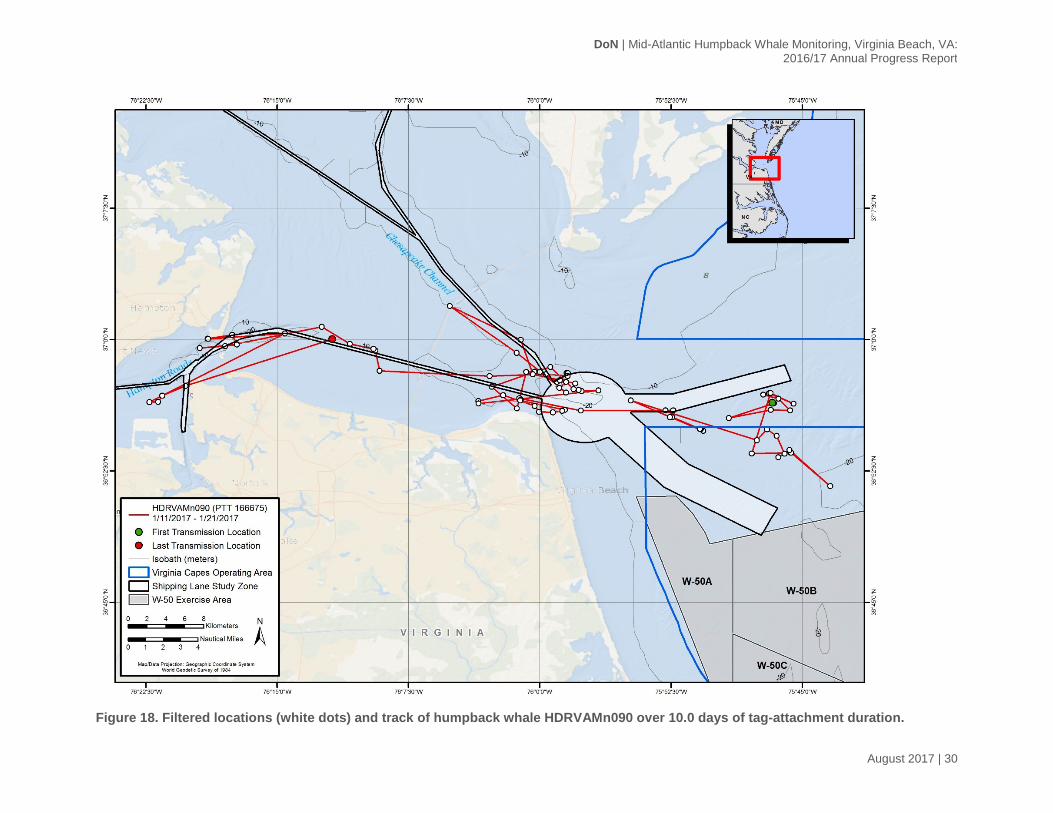
Figure 18. Filtered locations (white dots) and track of humpback whale HDRVAMn090 over 10.0 days of tag-attachment duration. ..............................................................................30
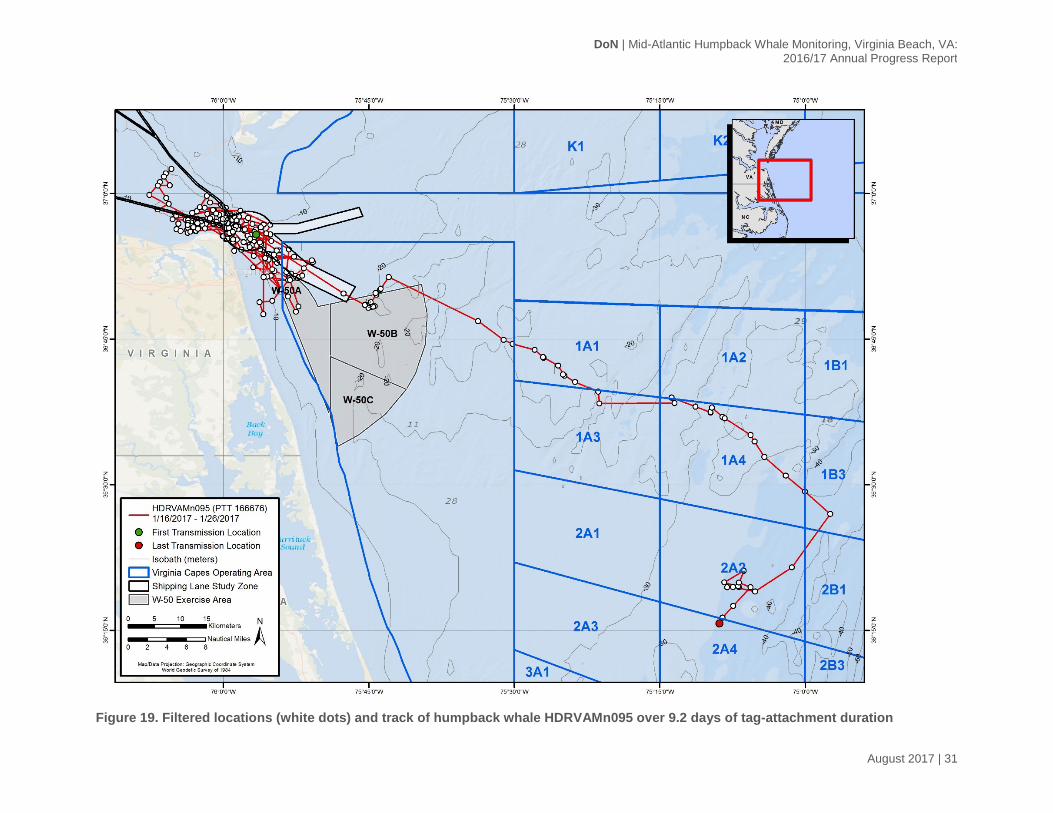
Figure 19. Filtered locations (white dots) and track of humpback whale HDRVAMn095 over 9.2 days of tag-attachment duration .................................................................................31
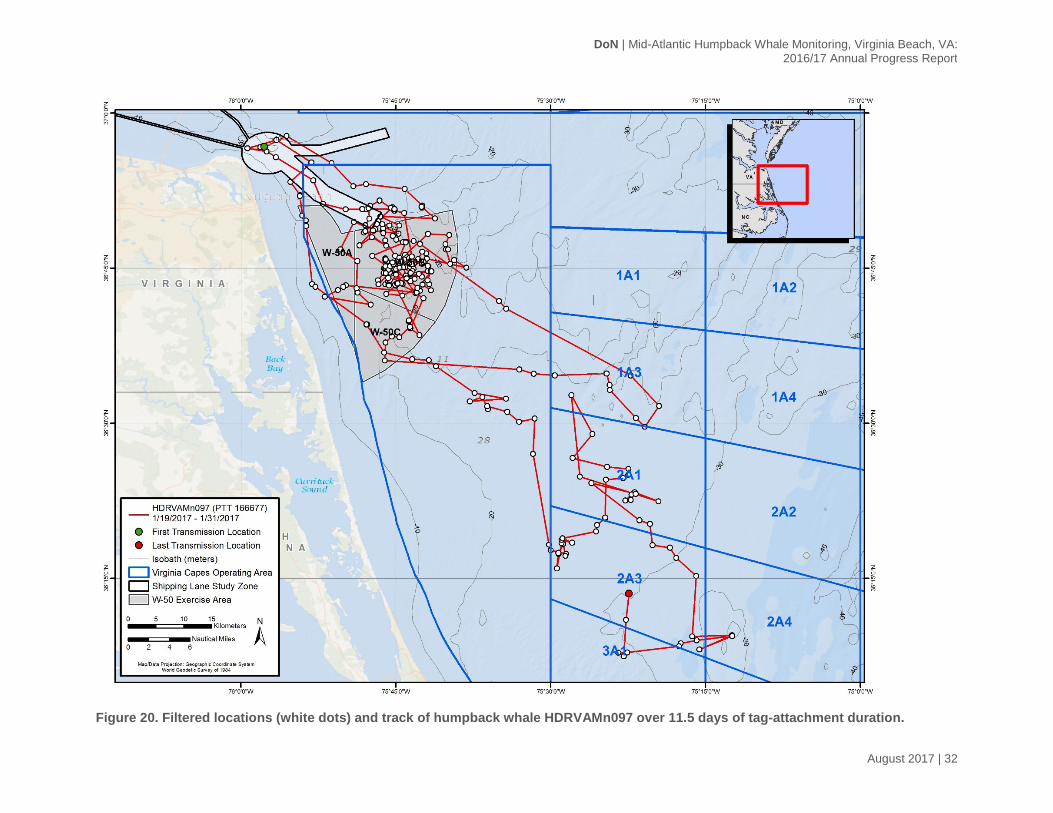
Figure 20. Filtered locations (white dots) and track of humpback whale HDRVAMn097 over 11.5 days of tag-attachment duration. ..............................................................................32
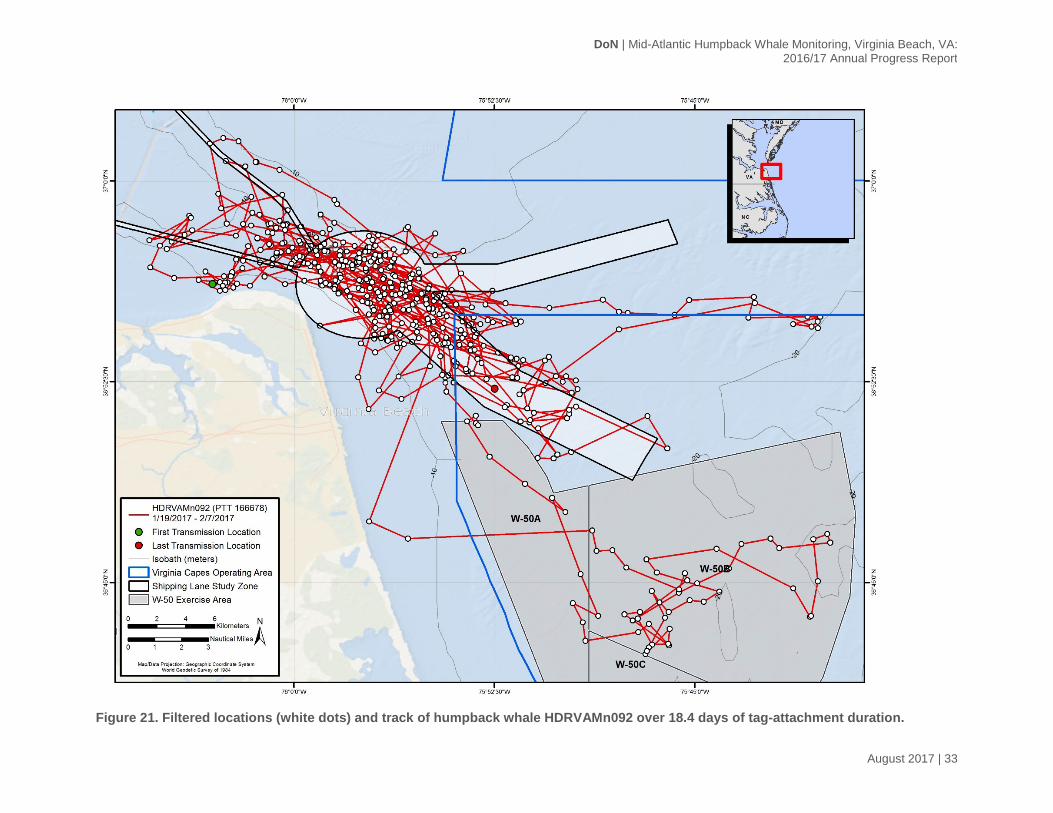
Figure 21. Filtered locations (white dots) and track of humpback whale HDRVAMn092 over 18.4 days of tag-attachment duration. ..............................................................................33
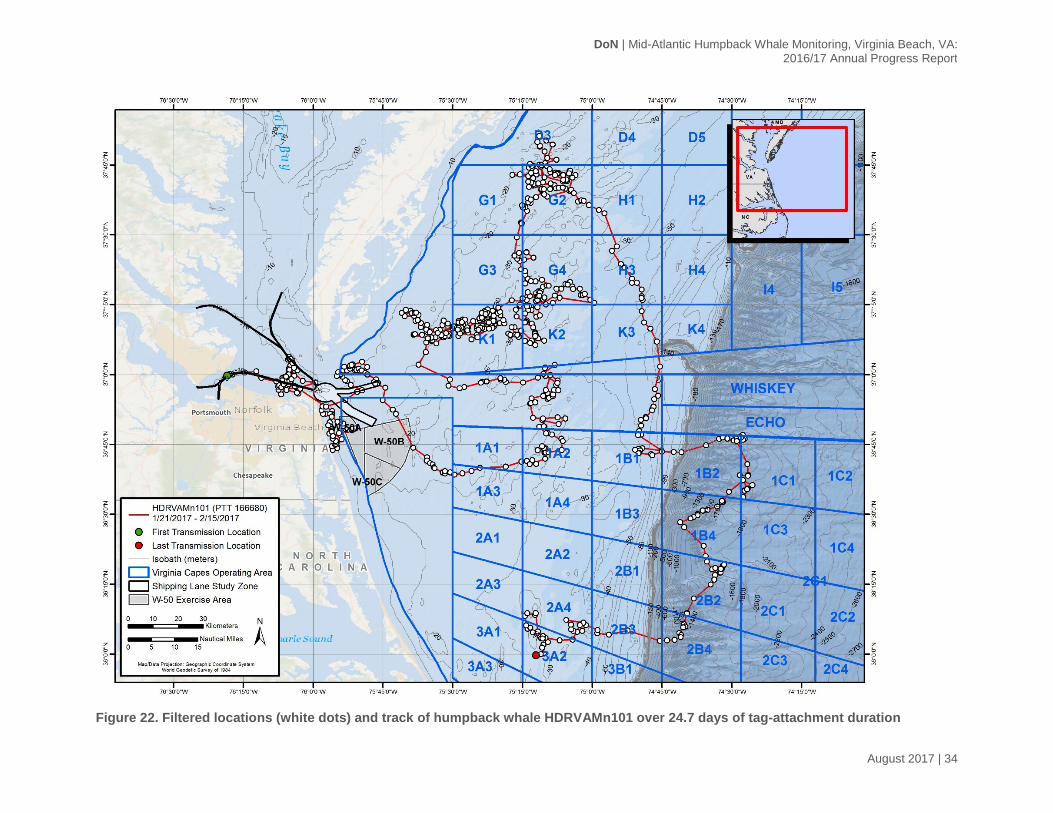
Figure 22. Filtered locations (white dots) and track of humpback whale HDRVAMn101 over 24.7 days of tag-attachment duration ...............................................................................34
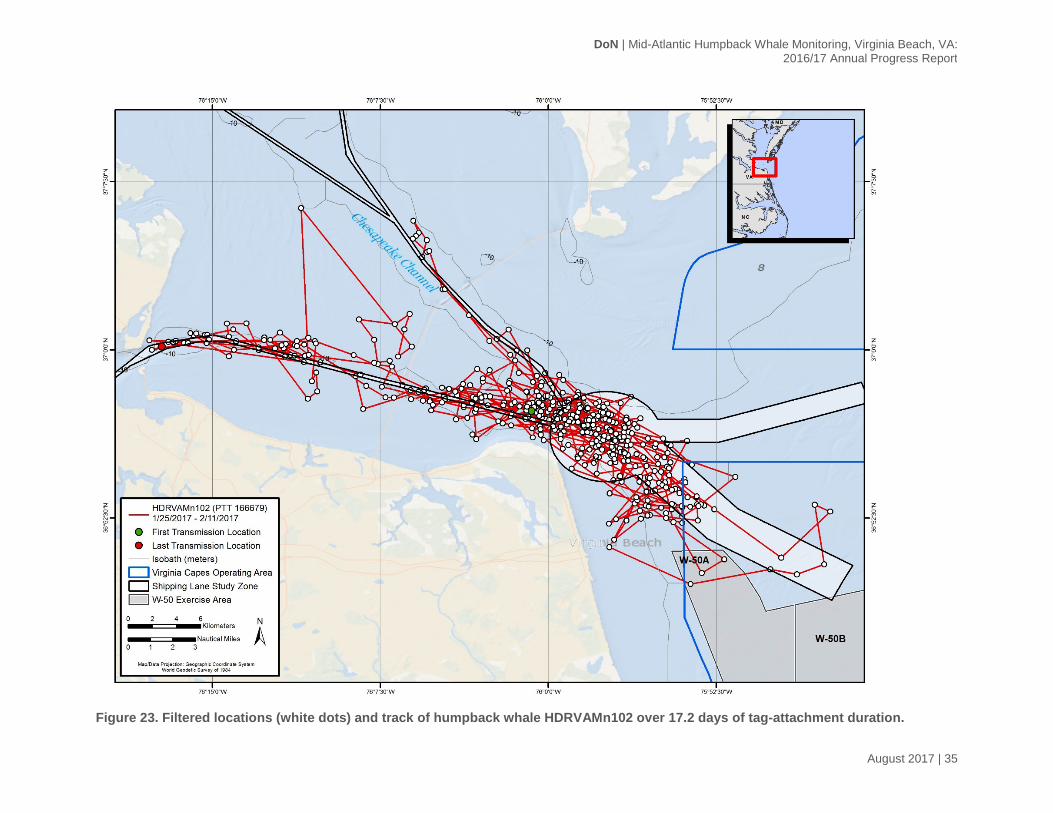
Figure 23. Filtered locations (white dots) and track of humpback whale HDRVAMn102 over 17.2 days of tag-attachment duration. ..............................................................................35
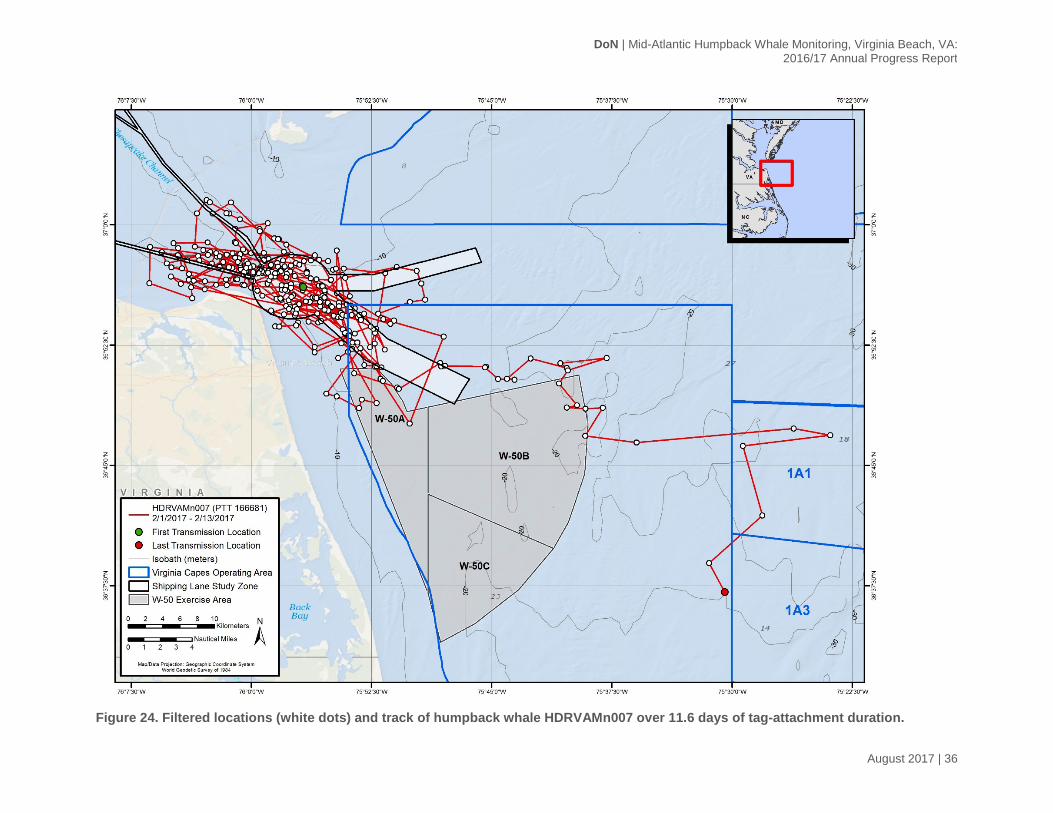
Figure 24. Filtered locations (white dots) and track of humpback whale HDRVAMn007 over 11.6 days of tag-attachment duration. ..............................................................................36
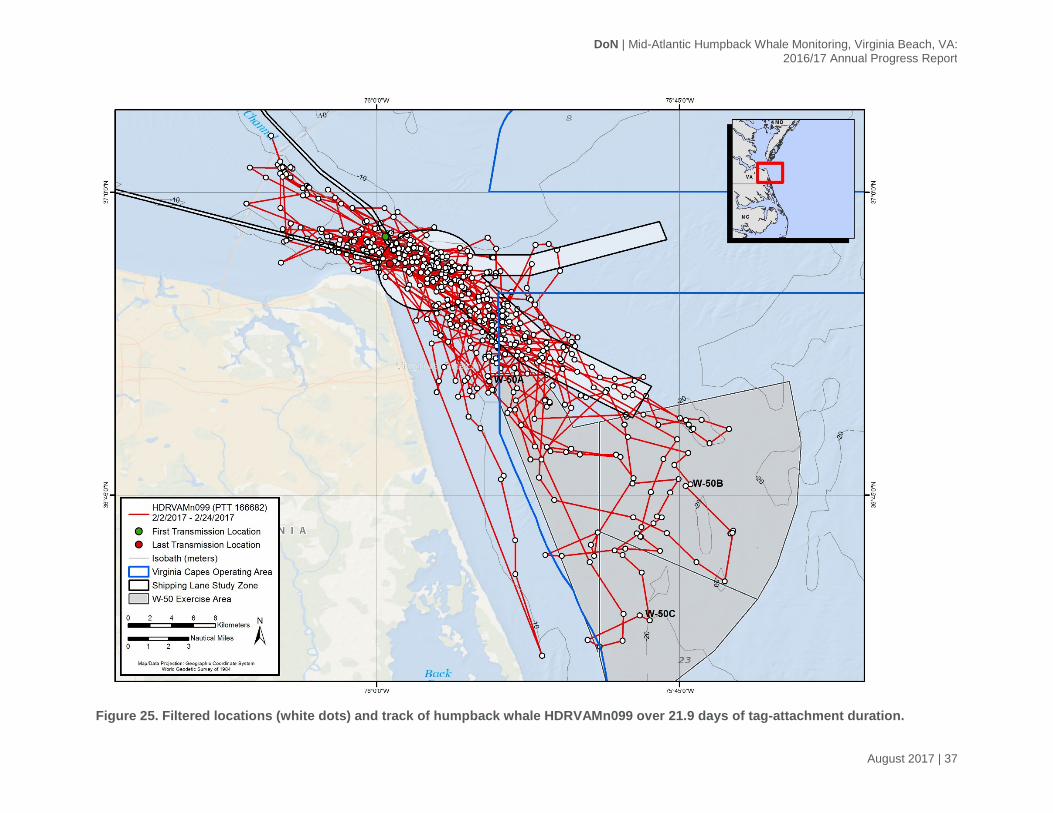
Figure 25. Filtered locations (white dots) and track of humpback whale HDRVAMn099 over 21.9 days of tag-attachment duration. ..............................................................................37
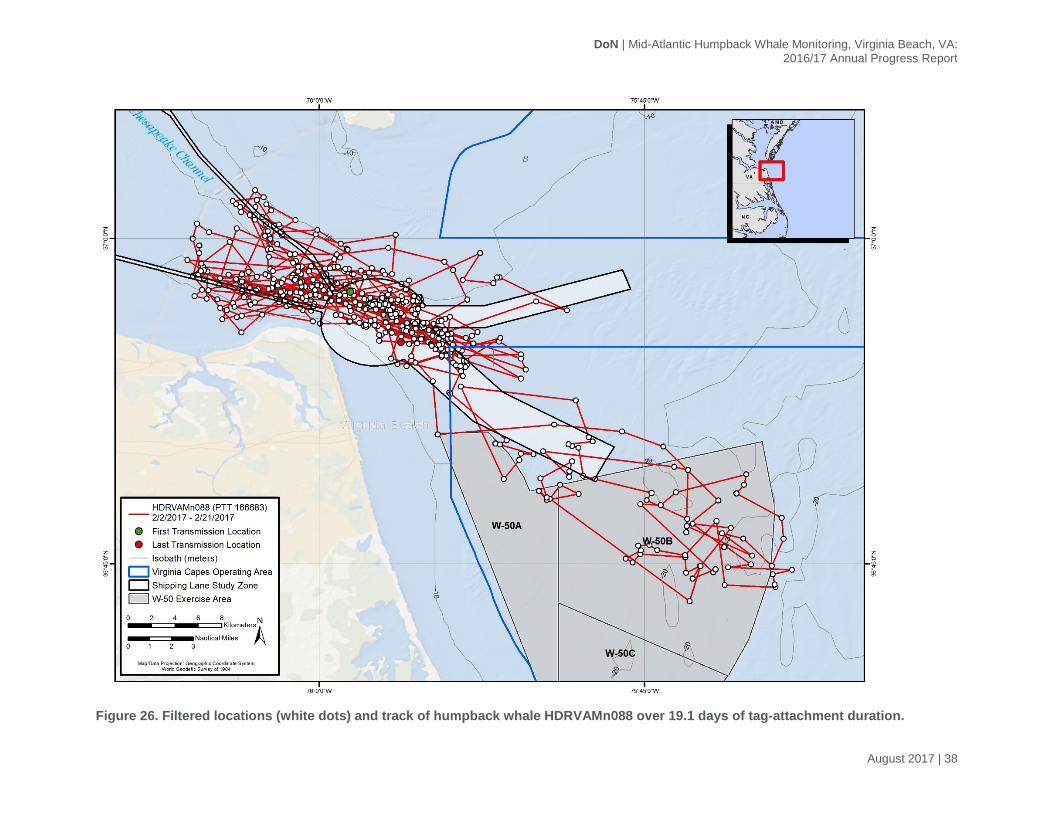
Figure 26. Filtered locations (white dots) and track of humpback whale HDRVAMn088 over 19.1 days of tag-attachment duration. ..............................................................................38
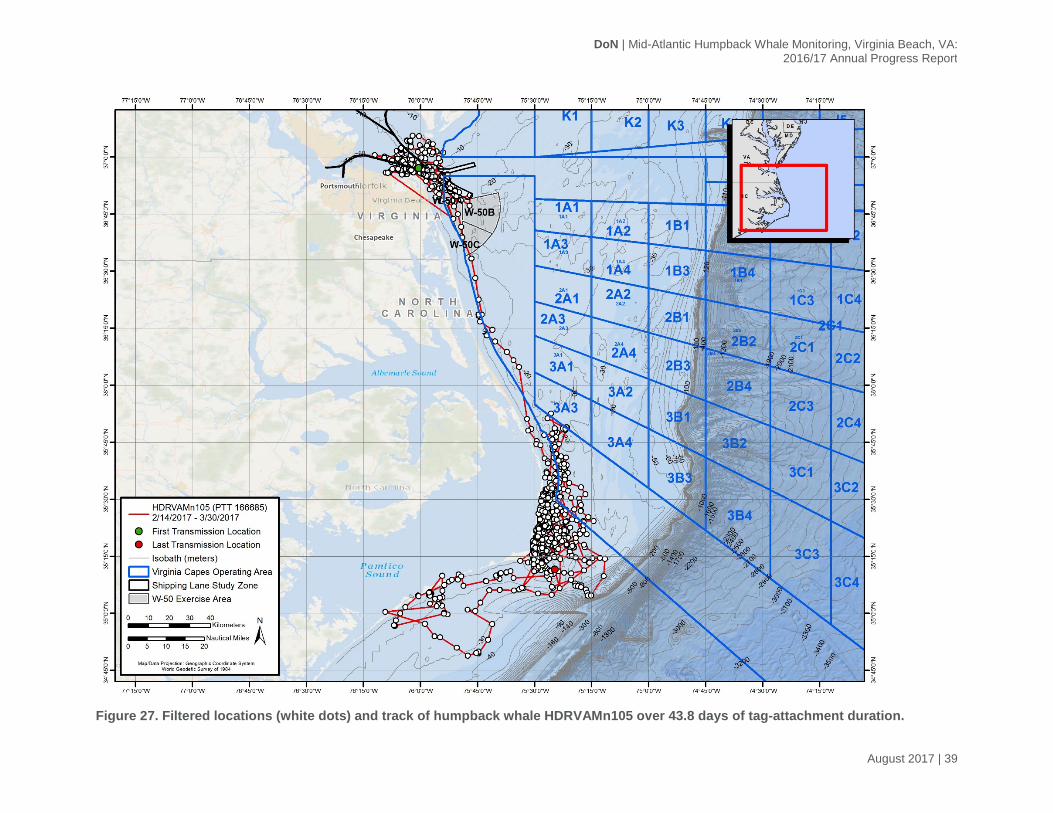
Figure 27. Filtered locations (white dots) and track of humpback whale HDRVAMn105 over 43.8 days of tag-attachment duration. ..............................................................................39
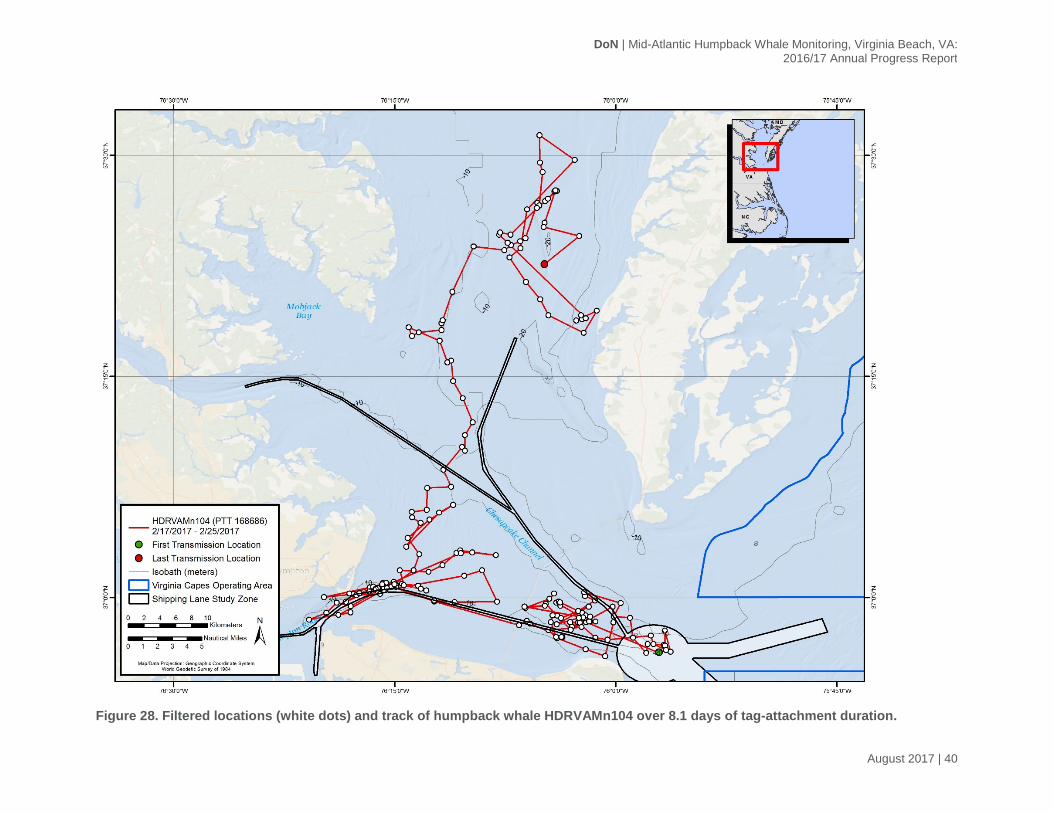
Figure 28. Filtered locations (white dots) and track of humpback whale HDRVAMn104 over 8.1 days of tag-attachment duration. ................................................................................40
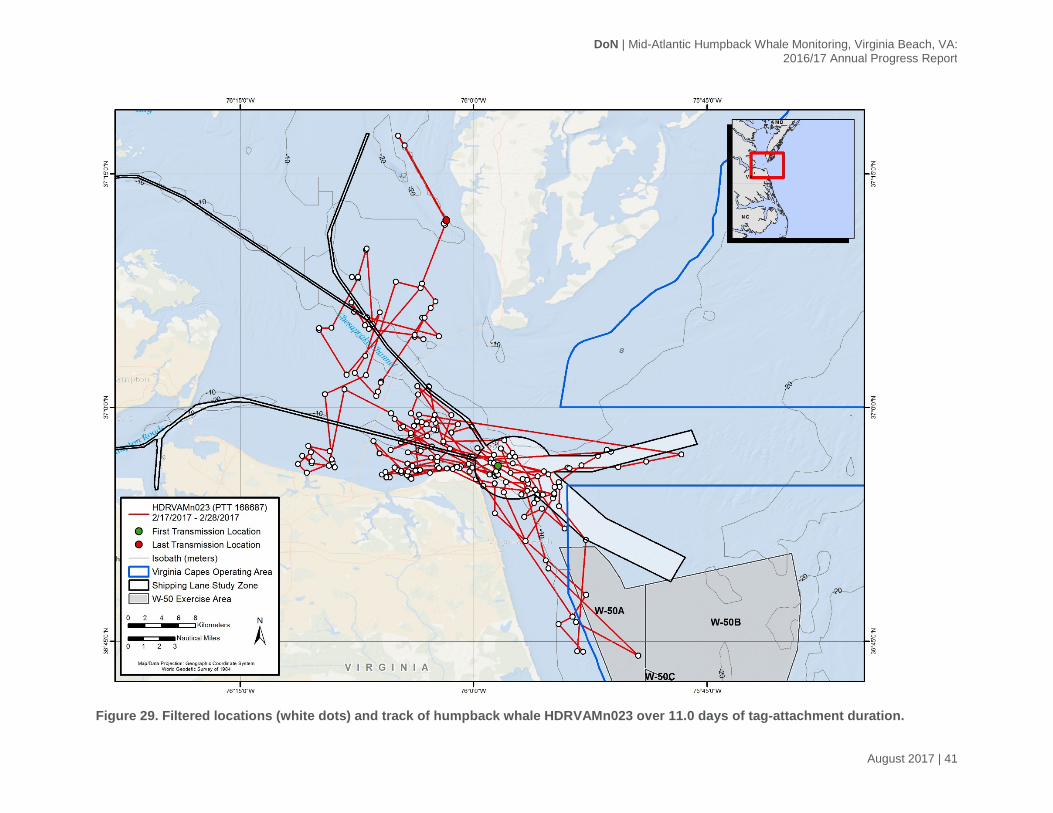
Figure 29. Filtered locations (white dots) and track of humpback whale HDRVAMn023 over 11.0 days of tag-attachment duration. ..............................................................................41
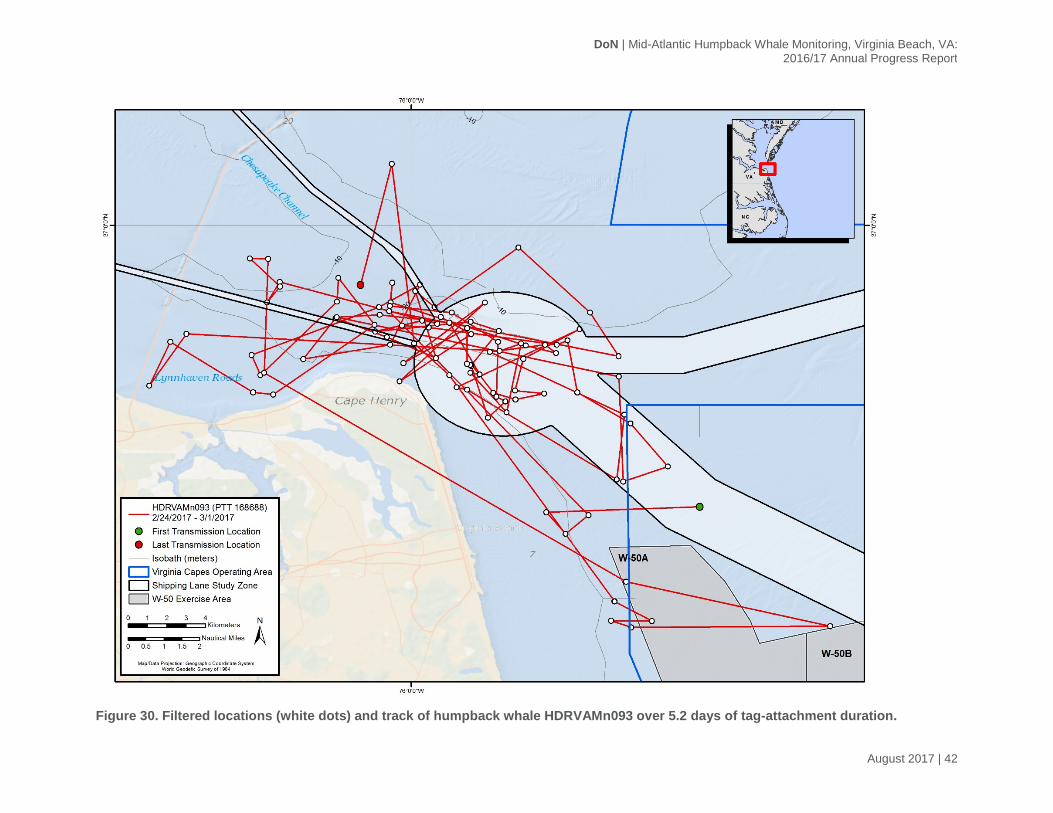
Figure 30. Filtered locations (white dots) and track of humpback whale HDRVAMn093 over 5.2 days of tag-attachment duration. ................................................................................42
Figure 31. Humpback whale HDRVAMn090 washed ashore on Virginia Beach on 12 February 2017 with fatal propeller slices through its body. ...............................................44
Figure 32. Humpback whale HDRVAMn085 observed by HDR off Virginia Beach on 14 February 2017 with propeller slices through its body. This individual was observed without these injuries on 06 February 2017. .....................................................................44
DoN | Mid-Atlantic Humpback Whale Monitoring, Virginia Beach, VA: 2016/17 Annual Progress Report
August 2017 | iii
Tables
Table 1. Summary of nearshore survey efforts off Virginia Beach, Virginia: November 2016–March 2017. ...................................................................................................................... 7
Table 2. Sighting history (by number of days seen per month) and additional information of all photo-identified baleen whales off Virginia Beach, Virginia: December 2014–March 2017. ................................................................................................................................. 8
Table 3. Summary of satellite tag deployments for the 2016/17 season. ...................................16
DoN | Mid-Atlantic Humpback Whale Monitoring, Virginia Beach, VA: 2016/17 Annual Progress Report
August 2017 | iv
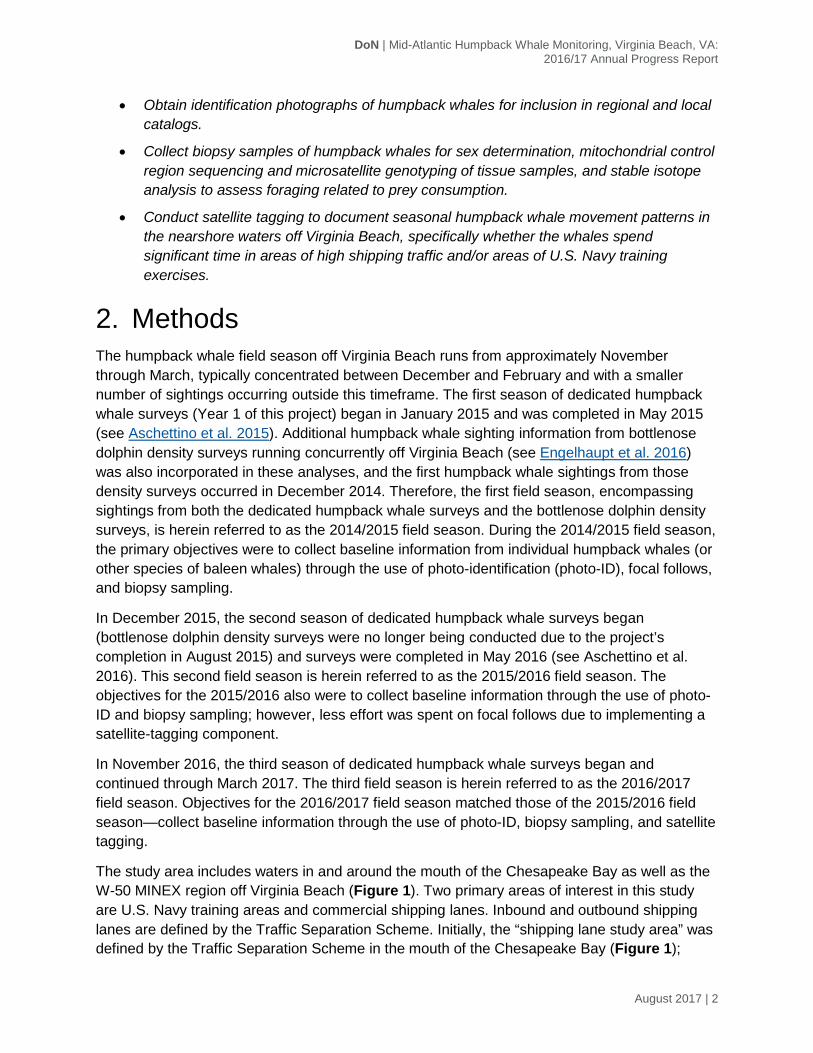
Acronyms and Abbreviations
BSS Beaufort sea state
°C degrees Celsius
CBBT Chesapeake Bay Bridge-Tunnel
GPS Global Positioning System
km kilometer(s)
LIMPET Low Impact Minimally Percutaneous External-electronics Transmitter
m meter(s)
MAHWC Mid-Atlantic Humpback Whale Catalog
MINEX Mine Neutralization Exercise
NMFS National Marine Fisheries Service
Photo-ID photo-identification
SPOT Smart Position and Temperature
UME Unusual Mortality Event
U.S. United States
VACAPES Virginia Capes Operating Area
VAQS Virginia Aquarium and Marine Science Center
DoN | Mid-Atlantic Humpback Whale Monitoring, Virginia Beach, VA: 2016/17 Annual Progress Report
August 2017 | 1
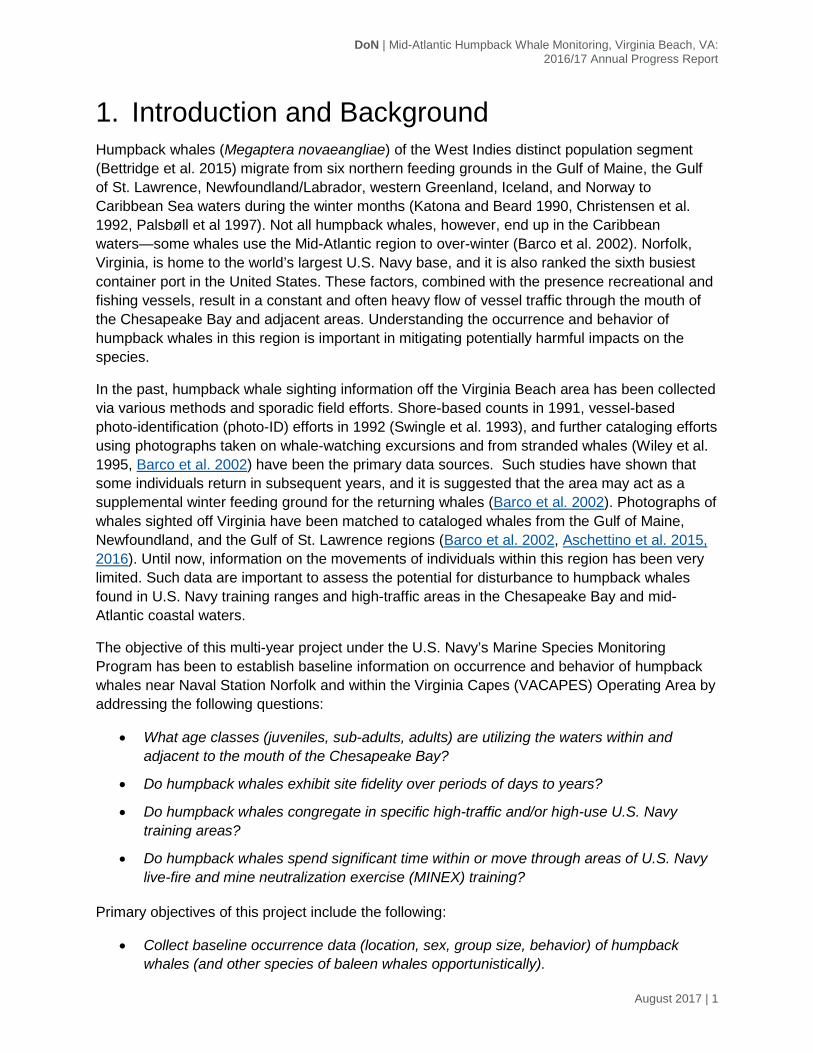
1. Introduction and Background Humpback whales (Megaptera novaeangliae) of the West Indies distinct population segment (Bettridge et al. 2015) migrate from six northern feeding grounds in the Gulf of Maine, the Gulf of St. Lawrence, Newfoundland/Labrador, western Greenland, Iceland, and Norway to Caribbean Sea waters during the winter months (Katona and Beard 1990, Christensen et al. 1992, Palsbøll et al 1997). Not all humpback whales, however, end up in the Caribbean waters—some whales use the Mid-Atlantic region to over-winter (Barco et al. 2002). Norfolk, Virginia, is home to the world’s largest U.S. Navy base, and it is also ranked the sixth busiest container port in the United States. These factors, combined with the presence recreational and fishing vessels, result in a constant and often heavy flow of vessel traffic through the mouth of the Chesapeake Bay and adjacent areas. Understanding the occurrence and behavior of humpback whales in this region is important in mitigating potentially harmful impacts on the species.
In the past, humpback whale sighting information off the Virginia Beach area has been collected via various methods and sporadic field efforts. Shore-based counts in 1991, vessel-based photo-identification (photo-ID) efforts in 1992 (Swingle et al. 1993), and further cataloging efforts using photographs taken on whale-watching excursions and from stranded whales (Wiley et al. 1995, Barco et al. 2002) have been the primary data sources. Such studies have shown that some individuals return in subsequent years, and it is suggested that the area may act as a supplemental winter feeding ground for the returning whales (Barco et al. 2002). Photographs of whales sighted off Virginia have been matched to cataloged whales from the Gulf of Maine, Newfoundland, and the Gulf of St. Lawrence regions (Barco et al. 2002, Aschettino et al. 2015, 2016). Until now, information on the movements of individuals within this region has been very limited. Such data are important to assess the potential for disturbance to humpback whales found in U.S. Navy training ranges and high-traffic areas in the Chesapeake Bay and mid-Atlantic coastal waters.
The objective of this multi-year project under the U.S. Navy’s Marine Species Monitoring Program has been to establish baseline information on occurrence and behavior of humpback whales near Naval Station Norfolk and within the Virginia Capes (VACAPES) Operating Area by addressing the following questions:
• What age classes (juveniles, sub-adults, adults) are utilizing the waters within and adjacent to the mouth of the Chesapeake Bay?
• Do humpback whales exhibit site fidelity over periods of days to years?
• Do humpback whales congregate in specific high-traffic and/or high-use U.S. Navy training areas?
• Do humpback whales spend significant time within or move through areas of U.S. Navy live-fire and mine neutralization exercise (MINEX) training?
Primary objectives of this project include the following:
• Collect baseline occurrence data (location, sex, group size, behavior) of humpback whales (and other species of baleen whales opportunistically).
DoN | Mid-Atlantic Humpback Whale Monitoring, Virginia Beach, VA: 2016/17 Annual Progress Report
August 2017 | 2
• Obtain identification photographs of humpback whales for inclusion in regional and local catalogs.
• Collect biopsy samples of humpback whales for sex determination, mitochondrial control region sequencing and microsatellite genotyping of tissue samples, and stable isotope analysis to assess foraging related to prey consumption.
• Conduct satellite tagging to document seasonal humpback whale movement patterns in the nearshore waters off Virginia Beach, specifically whether the whales spend significant time in areas of high shipping traffic and/or areas of U.S. Navy training exercises.
2. Methods The humpback whale field season off Virginia Beach runs from approximately November through March, typically concentrated between December and February and with a smaller number of sightings occurring outside this timeframe. The first season of dedicated humpback whale surveys (Year 1 of this project) began in January 2015 and was completed in May 2015 (see Aschettino et al. 2015). Additional humpback whale sighting information from bottlenose dolphin density surveys running concurrently off Virginia Beach (see Engelhaupt et al. 2016) was also incorporated in these analyses, and the first humpback whale sightings from those density surveys occurred in December 2014. Therefore, the first field season, encompassing sightings from both the dedicated humpback whale surveys and the bottlenose dolphin density surveys, is herein referred to as the 2014/2015 field season. During the 2014/2015 field season, the primary objectives were to collect baseline information from individual humpback whales (or other species of baleen whales) through the use of photo-identification (photo-ID), focal follows, and biopsy sampling.
In December 2015, the second season of dedicated humpback whale surveys began (bottlenose dolphin density surveys were no longer being conducted due to the project’s completion in August 2015) and surveys were completed in May 2016 (see Aschettino et al. 2016). This second field season is herein referred to as the 2015/2016 field season. The objectives for the 2015/2016 also were to collect baseline information through the use of photo-ID and biopsy sampling; however, less effort was spent on focal follows due to implementing a satellite-tagging component.
In November 2016, the third season of dedicated humpback whale surveys began and continued through March 2017. The third field season is herein referred to as the 2016/2017 field season. Objectives for the 2016/2017 field season matched those of the 2015/2016 field season—collect baseline information through the use of photo-ID, biopsy sampling, and satellite tagging.
The study area includes waters in and around the mouth of the Chesapeake Bay as well as the W-50 MINEX region off Virginia Beach (Figure 1). Two primary areas of interest in this study are U.S. Navy training areas and commercial shipping lanes. Inbound and outbound shipping lanes are defined by the Traffic Separation Scheme. Initially, the “shipping lane study area” was defined by the Traffic Separation Scheme in the mouth of the Chesapeake Bay (Figure 1);
DoN | Mid-Atlantic Humpback Whale Monitoring, Virginia Beach, VA: 2016/17 Annual Progress Report
August 2017 | 3
Figure 1. Map of the primary study area, as outlined by the green boundary, which includes waters in and around the mouth of the Chesapeake Bay as well as the W-50 MINEX region off Virginia Beach.
DoN | Mid-Atlantic Humpback Whale Monitoring, Virginia Beach, VA: 2016/17 Annual Progress Report
August 2017 | 4
however, as tag locations showed movements out of the defined area but within shipping channels, the area was extended using multiple nautical charts and datasets, including the Traffic Separation Scheme, Coastal Maintained Channels in U.S. Waters (U.S. Army Corps of Engineers), and Shipping Fairways, Lanes, and Zones for U.S. Waters (National Oceanic and Atmospheric Administration) as guidelines. The U.S. Navy training areas included portions of the W-50 MINEX range.
Local availability of researchers allowed survey effort to be flexible and take advantage of limited winter weather windows in order to maximize the ability to achieve project objectives. Optimal weather conditions included good visibility and a Beaufort sea state (BSS) of 3 or lower. Once a survey was underway, if BSS reached 4 or 5, or visibility was reduced to less than 1 nautical mile due to rain, fog, or snow, the survey was typically aborted and the vessel returned to port. Efforts were coordinated with the W-50 MINEX range so that the research vessel had clearance to operate when training was not being conducted. Due to frequent range closures and limited weather windows, it was not always possible to conduct surveys within the W-50 MINEX range.
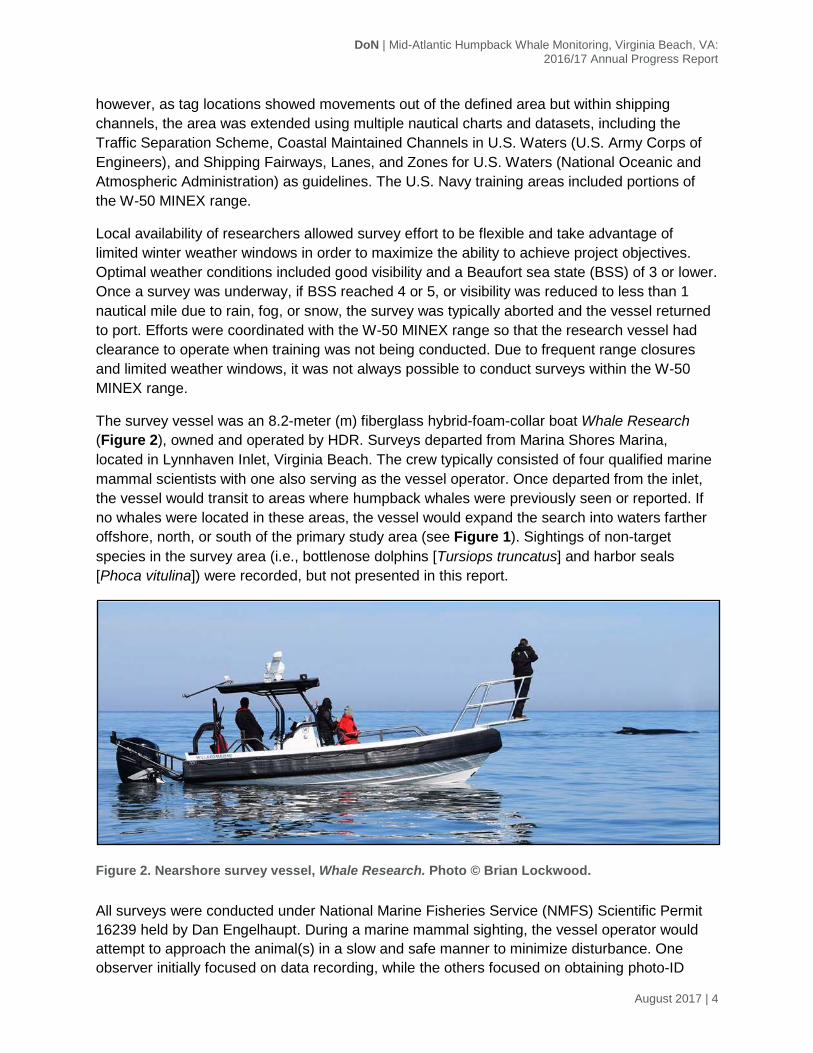
The survey vessel was an 8.2-meter (m) fiberglass hybrid-foam-collar boat Whale Research (Figure 2), owned and operated by HDR. Surveys departed from Marina Shores Marina, located in Lynnhaven Inlet, Virginia Beach. The crew typically consisted of four qualified marine mammal scientists with one also serving as the vessel operator. Once departed from the inlet, the vessel would transit to areas where humpback whales were previously seen or reported. If no whales were located in these areas, the vessel would expand the search into waters farther offshore, north, or south of the primary study area (see Figure 1). Sightings of non-target species in the survey area (i.e., bottlenose dolphins [Tursiops truncatus] and harbor seals [Phoca vitulina]) were recorded, but not presented in this report.
Figure 2. Nearshore survey vessel, Whale Research. Photo © Brian Lockwood.
All surveys were conducted under National Marine Fisheries Service (NMFS) Scientific Permit 16239 held by Dan Engelhaupt. During a marine mammal sighting, the vessel operator would attempt to approach the animal(s) in a slow and safe manner to minimize disturbance. One observer initially focused on data recording, while the others focused on obtaining photo-ID
DoN | Mid-Atlantic Humpback Whale Monitoring, Virginia Beach, VA: 2016/17 Annual Progress Report
August 2017 | 5
images of the individual(s) using a digital SLR camera (Canon 7D, 7D Mark ii, or 1D) with a zoom lens (Canon 100 to 400-millimeter). A laser-photogrammetry system (http://www.abdn.ac.uk/lighthouse) was incorporated beginning in December 2015 as a means to add quantitative data to support age-class identification in the field; however, this system was not always functional, and what data were collected have not yet been incorporated into the results. After the scientific crew confirmed species and individual identification(s) (i.e., determined whether the individual whale was a known whale in the HDR catalog or a new individual), additional decisions could be made regarding tagging or biopsy efforts.
Photographs of humpback, fin (Balaenoptera physalus), and minke (Balaenoptera acoustrata) whales were post-processed using ACDSee (Versions 7–9) by cropping the best image of each individual whale’s dorsal fin (left and right) and tail flukes (when obtained). Photographs were assembled into a catalog managed by HDR where each new whale was assigned an ID number (e.g., HDRVAMn001 or HDRVABp001) and compared with one another. At the end of the 2014/2015 field season, images of humpback whale flukes were submitted to Allied Whale for comparison to the North Atlantic humpback whale catalog and images of humpback whale dorsal fins and flukes were submitted to the Virginia Aquarium and Marine Science Center (VAQS) for comparison and integration with the mid-Atlantic humpback whale catalog (MAHWC). At the end of the 2015/2016 field season, images were submitted to VAQS. Images of fin whales were shared with Duke University as well as researchers from the Center for Coastal Studies in Provincetown, Massachusetts. At the end of the 2016/2017 field season, humpback whale images will once again be shared with VAQS for integration into the MAHWC (see Mallette and Barco 2017).
Biopsy samples were collected, when possible, from whales of interest. Biopsies were obtained using either a crossbow or biopsy rifle. In the first, Finn Larsen designed crossbow bolts outfitted with 25-millimeter, ethanol sterilized, stainless steel tips were projected by a 68-kilogram pull Barnett crossbow (Barnett Outdoors, LLC, Tarpon Springs, FL). Alternatively, a Paxarms biopsy rifle (Paxarms New Zealand Ltd., Cheviot, New Zealand) fired 6 × 20-millimeter sterilized dart tips propelled by .22 caliber blank cartridges. Samples were post-processed by sectioning the skin into three equal-sized pieces. One third of the skin was placed in a cryovial and frozen (-40 degrees Celsius [°C]) for stable isotope analysis by Duke University, one third was placed in a cryovial with a dimethylsulfate and sodium chloride solution in preparation for analysis by University of Groningen, and one third was frozen (-40°C) for archival storage for Southeast Fisheries Science Center. Blubber was wrapped in foil and frozen for archiving for Southeast Fisheries Science Center. Analysis of these samples is currently in progress.
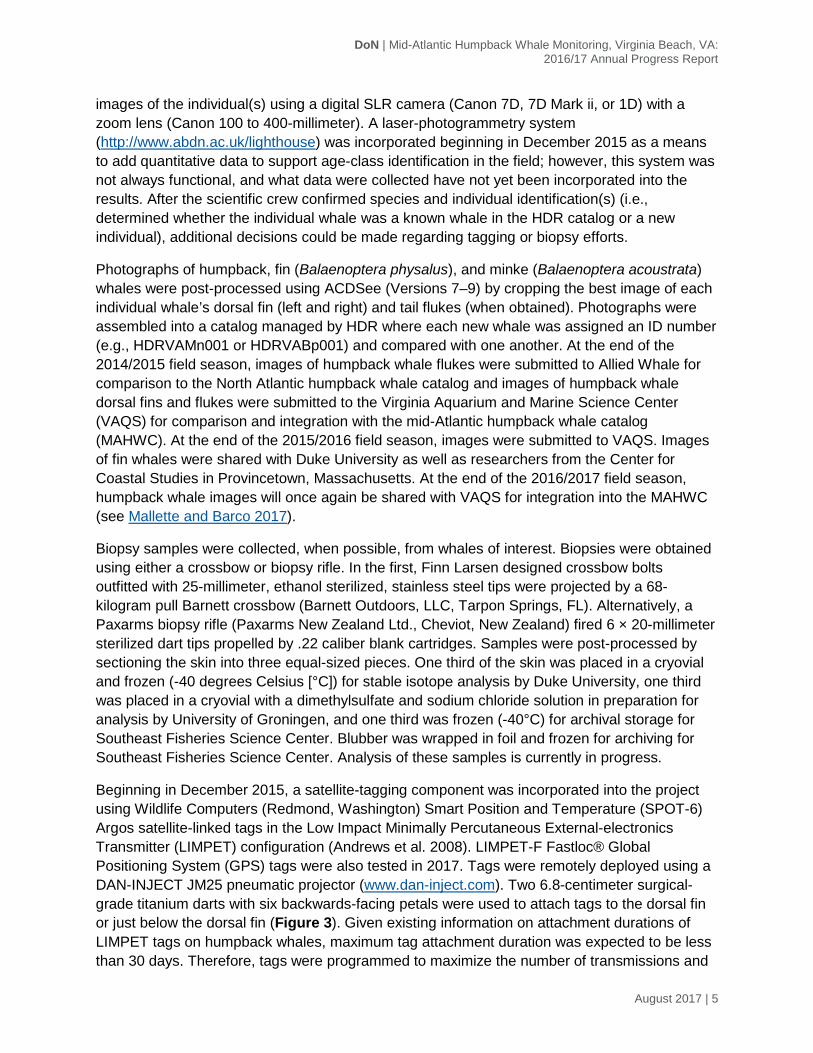
Beginning in December 2015, a satellite-tagging component was incorporated into the project using Wildlife Computers (Redmond, Washington) Smart Position and Temperature (SPOT-6) Argos satellite-linked tags in the Low Impact Minimally Percutaneous External-electronics Transmitter (LIMPET) configuration (Andrews et al. 2008). LIMPET-F Fastloc® Global Positioning System (GPS) tags were also tested in 2017. Tags were remotely deployed using a DAN-INJECT JM25 pneumatic projector (www.dan-inject.com). Two 6.8-centimeter surgical-grade titanium darts with six backwards-facing petals were used to attach tags to the dorsal fin or just below the dorsal fin (Figure 3). Given existing information on attachment durations of LIMPET tags on humpback whales, maximum tag attachment duration was expected to be less than 30 days. Therefore, tags were programmed to maximize the number of transmissions and
DoN | Mid-Atlantic Humpback Whale Monitoring, Virginia Beach, VA: 2016/17 Annual Progress Report
August 2017 | 6
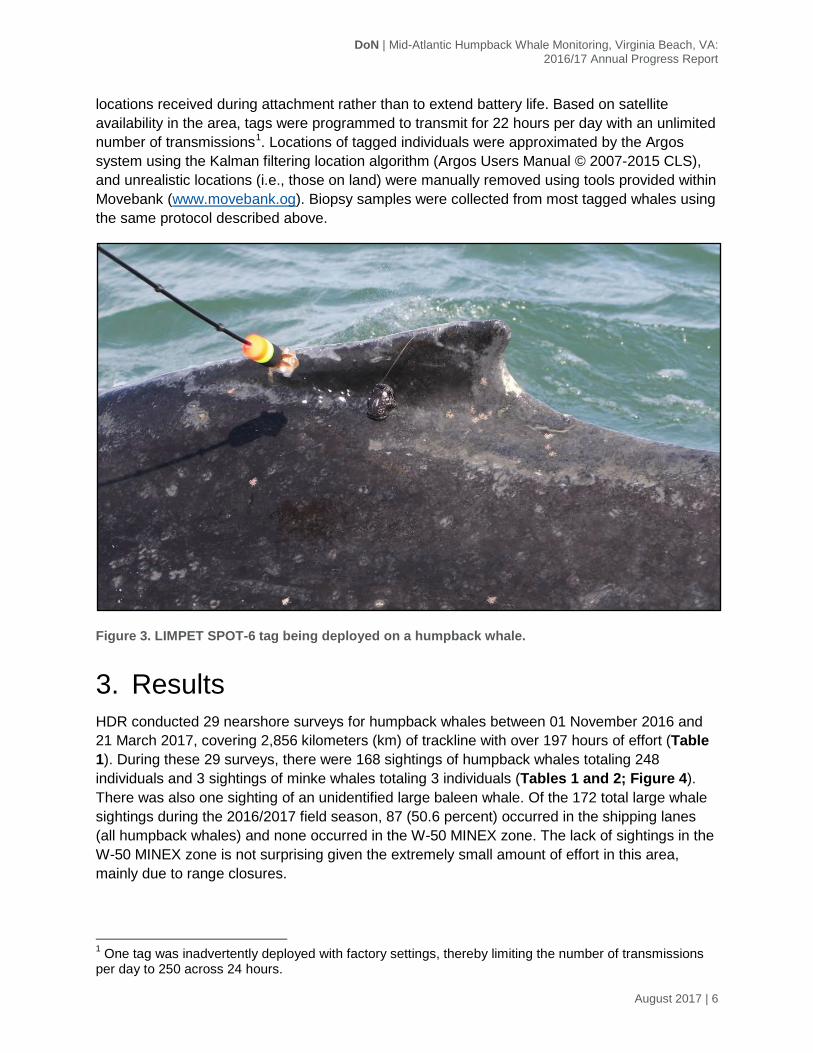
locations received during attachment rather than to extend battery life. Based on satellite availability in the area, tags were programmed to transmit for 22 hours per day with an unlimited number of transmissions1. Locations of tagged individuals were approximated by the Argos system using the Kalman filtering location algorithm (Argos Users Manual © 2007-2015 CLS), and unrealistic locations (i.e., those on land) were manually removed using tools provided within Movebank (www.movebank.og). Biopsy samples were collected from most tagged whales using the same protocol described above.
Figure 3. LIMPET SPOT-6 tag being deployed on a humpback whale.
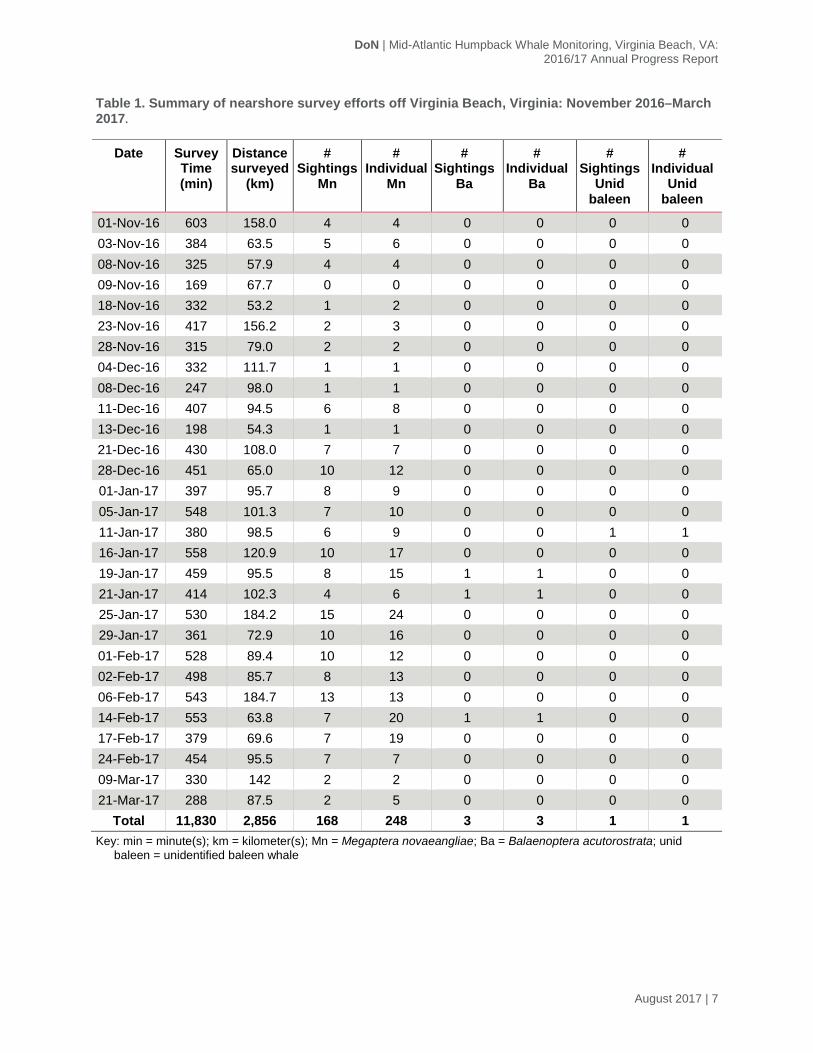
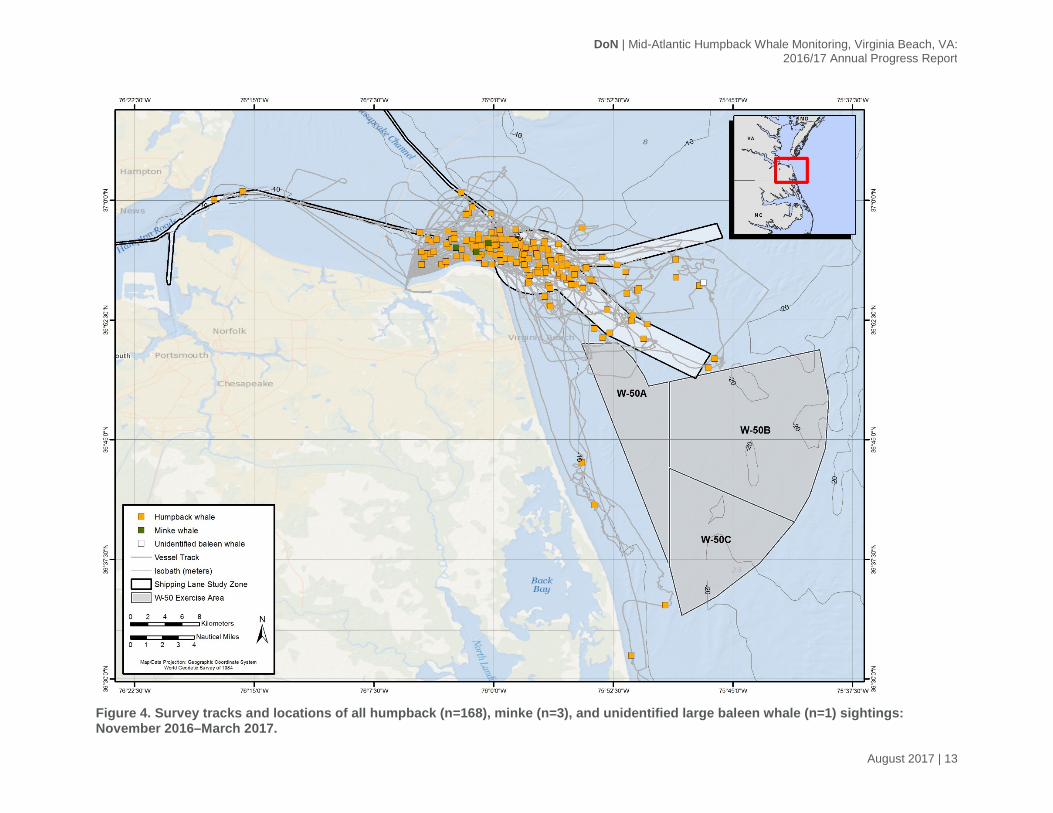
3. Results HDR conducted 29 nearshore surveys for humpback whales between 01 November 2016 and 21 March 2017, covering 2,856 kilometers (km) of trackline with over 197 hours of effort (Table 1). During these 29 surveys, there were 168 sightings of humpback whales totaling 248 individuals and 3 sightings of minke whales totaling 3 individuals (Tables 1 and 2; Figure 4). There was also one sighting of an unidentified large baleen whale. Of the 172 total large whale sightings during the 2016/2017 field season, 87 (50.6 percent) occurred in the shipping lanes (all humpback whales) and none occurred in the W-50 MINEX zone. The lack of sightings in the W-50 MINEX zone is not surprising given the extremely small amount of effort in this area, mainly due to range closures.
1 One tag was inadvertently deployed with factory settings, thereby limiting the number of transmissions per day to 250 across 24 hours.
DoN | Mid-Atlantic Humpback Whale Monitoring, Virginia Beach, VA: 2016/17 Annual Progress Report
August 2017 | 7
Table 1. Summary of nearshore survey efforts off Virginia Beach, Virginia: November 2016–March 2017.
Date Survey Time (min)
Distance surveyed
(km)
# Sightings
Mn
# Individual
Mn
# Sightings
Ba
# Individual
Ba
# Sightings
Unid baleen
# Individual
Unid baleen
01-Nov-16 603 158.0 4 4 0 0 0 0 03-Nov-16 384 63.5 5 6 0 0 0 0 08-Nov-16 325 57.9 4 4 0 0 0 0 09-Nov-16 169 67.7 0 0 0 0 0 0 18-Nov-16 332 53.2 1 2 0 0 0 0 23-Nov-16 417 156.2 2 3 0 0 0 0 28-Nov-16 315 79.0 2 2 0 0 0 0 04-Dec-16 332 111.7 1 1 0 0 0 0 08-Dec-16 247 98.0 1 1 0 0 0 0 11-Dec-16 407 94.5 6 8 0 0 0 0 13-Dec-16 198 54.3 1 1 0 0 0 0 21-Dec-16 430 108.0 7 7 0 0 0 0 28-Dec-16 451 65.0 10 12 0 0 0 0 01-Jan-17 397 95.7 8 9 0 0 0 0 05-Jan-17 548 101.3 7 10 0 0 0 0 11-Jan-17 380 98.5 6 9 0 0 1 1 16-Jan-17 558 120.9 10 17 0 0 0 0 19-Jan-17 459 95.5 8 15 1 1 0 0 21-Jan-17 414 102.3 4 6 1 1 0 0 25-Jan-17 530 184.2 15 24 0 0 0 0 29-Jan-17 361 72.9 10 16 0 0 0 0 01-Feb-17 528 89.4 10 12 0 0 0 0 02-Feb-17 498 85.7 8 13 0 0 0 0 06-Feb-17 543 184.7 13 13 0 0 0 0 14-Feb-17 553 63.8 7 20 1 1 0 0 17-Feb-17 379 69.6 7 19 0 0 0 0 24-Feb-17 454 95.5 7 7 0 0 0 0 09-Mar-17 330 142 2 2 0 0 0 0 21-Mar-17 288 87.5 2 5 0 0 0 0
Total 11,830 2,856 168 248 3 3 1 1 Key: min = minute(s); km = kilometer(s); Mn = Megaptera novaeangliae; Ba = Balaenoptera acutorostrata; unid
baleen = unidentified baleen whale
DoN | Mid-Atlantic Humpback Whale Monitoring, Virginia Beach, VA: 2016/17 Annual Progress Report
August 2017 | 8
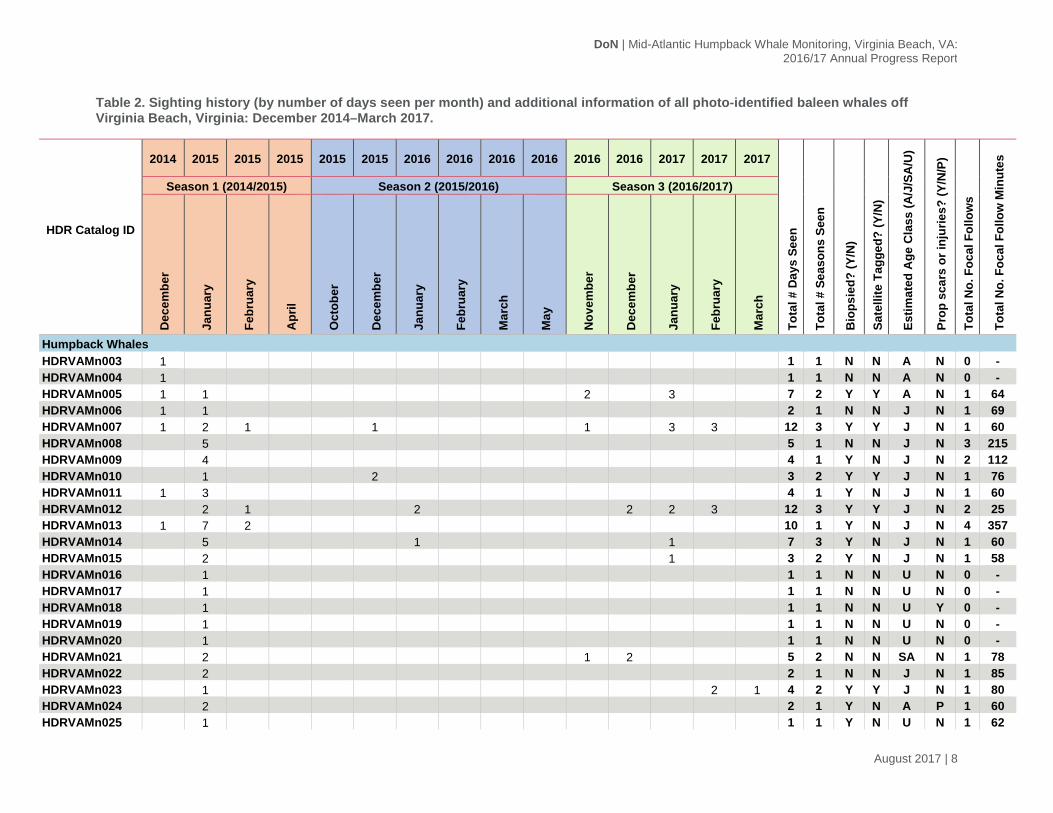
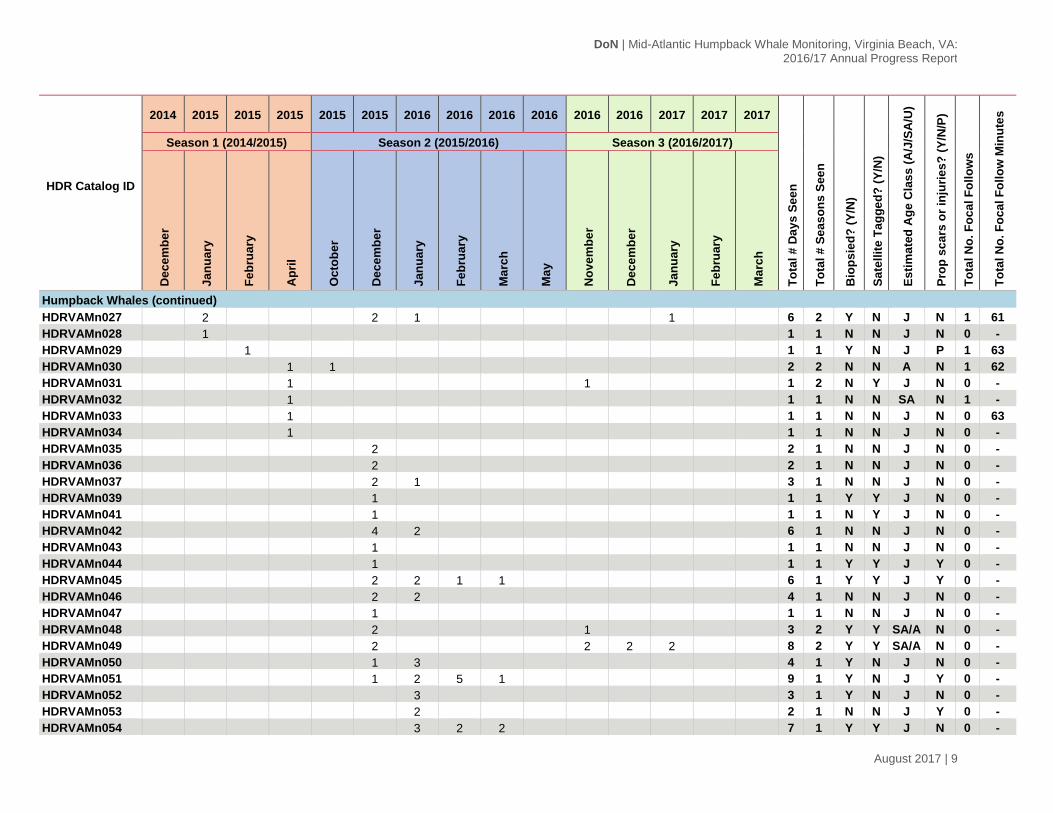
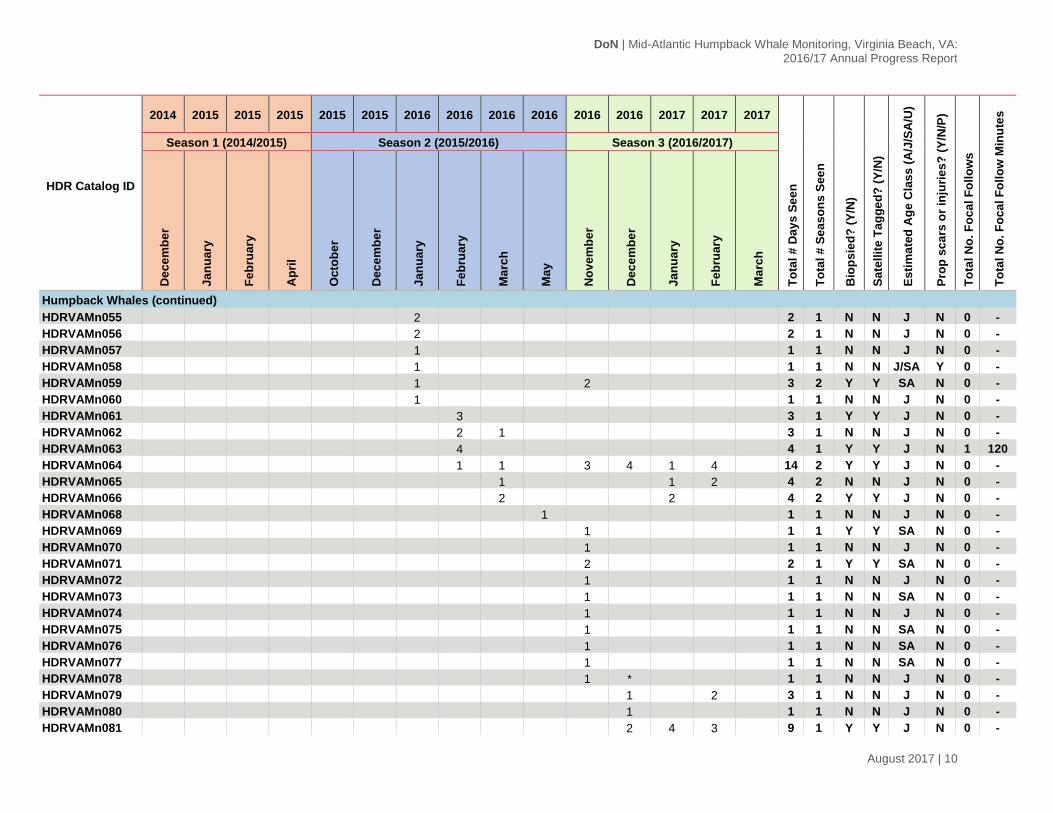
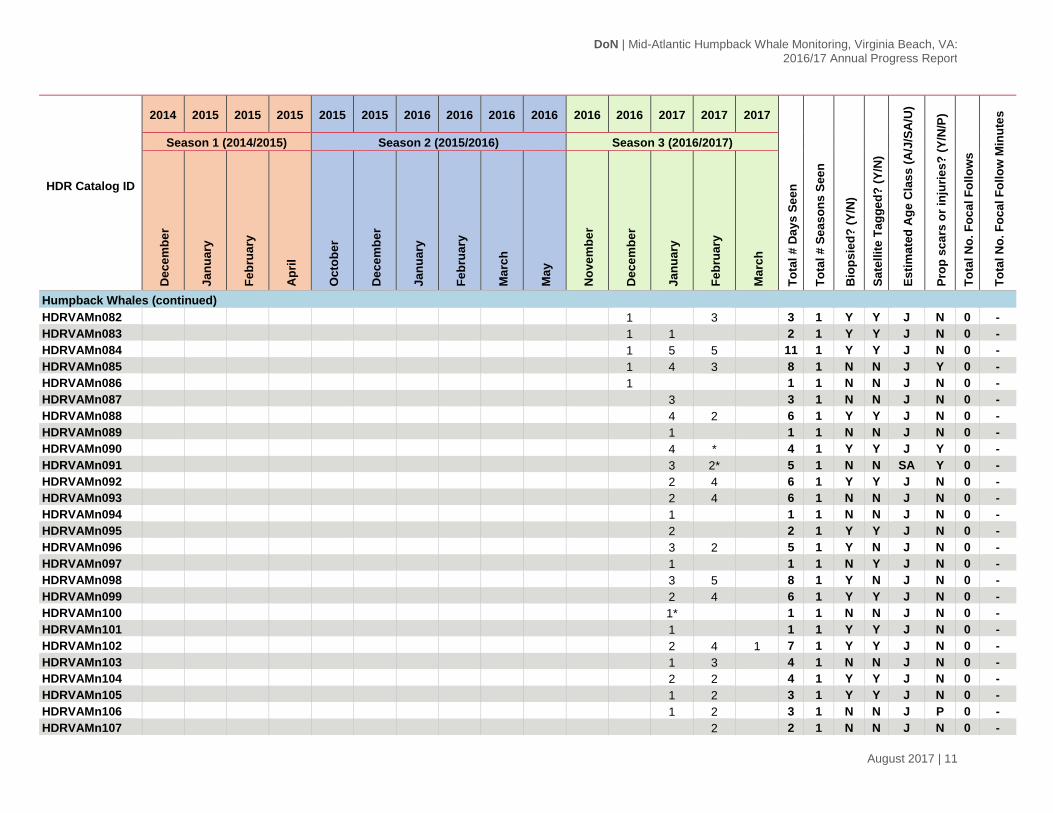
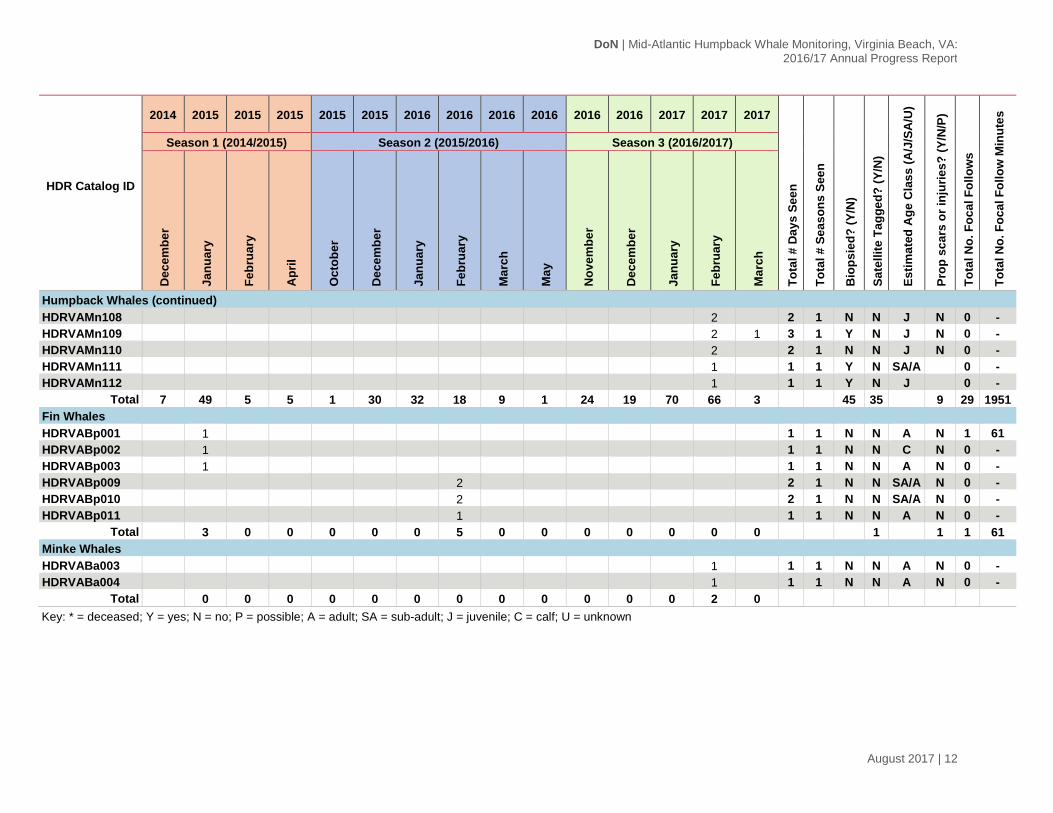
Table 2. Sighting history (by number of days seen per month) and additional information of all photo-identified baleen whales off Virginia Beach, Virginia: December 2014–March 2017.
HDR Catalog ID
2014 2015 2015 2015 2015 2015 2016 2016 2016 2016 2016 2016 2017 2017 2017
Tota
l # D
ays
Seen
Tota
l # S
easo
ns S
een
Bio
psie
d? (Y
/N)
Sate
llite
Tag
ged?
(Y/N
)
Estim
ated
Age
Cla
ss (A
/J/S
A/U
)
Prop
sca
rs o
r inj
urie
s? (Y
/N/P
)
Tota
l No.
Foc
al F
ollo
ws
Tota
l No.
Foc
al F
ollo
w M
inut
es
Season 1 (2014/2015) Season 2 (2015/2016) Season 3 (2016/2017)
Dec
embe
r
Janu
ary
Febr
uary
Apr
il
Oct
ober
Dec
embe
r
Janu
ary
Febr
uary
Mar
ch
May
Nov
embe
r
Dec
embe
r
Janu
ary
Febr
uary
Mar
ch
Humpback Whales HDRVAMn003 1
1 1 N N A N 0 -
HDRVAMn004 1
1 1 N N A N 0 - HDRVAMn005 1 1
2
3
7 2 Y Y A N 1 64
HDRVAMn006 1 1
2 1 N N J N 1 69 HDRVAMn007 1 2 1
1
1
3 3
12 3 Y Y J N 1 60
HDRVAMn008
5
5 1 N N J N 3 215 HDRVAMn009
4
4 1 Y N J N 2 112
HDRVAMn010
1
2
3 2 Y Y J N 1 76 HDRVAMn011 1 3
4 1 Y N J N 1 60
HDRVAMn012
2 1
2
2 2 3
12 3 Y Y J N 2 25 HDRVAMn013 1 7 2
10 1 Y N J N 4 357
HDRVAMn014
5
1
1
7 3 Y N J N 1 60 HDRVAMn015
2
1
3 2 Y N J N 1 58
HDRVAMn016
1
1 1 N N U N 0 - HDRVAMn017
1
1 1 N N U N 0 -
HDRVAMn018
1
1 1 N N U Y 0 - HDRVAMn019
1
1 1 N N U N 0 -
HDRVAMn020
1
1 1 N N U N 0 - HDRVAMn021
2
1 2
5 2 N N SA N 1 78
HDRVAMn022
2
2 1 N N J N 1 85 HDRVAMn023
1
2 1 4 2 Y Y J N 1 80
HDRVAMn024
2
2 1 Y N A P 1 60 HDRVAMn025
1
1 1 Y N U N 1 62
DoN | Mid-Atlantic Humpback Whale Monitoring, Virginia Beach, VA: 2016/17 Annual Progress Report
August 2017 | 9
HDR Catalog ID
2014 2015 2015 2015 2015 2015 2016 2016 2016 2016 2016 2016 2017 2017 2017
Tota
l # D
ays
Seen
Tota
l # S
easo
ns S
een
Bio
psie
d? (Y
/N)
Sate
llite
Tag
ged?
(Y/N
)
Estim
ated
Age
Cla
ss (A
/J/S
A/U
)
Prop
sca
rs o
r inj
urie
s? (Y
/N/P
)
Tota
l No.
Foc
al F
ollo
ws
Tota
l No.
Foc
al F
ollo
w M
inut
es
Season 1 (2014/2015) Season 2 (2015/2016) Season 3 (2016/2017)
Dec
embe
r
Janu
ary
Febr
uary
Apr
il
Oct
ober
Dec
embe
r
Janu
ary
Febr
uary
Mar
ch
May
Nov
embe
r
Dec
embe
r
Janu
ary
Febr
uary
Mar
ch
Humpback Whales (continued) HDRVAMn027
2
2 1
1
6 2 Y N J N 1 61
HDRVAMn028
1
1 1 N N J N 0 - HDRVAMn029
1
1 1 Y N J P 1 63
HDRVAMn030
1 1
2 2 N N A N 1 62 HDRVAMn031
1
1
1 2 N Y J N 0 -
HDRVAMn032
1
1 1 N N SA N 1 - HDRVAMn033
1
1 1 N N J N 0 63
HDRVAMn034
1
1 1 N N J N 0 - HDRVAMn035
2
2 1 N N J N 0 -
HDRVAMn036
2
2 1 N N J N 0 - HDRVAMn037
2 1
3 1 N N J N 0 -
HDRVAMn039
1
1 1 Y Y J N 0 - HDRVAMn041
1
1 1 N Y J N 0 -
HDRVAMn042
4 2
6 1 N N J N 0 - HDRVAMn043
1
1 1 N N J N 0 -
HDRVAMn044
1
1 1 Y Y J Y 0 - HDRVAMn045
2 2 1 1
6 1 Y Y J Y 0 -
HDRVAMn046
2 2
4 1 N N J N 0 - HDRVAMn047
1
1 1 N N J N 0 -
HDRVAMn048
2
1
3 2 Y Y SA/A N 0 - HDRVAMn049
2
2 2 2
8 2 Y Y SA/A N 0 -
HDRVAMn050
1 3
4 1 Y N J N 0 - HDRVAMn051
1 2 5 1
9 1 Y N J Y 0 -
HDRVAMn052
3
3 1 Y N J N 0 - HDRVAMn053
2
2 1 N N J Y 0 -
HDRVAMn054
3 2 2
7 1 Y Y J N 0 -
DoN | Mid-Atlantic Humpback Whale Monitoring, Virginia Beach, VA: 2016/17 Annual Progress Report
August 2017 | 10
HDR Catalog ID
2014 2015 2015 2015 2015 2015 2016 2016 2016 2016 2016 2016 2017 2017 2017
Tota
l # D
ays
Seen
Tota
l # S
easo
ns S
een
Bio
psie
d? (Y
/N)
Sate
llite
Tag
ged?
(Y/N
)
Estim
ated
Age
Cla
ss (A
/J/S
A/U
)
Prop
sca
rs o
r inj
urie
s? (Y
/N/P
)
Tota
l No.
Foc
al F
ollo
ws
Tota
l No.
Foc
al F
ollo
w M
inut
es
Season 1 (2014/2015) Season 2 (2015/2016) Season 3 (2016/2017)
Dec
embe
r
Janu
ary
Febr
uary
Apr
il
Oct
ober
Dec
embe
r
Janu
ary
Febr
uary
Mar
ch
May
Nov
embe
r
Dec
embe
r
Janu
ary
Febr
uary
Mar
ch
Humpback Whales (continued) HDRVAMn055
2
2 1 N N J N 0 -
HDRVAMn056
2
2 1 N N J N 0 - HDRVAMn057
1
1 1 N N J N 0 -
HDRVAMn058
1
1 1 N N J/SA Y 0 - HDRVAMn059
1
2
3 2 Y Y SA N 0 -
HDRVAMn060
1
1 1 N N J N 0 - HDRVAMn061
3
3 1 Y Y J N 0 -
HDRVAMn062
2 1
3 1 N N J N 0 - HDRVAMn063
4
4 1 Y Y J N 1 120
HDRVAMn064
1 1
3 4 1 4
14 2 Y Y J N 0 - HDRVAMn065
1
1 2
4 2 N N J N 0 -
HDRVAMn066
2
2
4 2 Y Y J N 0 - HDRVAMn068
1
1 1 N N J N 0 -
HDRVAMn069
1
1 1 Y Y SA N 0 - HDRVAMn070
1
1 1 N N J N 0 -
HDRVAMn071
2
2 1 Y Y SA N 0 - HDRVAMn072
1
1 1 N N J N 0 -
HDRVAMn073
1
1 1 N N SA N 0 - HDRVAMn074
1
1 1 N N J N 0 -
HDRVAMn075
1
1 1 N N SA N 0 - HDRVAMn076
1
1 1 N N SA N 0 -
HDRVAMn077
1
1 1 N N SA N 0 - HDRVAMn078
1 *
1 1 N N J N 0 -
HDRVAMn079
1
2
3 1 N N J N 0 - HDRVAMn080
1
1 1 N N J N 0 -
HDRVAMn081
2 4 3
9 1 Y Y J N 0 -
DoN | Mid-Atlantic Humpback Whale Monitoring, Virginia Beach, VA: 2016/17 Annual Progress Report
August 2017 | 11
HDR Catalog ID
2014 2015 2015 2015 2015 2015 2016 2016 2016 2016 2016 2016 2017 2017 2017
Tota
l # D
ays
Seen
Tota
l # S
easo
ns S
een
Bio
psie
d? (Y
/N)
Sate
llite
Tag
ged?
(Y/N
)
Estim
ated
Age
Cla
ss (A
/J/S
A/U
)
Prop
sca
rs o
r inj
urie
s? (Y
/N/P
)
Tota
l No.
Foc
al F
ollo
ws
Tota
l No.
Foc
al F
ollo
w M
inut
es
Season 1 (2014/2015) Season 2 (2015/2016) Season 3 (2016/2017)
Dec
embe
r
Janu
ary
Febr
uary
Apr
il
Oct
ober
Dec
embe
r
Janu
ary
Febr
uary
Mar
ch
May
Nov
embe
r
Dec
embe
r
Janu
ary
Febr
uary
Mar
ch
Humpback Whales (continued) HDRVAMn082
1
3
3 1 Y Y J N 0 -
HDRVAMn083
1 1
2 1 Y Y J N 0 - HDRVAMn084
1 5 5
11 1 Y Y J N 0 -
HDRVAMn085
1 4 3
8 1 N N J Y 0 - HDRVAMn086
1
1 1 N N J N 0 -
HDRVAMn087
3
3 1 N N J N 0 - HDRVAMn088
4 2
6 1 Y Y J N 0 -
HDRVAMn089
1
1 1 N N J N 0 - HDRVAMn090
4 *
4 1 Y Y J Y 0 -
HDRVAMn091
3 2*
5 1 N N SA Y 0 - HDRVAMn092
2 4
6 1 Y Y J N 0 -
HDRVAMn093
2 4
6 1 N N J N 0 - HDRVAMn094
1
1 1 N N J N 0 -
HDRVAMn095
2
2 1 Y Y J N 0 - HDRVAMn096
3 2
5 1 Y N J N 0 -
HDRVAMn097
1
1 1 N Y J N 0 - HDRVAMn098
3 5
8 1 Y N J N 0 -
HDRVAMn099
2 4
6 1 Y Y J N 0 - HDRVAMn100
1*
1 1 N N J N 0 -
HDRVAMn101
1
1 1 Y Y J N 0 - HDRVAMn102
2 4 1 7 1 Y Y J N 0 -
HDRVAMn103
1 3
4 1 N N J N 0 - HDRVAMn104
2 2
4 1 Y Y J N 0 -
HDRVAMn105
1 2
3 1 Y Y J N 0 - HDRVAMn106
1 2
3 1 N N J P 0 -
HDRVAMn107
2
2 1 N N J N 0 -
DoN | Mid-Atlantic Humpback Whale Monitoring, Virginia Beach, VA: 2016/17 Annual Progress Report
August 2017 | 12
HDR Catalog ID
2014 2015 2015 2015 2015 2015 2016 2016 2016 2016 2016 2016 2017 2017 2017
Tota
l # D
ays
Seen
Tota
l # S
easo
ns S
een
Bio
psie
d? (Y
/N)
Sate
llite
Tag
ged?
(Y/N
)
Estim
ated
Age
Cla
ss (A
/J/S
A/U
)
Prop
sca
rs o
r inj
urie
s? (Y
/N/P
)
Tota
l No.
Foc
al F
ollo
ws
Tota
l No.
Foc
al F
ollo
w M
inut
es
Season 1 (2014/2015) Season 2 (2015/2016) Season 3 (2016/2017)
Dec
embe
r
Janu
ary
Febr
uary
Apr
il
Oct
ober
Dec
embe
r
Janu
ary
Febr
uary
Mar
ch
May
Nov
embe
r
Dec
embe
r
Janu
ary
Febr
uary
Mar
ch
Humpback Whales (continued) HDRVAMn108
2
2 1 N N J N 0 -
HDRVAMn109
2 1 3 1 Y N J N 0 - HDRVAMn110
2
2 1 N N J N 0 -
HDRVAMn111
1
1 1 Y N SA/A 0 - HDRVAMn112
1
1 1 Y N J 0 -
Total 7 49 5 5 1 30 32 18 9 1 24 19 70 66 3 45 35 9 29 1951
Fin Whales HDRVABp001
1
1 1 N N A N 1 61
HDRVABp002
1
1 1 N N C N 0 - HDRVABp003
1
1 1 N N A N 0 -
HDRVABp009
2
2 1 N N SA/A N 0 - HDRVABp010
2
2 1 N N SA/A N 0 -
HDRVABp011
1
1 1 N N A N 0 - Total
3 0 0 0 0 0 5 0 0 0 0 0 0 0
1 1 1 61 Minke Whales HDRVABa003
1
1 1 N N A N 0 -
HDRVABa004
1
1 1 N N A N 0 - Total
0 0 0 0 0 0 0 0 0 0 0 0 2 0
Key: * = deceased; Y = yes; N = no; P = possible; A = adult; SA = sub-adult; J = juvenile; C = calf; U = unknown
DoN | Mid-Atlantic Humpback Whale Monitoring, Virginia Beach, VA: 2016/17 Annual Progress Report
August 2017 | 13
Figure 4. Survey tracks and locations of all humpback (n=168), minke (n=3), and unidentified large baleen whale (n=1) sightings: November 2016–March 2017.
DoN | Mid-Atlantic Humpback Whale Monitoring, Virginia Beach, VA: 2016/17 Annual Progress Report
August 2017 | 14
The 168 sightings of 248 total individual humpback whales equated to 59 unique humpback whales identified during the 2016/2017 field season (Table 2). Forty-five (76.3 percent) of those whales were categorized as juveniles based on their estimated size and the remaining 14 (23.7 percent) were categorized as sub-adults or adults. Fifteen (25.4 percent) of the 59 individuals were re-sights to HDR’s catalog; nine were first seen during the 2014/2015 field season and six were first seen during the 2015/2016 field season (Table 2). The remaining 44 whales were new individuals added to HDRs growing catalog, which, to date, has 107 unique humpback whales (not inclusive of humpback whale identifications from the Outer Continental Shelf Break Cetacean Study – see Engelhaupt et al. 2017). Forty-one of the 59 (69.5 percent) humpback whales were seen on more than one occasion during the 2016/2017 field season. When looking only at the first and last sighting date, and excluding same-day re-sightings, humpback whales were re-sighted between 1.9 and 75.0 days apart with a mean re-sighting period of 32.9 days.
Evidence of vessel interaction is apparent on at least nine of the 107 (8.4 percent) humpback whales in HDR’s catalog. Four of the whales added during the 2016/2017 field season were later found dead. HDRVAMn078 came ashore on Corolla, North Carolina; HDRVAMn090 came ashore on Virginia Beach, Virginia; HDRVAMn091 was towed to Cape Charles, Virginia; and HDRVAMn100 was towed to Norfolk, Virginia. Post-mortem examination revealed three of these were males and one (HDRVAMn078) was a female (pers. comm. Sarah Mallette). Cause of death for three of the four whales (HDRVAMn090, HDRVAMn091, and HDRVAMn100) was likely due to large vessel interactions (NMFS 2017), with two animals having large propeller wounds (HDRVAMn090 and HDRVAMn100) (Table 2). Cause of death for the fourth whale (HDRVAMn078) was linked to human interaction (fisheries) (NMFS 2017), however, when this individual was observed alive by HDR during survey effort, the animal appeared to be severely emaciated to the point where the team opted not to deploy a satellite tag on this whale.
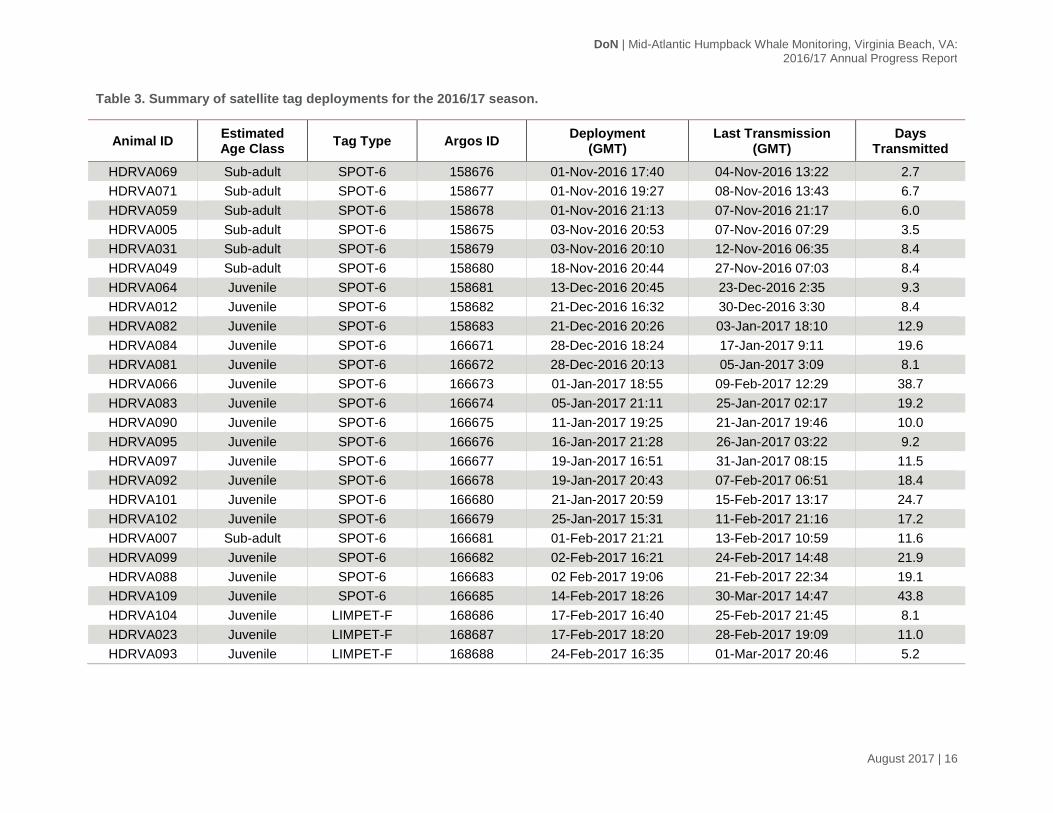
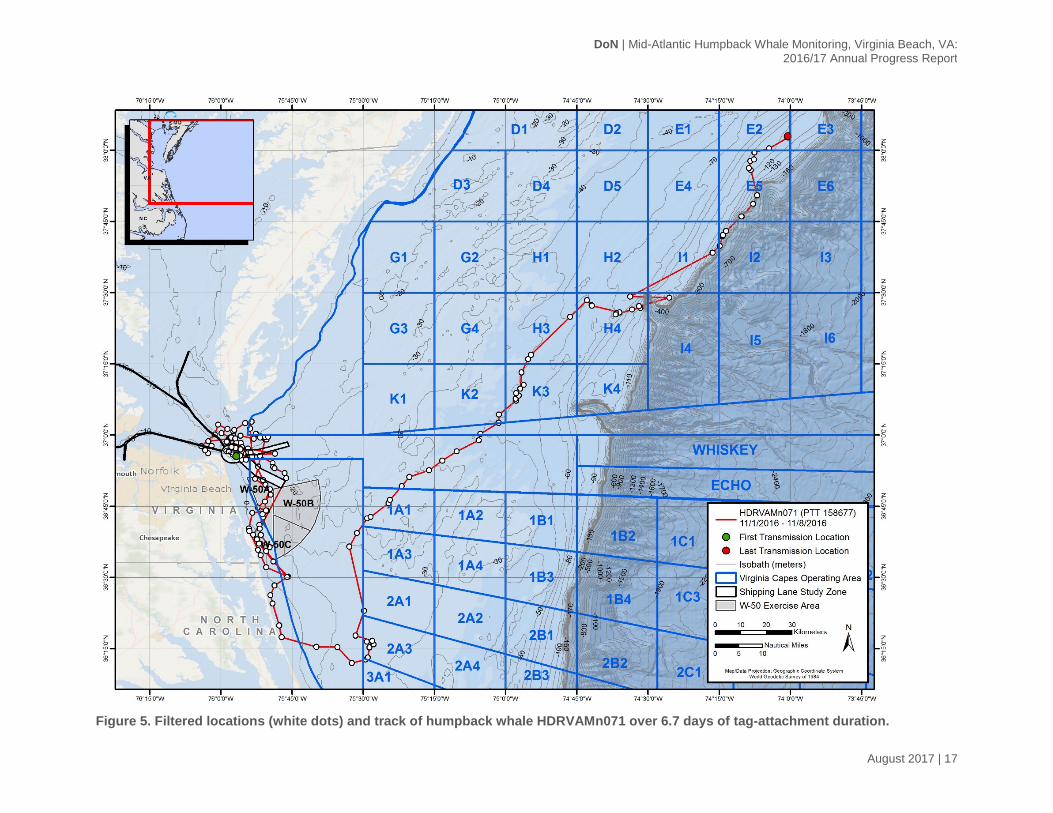
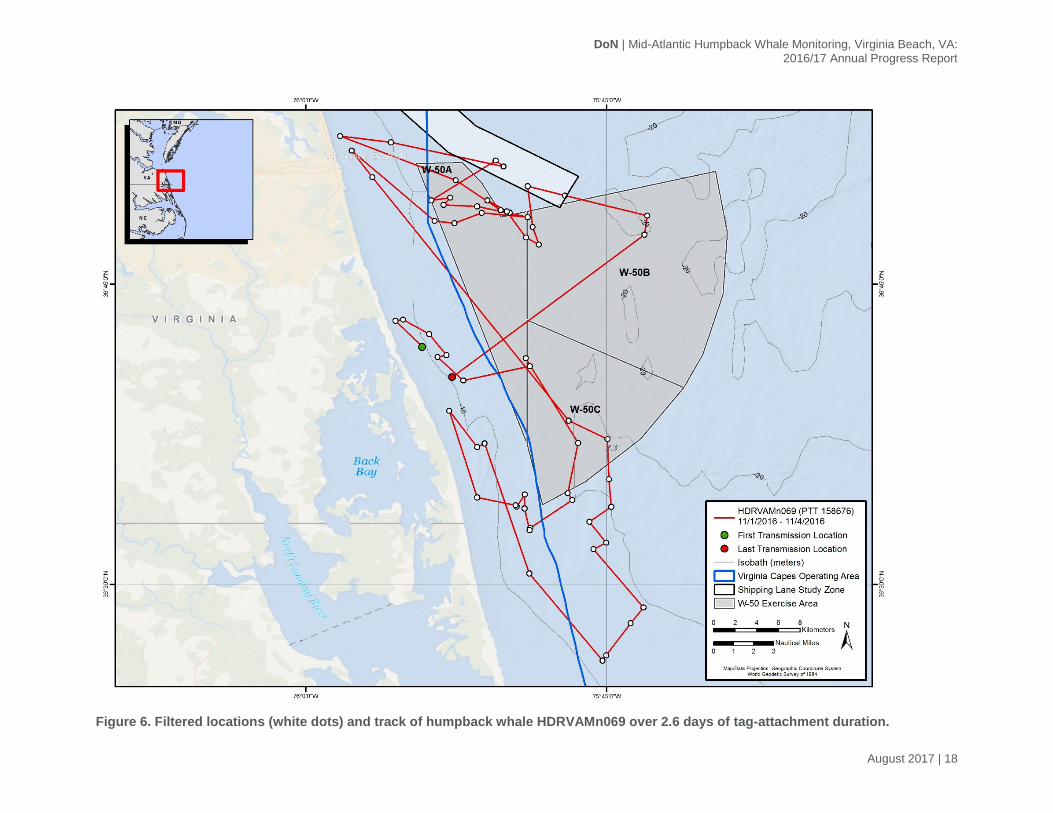
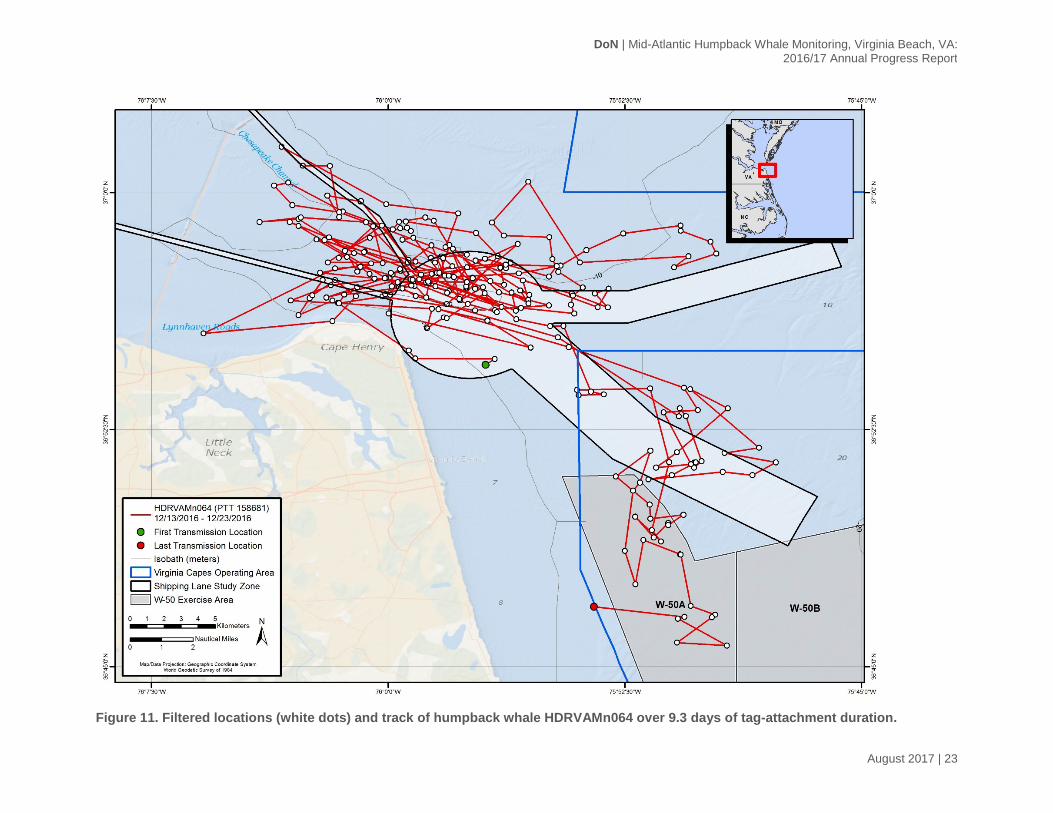
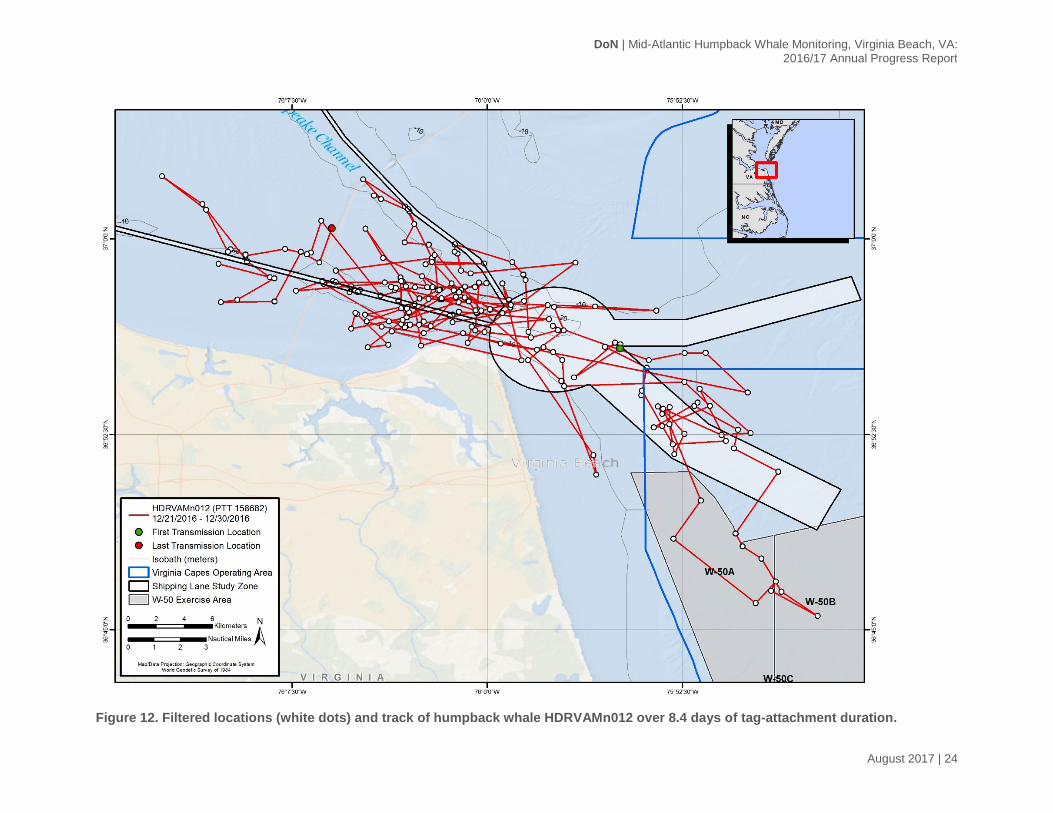
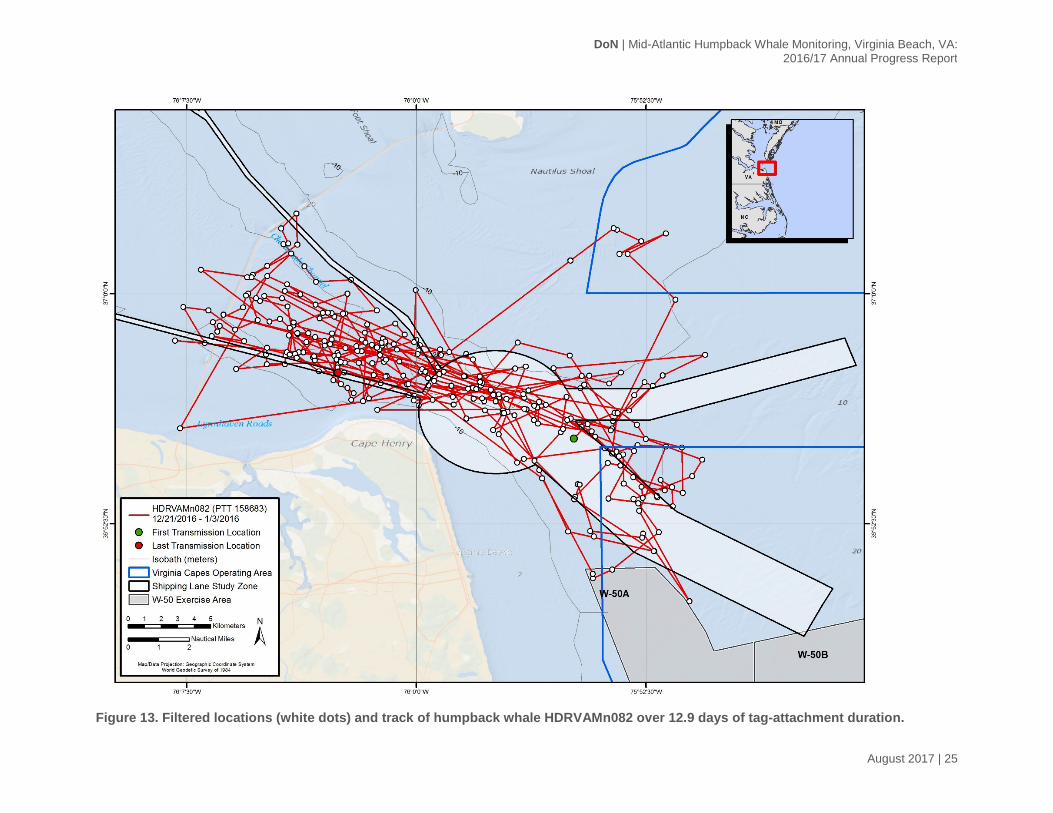
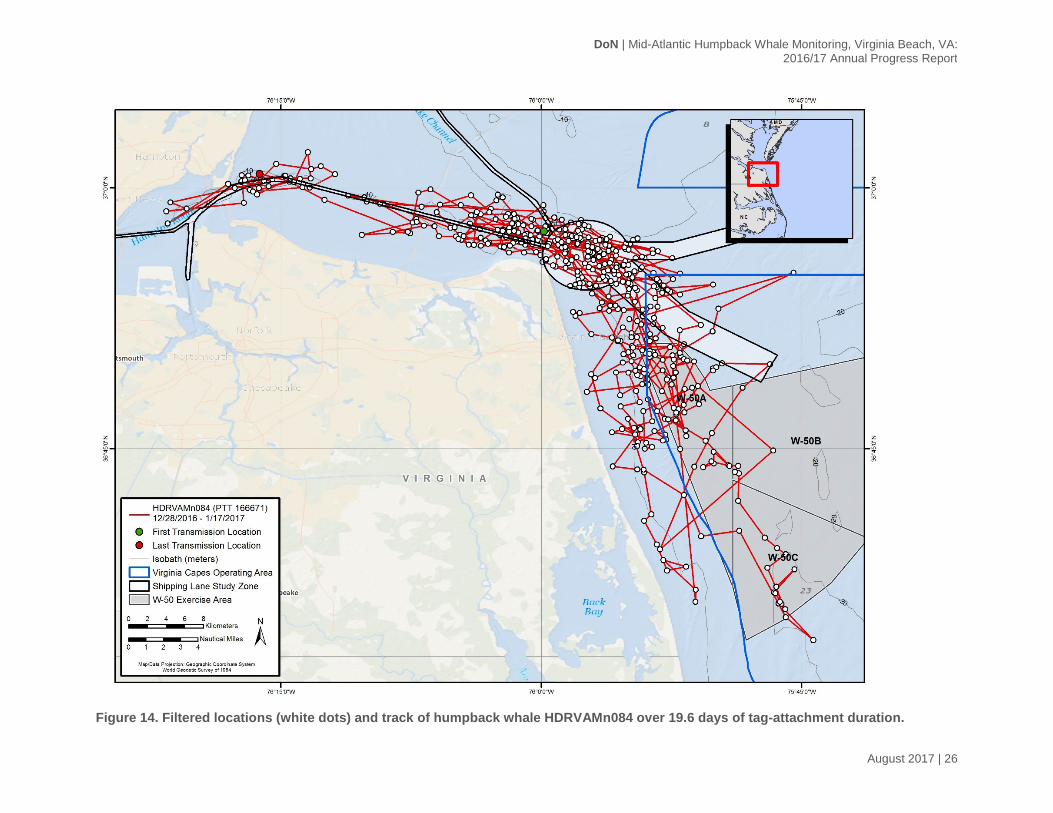
Twenty-three SPOT-6 and three LIMPET-F satellite tags were deployed (Figures 5 through 30) and transmitted between 2.7 and 43.9 days (mean = 13.9 days) (Table 3). All tags deployed during the month of November were on animals classified as sub-adults. Tags deployed during the months of December through February (with the exception of one) were deployed on juveniles. Argos locations were recorded in the shipping lanes for all whales. Fifteen of the 26 (57.7 percent) tagged animals had Argos locations west of the Chesapeake Bay Bridge-Tunnel (CBBT). This was a large increase when compared to the 2015/2016 field season where only two of nine (22.2 percent) had locations west of the CBBT (see Aschettino et al. 2016). Four whales never left the primary nearshore study area for the duration of the satellite tag’s transmissions (HDRVAMn064, HDRVAMn081, HDRVAMn093, and HDRVAMn102) (Figure 11, Figure 15, Figure 23, and Figure 30). The remainder of the tagged whales used the primary nearshore study area, as well as additional offshore areas or areas outside the primary nearshore study area (e.g., west of the CBBT). All but two whales had Argos locations in the W-50 MINEX zone, multiple whales had Argos locations along the continental shelf, and HDRVAMn071 and HDRVAMn101 (Figures 5 and 22) had locations extending beyond the continental shelf break. HDRVAMn071 traveled the greatest straight-line distance from the initial tagging location (Figure 5), with the last Argos location recorded approximately 122 km off Assateague, Virginia.
DoN | Mid-Atlantic Humpback Whale Monitoring, Virginia Beach, VA: 2016/17 Annual Progress Report
August 2017 | 15
Twenty-eight biopsy samples were collected with enough skin on all but one sample to also be used for stable isotope analysis (Table 2). Thirty-one samples from the 2014/2015 and 2015/2016 field season, comprised of 29 humpback and two fin whale samples were sent to Duke University for stable isotope analysis. See Appendix A for a report of findings from these analyses. HDR has completed the necessary paperwork and is waiting for CITES to issue an export permit before genetic samples can be shipped to the University of Groningen in the Netherlands for processing and integration into a larger North Atlantic humpback whale population study.
DoN | Mid-Atlantic Humpback Whale Monitoring, Virginia Beach, VA: 2016/17 Annual Progress Report
August 2017 | 16
Table 3. Summary of satellite tag deployments for the 2016/17 season.
Animal ID Estimated Age Class Tag Type Argos ID Deployment
(GMT) Last Transmission
(GMT) Days
Transmitted
HDRVA069 Sub-adult SPOT-6 158676 01-Nov-2016 17:40 04-Nov-2016 13:22 2.7 HDRVA071 Sub-adult SPOT-6 158677 01-Nov-2016 19:27 08-Nov-2016 13:43 6.7 HDRVA059 Sub-adult SPOT-6 158678 01-Nov-2016 21:13 07-Nov-2016 21:17 6.0 HDRVA005 Sub-adult SPOT-6 158675 03-Nov-2016 20:53 07-Nov-2016 07:29 3.5 HDRVA031 Sub-adult SPOT-6 158679 03-Nov-2016 20:10 12-Nov-2016 06:35 8.4 HDRVA049 Sub-adult SPOT-6 158680 18-Nov-2016 20:44 27-Nov-2016 07:03 8.4 HDRVA064 Juvenile SPOT-6 158681 13-Dec-2016 20:45 23-Dec-2016 2:35 9.3 HDRVA012 Juvenile SPOT-6 158682 21-Dec-2016 16:32 30-Dec-2016 3:30 8.4 HDRVA082 Juvenile SPOT-6 158683 21-Dec-2016 20:26 03-Jan-2017 18:10 12.9 HDRVA084 Juvenile SPOT-6 166671 28-Dec-2016 18:24 17-Jan-2017 9:11 19.6 HDRVA081 Juvenile SPOT-6 166672 28-Dec-2016 20:13 05-Jan-2017 3:09 8.1 HDRVA066 Juvenile SPOT-6 166673 01-Jan-2017 18:55 09-Feb-2017 12:29 38.7 HDRVA083 Juvenile SPOT-6 166674 05-Jan-2017 21:11 25-Jan-2017 02:17 19.2 HDRVA090 Juvenile SPOT-6 166675 11-Jan-2017 19:25 21-Jan-2017 19:46 10.0 HDRVA095 Juvenile SPOT-6 166676 16-Jan-2017 21:28 26-Jan-2017 03:22 9.2 HDRVA097 Juvenile SPOT-6 166677 19-Jan-2017 16:51 31-Jan-2017 08:15 11.5 HDRVA092 Juvenile SPOT-6 166678 19-Jan-2017 20:43 07-Feb-2017 06:51 18.4 HDRVA101 Juvenile SPOT-6 166680 21-Jan-2017 20:59 15-Feb-2017 13:17 24.7 HDRVA102 Juvenile SPOT-6 166679 25-Jan-2017 15:31 11-Feb-2017 21:16 17.2 HDRVA007 Sub-adult SPOT-6 166681 01-Feb-2017 21:21 13-Feb-2017 10:59 11.6 HDRVA099 Juvenile SPOT-6 166682 02-Feb-2017 16:21 24-Feb-2017 14:48 21.9 HDRVA088 Juvenile SPOT-6 166683 02 Feb-2017 19:06 21-Feb-2017 22:34 19.1 HDRVA109 Juvenile SPOT-6 166685 14-Feb-2017 18:26 30-Mar-2017 14:47 43.8 HDRVA104 Juvenile LIMPET-F 168686 17-Feb-2017 16:40 25-Feb-2017 21:45 8.1 HDRVA023 Juvenile LIMPET-F 168687 17-Feb-2017 18:20 28-Feb-2017 19:09 11.0 HDRVA093 Juvenile LIMPET-F 168688 24-Feb-2017 16:35 01-Mar-2017 20:46 5.2
DoN | Mid-Atlantic Humpback Whale Monitoring, Virginia Beach, VA: 2016/17 Annual Progress Report
August 2017 | 17
Figure 5. Filtered locations (white dots) and track of humpback whale HDRVAMn071 over 6.7 days of tag-attachment duration.
DoN | Mid-Atlantic Humpback Whale Monitoring, Virginia Beach, VA: 2016/17 Annual Progress Report
August 2017 | 18
Figure 6. Filtered locations (white dots) and track of humpback whale HDRVAMn069 over 2.6 days of tag-attachment duration.
DoN | Mid-Atlantic Humpback Whale Monitoring, Virginia Beach, VA: 2016/17 Annual Progress Report
August 2017 | 19
Figure 7. Filtered locations (white dots) and track of humpback whale HDRVAMn059 over 6.0 days of tag-attachment duration.
DoN | Mid-Atlantic Humpback Whale Monitoring, Virginia Beach, VA: 2016/17 Annual Progress Report
August 2017 | 20
Figure 8. Filtered locations (white dots) and track of humpback whale HDRVAMn005 over 3.5 days of tag-attachment duration.
DoN | Mid-Atlantic Humpback Whale Monitoring, Virginia Beach, VA: 2016/17 Annual Progress Report
August 2017 | 21
Figure 9. Filtered locations (white dots) and track of humpback whale HDRVAMn031 over 8.4 days of tag-attachment duration.
DoN | Mid-Atlantic Humpback Whale Monitoring, Virginia Beach, VA: 2016/17 Annual Progress Report
August 2017 | 22
Figure 10. Filtered locations (white dots) and track of humpback whale HDRVAMn049 over 8.4 days of tag-attachment duration.
DoN | Mid-Atlantic Humpback Whale Monitoring, Virginia Beach, VA: 2016/17 Annual Progress Report
August 2017 | 23
Figure 11. Filtered locations (white dots) and track of humpback whale HDRVAMn064 over 9.3 days of tag-attachment duration.
DoN | Mid-Atlantic Humpback Whale Monitoring, Virginia Beach, VA: 2016/17 Annual Progress Report
August 2017 | 24
Figure 12. Filtered locations (white dots) and track of humpback whale HDRVAMn012 over 8.4 days of tag-attachment duration.
DoN | Mid-Atlantic Humpback Whale Monitoring, Virginia Beach, VA: 2016/17 Annual Progress Report
August 2017 | 25
Figure 13. Filtered locations (white dots) and track of humpback whale HDRVAMn082 over 12.9 days of tag-attachment duration.
DoN | Mid-Atlantic Humpback Whale Monitoring, Virginia Beach, VA: 2016/17 Annual Progress Report
August 2017 | 26
Figure 14. Filtered locations (white dots) and track of humpback whale HDRVAMn084 over 19.6 days of tag-attachment duration.
DoN | Mid-Atlantic Humpback Whale Monitoring, Virginia Beach, VA: 2016/17 Annual Progress Report
August 2017 | 27
Figure 15. Filtered locations (white dots) and track of humpback whale HDRVAMn081 over 8.1 days of tag-attachment duration.
DoN | Mid-Atlantic Humpback Whale Monitoring, Virginia Beach, VA: 2016/17 Annual Progress Report
August 2017 | 28
Figure 16. Filtered locations (white dots) and track of humpback whale HDRVAMn066 over 38.7 days of tag-attachment duration.
DoN | Mid-Atlantic Humpback Whale Monitoring, Virginia Beach, VA: 2016/17 Annual Progress Report
August 2017 | 29
Figure 17. Filtered locations (white dots) and track of humpback whale HDRVAMn083 over 19.2 days of tag-attachment duration.
DoN | Mid-Atlantic Humpback Whale Monitoring, Virginia Beach, VA: 2016/17 Annual Progress Report
August 2017 | 30
Figure 18. Filtered locations (white dots) and track of humpback whale HDRVAMn090 over 10.0 days of tag-attachment duration.
DoN | Mid-Atlantic Humpback Whale Monitoring, Virginia Beach, VA: 2016/17 Annual Progress Report
August 2017 | 31
Figure 19. Filtered locations (white dots) and track of humpback whale HDRVAMn095 over 9.2 days of tag-attachment duration
DoN | Mid-Atlantic Humpback Whale Monitoring, Virginia Beach, VA: 2016/17 Annual Progress Report
August 2017 | 32
Figure 20. Filtered locations (white dots) and track of humpback whale HDRVAMn097 over 11.5 days of tag-attachment duration.
DoN | Mid-Atlantic Humpback Whale Monitoring, Virginia Beach, VA: 2016/17 Annual Progress Report
August 2017 | 33
Figure 21. Filtered locations (white dots) and track of humpback whale HDRVAMn092 over 18.4 days of tag-attachment duration.
DoN | Mid-Atlantic Humpback Whale Monitoring, Virginia Beach, VA: 2016/17 Annual Progress Report
August 2017 | 34
Figure 22. Filtered locations (white dots) and track of humpback whale HDRVAMn101 over 24.7 days of tag-attachment duration
DoN | Mid-Atlantic Humpback Whale Monitoring, Virginia Beach, VA: 2016/17 Annual Progress Report
August 2017 | 35
Figure 23. Filtered locations (white dots) and track of humpback whale HDRVAMn102 over 17.2 days of tag-attachment duration.
DoN | Mid-Atlantic Humpback Whale Monitoring, Virginia Beach, VA: 2016/17 Annual Progress Report
August 2017 | 36
Figure 24. Filtered locations (white dots) and track of humpback whale HDRVAMn007 over 11.6 days of tag-attachment duration.
DoN | Mid-Atlantic Humpback Whale Monitoring, Virginia Beach, VA: 2016/17 Annual Progress Report
August 2017 | 37
Figure 25. Filtered locations (white dots) and track of humpback whale HDRVAMn099 over 21.9 days of tag-attachment duration.
DoN | Mid-Atlantic Humpback Whale Monitoring, Virginia Beach, VA: 2016/17 Annual Progress Report
August 2017 | 38
Figure 26. Filtered locations (white dots) and track of humpback whale HDRVAMn088 over 19.1 days of tag-attachment duration.
DoN | Mid-Atlantic Humpback Whale Monitoring, Virginia Beach, VA: 2016/17 Annual Progress Report
August 2017 | 39
Figure 27. Filtered locations (white dots) and track of humpback whale HDRVAMn105 over 43.8 days of tag-attachment duration.
DoN | Mid-Atlantic Humpback Whale Monitoring, Virginia Beach, VA: 2016/17 Annual Progress Report
August 2017 | 40
Figure 28. Filtered locations (white dots) and track of humpback whale HDRVAMn104 over 8.1 days of tag-attachment duration.
DoN | Mid-Atlantic Humpback Whale Monitoring, Virginia Beach, VA: 2016/17 Annual Progress Report
August 2017 | 41
Figure 29. Filtered locations (white dots) and track of humpback whale HDRVAMn023 over 11.0 days of tag-attachment duration.
DoN | Mid-Atlantic Humpback Whale Monitoring, Virginia Beach, VA: 2016/17 Annual Progress Report
August 2017 | 42
Figure 30. Filtered locations (white dots) and track of humpback whale HDRVAMn093 over 5.2 days of tag-attachment duration.
DoN | Mid-Atlantic Humpback Whale Monitoring, Virginia Beach, VA: 2016/17 Annual Progress Report
August 2017 | 43
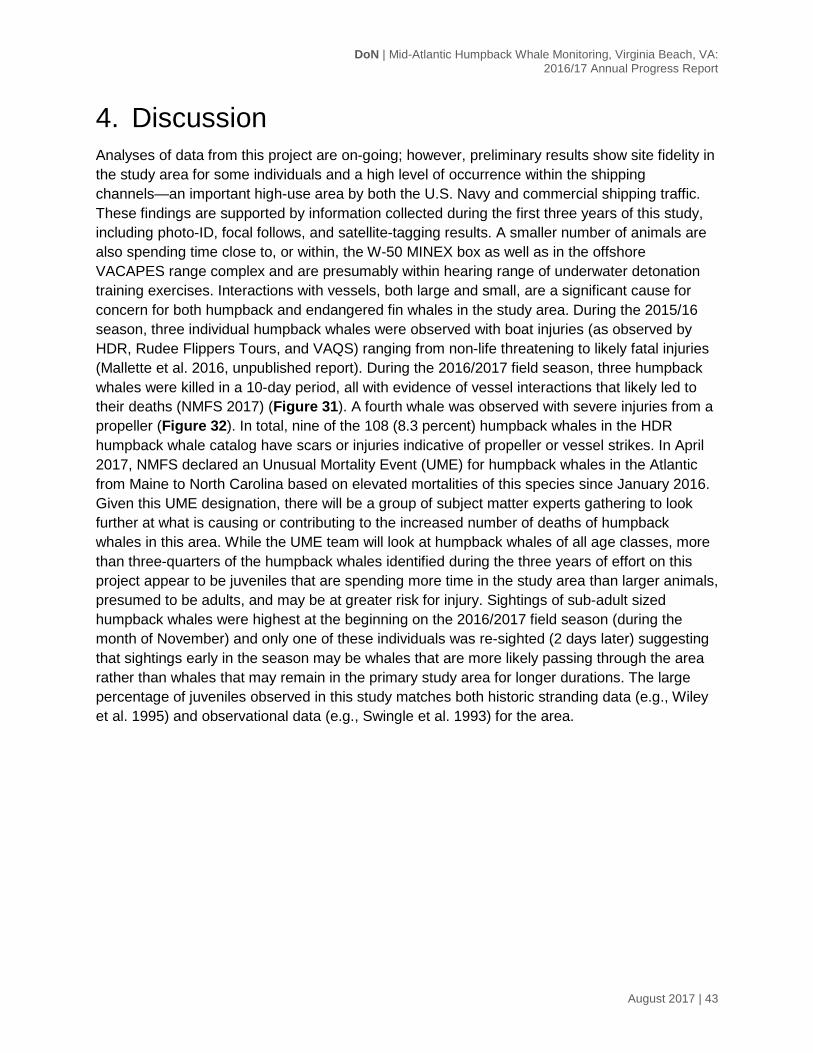
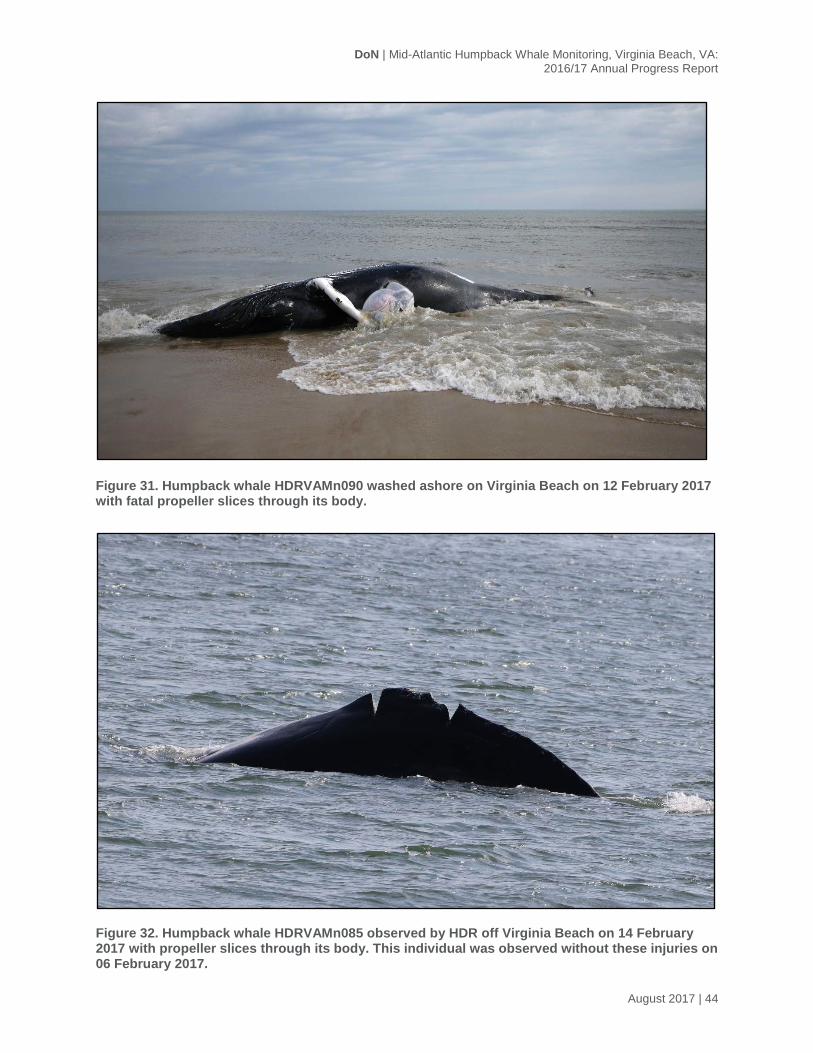
4. Discussion Analyses of data from this project are on-going; however, preliminary results show site fidelity in the study area for some individuals and a high level of occurrence within the shipping channels—an important high-use area by both the U.S. Navy and commercial shipping traffic. These findings are supported by information collected during the first three years of this study, including photo-ID, focal follows, and satellite-tagging results. A smaller number of animals are also spending time close to, or within, the W-50 MINEX box as well as in the offshore VACAPES range complex and are presumably within hearing range of underwater detonation training exercises. Interactions with vessels, both large and small, are a significant cause for concern for both humpback and endangered fin whales in the study area. During the 2015/16 season, three individual humpback whales were observed with boat injuries (as observed by HDR, Rudee Flippers Tours, and VAQS) ranging from non-life threatening to likely fatal injuries (Mallette et al. 2016, unpublished report). During the 2016/2017 field season, three humpback whales were killed in a 10-day period, all with evidence of vessel interactions that likely led to their deaths (NMFS 2017) (Figure 31). A fourth whale was observed with severe injuries from a propeller (Figure 32). In total, nine of the 108 (8.3 percent) humpback whales in the HDR humpback whale catalog have scars or injuries indicative of propeller or vessel strikes. In April 2017, NMFS declared an Unusual Mortality Event (UME) for humpback whales in the Atlantic from Maine to North Carolina based on elevated mortalities of this species since January 2016. Given this UME designation, there will be a group of subject matter experts gathering to look further at what is causing or contributing to the increased number of deaths of humpback whales in this area. While the UME team will look at humpback whales of all age classes, more than three-quarters of the humpback whales identified during the three years of effort on this project appear to be juveniles that are spending more time in the study area than larger animals, presumed to be adults, and may be at greater risk for injury. Sightings of sub-adult sized humpback whales were highest at the beginning on the 2016/2017 field season (during the month of November) and only one of these individuals was re-sighted (2 days later) suggesting that sightings early in the season may be whales that are more likely passing through the area rather than whales that may remain in the primary study area for longer durations. The large percentage of juveniles observed in this study matches both historic stranding data (e.g., Wiley et al. 1995) and observational data (e.g., Swingle et al. 1993) for the area.
DoN | Mid-Atlantic Humpback Whale Monitoring, Virginia Beach, VA: 2016/17 Annual Progress Report
August 2017 | 44
Figure 31. Humpback whale HDRVAMn090 washed ashore on Virginia Beach on 12 February 2017 with fatal propeller slices through its body.
Figure 32. Humpback whale HDRVAMn085 observed by HDR off Virginia Beach on 14 February 2017 with propeller slices through its body. This individual was observed without these injuries on 06 February 2017.
DoN | Mid-Atlantic Humpback Whale Monitoring, Virginia Beach, VA: 2016/17 Annual Progress Report
August 2017 | 45
The number of humpback whale identifications per season has grown steadily over the course of this project. There were 31 unique humpback whales identified during the 2014/2015 season, 37 during the 2015/2016 field season (including six individuals seen during the 2014/2015 season) and 59 during the current 2016/2017 field season (including 15 re-sightings from the previous two seasons). Part of this is likely due to effort—the 2016/2017 field season began two months earlier than the 2014/2015 season and one month earlier than the 2015/2016 field season. Also, during the 2014/2015 season, effort was focused on collecting focal follows of individual whales, so priority was given with staying with one whale over a longer period of time rather than collecting as many identification photographs of animals in the surrounding areas. Overall effort on the water, both in terms of days and hours used has also increased with each field season, partially accounting for the increase in sighting information during this season.
Further analysis of tag data is expected to occur during the summer/fall of 2017, including switching state space modeling. While only nine satellite tags were deployed during the 2015/2016 field season, satellite tagging efforts during the 2016/2017 field season greatly increases the existing dataset and our overall understanding of where humpback whales are spending their time in and around the Hampton Roads waters. While much of the data have matched sighting locations with ‘hot spots’ in and around the shipping channels, the amount of time some individual tagged whales were spending west of the CBBT was somewhat unexpected. Multiple tagged whales had locations near Naval Station Norfolk and Joint Expeditionary Base Little Creek (JEBLC). Although less survey effort focused in waters west of the CBBT, it should be considered a primary area of interest in future years given the high traffic flow, increased vessel speed allowed, and extent of marine-based training occurring at JEBLC. An explanation for increased presence of humpback whales west of the CBBT is likely caused by a combination of factors including but not limited to: 1) a short-term distributional shift related to overall oceanographic conditions causing prey to become more concentrated further into the bay than in previous years and 2) better documentation of whale presence through an increased number of satellite tags deployed.
The number of sightings of humpback whales and other species (including endangered fin whales), as well as the level of interaction between whales and vessel traffic to date, support previous recommendations to continue this study using the same techniques described above in order to better understand movement patterns. We remain confident that the inclusion of Wildlife Computer’s LIMPET-F tags with Fastloc® GPS technology (trialed on humpback whales by HDR in February 2017), capable of providing high-resolution data logging, will provide superior quality with respect to accuracy of locations. HDR also recommends the deployment of D-Tag technology into their current study in order to examine the three-dimensional movements of humpback whales and fin whales foraging within and around high-traffic shipping channels. All of this information will provide a better understanding of the occurrence and behavior of whales in this area and provide a necessary stepping stone for future mid-Atlantic behavioral response studies.
DoN | Mid-Atlantic Humpback Whale Monitoring, Virginia Beach, VA: 2016/17 Annual Progress Report
August 2017 | 46
5. Acknowledgements This project is funded by U.S. Fleet Forces Command and managed by Naval Facilities Engineering Command Atlantic (NAVFAC LANT) as part of the U.S. Navy’s marine species monitoring program. HDR would like to acknowledge our Contracting Officer’s Technical Representative, Joel Bell, for his continued oversight and support for this project in addition to his time assisting in the field. HDR thanks Todd Pusser for his assistance in the field. From NAVFAC we would also like to thank Jackie Bort Thornton, Danielle Jones, and Jamie Gormley for their assistance in the field. HDR would like to acknowledge Sarah Mallette and Alexis Rabon from VAQS along with the captains and crew of VAQS’ Atlantic Explorer as well as Kristin Rayfield and the captains and crew of Rudee Flipper Tours for coordination of real-time humpback whale sightings. Sarah, Alexis, and Kristin were also especially helpful in sharing photo and sighting information from tagged and/or biopsied humpback whales. HDR thanks Sarah and other staff from VAQS—Sue Barco and Mark Swingle, as well as Peter Stevick, Tom Fernald, and Leah Crowe from Allied Whale, for sharing humpback sighting information from the 2014/15 field season. HDR would like to thank Zach Swaim of Duke University for coordinating and sharing sighting information from their project during the month of January. HDR would also like to thank the veterinarians and staff at Virginia Beach Veterinary Hospital for dart autoclave. We thank Brian Lockwood (aka “Jet Ski Brian”) who provided us with numerous photos of our boat in the field. All surveys were conducted under National Marine Fisheries Service Scientific Permit 16239 held by Dan Engelhaupt.
DoN | Mid-Atlantic Humpback Whale Monitoring, Virginia Beach, VA: 2016/17 Annual Progress Report
August 2017 | 47
6. References Andrews, R.D., R.L. Pitman and L.T. Balance. 2008. Satellite tracking reveals distinct
movement patterns for Type B and Type C killer whales in the southern Ross Sea, Antarctica. Polar Biology, 31(12), 1461–1468. DOI 10.1007/s00300-008-0487-z.
Aschettino, J., A. Engelhaupt, and D. Engelhaupt. 2015. Mid-Atlantic Humpback Whale Monitoring, Virginia Beach, VA: 2014/15 Annual Progress Report. Final Report. Prepared for U.S. Fleet Forces Command. Submitted to Naval Facilities Engineering Command Atlantic, Norfolk, Virginia, under Contract No. N62470-10-3011, Task Order 054, issued to HDR Inc., Virginia Beach, Virginia. 29 June 2015.
Aschettino, J.M., D. Engelhaupt, A. Engelhaupt, and M. Richlen. 2016. Mid-Atlantic Humpback Whale Monitoring, Virginia Beach, Virginia: 2015/16 Annual Progress Report. Final Report. Prepared for U.S. Fleet Forces Command. Submitted to Naval Facilities Engineering Command Atlantic, Norfolk, Virginia, under Contract Nos. N62470-10-3011, Task Orders 03 and 54, and N62470-15-8006, Task Order 13, issued to HDR Inc., Virginia Beach, Virginia. 30 August 2016.
Barco, S.G., W.A. McLellan, J.M. Allen, R.A. Asmutis-Silvia, R. Mallon-Day, E.M. Meagher, D.A. Pabst, J. Robbins, R.E. Seton, W.M. Swingle, M.T. Weinrich, and P.J. Clapham. 2002. Population identity of humpback whales (Megaptera novaeangliae) in the waters of the US mid-Atlantic states. Journal of Cetacean Research and Management, 4(2), 135–141.
Bettridge, S., C.S. Baker, J. Barlow, P.J. Clapham, M. Ford, D. Gouveia, D. Mattila, R.M. Pace III, P.E. Rosel, G.K. Silber, and P.R. Wade. 2015. Status Review of the Humpback Whale (Megaptera novaeangliae) Under the Endangered Species Act. NOAA Technical Memorandum NMFS-SWFSC-540. National Marine Fisheries Service, La Jolla, California. 263 pp.
Christensen, I., T. Haug and N. Øien. 1992. Seasonal distribution, exploitation and present abundance of stocks of large baleen whales (Mysticeti) and sperm whales (Physeter macrocephalus) in Norwegian and adjacent waters. ICES Journal of Marine Science, 49, 341–355.
Engelhaupt, A., J. Aschettino, T.A. Jefferson, D. Engelhaupt, and M. Richlen. 2016. Occurrence, Distribution, and Density of Marine Mammals Near Naval Station Norfolk and Virginia Beach, Virginia: 2016 Final Report. Prepared for U.S. Fleet Forces Command. Submitted to Naval Facilities Engineering Command Atlantic, Norfolk, Virginia, under Contract No. N62470-10-3011, Task Orders 03 and 043, issued to HDR Inc., Virginia Beach, Virginia. 12 October 2016.
DoN | Mid-Atlantic Humpback Whale Monitoring, Virginia Beach, VA: 2016/17 Annual Progress Report
August 2017 | 48
Engelhaupt, A., J.M. Aschettino, and D. Engelhaupt. 2017. VACAPES Outer Continental Shelf Cetacean Study, Virginia Beach, Virginia: 2016/17 Annual Progress Report. Draft Report. Prepared for U.S. Fleet Forces Command. Submitted to Naval Facilities Engineering Command Atlantic, Norfolk, Virginia, under Contract Nos. N62470-10-3011, Task Orders 03 and 54, and N62470-15-8006, Task Order 35, issued to HDR Inc., Virginia Beach, Virginia. 21 February 2017.
Katona, S.K. and J.A. Beard. 1990. Population size, migrations, and feeding aggregations of the humpback whale (Megaptera novaeangliae) in the western North Atlantic Ocean. Reports of the International Whaling Commission, Special Issue 12, 295–306.
National Marine Fisheries Service, U.S. Department of Commerce. 2017. Marine Mammal Health and Stranding Response Database. Retrieved from http://www.nmfs.noaa.gov/pr/health/db_public.html.
Palsbøll, P.J., J. Allen, M. Berube, P. Clapham, T. Feddersen, P. Hammond, R. Hudson, H. Jorgensen, S. Katona, A.H. Larsen, F. Larsen, J. Lien, D. Mattila, J. Sigurjonsson, R. Sears, T. Smith, R. Sponer, P. Stevick, and N. Oien. 1997. Genetic tagging of humpback whales. Nature, 388, 767–769.
Swingle, W.M., S.G. Barco, and T.D. Pitchford. 1993. Appearance of juvenile humpback whales feeding in the nearshore waters of Virginia. Marine Mammal Science, 9(3), 309-315.
Wiley, D.N., R.A. Asmutis, T.D. Pitchford, and D.P. Gannon. 1995. Stranding and mortality of humpback whales, Megaptera novaeangliae, in the mid-Atlantic and southeast United States, 1985-1992. Fishery Bulletin, 93, 196–205.

DoN | Mid-Atlantic Humpback Whale Monitoring, Virginia Beach, VA: 2016/17 Annual Progress Report
August 2017 | 49
This page intentionally left blank.
A Stable Isotope Analysis of Humpback and Fin Whales off Virginia Beach, Virginia

This page intentionally left blank.
A-1
Stable Isotope Analysis of Humpback and Fin Whales off Virginia Beach, Virginia
Prepared by Danielle M. Waples June 2017
INTRODUCTION Stable isotope analysis is a powerful technique that can provide insights into animal habitat use and foraging ecology and is becoming increasingly used in marine mammal studies (Newsome et al. 2010). The stable isotopic composition of an animal’s tissues reflects the isotopic composition of its assimilated diet (Hobson 1999; Kelly 2000; Newsome et al. 2010), although stable isotope enrichment (an increase in the abundance of the heavier isotope) occurs between an animal and its food due to physiological processes (DeNiro and Epstein 1978; Mendez-Fernandez et al. 2012). In general, the enrichment in 15N between prey and predator is typically 3-4‰, mainly due to the preferential excretion of 14N (DeNiro and Epstein 1981; Minagawa and Wada 1984; Peterson and Fry 1987). The enrichment in 13C is estimated to be around 1‰ per trophic level due to carbon isotopic fractionation during assimilation or respiration (DeNiro and Epstein 1978; Peterson and Fry 1987). Caut et al. (2011) fed a captive killer whale (Orcinus orca) a long-term controlled diet and calculated enrichment factors of 0.09‰ for 13C and 3.05‰ for 15N in a skin sample.
The enrichment in 15N between trophic levels is relatively large and predictable and can be used to identify an animal’s trophic position (Minagawa and Wada 1984; Fry 1988; Hobson and Welch 1992; Rau et al. 1992; Lesage et al. 2001). The enrichment in 13C along the food chain is smaller and more variable than 15N enrichment but provides useful insight into sources of primary production (Rau et al. 1992; Lesage et al. 2001). Thus, carbon isotopes can provide information about foraging habitat, based on inferences regarding the sources of carbon (Ramsay and Hobson 1991; France 1995; Smith et al. 1996; Clementz and Koch 2001). Cetacean skin has a tissue turnover rate of approximately two to three months (Hicks et al. 1985) and isotopic values reflect diet assimilated during that period.
Isotope ratios are expressed in delta (δ) notation as parts per mil (‰) where δ is the ratio of the sample relative to a standard:
δhX = [(Rsample/Rstandard)-1] x 1000
in which X is the element, h is the atomic mass of the heavy isotope and Rsample and Rstandard are the heavy to light isotope ratios (13C/12C or 15N/14N) of the sample and standard, respectively (Newsome et al. 2010). The accepted standards are carbonates from Vienna Pee Dee Belemnite limestone for δ13C and atmospheric nitrogen for δ15N (Newsome et al. 2010).
Humpback whales (Megaptera novaeangliae) in the western North Atlantic are known to migrate between high-latitude summer feeding grounds and low-latitude winter breeding grounds (Clapham et al. 1992). However, some humpback whales have been documented off Virginia during the winter months and it has been suggested that they are juveniles using this area as a
A-2
winter feeding ground (Swingle et al. 1993; Barco et al. 2002). The objective of the current project was to conduct stable isotope analyses on biopsy samples collected from humpback whales off Virginia during the winter months to characterize their isotopic signatures.
MATERIAL AND METHODS Sample Collection HDR personnel collected samples from humpback and fin (Balaenoptera physalus) whales off Virginia from January 2015 through January 2017. Biopsies were collected from either a 68-kg pull Barnett crossbow equipped with 25-mm sterilized stainless steel tips or from a Paxarms biopsy rifle firing 6x20-mm dart tips using .22 caliber blank cartridges (Aschettino et al. 2016). The skin was excised from the blubber, separated into three subsamples and the portion for stable isotope analysis was stored in a cryovial and frozen at -40°C. Samples were transported to Duke University Marine Lab and stored in a -20°C freezer until sample preparation.
Sample Preparation and Stable Isotope Analysis
Skin samples were dried in an oven at 60°C for 48 hours and then homogenized to a fine powder. Compared to proteins and carbohydrates, lipids are depleted in 13C and thus typically have more negative δ13C values that can bias stable isotope analyses (DeNiro and Epstein 1977, Post et al. 2007, Borrell et al. 2012, Ryan et al. 2012). We lipid extracted all the samples using a chloroform and methanol solvent (2:1 v/v) following the protocol of Folch et al. (1957) and Lesage et al. (2010). Approximately 20-40mg of dried and homogenized samples were placed in glass tubes with 1ml of solvent, agitated for 10 minutes on a Multi-Pulse Vortexer and stored overnight. The solvent was removed the next day via pipette and a fresh 1ml of solvent was added. We repeated this procedure three times and after the final removal of the solvent the samples were stored overnight in a fume hood to dry via evaporation. Lipid extraction can cause unpredictable changes in δ15N values (Sotiropoulos et al. 2004; Lesage et al. 2010; Ryan et al. 2012), therefore we analyzed a portion of each skin sample for δ15N prior to lipid extraction and the remainder of each sample was analyzed for δ13C after lipid extraction was completed. Approximately 0.7-1.2 mg of each dried and homogenized sample was sealed in 8x5mm tin capsules. Stable isotope analyses were performed at the Duke Environmental Isotope Laboratory in Durham, North Carolina via a continuous flow mass spectrometer system (Thermo Finnigan Delta Plus XL). The external precision relative to reference materials was approximately ± 0.1‰ for both δ13C and δ15N.
We examined the effects of lipid extraction on stable isotope values using a paired t-test. We also examined inter-species differences and potential differences in humpback whale stable isotope signatures caused by gender with Student’s t-tests using JMP 13.0 statistical software.
Genetic Analysis Whale skin samples were subsampled and finely chopped using a scalpel blade for a final mass of approximately 15mg. DNA was extracted by silica spin column using the Wizard SV Genomic DNA purification system (catalog no. A2360) and stored at -20°C until ready for polymerase chain reaction (PCR) amplification. For gender determination, we performed
A-3
multiplex PCR to amplify a 447bp segment on the X chromosome (forward primer: 5’-GCACCTCTTTGGTATCTGAGAAAGT-3’, reverse primer: 5’-ACAACCACCTGGAGAGCCACAAGCT-3’) and a 224bp segment on the Y chromosome (forward primer: 5’-CCCATGAACGCTTTCATTGTGTGG-3’, reverse primer: 5’-CTCTTGGCCTTCCGACGAGGTCGATA-3’). Primers were based on the p2-3ez/p1-3ez (Aasen and Medrano 1990) and Y53-3C/Y53-3D (Fain and LeMay 1995) systems with slight modifications to reflect recent mysticete whale sequences. We modified the p2-3ez/p1-3ez primers to match a Balaenoptera acutorostrata scammoni predicted ZFX gene sequence (GenBank accession no. XM_007185147, Yim et al. 2014) and the Y53-3C/Y53-3D primers to match a Megaptera novaeangliae SRY gene sequence (GenBank accension no. AB108513.2, Nishida et al. 2007). PCR was carried out using a 20µL reaction with final reagent concentrations of 1x PCR buffer, 2.0 mM MgCl2, 200 µM dNTPs, 0.25 µM each primer forward and reverse, and 0.5 U/µL Taq. Thermocycling consisted of an initial four minute denaturation step at 94°C, followed by 35 cycles of denaturation at 94°C for 15 seconds, annealing at 60°C for 15 seconds, extension at 72°C for 30 seconds, and a final extension period of five minutes at 72°C. Amplification products were separated by electrophoresis on a 2% agarose gel and gender was inferred to be male for samples which showed two distinct bands at approximately 447bp and 224bp and female for animals that showed only one distinct band at approximately 447bp. The genetic analysis was conducted at Duke University Marine Laboratory.
RESULTS HDR personnel obtained skin samples from 29 humpback whales and two fin whales from January 2015 through January 2017. All humpback samples were collected during near shore surveys in the winter between the months of November and February and the two fin whale samples were collected during offshore surveys in April.
We examined the data for outliers, defined by Borrell (2012) as values differing by more than three standard deviations from the overall mean, and identified one humpback whale, (20150122_DTE_Mn_001) sampled on 22 January 2015, as having an outlier δ13C value (Figure 1). We ran a replicate of this individual’s sample and received similar results to the original isotopic values (δ13C values of -22.8‰ and -22.6‰). This animal also had the lowest δ15N value of any of the humpback whales sampled (Figure 1) and a similar value occurred in both the original sample and the replicate sample (δ15N values of 12.5‰ and 12.6‰). The values for this humpback were excluded from analyses.
Lipid extraction did have an effect on δ13C values; the lipid extracted samples were enriched in 13C compared to the non-lipid extracted samples (Figure 2). The differences in δ13C values between lipid extracted versus non-lipid extracted were significant for both humpback whales (p<0.001) and fin whales (p= 0.004). However, lipid extraction did not have an effect on δ15N values (Figure 3). There was no significant difference in δ15N values between lipid-extracted versus non-lipid-extracted samples for either humpback whales (p= 0.562) or fin whales (p= 0.636).
A-4
The humpback whale skin had a mean δ13C value of -18.9 (± 0.5) and a mean δ15N value of 14.6 (± 0.9) (Figure 4). The two fin whales that were sampled had a mean δ13C value of
-18.1 (± 0.2) and a mean δ15N value of 10.5 (± 0.0) (Figures 4 and 5). There was a significant difference in δ13C values between the humpback whale and fin whales (p= 0.032) and the humpback whales had significantly higher δ15N signatures than the fin whales (p< 0.001).
Our genetic analyses identified 14 female and 15 male humpback whales sampled during the study period (Table 1). In addition, both of the fin whales that were biopsied were genetically identified as males (Table 1). Females had a mean δ13C value of -19.1 (±0.4) and a mean δ15N value of 14.3 (±0.9) while male humpbacks mean values of δ13 C and δ15N were -18.8 (±0.5) and 14.9 (±0.8) respectively (Figures 6 and 7). There was no significant difference in the δ13C signature between female and male humpback whales (p= 0.066). The females generally had lower δ15N values than males and this difference was statistically significant (p= 0.029).
DISCUSSION Our results provide the first stable isotope values for humpback whales off Virginia Beach during the winter months. It has been hypothesized that these animals are juveniles that are using the area as a winter feeding ground instead of migrating to lower latitudes (Swingle et al. 1993; Barco et al. 2002). This is corroborated by field observations from Aschettino and colleagues (2016) who categorized 65-76% of the humpbacks they observed off Virginia Beach during the winter as juveniles, based on field size estimates during two years of survey effort.
Our results are comparable to other studies describing stable isotope signatures for humpback whales in other regions (Table 2). Interestingly, our findings are very similar to those of Gavrilchuk et al. (2014) who performed stable isotope analyses on skin samples collected from four rorqual species during the summer months in the Gulf of St. Lawrence when the animals are presumably feeding. They found a mean δ15N value for humpback whales of 14.3 (± 0.6), compared to our mean δ15N value of 14.6 (± 0.9). While not conclusive, this does indicate that the humpbacks in both areas are at a similar trophic level and adds support to the idea that humpback whales off Virginia are engaged in feeding during the winter.
We also conducted stable isotope analysis on two skin samples from fin whales that were located and biopsied during offshore vessel surveys in April. The isotopic signatures of these samples are also comparable to those reported for fin whales in other locations (Table 2). They were most similar to Borrell et al. (2012) who sampled fin whales collected during whaling off the northwestern coast of Spain.
There was a significant difference in both δ13C and δ15N values between the humpback and fin whales in our study area. The humpback whales were slightly more depleted in δ13C and had significantly higher δ15N signatures than the fin whales. The humpback whales had a mean δ15N value of 14.6 (± 0.9) compared to the fin whales value of 10.5 (± 0.0). Given a difference in δ15N values between the two species of 4.1‰ it is likely that the humpback whales are feeding at a
A-5
higher trophic level than the fin whales in our area. Gavrilchuk et al. (2014) also found that humpback whales occupied a higher isotopic niche than fin whales in their study area.
Our genetic analyses identified 14 female and 15 male humpback whales sampled in the study area. We found no significant differences in δ13 values between male and female humpback whales but females did have significantly lower δ15N values than males. These results are in contrast to findings from other studies (Todd et al. 1997; Gavrilchuk et al. 2014; Fleming et al. 2016) who found no differences between male and female humpback δ13 or δ15N signatures. It should be noted that differences in mean δ15N values between female and male humpbacks in our study do not reflect a difference in trophic level between males and females as there is less than 1‰ between the mean δ15N values and a difference in trophic level is typically indicated by a difference of 3-4‰ (Caut et al. 2011). These findings do suggest that the diets of the two sexes may differ in this area.
In conclusion, this project has established baseline stable isotope signatures for humpback and fin whales during the winter months off Virginia Beach and noted inter- and intra-specific differences in those signatures. Future survey and biopsy efforts can be used to supplement these baseline isotopic values and allow for further comparisons to be made.
ACKNOWLEDGMENTS Will Cioffi conducted the genetic analyses to determine gender and wrote the detailed protocol included in this report. Thanks to David Honig and Philip Turner who provided advice and materials to assist with homogenizing the skin samples. Thanks also to Jennifer Dunn who provided administrative support.
LITERATURE CITED Aasen E. and J.F. Medrano. 1990. Amplification of the ZFY and ZFX genes for sex identification
in humans, cattle, sheep and goats. Biotechnology 8:1279–1281. Aschettino, J.M., D. Engelhaupt, A. Engelhaupt and M. Richlen. 2016. Mid-Atlantic Humpback
Whale Monitoring, Virginia Beach, Virginia: 2015/16 Annual Progress Report. Final Report. Prepared for U.S. Fleet Forces Command. Submitted to Naval Facilities Engineering Command Atlantic, Norfolk, Virginia, under Contract Nos. N62470-10-3011, Task Orders 03 and 54, and N62470-15-8006, Task Order 13, issued to HDR Inc., Virginia Beach, Virginia. 30 August 2016.
Barco, S.G., W.A. McLellan, J.M. Allen, R.A. Asmutis-Silvia, R. Mallon-Day, E.M. Meagher, D.A.
Pabst, J. Robbins, R.E. Seton, W.M. Swingle, M.T. Weinrich and P.J. Clapham. 2002. Population identity of humpback whales (Megaptera novaeangliae) in the water of the US mid-Atlantic states. Journal of Cetacean Research and Management 4:135–141.
A-6
Borrell, A. N. Abad-Oliva, E. Gomez-Campos, J. Gimenez and A. Aguilar. 2012. Discrimination of stable isotopes in fin whale tissues and application to diet assessment in cetaceans. Rapid Communications in Mass Spectrometry 26:1596–1602.
Caut, S., S. Laran, E. Garcia-Hartmann and K. Das. 2011. Stable isotopes of captive cetaceans
(killer whales and bottlenose dolphins). Journal of Experimental Biology 214:538–545. Clapham, P.J., L.B. Baraff, C.A. Carlson, M.A. Christian, D.K. Mattila, C.A. Mayo, M.A. Murphy,
and S. Pittman. 1992. Seasonal occurrence and annual return of humpback whales, Megaptera novaeangliae, in the southern Gulf of Maine. Canadian Journal of Zoology 71:440-443/
Clementz, M.T. and P.L. Koch. 2001. Differentiating aquatic mammal habitat and foraging
ecology with stable isotopes in tooth enamel. Oecologia 129:461–472. DeNiro, E.J. and S. Epstein. 1977. Mechanism of carbon isotope fractionation associated with
lipid synthesis. Science 197:261–263. DeNiro, E.J. and S. Epstein. 1978. Influence of diet on the distribution of carbon isotopes in
animals. Geochimica et Cosmochimica Acta 42:495–506. DeNiro M.J. and S. Epstein. 1981. Influence of diet on the distribution of nitrogen isotopes in
animals. Geochimica et Cosmochimica Acta 45:341–351. Fain S.R. and J.P LeMay. 1995. Gender identification of humans and mammalian wildlife
species from PCR amplified sex linked genes. Proceedings of the American Academy of Forensic Science 1:34.
Fleming, A.H., C.T. Clark, J. Calambokidis and J. Barlow. 2016. Humpback whale diets respond
to variance in ocean climate and ecosystem conditions in the California Current. Global Change Biology 22:1214–1224.
Folch, J., M. Lees and G.H.S. Stanley. 1957. A simple method for the isolation and purification
of total lipids from animal tissues. Journal of Biological Chemistry 226:497–509. France, R.L. 1995. Carbon-13 enrichment in benthic compared to planktonic algae; foodweb
implications. Marine Ecology Progress Series 124:307–312. Fry, B. 1988. Food web structure on Georges Bank from stable C, N, and S isotopic
compositions. Limnology and Oceanography 33:1182–1190. Gavrilchuk, K., V. Lesage, C. Ramp, R. Sears, M. Berube, S. Bearhop and G. Beauplet. 2014.
Trophic niche partitioning among sympatric baleen whale species following the collapse of groundfish stocks in the Northwest Atlantic. Marine Ecology Progress Series 407:285–301.
A-7
Hicks, B.D., D.J. St. Aubin, J.R. Geraci and W.R. Brown. 1985. Epidermal growth in the bottlenose dolphin, Tursiops truncatus. Journal of Investigative Dermatology 85:60–63.
Hobson, K.A. 1999. Tracing origins and migration of wildlife using stable isotopes: a review.
Oecologia 120:314–326. Hobson, K.A. and H.E. Welch. 1992. Determination of trophic relationships within a high Arctic
marine food web using δ13C and δ15N analysis. Marine Ecology Progress Series 84:9–18. Kelly, J.E. 2000. Stable isotopes of carbon and nitrogen in the study of avian and mammalian
trophic ecology. Canadian Journal of Zoology 78:1–27. Lesage, V., M.O. Hammill and K.M. Kovacs. 2001. Marine mammals and community structure
of the Estuary and Gulf of St Lawrence, Canada: evidence from stable isotope analysis. Marine Ecology Progress Series 210:203–221.
Lesage, V., Y. Morin, E. Rioux, C. Pomerleau, S.H. Ferguson and E. Pelletier. 2010. Stable
isotopes and trace elements as indicators of diet and habitat use in cetaceans: predicting errors related to preservation, lipid extraction, and lipid normalization. Marine Ecology Progress Series 419:249–265.
Mendez-Fernandez, P., P. Bustamante, A. Bode, T. Chouvelon, M. Ferreira, A. Lopez, G.J.
Pierce, M.B. Santos, J. Spitz, J.V. Vingada and F. Caurant. 2012. Foraging ecology of five toothed whale species in the Northwest Iberian Peninsula, inferred using carbon and nitrogen isotope ratios. Journal of Experimental Marine Biology and Ecology 413:150–158.
Minagawa, M. and E. Wada. 1984. Stepwise enrichment of 15N along food chains: further
evidence and the relation between δ15N and animal age. Geochimica et Cosmochimica Acta 48:1135–1140.
Newsome S.D., M.T. Clementz and P.L. Koch. 2010. Using stable isotope biogeochemistry to
study marine mammal ecology. Marine Mammal Science 26:509–572. Nishida, S., M. Goto, L.A. Pastene, N. Kanda and H. Koike. 2007. Phylogenetic relationships
among cetaceans revealed by Y-chromosome sequences. Zoological Science 24:723–732.
Ostrom, P.H., J. Lien and S.A. Macko. 1993. Evaluation of the diet of Sowerby’s beaked whale,
Mesoplodon bidens, based on isotopic comparisons among northwestern Atlantic cetaceans. Canadian Journal of Zoology 71:858–861.
Peterson, B.J. and B. Fry. 1987. Stable isotopes in ecosystem studies. Annual Review of
Ecology, Evolution and Systematics 18:293–320.
A-8
Post, D.M., C.A. Layman, D.A. Arrington, G. Takimoto, J. Quattrochi and C.G. Montaña. 2007. Getting to the fat of the matter: models, methods and assumptions for dealing with lipids in stable isotope analysis. Oecologia 152:179–189.
Ramsay, M.A. and K.A. Hobson. 1991. Polar bears make little use of terrestrial food webs:
evidence from stable-carbon isotope analysis. Oecologia 86:598–600. Rau, G.H., D.G. Ainley, J.L. Bengston, J.T. Torres and T.L. Hopkins. 1992. 15N/14N and 13C/12C
in Weddell Sea birds, seals and fish: implications for diet and trophic structure. Marine Ecology Progress Series 84:1–8.
Ryan, C. B McHugh, C.N. Trueman, C. Harrod, S.D. Berrow and I. O’Connor. 2012. Accounting
for the effects of lipids in stable isotopes (δ13C and δ15N values) analysis of skin and blubber of balaenopterid whales. Rapid Communications in Mass Spectrometry 26:2745–2754.
Smith, R.J., K.A. Hobson, H.N. Koopman and D.M. Lavigne. 1996. Distinguishing between
populations of fresh- and salt-water harbour seals (Phoca vitulina) using stable-isotope ratios and fatty acid profiles. Canadian Journal of Fisheries and Aquatic Sciences 53:272–279.
Sotiropoulos, M.A., W.M. Tonn and L.I. Wassenaar. 2004. Effects of lipid extraction on stable
carbon and nitrogen isotope analyses of fish tissues: a potential consequence for food web studies. Ecology of Freshwater Fish 13:155–160.
Swingle, W.M., S.G. Barco, T.D. Pitchford, W.A. McLellan and D.A. Pabst. 1993. Appearance of
juvenile humpback whales feeding in the nearshore waters of Virginia. Marine Mammal Science 9:309–315.
Todd, S., P. Ostrom, J. Lien and J. Abrajano. 1997. Use of biopsy samples of humpback whale
(Megaptera novaeangliae) skin for stable isotope (δ13C) determination. Journal of Northwest Atlantic Fishery Science 22:71–76.
Yim, H.S., Y.S. Cho, X. Guang, S.G. Kang, J.Y. Jeong, S.S. Cha, H.M. Oh, J.H. Lee, E.C. Yang,
K.K. Kwon, Y.J. Kim et al. 2014. Minke whale genome and aquatic adaptation in cetaceans. Nature Genetics 46:88–92.
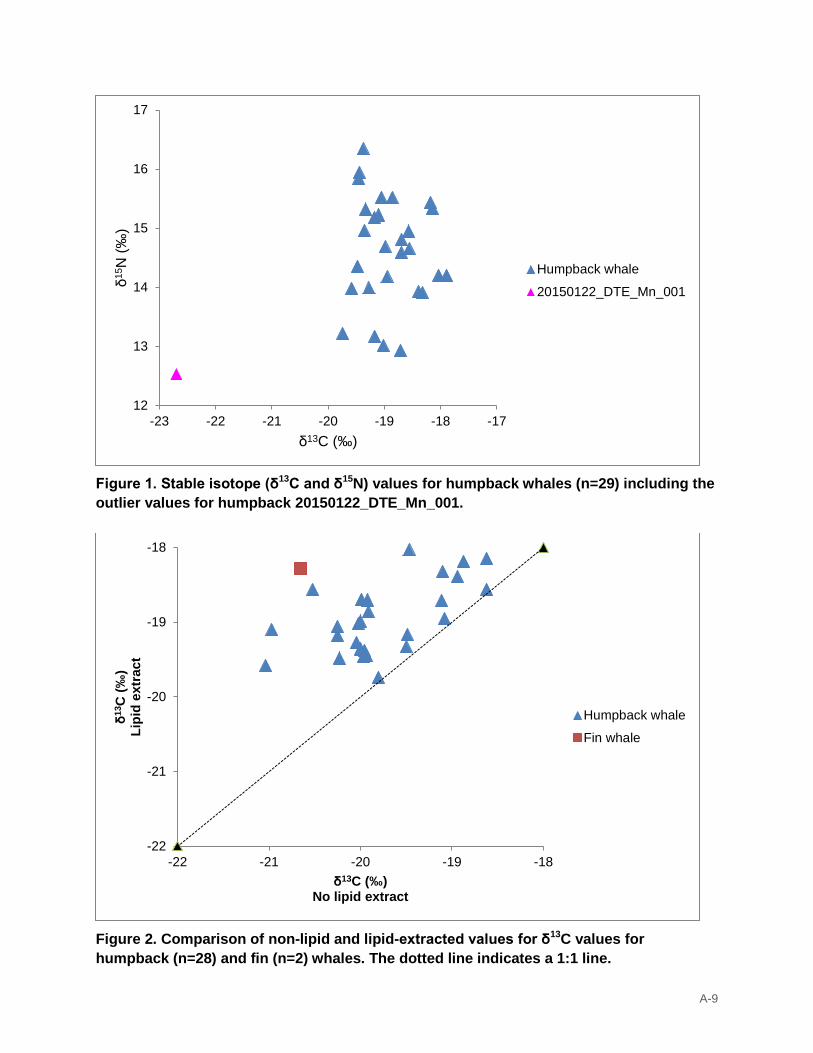
A-9
Figure 1. Stable isotope (δ13C and δ15N) values for humpback whales (n=29) including the outlier values for humpback 20150122_DTE_Mn_001.
Figure 2. Comparison of non-lipid and lipid-extracted values for δ13C values for humpback (n=28) and fin (n=2) whales. The dotted line indicates a 1:1 line.
12
13
14
15
16
17
-23 -22 -21 -20 -19 -18 -17
δ15 N
(‰)
δ13C (‰)
Humpback whale
20150122_DTE_Mn_001
-22
-21
-20
-19
-18
-22 -21 -20 -19 -18
δ13 C
(‰)
Lipi
d ex
trac
t
δ13C (‰) No lipid extract
Humpback whale
Fin whale
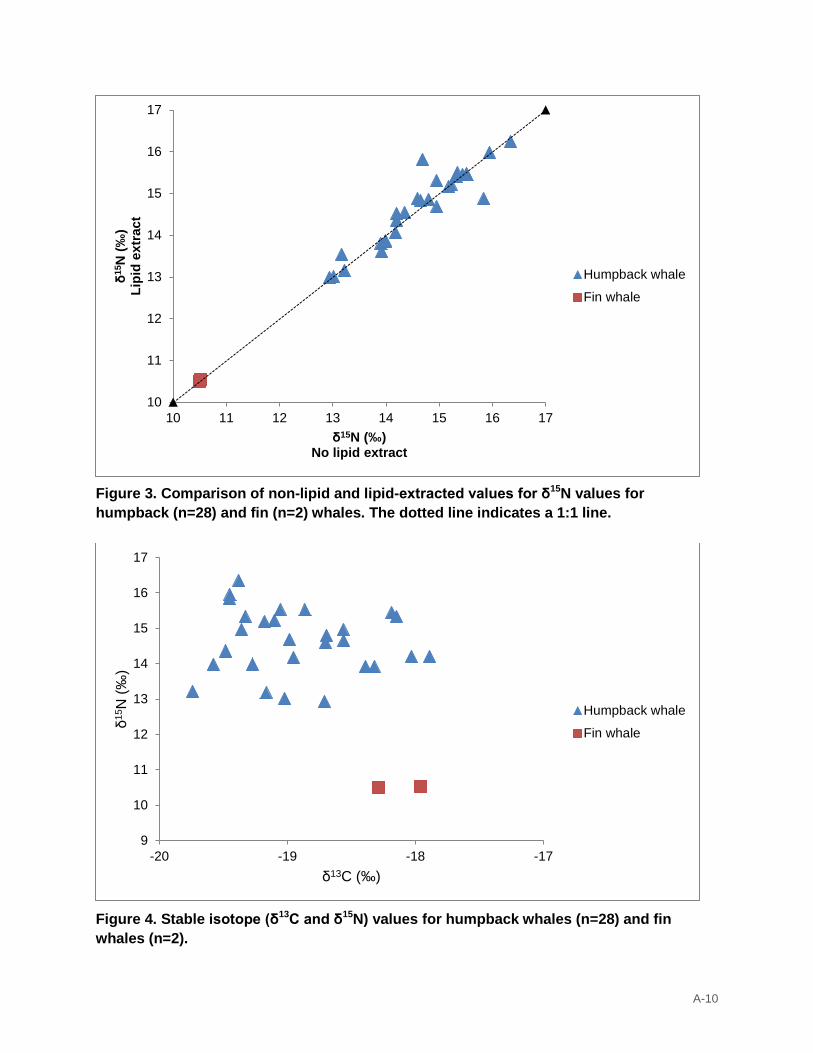
A-10
Figure 3. Comparison of non-lipid and lipid-extracted values for δ15N values for humpback (n=28) and fin (n=2) whales. The dotted line indicates a 1:1 line.
Figure 4. Stable isotope (δ13C and δ15N) values for humpback whales (n=28) and fin whales (n=2).
10
11
12
13
14
15
16
17
10 11 12 13 14 15 16 17
δ15 N
(‰)
Lipi
d ex
trac
t
δ15N (‰) No lipid extract
Humpback whale
Fin whale
9
10
11
12
13
14
15
16
17
-20 -19 -18 -17
δ15 N
(‰)
δ13C (‰)
Humpback whale
Fin whale
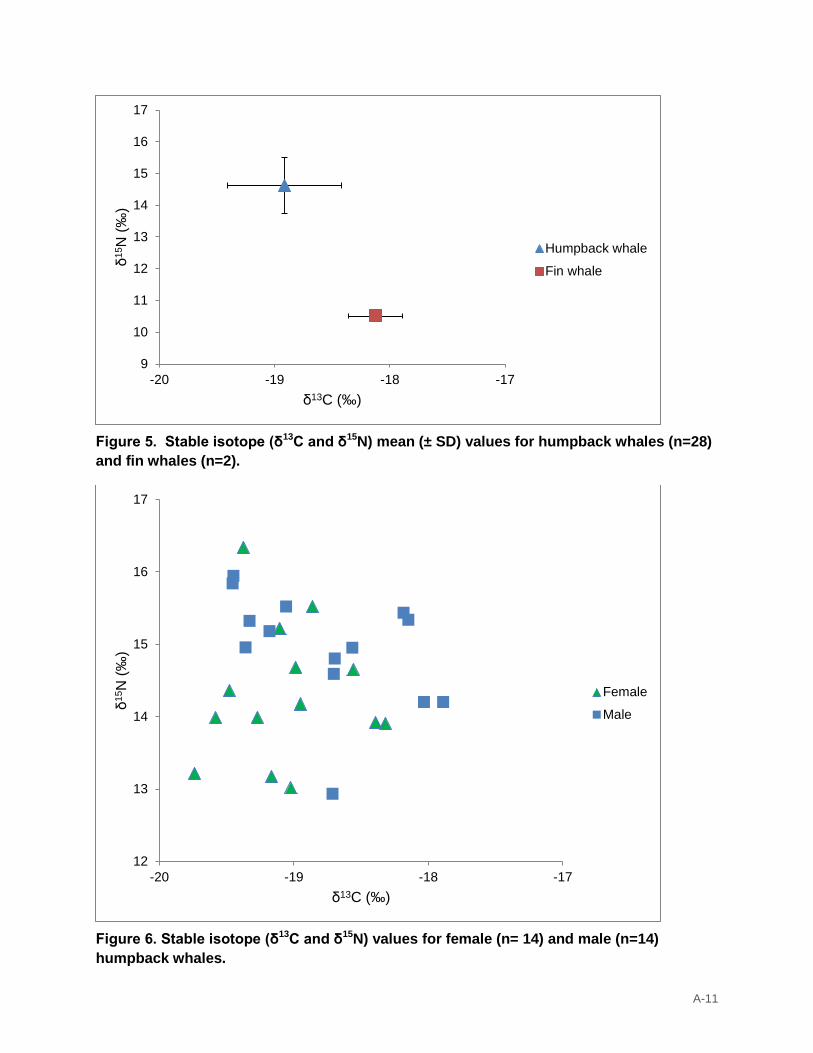
A-11
Figure 5. Stable isotope (δ13C and δ15N) mean (± SD) values for humpback whales (n=28) and fin whales (n=2).
Figure 6. Stable isotope (δ13C and δ15N) values for female (n= 14) and male (n=14) humpback whales.
9
10
11
12
13
14
15
16
17
-20 -19 -18 -17
δ15 N
(‰)
δ13C (‰)
Humpback whale
Fin whale
12
13
14
15
16
17
-20 -19 -18 -17
δ15 N
(‰)
δ13C (‰)
Female
Male
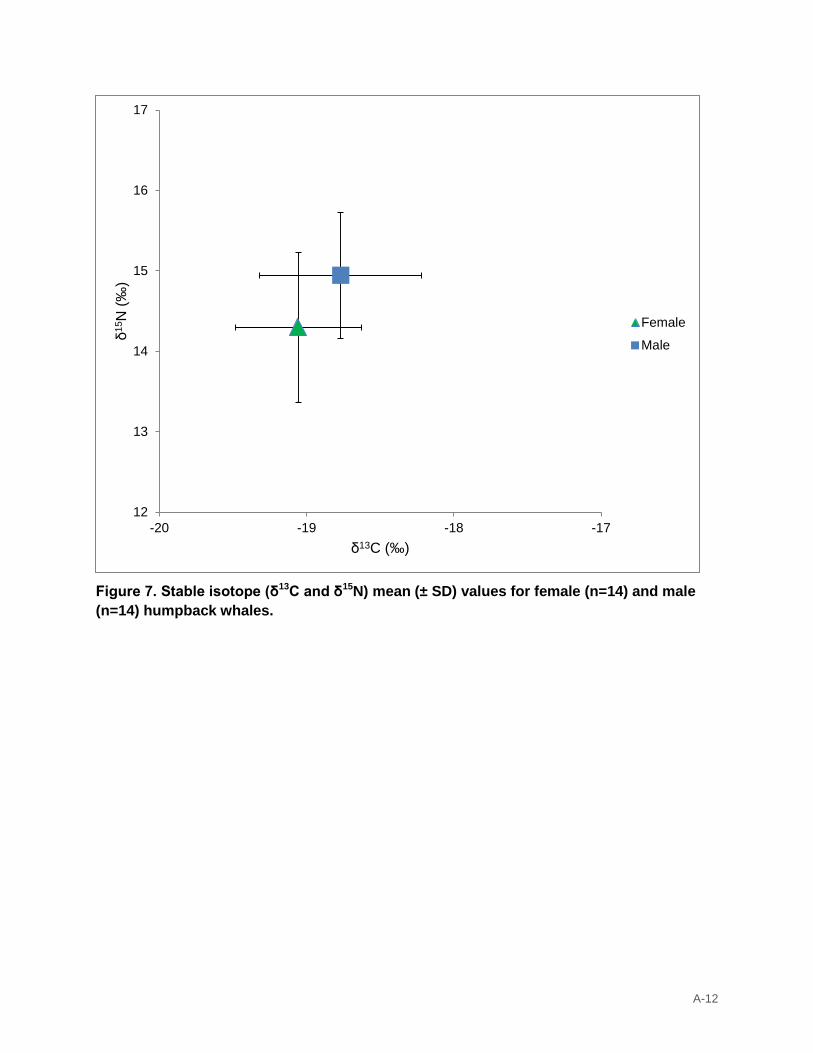
A-12
Figure 7. Stable isotope (δ13C and δ15N) mean (± SD) values for female (n=14) and male (n=14) humpback whales.
12
13
14
15
16
17
-20 -19 -18 -17
δ15 N
(‰)
δ13C (‰)
Female
Male
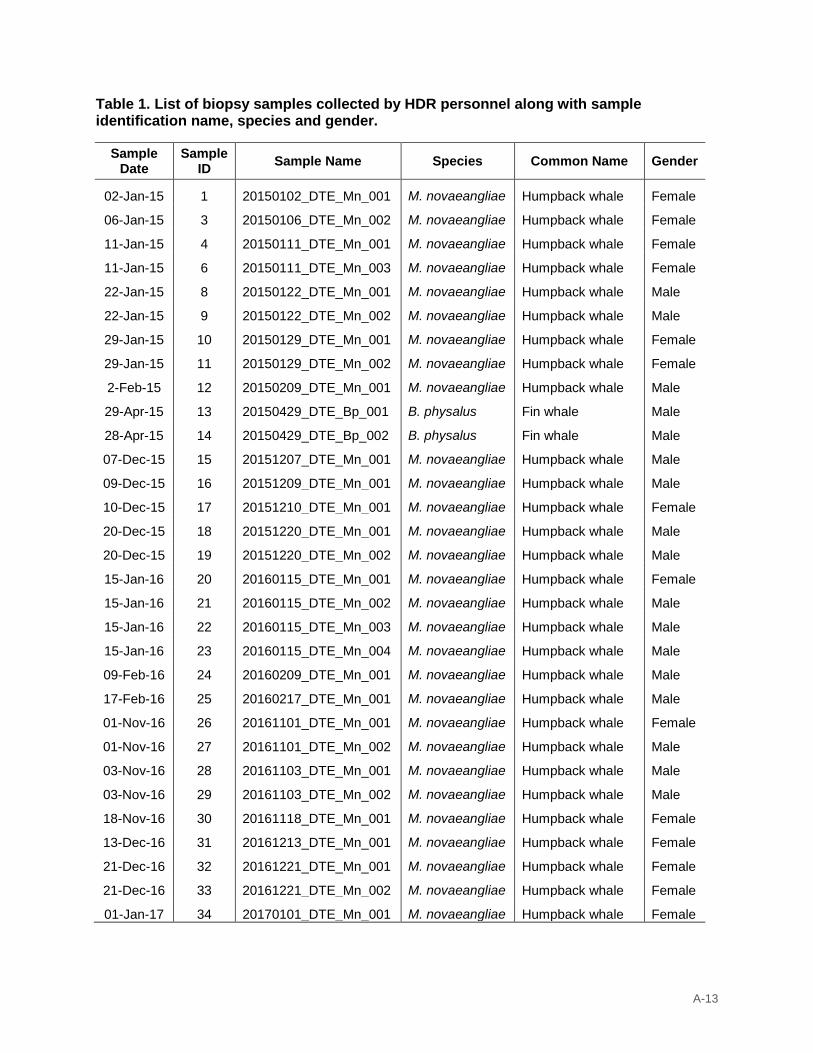
A-13
Table 1. List of biopsy samples collected by HDR personnel along with sample identification name, species and gender.
Sample Date
Sample ID Sample Name Species Common Name Gender
02-Jan-15 1 20150102_DTE_Mn_001 M. novaeangliae Humpback whale Female
06-Jan-15 3 20150106_DTE_Mn_002 M. novaeangliae Humpback whale Female
11-Jan-15 4 20150111_DTE_Mn_001 M. novaeangliae Humpback whale Female
11-Jan-15 6 20150111_DTE_Mn_003 M. novaeangliae Humpback whale Female
22-Jan-15 8 20150122_DTE_Mn_001 M. novaeangliae Humpback whale Male
22-Jan-15 9 20150122_DTE_Mn_002 M. novaeangliae Humpback whale Male
29-Jan-15 10 20150129_DTE_Mn_001 M. novaeangliae Humpback whale Female
29-Jan-15 11 20150129_DTE_Mn_002 M. novaeangliae Humpback whale Female
2-Feb-15 12 20150209_DTE_Mn_001 M. novaeangliae Humpback whale Male
29-Apr-15 13 20150429_DTE_Bp_001 B. physalus Fin whale Male
28-Apr-15 14 20150429_DTE_Bp_002 B. physalus Fin whale Male
07-Dec-15 15 20151207_DTE_Mn_001 M. novaeangliae Humpback whale Male
09-Dec-15 16 20151209_DTE_Mn_001 M. novaeangliae Humpback whale Male
10-Dec-15 17 20151210_DTE_Mn_001 M. novaeangliae Humpback whale Female
20-Dec-15 18 20151220_DTE_Mn_001 M. novaeangliae Humpback whale Male
20-Dec-15 19 20151220_DTE_Mn_002 M. novaeangliae Humpback whale Male
15-Jan-16 20 20160115_DTE_Mn_001 M. novaeangliae Humpback whale Female
15-Jan-16 21 20160115_DTE_Mn_002 M. novaeangliae Humpback whale Male
15-Jan-16 22 20160115_DTE_Mn_003 M. novaeangliae Humpback whale Male
15-Jan-16 23 20160115_DTE_Mn_004 M. novaeangliae Humpback whale Male
09-Feb-16 24 20160209_DTE_Mn_001 M. novaeangliae Humpback whale Male
17-Feb-16 25 20160217_DTE_Mn_001 M. novaeangliae Humpback whale Male
01-Nov-16 26 20161101_DTE_Mn_001 M. novaeangliae Humpback whale Female
01-Nov-16 27 20161101_DTE_Mn_002 M. novaeangliae Humpback whale Male
03-Nov-16 28 20161103_DTE_Mn_001 M. novaeangliae Humpback whale Male
03-Nov-16 29 20161103_DTE_Mn_002 M. novaeangliae Humpback whale Male
18-Nov-16 30 20161118_DTE_Mn_001 M. novaeangliae Humpback whale Female
13-Dec-16 31 20161213_DTE_Mn_001 M. novaeangliae Humpback whale Female
21-Dec-16 32 20161221_DTE_Mn_001 M. novaeangliae Humpback whale Female
21-Dec-16 33 20161221_DTE_Mn_002 M. novaeangliae Humpback whale Female
01-Jan-17 34 20170101_DTE_Mn_001 M. novaeangliae Humpback whale Female
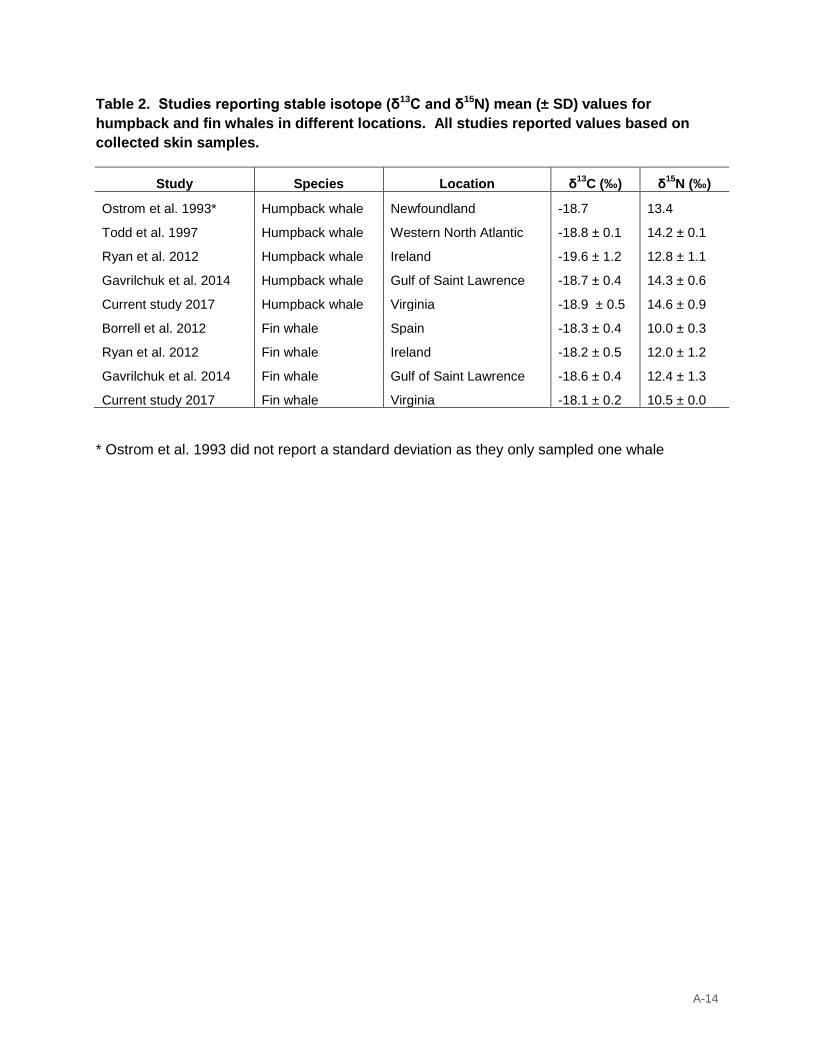
A-14
Table 2. Studies reporting stable isotope (δ13C and δ15N) mean (± SD) values for humpback and fin whales in different locations. All studies reported values based on collected skin samples.
Study Species Location δ13C (‰) δ15N (‰)
Ostrom et al. 1993* Humpback whale Newfoundland -18.7 13.4
Todd et al. 1997 Humpback whale Western North Atlantic -18.8 ± 0.1 14.2 ± 0.1
Ryan et al. 2012 Humpback whale Ireland -19.6 ± 1.2 12.8 ± 1.1
Gavrilchuk et al. 2014 Humpback whale Gulf of Saint Lawrence -18.7 ± 0.4 14.3 ± 0.6
Current study 2017 Humpback whale Virginia -18.9 ± 0.5 14.6 ± 0.9
Borrell et al. 2012 Fin whale Spain -18.3 ± 0.4 10.0 ± 0.3
Ryan et al. 2012 Fin whale Ireland -18.2 ± 0.5 12.0 ± 1.2
Gavrilchuk et al. 2014 Fin whale Gulf of Saint Lawrence -18.6 ± 0.4 12.4 ± 1.3
Current study 2017 Fin whale Virginia -18.1 ± 0.2 10.5 ± 0.0
* Ostrom et al. 1993 did not report a standard deviation as they only sampled one whale

A-15
This page intentionally left blank.
Related Documents