August 11, 2009 Second Quarter 2009 Earnings Review

Welcome message from author
This document is posted to help you gain knowledge. Please leave a comment to let me know what you think about it! Share it to your friends and learn new things together.
Transcript

August 11, 2009
Second Quarter 2009 Earnings Review

Highlights
Second quarter 2009 net sales of $49.4 million.
An increasing number of important customer and OEM Partner design wins, strengthening the Company’s view that as the economic situation improves X-Rite’s sales results show good potential.
Benjamin Moore adopts iVue Matchrite System as their next generation store solution.
An important trend is beginning for the use of ColorMunki Design in both graphic arts and industrial market segments in the “creative” phase of the product realization process. Example partners and customers include: Corel, Bunkspeed, Columbia Sportswear and Kohls.
Company profit improvement program contributed to Q2 operating income of $2.5 million and EBITDA margin of 24.8% of net sales.
2

Highlights cont.
3
Cash flow from operations continues to be healthy resulting from the Company’s EBITDA performance and continued progress managing working capital.
Strengthened the balance sheet as Q2 ending debt was $236.7, a reduction of $13.4 in the quarter and $34.2 million year to date.
Successfully closed the Company’s Viptronics operations in Brixen Italy on schedule. Expect to close on the sale of the campus by end of Q3 for approximately $2.4 million.
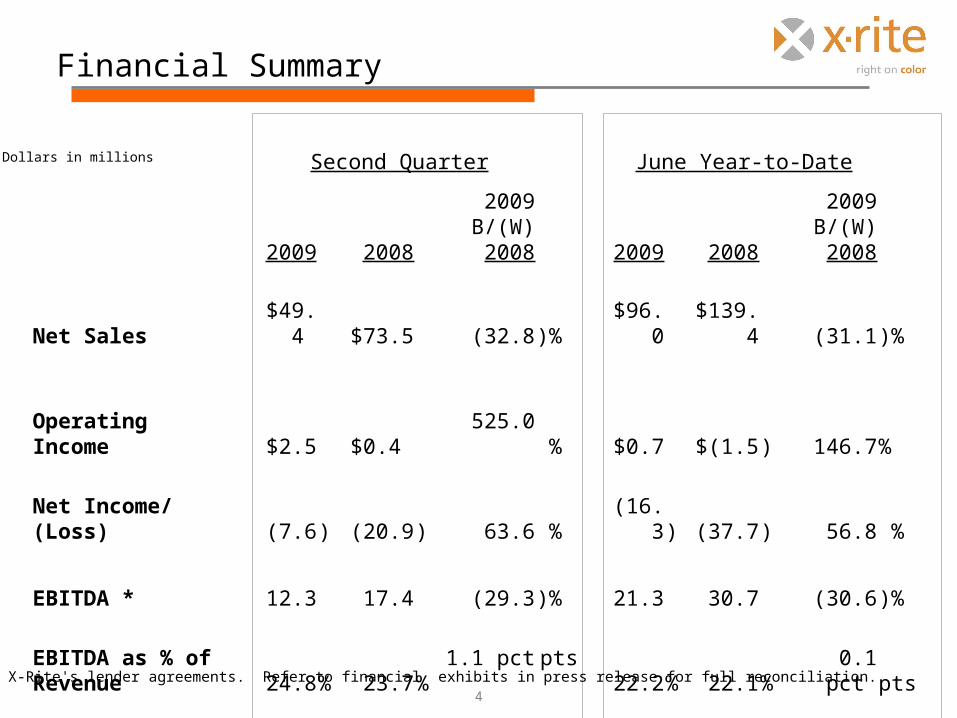
Financial Summary
4
Second Quarter June Year-to-Date
2009 2008
2009B/(W)2008 2009 2008
2009B/(W)2008
Net Sales $49.4 $73.5 (32.8)% $96.0 $139.4 (31.1)%
Operating Income $2.5 $0.4
525.0 % $0.7 $(1.5) 146.7%
Net Income/ (Loss) (7.6) (20.9) 63.6 % (16.3) (37.7) 56.8 %
EBITDA * 12.3 17.4 (29.3)% 21.3 30.7 (30.6)%
EBITDA as % of Revenue 24.8% 23.7% 1.1 pct pts 22.2% 22.1% 0.1 pct pts
Dollars in millions
* As defined by X-Rite's lender agreements. Refer to financial exhibits in press release for full reconciliation.
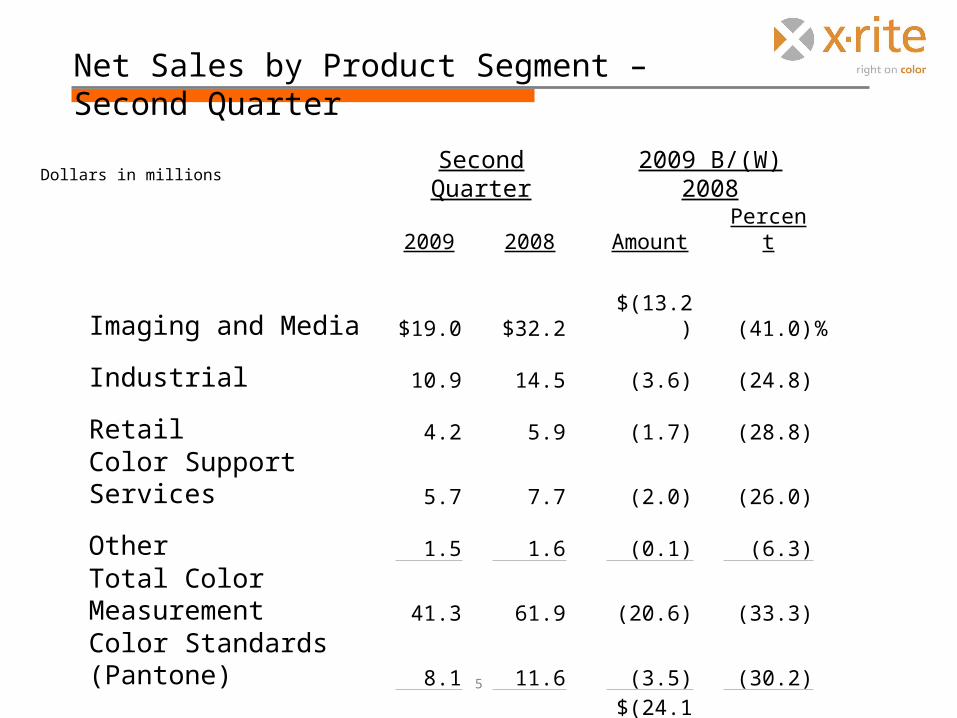
Second Quarter 2009 B/(W) 20082009 2008 Amount Percent
Imaging and Media $19.0 $32.2 $(13.2) (41.0)%Industrial 10.9 14.5 (3.6) (24.8)Retail 4.2 5.9 (1.7) (28.8)Color Support Services 5.7 7.7 (2.0) (26.0)Other 1.5 1.6 (0.1) (6.3)Total Color Measurement 41.3 61.9 (20.6) (33.3)Color Standards (Pantone) 8.1 11.6 (3.5) (30.2)
Total $49.4 $73.5 $(24.1) (32.8)%
Net Sales by Product Segment – Second Quarter
5
Dollars in millions
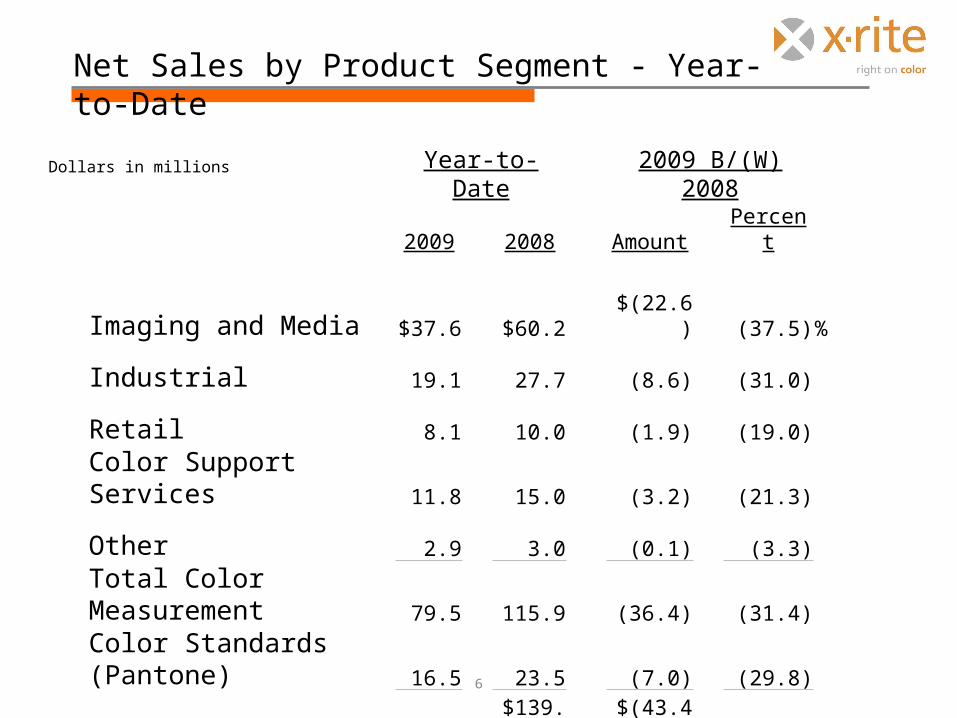
Year-to-Date 2009 B/(W) 20082009 2008 Amount Percent
Imaging and Media $37.6 $60.2 $(22.6) (37.5)%Industrial 19.1 27.7 (8.6) (31.0)Retail 8.1 10.0 (1.9) (19.0)Color Support Services 11.8 15.0 (3.2) (21.3)Other 2.9 3.0 (0.1) (3.3)Total Color Measurement 79.5 115.9 (36.4) (31.4)Color Standards (Pantone) 16.5 23.5 (7.0) (29.8)
Total $96.0 $139.4 $(43.4) (31.1)%
Net Sales by Product Segment - Year-to-Date
6
Dollars in millions
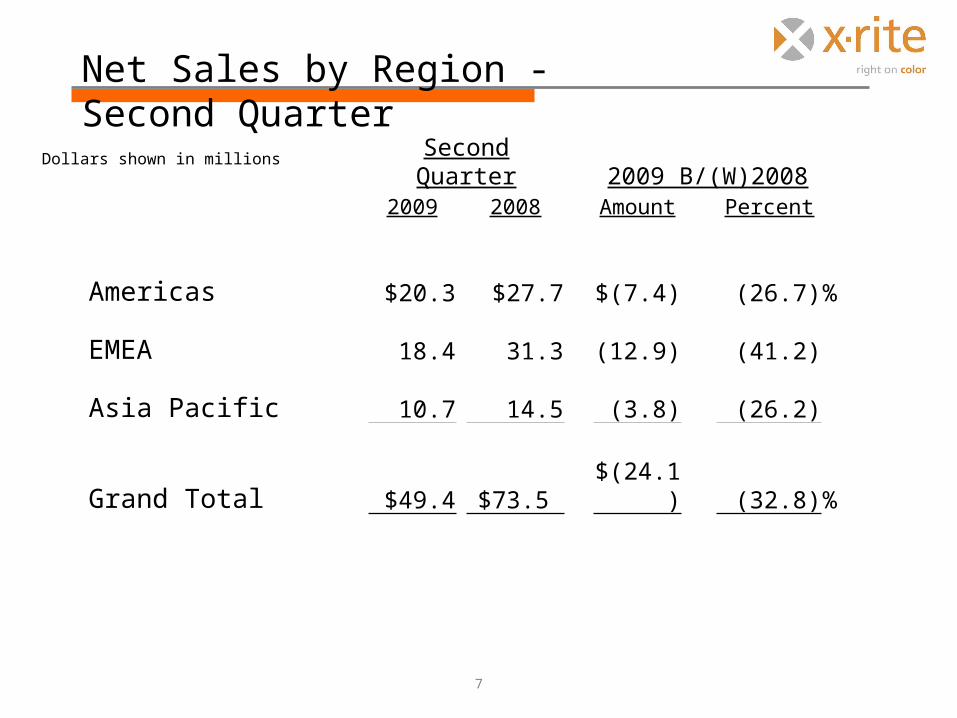
Second Quarter 2009 B/(W)20082009 2008 Amount Percent
Americas $20.3 $27.7 $(7.4) (26.7)%EMEA 18.4 31.3 (12.9) (41.2)Asia Pacific 10.7 14.5 (3.8) (26.2)
Grand Total $49.4 $73.5 $(24.1) (32.8)%
Net Sales by Region - Second Quarter
7
Dollars shown in millions

Year-to-Date 2009 B/(W)20082009 2008 Amount Percent
Americas $40.2 $51.7 $(11.5) (22.2)%EMEA 36.7 61.6 (24.9) (40.4)Asia Pacific 19.1 26.1 (7.0) (26.8)
Grand Total $96.0 $139.4 $(43.4) (31.1)%
Net Sales by Region - Year-to-Date
8
Dollars in millions

Second Quarter Gross Margins
2009 GAAP Gross Margin 60.1%
2008 GAAP Gross Margin 52.3%Add back:Inventory Valuation Adjustment 5.3Restructuring 0.12008 Adjusted Gross Margin* 57.7%2009 Adjusted Gross MarginB/(W) 2008 2.4 pct pts
9
Gross Margin
* Adjusted gross margin excludes non-recurring charges
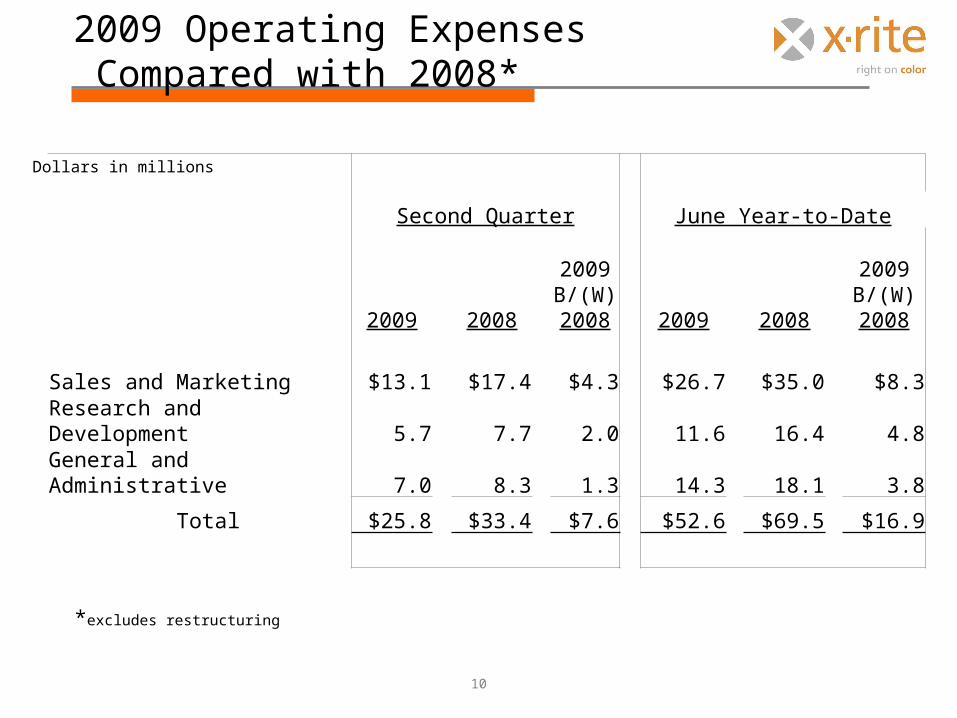
2009 Operating Expenses Compared with 2008*
10
Second Quarter June Year-to-Date
2009 2008
2009B/(W)2008 2009 2008
2009B/(W)2008
Sales and Marketing $13.1 $17.4 $4.3 $26.7 $35.0 $8.3
Research and Development 5.7 7.7 2.0 11.6 16.4 4.8
General and Administrative 7.0 8.3 1.3 14.3 18.1 3.8
Total $25.8 $33.4 $7.6 $52.6 $69.5 $16.9
*excludes restructuring
Dollars in millions
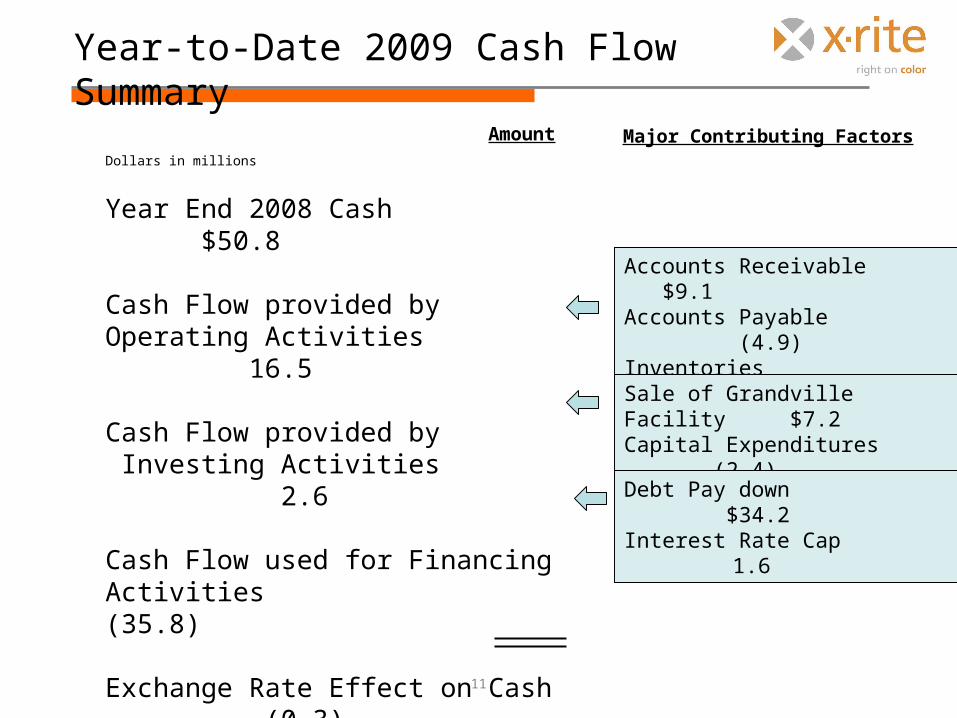
Year-to-Date 2009 Cash Flow Summary
AmountDollars in millions
Year End 2008 Cash $50.8
Cash Flow provided byOperating Activities 16.5
Cash Flow provided by Investing Activities 2.6
Cash Flow used for Financing Activities (35.8)
Exchange Rate Effect on Cash (0.3)
Second Quarter 2009 Cash $33.8
Accounts Receivable $9.1Accounts Payable (4.9)Inventories 3.6
Sale of Grandville Facility $7.2Capital Expenditures (2.4)
Debt Pay down $34.2Interest Rate Cap 1.6
11
Major Contributing Factors

2009 Debt Reduction
Total Debt at Year End 2008 $270.9
Paid off Mortgage on former headquarters 5.2Revolver payments 13.5Principal payments 2.1
Total Q1 Reductions 20.8
Total Debt as of First Quarter 2009 $250.1
Revolver payments ($0 outstanding) 13.0 Principal payments 0.4
Total Q2 Reductions 13.4
Total Debt at Second Quarter 2009 $236.7
Net Debt at Year End 2008 $ 220.1Net Debt at Second Quarter 2009 202.9 Improvement $ 17.2
Annualized Interest Cost Savings $ 2.6
Amount
12
Dollars in millions
$34.2

Selected Working Capital Performance
Second Quarter
2009
Fourth Quarter
2008
Accounts Receivables $27.2 $36.8Days Sales Outstanding (DSO) 51 56
Inventories $35.2 $38.7*Inventory Turns 2.2 1.9
Accounts Payable $6.6 $11.6Days Payable Outstanding (DPO) 38 43
13
Dollars in millions
* Excludes demonstration inventory
14
Summary
•Although the Company does not believe it is losing market share, its sales performance is the number one issue. The X-Rite team is addressing it and encouraged by recent customer discussions and design wins earned this quarter
•The profit improvement plan is working
•The Company remains committed to keeping our business financially safe in the short term, while being poised for an economic turnaround
Safe Harbor
This presentation contains forward-looking statements within the meaning of the Private Securities Litigation Reform Act of 1995. Actual results may differ materially from those projected in the forward-looking statements, due to a variety of factors, some of which maybe beyond the control of the Company. Factors that could cause such differences include the Company’s ability to sustain increased sales, improve operations and realize cost savings, competitive and general economic conditions, ability to access into new markets, acceptanceof the Company’s products and other risks described in the Company’s filings with the US Securities & Exchange Commission. The Company undertakes no obligation to publicly update or revise any forward looking statements whether as a result of new information, future events or for any other reason.
15

Non-GAAP Financial Measures
In addition to the results reported in accordance with generally accepted accounting principles (GAAP), X-Rite may provide certain information, including adjusted EBITDA, adjusted gross margin and net debt, which are considered non-GAAP financial measures. Management believes that these non-GAAP financial measures are useful to both management and its investors in their analysis of the company's underlying business and operating performance. Management also uses this information for operational planning and decision-making purposes. Adjusted EBITDA is a non-GAAP financial measure used for covenant compliance testing under our credit agreements. Non-GAAP financial measures should not be considered a substitute for any GAAP measure. Additionally, non-GAAP financial measures as presented by X-Rite may not be comparable to similarly titled measures reported by other companies. A reconciliation of these items can be found in the financial attachments to the press release or within this document.
16
Related Documents