Augmented Reality Enhances the Reading Experience, Bringing the Textbook to Life xxii Using a cutting-edge technology called augmented reality, Pearson’s BouncePages app launches engaging, interactive videos and animations that bring textbook pages to life. Use your mobile device to scan a SmartFigure identified by the BouncePages icon, and an animation or video illustrating the SmartFigure’s concept launches immediately. No slow websites or hard-to-remember logins required. BouncePages’ augmented reality technology transforms textbooks into convenient digital platforms, breathes life into your learning experience, and helps you grasp difficult academic concepts. Learning geology from a textbook will never be the same. https://itunes.apple.com/us/app/pearson -bouncepages/id659370955?mt=8 https://play.google.com/store/apps/details?id=com .layar.bouncepages&hl=en By scanning figures associated with the BouncePages icon, students will be immediately connected to the digital world and will deepen their learning experience with the printed text. Discharge C ha n n el ro u g h n e s s Channel size C h a n n e l s l o p e ( g r a d i e n t) Flow velocity Headwaters Headwaters Increase Mouth Mouth SmartFigure 16.14 Channel changes from head to mouth Although the gradi- ent decreases toward the mouth of a stream, increases in discharge and channel size and decreases in roughness more than offset the decrease in slope. Consequently, flow velocity usually increases toward the mouth. (https:// goo.gl/6srX2s) Download the FREE BP App for iOS Download the FREE BP App for Android

Welcome message from author
This document is posted to help you gain knowledge. Please leave a comment to let me know what you think about it! Share it to your friends and learn new things together.
Transcript
Augmented Reality Enhances the Reading Experience, Bringing the Textbook to Life
xxii
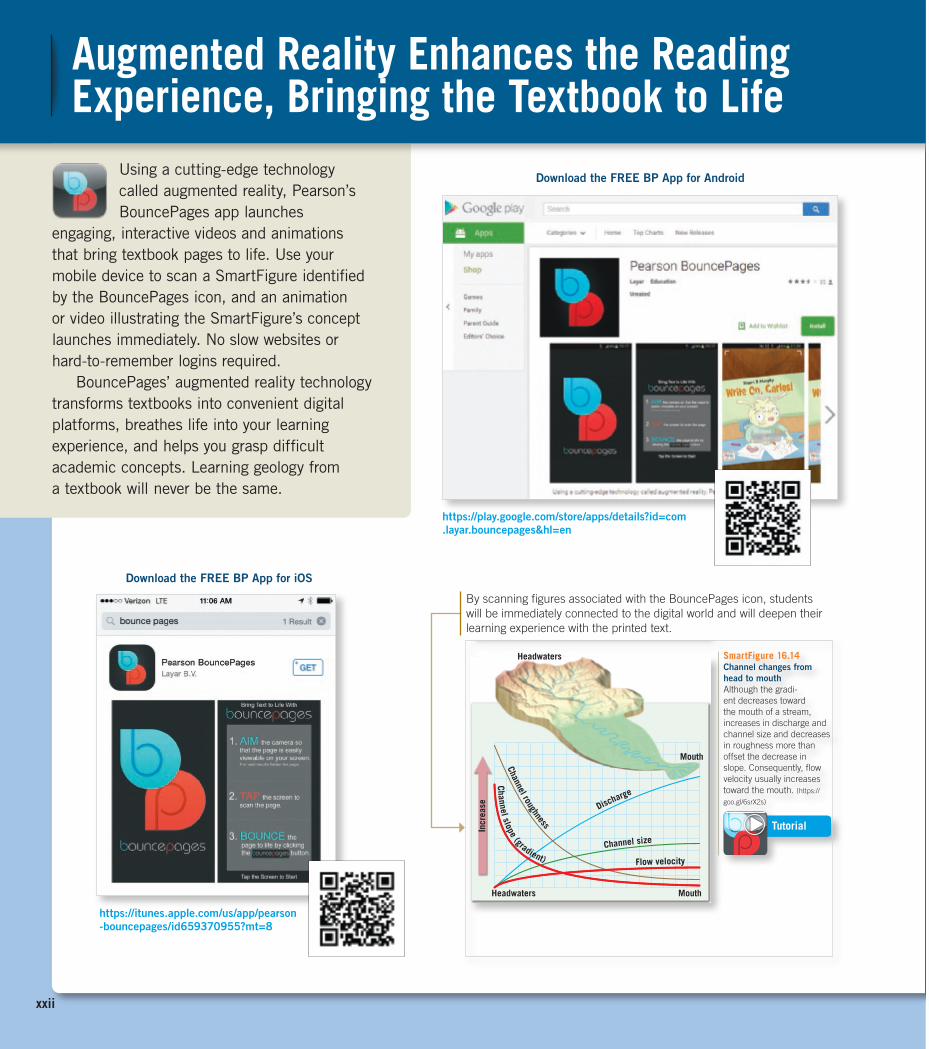
Using a cutting-edge technology called augmented reality, Pearson’s BouncePages app launches
engaging, interactive videos and animations that bring textbook pages to life. Use your mobile device to scan a SmartFigure identified by the BouncePages icon, and an animation or video illustrating the SmartFigure’s concept launches immediately. No slow websites or hard-to-remember logins required.
BouncePages’ augmented reality technology transforms textbooks into convenient digital platforms, breathes life into your learning experience, and helps you grasp difficult academic concepts. Learning geology from a textbook will never be the same.
https://itunes.apple.com/us/app/pearson -bouncepages/id659370955?mt=8
https://play.google.com/store/apps/details?id=com .layar.bouncepages&hl=en
By scanning figures associated with the BouncePages icon, students will be immediately connected to the digital world and will deepen their learning experience with the printed text.
16.3 Streamflow Characteristics 477
HeadSteeper gradient
Gentlergradient
Elev
atio
n (k
m)
0 50 100 150
4
3
2
1
0
Distance (km)
Fresno,CA
Mt. Whitney
Kings River
S i e r r a N e v a d a
Mouth
A longitudinal pro�le isa cross-section along
the length of a stream
measurement is frequently reported by the media, especially when a river approaches or surpasses flood stage. Streamflow measurements are essential components of river models used to make flood forecasts and issue warnings. There are other applications as well. The data are used to make decisions related to water supply allocations, operation of wastewater treatment plants, design of highway bridges, and recreation activities.
changes DownstreamOne useful way of studying a stream is to examine its longitudinal pro-file. Such a profile is simply a cross-sectional view of a stream from its source area (called the head, or headwaters) to its mouth, the point downstream where it empties into another water body—a river, a lake, or the ocean. Figure 16.13 shows that the most obvious feature of a typical longitudinal profile is its concave shape—a result of the decrease in slope that occurs from the headwaters to the mouth. In addition, local irregularities exist in the profiles of most streams; the flatter sections may be associated with lakes or reservoirs, and the steeper sections are sites of rapids or waterfalls.
The change in slope observed on most stream profiles is usually accompanied by an increase in discharge and channel size, as well as a reduction in sediment particle size (Figure 16.14). For example, data from successive gag-ing stations along most rivers show that, in humid regions, discharge increases toward the mouth. This should come as no surprise because, as we move downstream, more and more tributaries contribute water to the main chan-nel. In the case of the Amazon, for example, about 1000 tributaries join the main river along its 6500-kilometer (4000-mile) course across South America.
In order to accommodate the growing volume of water, channel size typically increases downstream as well. Recall that flow velocities are higher in large chan-nels than in small channels. Furthermore, observations show a general decline in sediment size downstream, making the channel smoother and more efficient.
Although the channel slope decreases—the gradient becomes less steep—toward a stream’s mouth, the flow velocity generally increases. This fact contradicts our intuitive assumptions of swift, narrow headwater streams and wide, placid rivers flowing across more subtle topography. Increases in channel size and discharge and decreases in channel roughness that occur downstream compensate for the decrease in slope—thereby mak-ing the stream more efficient (see Figure 16.14). Thus, the average flow velocity is typically lower in headwater streams than in wide, placid-appearing rivers.
Figure 16.13longitudinal profile California’s Kings River origi-nates high in the Sierra Nevada and flows into the San Joaquin Valley.
Discharge
Channel roughness
Channel size
Channel slope (gradient) Flow velocity
Headwaters
Headwaters
Incr
ease
Mouth
Mouth
smartFigure 16.14channel changes from head to mouthAlthough the gradi-ent decreases toward the mouth of a stream, increases in discharge and channel size and decreases in roughness more than offset the decrease in slope. Consequently, flow velocity usually increases toward the mouth. (https://
goo.gl/6srX2s)
16.3 Concept Checks1. Contrast laminar flow and turbulent flow.
2. Summarize the factors that influence flow velocity.
3. What is a longitudinal profile?
4. What typically happens to channel width, channel depth, flow velocity, and discharge between the headwaters and the mouth of a stream? Briefly explain why these changes occur.
M16_TARB4252_12_SE_C16.indd 477 12/10/15 6:13 PM
Download the FREE BP App for iOS
Download the FREE BP App for Android
A02_TARB4252_12_SE_WALK.indd 22 14/10/15 6:43 PM
Bring the Field to YOUR Teaching and Learning Experience
xxiii
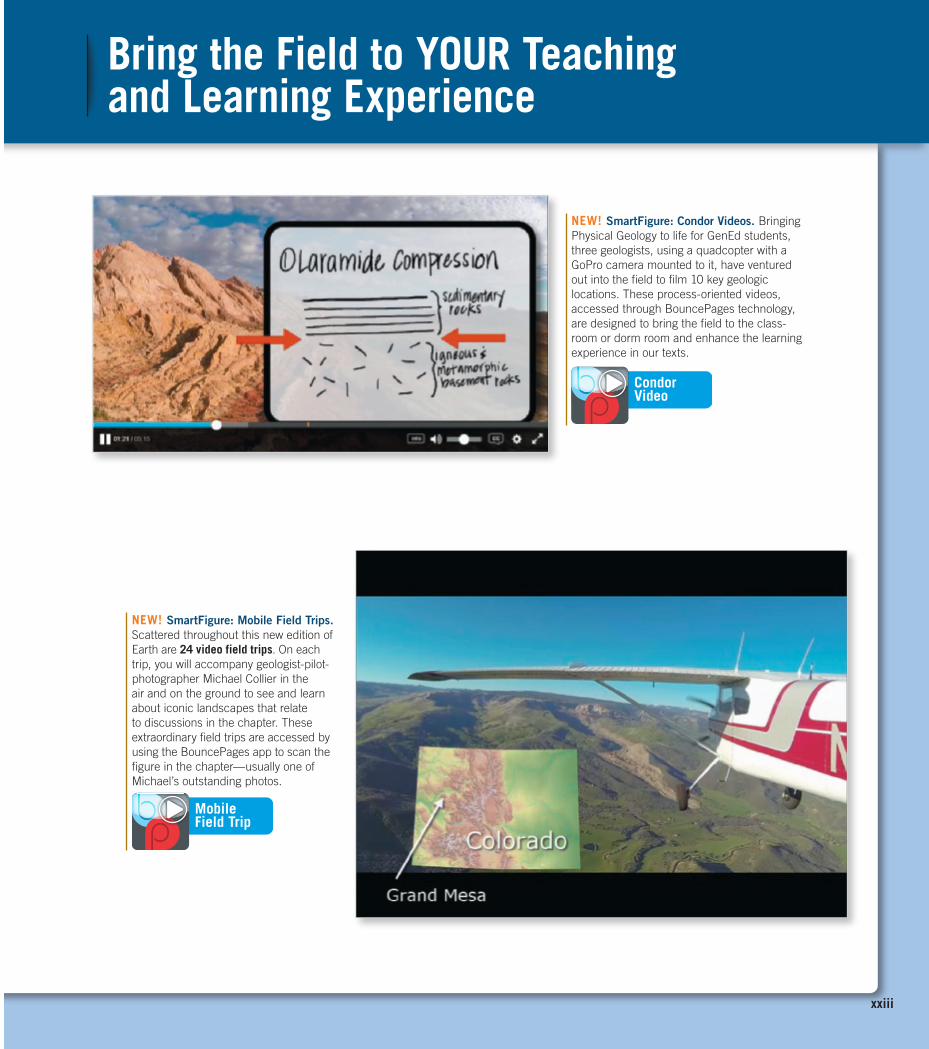
NEW! SmartFigure: Condor Videos. Bringing Physical Geology to life for GenEd students, three geologists, using a quadcopter with a GoPro camera mounted to it, have ventured out into the field to film 10 key geologic locations. These process-oriented videos, accessed through BouncePages technology, are designed to bring the field to the class-room or dorm room and enhance the learning experience in our texts.
NEW! SmartFigure: Mobile Field Trips. Scattered throughout this new edition of Earth are 24 video field trips. On each trip, you will accompany geologist-pilot-photographer Michael Collier in the air and on the ground to see and learn about iconic landscapes that relate to discussions in the chapter. These extraordinary field trips are accessed by using the BouncePages app to scan the figure in the chapter—usually one of Michael’s outstanding photos.
A02_TARB4252_12_SE_WALK.indd 23 14/10/15 6:43 PM
xxiv
Visualize Processes and Tough Topics
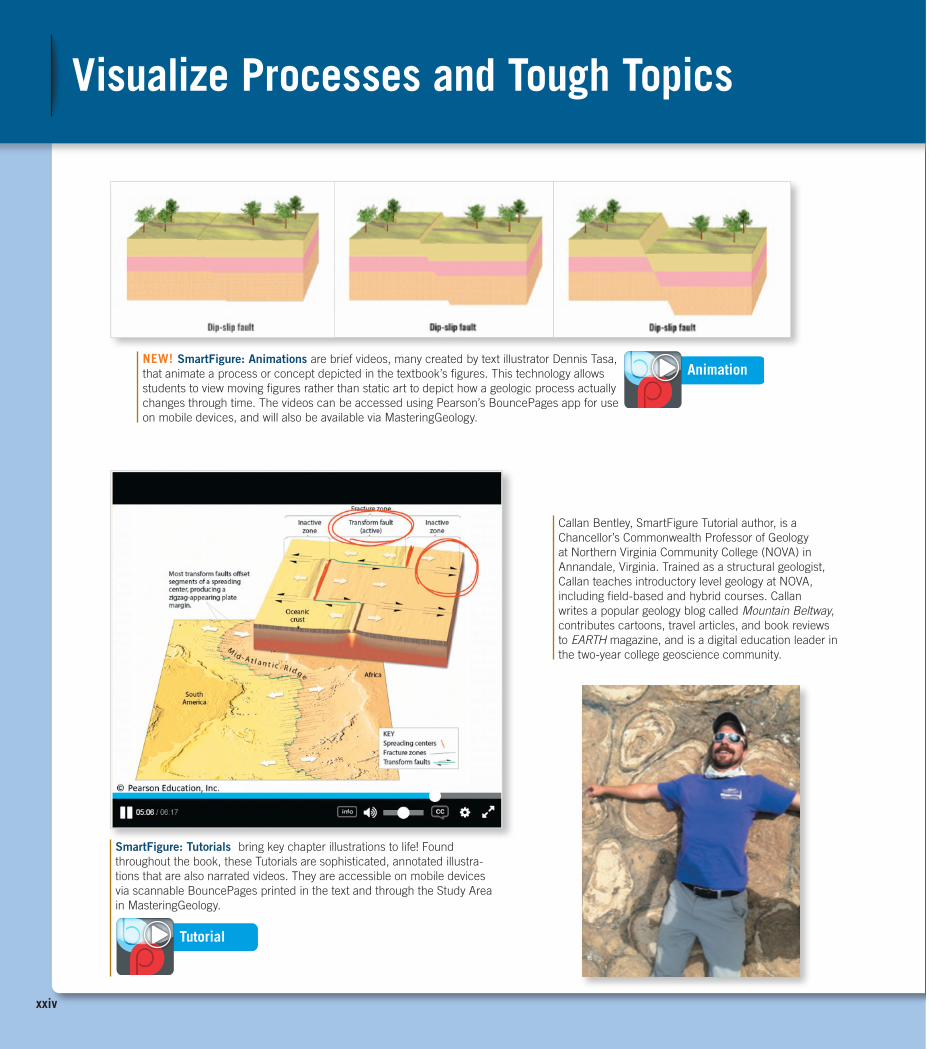
NEW! SmartFigure: Animations are brief videos, many created by text illustrator Dennis Tasa, that animate a process or concept depicted in the textbook’s figures. This technology allows students to view moving figures rather than static art to depict how a geologic process actually changes through time. The videos can be accessed using Pearson’s BouncePages app for use on mobile devices, and will also be available via MasteringGeology.
Callan Bentley, SmartFigure Tutorial author, is a Chancellor’s Commonwealth Professor of Geology at Northern Virginia Community College (NOVA) in Annandale, Virginia. Trained as a structural geologist, Callan teaches introductory level geology at NOVA, including field-based and hybrid courses. Callan writes a popular geology blog called Mountain Beltway, contributes cartoons, travel articles, and book reviews to EARTH magazine, and is a digital education leader in the two-year college geoscience community.
SmartFigure: Tutorials bring key chapter illustrations to life! Found throughout the book, these Tutorials are sophisticated, annotated illustra-tions that are also narrated videos. They are accessible on mobile devices via scannable BouncePages printed in the text and through the Study Area in MasteringGeology.
A02_TARB4252_12_SE_WALK.indd 24 14/10/15 6:43 PM
xxv
Improved Geospatial and Data Visualizations
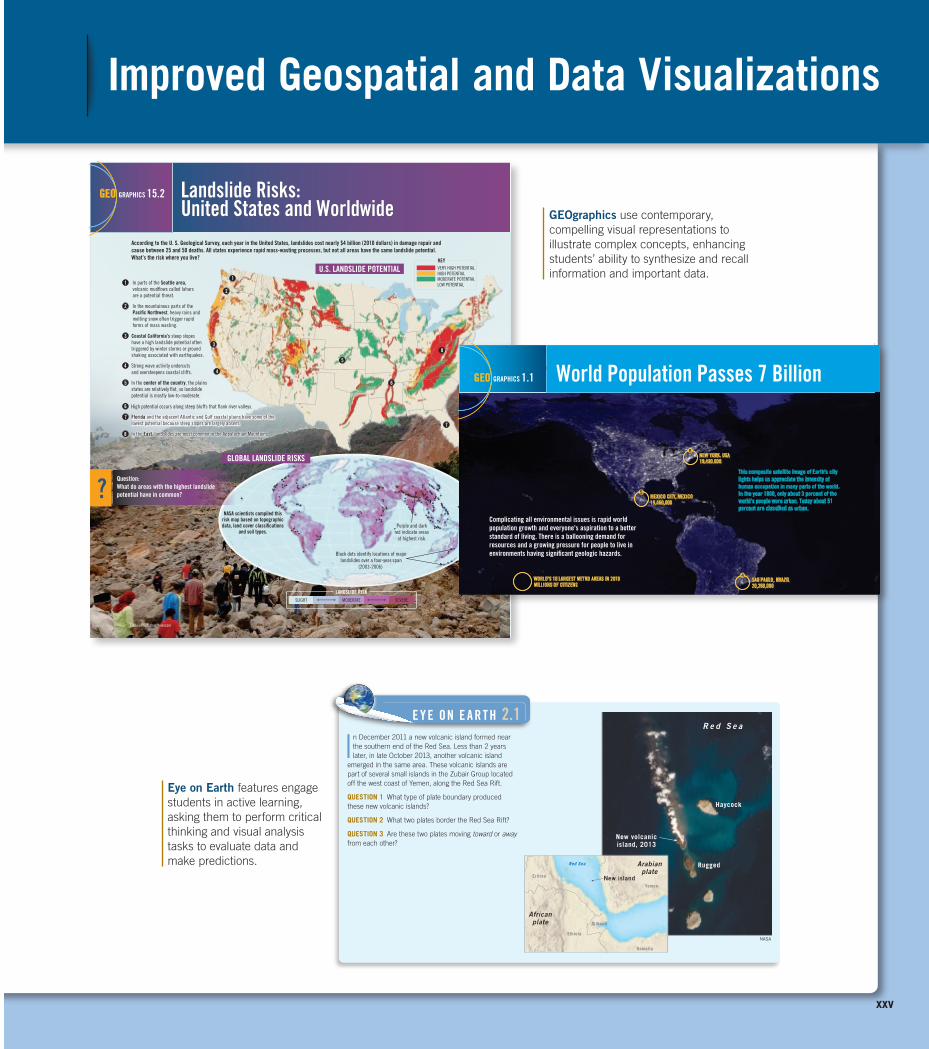
GEOgraphics use contemporary, compelling visual representations to illustrate complex concepts, enhancing students’ ability to synthesize and recall information and important data.
Eye on Earth features engage students in active learning, asking them to perform critical thinking and visual analysis tasks to evaluate data and make predictions.
2.5 Divergent Plate Boundaries and Seafloor Spreading 49
rift valley will lengthen and deepen (see Figure 2.14C). At some point, the rift valley will become a narrow sea with an outlet to the ocean. The Red Sea, formed when the Arabian Peninsula split from Africa, is a modern example of such a feature and provides us with a view of how the Atlantic Ocean may have looked in its infancy (see Figure 2.14D).
smartFigure 2.15 east african rift valley The East African Rift valley represents the early stage in the breakup of a continent. Areas shown in red consist of lithosphere that has been stretched and thinned, allow-ing magma to well up from the mantle. (https://goo.gl/Gp4pje)
2.5 Concept Checks1. Sketch or describe how two plates move in
relation to each other along divergent plate boundaries.
2. What is the average rate of seafloor spreading in modern oceans?
3. List four features that characterize the oceanic ridge system.
4. Briefly describe the process of continental rifting. Where is it occurring today?
In December 2011 a new volcanic island formed near the southern end of the Red Sea. Less than 2 years later, in late October 2013, another volcanic island
emerged in the same area. These volcanic islands are part of several small islands in the Zubair Group located off the west coast of Yemen, along the Red Sea Rift.
QuestIon 1 What type of plate boundary produced these new volcanic islands?
QuestIon 2 What two plates border the Red Sea Rift?
QuestIon 3 Are these two plates moving toward or away from each other?
E Y E on E A R T h 2.1
Gulf of AdenAfar
Lowlands
Indian Ocean
Red Sea
Gulf of Aden
LakeVictoria
LakeTanganyika
AfarLowlands
Mt. Kenya
Mt. Kilimanjaro
EASTAFRICAN
RIFT
Indian OceanWesternBranch
EasternBranchWestern
Branch
EasternBranch
Red Sea
Africa
?
NASA
R e d S e a
New volcanicisland, 2013
Haycock
Rugged
Yemen
Eritrea
Red Sea
New island
Ethioia
Djibouti
Somalia
Africanplate
Arabianplate
NASA
M02_TARB4252_12_SE_C02.indd 49 09/10/15 2:39 PM
452 Chapter 15 Mass Wasting: The Work of Gravity
United States and WorldwideUnited States and WorldwideLandslide Risks:Landslide Risks:
NASA scientists compiled thisrisk map based on topographicdata, land cover classi�cations
and soil types.
Black dots identify locations of majorlandslides over a four-year span
(2003-2006)
1
2
In parts of the Seattle area,volcanic mud�ows called laharsare a potential threat.
Strong wave activity undercutsand oversteepens coastal cliffs.
In the center of the country, the plainsstates are relatively �at, so landslidepotential is mostly low-to-moderate.
U.S. LANDSLIDE POTENTIAL1
2
3
4
5
6
7
8
3
4
5
6
7
8
GLOBAL LANDSLIDE RISKS
LANDSLIDE RISKSLIGHT MODERATE SEVERE
KEYVERY HIGH POTENTIALHIGH POTENTIALMODERATE POTENTIALLOW POTENTIAL
Coastal California’s steep slopeshave a high landslide potential oftentriggered by winter storms or groundshaking associated with earthquakes.
Xinhua/Photoshot/Newscom
Reuters/Japan Coast Guard
Purple and darkred indicate areas
at highest risk.
According to the U. S. Geological Survey, each year in the United States, landslides cost nearly $4 billion (2010 dollars) in damage repair andcause between 25 and 50 deaths. All states experience rapid mass-wasting processes, but not all areas have the same landslide potential.What’s the risk where you live?
In the mountainous parts of thePaci�c Northwest, heavy rains andmelting snow often trigger rapidforms of mass wasting.
High potential occurs along steep bluffs that �ank river valleys.
Florida and the adjacent Atlantic and Gulf coastal plains have some of thelowest potential because steep slopes are largely absent.
In the East, landslides are most common in the Appalachian Mountains
Question:What do areas with the highest landslide potential have in common?
GEO GRAPHICS 15.2
M15_TARB4252_12_SE_C15.indd 452 07/09/15 2:23 PM
6 cHApter 1 An Introduction to Geology
According to the United Nations, more people live in cities than in rural areas (see GEOgraphics 1.1). This global trend toward urbanization concen-trates millions of people into megacities, many of which are vulnerable to natural hazards. Coastal sites are especially vulnerable because development often destroys natural defenses such as wetlands and sand dunes. In addition, threats associated with human influences on the Earth system are increasing; one example is sea-level rise linked to global climate change. Some megacities are exposed to seismic (earthquake) and volcanic hazards because inap-propriate land use and poor construction practices, coupled with rapid population growth, increase the risk of death and damage.
Resources are another important focus of geology that is of great practical value to people. They include water and soil, a great variety of metallic and nonmetallic miner-als, and energy (Figure 1.4). Together these form the very foundation of modern civilization. Geology deals not only with how and where these vital resources form but also with
6
5
4
GEO GRAPHICS 1.1 World Population Passes 7 Billion
Complicating all environmental issues is rapid world population growth and everyone's aspiration to a better standard of living. There is a ballooning demand for resources and a growing pressure for people to live in environments having signi�cant geologic hazards.
This composite satellite image of Earth's city lights helps us appreciate the intensity of human occupation in many parts of the world. In the year 1800, only about 3 percent of the world's people were urban. Today about 51 percent are classi�ed as urban.
NEW YORK, USA19,430,000
MEXICO CITY, MEXICO19,460,000
SAO PAULO, BRAZIL20,260,000
NEW YORK, USA19,430,000
MEXICO CITY, MEXICO19,460,000
SAO PAULO, BRAZIL20,260,000
WORLD’S 10 LARGEST METRO AREAS IN 2010MILLIONS OF CITIZENS
2
3
1
8 9
7
10
1800
18001 BILLION
19272 BILLION
19603 BILLION
19744 BILLION
19875 BILLION
19996 BILLION
20117 BILLION
2025*8 BILLION
1850 1900 1950 2000 YEAR
WOR
LD P
OPUL
ATIO
NIN
BIL
LION
S
1800
18001 BILLION
19272 BILLION
19603 BILLION
19744 BILLION
19875 BILLION
19996 BILLION
20117 BILLION
2025*8 BILLION
1850 1900 1950 2000 YEAR
WOR
LD P
OPUL
ATIO
NIN
BIL
LION
S
NASA
*projection*projection
WORLD POPULATION MILESTONESGrowth of population 1800-2011 and projected to 2025
It took until about the year 1800 for world population to reach 1 billion people. By 1927, the number doubled to 2 billion. According to U.N. estimates, world population reached 7 billion in late October 2011. We are currently adding 80 million people per year to the planet.
Question:Find the year on the graph near your birth date. About how much will population have increased between the date you selected and 2025?
DELHI, INDIA22,160,000
MUMBAI, INDIA20,400,000
KOLKATA, INDIA15,550,000
DHAKA, BANGLADESH14,650,000
SHANGHAI, CHINA16,580,000
KARACHI, PAKISTAN13,120,000
TOKYO, JAPAN36,670,000
maintaining supplies and with the environmental impacts of their extraction and use.
Geologic processes clearly have an impact on people. Conversely, we humans can dramatically influence geo-logic processes. For example, landslides and river flood-ing occur naturally, but the magnitude and frequency of these processes can be affected significantly by human activities such as clearing forests, building cities, and constructing roads and dams. Unfortunately, natural systems do not always adjust to artificial changes in ways that we can anticipate. Thus, an alteration to the environ-ment that was intended to benefit society sometimes has the opposite effect.
At appropriate places throughout this book, you will examine different aspects of our relationship with the physical environment. Nearly every chapter addresses some aspect of natural hazards, resources, and the envi-ronmental issues associated with each. Significant parts of some chapters provide the basic geologic knowledge and principles needed to understand environmental problems.
M01_TARB4252_12_SE_C01.indd 6 09/10/15 2:30 PM
A02_TARB4252_12_SE_WALK.indd 25 14/10/15 6:44 PM
xxvi
Modular Approach Driven by Learning Objectives
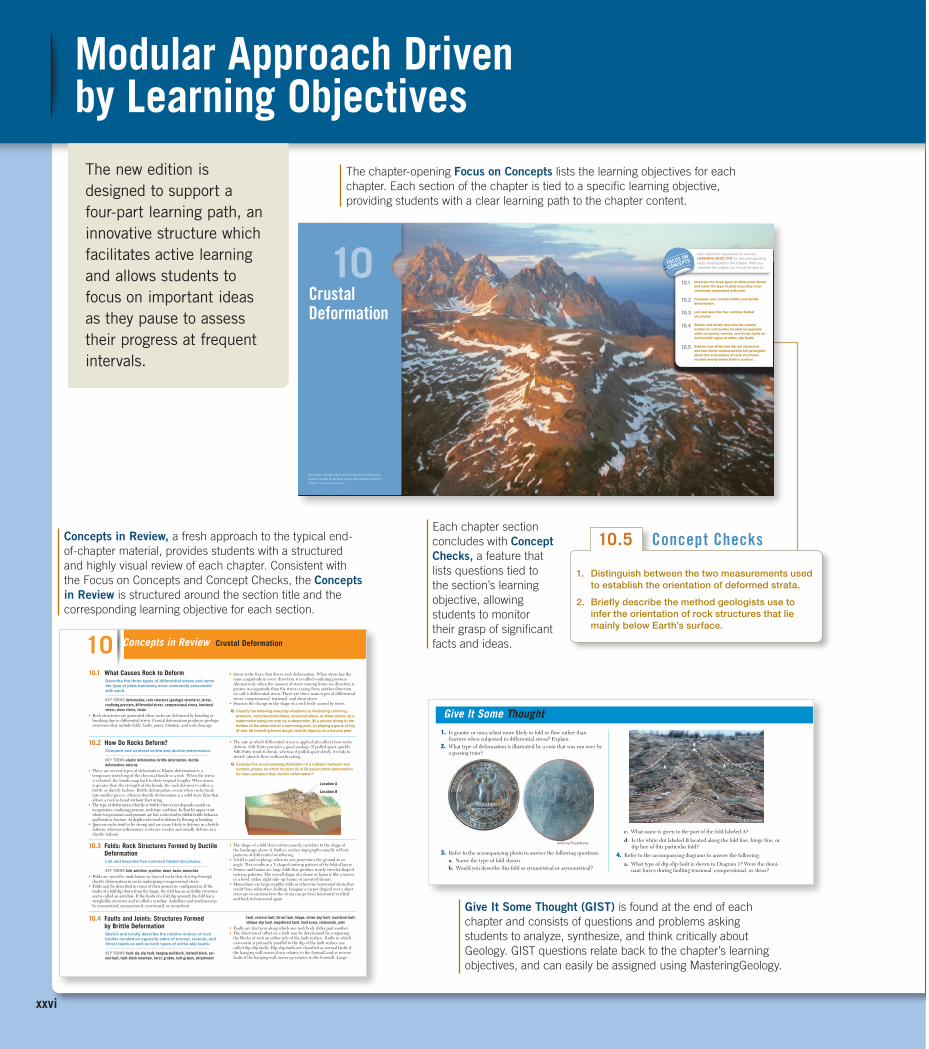
The new edition is designed to support a four-part learning path, an innovative structure which facilitates active learning and allows students to focus on important ideas as they pause to assess their progress at frequent intervals.
Concepts in Review, a fresh approach to the typical end-of-chapter material, provides students with a structured and highly visual review of each chapter. Consistent with the Focus on Concepts and Concept Checks, the Concepts in Review is structured around the section title and the corresponding learning objective for each section.
Concepts in Review crustal Deformation1010.1 What causes Rock to Deform
Describe the three types of differential stress and name the type of plate boundary most commonly associated with each.
Key teRMs deformation, rock structure (geologic structure), stress, confining pressure, differential stress, compressional stress, tensional stress, shear stress, strain
• Rock structures are generated when rocks are deformed by bending or breaking due to differential stress. Crustal deformation produces geologic structures that include folds, faults, joints, foliation, and rock cleavage.
• Stress is the force that drives rock deformation. When stress has the same magnitude in every direction, it is called confining pressure. Alternatively, when the amount of stress coming from one direction is greater in magnitude than the stress coming from another direction, we call it differential stress. There are three main types of differential stress: compressional, tensional, and shear stress.
• Strain is the change in the shape of a rock body caused by stress.
Q Classify the following everyday situations as illustrating confining pressure, compressional stress, tensional stress, or shear stress: (a) a watermelon being run over by a steamroller, (b) a person diving to the bottom of the deep end of a swimming pool, (c) playing a game of tug-of-war, (d) kneading bread dough, and (e) slipping on a banana peel.
10.2 how Do Rocks Deform?Compare and contrast brittle and ductile deformation.
Key teRMs elastic deformation, brittle deformation, ductile deformation, outcrop
• There are several types of deformation. Elastic deformation is a temporary stretching of the chemical bonds in a rock. When the stress is released, the bonds snap back to their original lengths. When stress is greater than the strength of the bonds, the rock deforms in either a brittle or ductile fashion. Brittle deformation occurs when rocks break into smaller pieces, whereas ductile deformation is a solid-state flow that allows a rock to bend without fracturing.
• The type of deformation (ductile or brittle) that occurs depends mainly on temperature, confining pressure, rock type, and time. In Earth’s upper crust where temperatures and pressure are low, rocks tend to exhibit brittle behavior and break or fracture. At depth rocks tend to deform by flowing or bending.
• Igneous rocks tend to be strong and are more likely to deform in a brittle fashion, whereas sedimentary rocks are weaker and usually deform in a ductile fashion.
• The rate at which differential stress is applied also affects how rocks deform. Silly Putty provides a good analogy: If pulled apart quickly, Silly Putty tends to break, whereas if pulled apart slowly, it tends to stretch (ductile flow) without breaking.
Q Examine the accompanying illustration of a collision between two tectonic plates. At which location (A or B) would brittle deformation be more prevalent than ductile deformation?
Location A
Location B
10.3 Folds: Rock structures Formed by Ductile DeformationList and describe five common folded structures.
Key teRMs fold, anticline, syncline, dome, basin, monocline• Folds are wavelike undulations in layered rocks that develop through
ductile deformation in rocks undergoing compressional stress.• Folds may be described in terms of their geometric configuration: If the
limbs of a fold dip down from the hinge, the fold has an arch-like structure and is called an anticline. If the limbs of a fold dip upward, the fold has a trough-like structure and is called a syncline. Anticlines and synclines may be symmetrical, asymmetrical, overturned, or recumbent.
• The shape of a fold does not necessarily correlate to the shape of the landscape above it. Rather, surface topography usually reflects patterns of differential weathering.
• A fold is said to plunge when its axis penetrates the ground at an angle. This results in a V-shaped outcrop pattern of the folded layers.
• Domes and basins are large folds that produce nearly circular-shaped outcrop patterns. The overall shape of a dome or basin is like a saucer or a bowl, either right-side-up (basin) or inverted (dome).
• Monoclines are large steplike folds in otherwise horizontal strata that result from subsurface faulting. Imagine a carpet draped over a short staircase to envision how the strata can go from horizontal to tilted and back to horizontal again.
10.4 Faults and Joints: structures Formed by Brittle DeformationSketch and briefly describe the relative motion of rock bodies located on opposite sides of normal, reverse, and thrust faults as well as both types of strike-slip faults.
Key teRMs fault, dip-slip fault, hanging wall block, footwall block, nor-mal fault, fault-block mountain, horst, graben, half-graben, detachment
fault, reverse fault, thrust fault, klippe, strike-slip fault, transform fault, oblique-slip fault, megathrust fault, fault scarp, slickenside, joint
• Faults are fractures along which one rock body slides past another.• The direction of offset on a fault may be determined by comparing
the blocks of rock on either side of the fault surface. Faults in which movement is primarily parallel to the dip of the fault surface are called dip-slip faults. Dip-slip faults are classified as normal faults if the hanging wall moves down relative to the footwall and as reverse faults if the hanging wall moves up relative to the footwall. Large
M10_TARB4252_12_SE_C10.indd 323 09/10/15 4:52 PM
Give It Some Thought (GIST) is found at the end of each chapter and consists of questions and problems asking students to analyze, synthesize, and think critically about Geology. GIST questions relate back to the chapter’s learning objectives, and can easily be assigned using MasteringGeology.
324 chApteR 10 Crustal Deformation
E.J. TarbuckA. B.
10.5 Mapping Geologic structuresExplain how strike and dip are measured and how these measurements tell geologists about the orientations of rock structures located mainly below Earth’s surface.
Key teRMs strike, dip, geologic map• Geologic maps are valuable tools for establishing the shape and
orientation of subterranean rock structures, mainly folds and faults—an important step for resource extraction and hazard assessment. Geologic maps are also used to reconstruct the geologic history of a region.
• Strike and dip are measurements of the orientation of planar rock features such as sedimentary bedding and fault surfaces. Strike is the compass direction of the line at the intersection between a horizontal plane and the geologic surface. Dip is the angle of inclination between the horizontal plane and a line perpendicular to the strike.
Q The accompanying simplified geologic map shows the strike and dip of outcropping sedimentary beds. Based on these measure- ments, what rock structure is most likely beneath Earth’s surface: anticline, syncline, dome, or basin?
Give It Some Thought 1. Is granite or mica schist more likely to fold or flow rather than
fracture when subjected to differential stress? Explain. 2. What type of deformation is illustrated by a coin that was run over by
a passing train?
Anthony Pleva/Alamy
A
B
A AA
B
E.J. Tarbuck
c. What name is given to the part of the fold labeled A?
d. Is the white dot labeled B located along the fold line, hinge line, or dip line of this particular fold?
4. Refer to the accompanying diagrams to answer the following:
a. What type of dip-slip fault is shown in Diagram 1? Were the domi-nant forces during faulting tensional, compressional, or shear?
normal faults with low dip angles are detachment faults, whereas reverse faults with low dip angles are called thrust faults.
• Areas of tectonic extension, such as the Basin and Range Province, produce fault-block mountains—horsts separated by neighboring grabens or half-grabens.
• Areas of tectonic compression, such as mountain belts, are dominated by reverse faults that shorten the crust horizontally while thickening it vertically.
• Most of the movement along a strike-slip fault is along the strike or trend of the fault trace. Transform faults are large strike-slip faults that serve as tectonic boundaries between lithospheric plates.
• Oblique-slip faults display characteristics of both dip-slip and strike-slip faults.• Joints are fractures in rocks along which no appreciable movement has
occurred.
Q What type of rock structure is shown in each of the accompanying photos: faults or joints? Explain how you arrived at your answer.
3. Refer to the accompanying photo to answer the following questions: a. Name the type of fold shown. b. Would you describe this fold as symmetrical or asymmetrical?
M10_TARB4252_12_SE_C10.indd 324 09/10/15 4:52 PM
The chapter-opening Focus on Concepts lists the learning objectives for each chapter. Each section of the chapter is tied to a specific learning objective, providing students with a clear learning path to the chapter content.
Each chapter section concludes with Concept Checks, a feature that lists questions tied to the section’s learning objective, allowing students to monitor their grasp of significant facts and ideas.
322 chApteR 10 Crustal Deformation
1. Distinguish between the two measurements used to establish the orientation of deformed strata.
2. Briefly describe the method geologists use to infer the orientation of rock structures that lie mainly below Earth’s surface.
10.5 Concept Checks
Figure 10.28Mapping geologic structures By establish-ing the strike and dip of outcropping sedimentary beds and placing symbols on a map, geologists can infer the orientation of the rock structures below the surface.
C. Block diagram
B. Geologic map
A. Study area
Sandstone
Red shale
Red shale
Limestone
Limestone
30°
30°
76°
76°
40°
40°
Sandstone
Sandstone
30°76° 40°
30°76°
76°
40°
40°30°
Outcrops
north. For example, N10°E means the line of strike is 10 degrees to the east of north.
Dip is the angle of inclination of the surface of a rock unit or fault, measured from a horizontal surface. Dip includes both an angle of inclination and a direction toward which the rock is inclined. In Figure 10.27 the dip angle of the rock layer is 30 degrees. The direction of dip is always at a 90-degree angle to the strike.
When doing field research, geologists measure the strike and dip of sedimentary strata at as many out-crops as practical (Figure 10.28A). These data are then plotted on a topographic map or an aerial photograph, using T-shaped symbols. In laboratories, this informa-tion, as well as notes about the rock units, is used to prepare graphical depictions of the study area, called geologic maps. Figure 10.28B shows a simplified geo-logic map of the study area. Geologic maps are valu-able tools used to infer the orientation and shape of buried rock structures (Figure 10.28c). Using this infor-mation, geologists can reconstruct the pre-erosional structures and begin to interpret the region’s geologic history. Geologic maps are also used to aid in extract-ing mineral resources and assessing hazards, such as the potential for groundwater contamination from a proposed disposal site.
M10_TARB4252_12_SE_C10.indd 322 09/10/15 4:52 PM
Each statement represents the primary learning objective for the corresponding major heading within the chapter. After you complete the chapter you should be able to:
Focus on
concepts
10.1 Describe the three types of differential stress and name the type of plate boundary most commonly associated with each.
10.2 Compare and contrast brittle and ductile deformation.
10.3 List and describe five common folded structures.
10.4 Sketch and briefly describe the relative motion of rock bodies located on opposite sides of normal, reverse, and thrust faults as well as both types of strike-slip faults.
10.5 Explain how strike and dip are measured and how these measurements tell geologists about the orientations of rock structures located mainly below Earth’s surface.
M10_TARB4252_12_SE_C10.indd 303 09/10/15 4:51 PM
10Crustal Deformation
Wyoming’s Grand Tetons are the result of crustal defor-mation created by tectonic forces that operate in Earth’s interior. (Photo by Michael Collier)
M10_TARB4252_12_SE_C10.indd 302 09/10/15 4:51 PM
A02_TARB4252_12_SE_WALK.indd 26 14/10/15 6:44 PM
xxvii
Continuous Learning Before, During, and After Class with
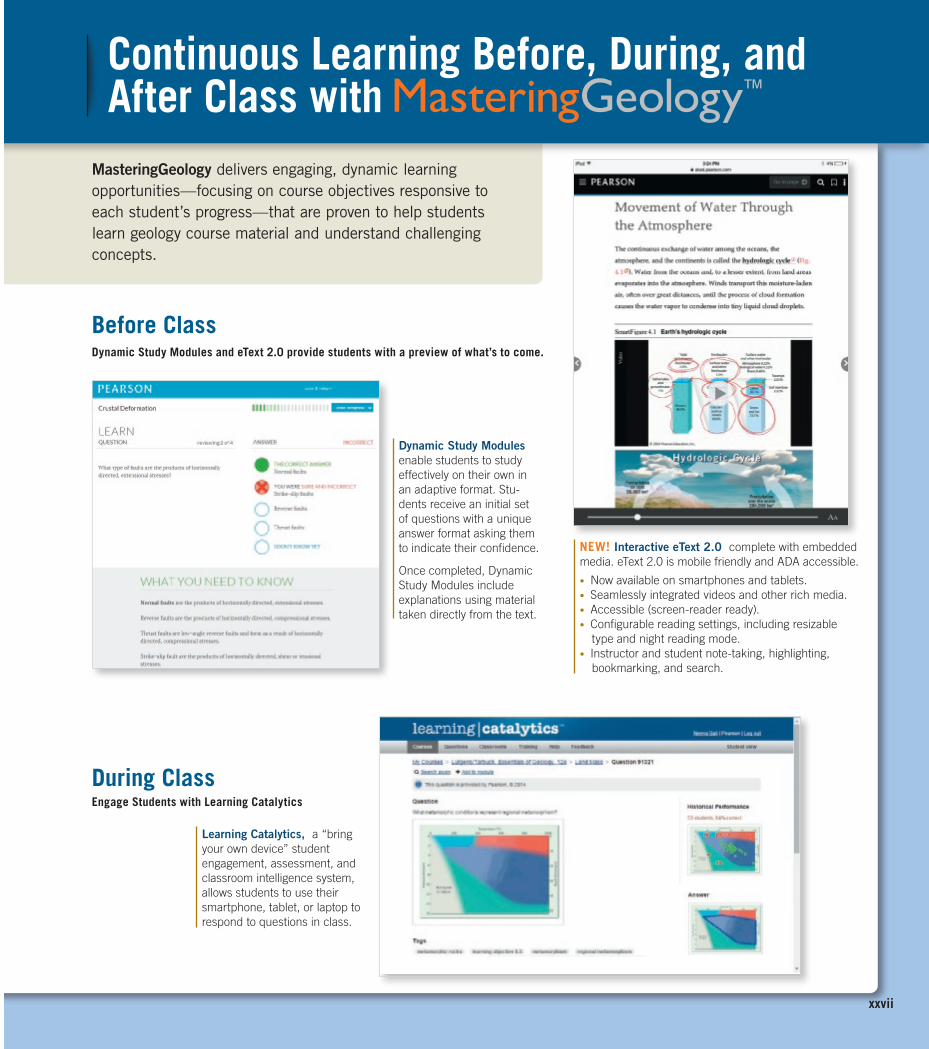
MasteringGeology delivers engaging, dynamic learning opportunities—focusing on course objectives responsive to each student’s progress—that are proven to help students learn geology course material and understand challenging concepts.
Before ClassDynamic Study Modules and eText 2.0 provide students with a preview of what’s to come.
During ClassEngage Students with Learning Catalytics
Dynamic Study Modules enable students to study effectively on their own in an adaptive format. Stu-dents receive an initial set of questions with a unique answer format asking them to indicate their confidence.
Once completed, Dynamic Study Modules include explanations using material taken directly from the text.
Learning Catalytics, a “bring your own device” student engagement, assessment, and classroom intelligence system, allows students to use their smartphone, tablet, or laptop to respond to questions in class.
NEW! Interactive eText 2.0 complete with embedded media. eText 2.0 is mobile friendly and ADA accessible.
• Now available on smartphones and tablets.• Seamlessly integrated videos and other rich media.• Accessible (screen-reader ready).• Configurable reading settings, including resizable
type and night reading mode.• Instructor and student note-taking, highlighting,
bookmarking, and search.
A02_TARB4252_12_SE_WALK.indd 27 14/10/15 6:44 PM
xxviii
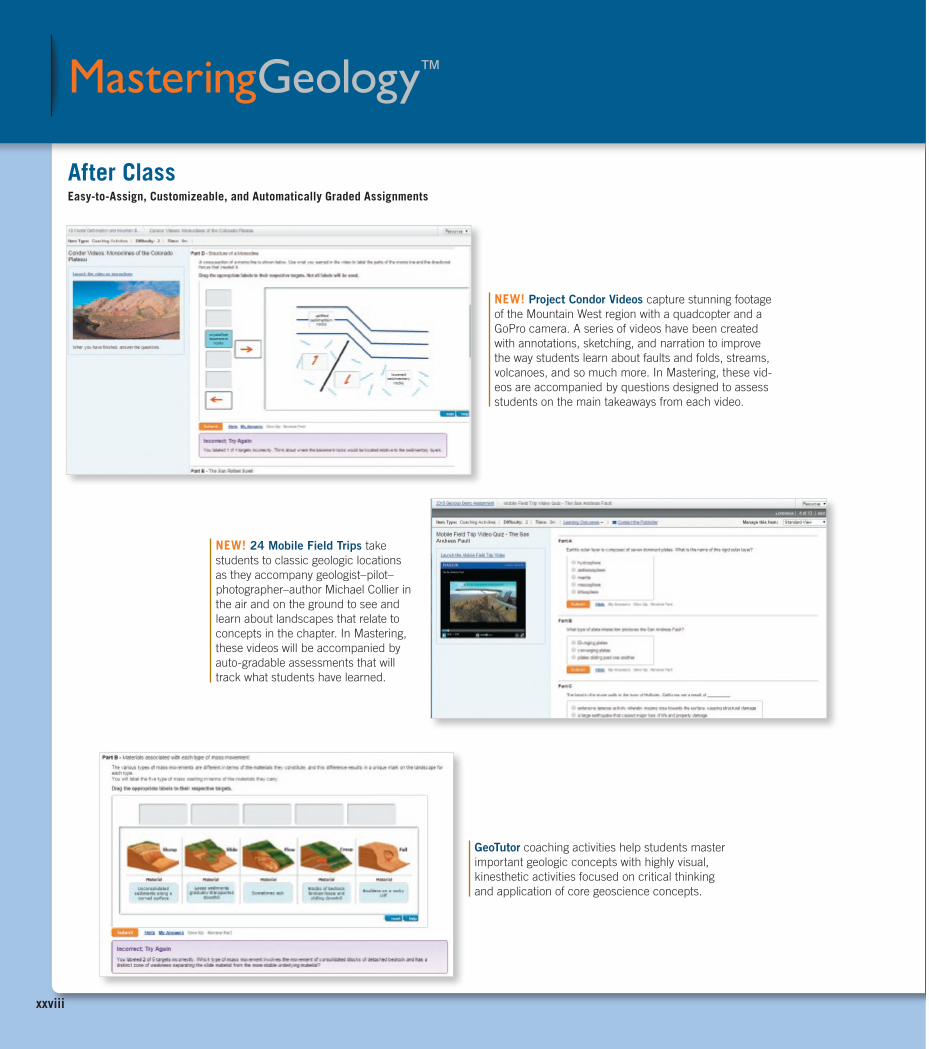
GeoTutor coaching activities help students master important geologic concepts with highly visual, kinesthetic activities focused on critical thinking and application of core geoscience concepts.
After ClassEasy-to-Assign, Customizeable, and Automatically Graded Assignments
NEW! Project Condor Videos capture stunning footage of the Mountain West region with a quadcopter and a GoPro camera. A series of videos have been created with annotations, sketching, and narration to improve the way students learn about faults and folds, streams, volcanoes, and so much more. In Mastering, these vid-eos are accompanied by questions designed to assess students on the main takeaways from each video.
NEW! 24 Mobile Field Trips take students to classic geologic locations as they accompany geologist–pilot–photographer–author Michael Collier in the air and on the ground to see and learn about landscapes that relate to concepts in the chapter. In Mastering, these videos will be accompanied by auto-gradable assessments that will track what students have learned.
A02_TARB4252_12_SE_WALK.indd 28 14/10/15 6:44 PM
xxix
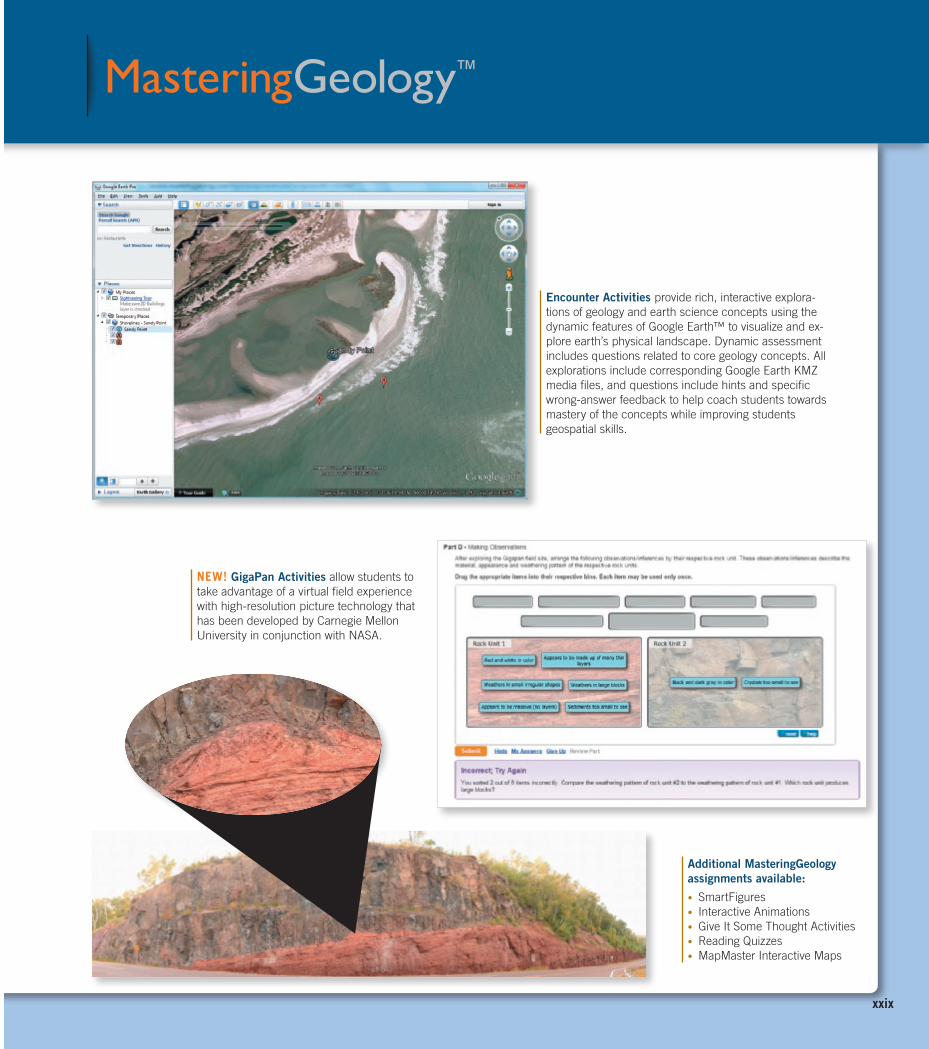
Encounter Activities provide rich, interactive explora-tions of geology and earth science concepts using the dynamic features of Google Earth™ to visualize and ex-plore earth’s physical landscape. Dynamic assessment includes questions related to core geology concepts. All explorations include corresponding Google Earth KMZ media files, and questions include hints and specific wrong-answer feedback to help coach students towards mastery of the concepts while improving students geospatial skills.
Additional MasteringGeology assignments available:
• SmartFigures• Interactive Animations• Give It Some Thought Activities• Reading Quizzes• MapMaster Interactive Maps
NEW! GigaPan Activities allow students to take advantage of a virtual field experience with high-resolution picture technology that has been developed by Carnegie Mellon University in conjunction with NASA.
A02_TARB4252_12_SE_WALK.indd 29 14/10/15 6:44 PM
Related Documents