Welcome message from author
This document is posted to help you gain knowledge. Please leave a comment to let me know what you think about it! Share it to your friends and learn new things together.
Transcript

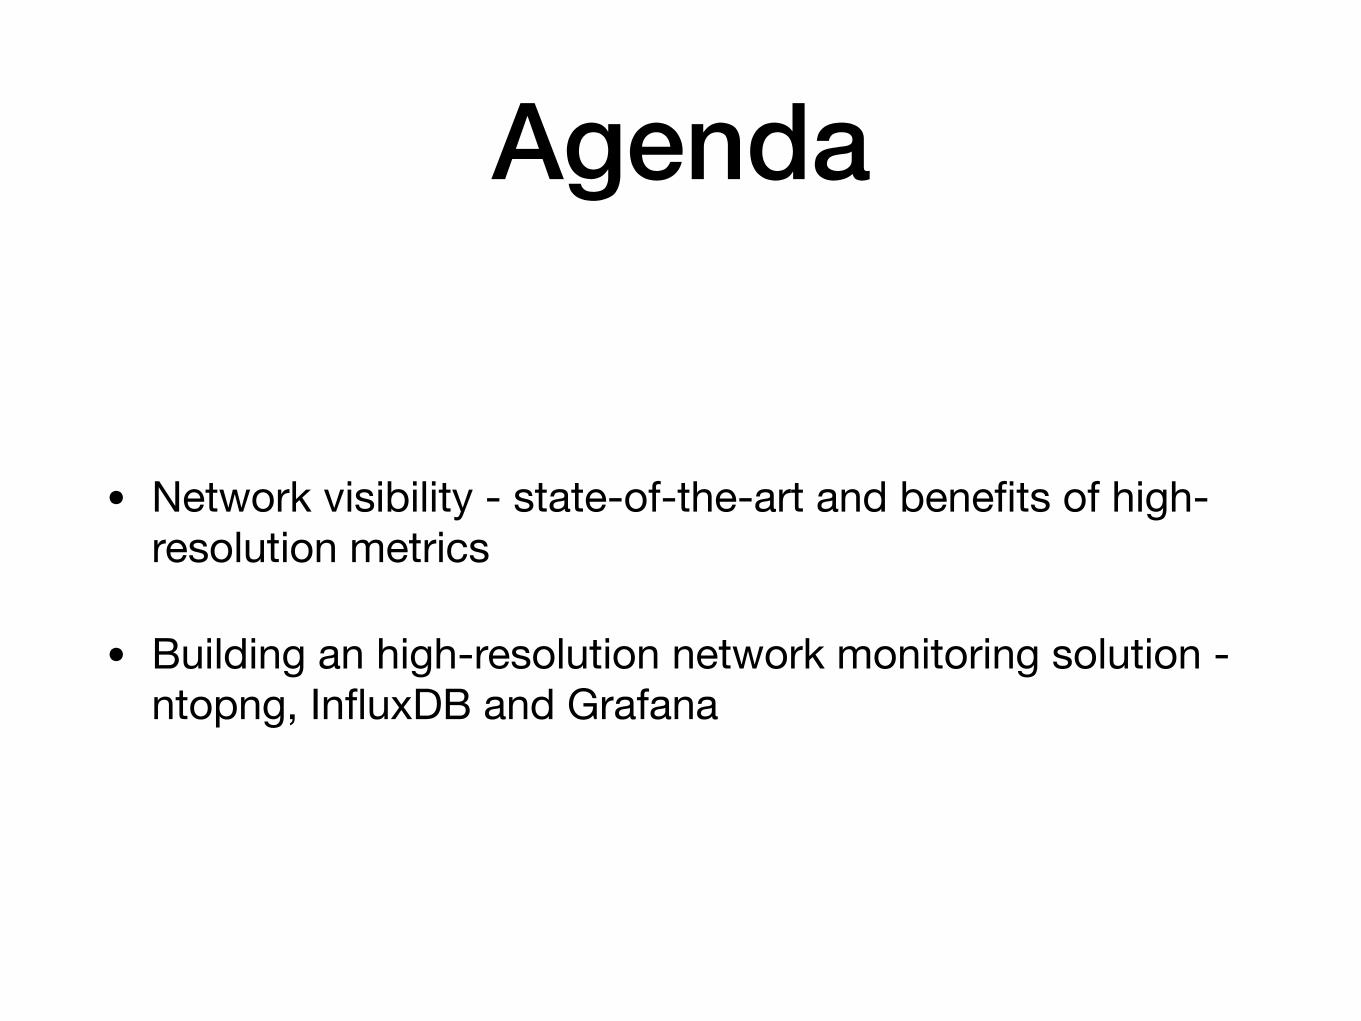
Agenda
• Network visibility - state-of-the-art and benefits of high-resolution metrics
• Building an high-resolution network monitoring solution - ntopng, InfluxDB and Grafana

Network Visibility
• In general, network visibility is provided by means of metrics
• bytes, packets, applications (e.g, YouTube, FaceBook), …
• Metrics are sampled at discrete time intervals — the shorter the interval, the higher the resolution

?
Inter-Interval Blindness• Nothing is known on the metric evolution between
consecutive samples
• Being able to increase the resolution reduces the unknowns
time
met
ric(ti
me)
Sampling Interval
s1
s2

Let’s See an Example• Same volume of traffic transferred
• Free link
• Fully-utilized link
• Client and server connected to a GbE switch
• iperf for the transfer (https://github.com/esnet/iperf)
• monitoring with ntopng (https://github.com/ntop/ntopng)
• 5-min vs 10-sec traffic samples

Free vs Fully-Utilized Link: 5-min Samples
client: [email protected]:~$ iperf -c develv5 -p 8082 -i 1 -t 9999 -n 10240M
server: [email protected]:~$ iperf -s -p 8082 -i 1 -t 99999

Free vs Fully-Utilized Link: 10-sec Samples
client: [email protected]:~$ iperf -c develv5 -p 8082 -i 1 -t 9999 -n 10240M
server: [email protected]:~$ iperf -s -p 8082 -i 1 -t 99999

10-secSamples
5-minSamples

Why Care? Throughput• Some applications expect the network to provide them a
minimum throughput
• VoIP
• Realtime Video
• Failing to meet such requirements could cause intermittent user experience and application performance degradation
• 10-sec throughput != 5-min throughput

• Detect bursty traffic
• Bursts can cause network buffers to overflow
• Packet drops while having a low average link utilization
• Cause network equipment further down the line to deliver packets at odd intervals, determining latency and jitter issues
• 10-sec samples can highlight bursts averaged out when using 5-min samples
Why Care? Burstiness

Augmented Visibility: Theory
• Monitoring tool that is able to generate metrics up to a packet-by-packet resolution
• Big-data store that is able to retain sub-minute samples
• Visualization/analytics platform for the analysis

Augmented Visibility: Practice
• Monitoring tool: ntopng
• Big-data store: InfluxDB
• Visualization/analytics platform: Grafana

Monitoring Tool: ntopng
• opensource web-based network monitoring tool
• https://github.com/ntop/ntopng

Sub-Min Samples with ntopng
• ntopng architecture
• Packet capture thread
• Periodic activities
• Originally based on RRDs, ntopng has been extended to produce 10-second samples, e.g., bytes(t), bytes(t+10), bytes(t+20), …
• Samples are temporary stored and periodically POST-ed to InfluxDB

Configurations
[email protected]:~$ ps aux | grep influxdb influxdb 2103 2.3 9.0 3856332 1471988 ? Ssl Jan17 297:12 /usr/bin/influxd -config /etc/influxdb/influxdb.conf

Grafana: Dashboards

Grafana #2: Alerts

Demo
• Let’s see ntopng, InfluxDB and Grafana in action…

Take-Home
• High-resolution metrics can unveil traffic patterns hidden at lower-resolutions
• Effective solution for high-resolution network monitoring involves ntopng (monitoring) + InfluxDB (storage) + Grafana (visualization / analysis)

Appendix
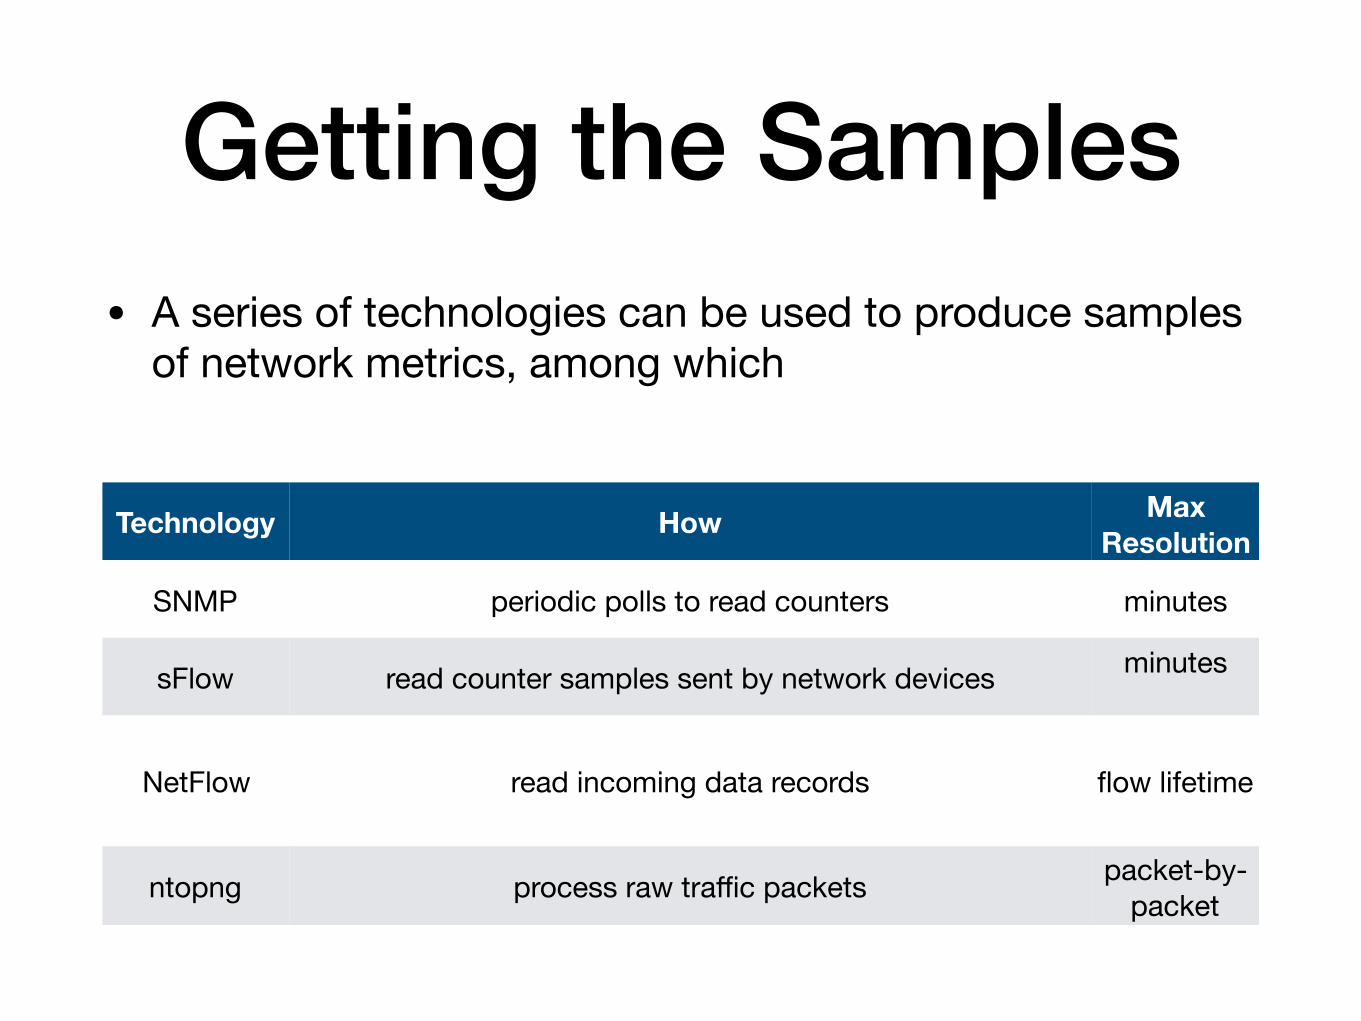
Getting the Samples• A series of technologies can be used to produce samples
of network metrics, among which
Technology How Max Resolution
SNMP periodic polls to read counters minutes
sFlow read counter samples sent by network devices minutes
NetFlow read incoming data records flow lifetime
ntopng process raw traffic packets packet-by-packet

• Metrics Generation/Storage
• Hosts in a corporate network can range from hundreds up to tens of thousands
• Multiple metrics generated for every single host
• Bytes sent and received
• Layer-7 application protocols (e.g, Facebook, Youtube, …)
• RTT / Retransmits / Out-of-Order / Out-of-Sequence
• 10,000 hosts @ 20 metrics / host / 10 seconds produce~173 M samples per day
Augmented Visibility: Challenges [1/2]

• Analysis/Visualization
• Unfeasible to visualize millions of samples on a dashboard
• Rollups to prevent ‘averaging-out’ effects
• Computationally expensive to run certain algorithms (e.g., ML, AI)
• Rollups to produce statistically-meaningful data
Augmented Visibility: Challenges [2/2]
Related Documents