Augmented designs to assess immune responses in vaccine efficacy trials Talk adapted from Dean Follmann’s slides NIAID Biostat 578A Lecture 12

Welcome message from author
This document is posted to help you gain knowledge. Please leave a comment to let me know what you think about it! Share it to your friends and learn new things together.
Transcript
Augmented designs to assess immune responses in vaccine
efficacy trials
Talk adapted from Dean Follmann’s slidesNIAID
Biostat 578A Lecture 12

Vax004
• First Phase III trial of an HIV vaccine
• 5403 HIV- volunteers randomized
• Measured antibody response to vaccine two weeks after each vaccination in vaccine group
• Looked at rate of infection as a function of antibody response

Vax004: Relative Risk of Infection Within Vaccine Group
GROUP Weak Modest Good Best
Vaccine 1.00 .43* .34* .29*
* p<.05
IMMUNE RESPONSE QUARTILE
Result: Antibody level is a Correlate of Risk (COR)

Vax004: Relative Risk of Infection Both Groups
GROUP Weak Modest Good Best
Placebo ? ? ? ? 1.00
Vaccine 1.67* .98 .87 .74
* p<.05
IMMUNE RESPONSE QUARTILE
? is X(1), the unknown potential immune response if assigned
vaccine [more on this later]

What does this mean?
• Two possible explanations– Mere Association: The vaccine is useless, but those
individuals who could mount a strong immune response are better able to remain uninfected
– Causation: The vaccine tends to cause infections in those who have poor immune response, but may prevent infections in those with good immune responses

Suppose
• X = immune response induced by the HIV vaccine• Phase III study with infection rates
10% placebo, 8% vaccine group
• Correlation of X with infection rate in vaccinees same as seen in Vax004
• After celebration over, tinker with vaccine to improve the immune response X to the HIV vaccine– Could this tinkering be a waste of time?

Goal
• Replace the ?s with numbers. Want to know if immune response is merely associated with infection rate or is causative
• We’ll discuss two different and complementary approaches– Baseline Predictor (BP)– Closeout Placebo Vaccination (CPV)
• These can be used together or separately

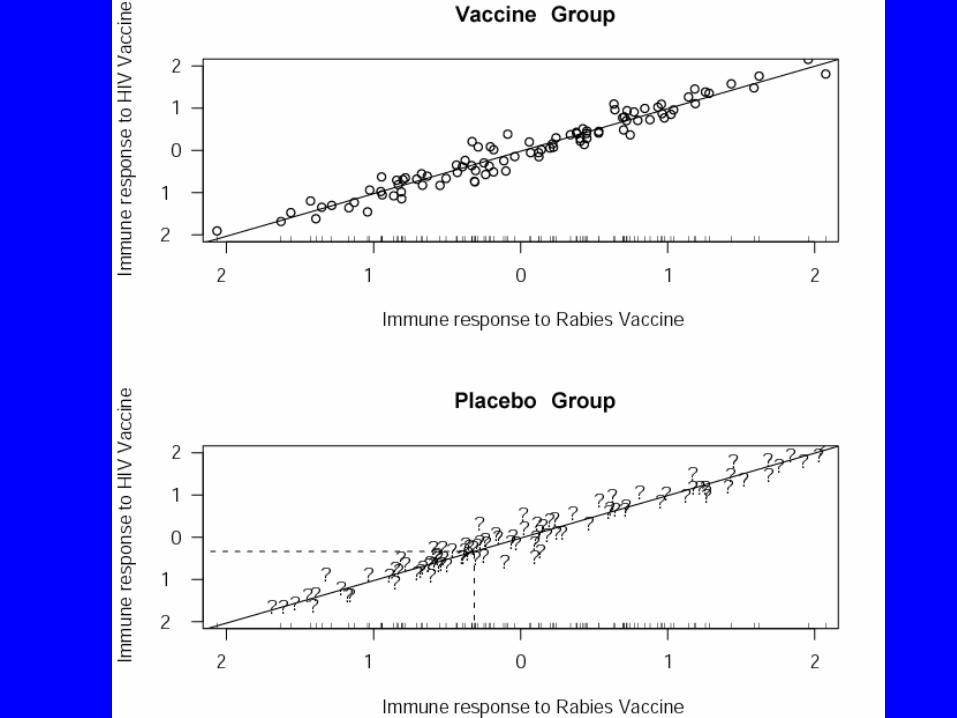
Baseline Predictor (BP)
• At baseline, measure something(s), W, that is correlated with X – E.g., inoculate everyone with rabies vaccine, and
shortly afterwards, W = immune response to rabies vaccine
– E.g., W = antibody levels to a non-HIV virus such as cytomegalovirus or Adenovirus
• Randomization ensures (X,W) same in both groups
• Use a placebo subjects’ W to impute X

Closeout Placebo Vaccination
• At the end of the trial, inoculate placebo uninfecteds with HIV vaccine
• Measure immune response XC on the same schedule as was measured for vaccinees
• Pretend XC is what we would have seen, had we inoculated at baseline, i.e., XC = X0

Group Outcome Weak Modest Good Best Total
Vaccine Uninfected 70 85 90 95 340
Infected 30 15 10 5 60
Total 100 100 100 100 400
Placebo Uninfected ? ? ? ? 340
Infected ? ? ? ? 60
Total ? ? ? ? 400
Immune Response Quartiles
Observable Data in Standard Trial Design

Group Outcome Weak Modest Good Best Total
Vaccine Uninfected 70 85 90 95 340
Infected 30 15 10 5 60
Total 100 100 100 100 400
Placebo Uninfected ? ? ? ? 340
Infected ? ? ? ? 60
Total ~100 ~100 ~100 ~100 400
Immune Response Quartiles
Standard Trial Design Exploiting Randomization
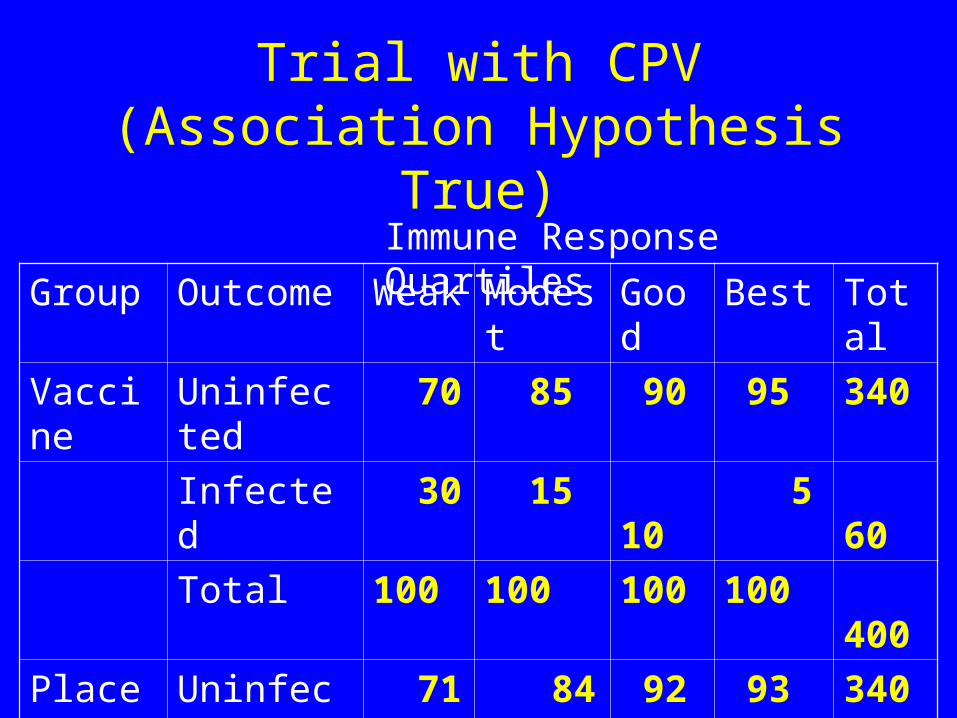
Group Outcome Weak Modest Good Best Total
Vaccine Uninfected 70 85 90 95 340
Infected 30 15 10 5 60
Total 100 100 100 100 400
Placebo Uninfected 71 84 92 93 340
Infected ~29 ~16 ~8 ~7 60
Total ~100 ~100 ~100 ~100 400
Immune Response Quartiles
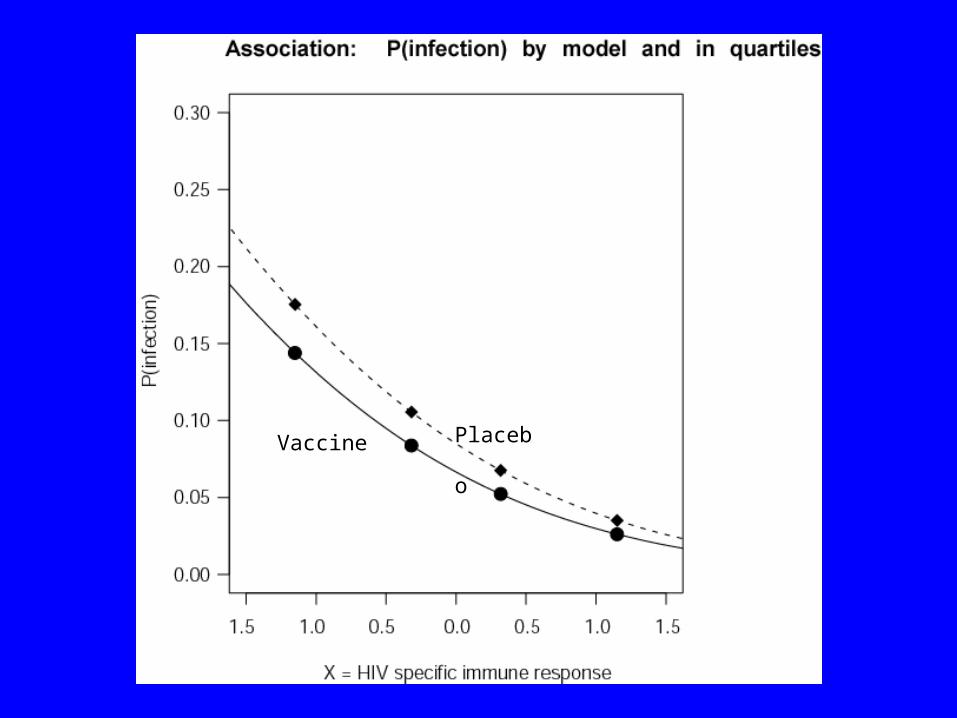
Trial with CPV (Association Hypothesis True)
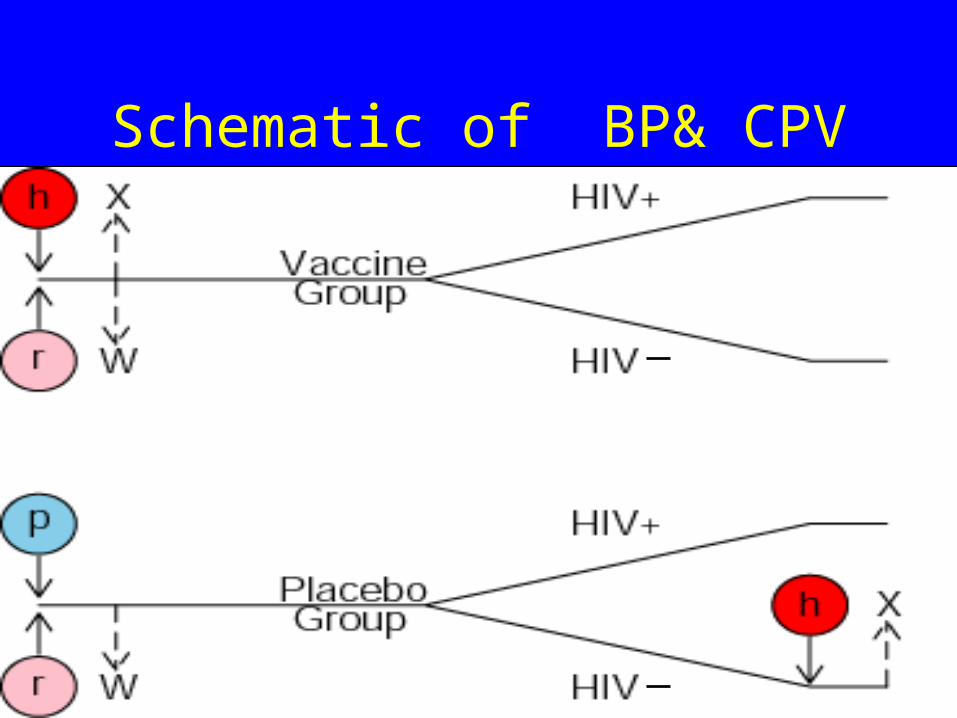
Schematic of BP& CPV
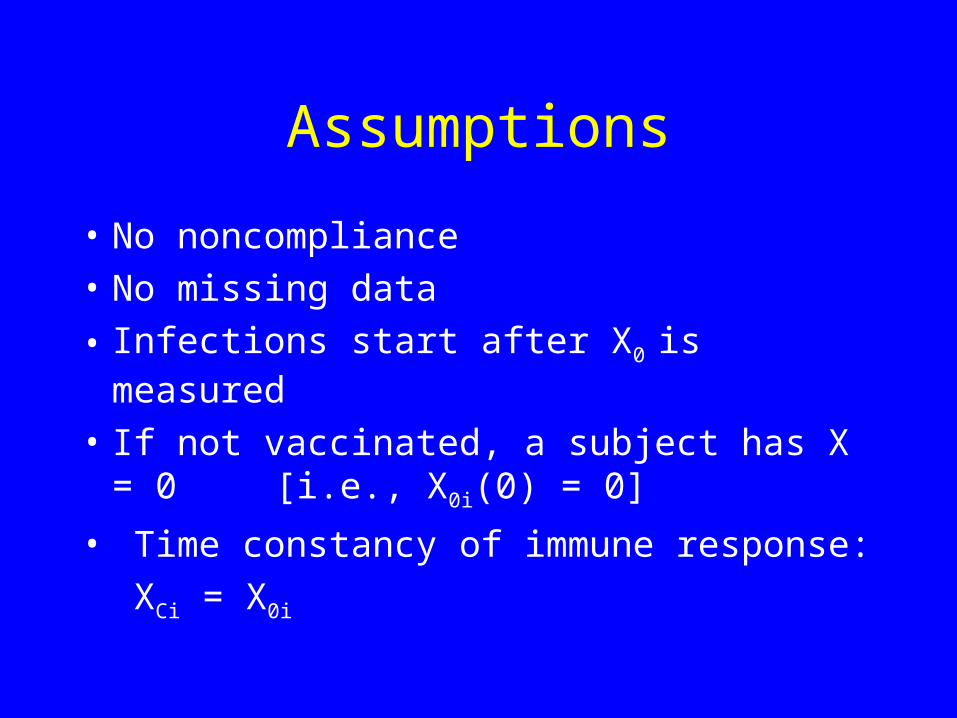
Assumptions
• No noncompliance
• No missing data
• Infections start after X0 is measured
• If not vaccinated, a subject has X = 0 [i.e., X0i(0) = 0]
• Time constancy of immune response:
XCi = X0i

What is X?
• X = X(1) is the potential HIV specific immune response to HIV vaccination
• Vaccine: What a subject did produce in response to the vaccine. (realized: X = X(1))
• Placebo: What a patient would produce in response to the vaccine. (unrealized: X(1) not observed- missing covariate)

Probit Regression
• Assume the probability of infection varies smoothly with X – Placebo Group:
– Vaccine Group:0 2( 1| ) ( )P Y X X
0 1 2 3( 1| ) ( ( ) )P Y X X

Causal Interpretation of Parameters
• A causal VE(x) parameter is some contrast in Pr{Y(1)=1|X(1)=x,X(0)=0} & Pr{Y(0)=1|X(1)=x,X(0)=0}
– These probabilities can be written as Pr(Y(z)=1|X(1)=x), because all X(0)’s are zero
• Set 1 + 3x = -1(Pr{Y(1)=1|X=x}) – -1(Pr{Y(0)=1|X=x})
3 = 0 reflects the association hypothesis
2 = 0 and 3 < 0 reflects the causation hypothesis
2 < 0 and 3 < 0 reflects a mixture of the two hypotheses

Maximum likelihood estimation (using both BP and CPV)
• We need X for P(Y=1 |X,Z)– Vaccine group, use X0
– Placebo Uninfecteds use XC
– Placebo Infecteds: Integrate P(Y=1 | X, 0) with respect to the distribution of X|W
– If (X,W) is assumed bivariate normal, then
– The parameters (w) and * are the mean and standard deviation of the X|W=w normal distribution

Likelihood (using both BP and CPV)
• Vaccine contribution
i in Vpv(x0i) y(i) (1 - pv(x0i) ) 1 - y(i)
• Placebo contribution
i in P(U) (1 - pp(xCi) ) 1 - y(i) i in P(I)p*(wi) y(i)
• wi at baseline, x0i shortly after randomization, xCi at closeout

Maximum Likelihood
• Likelihood maximized using R (standard maximizers)
• Bootstrap used to estimate standard errors of parameters for Wald Tests

Simulation
• N=1000 per group• Infection rates 10%/8% placebo/vaccine; 180 total
infections • Causation
– Risk gradient in Vaccine group, none in placebo
• Association – Similar risk gradient in both groups
• X,W correlation 0, .25, .50, .75, 1

Placebo
Vaccine
PlaceboVaccine

Results • Measure performance by simulation sample
variance of coefficient estimate, relative to the case where X is known for all subjects
• Association Scenario, correlation r =.5
Design
Variance of
2 estimate
Relative Variance
CPV .0575 15.5
BP .0199 5.4
CPV+BP .0145 3.9
X known .0037 1.0


Performance depends on r
• If r > .50, little need for CPV
• If r = .25, both CPV and BP are helpful
• If r = 0, BP useless
• If r = 1, CPV useless

Statistical Power BP alone
• r =.5 N=2000/5000 180/450 total infections
2 3 Scenario
.86/1.00 .03/.05 Association
.04/.05 .78/.99 Causation
.57/.95 .35/.65 Both
Is an improved vaccine good enough?
• Suppose Vaccine A had 20% VE• Small studies of Vaccine A* showed the immune
response is increased by • Will this be enough to launch a new Phase III
trial?• Using our statistical model, we can estimate the VE for A*, say VE*. Is it worth spending
$100 million? Go/No go decision based on VE*, not

Summary • BP and CPV can be added onto standard vaccine
efficacy trials to replace the “?”s in the placebo group
• Vaccine development focuses on cultivating the best immune response. But– Immune response may be partly causative– Different responses may be more/less causative
• Important to consider augmented designs to properly assess role of immune response
• Could incorporate BP into phase 1 or 2 trials to assess correlation

Summary • This work is an example of a method for assessing
validity of a principal surrogate endpoint [Frangakis and Rubin’s definition of a surrogate endpoint]
• Many open problems– More flexible modeling (semiparametric)/relax
assumptions/diagnostics– Extend from binary endpoint to failure time endpoint– Fitting into a case-cohort design framework– Handling multiple immune responses
• Repeated measures• Multiple immune responses- which combination best predicts
vaccine efficacy?
– Other trial designs (e.g., cluster randomized)
Related Documents