Neuroscience Research 47 (2003) 277–287 Auditory-visual speech perception examined by fMRI and PET Kaoru Sekiyama a,b,∗ , Iwao Kanno c , Shuichi Miura c , Yoichi Sugita a a Neuroscience Research Institute, National Institute of Advanced Industrial Science and Technology, Tsukuba, Japan b Division of Cognitive Psychology, Future University-Hakodate, Hakodate 041-8655, Japan c Department of Radiology and Nuclear Medicine, Akita Research Institute of Brain and Blood Vessels, Akita, Japan Received 17 March 2003; accepted 27 June 2003 Abstract Cross-modal binding in auditory-visual speech perception was investigated by using the McGurk effect, a phenomenon in which hearing is altered by incongruent visual mouth movements. We used functional magnetic resonance imaging (fMRI) and positron emission tomography (PET). In each experiment, the subjects were asked to identify spoken syllables (‘ba’, ‘da’, ‘ga’) presented auditorily, visually, or audiovisually (incongruent stimuli). For the auditory component of the stimuli, there were two conditions of intelligibility (High versus Low) as determined by the signal-to-noise (SN) ratio. The control task was visual talker identification of still faces. In the Low intelligibility condition in which the auditory component of the speech was harder to hear, the visual influence was much stronger. Brain imaging data showed bilateral activations specific to the unimodal auditory stimuli (in the temporal cortex) and visual stimuli (in the MT/V5). For the bimodal audiovisual stimuli, activation in the left temporal cortex extended more posteriorly toward the visual-specific area in the Low intelligibility condition. The direct comparison between the Low and High audiovisual conditions showed increased activations in the posterior part of the left superior temporal sulcus (STS), indicating its relationship with the stronger visual influence. It was discussed that this region is likely to be involved in cross-modal binding of auditory-visual speech. © 2003 Elsevier Ireland Ltd and the Japan Neuroscience Society. All rights reserved. Keywords: Cross-modal binding; Auditory-visual integration; Speech perception; The McGurk effect; fMRI; PET; Superior temporal sulcus 1. Introduction The visual cues from a speaker’s mouth movements play an important role in speech perception. They facilitate speech perception when auditory speech is degraded (e.g. Sumby and Pollack, 1954; Rosen et al., 1981). Furthermore, the visual cues alter what the perceiver hears when incongru- ent visual and auditory cues are presented, as demonstrated in the McGurk effect (McGurk and MacDonald, 1976). Recent psychophysical research has shown that in various perceptual domains, the brain tends to bind cross-modal in- puts not only when they are congruent, but also when they are incongruent or in an ambiguous relationship. For exam- ple, sound localization is displaced by incongruent visual source information (Bertelson et al., 2000), visual motion perception is altered by an additional sound (Sekuler et al., 1997), and visual frequency judgment is distorted by sounds ∗ Corresponding author. Tel.: +81-138-34-6327; fax: +81-138-34-6301. E-mail address: [email protected] (K. Sekiyama). (Shams et al., 2000). The McGurk effect, speech percep- tion altered by discrepant mouth movements (McGurk and MacDonald, 1976), can be also seen as an example of humans’ ubiquitous propensity to bind cross-modal inputs. In this study, we used the McGurk effect to investigate the cross-modal processing in auditory-visual speech percep- tion. The McGurk effect demonstrates an influence of dis- crepant visual input on auditory speech perception (McGurk and MacDonald, 1976; MacDonald and McGurk, 1978). When incongruent auditory and visual inputs are presented in synchrony, the perceiver often reports hearing a syllable distinct from the auditory one (e.g. audio /pa/ + video /na/ results in the perception of “ta”). In this case, the percept is an integrated product of information from the two sensory modalities. This illusion depends much on the complemen- tary nature of the two modalities (Binnie et al., 1974). That is, visual speech is advantageous to conveying the informa- tion about the place of articulation (e.g. at the lips or inside of the mouth) while auditory speech is robust for conveying the rest of the information (the manner of articulation and voicing). 0168-0102/$ – see front matter © 2003 Elsevier Ireland Ltd and the Japan Neuroscience Society. All rights reserved. doi:10.1016/S0168-0102(03)00214-1

Welcome message from author
This document is posted to help you gain knowledge. Please leave a comment to let me know what you think about it! Share it to your friends and learn new things together.
Transcript
Neuroscience Research 47 (2003) 277–287
Auditory-visual speech perception examined by fMRI and PET
Kaoru Sekiyamaa,b,∗, Iwao Kannoc, Shuichi Miurac, Yoichi Sugitaa
a Neuroscience Research Institute, National Institute of Advanced Industrial Science and Technology, Tsukuba, Japanb Division of Cognitive Psychology, Future University-Hakodate, Hakodate 041-8655, Japan
c Department of Radiology and Nuclear Medicine, Akita Research Institute of Brain and Blood Vessels, Akita, Japan
Received 17 March 2003; accepted 27 June 2003
Abstract
Cross-modal binding in auditory-visual speech perception was investigated by using the McGurk effect, a phenomenon in which hearing isaltered by incongruent visual mouth movements. We used functional magnetic resonance imaging (fMRI) and positron emission tomography(PET). In each experiment, the subjects were asked to identify spoken syllables (‘ba’, ‘da’, ‘ga’) presented auditorily, visually, or audiovisually(incongruent stimuli). For the auditory component of the stimuli, there were two conditions of intelligibility (High versus Low) as determinedby the signal-to-noise (SN) ratio. The control task was visual talker identification of still faces. In the Low intelligibility condition in whichthe auditory component of the speech was harder to hear, the visual influence was much stronger. Brain imaging data showed bilateralactivations specific to the unimodal auditory stimuli (in the temporal cortex) and visual stimuli (in the MT/V5). For the bimodal audiovisualstimuli, activation in the left temporal cortex extended more posteriorly toward the visual-specific area in the Low intelligibility condition.The direct comparison between the Low and High audiovisual conditions showed increased activations in the posterior part of the left superiortemporal sulcus (STS), indicating its relationship with the stronger visual influence. It was discussed that this region is likely to be involvedin cross-modal binding of auditory-visual speech.© 2003 Elsevier Ireland Ltd and the Japan Neuroscience Society. All rights reserved.
Keywords: Cross-modal binding; Auditory-visual integration; Speech perception; The McGurk effect; fMRI; PET; Superior temporal sulcus
1. Introduction
The visual cues from a speaker’s mouth movementsplay an important role in speech perception. They facilitatespeech perception when auditory speech is degraded (e.g.Sumby and Pollack, 1954; Rosen et al., 1981). Furthermore,the visual cues alter what the perceiver hears when incongru-ent visual and auditory cues are presented, as demonstratedin the McGurk effect (McGurk and MacDonald, 1976).
Recent psychophysical research has shown that in variousperceptual domains, the brain tends to bind cross-modal in-puts not only when they are congruent, but also when theyare incongruent or in an ambiguous relationship. For exam-ple, sound localization is displaced by incongruent visualsource information (Bertelson et al., 2000), visual motionperception is altered by an additional sound (Sekuler et al.,1997), and visual frequency judgment is distorted by sounds
∗ Corresponding author. Tel.:+81-138-34-6327;fax: +81-138-34-6301.
E-mail address: [email protected] (K. Sekiyama).
(Shams et al., 2000). The McGurk effect, speech percep-tion altered by discrepant mouth movements (McGurk andMacDonald, 1976), can be also seen as an example ofhumans’ ubiquitous propensity to bind cross-modal inputs.
In this study, we used the McGurk effect to investigate thecross-modal processing in auditory-visual speech percep-tion. The McGurk effect demonstrates an influence of dis-crepant visual input on auditory speech perception (McGurkand MacDonald, 1976; MacDonald and McGurk, 1978).When incongruent auditory and visual inputs are presentedin synchrony, the perceiver often reports hearing a syllabledistinct from the auditory one (e.g. audio /pa/+ video /na/results in the perception of “ta”). In this case, the percept isan integrated product of information from the two sensorymodalities. This illusion depends much on the complemen-tary nature of the two modalities (Binnie et al., 1974). Thatis, visual speech is advantageous to conveying the informa-tion about the place of articulation (e.g. at the lips or insideof the mouth) while auditory speech is robust for conveyingthe rest of the information (the manner of articulation andvoicing).
0168-0102/$ – see front matter © 2003 Elsevier Ireland Ltd and the Japan Neuroscience Society. All rights reserved.doi:10.1016/S0168-0102(03)00214-1

278 K. Sekiyama et al. / Neuroscience Research 47 (2003) 277–287
According to a magnetoencephalographic (MEG) studyby Sams et al. (1991), it seems that the McGurk effect isrelated to the ‘supratemporal’ cortex. In each trial, their sub-jects were presented either auditory-visual congruent “pa”or auditory /pa/ combined with discrepant visual [ka]. Ofthese congruent or discrepant (McGurk) stimuli, one waspresented more frequently (84% of stimuli) and the other in-frequently (16%). They found a ‘mismatch response’ to theinfrequent stimulus around the superior temporal and/or in-ferior frontal cortices. Unfortunately, the implication of theresult is not straightforward due to the mismatch paradigm.The fact that they recorded only from the left hemispheregives limited information. We used functional magnetic res-onance imaging (fMRI) and positron emission tomogra-phy (PET) to investigate brain activation in the McGurkeffect.
Our goal was to compare the brain activation for twoaudiovisual conditions in which the intelligibility of the audi-tory component of stimuli differs. Although the tendency tointegrate incompatible auditory and visual speech has beenwell documented in English speaking countries (for review,Summerfield, 1992; Campbell et al., 1998; Massaro, 1998),some Asian peoples such as the Japanese are less subjectto the McGurk effect (Sekiyama and Tohkura, 1993; Kuhlet al., 1994). Whereas native speakers of English show astrong McGurk effect for highly intelligible auditory speech,the Japanese do not use visual cues as much as do the na-tive speakers of English unless auditory speech has someambiguity due to added noise or foreign accent (Sekiyamaand Tohkura, 1991; Kuhl et al., 1994; Sekiyama, 1994). Weused this tendency of the Japanese to unravel the integrationprocess in speech perception. The same audiovisual stimuliwere presented in two different levels of auditory intelligibil-ity. Whereas the substantial McGurk effect was anticipatedin the Low auditory intelligibility condition, only a limitedMcGurk effect was in the High auditory intelligibility con-dition. The brain activation was compared between the twoconditions. We also tried to examine the relationship be-tween unimodal activation for auditory-alone or visual-alonestimuli and bimodal activation for audiovisual stimuli.
We used fMRI in Experiment 1, and PET in Experiment2. Since we intended to compare bimodal activation betweenthe High and Low auditory intelligibility conditions, the PETexperiment was to obtain a larger difference in auditory in-telligibility between the two conditions. As is well known,PET scans can be conducted with much less scanner noisethan fMRI scans. Therefore, a noiseless audiovisual stimu-lation can be realized only in the PET High intelligibilitycondition. It was anticipated that when the brain activationdata in the Low intelligibility audiovisual condition is con-trasted to those in the High intelligibility condition, the dif-ference would be larger in the PET experiment than in thefMRI experiment.
The results of the two experiments were basically in goodagreement although fMRI and PET target two different mea-sures, that is, regional cerebral blood flow (rCBF) in PET and
blood oxygen level dependent (BOLD, which is a by-productof cerebral blood flow) in fMRI.
2. Materials and methods
2.1. Subjects
The fMRI data were from eight native speakers ofJapanese. They were healthy right-handed volunteers (aged22–46 years; seven male and one female) with normal hear-ing, and normal or corrected to normal vision. The PETdata were collected from another comparable group of 10Japanese subjects (aged 20–46 years; all male). All subjectsgave informed written consent for participation.
2.2. Stimuli and tasks
Stimuli were created from “ba”, “da”, and “ga” uttered bythree female talkers (Fig. 1A). The utterances were video-taped (with the talker’s full face), digitized, and edited on acomputer (Sony PCV-S720) for audio-only (A), video-only(V), and audiovisual (AV) stimuli. Video digitizing was doneat 29.97 frames/s in 640× 480 dots, and audio digitizingwas at 32 kHz in 16 bit. Each stimulus was created as a 2 smovie of a monosyllabic utterance. The duration of acousticspeech signals in each movie was approximately 330 ms inaverage. The movie files were edited with frame unit accu-racy (33.3 ms), but the sound portion was additionally editedwith 1 ms accuracy. Each natural utterance was first cut suchthat the onset of its acoustic energy was at some point in the19th frame of the movie. Then the position of the acoustic
Fig. 1. Stimulus samples. (A) A video frame of consonant constrictionfor /ba/, /da/, and /ga/, shown for one of the three talkers. These videoframes were one or two frames earlier than the acoustic onset of voicing.(B) A part of video sequence for /ba/. The acoustic onset of voicing wasat 600 ms in all sound files. In off-line editing, the voicing onset wassynchronized with the beginning of the 19th video frame.
K. Sekiyama et al. / Neuroscience Research 47 (2003) 277–287 279
signals was adjusted so that the onset of voicing was at thebeginning of the 19th frame (i.e. 600 ms from the onset ofthe movie file).
The A stimuli (/ba/, /da/, and /ga/ of the three talkers)were used to present only the auditory component of speech,but were combined with the talker’s still face with mouthneutrally closed (thus no linguistic information in the face).The V stimuli ([ba], [da], and [ga] of the three talkers) con-sisted of only the video component of speech, providingprojections of a silent talking face. The AV stimuli werewithin-talker combinations of the synchronized auditory andvisual speech. All AV stimuli were the McGurk-type stimuliconsisting of discrepant auditory and visual syllables (au-dio /ba/ was combined with video [da] or [ga], and audio/da/ and /ga/ were combined with video [ba]). To make thedubbing, the onset of the voicing was used as the synchro-nization reference (Fig. 1B).
For the A, V, and AV stimuli, the subject’s task was sylla-ble identification. The subjects were instructed to watch andlisten to the talkers speaking and were asked to report whatthey perceived by choosing a syllable from three alternatives(‘ba’, ‘da’, and ‘ga’). Although the audiovisual stimuli in-cluded so-called “combination presentations” (auditory /da/or /ga/ combined with visual [ba] which often produce “com-bination responses”, for example, “bda” or “bga”), we didnot allow such responses based on our previous results thatJapanese perceivers rarely reported combination responsesin an open-choice task (Sekiyama and Tohkura, 1991). Forthese stimuli, “ba” responses were anticipated for visuallyinfluenced responses. The subjects were not informed of theincompatibility of the AV stimuli at all. They were to sig-nal each of the three alternatives by using fingers. Therewas also a control (C) condition for which the static neutralfaces (visual component of the A stimuli) were presentedsilently for a visual talker identification task. The subjectswere asked to signal which of the three talkers they saw byusing fingers. We assumed that the C condition yields pro-cessing of talker information only, whereas the A, V, andAV conditions involve linguistic processing as well as vi-sual talker processing. Note that the C condition was equal-ized with the A, V, and AV conditions in the processes ofresponse selection and response execution.
2.3. fMRI experiment (Experiment 1)
2.3.1. ProcedureThe stimuli were presented from the computer. The visual
stimuli were projected onto a rear screen that the subjectviewed through a mirror attached to the head coil. The audi-tory stimuli were presented on a loud speaker (Bose 121V)located outside of a shielded room in which the subject wasbeing tested. The output of the loud speaker was conveyedthrough a pipe (10 cm in diameter, 2 m long) from the outsideloud speaker to the subject (in the middle of both ankles).We used the loud speaker rather than a headset because thesound quality was better with the loud speaker than with the
air-tube headset provided in the magnet. The sound intensitywas adjusted by using an audio amplifier (Onkyo A-924(N))placed between the computer and the loud speaker.
The subject’s head was scanned while a sequence(A-V-C-AV) of the stimuli was presented in two levelsof sound intensity. The intensity levels of speech sounds(altered by using the audio amplifier) were approximately112 dB sound pressure level (SPL) for the High intelligi-bility runs and 102 dB SPL for the Low intelligibility runs.The timing of the speech was set such that the speechwas always presented during the MRI scan noise (about105 dB SPL). Thus, the signal-to-noise ratios were+7 dBand−3 dB. Although the sound intensities were rather highcompared with usual speech perception experiments, theywere not uncomfortable to the subjects whose auditorysystem soon became adapted to the MRI scan noise. Alsonote that the MRI scanner we used was relatively quietcompared with MRI scanners of higher magnetic fields.
2.3.2. Data acquisitionEcho planar MRI data were obtained with a 1-T Siemens
Magnetom system with a standard circular-polarized (CP)head coil. T2∗-weighted functional images were acquiredfor 10 axial noncontiguous 6 mm thick slices with 3 mminterslice gap. The following parameter settings were used:Repetition time (TR) was 3.95 s, echo time (TE) 66 ms, fieldof view (FOV) 200 mm, and spatial resolution 3.13 mm×3.13 mm (matrix= 64 × 64). These axial slices, coveringapproximately two thirds of the cortex in height, includedmost of the temporal, occipital, and parietal cortices. Thestimuli were presented in a blocked design by alternatingfour stimulus conditions in an A-V-C-AV pattern. Duringeach condition epoch, eight stimuli were presented with astimulus onset asynchrony (SOA) of 3.95 s. The functionalruns consisted of 102 volumes (6 dummy+ 96). Thus, withthe 3.95 s TR, one functional run took about 7 min. Eachsubject participated in two runs for each of the High and Lowintelligibility conditions. The order of the two conditionswas counterbalanced among the subjects.
2.4. PET experiment (Experiment 2)
2.4.1. ProcedureThe stimulus set and the task were identical to those in the
fMRI experiment. The subjects were given the AV, A, V, andC blocks. The stimuli were presented from a computer (SonyPCG-Z505). The visual component of the stimuli was pre-sented on a CRT display (Sony Multiscan 17GS), which wasattached to a display arm suspended from the ceiling. Theviewing distance was approximately 50 cm. The auditorycomponent was presented through earphones (via an audiomixer, Pioneer DJM-300) due to the restriction for the headstabilization. In each block, 21 stimuli were presented in ran-dom order with a fixed SOA of 3.1 s (for 65 s stimulation).
For each of the AV and A conditions, there were twoconditions depending on the SN ratio of the auditory
280 K. Sekiyama et al. / Neuroscience Research 47 (2003) 277–287
component of the stimuli (High and Low). Thus, there weresix blocks in total (AV, nAV, A, nA, V, and C, with the pre-fix ‘n’ indicating ‘noise-dominant’ due to a lower SN ratio).The intensity level of speech sounds was approximately75 dB SPL. To vary the SN ratio, we added white noisewhere intensity was either 60 or 80 dB. Thus, the SN ratioswere+15 dB (in the AV and A conditions) and−5 dB (inthe nAV and nA conditions). The SN ratio of+15 dB wasregarded as ‘noise-free’ because previous performance datain our laboratory showed that the effect of the added noiseon auditory-visual interaction is virtually null if the SNratio is higher than+12 dB. This weaker level of noise wasto mask unexpected variation of the room noise. The orderof the six blocks was randomized for each subject.
2.4.2. Data acquisitionPET scans were performed using a 3 module-ring PET
scanner (Shimadsu Headtome V), operated in its 3D acqui-sition mode. It provides 47 image planes with an axial fieldof view of 150 mm (Iida et al., 1998). The effective in-planeresolution was 8 mm full width at half maximum (FWHM)after reconstruction with a Butterworth filter, and the effec-tive axial resolution was 6 mm after combining adjacent im-ages. The transmission scan for attenuation correction wasdone using a 68Ge-68Ga rod source prior to succeedingemission scans. The PET data were acquired with a bolusinjection of H2
15O (Raichle et al., 1983; Kanno et al., 1987)but without the arterial blood sampling. Corresponding tothe six experimental conditions, six PET scans were repeatedwith a 10 min H2
15O injection interval. The H215O bolusinjection (10 mCi per scan) was commenced, and the dataacquisition was started at 15 s and continued for 90 s. Weapplied the so-called “stop paradigm” (Cherry et al., 1993).The stimulation was started at the same time as the H2
15Oinjection and continued for 65 s, followed by the rest condi-tion. The reconstructed images were obtained in 128× 128format with each 2 mm× 2 mm pixel.
2.5. Analyses of BOLD and rCBF data
All activation data were processed using the SPM99 soft-ware package (Wellcome Department of Cognitive Neurol-ogy,Friston et al., 1995). Standard linear image realignment,linear normalization to the stereotactic anatomical space, andspatial smoothing (3D Gaussian kernel, 6 mm FWHM forthe fMRI data, and 16 mm FWHM for the PET data) weresuccessively performed for each subject. All subjects werepooled together and group comparisons were performed us-ing a fixed-effect general linear model. The A, V, and AVdata were compared with those of the control task. A signif-icant increase was tested for witht statistics and displayedas statistical parametric maps. The threshold for significancewas set at voxel-levelP < 0.05 (corrected for multiplecomparisons) for the fMRI data. For the PET data, how-ever, this threshold was too strict to see differences betweenthe High and Low intelligibility AV conditions. Because we
intended to examine differences in brain activation betweenthe two conditions where behavioral data usually show asharp difference, we displayed the results at a threshold ofP < 0.005 (uncorrected) and then took clusters with theirpeak-thresholdsP < 0.002 (uncorrected) to be significant.
3. Results
3.1. Behavioral performance
As anticipated, the subjects showed a much strongerMcGurk effect for lower SN ratios than they did for higherSN ratios. InFig. 2, percent of auditorily correct responses,averaged across stimuli, is shown for each condition. Thesize of the McGurk effect (a visual effect) is roughly givenas a decrease of auditory responses due to the additionalincongruent visual cues (A minus AV). If the size of thevisual effect were constant across the SN ratios, the inter-action between ‘SN (High versus Low)’ and ‘modality (AVversus A)’ would have been null. In fact, the interactionwas statistically significant (F(1, 7) = 9.53, P < 0.05 forfMRI; F(1, 9) = 11.65, P < 0.01 for PET; two factorANOVAs), indicating that the visual influence was strongerwhen speech was harder to hear.
3.2. Brain activation
Each condition (A, V, and AV) was contrasted to the Ccondition (visual talker identification of still faces). Thebimodal audiovisual condition showed noticeable differ-ences between the High and Low intelligibility conditions,whereas the unimodal auditory condition showed essentiallyidentical activations for the two intelligibility conditions(Fig. 3 for fMRI, Fig. 4 for PET).
Fig. 2. Behavioral performance in each experiment. Percent auditorilycorrect responses for the audio-only (A; lighter bars) and incompatibleaudiovisual (AV; darker bars) stimuli is shown for the Low and HighSN ratios (−3 dB and+7 dB for the fMRI, −5 dB and+15 dB for thePET) of the auditory component of the stimuli. Error bars show standarderrors. SN: signal-to-noise.
K. Sekiyama et al. / Neuroscience Research 47 (2003) 277–287 281
Fig. 3. Suprathreshold voxels in the fMRI experiment (P < 0.05, corrected). (a–f) 3D-rendered surface images for the A, nA, V, nV, AV, and nAVconditions contrasted to the C condition. (g, h) Axial projections for the nA, nV, and nAV conditions. (j, k) Axial images for the AV and nAV conditionssectioned at their local maxima in the temporal cortex. (l, m) Results of ‘nAV-AV’ contrast inclusively masked by ‘nAV-C’, indicating significant increasein the nAV condition relative to the AV condition (P < 0.001, uncorrected) among voxels that were significantly activated in the nAV condition relative tothe C condition (P < 0.05, uncorrected). The peak coordinates of the cluster in the left temporal cortex was (−56, −49, 9). A: audio-only, V: video-only,AV: audiovisual, nAV: noise-dominant audiovisual, C: control.
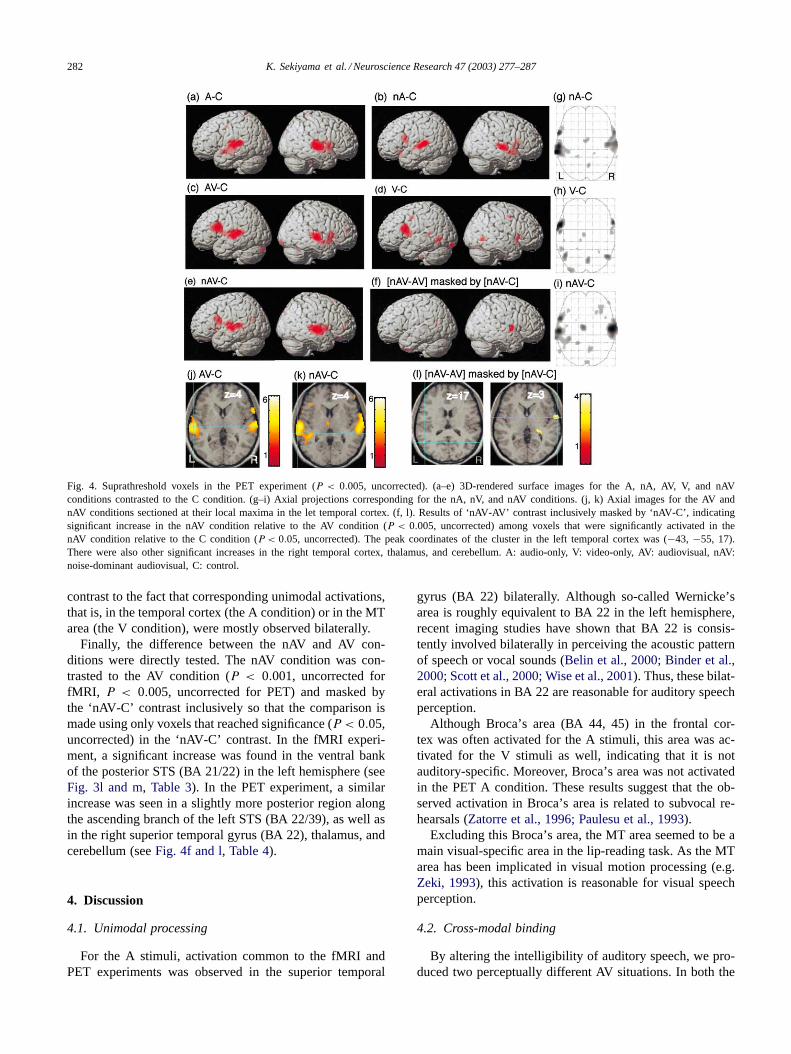
In the audio-only conditions (A-C, nA-C), activation com-mon to the fMRI and PET experiments was observed inthe temporal cortex bilaterally (Fig. 3a, b and g, Fig. 4a,b and g). The activation was along the superior temporalsulcus (STS), including Brodmann’s area (BA) 22, overlap-ping the so-called ‘Wernicke’s area’. In the PET experiment,the cluster in the temporal cortex contained the primaryauditory cortex (Table 2). In the fMRI nA condition, the an-gular gyrus (BA 39) was additionally activated (Table 1).Broca’s area (BA 44, 45) in the frontal cortex was acti-vated in most audio-only conditions, but not in the PET Acondition.
The V and C stimuli differed in the presence or absence ofvisual speech information given as motion pictures. For the‘V-C’ contrast, activation common to the visual-only condi-tions was seen at the MT/V5 area (BA 37/19), Broca’s area(BA 44, 45), and the premotor area (BA 6), mostly bilateral(Figs. 3c, d, h and 4d, h). The cerebellum was often acti-vated (fMRI-nV, PET-V;Tables 1 and 2). Additional corti-cal activation was seen in the intraparietal sulcus (fMRI-nV,Fig. 3d), middle temporal gyrus (fMRI-nV,Fig. 3d), visualprestriate area (PET-V,Fig. 4d), and superior temporal gyrus(PET-V).
In the audiovisual conditions, the areas activated differeddepending on the speech intelligibility. Compare the AV(AV-C) with nAV (nAV-C) activations (Figs. 3e versus f and4c versus e). In the AV condition, the activated areas werealmost the same as those for the audio-only stimuli (Aor nA) in both the fMRI and PET experiments (Figs. 3eand 4c).
On the other hand, the activation for the nAV stimuliincluded a part of the visual-specific area observed in theunimodal V condition (Figs. 3f and 4e). In the nAV condi-tion, the activation in the left temporal cortex extended moreposteriorly toward the visual (MT) area (e.g.Figs. 3j versus kand 4j versus k). This is consistent with the behavioral dataof the stronger visual influence in the nAV condition thanin the AV condition. The large cluster in the left temporalcortex in the nAV condition included the superior temporalgyrus (BA 22, along with the STS) and the lateral occipi-totemporal gyrus (BA 37) in both the fMRI and PET exper-iments. Close to this activation, the left angular gyrus wasalso activated in the PET experiment along the ascendingbranch of the STS (BA 22/39,Fig. 4e). It was noticeable thatthe extended activation from the temporal to more posteriorareas was confined to the left hemisphere. This is in striking
282 K. Sekiyama et al. / Neuroscience Research 47 (2003) 277–287
Fig. 4. Suprathreshold voxels in the PET experiment (P < 0.005, uncorrected). (a–e) 3D-rendered surface images for the A, nA, AV, V, and nAVconditions contrasted to the C condition. (g–i) Axial projections corresponding for the nA, nV, and nAV conditions. (j, k) Axial images for the AV andnAV conditions sectioned at their local maxima in the let temporal cortex. (f, l). Results of ‘nAV-AV’ contrast inclusively masked by ‘nAV-C’, indicatingsignificant increase in the nAV condition relative to the AV condition (P < 0.005, uncorrected) among voxels that were significantly activated in thenAV condition relative to the C condition (P < 0.05, uncorrected). The peak coordinates of the cluster in the left temporal cortex was (−43, −55, 17).There were also other significant increases in the right temporal cortex, thalamus, and cerebellum. A: audio-only, V: video-only, AV: audiovisual, nAV:noise-dominant audiovisual, C: control.
contrast to the fact that corresponding unimodal activations,that is, in the temporal cortex (the A condition) or in the MTarea (the V condition), were mostly observed bilaterally.
Finally, the difference between the nAV and AV con-ditions were directly tested. The nAV condition was con-trasted to the AV condition (P < 0.001, uncorrected forfMRI, P < 0.005, uncorrected for PET) and masked bythe ‘nAV-C’ contrast inclusively so that the comparison ismade using only voxels that reached significance (P < 0.05,uncorrected) in the ‘nAV-C’ contrast. In the fMRI experi-ment, a significant increase was found in the ventral bankof the posterior STS (BA 21/22) in the left hemisphere (seeFig. 3l and m, Table 3). In the PET experiment, a similarincrease was seen in a slightly more posterior region alongthe ascending branch of the left STS (BA 22/39), as well asin the right superior temporal gyrus (BA 22), thalamus, andcerebellum (seeFig. 4f and l, Table 4).
4. Discussion
4.1. Unimodal processing
For the A stimuli, activation common to the fMRI andPET experiments was observed in the superior temporal
gyrus (BA 22) bilaterally. Although so-called Wernicke’sarea is roughly equivalent to BA 22 in the left hemisphere,recent imaging studies have shown that BA 22 is consis-tently involved bilaterally in perceiving the acoustic patternof speech or vocal sounds (Belin et al., 2000; Binder et al.,2000; Scott et al., 2000; Wise et al., 2001). Thus, these bilat-eral activations in BA 22 are reasonable for auditory speechperception.
Although Broca’s area (BA 44, 45) in the frontal cor-tex was often activated for the A stimuli, this area was ac-tivated for the V stimuli as well, indicating that it is notauditory-specific. Moreover, Broca’s area was not activatedin the PET A condition. These results suggest that the ob-served activation in Broca’s area is related to subvocal re-hearsals (Zatorre et al., 1996; Paulesu et al., 1993).
Excluding this Broca’s area, the MT area seemed to be amain visual-specific area in the lip-reading task. As the MTarea has been implicated in visual motion processing (e.g.Zeki, 1993), this activation is reasonable for visual speechperception.
4.2. Cross-modal binding
By altering the intelligibility of auditory speech, we pro-duced two perceptually different AV situations. In both the
K. Sekiyama et al. / Neuroscience Research 47 (2003) 277–287 283
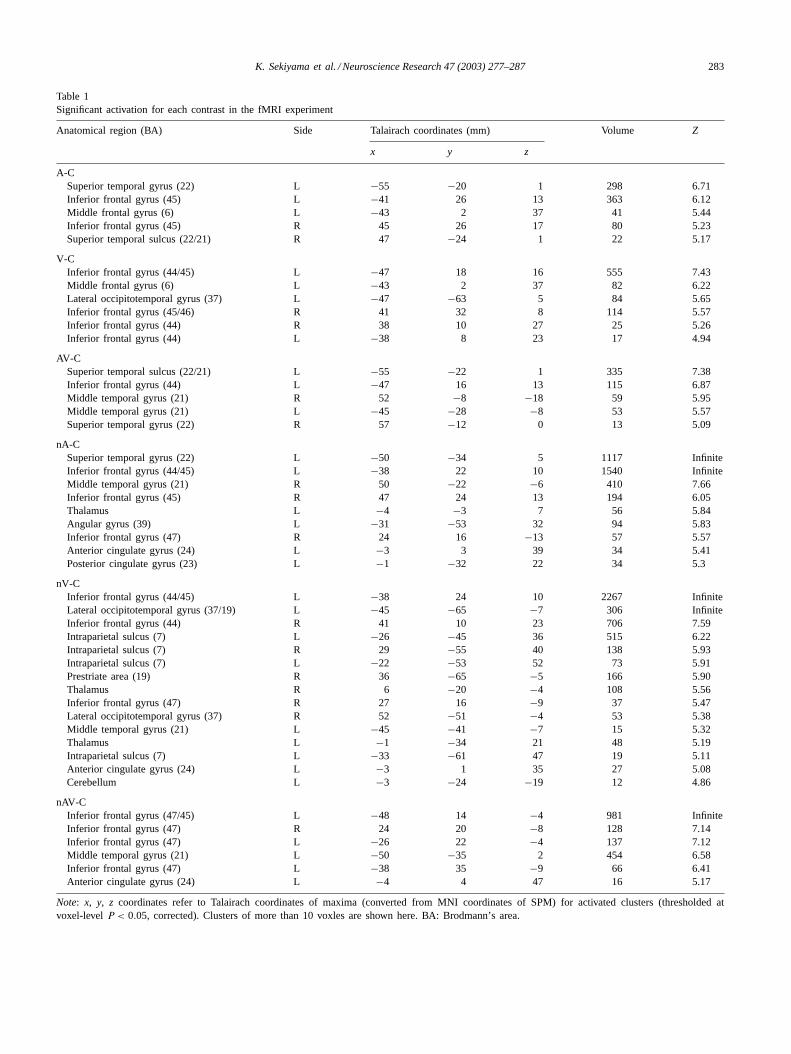
Table 1Significant activation for each contrast in the fMRI experiment
Anatomical region (BA) Side Talairach coordinates (mm) Volume Z
x y z
A-CSuperior temporal gyrus (22) L −55 −20 1 298 6.71Inferior frontal gyrus (45) L −41 26 13 363 6.12Middle frontal gyrus (6) L −43 2 37 41 5.44Inferior frontal gyrus (45) R 45 26 17 80 5.23Superior temporal sulcus (22/21) R 47 −24 1 22 5.17
V-CInferior frontal gyrus (44/45) L −47 18 16 555 7.43Middle frontal gyrus (6) L −43 2 37 82 6.22Lateral occipitotemporal gyrus (37) L −47 −63 5 84 5.65Inferior frontal gyrus (45/46) R 41 32 8 114 5.57Inferior frontal gyrus (44) R 38 10 27 25 5.26Inferior frontal gyrus (44) L −38 8 23 17 4.94
AV-CSuperior temporal sulcus (22/21) L −55 −22 1 335 7.38Inferior frontal gyrus (44) L −47 16 13 115 6.87Middle temporal gyrus (21) R 52 −8 −18 59 5.95Middle temporal gyrus (21) L −45 −28 −8 53 5.57Superior temporal gyrus (22) R 57 −12 0 13 5.09
nA-CSuperior temporal gyrus (22) L −50 −34 5 1117 InfiniteInferior frontal gyrus (44/45) L −38 22 10 1540 InfiniteMiddle temporal gyrus (21) R 50 −22 −6 410 7.66Inferior frontal gyrus (45) R 47 24 13 194 6.05Thalamus L −4 −3 7 56 5.84Angular gyrus (39) L −31 −53 32 94 5.83Inferior frontal gyrus (47) R 24 16 −13 57 5.57Anterior cingulate gyrus (24) L −3 3 39 34 5.41Posterior cingulate gyrus (23) L −1 −32 22 34 5.3
nV-CInferior frontal gyrus (44/45) L −38 24 10 2267 InfiniteLateral occipitotemporal gyrus (37/19) L −45 −65 −7 306 InfiniteInferior frontal gyrus (44) R 41 10 23 706 7.59Intraparietal sulcus (7) L −26 −45 36 515 6.22Intraparietal sulcus (7) R 29 −55 40 138 5.93Intraparietal sulcus (7) L −22 −53 52 73 5.91Prestriate area (19) R 36 −65 −5 166 5.90Thalamus R 6 −20 −4 108 5.56Inferior frontal gyrus (47) R 27 16 −9 37 5.47Lateral occipitotemporal gyrus (37) R 52 −51 −4 53 5.38Middle temporal gyrus (21) L −45 −41 −7 15 5.32Thalamus L −1 −34 21 48 5.19Intraparietal sulcus (7) L −33 −61 47 19 5.11Anterior cingulate gyrus (24) L −3 1 35 27 5.08Cerebellum L −3 −24 −19 12 4.86
nAV-CInferior frontal gyrus (47/45) L −48 14 −4 981 InfiniteInferior frontal gyrus (47) R 24 20 −8 128 7.14Inferior frontal gyrus (47) L −26 22 −4 137 7.12Middle temporal gyrus (21) L −50 −35 2 454 6.58Inferior frontal gyrus (47) L −38 35 −9 66 6.41Anterior cingulate gyrus (24) L −4 4 47 16 5.17
Note: x, y, z coordinates refer to Talairach coordinates of maxima (converted from MNI coordinates of SPM) for activated clusters (thresholded atvoxel-levelP < 0.05, corrected). Clusters of more than 10 voxles are shown here. BA: Brodmann’s area.
284 K. Sekiyama et al. / Neuroscience Research 47 (2003) 277–287
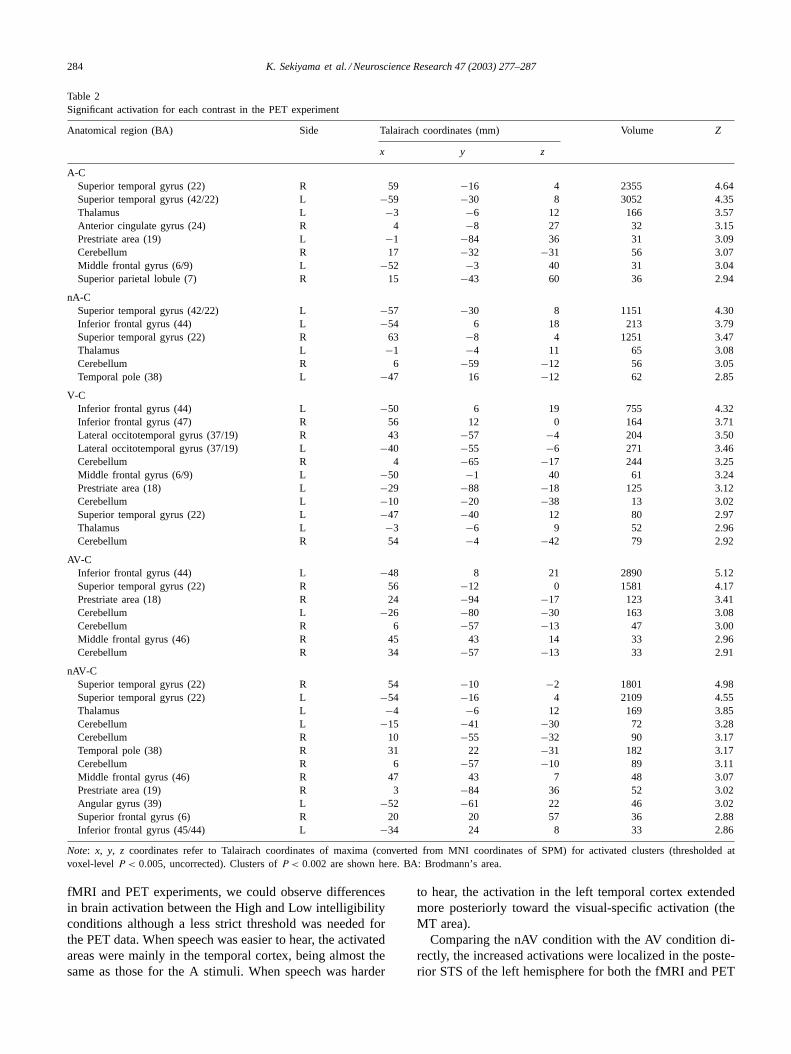
Table 2Significant activation for each contrast in the PET experiment
Anatomical region (BA) Side Talairach coordinates (mm) Volume Z
x y z
A-CSuperior temporal gyrus (22) R 59 −16 4 2355 4.64Superior temporal gyrus (42/22) L −59 −30 8 3052 4.35Thalamus L −3 −6 12 166 3.57Anterior cingulate gyrus (24) R 4 −8 27 32 3.15Prestriate area (19) L −1 −84 36 31 3.09Cerebellum R 17 −32 −31 56 3.07Middle frontal gyrus (6/9) L −52 −3 40 31 3.04Superior parietal lobule (7) R 15 −43 60 36 2.94
nA-CSuperior temporal gyrus (42/22) L −57 −30 8 1151 4.30Inferior frontal gyrus (44) L −54 6 18 213 3.79Superior temporal gyrus (22) R 63 −8 4 1251 3.47Thalamus L −1 −4 11 65 3.08Cerebellum R 6 −59 −12 56 3.05Temporal pole (38) L −47 16 −12 62 2.85
V-CInferior frontal gyrus (44) L −50 6 19 755 4.32Inferior frontal gyrus (47) R 56 12 0 164 3.71Lateral occitotemporal gyrus (37/19) R 43 −57 −4 204 3.50Lateral occitotemporal gyrus (37/19) L −40 −55 −6 271 3.46Cerebellum R 4 −65 −17 244 3.25Middle frontal gyrus (6/9) L −50 −1 40 61 3.24Prestriate area (18) L −29 −88 −18 125 3.12Cerebellum L −10 −20 −38 13 3.02Superior temporal gyrus (22) L −47 −40 12 80 2.97Thalamus L −3 −6 9 52 2.96Cerebellum R 54 −4 −42 79 2.92
AV-CInferior frontal gyrus (44) L −48 8 21 2890 5.12Superior temporal gyrus (22) R 56 −12 0 1581 4.17Prestriate area (18) R 24 −94 −17 123 3.41Cerebellum L −26 −80 −30 163 3.08Cerebellum R 6 −57 −13 47 3.00Middle frontal gyrus (46) R 45 43 14 33 2.96Cerebellum R 34 −57 −13 33 2.91
nAV-CSuperior temporal gyrus (22) R 54 −10 −2 1801 4.98Superior temporal gyrus (22) L −54 −16 4 2109 4.55Thalamus L −4 −6 12 169 3.85Cerebellum L −15 −41 −30 72 3.28Cerebellum R 10 −55 −32 90 3.17Temporal pole (38) R 31 22 −31 182 3.17Cerebellum R 6 −57 −10 89 3.11Middle frontal gyrus (46) R 47 43 7 48 3.07Prestriate area (19) R 3 −84 36 52 3.02Angular gyrus (39) L −52 −61 22 46 3.02Superior frontal gyrus (6) R 20 20 57 36 2.88Inferior frontal gyrus (45/44) L −34 24 8 33 2.86
Note: x, y, z coordinates refer to Talairach coordinates of maxima (converted from MNI coordinates of SPM) for activated clusters (thresholded atvoxel-levelP < 0.005, uncorrected). Clusters ofP < 0.002 are shown here. BA: Brodmann’s area.
fMRI and PET experiments, we could observe differencesin brain activation between the High and Low intelligibilityconditions although a less strict threshold was needed forthe PET data. When speech was easier to hear, the activatedareas were mainly in the temporal cortex, being almost thesame as those for the A stimuli. When speech was harder
to hear, the activation in the left temporal cortex extendedmore posteriorly toward the visual-specific activation (theMT area).
Comparing the nAV condition with the AV condition di-rectly, the increased activations were localized in the poste-rior STS of the left hemisphere for both the fMRI and PET
K. Sekiyama et al. / Neuroscience Research 47 (2003) 277–287 285
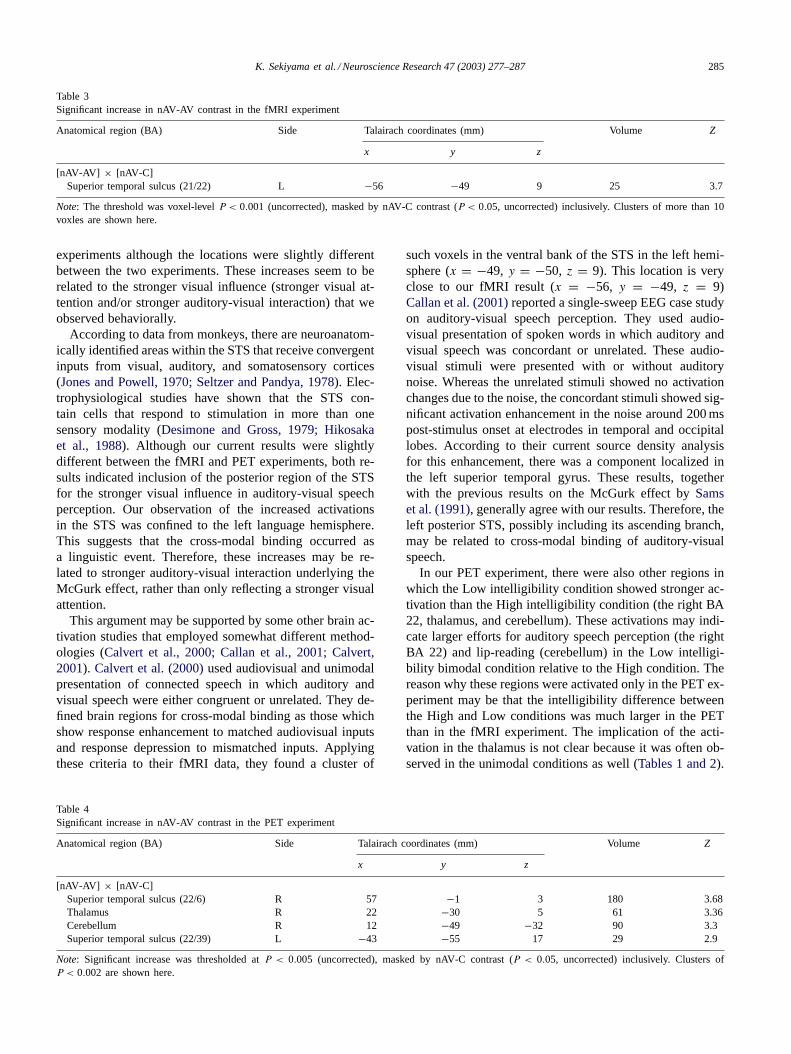
Table 3Significant increase in nAV-AV contrast in the fMRI experiment
Anatomical region (BA) Side Talairach coordinates (mm) Volume Z
x y z
[nAV-AV] × [nAV-C]Superior temporal sulcus (21/22) L −56 −49 9 25 3.7
Note: The threshold was voxel-levelP < 0.001 (uncorrected), masked by nAV-C contrast (P < 0.05, uncorrected) inclusively. Clusters of more than 10voxles are shown here.
experiments although the locations were slightly differentbetween the two experiments. These increases seem to berelated to the stronger visual influence (stronger visual at-tention and/or stronger auditory-visual interaction) that weobserved behaviorally.
According to data from monkeys, there are neuroanatom-ically identified areas within the STS that receive convergentinputs from visual, auditory, and somatosensory cortices(Jones and Powell, 1970; Seltzer and Pandya, 1978). Elec-trophysiological studies have shown that the STS con-tain cells that respond to stimulation in more than onesensory modality (Desimone and Gross, 1979; Hikosakaet al., 1988). Although our current results were slightlydifferent between the fMRI and PET experiments, both re-sults indicated inclusion of the posterior region of the STSfor the stronger visual influence in auditory-visual speechperception. Our observation of the increased activationsin the STS was confined to the left language hemisphere.This suggests that the cross-modal binding occurred asa linguistic event. Therefore, these increases may be re-lated to stronger auditory-visual interaction underlying theMcGurk effect, rather than only reflecting a stronger visualattention.
This argument may be supported by some other brain ac-tivation studies that employed somewhat different method-ologies (Calvert et al., 2000; Callan et al., 2001; Calvert,2001). Calvert et al. (2000)used audiovisual and unimodalpresentation of connected speech in which auditory andvisual speech were either congruent or unrelated. They de-fined brain regions for cross-modal binding as those whichshow response enhancement to matched audiovisual inputsand response depression to mismatched inputs. Applyingthese criteria to their fMRI data, they found a cluster of
Table 4Significant increase in nAV-AV contrast in the PET experiment
Anatomical region (BA) Side Talairach coordinates (mm) Volume Z
x y z
[nAV-AV] × [nAV-C]Superior temporal sulcus (22/6) R 57 −1 3 180 3.68Thalamus R 22 −30 5 61 3.36Cerebellum R 12 −49 −32 90 3.3Superior temporal sulcus (22/39) L −43 −55 17 29 2.9
Note: Significant increase was thresholded atP < 0.005 (uncorrected), masked by nAV-C contrast (P < 0.05, uncorrected) inclusively. Clusters ofP < 0.002 are shown here.
such voxels in the ventral bank of the STS in the left hemi-sphere (x = −49, y = −50, z = 9). This location is veryclose to our fMRI result (x = −56, y = −49, z = 9)Callan et al. (2001)reported a single-sweep EEG case studyon auditory-visual speech perception. They used audio-visual presentation of spoken words in which auditory andvisual speech was concordant or unrelated. These audio-visual stimuli were presented with or without auditorynoise. Whereas the unrelated stimuli showed no activationchanges due to the noise, the concordant stimuli showed sig-nificant activation enhancement in the noise around 200 mspost-stimulus onset at electrodes in temporal and occipitallobes. According to their current source density analysisfor this enhancement, there was a component localized inthe left superior temporal gyrus. These results, togetherwith the previous results on the McGurk effect bySamset al. (1991), generally agree with our results. Therefore, theleft posterior STS, possibly including its ascending branch,may be related to cross-modal binding of auditory-visualspeech.
In our PET experiment, there were also other regions inwhich the Low intelligibility condition showed stronger ac-tivation than the High intelligibility condition (the right BA22, thalamus, and cerebellum). These activations may indi-cate larger efforts for auditory speech perception (the rightBA 22) and lip-reading (cerebellum) in the Low intelligi-bility bimodal condition relative to the High condition. Thereason why these regions were activated only in the PET ex-periment may be that the intelligibility difference betweenthe High and Low conditions was much larger in the PETthan in the fMRI experiment. The implication of the acti-vation in the thalamus is not clear because it was often ob-served in the unimodal conditions as well (Tables 1 and 2).
286 K. Sekiyama et al. / Neuroscience Research 47 (2003) 277–287
4.3. Some discrepancies in lip-reading related areas
In the present study, the visual-specific activation forlip-reading was found mainly in the MT area (bilaterallyin the PET experiment and in the left hemisphere in thefMRI experiment) that is well documented for its functionof visual motion processing (Zeki, 1993). A case study isreported in which a patient with bilateral lesions in areaV5/MT was unable to lip-read multisyllabic utterances(Campbell et al., 1997). Thus, the MT may play an essentialrole in lip-reading.
In the literature, however, brain areas activated forlip-reading in normal hearing are somewhat variable.Calvert and colleagues reported an fMRI study indicatingactivation in the primary auditory cortex (BA 41) as wellas the superior temporal gyrus (BA 22) and visual areasaround the MT (Calvert et al., 1997). Later, the activationin the primary auditory cortex was not replicated (Campbellet al., 2001; Bernstein et al., 2002; but also seeCalvert andCampbell, 2003), nor was it in this study. The MT area isoften activated (Calvert et al., 1997; Campbell et al., 2001)as in the present study. Activation in the superior temporalgyrus (BA 22, often with BA 21) is frequently observed(Calvert et al., 1997; Campbell et al., 2001; Bernstein et al.,2002), and it was also observed in the fMRI-nV conditionand the PET experiment in this study. Broca’s area is some-times activated (Campbell et al., 2001) as in our study. Thecauses of these inconsistencies are not clear due to manyexperimental differences such as speech stimuli (meaning-less monosyllables versus words), the nature of the controlcondition, and subjects’ language background.
4.4. Generality across languages
In the present study, brain activation for the AV stimuliof High intelligibility (+15 dB or+7 dB in SN ratio) wasalmost identical to that for the audio-only stimuli, lackingthe evidence for auditory-visual integration. Although it isin accordance with the relatively weak McGurk effect ob-served, a question arises. Is this result specific to Japanesespeaking subjects? It has been reported that native speak-ers of Japanese rely on the auditory input more than nativespeakers of English, showing only a weak McGurk effectunless the auditory speech has some ambiguity (Sekiyamaand Tohkura, 1991; Kuhl et al., 1994; Sekiyama, 1994, butalso seeMassaro et al., 1993). Concerning the data fromthe High intelligibility condition, generality of the presentresults across languages remains for further research.
In conclusion, by using Japanese speakers who are lesssubject to the McGurk effect for intelligible auditory speech,we found a brain region seemingly related to the McGurkeffect for less intelligible auditory speech. The region waslocated in the posterior STS in the left hemisphere. Al-though our experimental design does not rule out a possi-bility that this activation reflects stronger visual attention tocope with the Low intelligibility, its location was reasonably
close to the area recently reported for cross-modal bindingof auditory-visual speech, suggesting that the posterior STSin the left hemisphere plays a role in the McGurk effect.
Acknowledgements
This work was supported by grants from the Science andTechnology Agency, Japan, the Ministry of Education, Sci-ence, Sports and Culture, Japan, and H. Nakayama SciencePromotion Foundation, to the first author. We are gratefulto the staff of PET facilities at Akita Research Institute ofBrain and Vessels for their support during the PET experi-ment, and two anonymous reviewers for their helpful com-ments and suggestions on an earlier version of this article.
References
Belin, P., Zatorre, R.J., Lafaille, P., Ahad, P., Pike, B., 2000. Voice-selectiveareas in human auditory cortex. Nature 403, 309–312.
Bernstein, L.E., Auer Jr., E.T., Moore, J.K., Ponton, C.W., Don, M.,Singh, M., 2002. Visual speech perception without primary auditorycortex activation. NeuroReport 13, 311–315.
Bertelson, P., Vroomen, J., de Gelder, B., Driver, J., 2000. The ventriloquisteffect does not depend on the direction of deliberate visual attention.Percept. Psychophys. 62, 321–332.
Binder, J.R., Frost, J.A., Hammeke, T.A., Bellgowan, P.S.F., Springer, J.A.,Kaufman, J.N., Possing, E.T., 2000. Human temporal lobe activationby speech and nonspeech sounds. Cereb. Cortex 10, 512–528.
Binnie, C.A., Montgomery, A.A., Jackson, P.L., 1974. Auditory and visualcontributions to the perception of consonants. J. Speech Hear. Res.17, 619–630.
Callan, D.E., Callan, A., Kroos, C., Vatikiotis-Bateson, E., 2001. Mul-timodal contribution to speech perception revealed by independentcomponent analysis: a single-sweep EEG case study. Cogn. Brain Res.10, 349–353.
Calvert, G.A., 2001. Crossmodal processing in the human brain: insightsfrom functional neuroimaging studies. Cereb. Cortex 11, 1110–1123.
Calvert, G.A., Campbell, R., 2003. Reading speech from still and movingfaces: the neural substrates of visible speech. J. Cogn. Neurosci. 15,57–70.
Calvert, G.A., Bullmore, E.T., Brammer, M.J., Campbell, R., Williams,S.C.R., McGuire, P.K., Woodruff, P.W.R., Iversen, S.D., David, A.S.,1997. Activation of auditory cortex during silent lipreading. Science276, 593–596.
Calvert, G.A., Campbell, R., Brammer, M.J., 2000. Evidence from func-tional magnetic resonance imaging of crossmodal binding in the hu-man heteromodal cortex. Curr. Biol. 10, 649–657.
Campbell, R., Zihl, J., Massaro, D., Munhall, K., Cohen, M.M., 1997.Speechreading in the akinetopsic patient, L.M. Brain 120, 1793–1803.
Campbell, R., Dodd, B., Burnham, D., 1998. Hearing by Eye II. Psychol-ogy Press, Hove, UK.
Campbell, R., MacSweeney, M., Surguladze, S., Calvert, G., McGuire, P.,Suckling, J., Brammer, M.J., David, A.S., 2001. Cortical substratesfor the perception of face actions: an fMRI study of the specificityof activation for seen speech and for meaningless lower-face acts(gurning). Cogn. Brain Res. 12, 233–243.
Cherry, S.R., Woods, R.P., Mazziotta, J.C., 1993. Improved signal-to-noisein activation studies by exploiting the kinetics of oxygen-15 labelledwater. In: Uemura, K. et al. (Eds.), Qualification of Brain Function:Tracer Kinetic and Image Analysis in Brain PET. Elsevier SciencePublishers, Tokyo, pp. 79–87.
K. Sekiyama et al. / Neuroscience Research 47 (2003) 277–287 287
Desimone, R., Gross, C.G., 1979. Visual areas in the temporal cortex ofthe macaque. Brain Res. 178, 363–380.
Friston, K., Holmes, A., Worsley, K., Poline, J.B., Frith, C.D., Heather,J.D., Frackowiak, R.S.J., 1995. Statistical parametric maps in func-tional imaging: a general approach. Hum. Brain Mapp. 2, 189–210.
Hikosaka, K., Iwai, E., Saito, H., Tanaka, K., 1988. Polysensory propertiesof neurons in the anterior bank of the caudal superior temporal sulcusof the macaque monkey. J. Neurophysiol. 60, 1615–1637.
Iida, H., Miura, S., Shoji, Y., Ogawa, T., Kado, H., Narita, Y., Hatazawa,J., Eberl, S., Kanno, I., Uemura, K., 1998. Non-invasive quantitationof CBF using oxygen-15-water and a dual-PET system. J. Nucl. Med.39, 1789–1798.
Jones, E.G., Powell, T.P.S., 1970. An anatomical study of convergingsensory pathways within the cerebral cortex of the monkey. Brain 93,793–820.
Kanno, I., Iida, H., Miura, S., Murakami, M., Takahashi, K., Sasaki, H.,Inugami, A., Shishido, F., Uemura, K., 1987. A system for cerebralblood flow measurement using an H2
15O autoradiographic methodand positron emission tomography. J. Cereb. Blood Flow Metab. 7,143–153.
Kuhl, P.K., Tsuzaki, M., Tohkura, Y., Meltzoff, A.N., 1994. Human pro-cessing of auditory-visual information in speech perception: poten-tial for multimodal human-machine interfaces. In: Acoust. Soc. Japan(Ed.), Proceedings of the International Conference on Spoken Lan-guage Processing. Acoust. Soc. Japan, Tokyo, pp. 539–542.
MacDonald, J., McGurk, H., 1978. Visual influence on speech perceptionprocesses. Percept. Psychophys. 24, 253–257.
Massaro, D.W., 1998. Perceiving Talking Faces: From Speech Perceptionto Behavioral Principle. MIT Press, Cambridge, MA.
Massaro, D.W., Tsuzaki, M., Cohen, M.M., Gesi, A., Heredia, R., 1993.Bimodal speech perception: an examination across languages. J. Pho-netics 21, 445–478.
McGurk, H., MacDonald, J., 1976. Hearing lips and seeing voices. Nature264, 746–748.
Paulesu, E., Frith, C.D., Frackowiak, R.S., 1993. The neural correlates ofthe verbal component of working memory. Nature 362, 342–345.
Raichle, M.E., Martin, W.R., Herscovitch, P., Mintun, M.A., Markham,J., 1983. Brain blood flow measured with intravenous H2
15O. Part II.Implementation and validation. J. Nucl. Med. 24, 790–798.
Rosen, S.M., Fourcin, A.J., Moore, B.C., 1981. Voice pitch as an aid tolipreading. Nature 291, 150–152.
Sams, M., Aulanko, R., Hämäläinen, M., Hari, R., Lounasmaa, O.V.,Lu, S., Simola, J., 1991. Seeing speech: visual information from lipmovements modifies activity in the human auditory cortex. Neurosci.Lett. 127, 141–145.
Scott, S.K., Blank, C.C., Rosen, S., Wise, R.J.S., 2000. Identification ofa pathway for intelligible speech in the left temporal lobe. Brain 123,2400–2406.
Sekiyama, K., 1994. Differences in auditory-visual speech percep-tion between Japanese and Americans: McGurk effect as afunction of incompatibility. J. Acoust. Soc. Jpn. (E) 15, 143–158.
Sekiyama, K., Tohkura, Y., 1991. McGurk effect in non-English listen-ers: few visual effects for Japanese subjects hearing Japanese sylla-bles of high auditory intelligibility. J. Acoust. Soc. Am. 90, 1797–1805.
Sekiyama, K., Tohkura, Y., 1993. Inter-language differences in the in-fluence of visual cues in speech perception. J. Phonetics 21, 427–444.
Sekuler, R., Sekuler, A.B., Lau, R., 1997. Sound alters visual motionprocessing. Nature 385, 308.
Seltzer, B., Pandya, D.N., 1978. Afferent cortical connections and archi-tectonics of the superior temporal sulcus and surrounding cortex inthe rhesus monkey. Brain Res. 149, 1–24.
Shams, L., Kamitani, Y., Shimojo, S., 2000. What you see is what youhear. Nature 408, 788.
Sumby, W.H., Pollack, I., 1954. Visual contribution to speech intelligibilityin noise. J. Acoust. Soc. Am. 26, 212–215.
Summerfield, Q., 1992. Lipreading and audio-visual speech perception.Phil. Trans. R. Soc. Lond. B 335, 71–78.
Wise, R.J.S., Scott, S.K., Blank, S.C., Mummery, C.J., Murphy, K., War-burton, E.A., 2001. Separate neural subsystems within ‘Wernicke’sarea’. Brain 124, 83–95.
Zatorre, R.J., Meyer, E., Gjedde, A., Evans, A.C., 1996. PET studiesof phonetic processing of speech: review, replication, and reanalysis.Cereb. Cortex 6, 21–30.
Zeki, S., 1993. A Vision of the Brain. Blackwell Scientific Publications,Oxford.
Related Documents