Harvard-MIT Division of Health Sciences and Technology HST.723: Neural Coding and Perception of Sound Instructor: Christophe Micheyl Auditory scene analysis Christophe Micheyl

Welcome message from author
This document is posted to help you gain knowledge. Please leave a comment to let me know what you think about it! Share it to your friends and learn new things together.
Transcript

Harvard-MIT Division of Health Sciences and TechnologyHST.723: Neural Coding and Perception of SoundInstructor: Christophe Micheyl
Auditory scene analysis
Christophe Micheyl

We are often surrounded by various sound sources.Some of importance to us; others, a nuisance.
SINGERSINGER
Figures by MIT OCW.
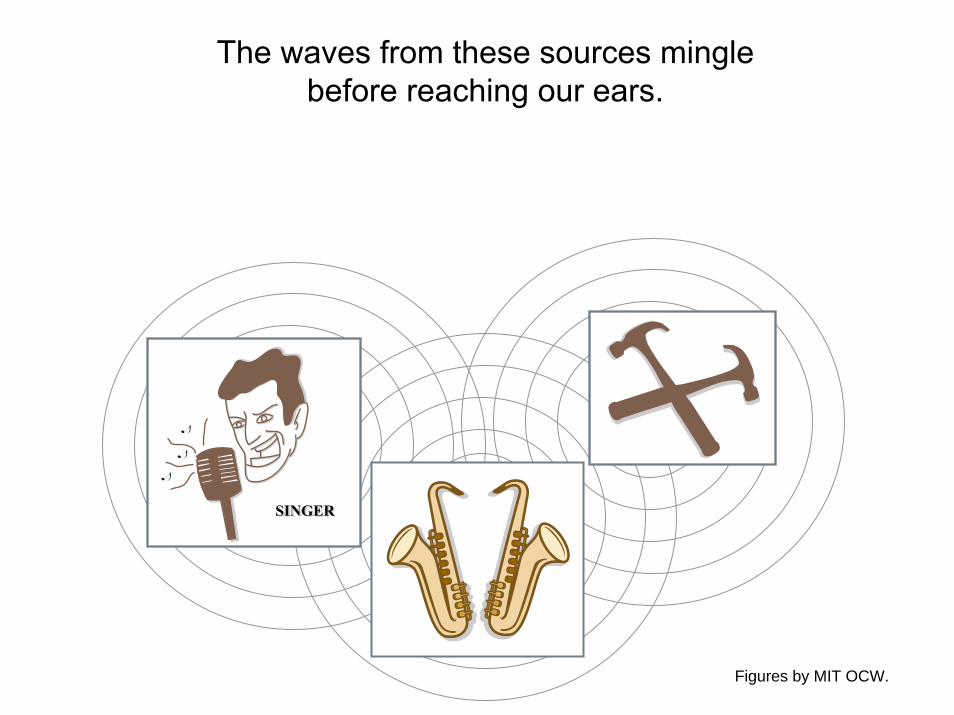
The waves from these sources mingle before reaching our ears.
SINGERSINGER
Figures by MIT OCW.

The result is a complex acoustic mixture.
Figures removed due to copyright reasons.

The auditory system must disentangle the mixtureto permit (or at least facilitate) source identification
Figures removed due to copyright reasons.

Solution:
Figures removed due to copyright reasons.

Some of the questions that we will address:
- What tricks does the auditory system use to analyze complex scenes?
- What neural/brain processes subtend these perceptual phenomena?
- Why do hearing-impaired listeners have listening difficulties in the presence of multiple sound sources?
Why is this important?
-Understand how the auditory system works in ‘real-life’(the system was probably not designed primarily to process isolated sounds)
-Build artificial sound-processing systems that can do ASA like us…(speaker separation for speech recognition, instrument separation for music transcription, content-based indexing in audio recordings,…)
-… or help us do it better(sound pre-processing for ‘intelligent’ hearing aids, enhanced speech-in-noise understanding,…)
Bottom-up and top-down mechanisms
Bottom-up (or ‘primitive’) mechanisms-partition the sensory input based on simple stimulus properties-largely automatic (pre-attentive)-probably innate or acquired early during infancy
Top-down (or ‘schema-based’) mechanisms-partition the input based on stored object representations (prototypes)-heavily dependent upon experience/knowledge
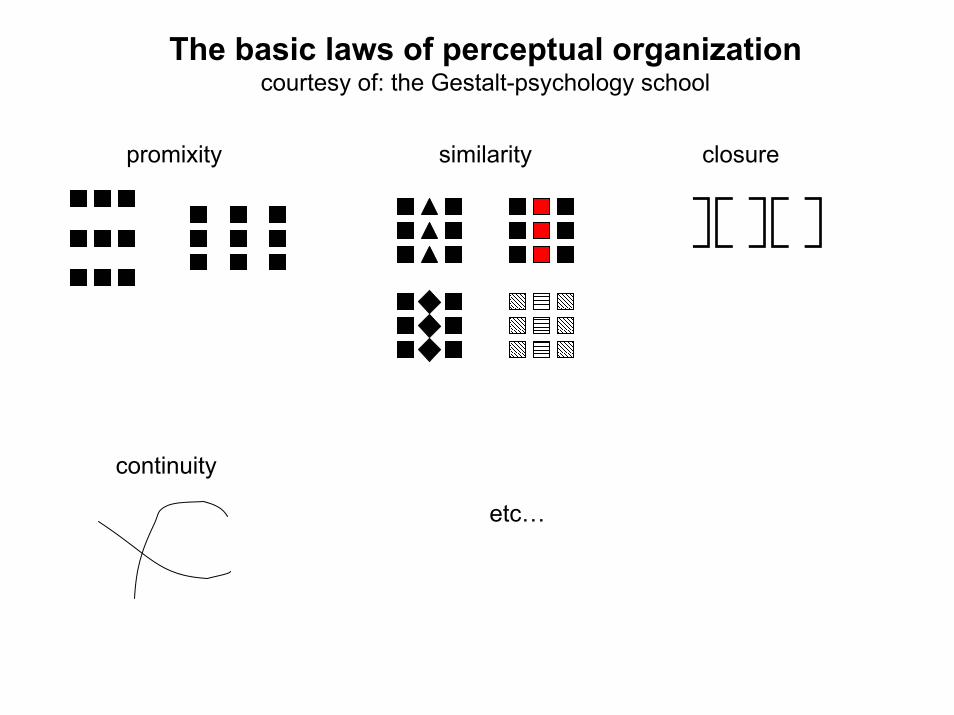
The basic laws of perceptual organizationcourtesy of: the Gestalt-psychology school
promixity similarity closure
continuity
etc…

Top-down
Figure removed due to copyright reasons.
Sequential and simultaneous mechanisms
Sequential mechanisms(auditory ‘streaming’)
Figures removed due to copyright reasons.
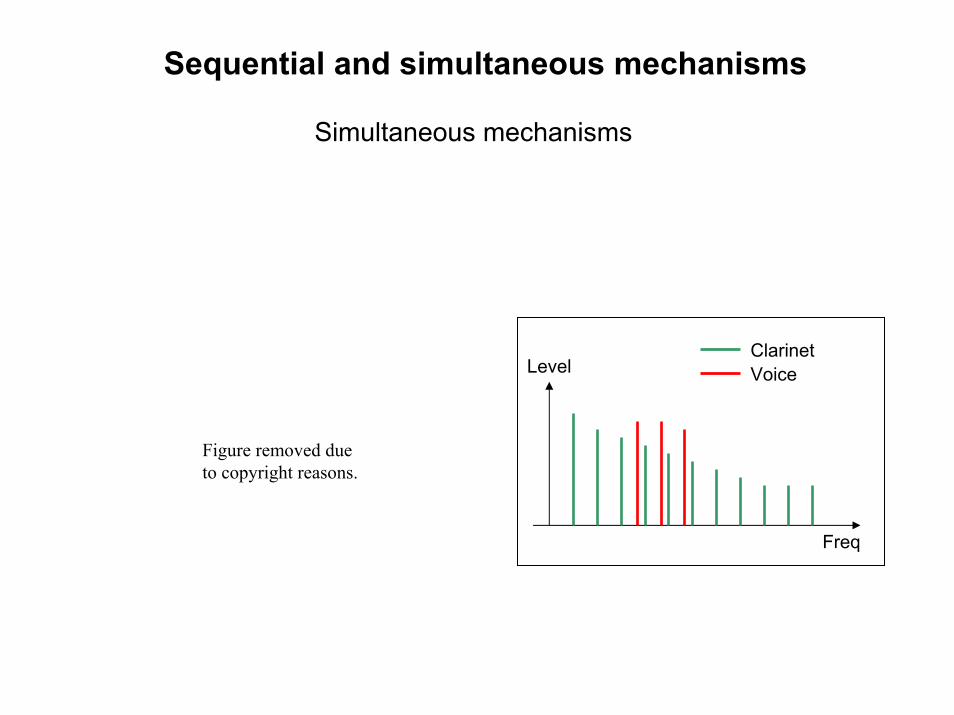
Sequential and simultaneous mechanisms
Simultaneous mechanisms
Level
Freq
ClarinetVoice
Figure removed due to copyright reasons.
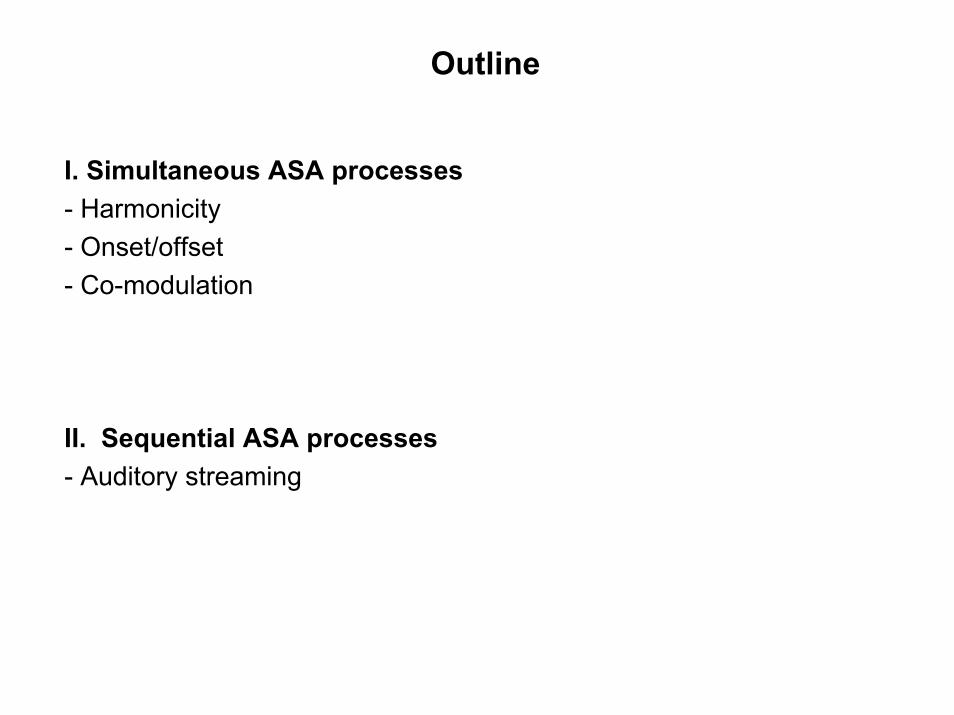
Outline
I. Simultaneous ASA processes- Harmonicity- Onset/offset- Co-modulation
II. Sequential ASA processes- Auditory streaming
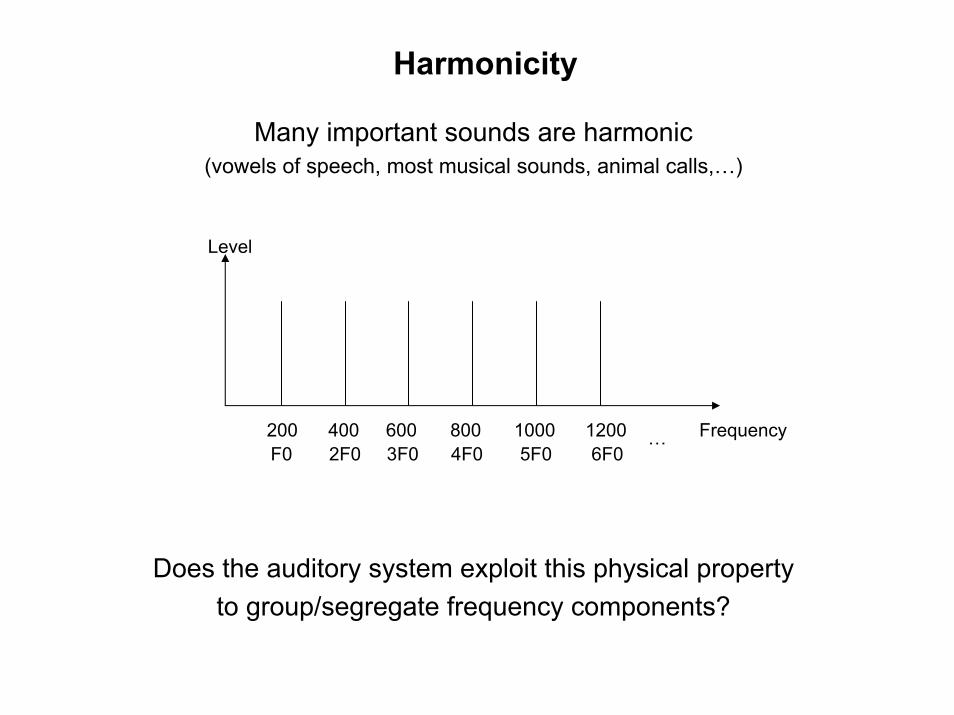
Harmonicity
Many important sounds are harmonic(vowels of speech, most musical sounds, animal calls,…)
Does the auditory system exploit this physical property to group/segregate frequency components?
Level
200 400 600 800 1000 1200 FrequencyF0 2F0 3F0 4F0 5F0 6F0
…
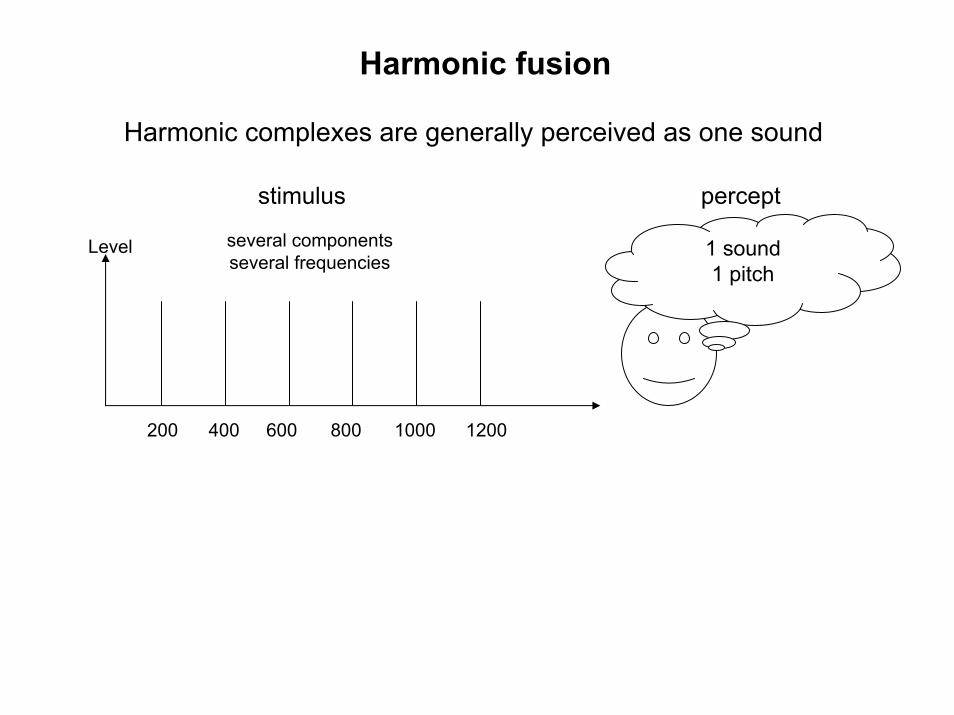
Harmonic fusion
Harmonic complexes are generally perceived as one sound
stimulus percept
1 sound1 pitch
Level several componentsseveral frequencies
200 400 600 800 1000 1200
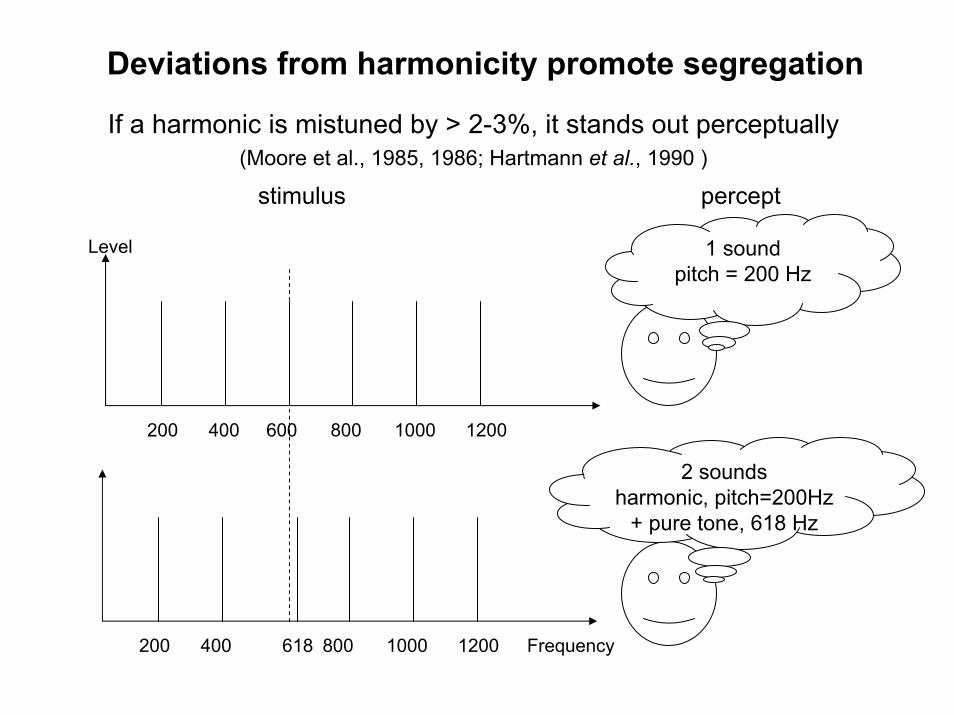
Deviations from harmonicity promote segregation
If a harmonic is mistuned by > 2-3%, it stands out perceptually(Moore et al., 1985, 1986; Hartmann et al., 1990 )
stimulus percept
Level
200 400 600 800 1000 1200
Frequency
1 soundpitch = 200 Hz
2 soundsharmonic, pitch=200Hz
+ pure tone, 618 Hz
200 400 618 800 1000 1200

Demonstration From: Bregman (1990)Auditory scene analysisMIT PressDemo CD
Frequency in tune
1.2kHz
Time
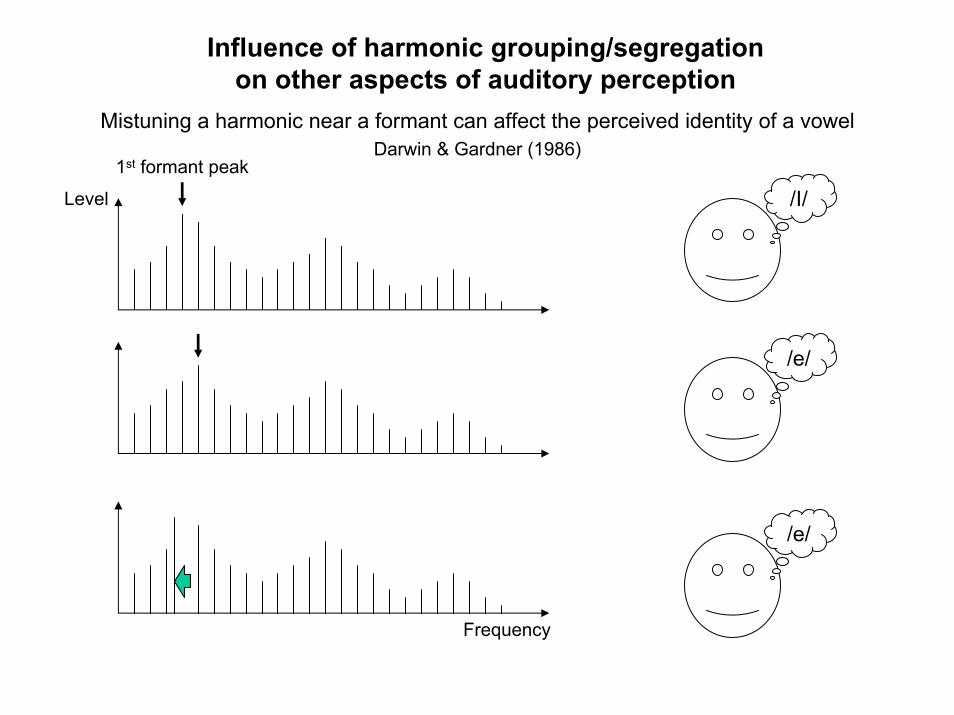
Influence of harmonic grouping/segregationon other aspects of auditory perception
Mistuning a harmonic near a formant can affect the perceived identity of a vowelDarwin & Gardner (1986)
1st formant peak
/I/Level
/e/
/e/
Frequency
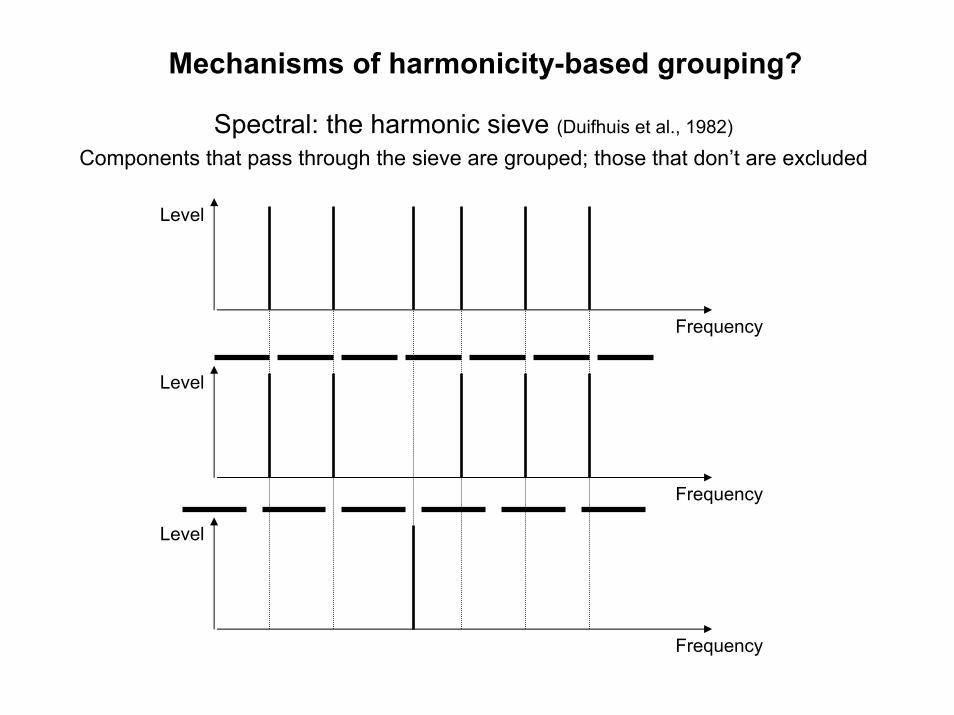
Mechanisms of harmonicity-based grouping?
Spectral: the harmonic sieve (Duifhuis et al., 1982)
Components that pass through the sieve are grouped; those that don’t are excluded
Level
Frequency
Level
Frequency
Level
Frequency
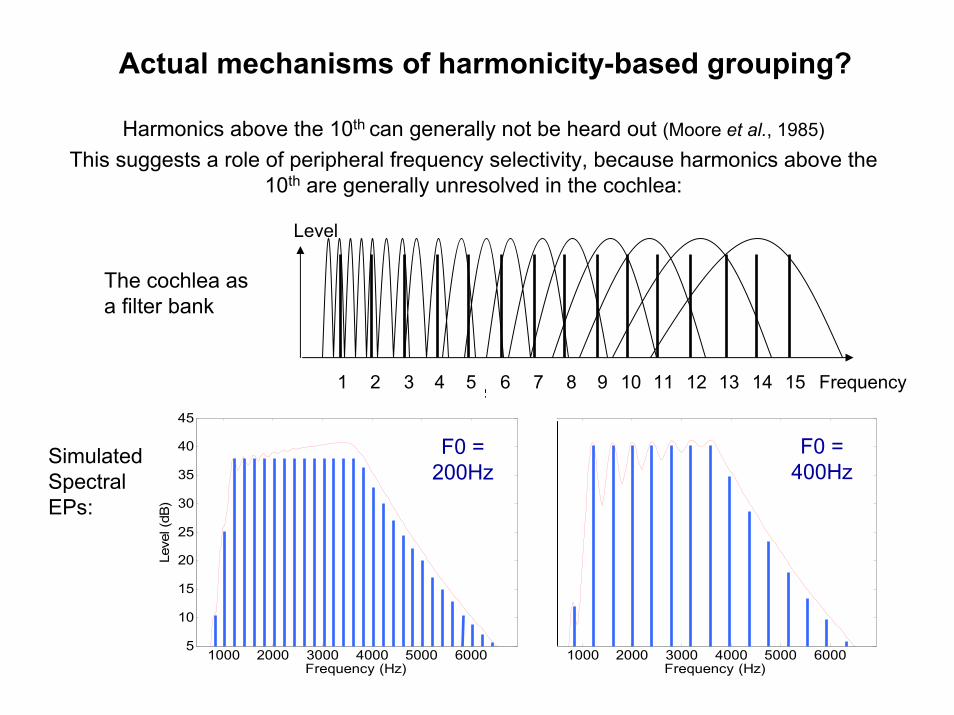
Actual mechanisms of harmonicity-based grouping?
Harmonics above the 10th can generally not be heard out (Moore et al., 1985)This suggests a role of peripheral frequency selectivity, because harmonics above the
10th are generally unresolved in the cochlea:
Level
1 Frequency4 10 132 3 5 6 7 8 9 11 12 1514
The cochlea as a filter bank
SimulatedSpectralEPs:
1000 2000 3000 4000 5000 60005
10
15
20
25
30
35
40
45
Leve
l (dB
)
Frequency (Hz)
F0 = 400Hz
1000 2000 3000 4000 5000 60005
10
15
20
25
30
35
40
45
Leve
l (dB
)
Frequency (Hz)
F0 = 200Hz
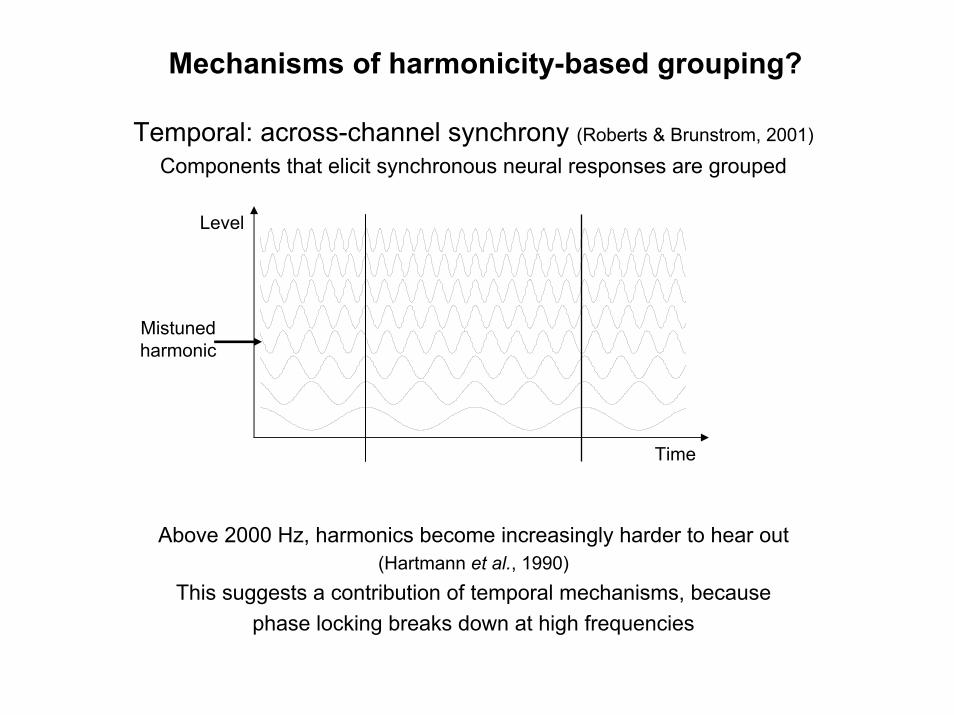
Mechanisms of harmonicity-based grouping?
Temporal: across-channel synchrony (Roberts & Brunstrom, 2001)
Components that elicit synchronous neural responses are grouped
Above 2000 Hz, harmonics become increasingly harder to hear out (Hartmann et al., 1990)
This suggests a contribution of temporal mechanisms, becausephase locking breaks down at high frequencies
Mistuned harmonic
Level
Time
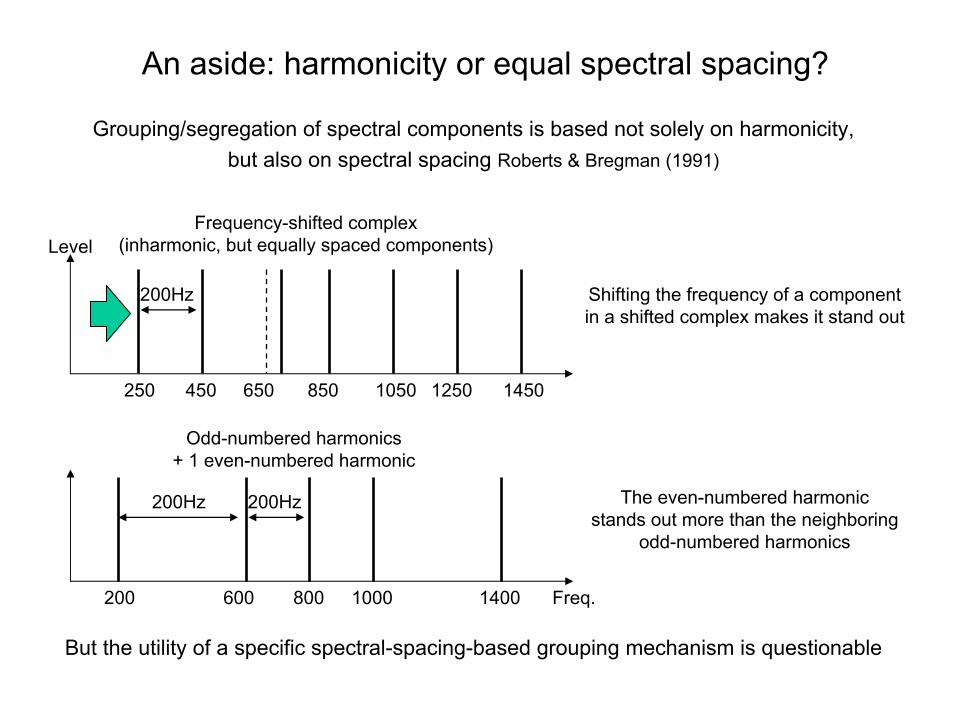
An aside: harmonicity or equal spectral spacing?
Grouping/segregation of spectral components is based not solely on harmonicity, but also on spectral spacing Roberts & Bregman (1991)
But the utility of a specific spectral-spacing-based grouping mechanism is questionable
Level
1050
Frequency-shifted complex (inharmonic, but equally spaced components)
Freq.
Odd-numbered harmonics + 1 even-numbered harmonic
200 600 800 1000
250 450 650 850
200Hz
14501250
1400
The even-numbered harmonic stands out more than the neighboring
odd-numbered harmonics
200Hz200Hz
Shifting the frequency of a component in a shifted complex makes it stand out
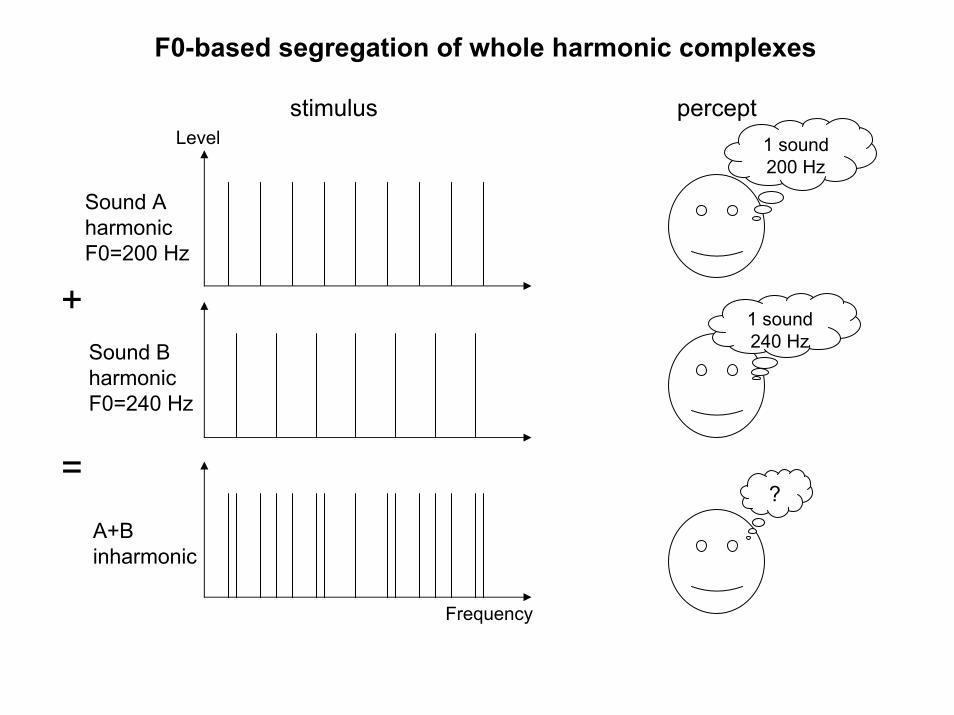
F0-based segregation of whole harmonic complexes
stimulus percept1 sound200 Hz
Level
Sound AharmonicF0=200 Hz
+1 sound240 HzSound B
harmonicF0=240 Hz
=?
A+Binharmonic
Frequency

Double vowelsTwo (synthetic) vowels with different F0s played simultaneously
Level
/o/vowel A
F0=100 Hz
/e/vowel B
F0=140 Hz
?
A+B
Frequency

Double vowelsCan listeners use F0 differences to sort out the frequency components?
/o/vowel A
F0=100 Hz
/e/
vowel BF0=140 Hz
harmonics corresponding to one F0harmonics corresponding to the other F0

Concurrent vowels
F0 differences facilitate the identification of concurrent vowels(Scheffers, 1983; Assmann & Summerfield, 1990; …)
(but note %-correct well above chance even with no F0 difference, providingevidence for a role of template-based mechanisms)
This also works with whole sentences (Brokx & Nooteboom, 1982)
and Summerfield. J. Acoust.Soc. Am. 88 (1990): 680-687.
Figure removed due to copyright reasons. Please see: Assmann,

Actual mechanisms of harmonicity-based grouping?
Harmonics above the 10th can generally not be heard out (Moore et al., 1985)This suggests a role of peripheral frequency selectivity, because harmonics above the
10th are generally unresolved in the cochlea:
Level
1 Frequency4 10 132 3 5 6 7 8 9 11 12 1514
The cochlea as a filter bank
SimulatedSpectralEPs:
1000 2000 3000 4000 5000 60005
10
15
20
25
30
35
40
45
Leve
l (dB
)
Frequency (Hz)
F0 = 400Hz
1000 2000 3000 4000 5000 60005
10
15
20
25
30
35
40
45
Leve
l (dB
)
Frequency (Hz)
F0 = 200Hz
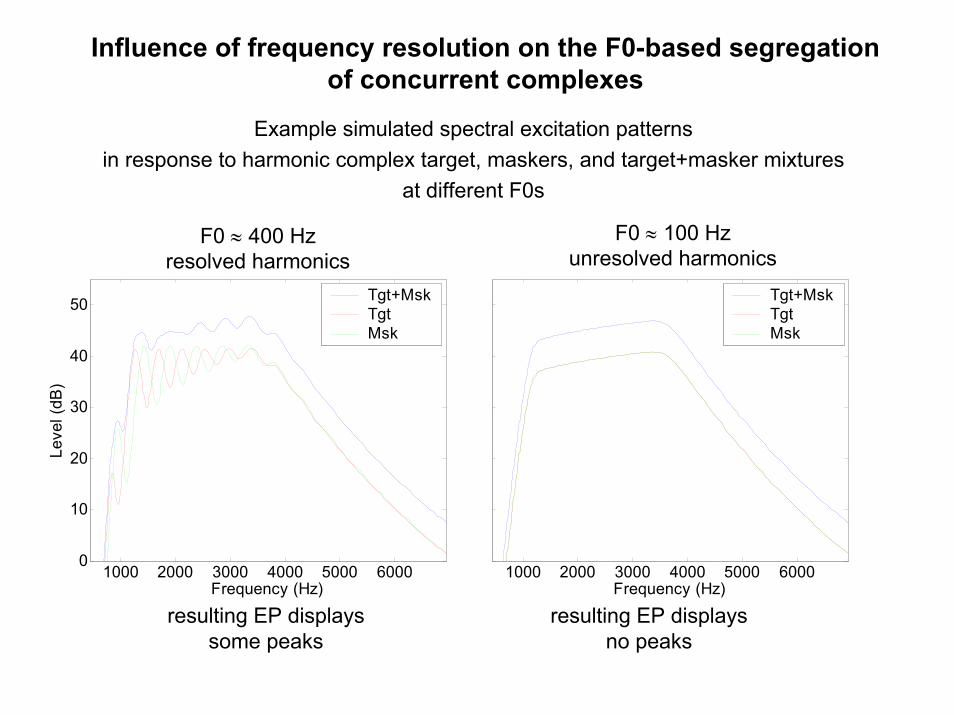
Influence of frequency resolution on the F0-based segregation of concurrent complexes
Example simulated spectral excitation patternsin response to harmonic complex target, maskers, and target+masker mixtures
at different F0s
1000 2000 3000 4000 5000 60000
10
20
30
40
50
Leve
l (dB
)
Frequency (Hz)
Tgt+MskTgtMsk
1000 2000 3000 4000 5000 60000
10
20
30
40
50
Leve
l (dB
)
Frequency (Hz)
Tgt+MskTgtMsk
F0 ≈ 400 Hzresolved harmonics
F0 ≈ 100 Hzunresolved harmonics
resulting EP displays some peaks
resulting EP displays no peaks
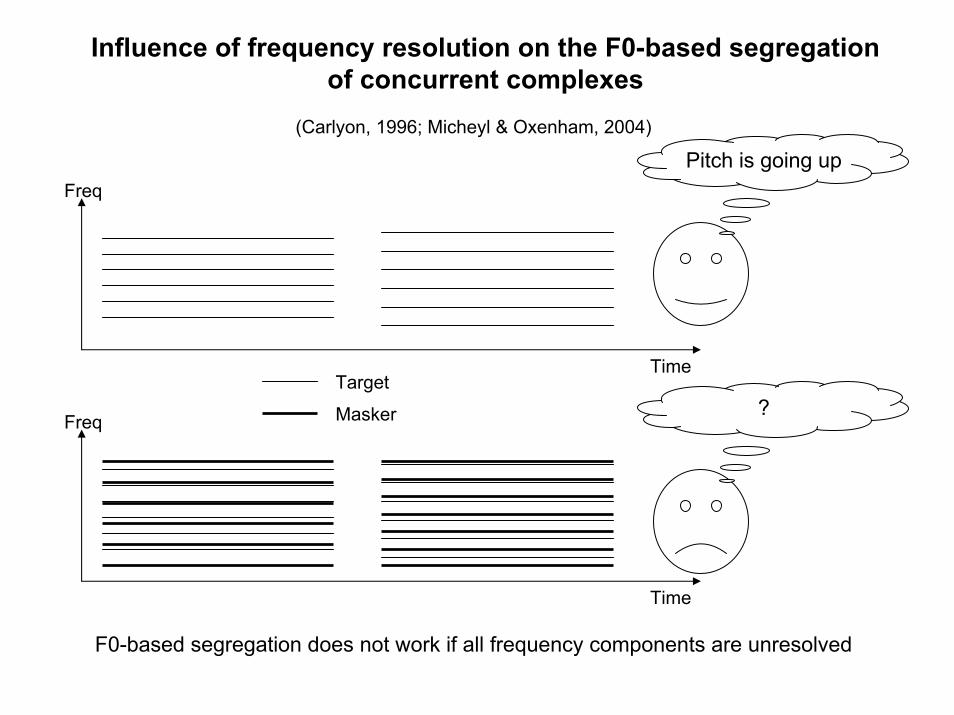
Influence of frequency resolution on the F0-based segregation of concurrent complexes
(Carlyon, 1996; Micheyl & Oxenham, 2004)
F0-based segregation does not work if all frequency components are unresolved
Freq
Time
Freq
Time
Pitch is going up
?Target
Masker
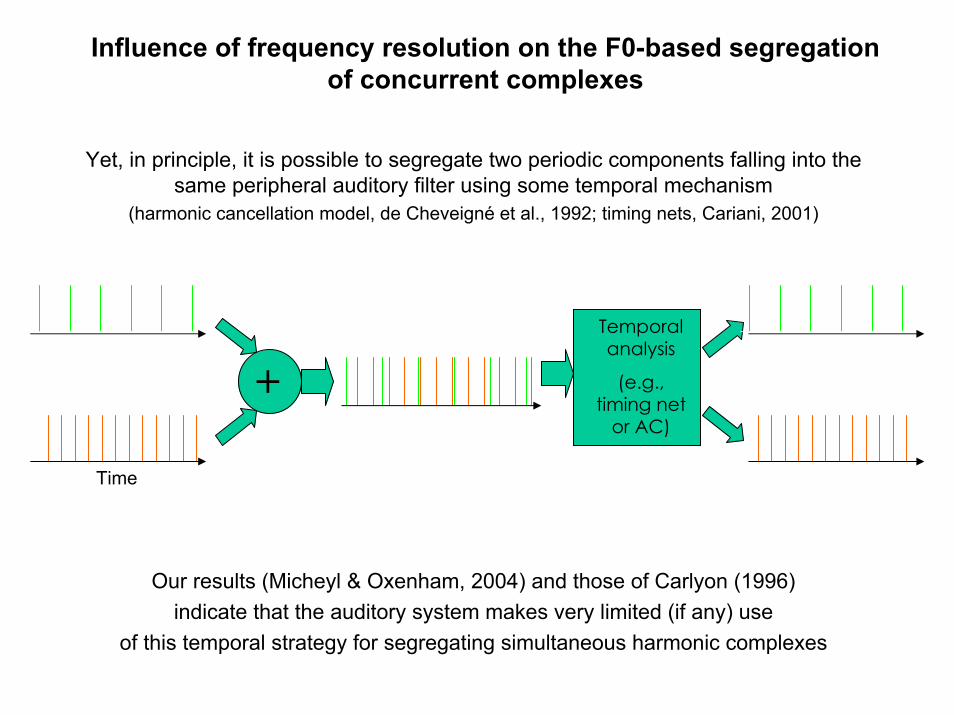
Influence of frequency resolution on the F0-based segregation of concurrent complexes
Yet, in principle, it is possible to segregate two periodic components falling into the same peripheral auditory filter using some temporal mechanism
(harmonic cancellation model, de Cheveigné et al., 1992; timing nets, Cariani, 2001)
Our results (Micheyl & Oxenham, 2004) and those of Carlyon (1996) indicate that the auditory system makes very limited (if any) use
of this temporal strategy for segregating simultaneous harmonic complexes
+Temporal analysis
(e.g., timing net
or AC)
Time
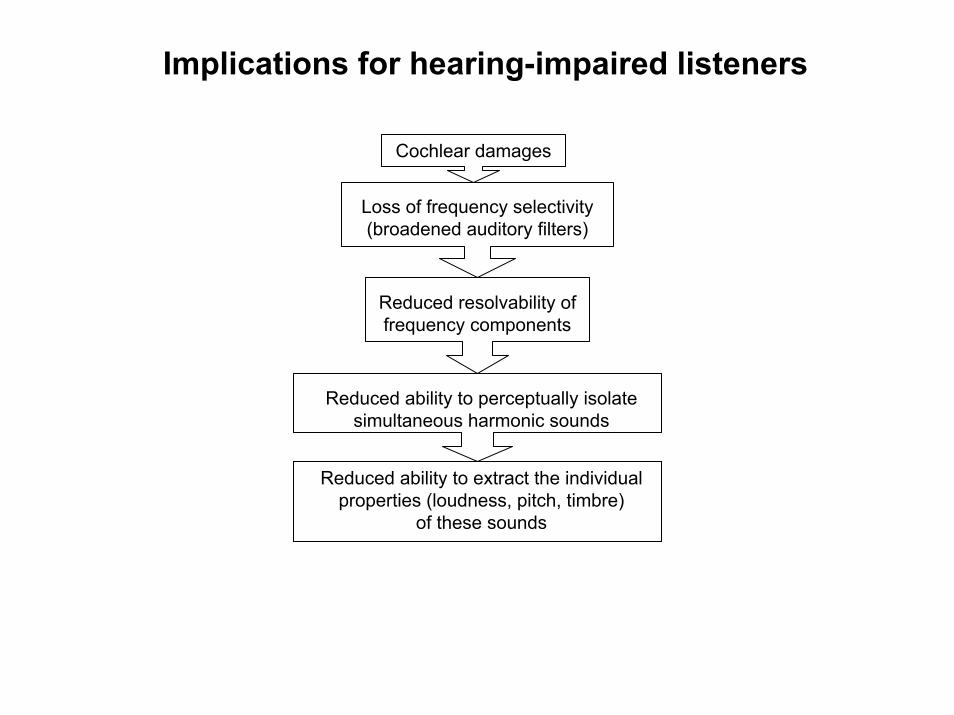
Implications for hearing-impaired listeners
Cochlear damages
Loss of frequency selectivity(broadened auditory filters)
Reduced resolvability offrequency components
Reduced ability to perceptually isolate simultaneous harmonic sounds
Reduced ability to extract the individual properties (loudness, pitch, timbre)
of these sounds
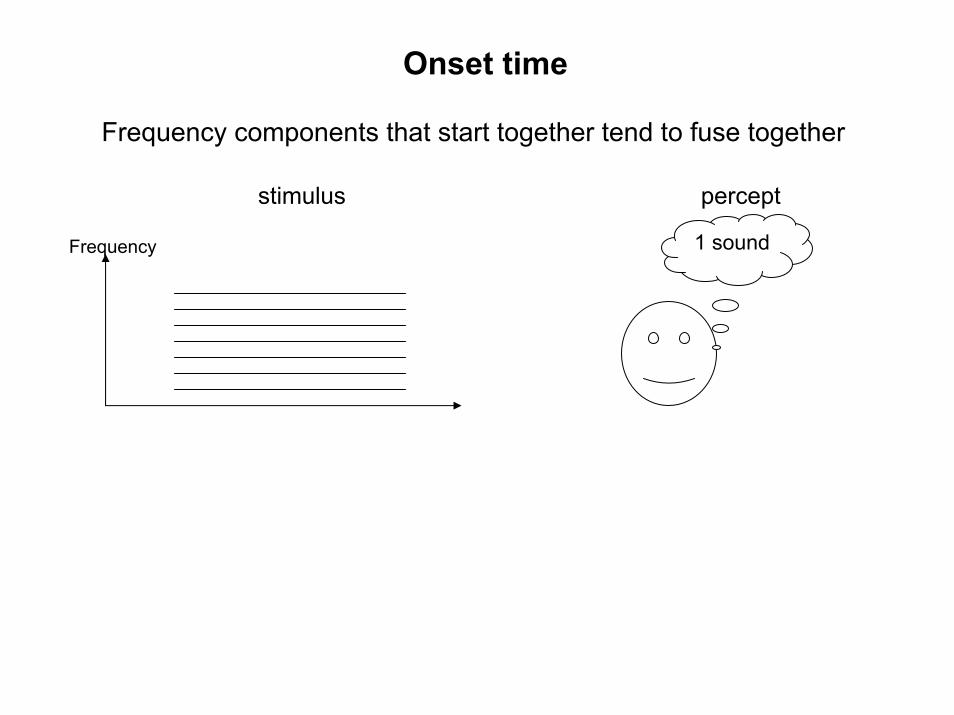
Onset time
Frequency components that start together tend to fuse together
stimulus percept
1 soundFrequency
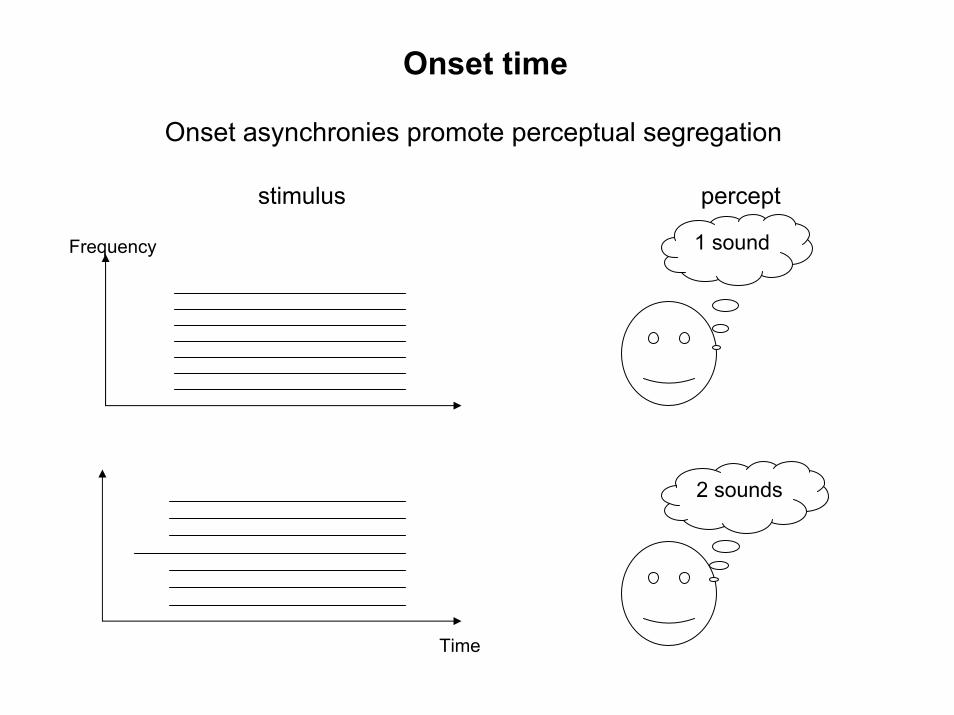
Onset time
Onset asynchronies promote perceptual segregation
stimulus percept
1 soundFrequency
2 sounds
Time
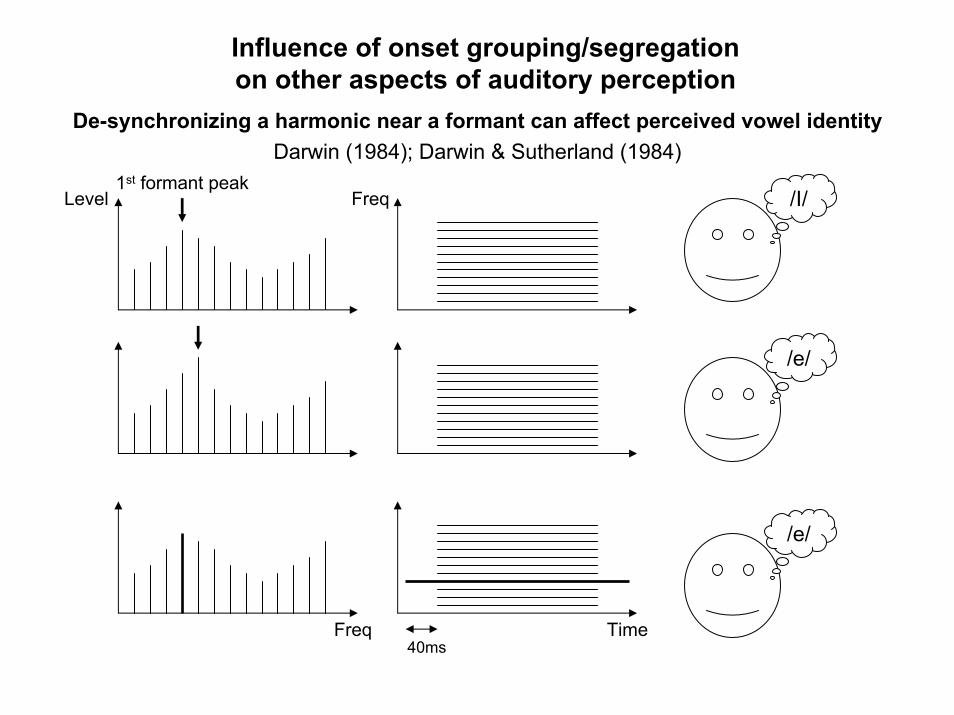
Influence of onset grouping/segregationon other aspects of auditory perception
De-synchronizing a harmonic near a formant can affect perceived vowel identityDarwin (1984); Darwin & Sutherland (1984)
1st formant peak/I/Level Freq
/e/
/e/
Freq Time40ms

Demonstration of onset asynchrony and vowel identityFrom: Bregman (1990)Auditory scene analysisMIT PressDemo CDFrequency
‘ee’ ‘en’ ?
Time

Co-modulation. I. Frequency modulation (FM)
When the F0 of a harmonic sound changes, all of its harmonics change frequency coherently
Frequency(linear scale)
Time
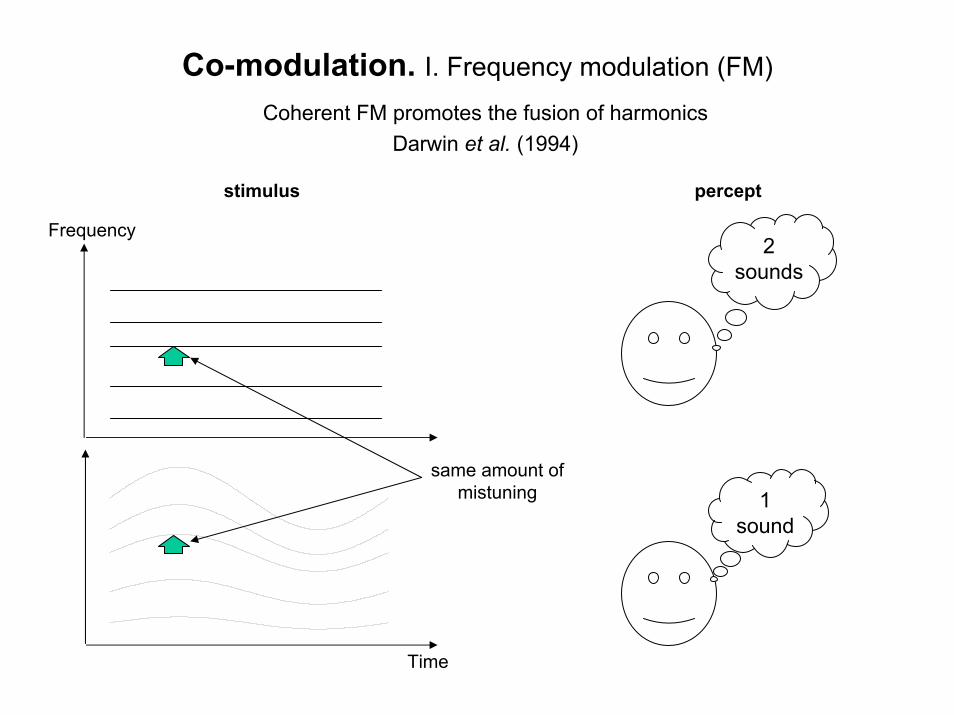
Co-modulation. I. Frequency modulation (FM)
Coherent FM promotes the fusion of harmonicsDarwin et al. (1994)
Frequency
Time
stimulus percept
2 sounds
same amount of mistuning 1
sound
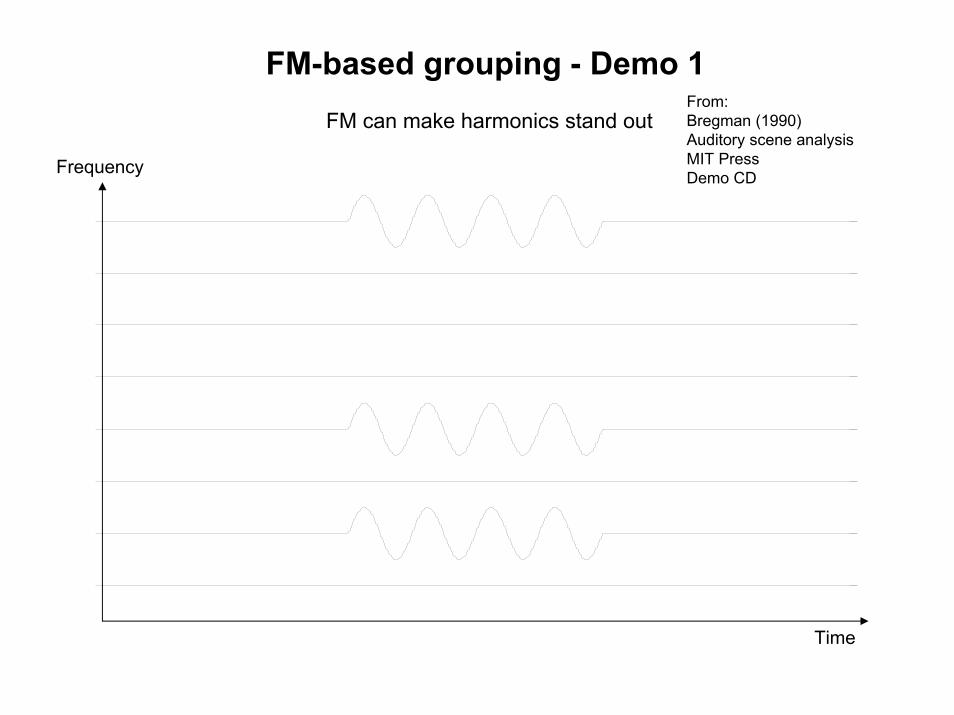
FM-based grouping - Demo 1
Frequency
Time
FM can make harmonics stand outFrom: Bregman (1990)Auditory scene analysisMIT PressDemo CD
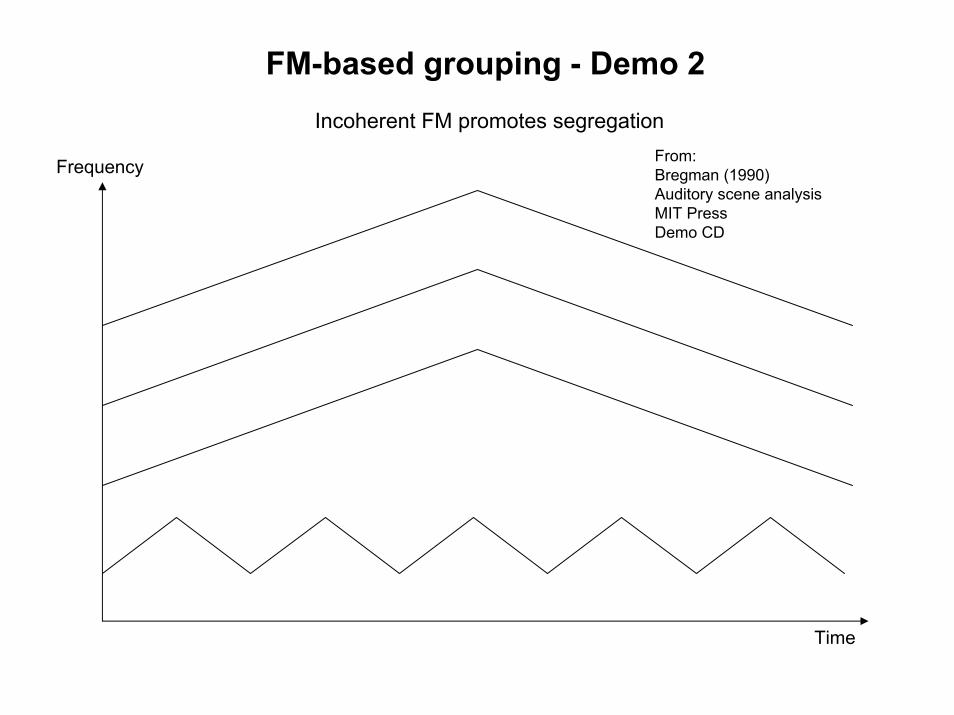
FM-based grouping - Demo 2
Frequency
Incoherent FM promotes segregationFrom: Bregman (1990)Auditory scene analysisMIT PressDemo CD
Time

Is it FM or harmonicity?Carlyon (1991)
Frequencyharmonic inharmonic
2nd
sound
Which sound contains the incoherent FM?Condition 1
Condition 2
?inharmonic inharmonic
Time

Co-modulation. II. Amplitude modulation
Current evidence in favor of a genuine AM-based grouping/segregation mechanism is weak, at best
Out-of phase AM generally results in onset asynchronies(leading to the question: is it really AM phase or rather onset asynchrony?)
Out-of phase AM results in some spectral components being well audible while the others are not, at certain times
(leading to the question: is the pop-out due to AM or enhanced SNR?)
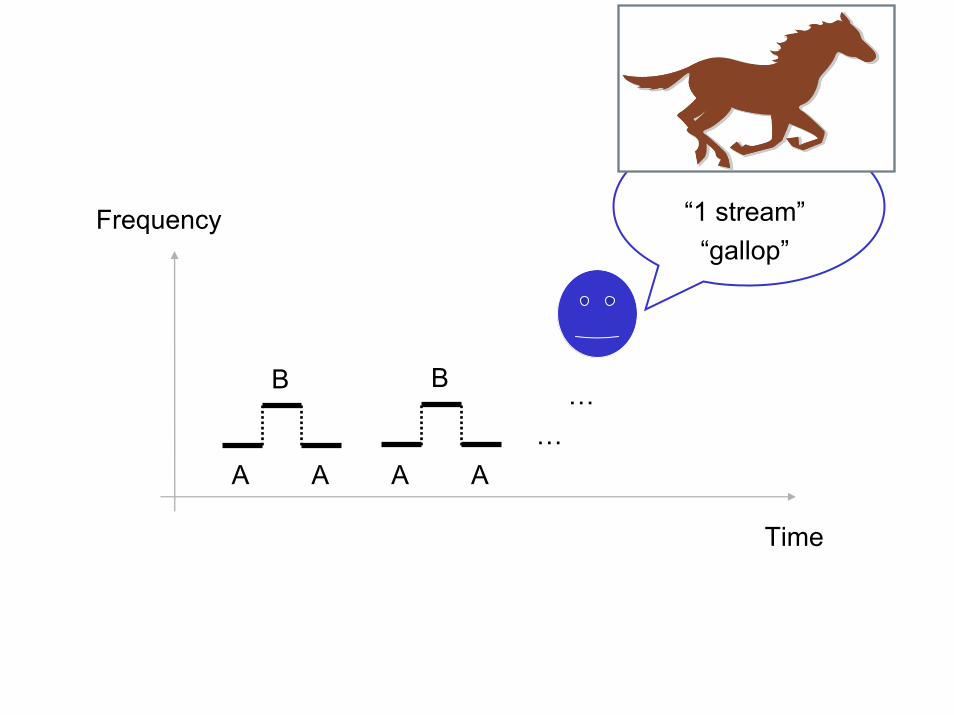
Auditory streaming
What is it?
Description and demonstration ofthe phenomenon
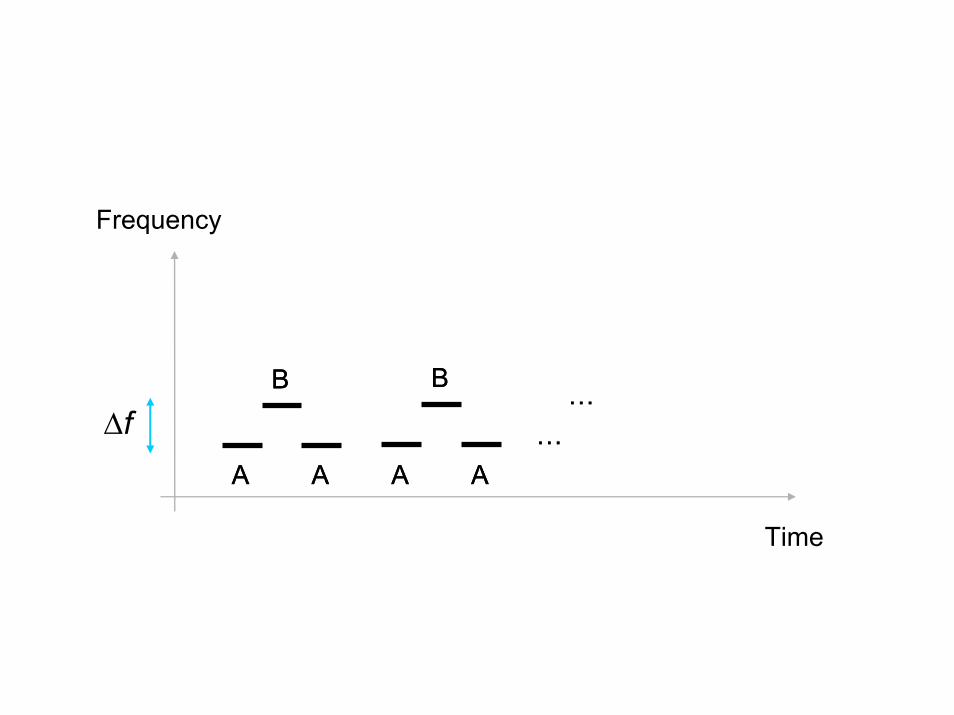
Frequency
A
B
A A
B
A…
…
A
B
A A
B
A…
…∆f
Time
Frequency
Time
A
B
A A
B
A…
…
“1 stream”“gallop”

Frequency
Time
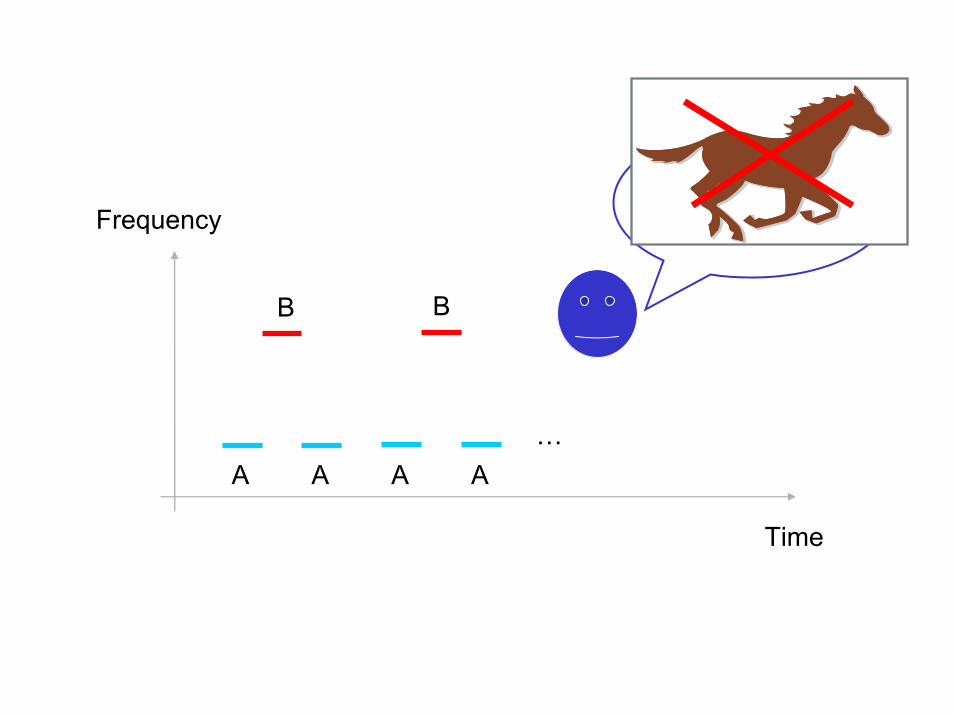
A A
B B …
∆f…
A A

…
“2 streams!”“one high and slow,
the other low and fast”
…
Frequency
BB
Time
A A A A…
……
Frequency
BB
Time
A A A A…

A basic pre-requisite for any neural correlate of streaming: depend on both dF and dT
dF
dT
always2
streams1 or 2 streams
always1 stream
Tone repetition rate
fission boundary
temporal coherence boundary

0.0
0.2
0.4
0.6
0.8
1.0
0 1 2 3 4 5 6 7 8 9Time (s)
Pro
babi
lity
'2 s
tream
s' re
spon
se
1 ST3 ST6 ST9 ST
∆f
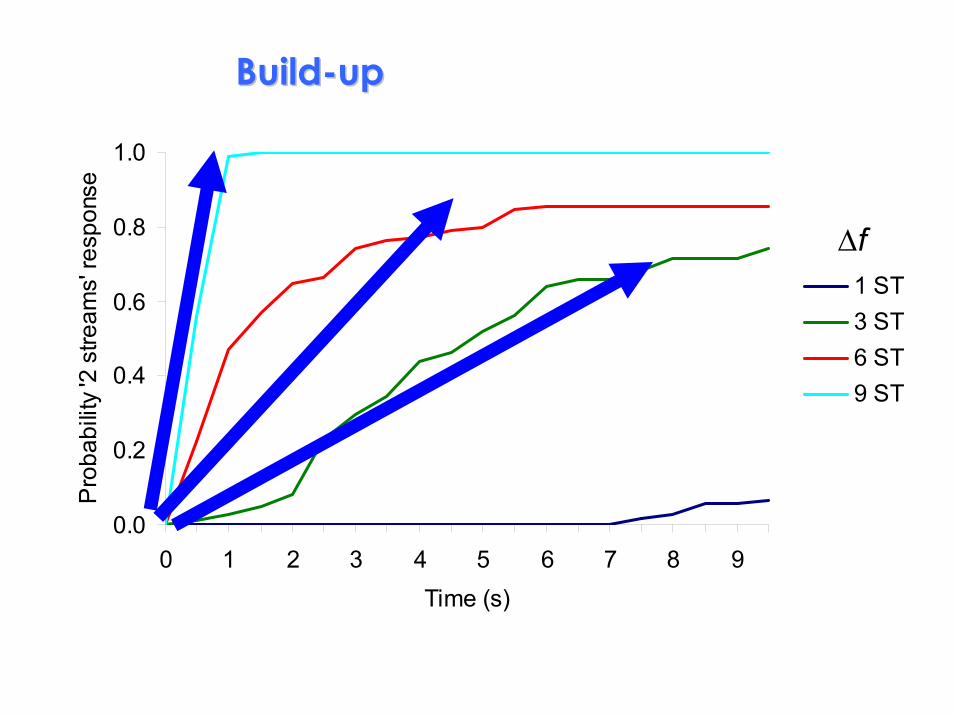
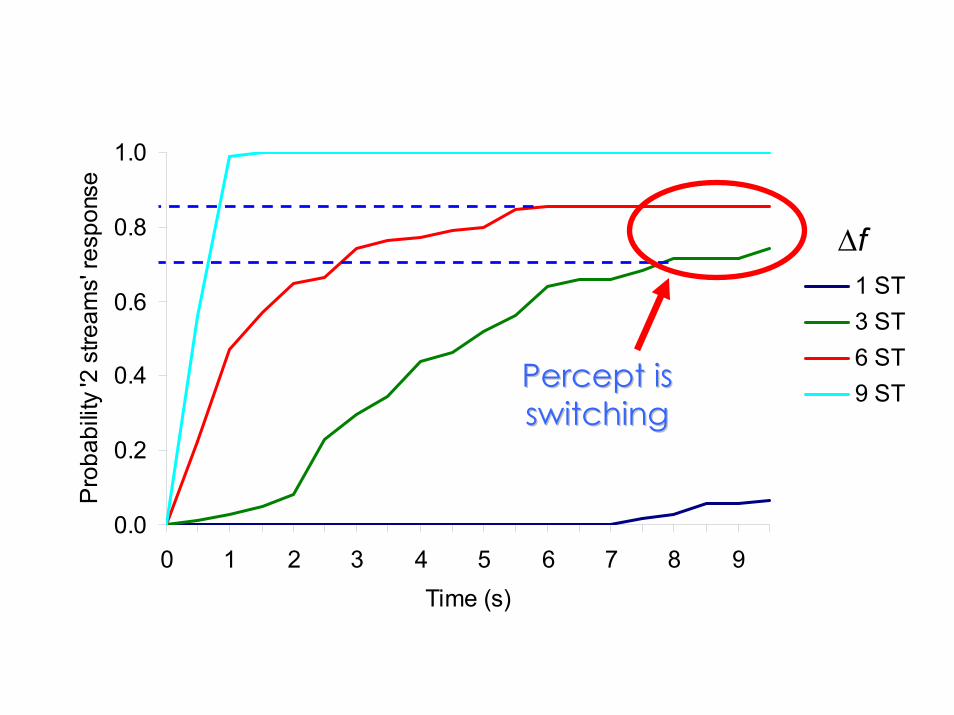
BuildBuild--upup
0.0
0.2
0.4
0.6
0.8
1.0
0 1 2 3 4 5 6 7 8 9Time (s)
Pro
babi
lity
'2 s
tream
s' re
spon
se
1 ST3 ST6 ST9 ST
∆f

Traditional explanations for the build-up
«« NeurophysiologicalNeurophysiological » » explanationexplanationNeural adaptation Neural adaptation ofof coherencecoherence//pitchpitch--motionmotion detectorsdetectors
((AnstisAnstis & Saida, 1985)& Saida, 1985)
«« CognitiveCognitive » » explanationexplanationTheThe defaultdefault isis integrationintegration (1 (1 streamstream););
thethe brainbrain needsneeds to to accumulateaccumulate evidenceevidence thatthat therethere isis more more thanthan 1 1 streamstreambeforebefore declaringdeclaring «« 2 2 streamsstreams »»
((BregmanBregman, 1978, 1990,…), 1978, 1990,…)
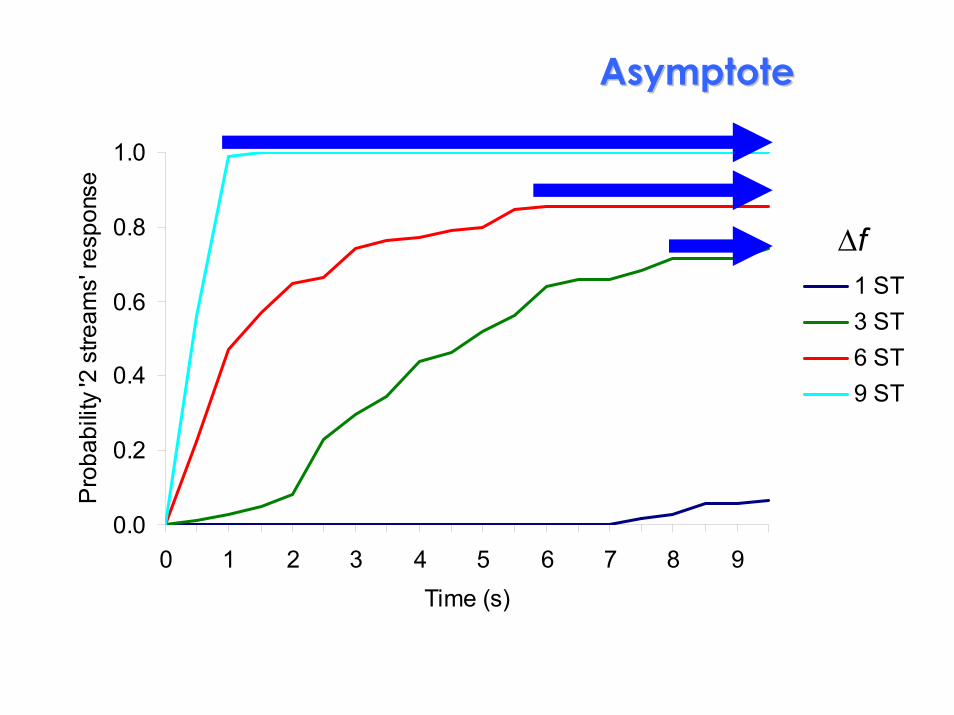
AsymptoteAsymptote
0.0
0.2
0.4
0.6
0.8
1.0
0 1 2 3 4 5 6 7 8 9Time (s)
Pro
babi
lity
'2 s
tream
s' re
spon
se
1 ST3 ST6 ST9 ST
∆f
0.0
0.2
0.4
0.6
0.8
1.0
0 1 2 3 4 5 6 7 8 9Time (s)
Pro
babi
lity
'2 s
tream
s' re
spon
se
1 ST3 ST6 ST9 ST
∆f
Percept is Percept is switchingswitching
AmbiguousAmbiguous stimuli stimuli andand bibi--stablestable perceptspercepts
have have beenbeen usedused successfullysuccessfully in in thethe pastpastto to demonstratedemonstrate neural/neural/brainbrain correlatescorrelates ofof visualvisual perceptspercepts
e.g., e.g., LogothetisLogothetis & & SchallSchall (1989), (1989), LeopoldLeopold & & LogothetisLogothetis (1996),..(1996),..
Necker’s cubeNecker’s cube Rubin’s Rubin’s vasevase--facesfaces
Figures removed due to copyright reasons.

Streaming
How does it work?
Theories andcomputational models
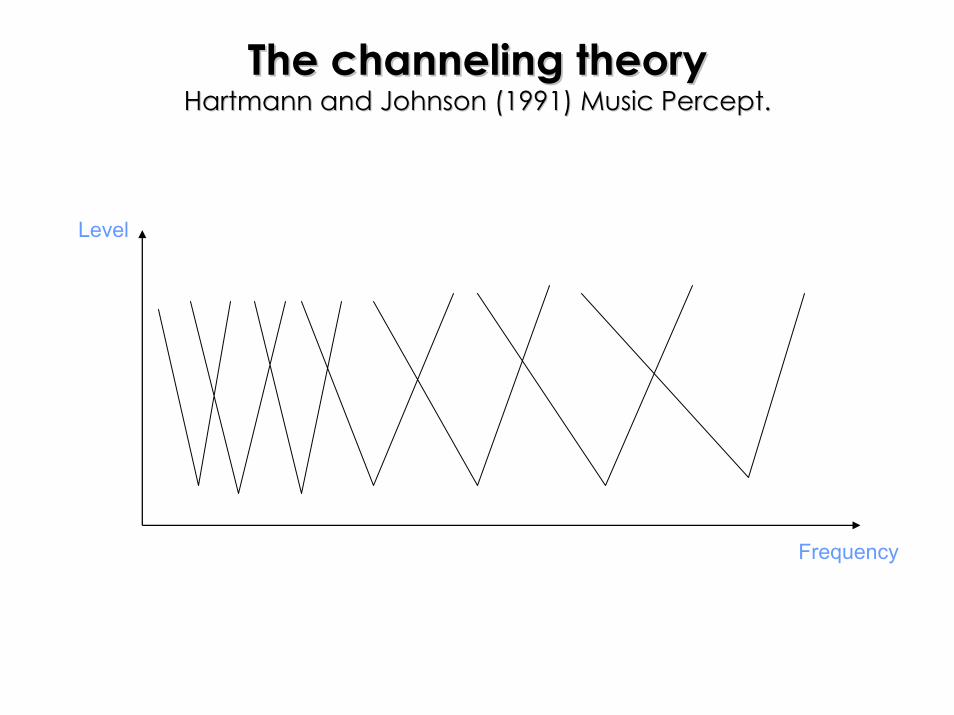
TheThe channelingchanneling theorytheoryHartmann Hartmann andand Johnson (1991) Johnson (1991) MusicMusic Percept.Percept.
Level
Frequency
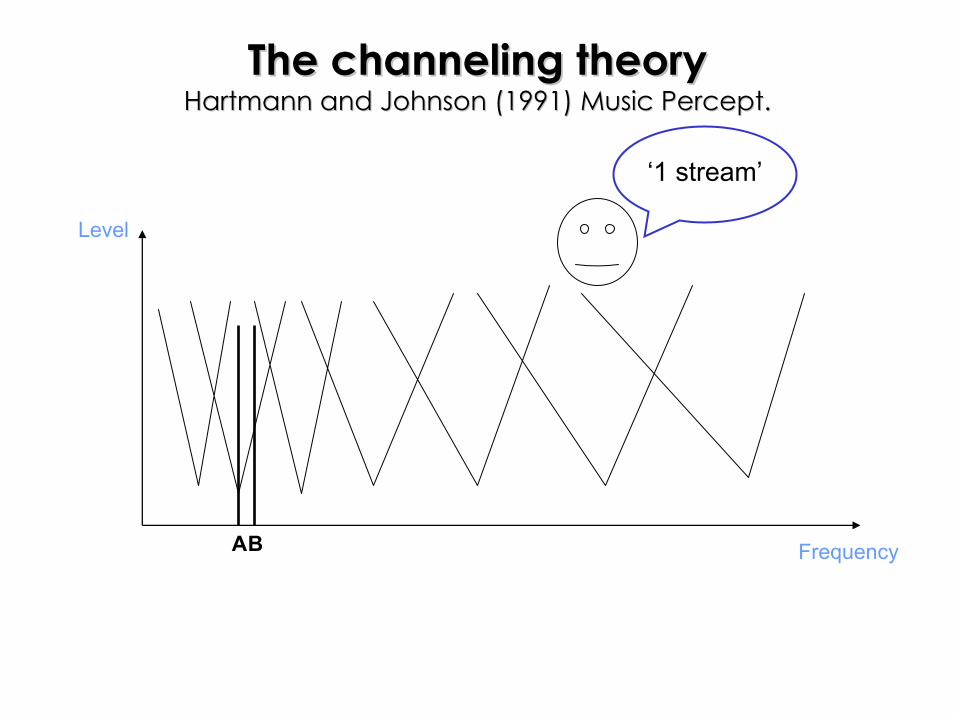
TheThe channelingchanneling theorytheoryHartmann Hartmann andand Johnson (1991) Johnson (1991) MusicMusic Percept.Percept.
‘1 stream’
Level
AB Frequency
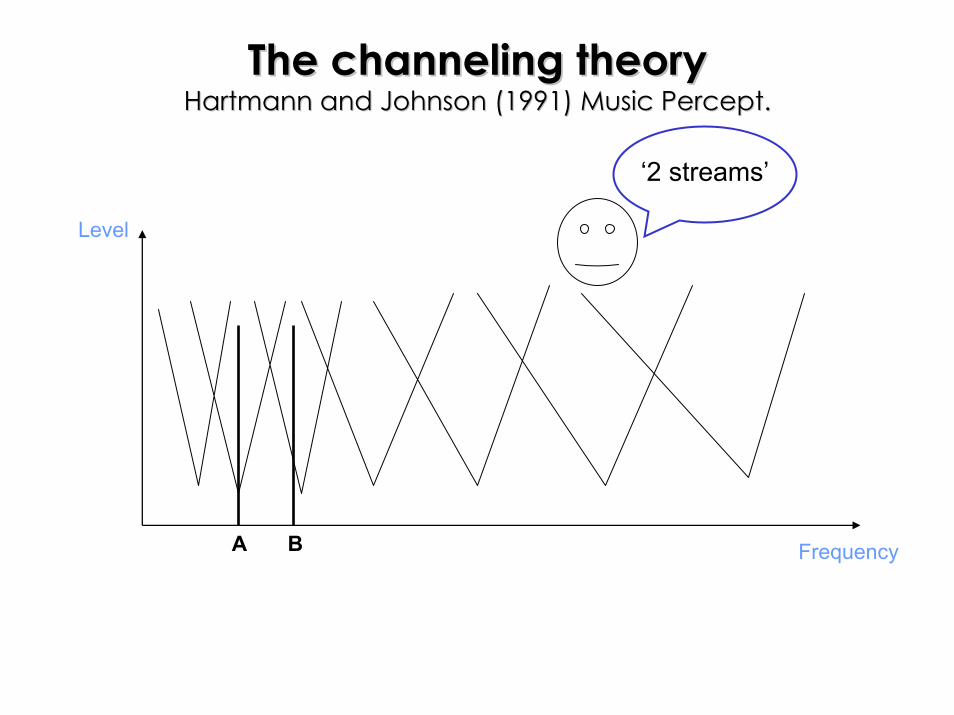
TheThe channelingchanneling theorytheoryHartmann Hartmann andand Johnson (1991) Johnson (1991) MusicMusic Percept.Percept.
‘2 streams’
Level
A B Frequency

StreamingStreaming
HowHow doesdoes itit reallyreally workwork??
Neural Neural mechanismsmechanisms
BehavioralBehavioral evidenceevidence thatthat streamingstreaming occursoccurs inin
-- monkeymonkey ((IzumiIzumi, 2002), 2002)
-- birdbird ((HulseHulse et et alal., 1997; ., 1997; McDougallMcDougall--ShackletonShackleton et et alal, 1998), 1998)
-- fishfish ((FayFay, 1998), 1998)
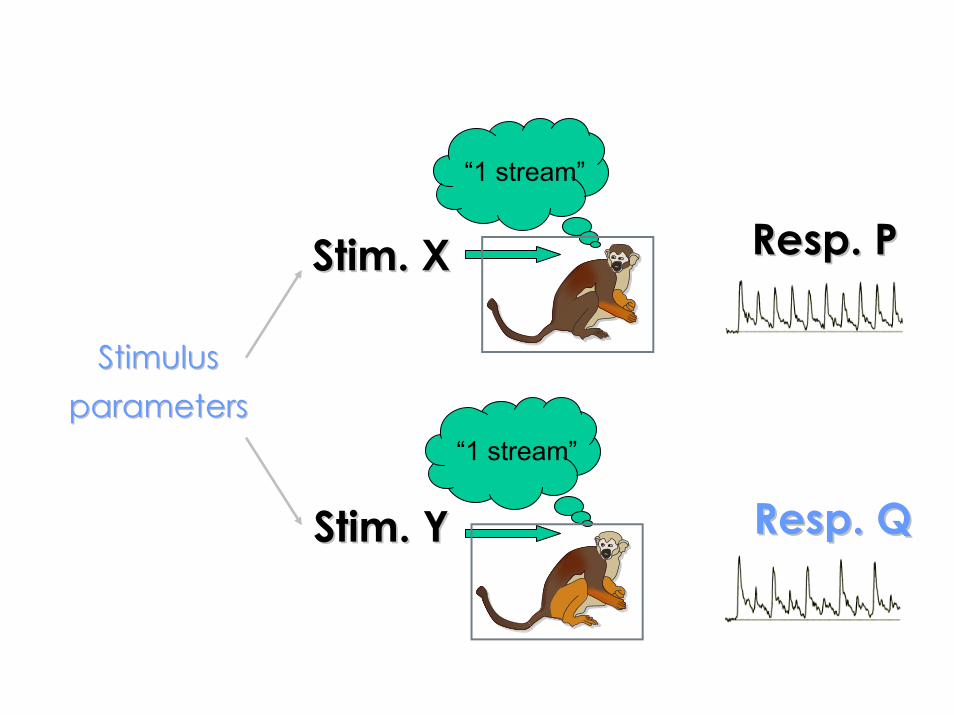
StimStim. X. X
StimStim. Y. Y
“1 stream”
“1 stream”
RespResp. P. P
StimulusStimulusparametersparameters
RespResp. Q. Q
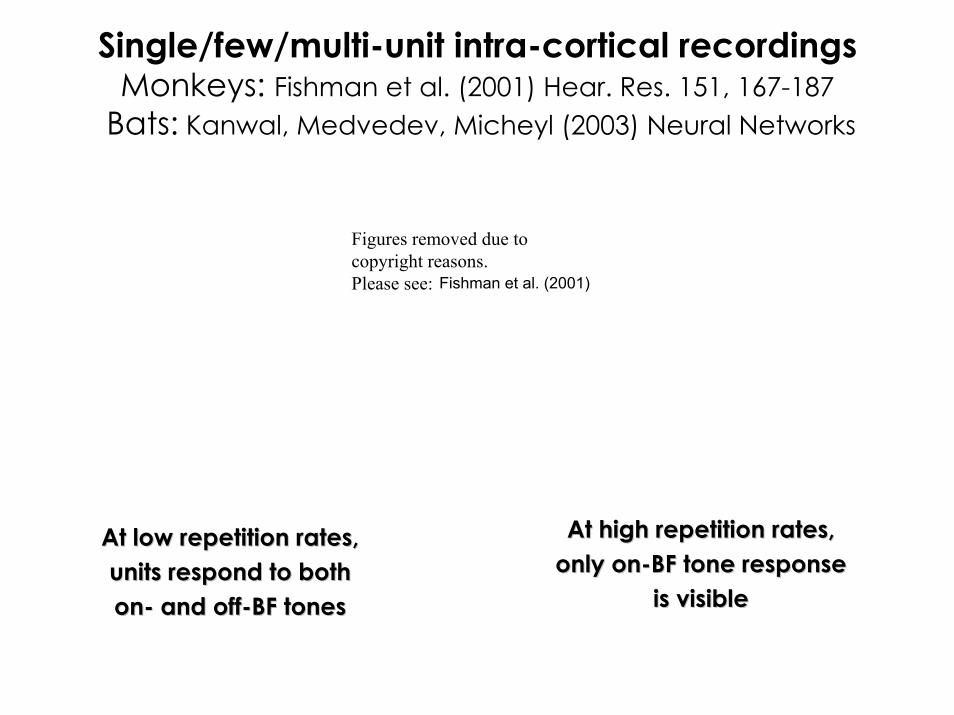
Single/few/multi-unit intra-cortical recordingsMonkeys: Fishman et al. (2001) Hear. Res. 151, 167-187
Bats: Kanwal, Medvedev, Micheyl (2003) Neural Networks
Fishman et al. (2001)
Figures removed due to copyright reasons. Please see:
AtAt highhigh repetitionrepetition rates, rates, onlyonly onon--BFBF tonetone responseresponse
AtAt lowlow repetitionrepetition rates,rates,unitsunits respondrespond to to bothbothonon-- andand offoff--BFBF tones isis visiblevisibletones

IsIs peripheralperipheral chanellingchanelling thethe whole storywhole story??
SoundsSounds thatthat excite excite thethe samesame peripheralperipheralchannelschannels cancan yieldyield streamingstreaming
VliegenVliegen & & OxenhamOxenham (1999)(1999)VliegenVliegen, Moore, , Moore, OxenhamOxenham (1999)(1999)
Grimault, Grimault, MicheylMicheyl, , CarlyonCarlyon et et alal. (2001). (2001)Grimault, Bacon, Grimault, Bacon, MicheylMicheyl (2002)(2002)Roberts, Roberts, GlasbergGlasberg, Moore (2002), Moore (2002)
......
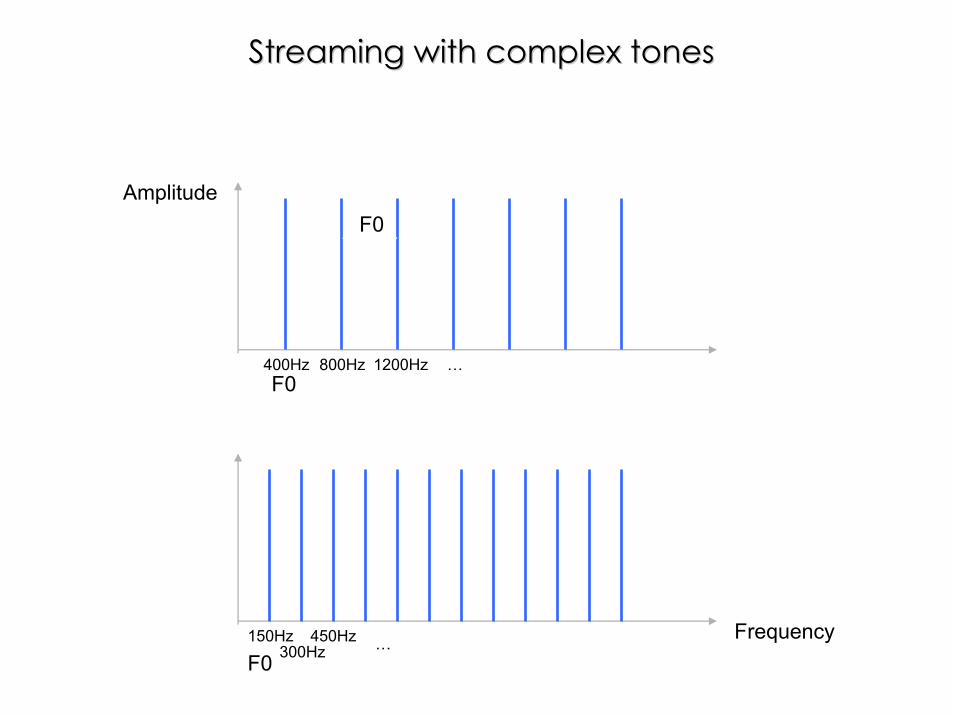
StreamingStreaming withwith complexcomplex tonestones
Amplitude
F0400Hz 800Hz 1200Hz …
F0
FrequencyF0150Hz
300Hz450Hz …
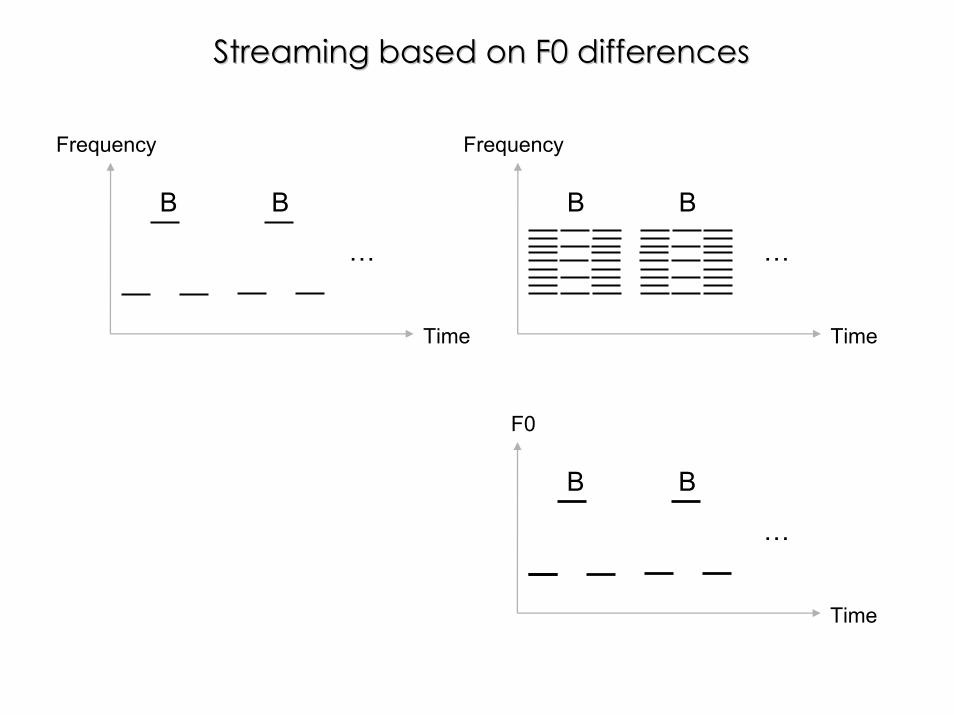
StreamingStreaming basedbased on F0 on F0 differencesdifferences
Frequency
Time
B B
Frequency
Time
B B
……
F0
Time
B B
…

Streaming based on F0 differences
F0A=100Hz F0B= F0A+1.5oct = 283Hz
125 ms
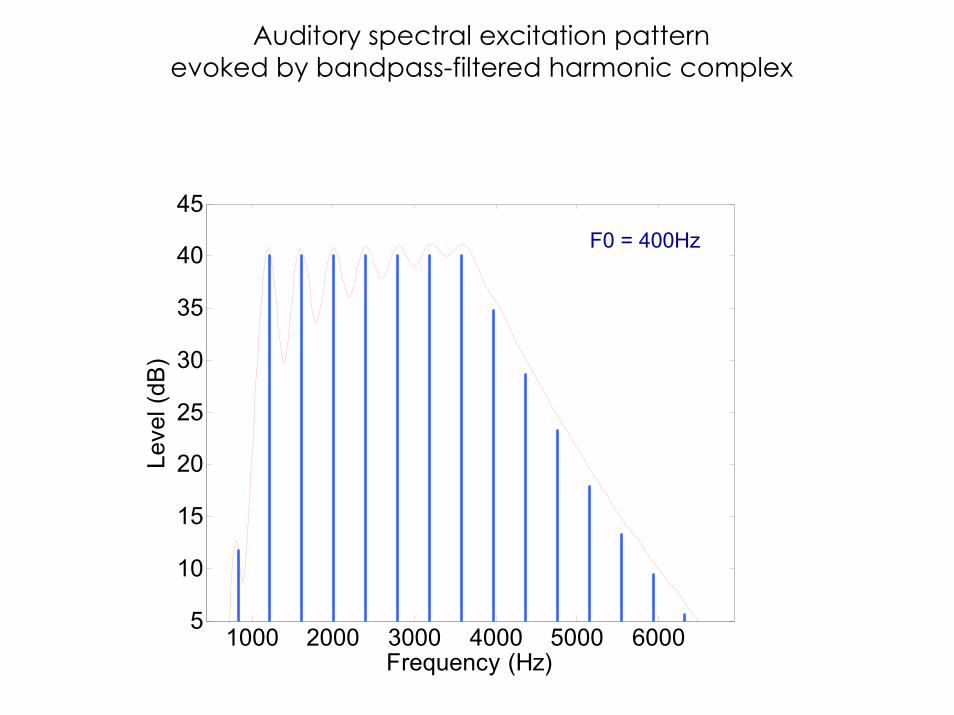
Auditory spectral excitation pattern evoked by bandpass-filtered harmonic complex
1000 2000 3000 4000 5000 60005
10
15
20
25
30
35
40
45
Leve
l (dB
)
Frequency (Hz)
F0 = 400Hz
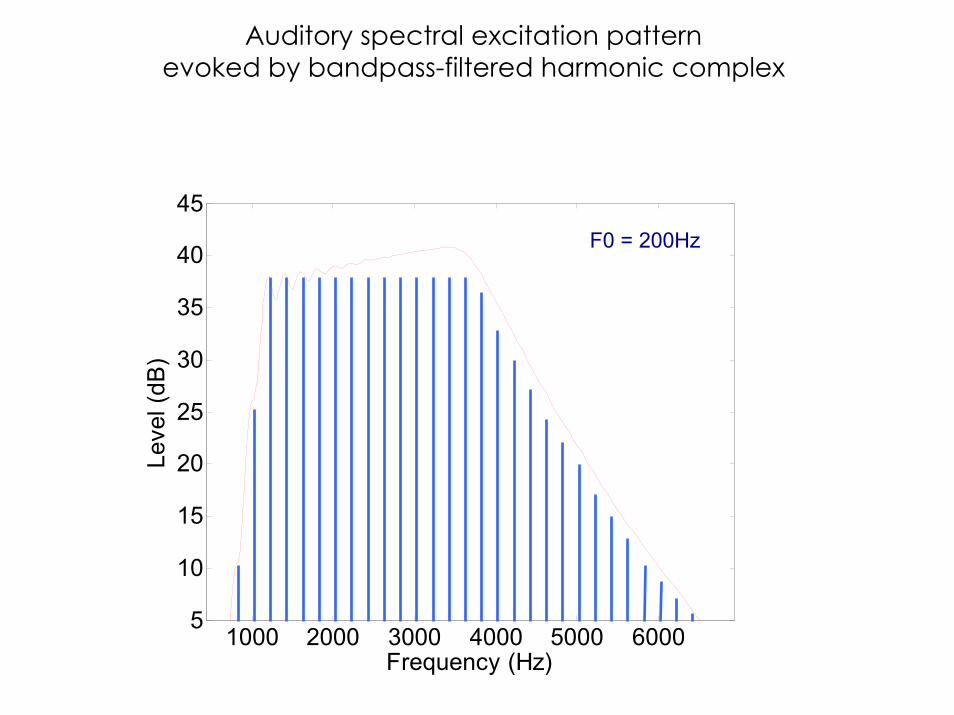
Auditory spectral excitation pattern evoked by bandpass-filtered harmonic complex
1000 2000 3000 4000 5000 60005
10
15
20
25
30
35
40
45
Leve
l (dB
)
Frequency (Hz)
F0 = 200Hz

Auditory spectral excitation pattern evoked by bandpass-filtered harmonic complex
1000 2000 3000 4000 5000 60005
10
15
20
25
30
35
40
45
Leve
l (dB
)
Frequency (Hz)
F0 = 100Hz

F0A=100Hz F0B= F0A+1.5oct = 283Hz
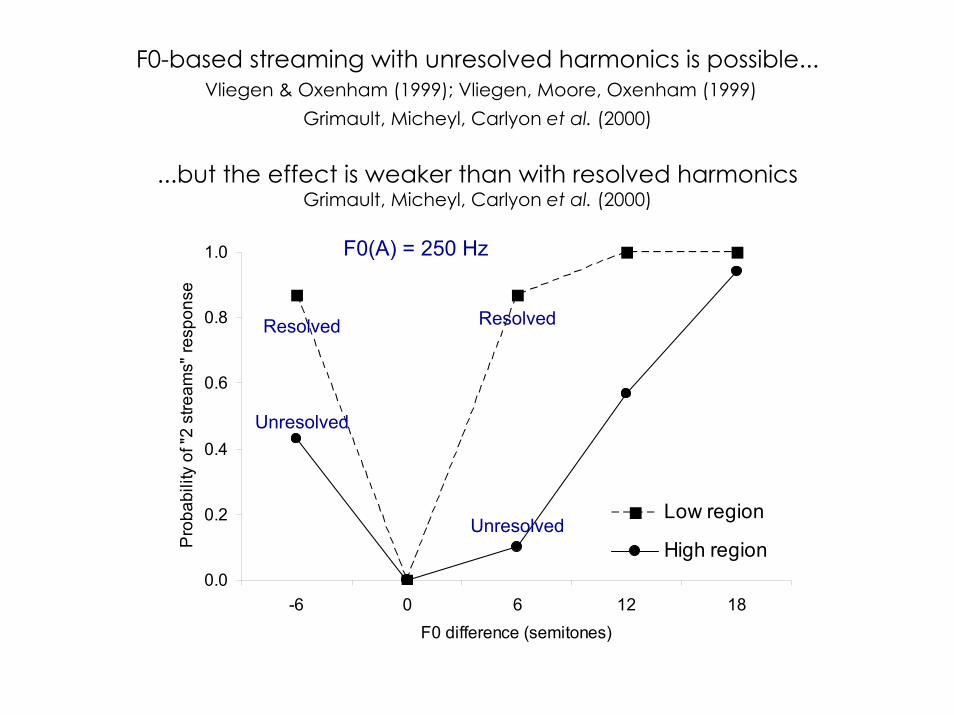
F0-based streaming with unresolved harmonics is possible...Vliegen & Oxenham (1999); Vliegen, Moore, Oxenham (1999)
Grimault, Micheyl, Carlyon et al. (2000)
...but the effect is weaker than with resolved harmonicsGrimault, Micheyl, Carlyon et al. (2000)
0.0
0.2
0.4
0.6
0.8
1.0
-6 0 6 12 18F0 difference (semitones)
Pro
babi
lity
of "2
stre
ams"
resp
onse
Low region
High region
F0(A) = 250 Hz
From: Grimault et al. (2000) JASA 108, 263-
Unresolved
Unresolved
Resolved Resolved
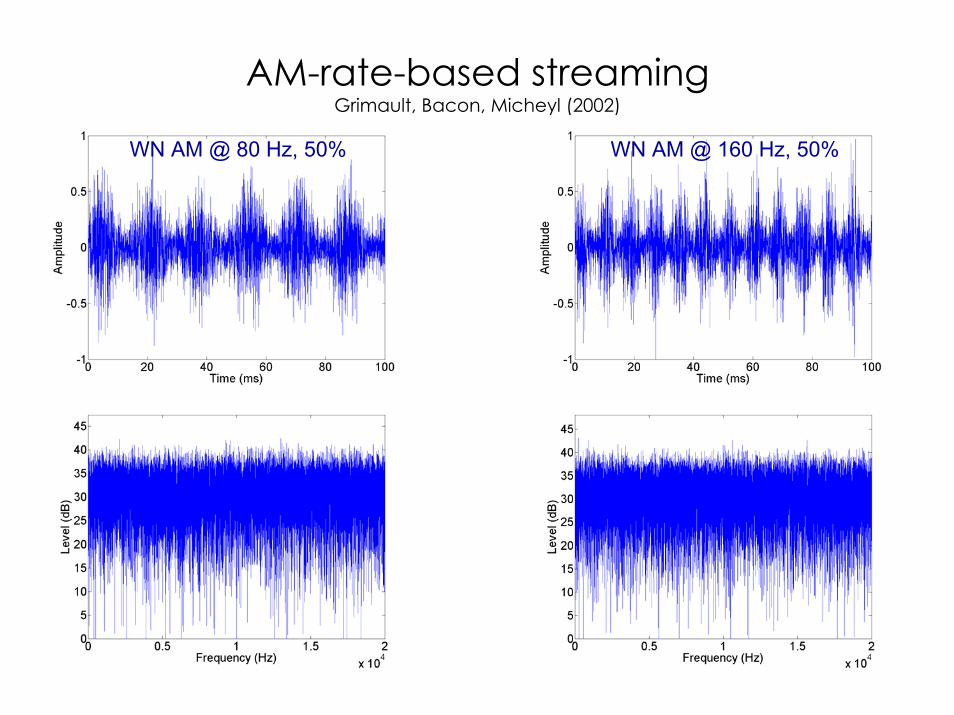
AM-rate-based streamingGrimault, Bacon, Micheyl (2002)
WN AM @ 80 Hz, 50% WN AM @ 160 Hz, 50%

AM-rate-based streamingGrimault, Bacon, Micheyl (2002)
fAMA=80Hz fAMB=fAMA+1.5oct=226 Hz

Phase-based streamingRoberts, Glasberg, Moore (2002)
Harmonics insine phaseφ(n)=0
Harmonics in alternating-phaseφ(n)=0 for odd n φ(n)=0 for even n

Phase-based streamingRoberts, Glasberg, Moore (2002)
F0A=100Hz/SINE F0B= 100Hz/ALT
Conclusion:
The formation of auditory streams is determinedprimarily by peripheral frequency selectivity,
but some streaming may be produced even by sounds that excite the same peripheral channels

Does streaming influenceother aspects of auditory perception?

Stream segregation can help...
Improved recognition of intervleaved melodiesDowling (1973), Dowling et al. (1987),
Hartmann & Johnson (1991), Vliegen & Oxenham (1999),Iverson (1995), Cusack & Roberts (2000), Bey & McAdams (2002)
Frequency
Time
TargetInterferer
?

Improved (pitch) discrimination of target tones separated by extraneous tonesJones, Macken, Harries (1997)
Micheyl & Carlyon (1998) Gockel, Carlyon, & Micheyl (1999)
?F0
Time
TargetInterferers
Stream segregation can help...

Stream segregation can harm...
Detrimental effect on temporal order identificationBregman & Campbell (1971)
Frequency
Time
…
…
?
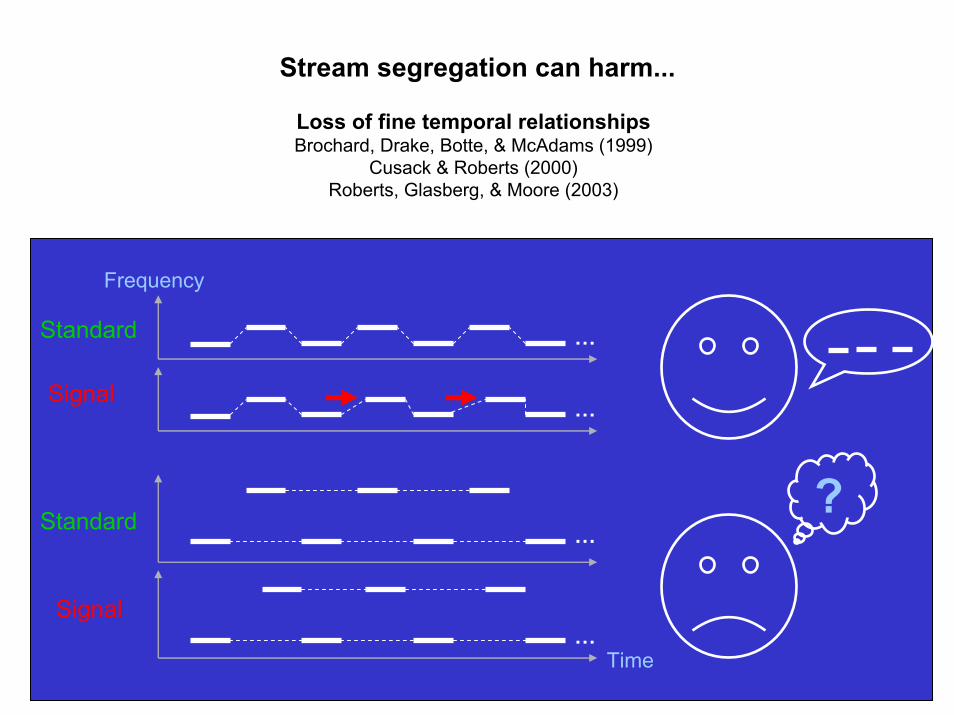
Stream segregation can harm...
Loss of fine temporal relationshipsBrochard, Drake, Botte, & McAdams (1999)
Cusack & Roberts (2000)Roberts, Glasberg, & Moore (2003)
Frequency
Time
…
…
…
…
Standard
Signal
Standard
Signal
?
References
Books, reviews on ASA:- Darwin CJ & Carlyon RP (1995) Auditory grouping. In: Hearing (Ed. BJ Moore), Acad. Press, NY- Bregman (1990) Auditory scene analysis. MIT Press, Cambridge MA.
Misc:- Darwin CJ, Ciocca V. (1992) Grouping in pitch perception: effects of onset asynchrony and ear of presentation of a mistuned component. J Acoust Soc Am. 91, 3381-3390. - Darwin CJ, Gardner RB. (1986) Mistuning a harmonic of a vowel: grouping and phase effects on vowel quality. J Acoust Soc Am. 79, 838-845.
On the neural mechanisms streaming:- Fishman YI et al. (2001) Neural correlates of auditory stream segregation in primary auditory cortex of the awake monkey. Hear Res. 151, 167-187.
Computer models of sound segregation:- Cariani PA (2001) Neural timing nets. Neural Netw. 14, 737-753- de Cheveigne A, et al. (1995) Identification of concurrent harmonic and inharmonic vowels: a test of the theory of harmonic cancellation and enhancement. J Acoust Soc Am. 97, 3736-3748. - Assmann PF, Summerfield Q. (1990) Modeling the perception of concurrent vowels: vowels with different fundamental frequencies. J. Acoust. Soc. Am. 88, 680-697.
Related Documents