Lingnan University Lingnan University Digital Commons @ Lingnan University Digital Commons @ Lingnan University Theses & Dissertations Department of Finance and Insurance 2010 Auditor choice, audit fees and internal governance in family firms Auditor choice, audit fees and internal governance in family firms Shaohua HE Follow this and additional works at: https://commons.ln.edu.hk/fin_etd Part of the Finance and Financial Management Commons Recommended Citation Recommended Citation He, S. (2010). Auditor choice, audit fees and internal governance in family firms (Master's thesis, Lingnan University, Hong Kong). Retrieved from http://dx.doi.org/10.14793/fin_etd.3 This Thesis is brought to you for free and open access by the Department of Finance and Insurance at Digital Commons @ Lingnan University. It has been accepted for inclusion in Theses & Dissertations by an authorized administrator of Digital Commons @ Lingnan University.

Welcome message from author
This document is posted to help you gain knowledge. Please leave a comment to let me know what you think about it! Share it to your friends and learn new things together.
Transcript

Lingnan University Lingnan University
Digital Commons @ Lingnan University Digital Commons @ Lingnan University
Theses & Dissertations Department of Finance and Insurance
2010
Auditor choice, audit fees and internal governance in family firms Auditor choice, audit fees and internal governance in family firms
Shaohua HE
Follow this and additional works at: https://commons.ln.edu.hk/fin_etd
Part of the Finance and Financial Management Commons
Recommended Citation Recommended Citation He, S. (2010). Auditor choice, audit fees and internal governance in family firms (Master's thesis, Lingnan University, Hong Kong). Retrieved from http://dx.doi.org/10.14793/fin_etd.3
This Thesis is brought to you for free and open access by the Department of Finance and Insurance at Digital Commons @ Lingnan University. It has been accepted for inclusion in Theses & Dissertations by an authorized administrator of Digital Commons @ Lingnan University.

Terms of Use The copyright of this thesis is owned by its
author. Any reproduction, adaptation,
distribution or dissemination of this thesis
without express authorization is strictly
prohibited.
All rights reserved.

AUDITOR CHOICE, AUDIT FEES AND INTERNAL GOVERNANCE IN
FAMILY FIRMS
HE SHAOHUA
MPHIL
LINGNAN UNIVERSITY
2010
AUDITOR CHOICE, AUDIT FEES AND INTERNAL GOVERNANCE IN
FAMILY FIRMS
by HE Shaohua
A thesis submitted in partial fulfillment
of the requirements for the Degree of Master of Philosophy in Business
(Finance & Insurance)
Lingnan University
2010
ABSTRACT
Auditor choice, Audit Fees and Internal Governance in Family Firms
by
HE Shaohua
Master of Philosophy
I study the role of auditing in mitigating agency concerns in family firms. Family firms face less severe agency problems due to the separation of ownership and control (Type 1) but more severe agency problems between controlling and non-controlling shareholders (Type 2). As family firms make up a large part of most free enterprise economies it is important to examine these two agency problems with respect to auditor choice and audit effort. I find that family firms are more likely to choose a specialist auditor than nonfamily firms, consistent with the argument that family firms need to signal their non-expropriating behaviors by choosing specialist auditors. I further find that audit fees are lower in family firms compared to non-family firms, consistent with the hypothesis that the Type 1 agency conflict dominates the Type 2 agency conflict in the determination of audit effort and pricing. Moreover, consistent with prior literature that states that effective internal governance demands a quality auditor and more audit effort irrespective of ownership structure, I find that the positive association between family ownership and specialist auditor choice is stronger when internal governance is strong and the negative relation between audit fees and family ownership is weaker when the internal governance is strong. I find that these results on audit fees are robust to the use of alternative measures of concentrated influence such as CEO ownership, inside director ownership, and the presence of one or more founder directors. I also find that the effect of internal governance on audit fees is not limited to one or a few components of internal governance.

DECLARATION
I declare that this is an original work based primarily on my own research, and I warrant that all citations of previous research, published or unpublished, have been duly acknowledged.
(He Shaohua)
May 21, 2010

CERTIFICATE OF APPROVAL OF THESIS
AUDITOR CHOICE, AUDIT FEES AND INTERNAL GOVERNANCE IN
FAMILY FIRMS
by
HE Shaohua
Master of Philosophy
Panel of Examiners:
(Chairman) Prof Phyllis Mo
(External Member) Dr Peter Lau
(Internal Member) Prof Michael Firth
(Internal Member)
Dr Sonia Wong
Chief Supervisor: Prof. Michael Firth
Approved for the Senate:
Prof. Jesús Seade Chairman, Research and Postgraduate Studies Committee
Date
i
TABLE OF CONTENTS
CHAPTERS
Chapter 1. Introduction……………………………………………………………….1
Chapter 2. Literature Review…………………………………………………….. …8
2.1 Studies on Family ownership………………………………………………………..8
2.2 Studies on management ownership……………………………………………….... 9
2.3 Studies on auditor choice………………………………………………………….. 10
2.4 Studies on auditor response and pricing………………………………………… 11
Chapter 3. Hypotheses Development……………………………………………. ...14
Chapter 4. Methodology and Data……………………………………………… …16
4.1 Research methodology……………………………………………………………... 16
4.2 Data sources and sample selection………………………………………………..21
4.3 Descriptive details of the sample…………………………………………………..23
Chapter 5. Hypothesis Tests and Result Analyses…………………………….. …..24
5.1 Univariate tests for audit fees………………………………………………………24
5.2 Testing Hypotheses H1a andH1b………………………………………………….. .24
5.3 Testing Hypotheses H2a and H2b…………………………………………………. .25
5.4 Testing Hypothesis H2c……………………………………………………………. .27
5.5 Additional tests using other measures of concentrated holdings……………...28
5.6 Additional tests where sub-samples are formed based on components of
the internal governance index……………………………………………… … …29
5.7 Additional tests for the effect of firm size on the relationship between
family ownership and audit fees……………………………………………….. …30
5.9 Additional tests for small firms………………………………………………… …31
5.10 Additional test when managerial ownership is very high and
entrenchment is indicated………………………………………………………….32
5.11 Additional test on the benefit of using corporate governance (auditing)
as a signal mechanism for family firms…………………………………………..34
Chapter 6. Conclusion……………………………………………………….. .. ….35
References…………………………………………………………………………..60
ii
LIST OF FIGURES
Figure 1 Audit fees and family ownership under poor and good governance……………...36
LIST OF TABLES
Table 1 Definitions of Variables……………………………………………………………37
Table 2 Sample Details……………………………………………………………………..38
Table 3 Correlation matrix……………………………………………………………….....41
Table 4 Difference in audit fees between firms with and without concentrated holdings…43
Table 5 Family ownership and specialist auditor choice: OWN = Family/FamilyPlus…...44
Table 6 Family ownership and audit fees: OWN = Family/FamilyPlus…………………..45
Table 7 Family ownership and specialist auditor choice: OWN = Family………………..46
Table 8 Family ownership and specialist auditor choice: OWN = FamilyPlus…………...47
Table 9 Family ownership effect separated into good and poor CG sub-samples:
OWN = Family…………………………………………………………………….48
Table 10 Family ownership effect separated into good and poor CG sub-samples:
OWN = FamliyPlus………………………………………………………………..49
Table 11 The joint effect of family control and good corporate governance on audit fees..50
Table 12 Specialist auditor premiums: OWN = Family……………………………………51
Table 13 Other measures of concentrated holdings: OWN = CEO Holdings/
Insider holdings………………….………………………………………………..52
Table 14 Results of regressions with different measures of family ownership separated
into good and poor corporate governance firms using disaggregated
components of CG: OWN = Family……………………………………………..53
Table 15 Large and small family firm and audit fees: OWN = Family…………………….55
Table 16 Family ownership and specialist auditor choice in the small firms:
OWN = Family…………………………………………………………………..56
Table 17 Joint effect of family ownership and good corporate governance on
audit fees in the small firms……………………………………………………...57
Table 18 Entrenchment test: Effect of concentrated family ownership in the sub-sample
where CEO ownership is in the highest quartile: OWN = Family……………….58
Table 19 Ordered logistic regression of S&P Long-Term Credit Rating on Family
ownership: OWN=Family…………………………………………………….......59

iii
Acknowledgement I am especially grateful to Prof. Michael Firth and Prof. Bin Srinidhi, for their thorough guidance on my thesis. I thank participants at the conference on Financial reporting, auditing and governance (April 2010) at Lehigh University for their comments and suggestions. I also appreciate the financial support provided by Lingnan University, which makes it possible for me to complete my studies. Finally, I want to thank my family for their love and encouragement.
1
Auditor choice, Audit Fees and Internal Governance in Family Firms
Chapter 1. Introduction
Auditing has long been identified as playing a governance role in mitigating the
agency concerns in firms. Jensen and Meckling (1976) hypothesize that auditing
increases the value of the firm by reducing the incentive problems that arise when the
manager does not own all the residual claims of the firm (Watts and Zimmerman
1983). Using a semi-structured interview, Cohen et al. (2002) show that auditors
consider corporate governance as an important determinant of the audit process and
plan their audit to mitigate the adverse effects of poor governance. The governance
role of the external audit is also recognized by regulators (See the Security and
Exchange Commission (SEC 1999) pronouncement on audit committee disclosure).
The Sarbanes Oxley Act of 2002 established Public Company Accounting Oversight
Board (PCAOB) as a new entity to oversee the audits of public companies with the
explicit purpose of protecting the interests of their investors by producing
informative, accurate, and independent audit reports. In the academic literature and
regulatory pronouncements, auditing is recognized as an important element in
reducing the information asymmetry between managers and investors. The auditing
and accounting standards that form the basis of an audit are both designed to provide
credible information to investors.
However, the corporate governance role of auditors in reducing the agency
conflict between different classes of investors is less clear. Auditing standards
address the issue of inter-investor information asymmetry only indirectly. For
example, SAS 45 requires auditors to “place primary emphasis” on the adequacy of
disclosure with regard to related party transactions. SAS 57 requires auditors to
evaluate the reasonableness of management estimates if they affect financial
statements. PCAOB’s Auditing Standard 5 requires auditors to evaluate the firm’s
2
controls with regard to potential material misstatements due to fraud and the
possibility of management override of existing controls. One could argue that the
disclosure of related party transactions helps reduce the information asymmetry
between controlling shareholders who might indulge in such transactions and non-
controlling shareholders who might be hurt by them. Paying particular attention to
managerial override of controls also reduces insiders’ ability to indulge in
expropriating behavior. However, these standards do not change the primary
mandate of auditors, which is to reduce the information asymmetry between
managers and investors.
Although there is no direct mandate on auditors to address the inter-investor
agency conflict, there is prior evidence that auditors help in mitigating these concerns.
In the context of initial public offerings, many studies have shown that auditors
reduce the informational differences between informed inside investors and the
external investors to whom the stock is offered (Michaely and Shaw 1995; Beatty
1989; Menon and Williams 1991; Weber and Willenborg 2003). Auditors have been
shown to help mitigate the agency concerns of foreign investors in privatized firms
(Guedhami and Pittman 2006; Guedhami et al. 2009). In their study of East Asian
economies, Fan and Wong (2005) show that the auditor can limit the ability of
insider investors to manipulate accounting reports and hide any expropriation from
external investors. Further, auditors can discourage self-dealing activities by insiders
by pressing for improved disclosures of related party transactions.
The abovementioned studies suggest that auditors have the capability to
improve corporate governance by reducing the agency concerns between informed
and uninformed investors. But do they have the incentive to expend effort and other
resources in the face of a highly competitive audit market? In the absence of explicit
auditing standard requirements, auditors need other specific contextual incentives to
devote effort and resources to reducing agency concerns between informed and
uninformed investors. In the initial public offering context, inside investors need to
attract capital from the external investors and are therefore motivated to reduce
3
informational differences between them and external investors. They are therefore
likely to demand that the auditors decrease the information asymmetry between the
inside investors who currently hold the shares and the outside investors who need to
be attracted to buy the shares during and after the offering. This demand provides the
requisite specific motivation for auditors to play a corporate governance role.
In the context of concentrated family ownership, the controlling owners might
voluntarily choose auditing as a bonding mechanism (Jensen and Meckling 1976).
The family owners would then provide the requisite motivation for the auditors to
mitigate the agency concerns of non-family shareholders. On the other hand, if the
private control benefits of family investors are higher than the benefits they obtain
from bonding, they will not direct the auditors to reduce the information asymmetry
between them and non-family investors. Family investors are influential in
appointing the auditor, maintaining the contract and deciding their fees. In a
competitive audit market, where there is no general mandate for auditors to reduce
the agency concerns of minority investors, auditors are unlikely to voluntarily devote
their effort and resources to do so against the wishes of family investors. In effect,
even though the auditors might have the ability to mitigate the agency problem
between controlling and non-controlling investors, the question remains as to
whether they have sufficient incentive to do so. We argue that if a family firm
appoints a strong, independent and effective board of directors, the bonding effect is
more likely to prevail. On the other hand, if the board is not as strong, the private
benefits effect is more likely to prevail.
In this thesis, I address the role of auditors in mitigating the two
abovementioned agency conflicts by examining the effect of family ownership on
auditor choice and audit effort. I find a positive association between family
ownership and specialist auditor choice, and a negative association between family
ownership and audit effort at the aggregate level. I then examine whether these
relationships are different under different levels of board effectiveness in the second
stage. I find that a positive association between family ownership and specialist

4
auditor choice is stronger when the board is more effective and that the negative
association between family ownership and audit effort is weaker when the board is
more effective.
My use of family firms for addressing this issue is motivated by two reasons.
First, although ownership is more dispersed in the U.S. than in many other countries,
nearly a third of the firms in S&P 500 index are characterized by founding family
involvement (Anderson and Reeb 2003; Wang 2006), which allows me to examine
the issue in a large sample of firms. Second, family controlled firms face less severe
agency problems that arise from the separation of ownership and management
(referred to as the Type 1 agency problem) but are characterized by more severe
agency problems between controlling and non-controlling shareholders (referred to
as the Type 2 agency problem)1. Investors face a less severe Type 1 agency problem
because the controlling family is better informed about the operations of the firm and
is therefore better able to directly monitor the value-relevance of managerial actions
and decisions (Demsetz and Lehn 1985). This enables family firms to depend less on
accounting reports to evaluate the performance of managers and, correspondingly,
the managers feel less able to mislead the dominant investors by hiding the results of
poor performance by opportunistically choosing accounting methods and estimates.
Logically then, the auditors could save on verification procedures and costs, a fact
that is likely to be reflected in lower audit fees in a competitive audit market2. On the
other hand, the significant extent to which the family owns stock and controls board
directors results in higher Type 2 agency problems (Anderson and Reeb 2003, 2004).
Type 2 agency problems include the expropriation and enjoyment of private control
benefits (such as related party transactions) by the family members, which might
induce them to mislead non-family investors through accounting reports (Leuz et al.
2003). This possibility should result in a greater demand for audit effort by those
1 The reduction of the Type 1 agency problem is often referred to as the “alignment effect” and the exacerbation of the Type 2 agency problem is referred to as the “entrenchment effect”(Wang 2006). 2 After the AICPA changed its code of ethics in 1979 and allowed free advertising by auditors, auditors faced increased competition at all levels (Sunder 2003).
5
family firms that want to allay fears of Type 2 agency problems. In effect, in the case
of family controlled firms, two forces are at work on the audit fee: a decrease
brought about by the lower level of Type 1 agency problem and an increase brought
about by the higher level of Type 2 agency problem.
The effect of the trade-off between the two agency problems on auditor effort
hinges on the incentives that the controlling family shareholders have for bonding
behavior. If the controlling owners find that the gains from hiding private control
benefits through less transparent reporting (Leuz et al. 2003) is lower than the gain
from transparent reporting to minority shareholders, they are more likely to engage in
bonding behavior. As part of their bonding behavior, they are more likely to have
more effective internal governance3 in place (Linck et al. 2008; Boone et al. 2007;
Raheja 2005). In these firms, auditing will be used as a complementary mechanism
to signal higher transparency and less expropriation by controlling shareholders. In
order to support the bonding behavior, auditors will be expected by the family
owners to improve transparency and mitigate the agency problem between them and
the non-family shareholders. In this situation, even though less audit effort is needed
to mitigate the Type 1 agency problem, it is compensated for by more audit effort
that is needed to mitigate the Type 2 agency problem. Therefore, the audit effort
demanded of the auditor is not necessarily reduced because of concentrated family
ownership, resulting in a weaker relation between family ownership and audit fees.
In contrast, in firms where the controlling insiders do not undertake board-based
monitoring, auditors are less motivated to mitigate the Type 2 agency cost. In those
firms, the negative relationship between family ownership and audit fee will be
accentuated.
My examination of the relationship between auditor choice (audit fees) and
family ownership confirms the above relationships. In the aggregate analysis, I find a
3 We use the term “internal governance” to denote board-based, committee-based and other internal mechanisms to improve transparency. We differentiate this type of governance from the “external” market-based governance that arises from the market for corporate control, product competition, and other market forces.
6
positive association between family ownership and specialist auditor choice,
consistent with the signaling incentive of family owners, and a negative relation
between family ownership and audit fee, consistent with the argument that the
reduction of the Type 1 agency problem outweighs the increase of the Type 2 agency
problem. I surmise from these results that the mandated role of the auditor in
mitigating the Type 1 agency problem between managers and investors drives audit
effort more than the role of auditors in reducing the Type 2 agency problem between
controlling and non-controlling shareholders. In the differential analysis, consistent
with my expectation, I find that the positive association between family ownership
and specialist auditor choice is stronger for firms with a stronger board, and that the
negative relationship between audit fee and family ownership is weaker for firms that
have stronger board-based monitoring. I measure overall board-based monitoring
strength using indices based on Larcker and Richardson (2004) and Carcello et al.
(2002). I repeat the analysis with several components of board-based monitoring
effectiveness and obtain similar results. Based on these results, I surmise that in
situations where family controlled firms take steps to signal their transparency by
having boards with strong monitoring effectiveness and choosing specialist auditors,
auditors indeed play a governance role in mitigating the Type 2 agency problem.
My findings contribute to the current literature in several ways. It brings
together the results of three strands of research: the role of auditors in mitigating the
Type 1 agency problem between managers and investors; the moderating effect of
ownership structure in auditors’ mitigation of the Type 1 agency problem (Gul et al.
2003), and the governance role of auditors in mitigating the Type 2 agency problem
(Fan and Wong 2005). My findings suggest that the auditors have the capability to
mitigate the Type 2 agency problem but do not have a mandate to do so in a normal
audit. However, given the proper incentives, auditors can mitigate the Type 2 agency
problem. In this sense, my research complements the studies on an auditor’s role in
initial public offerings or in privatized firms seeking foreign investors alluded to
earlier. My results validate the hypothesis that in some family firms that undertake
7
bonding effort, auditors are motivated to mitigate the Type 2 agency problem. By
integrating the results of these three strands of literature, my study helps us to
understand the complex interactions between auditing, governance, and ownership
structure.
The next chapter provides a brief review of supporting literature and chapter 3
develops the hypotheses. The fourth chapter describes the research methodology and
data. Chapter 5 describes the empirical results and discussions thereon. The last
chapter presents my conclusions.

8
Chapter 2. Literature Review
2.1 Studies on Family ownership
Current literature on family ownership focuses on (i) the firm performance
effect, and (ii) the disclosure effect. If family ownership is not the result of a demand
for governance, it could be considered exogenous and could result in a reduction of
Type I agency conflicts, which in turn enhances firm performance (Jensen and
Meckling 1976). Several studies document this improvement in performance
(Anderson and Reeb 2003; Yermack 1996). On the other hand, the performance of
family firms might be compromised because of tensions between family and business
objectives (Lansberg 1983; Levinson 1971; Barnes and Hershon 1976) and the
smaller pool of talent from which managers are selected (Burkart et al. 2003). The
firm performance effect is studied by Villalonga and Amit (2006) who find that
family ownership in Fortune-500 firms creates value when the founder serves as
CEO of the family firm or as chairman with a hired CEO but not when heirs who
succeed the founder serve as CEOs. Miller et al. (2007) find that the effect of family
ownership on firm performance relies on the way in which family businesses are
defined. Particularly in Fortune 1000 firms, including relatives as owners or
managers shows they do not outperform in terms of market valuation whereas
businesses with a lone founder outperform. To sum up, the effect of family
ownership on performance seems to depend critically on whether the founder or
successors are in charge.
Theoretically, the mitigation of the Type 1 agency problem reduces the ability
of managers to hide their performance by being less transparent. In turn, this could
lead to higher quality of earnings and greater disclosure of investor-relevant
information. On the other hand, if the family owners enjoy private control benefits,
they have an incentive to be less transparent (Leuz et al. 2003). Therefore, the effect
of family ownership on corporate disclosure cannot be unambiguously predicted. Ali
9
et al. (2007) find that family firms report earnings that are more predictive of future
cash flows and less distorted by opportunistic discretionary accruals compared to
non-family firms. They also find that family firms are more likely to warn investors
about bad news but are less likely to make voluntary disclosures about their
corporate governance practices. Family firms also seem to attract more analysts and
reduce analyst forecast dispersion and error. Their findings suggest that the effect of
the reduced Type 1 agency problem dominates the potential increase in the Type 2
agency problem with regard to disclosures. In a study that supports these findings,
Wang (2006) also shows that the earnings of family-owned firms exhibit higher
quality, lower abnormal accruals, greater informativeness and fewer transitory
components compared to non-family firms. In contrast to the above two papers,
Anderson et al. (2009) find that family firms are more opaque than non-family firms
and attribute this opacity to extraction of private control benefits by family firms.
2.2 Studies on management ownership
A large number of studies have focused on the effect of management ownership
on performance, disclosures, earnings quality, and auditing. Managerial or CEO
ownership aligns managers’ interest with that of the shareholders and thereby has the
direct effect of reducing the Type 1 agency problem (Jensen and Meckling 1976)4. In
contrast to family ownership, managerial ownership has no direct link to the Type 2
agency problem. In effect, a comparative study of CEO ownership and family
ownership has the advantage of suggesting the incremental effect of Type 2 agency
problem that applies only to family ownership.
Using a sample of US firms, Warfield et al. (1995) show a higher information
content of earnings and lower discretionary accruals in firms with high managerial
4 Management ownership can also lead to entrenchment when the market for corporate control is curtailed by the adoption of poison pills and other antitakeover devices (Almazan and Suarez 2003; Barnhart et al. 2000; Claessens et al. 2002; Hu and Kumar 2004) or when managerial ownership exceeds a certain threshold (Yeo et al. 2002).
10
ownership. However, Cheng and Warfield (2005) indicate more earnings
management in firms with high managerial stock ownership. In non-US markets,
some studies (Gul et al. 2003; Gul et al. 2002; Jung and Kwon 2002) document the
positive role of managerial/insider ownership on disclosure, while other studies (Oei
et al. 2008; Gabrielsen et al. 2002; Yeo et al. 2002; García-Meca and Sánchez-
Ballesta 2009) provide mixed evidence.
2.3 Studies on auditor choice
Prior studies have investigated the effect of ownership on auditor choice. Wang
et al. (2008) find a negative relationship between state ownership and “Big auditor”
choice in the China. Guedhami et al. (2009) report that privatized firms worldwide
become less (more) likely to appoint a Big Four auditor as state (foreign) ownership
increases. Fan and Wong (2005) document a positive relationship between the Big
auditor choice and the wedge of vote-cash flow rights in East Asia companies, thus
showing how Asian family firms signal their motivations to small investors. To sum
up, given the expectation of small investors that controlling shareholders expropriate
assets and resources away from the firms, controlling shareholders (state or family)
need to signal their incentives by the Big auditor choice when the benefit of doing so
outweighs the cost.
Several studies examine the effect of internal governance on auditor choice.
Hossain et al (2010) find firm-level internal governance is positively related to the
firm’s Big N auditor choice in emerging markets. Lin and Liu (2009) report that
strong internal governance has a positive effect on the Big N auditor choice in the
China. In total, prior studies on non-US markets record a positive relationship
between internal governance and the Big auditor choice.
2.4 Studies on auditor response and pricing
11
Several studies have examined the role of auditors in mitigating the Type 1
agency problem that results in information asymmetry between managers and
investors. Of particular relevance to our study is Gul et al. (2003) who show that (i)
auditors respond to discretionary accruals by increasing their effort and hence the
fees charged the client; and (ii) that the relation between discretionary accruals and
audit fees is weaker for firms with high management ownership. They interpret this
result to mean that in firms with high managerial ownership, there is less Type 1
agency problem and therefore there is less need for managers to opportunistically
manage their earnings. Instead, the discretionary accruals estimated by managers are
more likely to be value-relevant and therefore the auditors need to spend less
verification and validation effort in auditing those accruals. Other studies (Teoh and
Wong 1993; Gul 2006) also support the positive role of the auditor in mitigating the
Type 1 agency problem.
Prior studies have also shown that auditors respond to the quality of disclosures
by the firm. In fact, this is the assumption behind many studies on auditor
independence (Frankel et al. 2002; Larcker and Richardson 2004; Ashbaugh et al.
2003) that use discretionary accruals as the indicator of audit quality. In other words,
the assumption is that if the audit quality is good (the auditor is independent), the
discretionary accruals will be lower. More directly, Bedard and Johnstone (2004)
find that auditors plan more hours and increase billing rates in the face of earnings
management risk. This is consistent with the current literature that links auditor effort
to litigation risk (Simunic and Stein 1996; Pratt and Stice 1994; Simon and Francis
1988) on the one hand, and earnings management to litigation risk on the other hand
(Heninger 2001; Barron et al. 2001). Abbott et al. (2006) show that due to
asymmetric litigation effects, audit fees are related more to the positive rather than to
negative earnings management risk. Consistent with Simunic’s production view of
auditing (Simunic 1980), these studies show that risk factors such as lax disclosure
and earnings management by the client firm result in a higher “supply” of audit effort,
resulting from the motivation of auditors to limit their litigation and reputation risks.
12
These studies support the view that in firms where the Type 1 agency cost is low as
in the case of family firms and firms with high managerial ownership, auditors scale
back their effort and this is reflected in lower audit fees.
The interaction between corporate governance and auditing is more complex
than the production view of auditing would have us believe. Hay et al. (2006) argue
that the pure production function view of auditing requires that the audit market be
competitive and that the level of assurance delivered is constant for a given auditor
across client firms. The first condition makes audit fees a function of the cost and the
second condition gives a unique level of assurance at which the expected cost of
auditor’s risk from not providing the marginal unit of assurance (due to litigation and
reputation risks faced by the auditor) is equated to the production cost of providing
the marginal unit of assurance. However, the second condition might not be satisfied
because the boards in different firms might demand incrementally different levels of
auditing (Carcello et al. 2002). Similarly, I argue that the context (e.g., bonding or
private benefits) might determine the incremental audit effort required from the
auditor. Knechel and Willekens (2006) argue that these demand factors alter the
audit effort provided by the auditor. In effect, the corporate governance effort
required of the auditor is related more to the demand by the board rather than to the
production function of the auditor, which is determined by auditing standards,
litigation, and reputation risks.
Prior studies have documented the effect of ownership on audit fees. Mitra et al.
(2007) show that institutional and management ownership is negatively associated
with audit fees. The negative association between managerial ownership and audit
fees is also shown in the international context by Nikkinen and Sahlstrom (2004).
Vafeas and Waegelein (2007) show a negative relationship between insider
ownership and audit fees.
13
Chapter 3. Hypotheses Development
I use the evidence from prior studies and the aforesaid arguments to develop the
hypotheses on the effect of family ownership and internal governance on auditor
choice and audit fees.
Fan and Wong (2005) indicate that firms are more likely to signal their non-
expropriating incentives by choosing a quality auditor when they face agency
conflicts from the wedge between voting rights and cash flow rights. Given that
nonfamily investors expect family owners to expropriate and then discount the stock
price, family firms are more likely to choose specialist auditors to signal to the
nonfamily investors about their non-expropriation motivation compared to nonfamily
firms that do not have so serious Type 2 agency problems as the family firms do. I
thus put forward the following hypothesis:
Hypothesis H1a: all else equal, family firms are more likely to choose specialist
auditors than nonfamily firms.
From Ali et al. (2007) discussed above, I expect that the effect of Type 1 agency
problem dominates the Type 2 agency problem for family firms in the auditor’s
pricing of their services. Based on the arguments presented earlier, I formulate the
following hypothesis on the aggregate relation between family ownership and audit
fees.
Hypothesis H1b: all else equal, audit fee for family firms is lower than for non-family
firms.
14
My discussion of the prior literature on the response of auditors to the presence
of different levels of board effectiveness indicates that for family firms for which
insiders’ private benefits are dominated by the need to signal transparency to
minority shareholders, the positive relationship between specialist auditor choice and
family ownership should be stronger and the negative relation between audit fee and
family ownership should be weaker. On the other hand, for family firms for which
the insiders’ private benefits dominate the need to signal transparency to minority
shareholders, the positive relationship between specialist choice and family
ownership should be weaker and the negative relation between audit fee and family
ownership should be stronger. Based on this reasoning, I hypothesize the following
differential relation between specialist auditor choice/audit fee and family ownership
in the presence of differential board strengths.
Hypothesis H2a: all else equal, the positive relation between specialist auditor
choice and family ownership is stronger in the presence of stronger boards
compared to firms with weaker boards.
Hypothesis H2b: all else equal, the negative relationship between audit fee and family
ownership is weaker in the presence of stronger boards compared to firms with
weaker boards.
Furthermore, the strong board and good governance practices help reduce the
reputation and litigation risks that specialist auditors face and therefore the specialist
premiums are relatively lower than in other firms with weak internal governance. I
thus put forward the following hypothesis:
Hypothesis H2c: all else equal, the specialist auditor premium is smaller in the
presence of stronger boards compared to firms with weaker boards.
15
Chapter 4. Methodology and Data
4.1 Research methodology
My basic specialist auditor choice model is similar to the auditor choice model
used by Fan and Wong (2005) that controls for the following well-documented
factors: (i) the scale and scope of the audit measured by the client firm size; (ii) audit
risk captured by two variables, the firm’s financial leverage and its return on assets.
To test H1a, I employ the following model:
SPECIALIST = β0 + β1LNMVE + β2LEVE + β3ROA + β4OWN
+ Industry effects + Year effects +ε (1)
In the above model, OWN = Family or FamilyPlus is the experimental variable.
Family is coded one if firm has family ties which go back a generation or two to the
founder and play a key role in both ownership (≥20%) and board membership.
FamilyPlus is coded one if Family is valued one or the firm has at least one founder
who sits in the board as well as there being dual class stock that creates a wedge
between cash flow rights and control rights in the firm. If the coefficient β4 is
positive and significant in the corresponding regressions, it validates Hypothesis H1a.
Some earlier studies, such as Anderson and Reeb (2003, 2004) and Ali et al.
(2007), do not impose a minimum ownership criterion for identifying a firm as a
family firm. Hutton (2007) gives examples from the Ali et al. (2007) sample where
the family influence is quite low – like Percy Chubb who was a non-voting director
on Chubb Co. directors. While Percy Chubb is a descendent of Chubb Co.’s founder,
his share ownership in the firm is extremely low. It is debatable whether one could
argue that the family has incentives to monitor the managers very carefully if they do
not have significant ownership stakes. Other studies such as Ang et al. (1992),
16
Barontini and Capiro (2005), Barth et al. (2005), impose significant threshold
restrictions either on ownership or voting rights or both.
Prior literature has shown that founder presence on the board seems to reduce
agency costs more than heir presence. What seems to matter is the incentive and
interest that the family has in the firm. A high ownership stake signals such interest
and incentive. Based on earlier literature on management ownership, auditor
response (audit effort) can be expected in case of concentrated ownership. Therefore,
I use the definition of family firm using a threshold restriction.
My basic audit fee model, based on the theoretical constructs of Simunic (1980)
is similar to the one used by Ashbaugh et al. (2003) that controls for the following
well-documented factors: (i) client firm’s auditor choice measured by an indicator
variable for the Big-4 auditors; (ii) the scale and scope of the audit measured by the
client firm size; (iii) the complexity of the audit measured by the ratio of market to
book value of equity using the reasoning that intangible growth options are included
in the firm’s market value of equity but not in its book value; (iv) demand for
additional audit work unrelated to ownership structure, measured by two variables –
an indicator variable for merger or acquisition activity and a financing indicator
variable that captures material capital infusion in the form of either debt or equity;
and (v) audit risk captured by five variables - the firm’s financial leverage, the return
on assets, the amount of inventory and accounts receivables relative to total assets, an
indicator variable for loss-making firms, and an indicator variable if the firm reports
special items. Firm performance variables such as ROA, market-to-book ratio, and
the indicator variable for loss affect a myriad of risk factors such as litigation risk,
reputation loss, and the potential for financial distress. Consistent with Simunic
(1980) and Ashbaugh et al. (2003), I also include industry dummies as control
variables. Additionally, I include year dummies to account for secular changes in
audit fees over time.
To test H1b, I include an indicator variable for family ownership and/or
influence in addition to the controls mentioned above. The model is:
17
LNFEE = β0 + β1BIG + β2LNMVE + β3MA + β4FINANCING + β5MB + β6LEVE
+ β7ROA + β8INVREC + β9LOSS + β10SPECIAL + β11OWN
+ Industry effects + Year effects + ε (2)
In the above model, OWN (= Family or FamilyPlus) is the experimental
variable. In addition, we also examine the effect of CEO Holdings, Insider Holdings
(the fraction of outstanding shares held by insider directors) and Founder (indicator
variable if one or more of the directors are the founder(s) of the firm). The dependent
variable, LNFEE is the log of audit fees. The full definitions of the dependent,
control, and experimental variables are given in Table 1. If the coefficient β11 is
negative and significant in the corresponding regressions, it validates Hypothesis
H1b.
Insert Table 1 here
To test hypothesis H2a and H2b, I need to measure the strength of the internal
corporate governance that is independent of the ownership structure. Although there
is extensive research on the role of internal corporate governance such as board
effectiveness and CEO power, only recently have there been some attempts to
aggregate these into indices in a manner similar to the shareholder rights governance
index proposed by Gompers et al. (2003). I use two indices to measure this strength.
I base the first index on Carcello et al. (2002) who show that the audit fee is
positively associated with effective boards. In particular, they show that board
independence measured by the percentage of independent directors on the board, the
board diligence measured by the number of meetings attended, and board expertise
measured by the number of outside directorships held in other corporations by non-
management directors are all positively associated with the audit fee. I build on their
model and use an index (GIndexI) that aggregates the following: board independence

18
(measured as the percentage of outside directors); board diligence (measured as the
number of meetings held 5 ); audit committee independence (measured by the
percentage 6 of non-affiliated outside directors on the audit committee); board
expertise (measured as the percentage of financial experts on the board + number of
directorships held by outside directors); and (negative) CEO power (indicator
variable if CEO is also the chairman or founder or sole insider). Carcello et al. (2002)
provide justification for including board independence, board diligence and the
number of directorships held by board numbers; Abbott et al. (2003) provide
justification for audit committee independence; Carcello et al. (2006) and Krishnan
and Visvanathan (2009) provide justification for including financial expertise
separately in the board expertise variable; Gul and Leung (2004) and García-Meca
and Sánchez-Ballesta (2009) provide justification for including CEO power7. I scale
all the governance variables to range from 0 to 1, add them to get a total measure of
CG, and adjust for the industry-year mean of the total measure to obtain the index8
and classify the firms that have above-median index as “Good CG” firms and those
with below-median index as “Poor CG” firms.
My second index (GIndexII) is based on Larcker et al. (2007). Their index spans
a larger number of factors. For example, the board independence variable includes
the percentage of female directors, which is consistent with the finding that boards
with female directors monitor company management more closely (Adams and
Ferreira 2009), have less earnings management (Gul et al. 2007), and demand more
auditing (Gul et al. 2008). Consistent with their analysis, I aggregate the following in
my construction of the index: board independence (measured as the percentage of
5 All variables that are not indicator variables or fractions are scaled to a value between 0 and 1 by dividing by the maximum value obtained in the sample. 6 The terms percentage and fraction are used interchangeably and denote the fraction between 0 and 1. 7 The use of CEO Power rather than CEO duality is based on Dechow et al. (1996). 8 Use of principal component analysis instead of simple aggregation does not change the result. It is not clear whether a different weighted aggregation of these factors gives a better indication of internal corporate governance. Therefore, we present the results using simple aggregation. The results based on principal component analysis of CG are available and will be provided on request.
19
outsiders – percentage of affiliated directors + percentage of female directors); board
diligence (measured as the scaled number of meetings held + fraction of directors
who attend more than 75% of the meetings); board experience (measured as the
tenure given by the average number of years the directors have served on the board +
percentage of directors who are above 70 years of age); board and audit committee
sizes (board size + audit committee size); the busy directors (fraction of outside
directors who serve on four or more boards + fraction of inside directors who serve
on two or more other boards), and the (negative) CEO power. As in the case of
GIndexI, I add these variables to obtain the index and classify the firms that have
above-median index as “Good CG” firms and those with below-median index as
“Poor CG” firms.
I run the regression equations (1) and (2) on both the poor CG and good CG
sub-samples using GIndexI and GIndexII separately. Hypothesis H2a will be
satisfied if the coefficient β4 in specialist choice model (equation1) is significantly
positive for the good CG sub-sample but not for the poor CG sub-sample and
Hypothesis H2b will be satisfied if the coefficient β11 in the audit fee model (equation
2) is significantly negative for the poor CG sub-sample but not for the good CG sub-
sample.
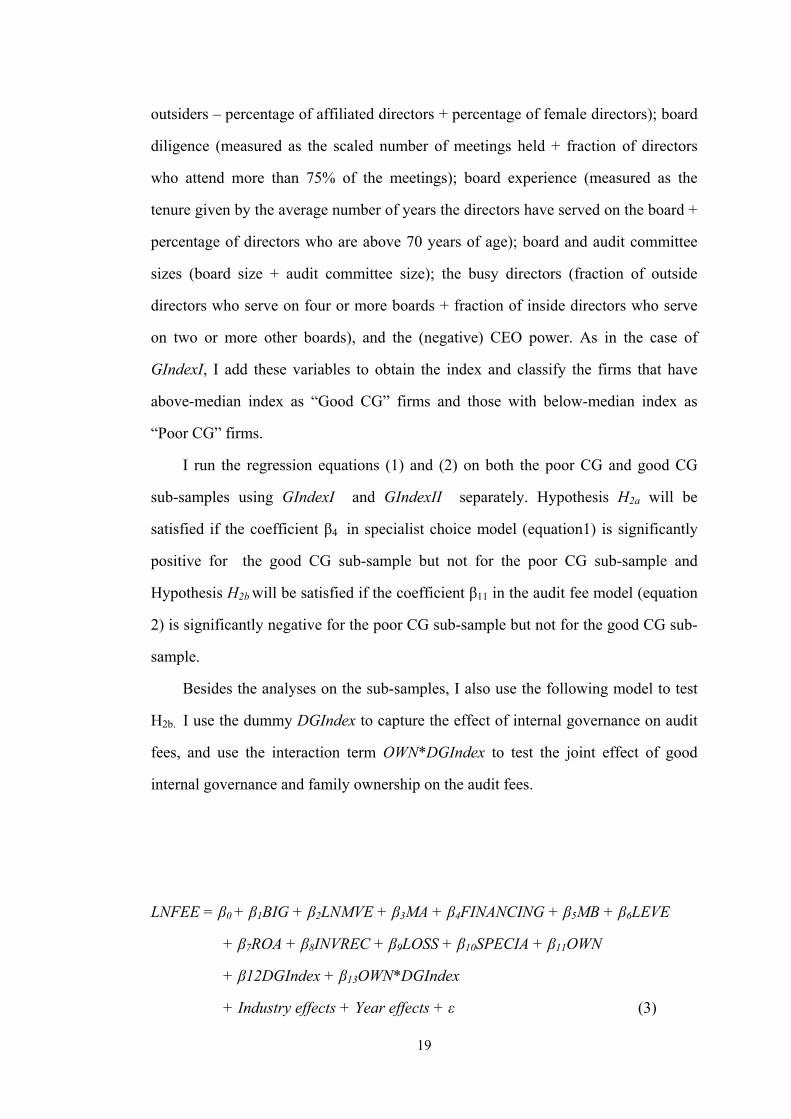
Besides the analyses on the sub-samples, I also use the following model to test
H2b. I use the dummy DGIndex to capture the effect of internal governance on audit
fees, and use the interaction term OWN*DGIndex to test the joint effect of good
internal governance and family ownership on the audit fees.
LNFEE = β0 + β1BIG + β2LNMVE + β3MA + β4FINANCING + β5MB + β6LEVE
+ β7ROA + β8INVREC + β9LOSS + β10SPECIA + β11OWN
+ β12DGIndex + β13OWN*DGIndex
+ Industry effects + Year effects + ε (3)
20
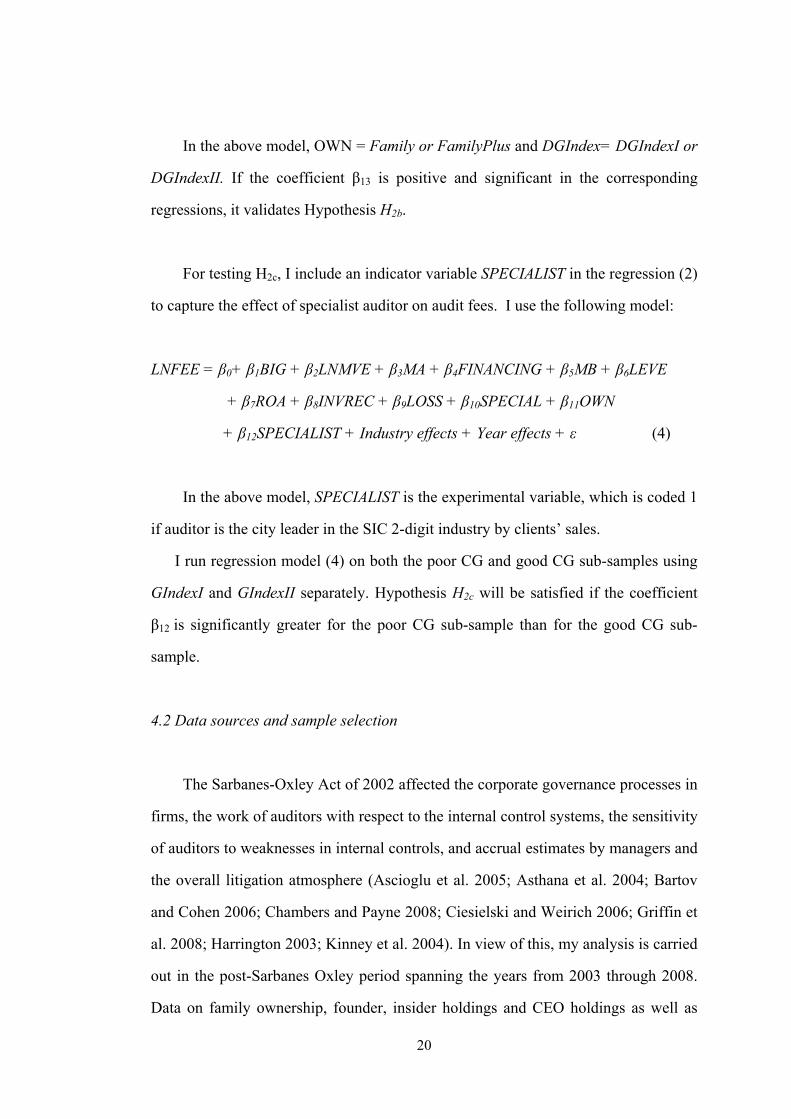
In the above model, OWN = Family or FamilyPlus and DGIndex= DGIndexI or
DGIndexII. If the coefficient β13 is positive and significant in the corresponding
regressions, it validates Hypothesis H2b.
For testing H2c, I include an indicator variable SPECIALIST in the regression (2)
to capture the effect of specialist auditor on audit fees. I use the following model:
LNFEE = β0+ β1BIG + β2LNMVE + β3MA + β4FINANCING + β5MB + β6LEVE
+ β7ROA + β8INVREC + β9LOSS + β10SPECIAL + β11OWN
+ β12SPECIALIST + Industry effects + Year effects + ε (4)
In the above model, SPECIALIST is the experimental variable, which is coded 1
if auditor is the city leader in the SIC 2-digit industry by clients’ sales.
I run regression model (4) on both the poor CG and good CG sub-samples using
GIndexI and GIndexII separately. Hypothesis H2c will be satisfied if the coefficient
β12 is significantly greater for the poor CG sub-sample than for the good CG sub-
sample.
4.2 Data sources and sample selection
The Sarbanes-Oxley Act of 2002 affected the corporate governance processes in
firms, the work of auditors with respect to the internal control systems, the sensitivity
of auditors to weaknesses in internal controls, and accrual estimates by managers and
the overall litigation atmosphere (Ascioglu et al. 2005; Asthana et al. 2004; Bartov
and Cohen 2006; Chambers and Payne 2008; Ciesielski and Weirich 2006; Griffin et
al. 2008; Harrington 2003; Kinney et al. 2004). In view of this, my analysis is carried
out in the post-Sarbanes Oxley period spanning the years from 2003 through 2008.
Data on family ownership, founder, insider holdings and CEO holdings as well as

21
board information regarding the directors are obtained from the Corporate Library’s
Board Analyst database. The Board Analyst provides data on family ownership only
from 2004 to 2008. I assume that if a firm is family-controlled in 2004, it is also
family controlled in 20039. Board Analyst offers coverage for public companies of
the S&P 500, S&P MidCaps 400, S&P SmallCaps 600, Fortune 1000, Russell 3000
and S&P/TSX 60. By giving coverage to midcaps and small caps, the database has
reduced the large company bias10. For the period from 2003-2008, we get an initial
sample of 15,479 firm-year observations. After subtracting the firm-years for which
the ownership data (family, CEO, insider or founder) are missing (979 cases), we are
left with 14,500 firm-year observations.
Data on audit fees are obtained from the AuditAnalytics database. In the sample
of 14,500 observations obtained from Corporate Library, 258 are missing from
AuditAnalytics which leaves us with a sample of 14,242. Subtracting the missing
observations on board meetings and financial experts on the audit committee (273
cases), we have 13,969 observations left. Data on market value, net income, leverage
etc. are obtained from the financial statements on S&P’s Compustat database.
Matching with Compustat further reduces the sample by 697 observations. Of the
remaining 13,272 observations, 134 have missing information on
mergers/acquisitions (Compustat data item SALE_FN) or special items (Compustat
data item SPI). Further, we eliminate all the data on financial firms (SIC codes 6000-
6999), which further reduces the sample by 2,772. This leaves us with a net usable
sample of 10,366 firm-years. The sample selection is summarized in Panel A of
Table 2.
Insert Table 2 here
9 Analysis of the period from 2004 to 2008 also gives results that are not qualitatively different from the ones presented here.
10 Larger firms are more likely to disclose information on their corporate governance and other practices and therefore, it is impossible to completely avoid the large firm bias, irrespective of which database is used for analysis.
22
4.3 Descriptive details of the sample
Panel B of Table 2 gives the distribution of sample firms over the six years
spanning the period 2003-2008 across the thirteen different industry categories used
by Ashbaugh et al. (2003) and Frankel et al. (2002) based on SIC codes. The
distribution that is not very different from the distribution of the Compustat database.
Panel C gives the descriptive statistics of the variables. Audit fee has a mean and
median that are very significantly higher than the ones reported in Ashbaugh et al.
(2003), which is suggestive of the increase in audit fees after the Sarbanes-Oxley Act.
Consistent with prior studies, more than 90% of the firms are audited by the big-4
auditors. On average, CEO holdings constitute 2.7% of outstanding shares and 7.2%
of the firms are classified as family firms. A founder director serves on the boards of
21.3% of the firms. On average, the board meets 8 times a year. The average board
size is 8.7 and the average size of the audit committee is 3.7. 94% of the audit
committee members are unaffiliated outsiders. Of the audit committee members,
36% have financial expertise.
Table 3 gives the Pearson (Spearman) correlations. The two governance indices
exhibit a 67% (68%) correlation. As expected, the audit fee is correlated with firm
size [61% (60%)]. A strong negative correlation [-43% (-42%)] is found between
firm size and loss propensity. Although Family is negatively correlated with LNFEE,
the correlation is only -.04 (-.03). In general, the correlations between independent
variables are small and are unlikely to result in multicollinearity.
Insert Table 3 here
23
Chapter 5. Hypothesis Tests and Result Analyses
5.1 Univariate tests for audit fees
Table 4 presents univariate tests of audit fee differences between (i) family
firms and non-family firms; (ii) firms with below-median CEO holdings and those
with above-median CEO holdings; (iii) firms with and without founder directors; and
(iv) firms with low and high insider director holdings. The audit fee is significantly
lower for family firms compared to non-family firms, for firms with high CEO
holdings compared to firms with low CEO holdings, firms with founder directors
compared to those that don’t, and for firms that have high insider holdings compared
to those with low insider holdings. These results suggest that auditors respond to the
reduction of the Type 1 agency problem by reducing their audit effort and, in general,
this is not offset by an increase of the Type 2 agency problem, thus validating H1b.
Insert Table 4 here
5.2 Testing Hypotheses H1a and H1b
Table 5 gives the results of regression (1). The first column gives the results
when OWN = Family. The second column gives the results when OWN =
FamilyPlus. The coefficient β4 is positive and significant in both the columns, which
validates Hypothesis H1a, showing that family firms are more likely to choose
specialist auditors, consistent with the argument that family owners are more likely
to signal the non-expropriation motivation to the market than nonfamily firms.
Insert Table 5 here
Table 6 gives the results of regression equation (2). The first column gives the
results when OWN = Family. The second column gives the results when OWN =
FamilyPlus. The coefficient β11 is negative and significant in both the columns,
24
which validates Hypothesis H1b, consistent with the argument that the reduction of
Type 1 agency cost reduces the audit fee and the increase in Type 2 agency cost is
not sufficient to make the coefficient insignificant. This result suggests that, in
general, the effects of the Type 1 agency conflict dominate the effects of Type 2
agency conflict in the determination of auditor effort and fees.
Insert Table 6 here
Consistent with prior studies and my expectation, the audit fee is higher for the
big-4 auditors, positively associated with client firm size, leverage, inventory and
receivables, loss and special items. Contrary to my expectations but consistent with
Ashbaugh et al. (2003), financing and market-to-book variables are negatively
associated with audit fees. The coefficients in the two regressions are not very
different from each other, which suggests that the two OWN variables do not affect
the relation between the other control variables and audit fees. The adjusted R-
squares of 0.637 and 0.636 in the two regressions, respectively, are comparable to the
adjusted R-square of 0.66 in Ashbaugh et al. (2003). This comparability of the R-
squares metric shows that the audit fee model seems to be as valid in the post-
Sarbanes-Oxley period as it was before the Act.
5.3 Testing Hypotheses H2a and H2b
Tables 7 and 8 provide the results of regression equation (1) on sub-samples of
firms with poor and good internal governance. For the sake of easy readability, the
columns of Table 5 using the full sample are repeated in the first column of Table 7
and the first column of Table 8. Columns 2 and 3 give the results of the regression
for the two governance-differentiated sub-samples when governance is based on
GIndexI. Likewise, Columns 4 and 5 give the results of the regression for the two
governance-differentiated sub-samples when governance is based on GIndexII. In
both cases, Family and FamilyPlus are significantly positively related to specialist
25
auditor choice only when the internal governance is good but loses significance when
the internal governance is poor. This is consistent with the hypothesis that when
family-owners value their private benefits highly, they adopt weak internal
governance and in this case, they have no incentive to signal the market through
choosing a specialist auditor.
Insert Tables 7 and 8 here
Tables 9 and 10 provide the results of regression equation (2) on the sub-
samples of firms with poor and good internal governance. Family and FamilyPlus are
significantly negatively related to audit fee only when the internal governance is poor
but loses significance when the internal governance is strong. This is consistent with
the hypothesis that when family-owners value their private benefits highly, they
adopt weak internal governance and in this case they do not incentivize the auditors
to mitigate the Type 2 agency problem. As a result, there is a significant negative
relation between audit fees and family ownership. On the other hand, when the
family-owners want to signal that they will not expropriate, they adopt strong
internal governance and incentivize the auditors to mitigate the agency concerns of
non-family investors and therefore the reduction in audit effort driven by the
reduction of the Type 1 agency problem is compensated by an increase in audit effort
to reduce the Type 2 agency problem. In effect, when the internal governance is
strong, the audit fee is not reduced by family ownership. This effect is also shown in
Figure 1. Figure 1 provides a picture of expected audit fees with and without family
ownership in the cases of strong and weak internal governance. This figure shows
that the audit fee is expected to be higher in cases where the internal governance is
strong, both for the family and non-family firms. Furthermore, for firms with poor
governance, the audit fee in a family firm is obviously smaller than that in a
nonfamily firm, whereas there is no obvious difference in audit fee between a family
firm and a nonfamily firm when the corporate governance is strong.
Insert Tables 9 and 10 and Figure 1 here

26
An examination of the coefficients of the sub-sample regressions shows that
there are only minor differences between the two sub-samples. This indicates that the
audit fee model does not exhibit significant structural differences between good-
governance and weak-governance firms.
Table 11 presents the results of regression equation (3) on the joint effect of
family control and good corporate governance on audit fees. The first column gives
the regression result of the interaction term OWN*DGIndex for OWN=Family and
DGIndex=DGIndexI, which shows that the interaction term is significantly positively
associated with audit fees, consistent with my argument that family firms with good
corporate governance are more likely to signal their non-expropriation behavior by
purchasing more audit effort. Analogously, for OWN=Family and
DGIndex=DGIndexII, the interaction term is also significantly positively correlated
with audit fees, thereby supporting my hypothesis H2b. The last two columns give the
results for OWN=FamilyPlus. The result shown in third column indicates that there
is a positively but insignificantly joint effect of family ownership and good corporate
governance on audit fees, only offering weak evidence to support my hypothesis H2b.
However, the last column reporting the result for OWN=FamilyPlus and
DGIndex=DGIndexII shows a significantly positive association between the
interaction term OWN*DGIndex and LNFEE, which also supports my hypothesis H2b.
In total, table 11 gives me strong evidence to validate the hypothesis H2b.
Insert Table 11 here
5.4 Testing Hypothesis H2c
Table 12 provides the results of regression equation (4) on the specialist auditor
premium. The first column gives the regression results of the full sample, which
shows that the dummy variable SPECIALIST is significantly positively associated
with audit fees, consistent with my expectation on the existence of a specialist

27
auditor premium. Columns 2 and 3 give the results of the regression for the two
governance-differentiated sub-samples when governance is based on GIndexI.
Likewise, Columns 4 and 5 give the results of the regression for the two governance-
differentiated sub-samples when governance is based on GIndexII. In both cases,
SPECIALIST is significantly positively correlated to audit fees only when the internal
governance is poor but loses significance when the internal governance is good. The
t-value for the difference between the estimated coefficients of SPECIALIST in
Columns 2 and 3 shows that firms with poor internal governance pay significantly
more premiums to a specialist auditor than those with good internal governance.
Likewise, the t-value for the difference between the estimated coefficients of
SPECIALIST in Columns 4 and 5 also supports the hypothesis that the specialist
auditor premium is smaller in the presence of stronger boards compared to firms with
weaker boards.
The Big auditors are more likely to be specialist auditors than non-Big auditors.
I therefore calculate a correlation coefficient (0.226) between SPECIALIST and BIG,
and VIFs in the first regression of Table 12. I find that the correlation is significant
but not strong enough to cause multicollinearity problems, because the VIF of
SPECIALIST (BIG) in the first column of Table 12 is 1.07(1.16).
Insert Table 12 here
5.5 Additional tests using other measures of concentrated holdings
I repeat regression equation (2) using CEO Holdings, insider holdings, and the
existence of founder director as alternative measures to family ownership. CEO
ownership aligns the incentives of management with that of the investors and thereby
reduces the Type 1 agency problem. However, when the CEO is from the family,
CEO ownership is also connected with the Type 2 agency conflict. Insider directors
constitute the top management of the firm and having high ownership aligns their
interest with those of investors. However, it might also exacerbate the agency

28
problem between insider shareholders and outside shareholders. Existence of a
founder or his/her heir on the board also could be interpreted as an alignment of the
management and investor interest. Similar to family ownership, the founder director
presence might indicate entrenchment and a compromise of the outside shareholders’
interests.
Table 13 shows the results of regression equation (2) using CEO holdings,
insider holdings, and the existence of a founder director as alternative measures to
family ownership. In the interest of brevity, only the coefficients of the treatment
variables are shown. In the full sample regression, CEO holdings, insider ownership
and Founder director presence show a significant negative association with audit fee.
In the sub-sample regressions, the significant negative association remains for firms
with poor governance but the association becomes insignificant for firms with strong
governance. In effect, these variables exhibit the same consequences as family
ownership.
Insert Table 13 here
5.6 Additional tests where sub-samples are formed based on components of the
internal governance index
Analyses carried out above using the two indices support the general finding
that in family firms that signal their intent with strong governance, audit fee is not
different between family and non-family firms. This result could be driven by one or
a few or all of the governance characteristics. In this additional test, I use some of the
individual components of the governance indices to examine whether they drive the
results.
Table 14 presents the results of sub-sample analyses where sub-samples of
strong and weak governance are constructed based on (i) percentage of outside
independent directors; (ii) independence index; (iii) meetings index; (iv) size index;
and (v) CEO power. The percentage of independent directors has been used in
29
several prior studies as the sole indicator of board-based governance (Adams and
Ferreira 2007; Andersen et al. 2004; Carcello et al. 2002; Cotter and Sylvester 2003;
Osma 2008). Therefore, I use these as separate variables. Variables (ii) to (iv) are
sub-indices from which GIndexII is constructed and relate to highly researched
indicators of governance such as independence, diligence, and board/audit committee
size. Variable (v) – CEO power – has also been an important indicator of the
independence of the board from the CEO (Tsui et al. 2001). Consistently in all cases,
Family is negatively associated with audit fee only when the corresponding
governance variable is poor but the association becomes insignificant when the
corresponding governance variable is strong. This analysis shows that all governance
variables have a similar effect and my results are robust.
Insert Table 14 here
5.7 Additional tests for the effect of firm size on the relationship between family
ownership and audit fees.
Larger family firms come under greater public scrutiny and consequently the
potential for benefitting from private control benefits is less. Moreover, in larger
family firms, the external shareholders are more numerous and therefore have a
greater incentive for class action lawsuits compared to the external shareholders in
small family firms. Therefore, the litigation risk faced by auditors is relatively higher
than in small family firms. The big family firms purchase more audit to satisfy the
stronger external concerns, whereas the small family firms have no similar
motivation because of weaker external concerns. Thus, I hypothesize that the
negative relationship between audit fee and family ownership is weaker in large
firms than in small firms.
To validate the above hypothesis, I use extreme size observations (bottom 25%
and top 25%) and a matched-pair, nonfamily firm. Here, I rank the family firms by
size and isolate those in the lowest and highest quartiles (n=187 for the lowest and

30
n=187 for the highest). Then, I match each of these firms with a non-family firm in
the same industry and that is nearest in size. Thus, I end up with a sample of 374
small size firms (187 family obs. and 187 nonfamily obs.) and 374 large size firms. I
also combine the two samples (n=748).
The regression results are reported in table 15. As expected, the significant,
negative association between family ownership and audit fee still appears in the
combined sample. However, the lowest and highest quartile regression results show
that the negative relationship only is significant for firms in the lowest quartile but
not for firms in the highest quartile. Thus, large family firms, which face a lot of
media attention, do not have lower audit fees.
Insert Table 15 here
5.9 Additional tests for small firms
Unlike large family firms, small family firms are not subject to great scrutiny
from the market. The reason why large family firms set up strong boards, choose
specialist auditors, and purchase more audit effort is likely to be the result of external
scrutiny. However, when small family firms choose strong boards, specialist auditors,
and higher audit fees, this is more likely to be result of voluntarily signaling their
non-expropriation behavior. Based on this reasoning, I rerun regression equations (1)
– (3) and find that in small firms the positive effect of family ownership on specialist
auditor choice shown in table 16 is stronger than that shown in table 7, and the joint
positive effect of family ownership and good corporate governance on audit fees
reported in table 17 is stronger than that presented in table 11.
Comparing table 7 with table 16, I find that the estimated coefficients on OWN
in table 16 are greater than their counterparts in table 7. To verify this observation, I
calculate the t-value for the difference in coefficients. For example, in the full sample
regression, the t-value for the coefficients difference for OWN shows a significant
difference between the estimated coefficients. Likewise, the comparison between

31
table 11 and table 17 shows that the estimated coefficients of the interaction term
OWN*DGIndex in table 17 are greater than their counterparts in table 11. T statistical
tests show that such differences are significant. In total, these evidences validate my
expectation that small family firms are more likely to signal their non-expropriation
behavior compared to large family firms.
Insert Tables 16 and 17 here
5.10 Additional test when managerial ownership is very high and entrenchment is
indicated
Several studies have documented non-linear effects of managerial ownership on
governance (Yeo et al. 2002; Morck et al. 1988). These studies suggest that at very
high levels of managerial ownership, the entrenchment effect dominates the
alignment effect. Therefore, if the managerial ownership is very high, we do not
expect family ownership to reduce the Type 1 agency cost and the audit fee is not
expected to be lower in family firms. In order to test this, we select the top quartile of
the CEO ownership sub-sample and run regression equation (2) on this sample. The
results are shown in Table 18. As expected, the negative association between family
ownership and audit fee disappears in this case. The entrenched CEO dominates
other governance effects.
Insert Table 18 here
5.11 Additional test on the benefit of using corporate governance (auditing) as a
signal mechanism for family firms.
As an additional test, I test the effect of corporate governance on a firm’s credit
rating. I use the model in Francis et al. (2008), and report the results in Table 19. As
expected, family firms get a higher credit rating in the full sample analysis. The
separate sample analyses show that such effect is driven by the family firms with

32
good CG. These results indicate that family firms can benefit from setting up good
corporate governance which necessarily leads to higher quality audit.
Insert Table 19 here

33
Chapter 6. Conclusion
In this thesis, I examine the effect of family ownership on auditor choice and
audit pricing. Family ownership of firms results in a reduction of the agency conflict
between managers and investors because of the superior knowledge of the family
owners about the business that allows them to monitor the managers more effectively.
Given the concerns of nonfamily investors on the expropriation of family owners, the
family firms are more likely to signal their non-expropriation incentive by choosing a
specialist auditor. Furthermore, given that the primary role of auditors is to reduce
the information asymmetry between managers and investors, this alignment effect
reduces audit risk from mis-reporting by managers and, in a competitive audit market,
is expected to lead to lower audit fees for family firms. On the other hand, the family
owners could have incentives for consuming private benefits and this creates an
agency conflict with non-family shareholders. Although it is not the primary role of
auditors to mitigate agency conflicts between different classes of investors, prior
evidence suggests that in contexts where they have the incentive, auditors have the
capability to mitigate the agency conflict between inside and outside investors.
These arguments inevitably lead to three questions that I answer in this thesis.
The first is whether family firms are more likely to choose a specialist auditor to
signal their non-expropriating behavior compared to nonfamily firms, which do not
confront the Type 2 agency conflict as family firms do. The second is whether the
Type 1 agency conflict dominates the Type 2 agency conflict in the determination of
audit effort and audit fees. The third is that in contexts where the family owners
genuinely are not consuming private benefits and expropriating the wealth of non-
family shareholders, do they provide incentives to the auditors to address the
concerns of non-family shareholders? I address these questions in this paper. I find
that, in general, family firms are more likely to choose a specialist auditor to signal
their non-expropriation behavior than nonfamily firms, and that the Type 1 agency
conflict dominates the Type 2 agency conflict in the determination of audit effort and
34
pricing. In order to address the third question, I surmise that family owners who do
not expropriate wealth from non-family owners will use strong independent and
competent internal governance mechanisms to signal their honesty. Therefore, in the
presence of strong internal governance, the owners are more likely to choose
specialist auditors and provide incentives to auditors to mitigate the concerns of non-
family owners and therefore, the potential reduction in audit effort because the
reduced Type 1 agency conflict is compensated by an increase in the audit effort
needed to mitigate the concerns of the non-family owners. I find that the positive
relation between family ownership and specialist auditor choice is stronger in the
presence of strong internal governance but is insignificant if the internal governance
is weak, and the negative relation between family ownership and audit fee disappears
in the presence of strong internal governance but is significant if the internal
governance is weak.
I find that the results are robust to using alternate measures of ownership such
as CEO ownership, insider ownership, and the presence of founder directors. I also
find that the result is driven by individual internal governance factors such as
board/audit committee independence, board diligence, board/audit committee size,
and CEO power. I also document that among family firms, the audit fee is relatively
higher in larger firms and therefore these firms do not show significantly lower audit
fees compared to nonfamily firms. Furthermore, if the entrenchment effect of
managerial ownership is very strong, the effect of family ownership on audit fee
disappears. My thesis investigates auditor choice and auditor responses to agency conflicts
in family firms that have effective (ineffective) internal governance. The findings in
this thesis are valuable to regulators who might want to improve information flow to
nonfamily shareholders, nonfamily shareholders in assessing the motives of family
shareholders, auditing and accounting standard setters in redefining the role of
auditors, and family shareholders who want to signal non-expropriation of nonfamily
shareholder wealth.
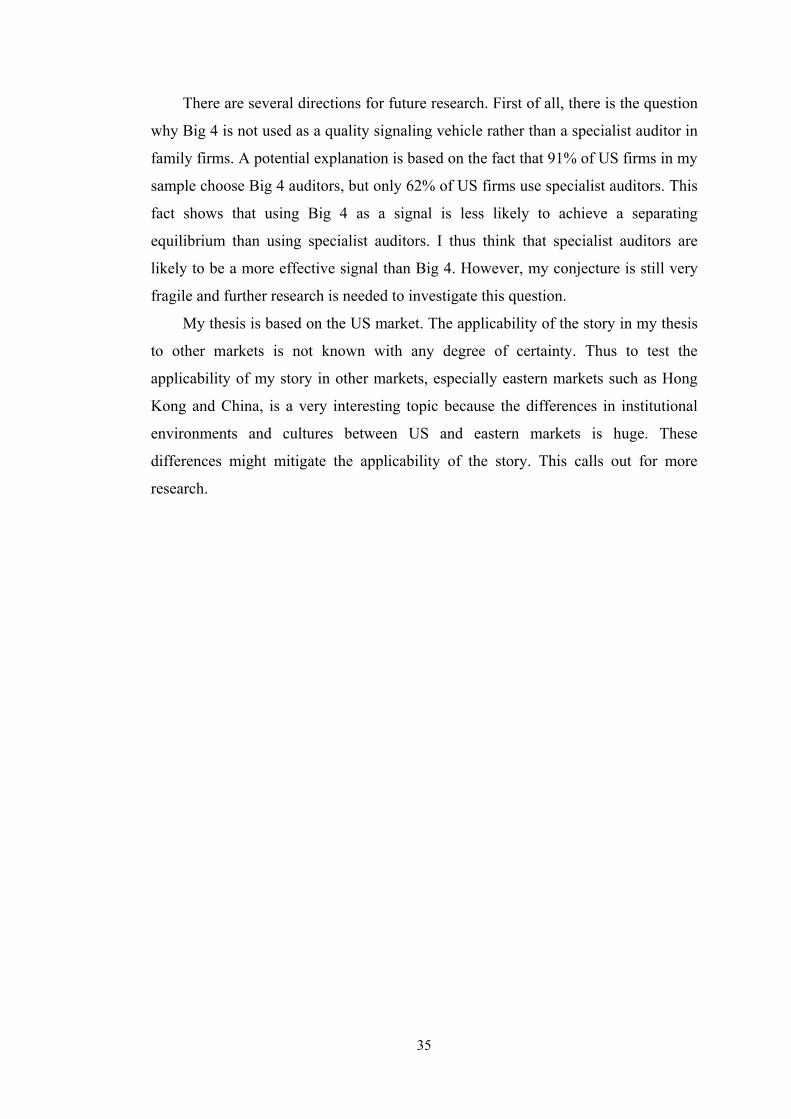
35
There are several directions for future research. First of all, there is the question
why Big 4 is not used as a quality signaling vehicle rather than a specialist auditor in
family firms. A potential explanation is based on the fact that 91% of US firms in my
sample choose Big 4 auditors, but only 62% of US firms use specialist auditors. This
fact shows that using Big 4 as a signal is less likely to achieve a separating
equilibrium than using specialist auditors. I thus think that specialist auditors are
likely to be a more effective signal than Big 4. However, my conjecture is still very
fragile and further research is needed to investigate this question.
My thesis is based on the US market. The applicability of the story in my thesis
to other markets is not known with any degree of certainty. Thus to test the
applicability of my story in other markets, especially eastern markets such as Hong
Kong and China, is a very interesting topic because the differences in institutional
environments and cultures between US and eastern markets is huge. These
differences might mitigate the applicability of the story. This calls out for more
research.
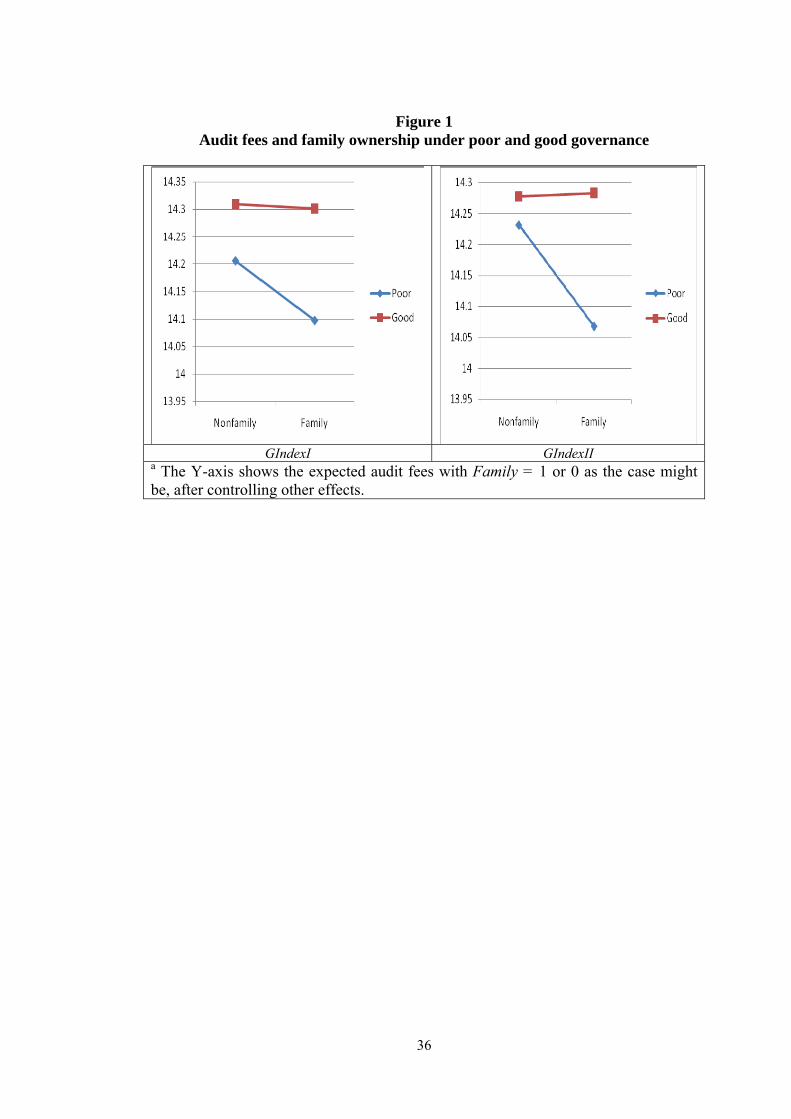
36
Figure 1
Audit fees and family ownership under poor and good governance
GIndexI GIndexII a The Y-axis shows the expected audit fees with Family = 1 or 0 as the case might be, after controlling other effects.
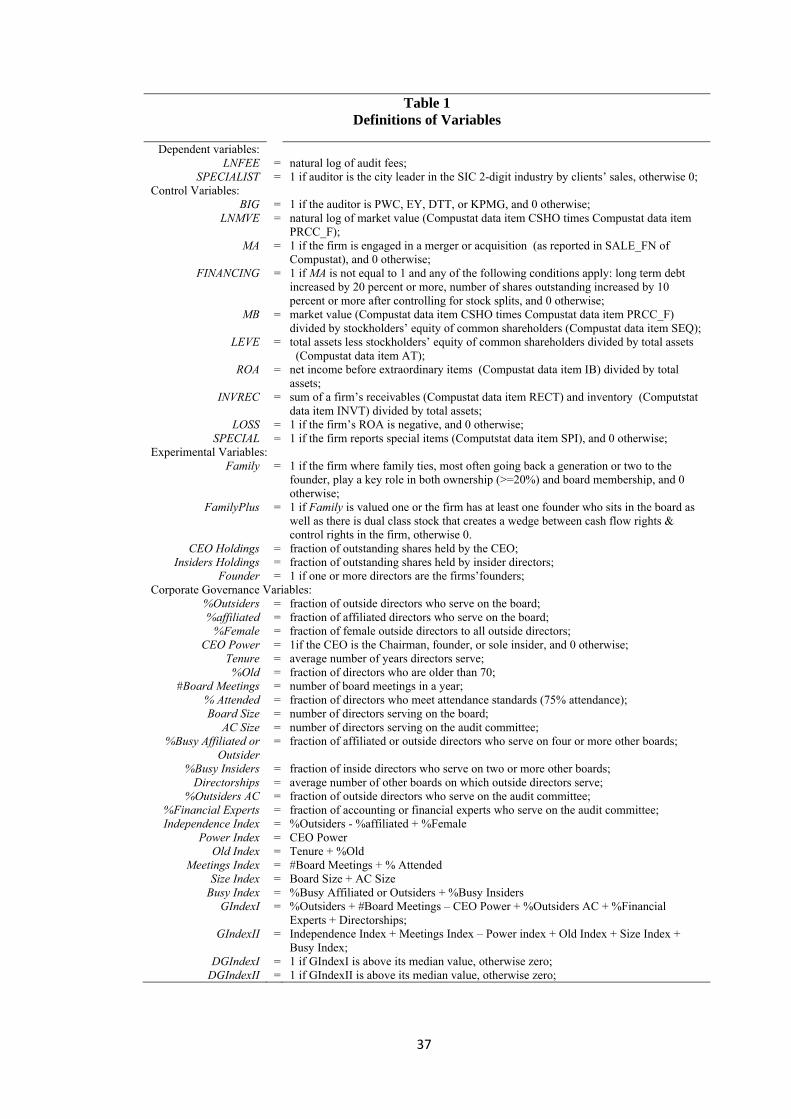
37
Table 1 Definitions of Variables
Dependent variables:
LNFEE = natural log of audit fees; SPECIALIST = 1 if auditor is the city leader in the SIC 2-digit industry by clients’ sales, otherwise 0;
Control Variables: BIG = 1 if the auditor is PWC, EY, DTT, or KPMG, and 0 otherwise;
LNMVE = natural log of market value (Compustat data item CSHO times Compustat data item PRCC_F);
MA = 1 if the firm is engaged in a merger or acquisition (as reported in SALE_FN of Compustat), and 0 otherwise;
FINANCING = 1 if MA is not equal to 1 and any of the following conditions apply: long term debt increased by 20 percent or more, number of shares outstanding increased by 10 percent or more after controlling for stock splits, and 0 otherwise;
MB = market value (Compustat data item CSHO times Compustat data item PRCC_F) divided by stockholders’ equity of common shareholders (Compustat data item SEQ);
LEVE = total assets less stockholders’ equity of common shareholders divided by total assets (Compustat data item AT);
ROA = net income before extraordinary items (Compustat data item IB) divided by total assets;
INVREC = sum of a firm’s receivables (Compustat data item RECT) and inventory (Computstat data item INVT) divided by total assets;
LOSS = 1 if the firm’s ROA is negative, and 0 otherwise; SPECIAL = 1 if the firm reports special items (Computstat data item SPI), and 0 otherwise;
Experimental Variables: Family = 1 if the firm where family ties, most often going back a generation or two to the
founder, play a key role in both ownership (>=20%) and board membership, and 0 otherwise;
FamilyPlus = 1 if Family is valued one or the firm has at least one founder who sits in the board as well as there is dual class stock that creates a wedge between cash flow rights & control rights in the firm, otherwise 0.
CEO Holdings = fraction of outstanding shares held by the CEO; Insiders Holdings = fraction of outstanding shares held by insider directors;
Founder = 1 if one or more directors are the firms’founders; Corporate Governance Variables:
%Outsiders = fraction of outside directors who serve on the board; %affiliated = fraction of affiliated directors who serve on the board;
%Female = fraction of female outside directors to all outside directors; CEO Power = 1if the CEO is the Chairman, founder, or sole insider, and 0 otherwise;
Tenure = average number of years directors serve; %Old = fraction of directors who are older than 70;
#Board Meetings = number of board meetings in a year; % Attended = fraction of directors who meet attendance standards (75% attendance); Board Size = number of directors serving on the board;
AC Size = number of directors serving on the audit committee; %Busy Affiliated or
Outsider = fraction of affiliated or outside directors who serve on four or more other boards;
%Busy Insiders = fraction of inside directors who serve on two or more other boards; Directorships = average number of other boards on which outside directors serve;
%Outsiders AC = fraction of outside directors who serve on the audit committee; %Financial Experts = fraction of accounting or financial experts who serve on the audit committee; Independence Index = %Outsiders - %affiliated + %Female
Power Index = CEO Power Old Index = Tenure + %Old
Meetings Index = #Board Meetings + % Attended Size Index = Board Size + AC Size
Busy Index = %Busy Affiliated or Outsiders + %Busy Insiders GIndexI = %Outsiders + #Board Meetings – CEO Power + %Outsiders AC + %Financial
Experts + Directorships; GIndexII = Independence Index + Meetings Index – Power index + Old Index + Size Index +
Busy Index; DGIndexI = 1 if GIndexI is above its median value, otherwise zero;
DGIndexII = 1 if GIndexII is above its median value, otherwise zero;
38
Table 2
Sample Details Panel A: Sample Selection 2003-2008
Initial sample : firm-year observations in Companies of Corporate Library 15479
Less
Observations with missing CEO/insiders/family/founder holdings in Corporate Library -979
14500
Observations not included in AuditAnalytics -258
14242Observations missing number of board meetings/financial experts of audit committee in Corporate Library to compile governance indexes -273
13969
Observations not included in Computstat -697
13272Observations missing footnote of sale (Computstat data item SALE_FN)/special item
(Computstat data item SPI) /net income (Computstat data item IB) -134
13138
Observations in financial industries (6000-6999) -2772
Final firm-year observations 10366

39
Panel B: Distribution of the sample firms over the sample period and across industries 2003 2004 2005 2006 2007 2008 Total Agriculture (0100-0999) 3 4 5 6 4 3 25Mining and Construction (1000-1999, excluding 1300-1399) 20 32 32 50 50 60 244
Food (2000-2111) 20 40 46 56 59 53 274Textiles and printing/ publishing (2200-2799) 75 102 102 119 117 108 623
Chemicals (2800-2824, 2840-2899) 34 46 52 66 70 64 332Pharmaceuticals (2830-2836) 46 61 67 150 164 166 654Extractive (1300-1399, 2900-2999) 43 54 58 93 113 121 482Durable manufactures (3000-3999, excluding 3570-3579 and 3670-3679) 232 353 354 503 507 494 2443
Transportation (4000-4899) 73 95 98 149 161 168 744Utilities (4900-4999) 72 88 90 103 98 101 552Retail (5000-5999) 123 199 189 256 261 254 1282Services (7000-8999, excluding 7370-7379) 88 141 147 237 234 224 1071
Computers (3570-3579, 3670-3679, 7370-7379) 129 216 228 336 342 347 1598
Others 6 7 9 8 6 6 42Total 964 1438 1477 2132 2186 2169 10366aSIC codes are given in parentheses.
Panel C: Descriptive StatisticsVariable Mean
Std. Dev. Q1 Median Q3
FEE($) 2906699
4995597 766000 145875
5 298600
0
MVE(M$) 5328.204
13448.61
422.5362
1173.891
3629.589
LNFEE 14.254 1.074 13.549 14.193 14.909
SPECIALIST 0.623 0.484 0.000 1.000 1.000LNMVE 7.145 1.686 6.046 7.068 8.197 BIG 0.912 0.283 1.000 1.000 1.000MA 0.222 0.416 0.000 0.000 0.000 FINANCING 0.304 0.460 0.000 0.000 1.000 MB 2.734 1.983 1.379 2.140 3.493 LEVE 0.523 0.222 0.354 0.522 0.679 ROA 0.007 0.168 0.004 0.044 0.083 INVREC 0.236 0.155 0.103 0.214 0.339 LOSS 0.239 0.426 0.000 0.000 0.000 SPECIAL 0.730 0.444 0.000 1.000 1.000 CEO Holdings 0.027 0.079 0.001 0.003 0.012 Family 0.072 0.259 0.000 0.000 0.000 Insiders Holdings 0.044 0.102 0.002 0.007 0.028 Founder 0.213 0.410 0.000 0.000 0.000 GIndexI -0.009 0.627 -0.469 -0.046 0.422 GIndexII -0.007 0.510 -0.393 -0.096 0.383 %Outsiders 0.705 0.150 0.600 0.714 0.833

40
%affiliated 0.113 0.129 0.000 0.100 0.182 %Female 0.138 0.149 0.000 0.125 0.222 CEO Power 0.667 0.471 0.000 1.000 1.000 Tenure 8.629 3.931 5.818 8.129 10.857 %Old 0.189 0.195 0.000 0.143 0.286 #Board Meetings 7.922 3.590 5.000 7.000 9.000 % Attended 0.987 0.043 1.000 1.000 1.000 Board Size 8.754 2.202 7.000 9.000 10.000 AC Size 3.728 1.034 3.000 3.000 4.000 %Busy affiliated or outsiders 0.149 0.174 0.000 0.111 0.250 %Busy Insiders 0.068 0.086 0.000 0.000 0.125 Directorships 2.033 0.922 1.333 1.833 2.600 %Outsiders AC 0.938 0.135 1.000 1.000 1.000 %Financial Experts 0.360 0.294 0.200 0.333 0.500
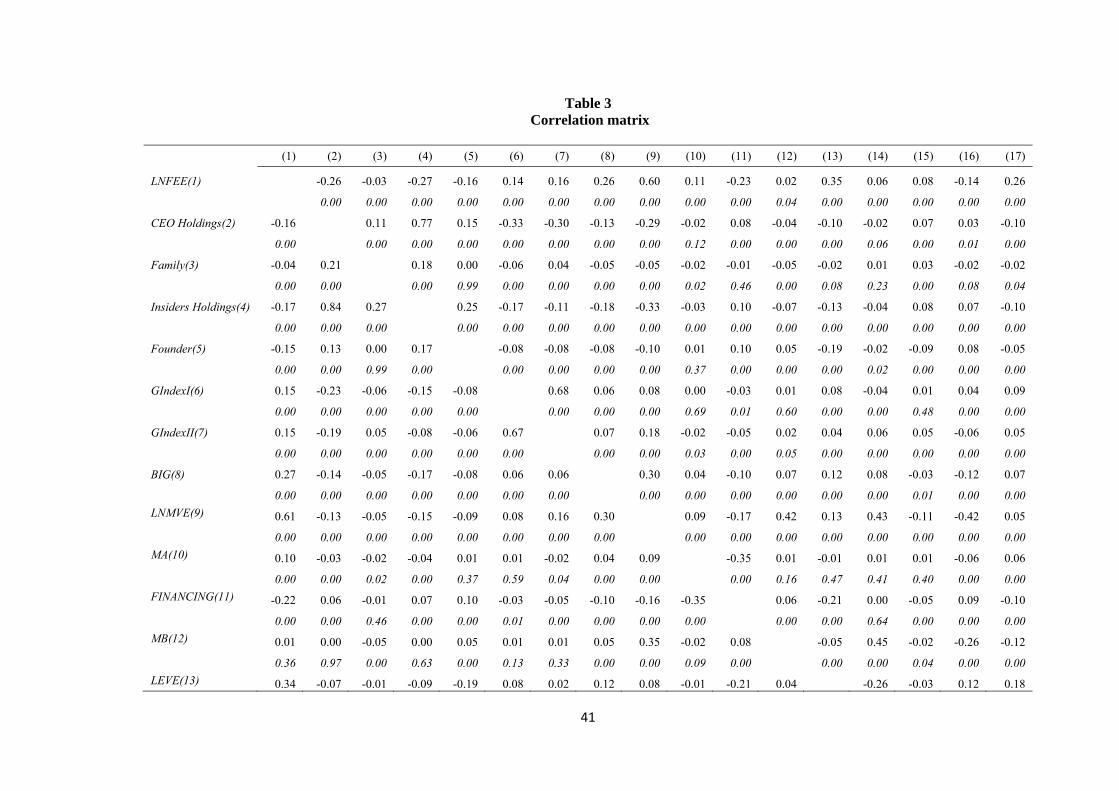
41
Table 3 Correlation matrix
(1) (2) (3) (4) (5) (6) (7) (8) (9) (10) (11) (12) (13) (14) (15) (16) (17)
LNFEE(1) -0.26 -0.03 -0.27 -0.16 0.14 0.16 0.26 0.60 0.11 -0.23 0.02 0.35 0.06 0.08 -0.14 0.26
0.00 0.00 0.00 0.00 0.00 0.00 0.00 0.00 0.00 0.00 0.04 0.00 0.00 0.00 0.00 0.00
CEO Holdings(2) -0.16 0.11 0.77 0.15 -0.33 -0.30 -0.13 -0.29 -0.02 0.08 -0.04 -0.10 -0.02 0.07 0.03 -0.10
0.00 0.00 0.00 0.00 0.00 0.00 0.00 0.00 0.12 0.00 0.00 0.00 0.06 0.00 0.01 0.00
Family(3) -0.04 0.21 0.18 0.00 -0.06 0.04 -0.05 -0.05 -0.02 -0.01 -0.05 -0.02 0.01 0.03 -0.02 -0.02
0.00 0.00 0.00 0.99 0.00 0.00 0.00 0.00 0.02 0.46 0.00 0.08 0.23 0.00 0.08 0.04
Insiders Holdings(4) -0.17 0.84 0.27 0.25 -0.17 -0.11 -0.18 -0.33 -0.03 0.10 -0.07 -0.13 -0.04 0.08 0.07 -0.10
0.00 0.00 0.00 0.00 0.00 0.00 0.00 0.00 0.00 0.00 0.00 0.00 0.00 0.00 0.00 0.00
Founder(5) -0.15 0.13 0.00 0.17 -0.08 -0.08 -0.08 -0.10 0.01 0.10 0.05 -0.19 -0.02 -0.09 0.08 -0.05
0.00 0.00 0.99 0.00 0.00 0.00 0.00 0.00 0.37 0.00 0.00 0.00 0.02 0.00 0.00 0.00
GIndexI(6) 0.15 -0.23 -0.06 -0.15 -0.08 0.68 0.06 0.08 0.00 -0.03 0.01 0.08 -0.04 0.01 0.04 0.09
0.00 0.00 0.00 0.00 0.00 0.00 0.00 0.00 0.69 0.01 0.60 0.00 0.00 0.48 0.00 0.00
GIndexII(7) 0.15 -0.19 0.05 -0.08 -0.06 0.67 0.07 0.18 -0.02 -0.05 0.02 0.04 0.06 0.05 -0.06 0.05
0.00 0.00 0.00 0.00 0.00 0.00 0.00 0.00 0.03 0.00 0.05 0.00 0.00 0.00 0.00 0.00
BIG(8) 0.27 -0.14 -0.05 -0.17 -0.08 0.06 0.06 0.30 0.04 -0.10 0.07 0.12 0.08 -0.03 -0.12 0.07
0.00 0.00 0.00 0.00 0.00 0.00 0.00 0.00 0.00 0.00 0.00 0.00 0.00 0.01 0.00 0.00 LNMVE(9) 0.61 -0.13 -0.05 -0.15 -0.09 0.08 0.16 0.30 0.09 -0.17 0.42 0.13 0.43 -0.11 -0.42 0.05 0.00 0.00 0.00 0.00 0.00 0.00 0.00 0.00 0.00 0.00 0.00 0.00 0.00 0.00 0.00 0.00 MA(10) 0.10 -0.03 -0.02 -0.04 0.01 0.01 -0.02 0.04 0.09 -0.35 0.01 -0.01 0.01 0.01 -0.06 0.06 0.00 0.00 0.02 0.00 0.37 0.59 0.04 0.00 0.00 0.00 0.16 0.47 0.41 0.40 0.00 0.00 FINANCING(11) -0.22 0.06 -0.01 0.07 0.10 -0.03 -0.05 -0.10 -0.16 -0.35 0.06 -0.21 0.00 -0.05 0.09 -0.10 0.00 0.00 0.46 0.00 0.00 0.01 0.00 0.00 0.00 0.00 0.00 0.00 0.64 0.00 0.00 0.00 MB(12) 0.01 0.00 -0.05 0.00 0.05 0.01 0.01 0.05 0.35 -0.02 0.08 -0.05 0.45 -0.02 -0.26 -0.12 0.36 0.97 0.00 0.63 0.00 0.13 0.33 0.00 0.00 0.09 0.00 0.00 0.00 0.04 0.00 0.00 LEVE(13) 0.34 -0.07 -0.01 -0.09 -0.19 0.08 0.02 0.12 0.08 -0.01 -0.21 0.04 -0.26 -0.03 0.12 0.18

42
0.00 0.00 0.17 0.00 0.00 0.00 0.02 0.00 0.00 0.18 0.00 0.00 0.00 0.00 0.00 0.00 ROA(14) 0.17 0.01 0.02 0.01 -0.07 -0.03 0.04 0.12 0.44 0.05 -0.09 0.17 -0.17 0.17 -0.74 -0.19 0.00 0.38 0.01 0.20 0.00 0.00 0.00 0.00 0.00 0.00 0.00 0.00 0.00 0.00 0.00 0.00 INVREC(15) 0.04 0.02 0.03 0.04 -0.08 0.00 0.04 -0.03 -0.13 -0.01 -0.04 -0.05 -0.02 0.13 -0.12 -0.01 0.00 0.08 0.00 0.00 0.00 0.93 0.00 0.00 0.00 0.46 0.00 0.00 0.13 0.00 0.00 0.61 LOSS(16) -0.13 0.01 -0.02 0.01 0.08 0.04 -0.06 -0.12 -0.43 -0.06 0.09 -0.15 0.14 -0.68 -0.09 0.14 0.00 0.15 0.08 0.22 0.00 0.00 0.00 0.00 0.00 0.00 0.00 0.00 0.00 0.00 0.00 0.00 SPECIAL(17) 0.24 -0.09 -0.02 -0.10 -0.05 0.10 0.05 0.07 0.04 0.06 -0.10 -0.09 0.18 -0.10 -0.02 0.14
0.00 0.00 0.04 0.00 0.00 0.00 0.00 0.00 0.00 0.00 0.00 0.00 0.00 0.00 0.03 0.00 a The numbers in parentheses are the two-tailed significance levels; b Spearman (Pearson) Correlations are Presented in the Upper (Lower) Diagonal.
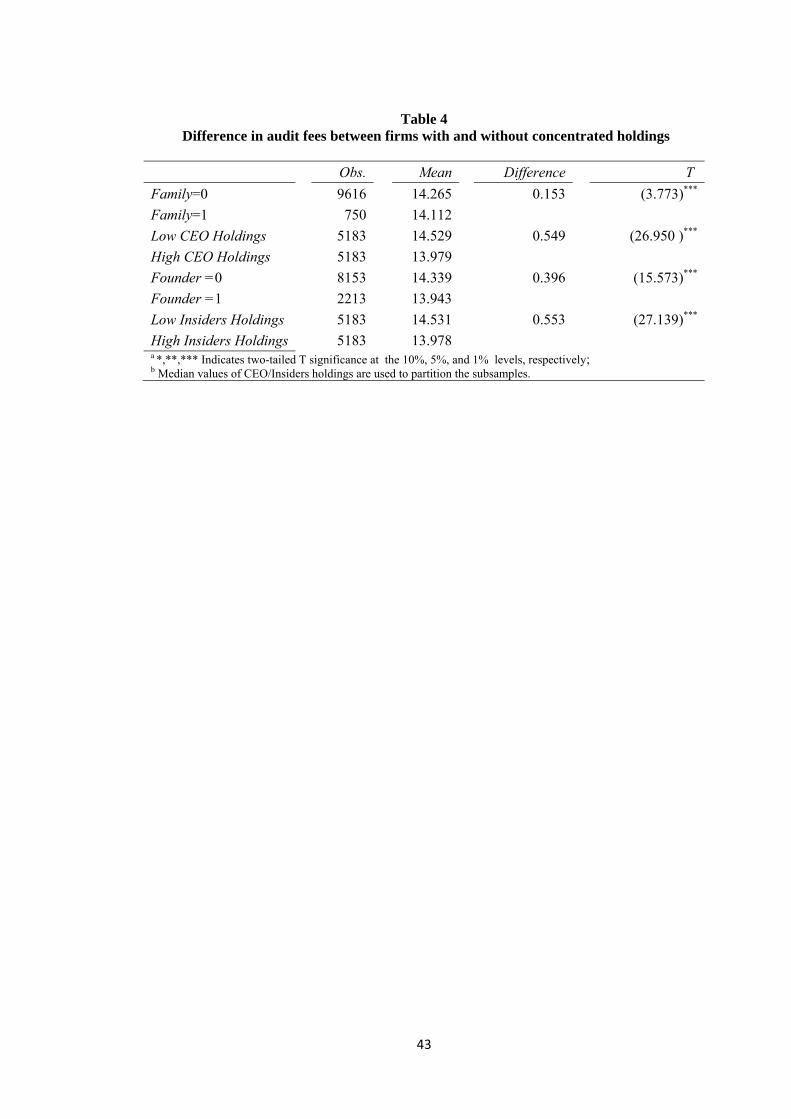
43
Table 4
Difference in audit fees between firms with and without concentrated holdings Obs. Mean Difference T Family=0 9616 14.265 0.153 (3.773)*** Family=1 750 14.112 Low CEO Holdings 5183 14.529 0.549 (26.950 )*** High CEO Holdings 5183 13.979 Founder =0 8153 14.339 0.396 (15.573)*** Founder =1 2213 13.943 Low Insiders Holdings 5183 14.531 0.553 (27.139)*** High Insiders Holdings 5183 13.978 a *,**,*** Indicates two-tailed T significance at the 10%, 5%, and 1% levels, respectively; b Median values of CEO/Insiders holdings are used to partition the subsamples.

44
Table 5
Family ownership and specialist auditor choice: OWN = Family/FamilyPlus
SPECIALIST = β0 + β1LNMVE + β2LEVE +β3ROA + β4OWN + Industry effects + Year effects + ε Variables OWN=Family OWN = FamilyPlus Intercept -2.271*** -2.229*** (0.120) (0.119) LNMVE 0.295*** 0.287*** (0.016) (0.016) LEVE 1.126*** 1.142*** (0.103) (0.103) ROA 0.091 0.138 (0.148) (0.148) OWN 0.154* 0.154** (0.083) (0.074) Observations 10366 10366 a *,**,*** Indicates two-tailed Z significance at the 10%, 5%, and 1% levels, respectively; b Standard errors in parentheses; c Industry and year dummies included in the regression but not shown in the Table.

45
Table 6
Family ownership and audit fees: OWN = Family/FamilyPlus
LNFEE = β0 + β1BIG + β2LNMVE + β3MA + β4FINANCING + β5MB + β6LEVE + β7ROA + β8INVREC + β9LOSS + β10SPECIAL + β11OWN + Industry effects + Year effects + ε
Variable OWN=Family OWN = FamilyPlus Intercept 10.610*** 10.606*** (0.262) (0.263) BIG 0.236*** 0.235*** (0.041) (0.041) LNMVE 0.479*** 0.480*** (0.009) (0.009) MA 0.011 0.012 (0.020) (0.020) FINANCING -0.074*** -0.073*** (0.019) (0.019) MB -0.123*** -0.123*** (0.006) (0.006) LEVE 1.341*** 1.340*** (0.062) (0.062) ROA -0.115 -0.116 (0.092) (0.092) INVREC 0.937*** 0.936*** (0.089) (0.089) LOSS 0.232*** 0.232*** (0.029) (0.029) SPECIAL 0.244*** 0.245*** (0.020) (0.020) OWN -0.077** -0.064* (0.039) (0.036) Observations 10366 10366 R-squared 0.636 0.636 a *,**,*** Indicates two-tailed T significance at the 10%, 5%, and 1% levels, respectively; b Robust standard errors in parentheses; c Industry and year dummies included in the regression but not shown in the Table.
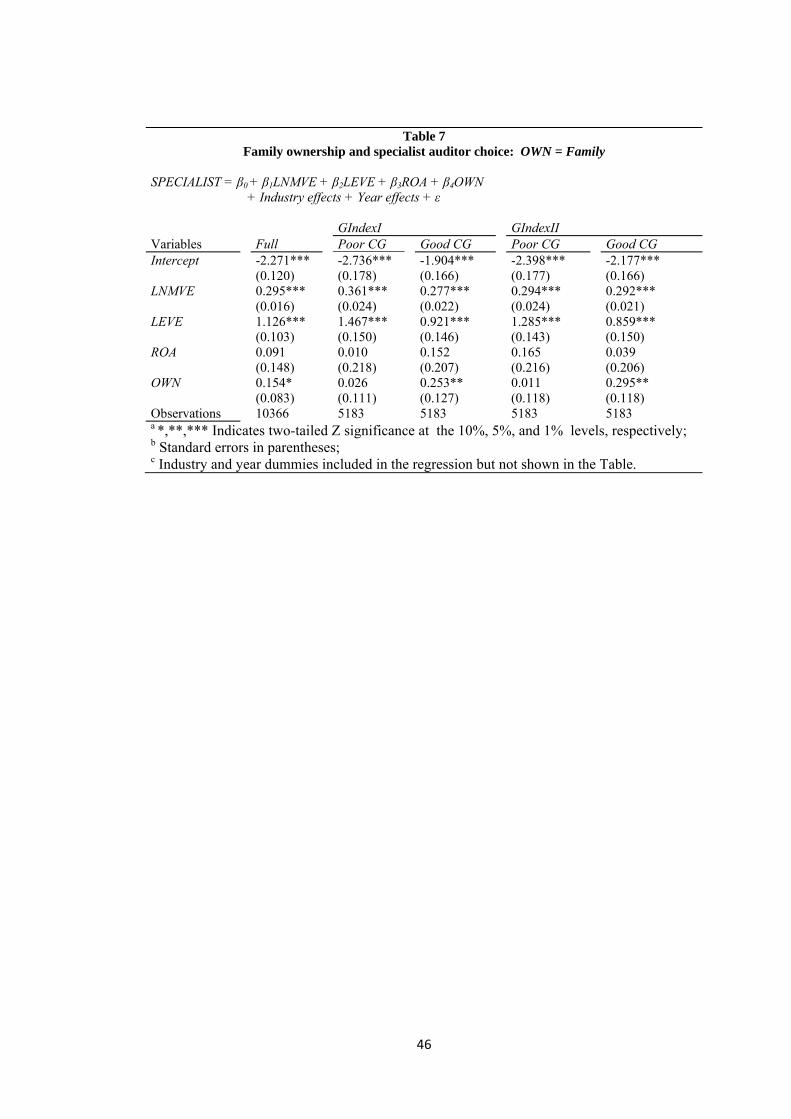
46
Table 7 Family ownership and specialist auditor choice: OWN = Family
SPECIALIST = β0 + β1LNMVE + β2LEVE + β3ROA + β4OWN + Industry effects + Year effects + ε GIndexI GIndexII Variables Full Poor CG Good CG Poor CG Good CG Intercept -2.271*** -2.736*** -1.904*** -2.398*** -2.177*** (0.120) (0.178) (0.166) (0.177) (0.166) LNMVE 0.295*** 0.361*** 0.277*** 0.294*** 0.292*** (0.016) (0.024) (0.022) (0.024) (0.021) LEVE 1.126*** 1.467*** 0.921*** 1.285*** 0.859*** (0.103) (0.150) (0.146) (0.143) (0.150) ROA 0.091 0.010 0.152 0.165 0.039 (0.148) (0.218) (0.207) (0.216) (0.206) OWN 0.154* 0.026 0.253** 0.011 0.295** (0.083) (0.111) (0.127) (0.118) (0.118) Observations 10366 5183 5183 5183 5183 a *,**,*** Indicates two-tailed Z significance at the 10%, 5%, and 1% levels, respectively; b Standard errors in parentheses; c Industry and year dummies included in the regression but not shown in the Table.
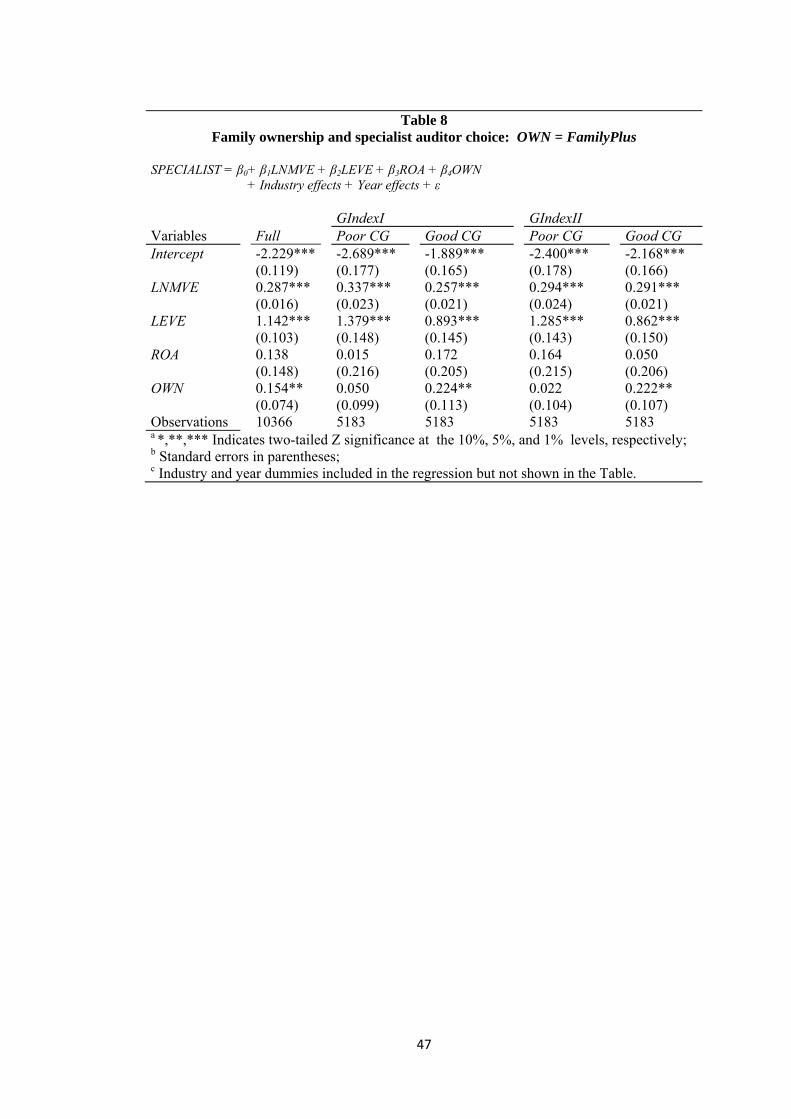
47
Table 8
Family ownership and specialist auditor choice: OWN = FamilyPlus
SPECIALIST = β0+ β1LNMVE + β2LEVE + β3ROA + β4OWN + Industry effects + Year effects + ε GIndexI GIndexII Variables Full Poor CG Good CG Poor CG Good CG Intercept -2.229*** -2.689*** -1.889*** -2.400*** -2.168*** (0.119) (0.177) (0.165) (0.178) (0.166) LNMVE 0.287*** 0.337*** 0.257*** 0.294*** 0.291*** (0.016) (0.023) (0.021) (0.024) (0.021) LEVE 1.142*** 1.379*** 0.893*** 1.285*** 0.862*** (0.103) (0.148) (0.145) (0.143) (0.150) ROA 0.138 0.015 0.172 0.164 0.050 (0.148) (0.216) (0.205) (0.215) (0.206) OWN 0.154** 0.050 0.224** 0.022 0.222** (0.074) (0.099) (0.113) (0.104) (0.107) Observations 10366 5183 5183 5183 5183 a *,**,*** Indicates two-tailed Z significance at the 10%, 5%, and 1% levels, respectively; b Standard errors in parentheses; c Industry and year dummies included in the regression but not shown in the Table.
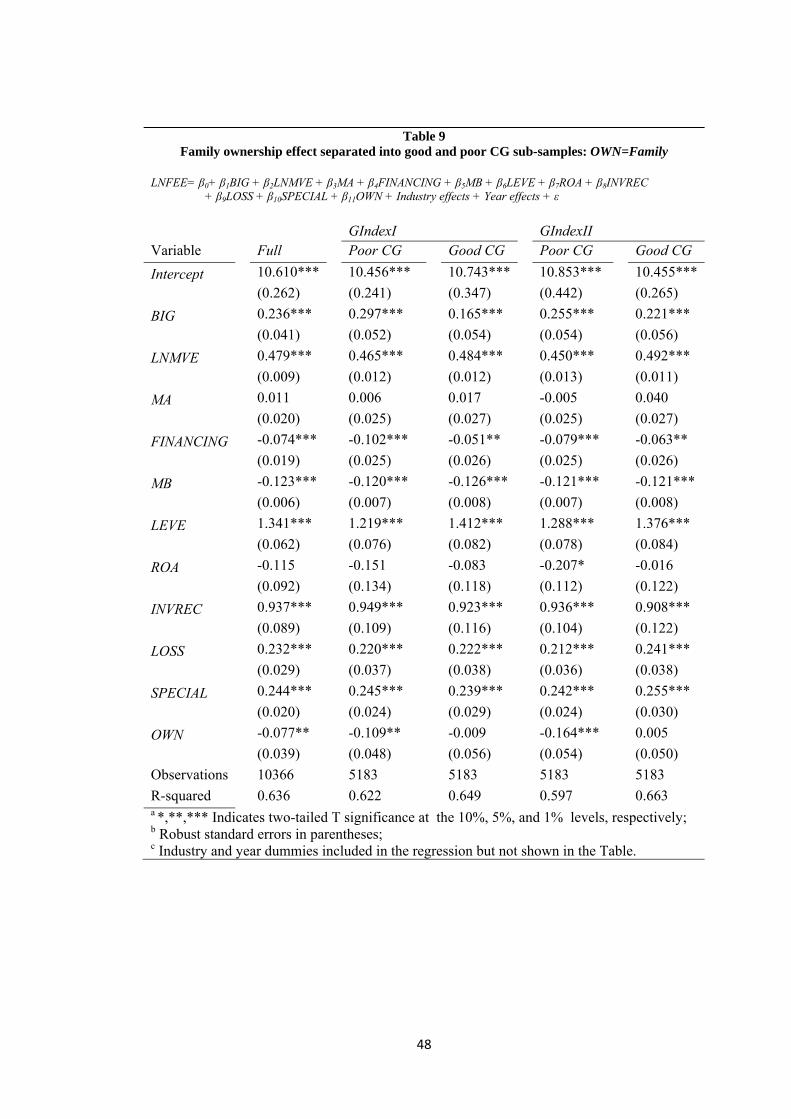
48
Table 9 Family ownership effect separated into good and poor CG sub-samples: OWN=Family
LNFEE= β0+ β1BIG + β2LNMVE + β3MA + β4FINANCING + β5MB + β6LEVE + β7ROA + β8INVREC
+ β9LOSS + β10SPECIAL + β11OWN + Industry effects + Year effects + ε GIndexI GIndexII Variable Full Poor CG Good CG Poor CG Good CG Intercept 10.610*** 10.456*** 10.743*** 10.853*** 10.455*** (0.262) (0.241) (0.347) (0.442) (0.265) BIG 0.236*** 0.297*** 0.165*** 0.255*** 0.221*** (0.041) (0.052) (0.054) (0.054) (0.056) LNMVE 0.479*** 0.465*** 0.484*** 0.450*** 0.492*** (0.009) (0.012) (0.012) (0.013) (0.011) MA 0.011 0.006 0.017 -0.005 0.040 (0.020) (0.025) (0.027) (0.025) (0.027) FINANCING -0.074*** -0.102*** -0.051** -0.079*** -0.063** (0.019) (0.025) (0.026) (0.025) (0.026) MB -0.123*** -0.120*** -0.126*** -0.121*** -0.121*** (0.006) (0.007) (0.008) (0.007) (0.008) LEVE 1.341*** 1.219*** 1.412*** 1.288*** 1.376*** (0.062) (0.076) (0.082) (0.078) (0.084) ROA -0.115 -0.151 -0.083 -0.207* -0.016 (0.092) (0.134) (0.118) (0.112) (0.122) INVREC 0.937*** 0.949*** 0.923*** 0.936*** 0.908*** (0.089) (0.109) (0.116) (0.104) (0.122) LOSS 0.232*** 0.220*** 0.222*** 0.212*** 0.241*** (0.029) (0.037) (0.038) (0.036) (0.038) SPECIAL 0.244*** 0.245*** 0.239*** 0.242*** 0.255*** (0.020) (0.024) (0.029) (0.024) (0.030) OWN -0.077** -0.109** -0.009 -0.164*** 0.005 (0.039) (0.048) (0.056) (0.054) (0.050) Observations 10366 5183 5183 5183 5183 R-squared 0.636 0.622 0.649 0.597 0.663 a *,**,*** Indicates two-tailed T significance at the 10%, 5%, and 1% levels, respectively; b Robust standard errors in parentheses; c Industry and year dummies included in the regression but not shown in the Table.

49
Table 10
Family ownership effect separated into good and poor CG sub-samples: OWN=FamliyPlus LNFEE = β0 + β1BIG + β2LNMVE + β3MA + β4FINANCING + β5MB + β6LEVE + β7ROA
+ β8INVREC + β9LOSS + β10SPECIAL + β11OWN + Industry effects + Year effects + ε
GIndexI GIndexII Variable Full Poor CG Good CG Poor CG Good CG Intercept 10.606*** 10.449*** 10.744*** 10.849*** 10.452*** (0.263) (0.243) (0.347) (0.444) (0.265) BIG 0.235*** 0.296*** 0.164*** 0.251*** 0.222*** (0.041) (0.053) (0.054) (0.055) (0.056) LNMVE 0.480*** 0.465*** 0.484*** 0.451*** 0.492*** (0.009) (0.012) (0.012) (0.013) (0.011) MA 0.012 0.008 0.017 -0.002 0.040 (0.020) (0.025) (0.027) (0.025) (0.027) FINANCING -0.073*** -0.101*** -0.051** -0.078*** -0.063** (0.019) (0.025) (0.026) (0.025) (0.026) MB -0.123*** -0.120*** -0.126*** -0.121*** -0.121*** (0.006) (0.007) (0.008) (0.007) (0.008) LEVE 1.340*** 1.217*** 1.411*** 1.287*** 1.377*** (0.062) (0.076) (0.082) (0.077) (0.084) ROA -0.116 -0.150 -0.083 -0.205* -0.016 (0.092) (0.134) (0.118) (0.112) (0.122) INVREC 0.936*** 0.946*** 0.923*** 0.929*** 0.908*** (0.089) (0.109) (0.116) (0.104) (0.122) LOSS 0.232*** 0.222*** 0.222*** 0.215*** 0.241*** (0.029) (0.037) (0.038) (0.036) (0.038) SPECIAL 0.245*** 0.245*** 0.239*** 0.243*** 0.255*** (0.020) (0.024) (0.029) (0.024) (0.030) OWN -0.064* -0.087** -0.014 -0.144*** 0.017 (0.036) (0.044) (0.050) (0.049) (0.048) Observations 10366 5183 5183 5183 5183 R-squared 0.636 0.622 0.649 0.597 0.663 a *,**,*** Indicates two-tailed T significance at the 10%, 5%, and 1% levels, respectively; b Robust standard errors in parentheses; c Industry and year dummies included in the regression but not shown in the Table.
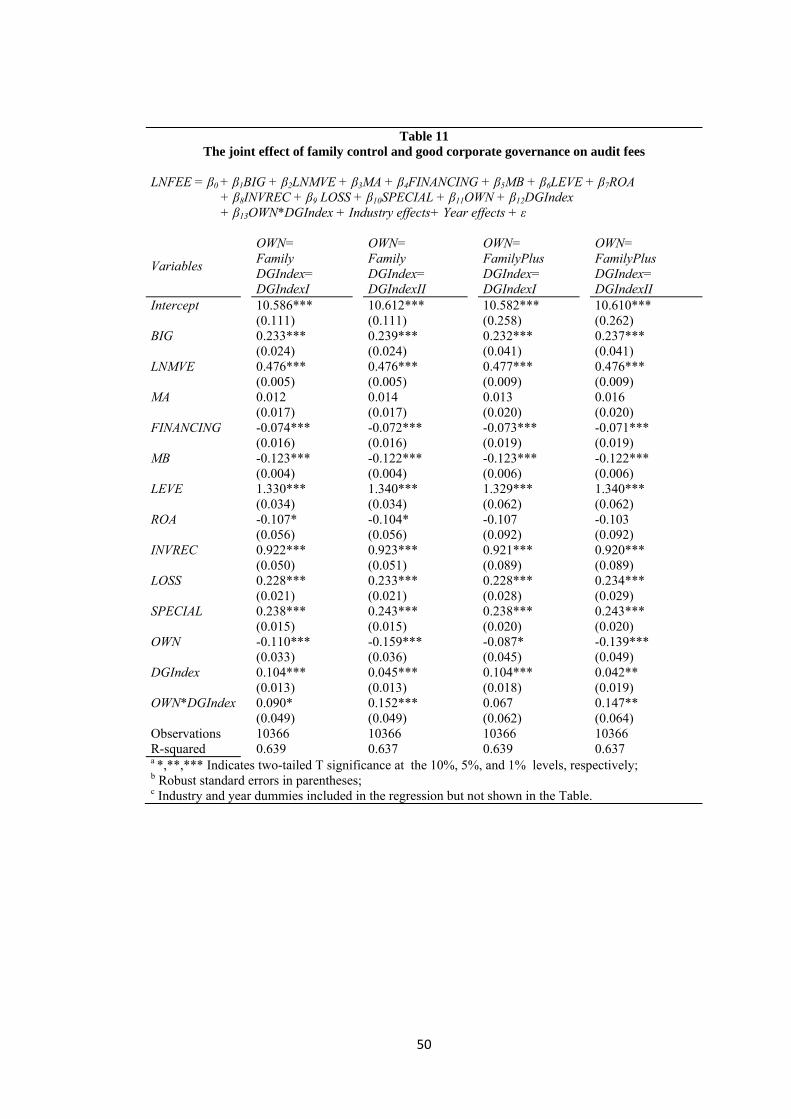
50
Table 11 The joint effect of family control and good corporate governance on audit fees
LNFEE = β0 + β1BIG + β2LNMVE + β3MA + β4FINANCING + β5MB + β6LEVE + β7ROA + β8INVREC + β9 LOSS + β10SPECIAL + β11OWN + β12DGIndex + β13OWN*DGIndex + Industry effects+ Year effects + ε
Variables
OWN= Family DGIndex= DGIndexI
OWN= Family DGIndex= DGIndexII
OWN= FamilyPlus DGIndex= DGIndexI
OWN= FamilyPlus DGIndex= DGIndexII
Intercept 10.586*** 10.612*** 10.582*** 10.610*** (0.111) (0.111) (0.258) (0.262) BIG 0.233*** 0.239*** 0.232*** 0.237*** (0.024) (0.024) (0.041) (0.041) LNMVE 0.476*** 0.476*** 0.477*** 0.476*** (0.005) (0.005) (0.009) (0.009) MA 0.012 0.014 0.013 0.016 (0.017) (0.017) (0.020) (0.020) FINANCING -0.074*** -0.072*** -0.073*** -0.071*** (0.016) (0.016) (0.019) (0.019) MB -0.123*** -0.122*** -0.123*** -0.122*** (0.004) (0.004) (0.006) (0.006) LEVE 1.330*** 1.340*** 1.329*** 1.340*** (0.034) (0.034) (0.062) (0.062) ROA -0.107* -0.104* -0.107 -0.103 (0.056) (0.056) (0.092) (0.092) INVREC 0.922*** 0.923*** 0.921*** 0.920*** (0.050) (0.051) (0.089) (0.089) LOSS 0.228*** 0.233*** 0.228*** 0.234*** (0.021) (0.021) (0.028) (0.029) SPECIAL 0.238*** 0.243*** 0.238*** 0.243*** (0.015) (0.015) (0.020) (0.020) OWN -0.110*** -0.159*** -0.087* -0.139*** (0.033) (0.036) (0.045) (0.049) DGIndex 0.104*** 0.045*** 0.104*** 0.042** (0.013) (0.013) (0.018) (0.019) OWN*DGIndex 0.090* 0.152*** 0.067 0.147** (0.049) (0.049) (0.062) (0.064) Observations 10366 10366 10366 10366 R-squared 0.639 0.637 0.639 0.637 a *,**,*** Indicates two-tailed T significance at the 10%, 5%, and 1% levels, respectively; b Robust standard errors in parentheses; c Industry and year dummies included in the regression but not shown in the Table.
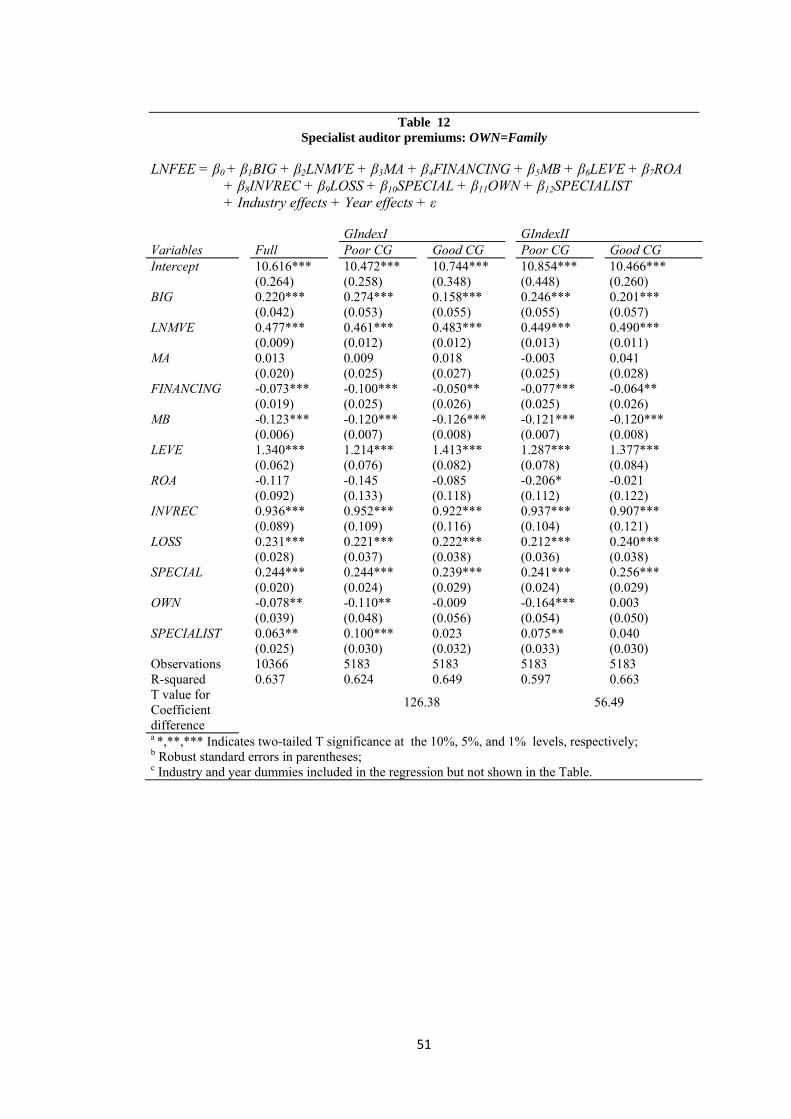
51
Table 12
Specialist auditor premiums: OWN=Family
LNFEE = β0 + β1BIG + β2LNMVE + β3MA + β4FINANCING + β5MB + β6LEVE + β7ROA + β8INVREC + β9LOSS + β10SPECIAL + β11OWN + β12SPECIALIST + Industry effects + Year effects + ε
GIndexI GIndexII Variables Full Poor CG Good CG Poor CG Good CG Intercept 10.616*** 10.472*** 10.744*** 10.854*** 10.466*** (0.264) (0.258) (0.348) (0.448) (0.260) BIG 0.220*** 0.274*** 0.158*** 0.246*** 0.201*** (0.042) (0.053) (0.055) (0.055) (0.057) LNMVE 0.477*** 0.461*** 0.483*** 0.449*** 0.490*** (0.009) (0.012) (0.012) (0.013) (0.011) MA 0.013 0.009 0.018 -0.003 0.041 (0.020) (0.025) (0.027) (0.025) (0.028) FINANCING -0.073*** -0.100*** -0.050** -0.077*** -0.064** (0.019) (0.025) (0.026) (0.025) (0.026) MB -0.123*** -0.120*** -0.126*** -0.121*** -0.120*** (0.006) (0.007) (0.008) (0.007) (0.008) LEVE 1.340*** 1.214*** 1.413*** 1.287*** 1.377*** (0.062) (0.076) (0.082) (0.078) (0.084) ROA -0.117 -0.145 -0.085 -0.206* -0.021 (0.092) (0.133) (0.118) (0.112) (0.122) INVREC 0.936*** 0.952*** 0.922*** 0.937*** 0.907*** (0.089) (0.109) (0.116) (0.104) (0.121) LOSS 0.231*** 0.221*** 0.222*** 0.212*** 0.240*** (0.028) (0.037) (0.038) (0.036) (0.038) SPECIAL 0.244*** 0.244*** 0.239*** 0.241*** 0.256*** (0.020) (0.024) (0.029) (0.024) (0.029) OWN -0.078** -0.110** -0.009 -0.164*** 0.003 (0.039) (0.048) (0.056) (0.054) (0.050) SPECIALIST 0.063** 0.100*** 0.023 0.075** 0.040 (0.025) (0.030) (0.032) (0.033) (0.030) Observations 10366 5183 5183 5183 5183 R-squared 0.637 0.624 0.649 0.597 0.663 T value for Coefficient difference
126.38
56.49
a *,**,*** Indicates two-tailed T significance at the 10%, 5%, and 1% levels, respectively; b Robust standard errors in parentheses; c Industry and year dummies included in the regression but not shown in the Table.
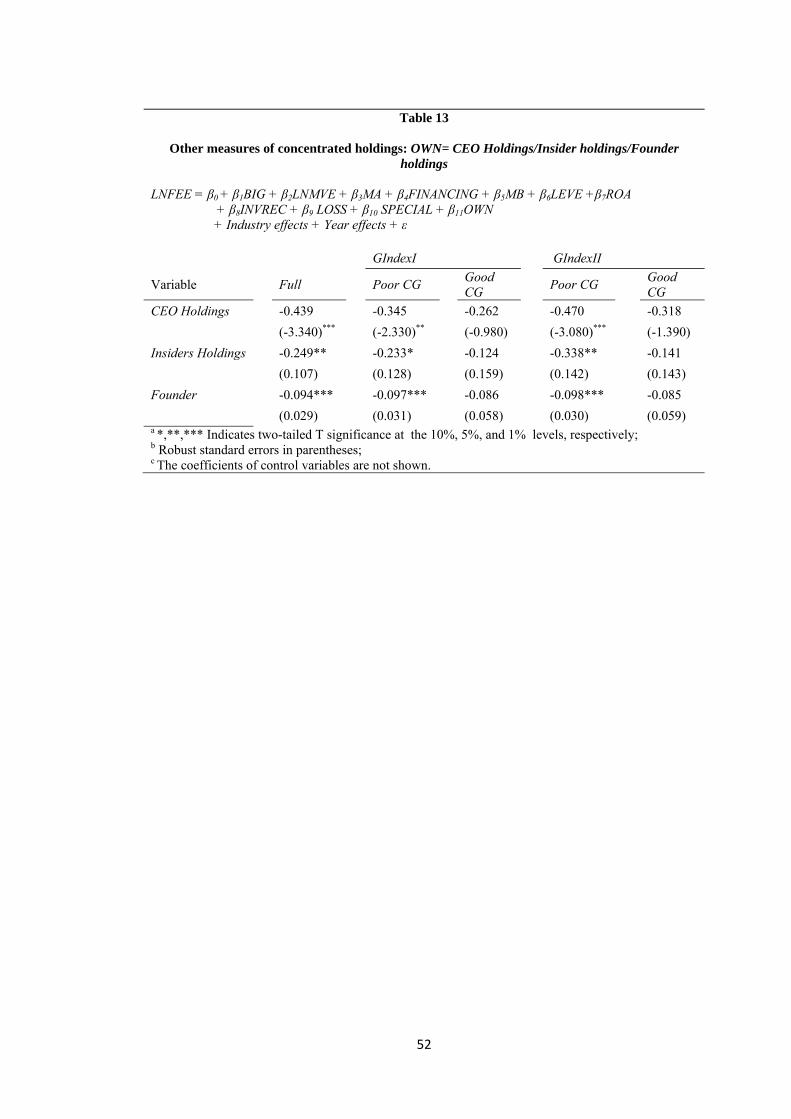
52
Table 13
Other measures of concentrated holdings: OWN= CEO Holdings/Insider holdings/Founder
holdings
LNFEE = β0 + β1BIG + β2LNMVE + β3MA + β4FINANCING + β5MB + β6LEVE +β7ROA + β8INVREC + β9 LOSS + β10 SPECIAL + β11OWN
+ Industry effects + Year effects + ε GIndexI GIndexII
Variable Full Poor CG Good CG Poor CG Good
CG CEO Holdings -0.439 -0.345 -0.262 -0.470 -0.318 (-3.340)*** (-2.330)** (-0.980) (-3.080)*** (-1.390)
Insiders Holdings -0.249** -0.233* -0.124 -0.338** -0.141 (0.107) (0.128) (0.159) (0.142) (0.143) Founder -0.094*** -0.097*** -0.086 -0.098*** -0.085 (0.029) (0.031) (0.058) (0.030) (0.059) a *,**,*** Indicates two-tailed T significance at the 10%, 5%, and 1% levels, respectively; b Robust standard errors in parentheses; c The coefficients of control variables are not shown.

53
Table 14
Results of regressions with different measures of family ownership separated into good and poor corporate governance firms using disaggregated
components of CG: OWN=Family
LNFEE = β0 + β1BIG + β2LNMVE + β3MA + β4FINANCING + β5MB + β6LEVE + β7ROA + β8INVREC + β9LOSS + β10SPECIAL + β11OWN + Industry effects + Year effects + ε
%Outsiders Independence Index Meetings Index Size Index CEO Power Variable Low High Low High Low High Small Big Strong Weak Intercept 10.782*** 10.557*** 10.576*** 10.728*** 10.480*** 10.812*** 10.505*** 11.010*** 10.790*** 10.215*** (0.168) (0.146) (0.173) (0.143) (0.163) (0.338) (0.160) (0.155) (0.311) (0.224) BIG 0.256*** 0.191*** 0.269*** 0.182*** 0.288*** 0.183*** 0.143*** 0.309*** 0.255*** 0.217*** (0.030) (0.040) (0.031) (0.039) (0.032) (0.057) (0.044) (0.029) (0.055) (0.054) LNMVE 0.441*** 0.507*** 0.429*** 0.508*** 0.452*** 0.494*** 0.505*** 0.404*** 0.481*** 0.479*** (0.008) (0.007) (0.008) (0.007) (0.007) (0.012) (0.007) (0.009) (0.011) (0.012) MA 0.028 -0.002 0.042* -0.014 0.034 -0.021 0.022 0.019 -0.014 0.035 (0.024) (0.023) (0.024) (0.022) (0.024) (0.025) (0.022) (0.025) (0.026) (0.027) FINANCING -0.093*** -0.054** -0.083*** -0.072*** -0.083*** -0.072*** -0.077*** -0.068*** -0.079*** -0.068** (0.023) (0.022) (0.023) (0.021) (0.021) (0.026) (0.022) (0.022) (0.024) (0.027) MB -0.119*** -0.123*** -0.113*** -0.129*** -0.111*** -0.126*** -0.131*** -0.104*** -0.117*** -0.129*** (0.005) (0.005) (0.006) (0.005) (0.005) (0.007) (0.005) (0.005) (0.007) (0.008) LEVE 1.300*** 1.314*** 1.250*** 1.365*** 1.207*** 1.381*** 1.559*** 1.081*** 1.264*** 1.419*** (0.049) (0.047) (0.049) (0.046) (0.048) (0.077) (0.049) (0.047) (0.076) (0.081) ROA 0.060 -0.328*** 0.026 -0.279*** -0.178** -0.040 -0.336*** 0.089 -0.314*** 0.054 (0.077) (0.082) (0.077) (0.081) (0.083) (0.122) (0.085) (0.074) (0.110) (0.136) INVREC 0.873*** 0.995*** 0.794*** 1.067*** 0.941*** 0.976*** 1.040*** 0.820*** 1.095*** 0.766*** (0.071) (0.071) (0.072) (0.070) (0.068) (0.118) (0.072) (0.070) (0.106) (0.116) LOSS 0.269*** 0.192*** 0.257*** 0.199*** 0.205*** 0.226*** 0.193*** 0.250*** 0.189*** 0.269*** (0.030) (0.030) (0.030) (0.030) (0.031) (0.038) (0.031) (0.029) (0.037) (0.039) SPECIAL 0.266*** 0.211*** 0.273*** 0.199*** 0.247*** 0.215*** 0.221*** 0.259*** 0.239*** 0.249*** (0.021) (0.022) (0.022) (0.021) (0.020) (0.028) (0.022) (0.021) (0.024) (0.028) OWN -0.055* -0.032 -0.070** 0.043 -0.061* -0.065 -0.085** -0.051 -0.145*** -0.011 (0.029) (0.058) (0.030) (0.048) (0.032) (0.053) (0.037) (0.034) (0.054) (0.051) Obs. 5183 5183 5180 5186 5195 5171 5165 5201 5231 5135 R-squared 0.586 0.674 0.564 0.686 0.614 0.653 0.670 0.506 0.661 0.616 a *,**,*** Indicates two-tailed T significance at the 10%, 5%, and 1% levels, respectively; b Robust standard errors in parentheses;

54
c Industry and year dummies included in the regression but not shown in the Table.
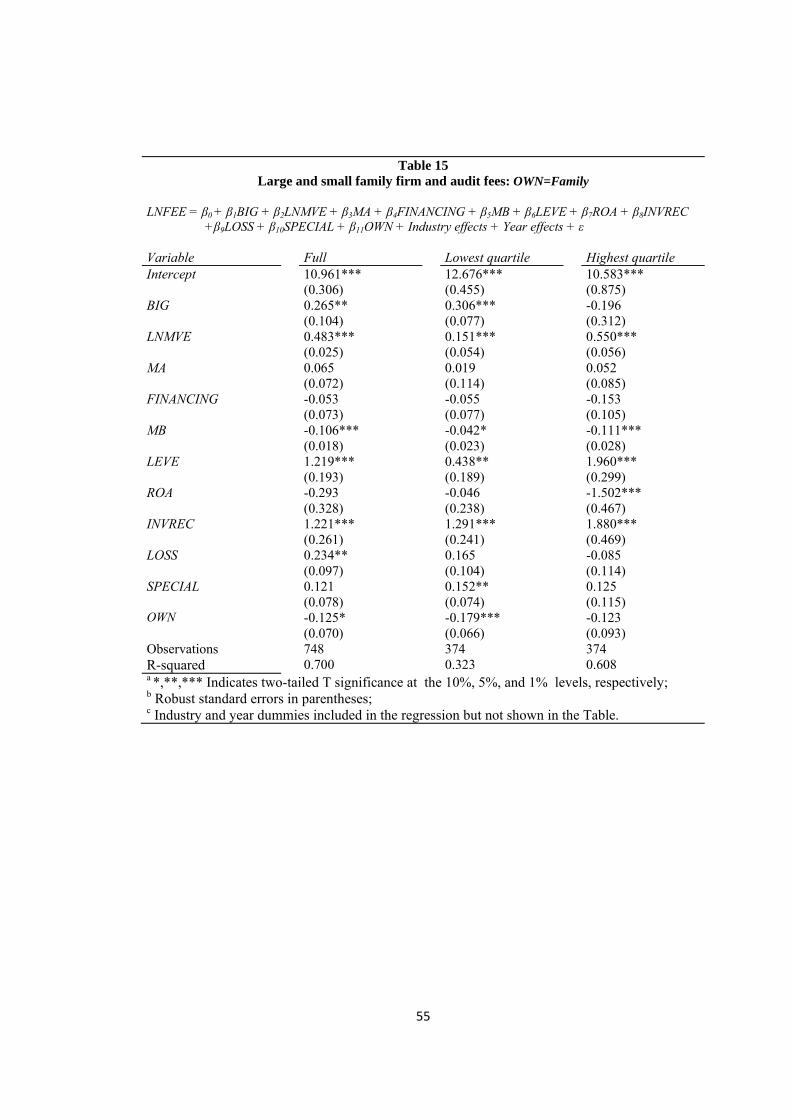
55
Table 15
Large and small family firm and audit fees: OWN=Family LNFEE = β0 + β1BIG + β2LNMVE + β3MA + β4FINANCING + β5MB + β6LEVE + β7ROA + β8INVREC
+β9LOSS + β10SPECIAL + β11OWN + Industry effects + Year effects + ε Variable Full Lowest quartile Highest quartile Intercept 10.961*** 12.676*** 10.583*** (0.306) (0.455) (0.875) BIG 0.265** 0.306*** -0.196 (0.104) (0.077) (0.312) LNMVE 0.483*** 0.151*** 0.550*** (0.025) (0.054) (0.056) MA 0.065 0.019 0.052 (0.072) (0.114) (0.085) FINANCING -0.053 -0.055 -0.153 (0.073) (0.077) (0.105) MB -0.106*** -0.042* -0.111*** (0.018) (0.023) (0.028) LEVE 1.219*** 0.438** 1.960*** (0.193) (0.189) (0.299) ROA -0.293 -0.046 -1.502*** (0.328) (0.238) (0.467) INVREC 1.221*** 1.291*** 1.880*** (0.261) (0.241) (0.469) LOSS 0.234** 0.165 -0.085 (0.097) (0.104) (0.114) SPECIAL 0.121 0.152** 0.125 (0.078) (0.074) (0.115) OWN -0.125* -0.179*** -0.123 (0.070) (0.066) (0.093) Observations 748 374 374 R-squared 0.700 0.323 0.608 a *,**,*** Indicates two-tailed T significance at the 10%, 5%, and 1% levels, respectively; b Robust standard errors in parentheses; c Industry and year dummies included in the regression but not shown in the Table.
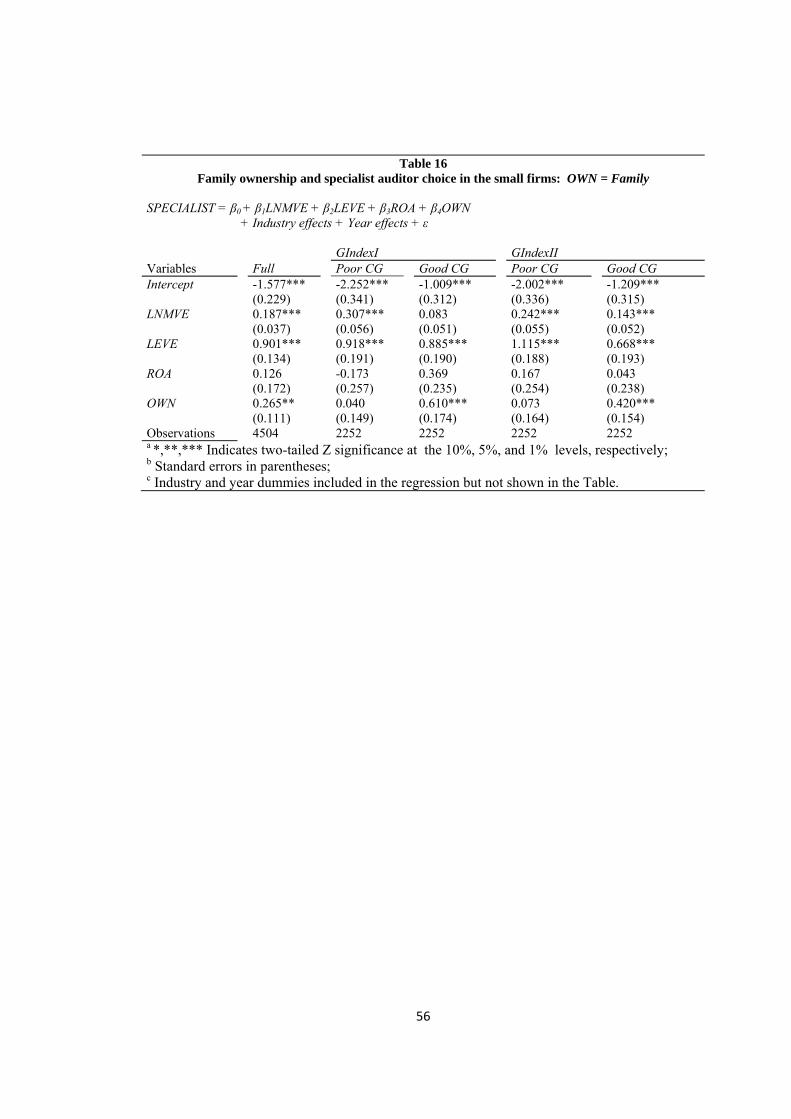
56
Table 16
Family ownership and specialist auditor choice in the small firms: OWN = Family
SPECIALIST = β0 + β1LNMVE + β2LEVE + β3ROA + β4OWN + Industry effects + Year effects + ε GIndexI GIndexII Variables Full Poor CG Good CG Poor CG Good CG Intercept -1.577*** -2.252*** -1.009*** -2.002*** -1.209*** (0.229) (0.341) (0.312) (0.336) (0.315) LNMVE 0.187*** 0.307*** 0.083 0.242*** 0.143*** (0.037) (0.056) (0.051) (0.055) (0.052) LEVE 0.901*** 0.918*** 0.885*** 1.115*** 0.668*** (0.134) (0.191) (0.190) (0.188) (0.193) ROA 0.126 -0.173 0.369 0.167 0.043 (0.172) (0.257) (0.235) (0.254) (0.238) OWN 0.265** 0.040 0.610*** 0.073 0.420*** (0.111) (0.149) (0.174) (0.164) (0.154) Observations 4504 2252 2252 2252 2252 a *,**,*** Indicates two-tailed Z significance at the 10%, 5%, and 1% levels, respectively; b Standard errors in parentheses; c Industry and year dummies included in the regression but not shown in the Table.
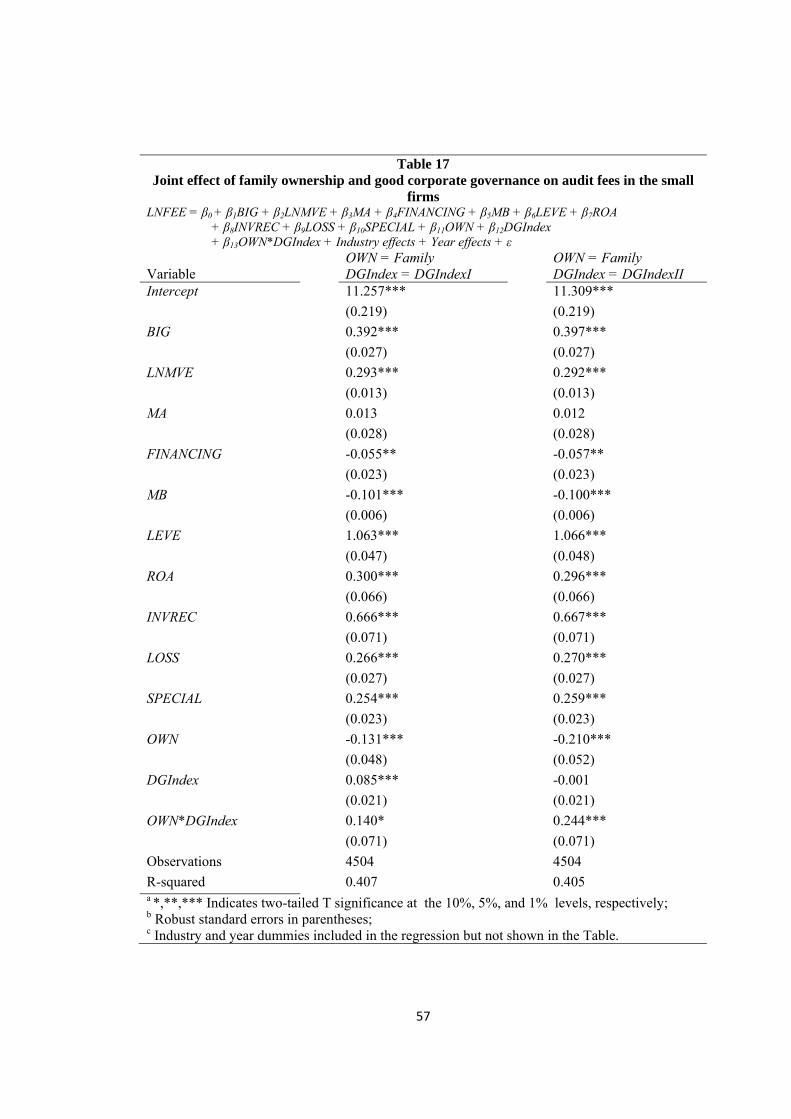
57
Table 17
Joint effect of family ownership and good corporate governance on audit fees in the small firms
LNFEE = β0 + β1BIG + β2LNMVE + β3MA + β4FINANCING + β5MB + β6LEVE + β7ROA + β8INVREC + β9LOSS + β10SPECIAL + β11OWN + β12DGIndex + β13OWN*DGIndex + Industry effects + Year effects + ε Variable
OWN = Family DGIndex = DGIndexI
OWN = Family DGIndex = DGIndexII
Intercept 11.257*** 11.309*** (0.219) (0.219) BIG 0.392*** 0.397*** (0.027) (0.027) LNMVE 0.293*** 0.292*** (0.013) (0.013) MA 0.013 0.012 (0.028) (0.028) FINANCING -0.055** -0.057** (0.023) (0.023) MB -0.101*** -0.100*** (0.006) (0.006) LEVE 1.063*** 1.066*** (0.047) (0.048) ROA 0.300*** 0.296*** (0.066) (0.066) INVREC 0.666*** 0.667*** (0.071) (0.071) LOSS 0.266*** 0.270*** (0.027) (0.027) SPECIAL 0.254*** 0.259*** (0.023) (0.023) OWN -0.131*** -0.210*** (0.048) (0.052) DGIndex 0.085*** -0.001 (0.021) (0.021) OWN*DGIndex 0.140* 0.244*** (0.071) (0.071) Observations 4504 4504 R-squared 0.407 0.405 a *,**,*** Indicates two-tailed T significance at the 10%, 5%, and 1% levels, respectively; b Robust standard errors in parentheses; c Industry and year dummies included in the regression but not shown in the Table.
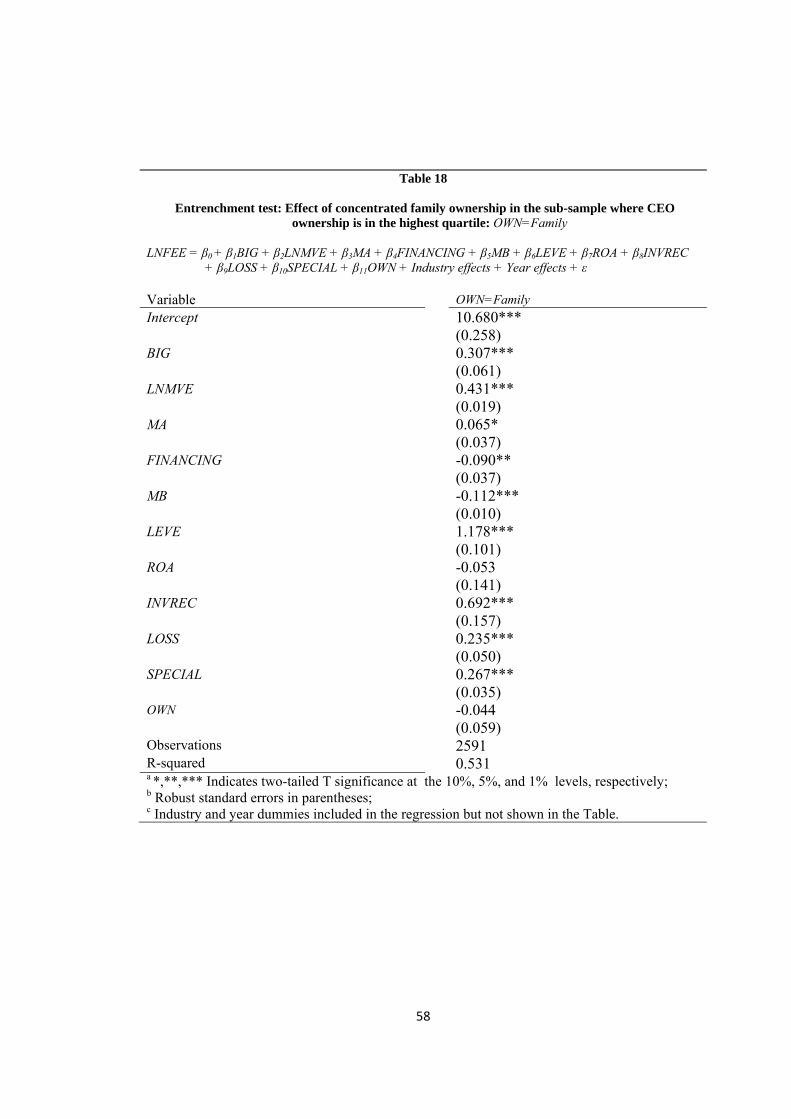
58
Table 18
Entrenchment test: Effect of concentrated family ownership in the sub-sample where CEO ownership is in the highest quartile: OWN=Family
LNFEE = β0 + β1BIG + β2LNMVE + β3MA + β4FINANCING + β5MB + β6LEVE + β7ROA + β8INVREC
+ β9LOSS + β10SPECIAL + β11OWN + Industry effects + Year effects + ε Variable OWN=Family Intercept 10.680*** (0.258) BIG 0.307*** (0.061) LNMVE 0.431*** (0.019) MA 0.065* (0.037) FINANCING -0.090** (0.037) MB -0.112*** (0.010) LEVE 1.178*** (0.101) ROA -0.053 (0.141) INVREC 0.692*** (0.157) LOSS 0.235*** (0.050) SPECIAL 0.267*** (0.035) OWN -0.044 (0.059) Observations 2591 R-squared 0.531 a *,**,*** Indicates two-tailed T significance at the 10%, 5%, and 1% levels, respectively; b Robust standard errors in parentheses; c Industry and year dummies included in the regression but not shown in the Table.
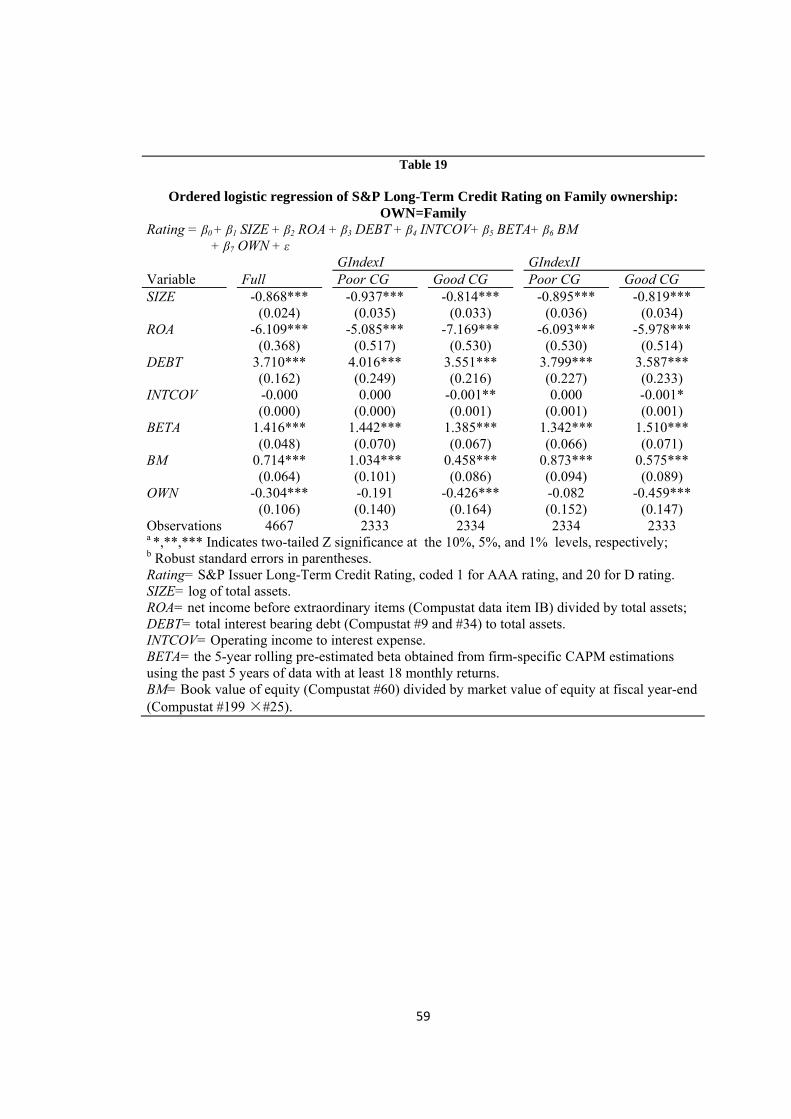
59
Table 19
Ordered logistic regression of S&P Long-Term Credit Rating on Family ownership:
OWN=Family Rating = β0 + β1 SIZE + β2 ROA + β3 DEBT + β4 INTCOV+ β5 BETA+ β6 BM
+ β7 OWN + ε GIndexI GIndexII Variable Full Poor CG Good CG Poor CG Good CG SIZE -0.868*** -0.937*** -0.814*** -0.895*** -0.819*** (0.024) (0.035) (0.033) (0.036) (0.034) ROA -6.109*** -5.085*** -7.169*** -6.093*** -5.978*** (0.368) (0.517) (0.530) (0.530) (0.514) DEBT 3.710*** 4.016*** 3.551*** 3.799*** 3.587*** (0.162) (0.249) (0.216) (0.227) (0.233) INTCOV -0.000 0.000 -0.001** 0.000 -0.001* (0.000) (0.000) (0.001) (0.001) (0.001) BETA 1.416*** 1.442*** 1.385*** 1.342*** 1.510*** (0.048) (0.070) (0.067) (0.066) (0.071) BM 0.714*** 1.034*** 0.458*** 0.873*** 0.575*** (0.064) (0.101) (0.086) (0.094) (0.089) OWN -0.304*** -0.191 -0.426*** -0.082 -0.459*** (0.106) (0.140) (0.164) (0.152) (0.147) Observations 4667 2333 2334 2334 2333 a *,**,*** Indicates two-tailed Z significance at the 10%, 5%, and 1% levels, respectively; b Robust standard errors in parentheses. Rating= S&P Issuer Long-Term Credit Rating, coded 1 for AAA rating, and 20 for D rating. SIZE= log of total assets. ROA= net income before extraordinary items (Compustat data item IB) divided by total assets; DEBT= total interest bearing debt (Compustat #9 and #34) to total assets. INTCOV= Operating income to interest expense. BETA= the 5-year rolling pre-estimated beta obtained from firm-specific CAPM estimations using the past 5 years of data with at least 18 monthly returns. BM= Book value of equity (Compustat #60) divided by market value of equity at fiscal year-end (Compustat #199 ×#25).
60
References Abbott, L. J., S. Parker, and G. F. Peters. 2006. Earnings Management, Litigation Risk, and
Asymmetric Audit Fee Responses. Auditing: A Journal of Practice and Theory 25 (1):85-98.
Abbott, L. J., S. Parker, G. F. Peters, and K. Raghunandan. 2003. The Association between
Audit Committee Characteristics and Audit Fees. Auditing: A Journal of Practice and Theory 22 (2):17-32.
Adams, R., and D. Ferreira. 2009. Women in the boardroom and their impact on governance and
performance. Journal of Financial Economics 94 (2):291. Adams, R. B., and D. Ferreira. 2007. A Theory of Friendly Boards. The Journal of Finance 62
(1):217-250. Ali, A., T.-Y. Chen, and S. Radhakrishnan. 2007. Corporate disclosures by family firms. Journal
of Accounting & Economics 44 (1/2):238-286. Almazan, A., and J. Suarez. 2003. Entrenchment and severance pay in optimal governance
structures. The Journal of Finance 58 (2):519-547. Andersen, R. C., S. A. Mansi, and D. M. Reeb. 2004. Board characterisitics, accounting
reporting integrity, and the cost of debt. Journal of Accounting & Economics 37 (3):315. Anderson, R., A. Duru, and D. Reeb. 2009. Founders, heirs, and corporate opacity in the United
States. Journal of Financial Economics 92 (2):205-221. Anderson, R. C., and D. M. Reeb. 2003. Founding-family ownership and firm performance:
Evidence from the S&P 500. The Journal of Finance 58 (3):1301-1328. ———. 2004. Board Composition: Balancing family influence in S&P 500 firms.
Administrative Science Quarterly 49 (2):209-237. Ascioglu, A., S. Hegde, P. , and J. McDermott, B. . 2005. Auditor compensation, disclosure
quality, and market liquidity: Evidence from the stock market. Journal of Accounting and Public Policy 24 (4):325.
Ashbaugh, H., R. LaFond, and B. Mayhew, W. . 2003. Do nonaudit services compromise auditor
independence? Further evidence. The Accounting Review 78 (3):611. Asthana, S., S. Balsam, and S. Kim. 2004. The Effect of Enron, Andersen, and Sarbanes-Oxley
on the Market for Audit Services: SSRN. Barnes, L. B., and S. A. Hershon. 1976. Transferring power in the family business. Harvard
Business Review LIV:105-114.

61
Barnhart, S. W., M. F. Spivey, and J. C. Alexander. 2000. Do firm and state antitakeover provisions affect how well CEOs earn their pay? Managerial and Decision Economics 21 (8):315.
Barron, O., J. Pratt, and J. D. Stice. 2001. Misstatement direction, litigation risk, and planned
audit investment. Journal of Accounting Research 39 (3):449-462. Bartov, E., and D. A. Cohen. 2006. Mechanisms to Meet/Beat Analyst Earnings Expectations in
the Pre- and Post-Sarbanes-Oxley Eras: SSRN. Bedard, J., C. , and K. Johnstone, M. . 2004. Earnings Manipulation Risk, Corporate Governance
Risk, and Auditors' Planning and Pricing Decisions. The Accounting Review 79 (2):277. Boone, A. L., L. C. Field, J. M. Karpoff, and C. G. Raheja. 2007. The determinants of corporate
board size and composition: An empirical analysis*. Journal of Financial Economics 85:66-101.
Burkart, M., F. Panunzi, and A. Shleifer. 2003. Family firms. The Journal of Finance 58
(5):2167-2202. Carcello, J. V., D. R. Hermanson, T. L. Neal, and J. Richard A. Riley. 2002. Board
characteristics and audit fees. Contemporary Accounting Research 19 (3):365. Carcello, J. V., C. W. Hollingsworth, A. Klein, and T. L. Neal. 2006. Audit Committee Financial
Expertise, Competing Corporate Governance Mechanisms, and Earnings Management, http://ssrn.com/paper=887512. In SSRN eLibrary.
Chambers, D. J., and J. L. Payne. 2008. Audit Quality and Accrual Reliability: Evidence from
the Pre- and Post-Sarbanes-Oxley Periods: SSRN. Cheng, Q., and T. D. Warfield. 2005. Equity Incentives and Earnings Management. The
Accounting Review 80 (2):441-476. Ciesielski, J. T., and T. R. Weirich. 2006. Ups and Downs of Audit Fees Since the Sarbanes-
Oxley Act. The CPA Journal 76 (10):28. Claessens, S., S. Djankov, J. P. H. Fan, and L. H. P. Lang. 2002. Disentangling the incentive and
entrenchment effects of large shareholdings. The Journal of Finance 57 (6):2741. Cohen, J., G. Krishnamoorthy, and A. M. Wright. 2002. Corporate governance and the audit
process. Contemporary Accounting Research 19 (4):573-594. Cotter, J., and M. Sylvester. 2003. Board and monitoring committee independence. Abacus 39
(2):211. Dechow, P. M., R. G. Sloan, and A. P. Hutton. 1996. Causes and Consequences of Earnings
Manipulation: An Analysis of Firms Subject to Enforcement Actions by the SEC. Contemporary Accounting Research 13 (1):1-36.
Demsetz, H., and K. Lehn. 1985. The Structure of Corporate Ownership: Causes and
Consequences. The Journal of Political Economy 93 (6):1155-1177.
62
Fan, J. P. H., and T. J. Wong. 2005. Do External Auditors Perform a Corporate Governance Role
in Emerging Markets? Evidence from East Asia. Journal of Accounting Research 43 (1):35.
Frankel, R., M. , M. Johnson, F. , and K. Nelson, K. . 2002. The Relation between Auditors' Fees
for Nonaudit Services and Earnings Management. The Accounting Review 77:71. Francis, J., D. Nanda, and P. Olsson, 2008. Voluntary Disclosure, Earnings Quality, and Cost of
Capital. Journal of Accounting Research 46(1):53-99. Gabrielsen, G., J. D. Gramlich, and T. Plenborg. 2002. Managerial ownership, information
content of earnings, and discretionary accruals in a non-US setting. Journal of Business Finance & Accounting 29 (7/8):967-988.
García-Meca, E., and J. Sánchez-Ballesta. 2009. Corporate Governance and Earnings
Management: A Meta-Analysis. Corporate Governance : An International Review 17 (5):594.
Gompers, P., J. Ishii, and A. Metrick. 2003. Corporate governance and equity prices. The
Quarterly Journal of Economics 118 (1):107. Griffin, P., D. Lont, and Y. Sun. 2008. Corporate Governance and Audit Fees: Evidence of
Countervailing Relations. Guedhami, O., and J. Pittman. 2006. Ownership Concentration in Privatized Firms: The Role of
Disclosure Standards, Auditor Choice, and Auditing Infrastructure. Journal of Accounting Research 44 (5):889-929.
Guedhami, O., J. Pittman, and W. Saffar. 2009. Auditor choice in privatized firms: Empirical
evidence on the role of state and foreign owners. Journal of Accounting & Economics 48 (2/3):151-171.
Gul, F. A. 2006. Auditors' Response to Political Connections and Cronyism in Malaysia. Journal
of Accounting Research 44 (5):931-963. Gul, F. A., C. Chen, J. P. , and J. Tsui, S. L. . 2003. Discretionary accounting accruals,
managers' incentives, and audit fees. Contemporary Accounting Research 20 (3):441. Gul, F. A., and S. Leung. 2004. Board leadership, outside directors' expertise and voluntary
corporate disclosures. Journal of Accounting and Public Policy 23 (5):351. Gul, F. A., S. Lynn, and J. Tsui, S. L. 2002. Audit quality, management ownership, and the
informativeness of accounting earnings. Journal of Accounting, Auditing & Finance 17 (1):25.
Gul, F. A., B. Srinidhi, and J. S. Tsui. 2008. Board Diversity and the Demand for Higher Audit
Effort; http://ssrn.com/paper=1359450. SSRN eLibrary.
63
Gul, F. A., B. Srinidhi, and J. S. L. Tsui. 2007. Do Female Directors Enhance Corporate Governance? Some Evidence On Earnings Quality, Working Paper, The HK Polytechnic University.
Harrington, C. 2003. The new accounting environment. Journal of Accountancy 196 (2):28. Hay, D. C., R. Knechel, and N. Wong. 2006. Audit Fees: A Meta-analysis of the Effect of
Supply and Demand Attributes. Contemporary Accounting Research 23 (1):141. Heninger, W. G. 2001. The association between auditor litigation and abnormal accruals. The
Accounting Review 76 (1):111-126. Hossain, M., C. Lim, and P. Tan, 2010. Corporate Governance, Legal Environment, and Auditor
Choice in Emerging Markets. Review of Pacific Basin Financial Markets & Policies 13(1): 91-126.
Hu, A., and P. Kumar. 2004. Managerial Entrenchment and Payout Policy. Journal of Financial
and Quantitative Analysis 39 (4):759. Jensen, M. C., and W. H.Meckling. 1976. Theory of the Firm: Managerial Behavior, Agency
Costs and Ownership Structure. Journal of Financial Economics 3 (4):305-360. Jung, K., and S. Y. Kwon. 2002. Ownership structure and earnings informativeness: Evidence
from Korea. The International Journal of Accounting 37 (3):301-325. Kinney, W. R., Z.-V. Palmrose, and S. Scholz. 2004. Auditor Independence, Non-Audit Services,
and Restatements: Was the U.S. Government Right? Journal of Accounting Research 42 (3):561.
Knechel, W. R., and M. Willekens. 2006. The Role of Risk Management and Governance in
Determining Audit Demand. Journal of Business Finance & Accounting 33 (9/10):1344-1367.
Krishnan, G., and G. Visvanathan. 2009. Do Auditors Price Audit Committee's Expertise? The
Case of Accounting versus Nonaccounting Financial Experts. Journal of Accounting, Auditing & Finance 24 (1):115-144.
Lansberg S, I. 1983. Managing Human Resources in Family Firms: The Problem of Institutional
Overlap. Organizational Dynamics 12 (1):39-46. Larcker, D., F. , and S. Richardson, A. 2004. Fees Paid to Audit Firms, Accrual Choices, and
Corporate Governance. Journal of Accounting Research 42 (3):625. Larcker, D. F., S. A. Richardson, and I. Tuna. 2007. Corporate Governance, Accounting
Outcomes, and Organizational Performance. The Accounting Review 82 (4):963-1008. Leuz, C., D. Nanda, and P. Wysocki, D. . 2003. Earnings management and investor protection:
an international comparison. Journal of Financial Economics 69 (3):505. Levinson, H. 1971. Conflicts that plague family businesses. Harvard Business Review:90-98.

64
Linck, J. S., J. M. Netter, and T. Yang. 2008. The determinants of board structure. Journal of Financial Economics 87 (2):308-328.
Lin, Z. Jun, and Ming Liu, 2009.The impact of corporate governance on auditor choice:
Evidence from China. Journal of International Accounting, Auditing & Taxation 18(1):44-59.
Miller, D., I. Le Breton-Miller, R. H. Lester, and A. A. Cannella Jr. 2007. Are family firms
really superior performers? Journal of Corporate Finance 13 (5):829-858. Mitra, Santanu, Mahmud Hossain, and Donald Deis, 2007. The empirical relationship between
ownership characteristics and audit fees. Review of Quantitative Finance & Accounting 28(3):257-285.
Morck, R., A. Shleifer, and R. W. Vishny. 1988. Management Ownership and Market Valuation:
An Empirical Analysis. Journal of Financial Economics 20 (1,2):293. Nikkinen, Jussi and Petri Sahlstrom, 2004. Does Agency Theory Provide a General Framework
for Audit Pricing? International Journal of Auditing 8(3):253-262. Oei, R., A. Ramsay, and P. Mather. 2008. Earnings persistence, accruals and managerial share
ownership. Accounting and Finance 48 (3):475-502. Osma, B. G. 2008. Board Independence and Real Earnings Management: The Case of R&D
Expenditure. Corporate Governance : An International Review 16 (2):116. Pratt, J., and J. D. Stice. 1994. The effects of client characteristics on auditor litigation risk
judgments, required audit evidence and recommended audit fees. The Accounting Review 69 (4):639-656.
Raheja, C. G. 2005. Determinants of Board Size and Composition: A Theory of Corporate
Boards. Journal of Financial and Quantitative Analysis 40 (2):283. SEC. 1999. Final Rule on Audit Committee Disclosure. Simon, D. T., and J. R. Francis. 1988. The Effects of Auditor Change on Audit Fees: Tests of
Price Cutting and Price Recovery. The Accounting Review 63 (2):255-269. Simunic, D. A. 1980. The Pricing of Audit Services: Theory and Evidence. Journal of
Accounting Research 18 (1):161. Simunic, D. A., and M. T. Stein. 1996. Impact of litigation risk on audit pricing: A review of the
economics and the evidence. Auditing 15:119. Sunder, S. 2003. Rethinking the Structure of Accounting and Auditing. Indian Accounting
Review 7 (1):1-15. Teoh, S. H., and T. J. Wong. 1993. Perceived auditor quality and the earnings response
coefficient. The Accounting Review 68 (2):346-366.

65
Tsui, J. S. L., B. Jaggi, and F. A. Gul. 2001. CEO domination, growth opportunities, and their impact on audit fees. Journal of Accounting, Auditing & Finance 16 (3):189.
Vafeas, Nikos and James Waegelein, 2007.The association between audit committees, compensation incentives, and corporate audit fees. Review of Quantitative Finance & Accounting 28(3):241-255.
Villalonga, B., and R. Amit. 2006. How do family ownership, control and management affect
firm value? Journal of Financial Economics 80 (2):385-417. Wang, Qian, T.J. Wong, and Lijun Xia, 2008. State ownership, the institutional environment,
and auditor choice: Evidence from China. Journal of Accounting & Economics 46(1):112-134.
Wang, D. 2006. Founding Family Ownership and Earnings Quality. Journal of Accounting
Research 44 (3):619-656. Warfield, T. D., J. J. Wild, and K. L. Wild. 1995. Managerial ownership, accounting choices,
and informativeness of earnings. Journal of Accounting & Economics 20 (1):61. Watts, R., and J. L. Zimmerman. 1983. Agency Problems, Auditing, and the Theory of the Firm:
Some Evidence. Journal of Law and Economics XXVI (October):613-633. Yeo, G., H. H. , P. Tan, M. S. , K. W. Ho, and S.-S. Chen. 2002. Corporate ownership structure
and the informativeness of earnings. Journal of Business Finance & Accounting 29 (7/8):1023-1046.
Yermack, D. 1996. Higher market valuation of companies with a small board of directors.
Journal of Financial Economics 40 (2):185-211.
Related Documents