Cluster Review In 2021, the Group made progress on its journey of adapting its operating model to the global pace of change, as uncertainty endured. In parallel, it continued to revisit and reshape its asset allocation strategy and de-risk the profile of its portfolio. • CIEL Textile Continued and robust momentum in the Textile cluster with an outstanding performance from the Knits and Knitwear segments led to a 2.4 times increase in the cluster’s EBITDA versus the prior period, further supported by favourable exchange rates despite higher raw material prices, logistics and restructuring costs. All lines of business are currently seeing an increase in demand, coming back from pre-COVID levels, following the reopening of our main markets, namely the UK, EU and USA, the renewed competitiveness of our operations and the ongoing supply chain shift away from China. The risk of new lockdowns in countries where the Textile cluster operates, particularly in India and Madagascar, continues to be on the agenda if local vaccination rates remain low. In August 2021, CIEL Textile, through its subsidiary Aquarelle, entered a strategic partnership with the SOCOTA Group (COTONA) in Madagascar for the creation of the largest woven fabric mill in the Indian Ocean region which should ensure the sustainability and competitiveness of our woven operations in the region. • CIEL Finance The Finance cluster continued to show resilience with a 5% increase in EBITDA on the prior period, a good performance given the high pandemic related risk provisions under the IFRS 9 model. However specific write-offs on the loan book for our two banks have cumulatively been reduced by 65% over the prior year. The strength of the banking operations in Madagascar is reflected in the revenue increase over the last twelve months leading to excellent fourth quarter profits. The banking businesses maintained strong capital and liquidity positions, giving management the opportunity to invest in growth and digital transformation projects despite challenging macroeconomic conditions. • CIEL Healthcare The utmost importance of healthcare and its effect on populations across the globe has been greatly highlighted over the last 18 months since the outbreak of the pandemic. In Mauritius, the Healthcare cluster demonstrated a strong performance on the back of increased activities at C-Care owing to the addition of more beds, and lab collection centres. Revenue picked up better than expected after the initial lockdown in March 2020. International Medical Group, the Ugandan operations, were optimised with the transfer of the insurance book in May 2021. EBITDA increased by 73%, largely due to growing demand for our healthcare services and increased bed capacity. The cluster continues to invest in new clinics and targeted projects and has a deliberate focus on further improving patient experience, expertise, and supply chain management. • CIEL Properties Non-core Group properties will be consolidated into a property portfolio with assets under management of MUR 4.2 bn. The strategy includes converting non-core industrial properties into yielding assets as part of the new property company which will operate as a stand-alone subsidiary by June 2022 and be managed by a dedicated asset management team. The conversion of Ferney into an integrated sustainable development under a smart city scheme, a medium to long term project, will start from next calendar year. In addition, the potential use of non-developed land owned by the Group will be assessed over the coming year and could include property development. Profitability of the cluster was positively impacted by the revaluation of Ferney land. • CIEL Hotels & Resorts Operations continued to be impacted by the pandemic with border closures in Mauritius and subsequent low rates of travel tourism. Consequently, EBITDA was substantially reduced from prior year due to 2021 taking the full impact of the pandemic, which resulted in the destination being closed to foreign visitors for the entire financial year under review. The Hotels & Resorts cluster managed to significantly lower its cost base, bringing its fourth quarter EBITDA into positive territory for the first time since March 2020. The restructuring of operations, the divestment of Kanuhura and financial support from the MIC, have restored cash flows and facilitated the alleviation of the debt burden. Other government support measures such as the Wage Assistance Scheme and Bank of Mauritius lines of credit, and the moratorium period on existing debt repayments with banks, were successfully negotiated. The necessary funding was therefore secured to meet short to medium term commitments. As borders reopen, trading revenues are still uncertain as sanitary protocols prevail, but management is however encouraged by the recent increase in the reservation trend. • CIEL Agro Significant improvement in the Agro cluster (reflecting the 20.96% stake in Alteo) over the financial year with CIEL’s share of profit attributable increasing to MUR 244M (2020: loss of MUR 23M). Sugar businesses in Mauritius, Tanzania and Kenya showed marked improvement on the prior period, mainly due to the strengthening of sugar operations on the back of higher production in Kenya and better sugar prices in Mauritius and Tanzania. Outlook On 29 th September, the CIEL Board on consideration of the Group’s marked improvement in its financial performance and its strong capital position, declared an interim dividend of 5 cents per share relating to the financial year ended 30 June 2021. This dividend will be exceptionally paid this year on or around 29 th October 2021. Going forward CIEL will be declaring its annual dividend around the end of June. CIEL is encouraged by the strength of its portfolio and the ongoing turnaround in most of its underlying businesses. The teams continue to optimise business operations, capital allocation and digitalisation journeys to enhance the long-term value of the Group. With its long-standing diversification and presence in the region and in South East Asia, CIEL is well positioned to benefit from the recovery in global markets, while generating net positive foreign currency income. CIEL Limited returns to profitability for the year ended 30 June 2021 and reinstates dividend Audited Financial Performance for the year ended 30 June 2021 A detailed review is available on the Company’s website at : www.cielgroup.com/financial-publications Group Results The decisive actions taken by CIEL in response to the global pandemic in early 2020 have enabled the Group to emerge stronger and leaner out of the crisis. Group revenue of MUR 17.9 bn and EBITDA of MUR 2.7 bn resulted in an EBITDA margin of 15.1% for the financial year ended 30 June 2021 (2020: 14.6%), despite revenue that has not yet fully recovered to pre-pandemic levels. CIEL’s profit after tax for the year stood at MUR 446M compared to MUR 2,178M losses in the prior period. On the operational front, the diversified portfolio has delivered improved margins in all investment sectors (“clusters”), except for Hotels & Resorts which continues to be severely affected by the net effect of lockdowns in Mauritius and international travel restrictions. The Textile and Healthcare clusters have demonstrated remarkable agility in capturing new growth opportunities brought about by the evolution of demand in their respective end markets, in Mauritius (Healthcare) and abroad (Textile/ Healthcare). The Finance cluster continued its resilient performance despite a difficult operating environment. Management took the decision to split the Agro & Property cluster into two distinct operating and reporting segments. This will allow the teams to prioritise their focus and better optimise each business’ contribution to CIEL Group’s profit. The Property cluster results include the non-cash revaluation of land of MUR 945M for the sustainable development project at Ferney. The revaluation which led to the change in the use of the land from agricultural to bare developable land was conducted after the Group received a letter of intent from the Economic Development Board of Mauritius. The global crisis did not stop the Group from looking to the future and continuing to work on the quality and resilience of its portfolio: it divested certain non-core assets such as the Kanuhura resort in the Maldives and the healthcare insurance business in Uganda. Full Year ended 30 June 2021 – financial performance shows marked improvement • Revenue totalled MUR 17.9 bn: a significant rebound in Q4 helped alleviate the year-on-year decline of 15%. Growth in the Healthcare (+26%) and Finance (+9%) clusters further assisted in mitigating the impact of the pandemic from the Hotels & Resorts business(-89%). • Earnings before Interest, Taxation, Depreciation, Amortisation, Impairment, Reorganisation costs and Fair Value gain on investment property (EBITDA) stood at MUR 2,697M, down 12%. This demonstrates the effectiveness of the numerous cost-saving initiatives deployed throughout the Group. The EBITDA margin increased slightly compared to the prior year, with a much improved fourth quarter compared with the low base of comparison for the fourth quarter in 2020. • Profit after taxation of MUR 446M, was a marked improvement on the loss after taxation of MUR 2,178M in 2020. • Profit attributable to owners increased and stood at MUR 617M (2020: Loss attributable to owners of MUR 1,680M). • Free cash flow reduced by 26% to MUR 986M from MUR 1,325M on the prior period, due mainly to the continued absence of cash generation in the Hotels & Resorts cluster, and the increased working capital needs in the Textile cluster following its rebound. However, free cash flow improved in the Finance cluster and posted a significant increase in the Healthcare cluster. • Net interest-bearing debt, half of which comes from the Hotels & Resorts cluster and is not guaranteed by the Group, was reduced to MUR 14.2 bn from MUR 17.1 bn in 2020 with a gearing ratio standing at 39% (June 2020: 48%). Funding from the Mauritius Investment Corporation (MIC) for Sun Limited in the form of a quasi-equity instrument largely accounted for this reduction in the Group’s indebtedness. As at 30 June 2021, a disbursement of MUR 2.3 bn from the MIC from a total approved funding line of MUR 3.1 bn has been received. The accompanying consolidated condensed financial statements, without reference to the detailed notes, are derived from the audited consolidated financial statements of CIEL Limited (the “Company”) for the year ended 30 June 2021. These audited financial statements, which have been prepared in accordance with International Financial Reporting Standards, are issued pursuant to the listing rule 12.14 and the Securities Act 2005. The Board of Directors of CIEL limited accepts full responsibility for the accuracy of the information contained in this report. Copies of the audited financial statements are available, free of charge, upon request from the Company Secretary, 5 th floor, Ebène Skies, rue de l’Institut, Ebène. The statement of direct and indirect interests of insiders, pursuant to Rule 8(2)(m) of the Securities (Disclosure Obligations of Reporting Issuers) Rules 2007, is available free of charge, upon request from the Company Secretary, 5 th floor, Ebène Skies, rue de l’Institut, Ebène. By order of the Board CIEL Corporate Services Ltd Secretaries 29 September 2021 BRN: C06000717 Communication: [email protected] For more information: [email protected] CONDENSED STATEMENT OF COMPREHENSIVE INCOME THE GROUP 30-Jun-21 Restated 30-Jun-20 Continuing operations MUR ‘000 MUR ‘000 Revenue 17,868,627 20,955,620 EBITDA* 2,697,440 3,052,694 Depreciation and amortisation: (1,300,835) (1,341,233) Earnings Before Interest and Taxation (EBIT) 1,396,605 1,711,461 Impairment and reorganisation costs** (575,846) (1,378,395) Fair value gain on investment properties 959,638 160,297 Net finance costs (1,274,895) (1,439,246) Impairment of associates - (108,744) Share of results of associates and joint ventures net of tax 267,304 (51,534) Profit/(Loss) before tax 772,806 (1,106,161) Taxation (79,548) (189,073) Profit/(Loss) from continuing operation 693,258 (1,295,234) Loss from discontinued operation (247,381) (882,910) Profit/(Loss) for the period 445,877 (2,178,144) Profit/(Loss) attributable to: Owners of the parent 617,391 (1,679,713) Non-controlling interests (171,514) (498,431) 445,877 (2,178,144) Basic and diluted earnings per share MUR 0.37 (1.00) Weighted average no. of ord shares for EPS Calculation ‘000 1,686,967 1,682,664 FINANCIAL HIGHLIGHTS GROUP CONSOLIDATED REVENUE EBITDA 1 GROUP PROFIT AFTER TAX PROFIT ATTRIBUTABLE TO OWNERS OF THE PARENT GROUP NAV PER SHARE MUR 17.9 bn MUR 2.7 bn MUR 446 M MUR 617 M MUR 8.85 MUR 21.0 bn - 30 June 2020 2 MUR 3.0 bn - 30 June 2020 2 (MUR 2.2 bn) - 30 June 2020 2 (MUR 1.7 bn) - 30 June 2020 2 MUR 6.69 - 30 June 2020 2 CONDENSED STATEMENT OF FINANCIAL POSITION THE GROUP 30-Jun-21 Restated 30-Jun-20 ASSETS MUR ‘000 MUR ‘000 Non-current assets 37,133,298 38,163,017 Current assets 10,506,176 8,843,371 Non-current assets classified as held for sale 1,403,473 131,969 Total non specific banking assets 49,042,947 47,138,357 Total specific banking assets 35,083,225 29,807,373 TOTAL ASSETS 84,126,172 76,945,730 EQUITY AND LIABILITIES Capital and Reserves Owners' interest 12,666,617 11,282,955 Convertible bonds 2,264,792 - Non-controlling interest 7,253,727 7,330,803 TOTAL EQUITY 22,185,136 18,613,758 Non-current liabilities 16,219,858 16,383,561 Current liabilities 11,571,716 13,234,937 Liabilities directly associated with assets classified as held for sale 560,757 - Total non specific banking liabilities 28,352,331 29,618,498 Specific banking liabilities (i) 33,588,705 28,713,474 TOTAL EQUITY AND LIABILITIES 84,126,172 76,945,730 Net asset value per share MUR 8.85 6.69 N o of shares in issue ‘000 1,687,445 1,686,751 Net interest bearing debt (ii) 14,157,052 17,078,253 Gearing = Debt/(Debt+Equity) 39% 48% i) Specific banking liabilities relate to deposits from customers of BNI Madagascar ii) Excludes lease liabilities under IFRS 16 and Banking liabilities. Restatement Reassessment of Investment Hotel Scheme (IHS) contracts at Sun Limited resulted in a partial derecognition of the villas under property, plant and equipment and a change in the corresponding lease liabilities. 2,697 Jun 2021 MUR’M (42) Healthcare 242 Property (1,477) Hotels & Resorts 94 CIEL - Holding Company net of Group Elimination 54 Finance 773 Textile 3,053 Jun 2020 EBITDA BRIDGE 1 Earnings Before Interest, Taxation, Depreciation, Amortisation, Impairment, Reorganisation costs and Fair Value gain on investment property. 2 30 June 2020 numbers are restated THE GROUP 30-Jun-21 Restated 30-Jun-20 TOTAL COMPREHENSIVE INCOME MUR ‘000 MUR ‘000 Profit/(Loss) after tax 445,877 (2,178,144) Other comprehensive income for the year 1,275,438 883,025 Total comprehensive income for the year 1,721,315 (1,295,119) Attributable to: Owners of the parent 1,401,210 (1,082,604) Non-controlling interests 320,105 (212,515) 1,721,315 (1,295,119) * Earnings Before Interest, Taxation, Depreciation, Amortisation, Impairment, Reorganisation costs and Fair Value gain on investment property. ** Includes impairment of financial (IFRS 9) and non-financial (stocks, property, plant and equipment) assets together with reorganisation costs at cluster level in response to Covid-19. CONDENSED STATEMENT OF CHANGES IN EQUITY THE GROUP Owners’ Interest Total Non- Controlling Interests Total Equity MUR ‘000 MUR ‘000 MUR ‘000 Balance at 1 July 2020 11,282,955 7,330,803 18,613,758 Total comprehensive income for the period 1,401,210 320,105 1,721,315 Dividends - (446,888) (446,888) Transaction with owners of the company 2,264,792 - 2,264,792 Other movements (17,548) 49,707 32,159 Balance at 30 June 2021 14,931,409 7,253,727 22,185,136 Balance at 1 July 2019 - As previously reported 12,935,181 9,195,956 22,131,137 - Effect of prior year adjustments 46,442 46,255 92,697 - Effect of adoption of IFRS 16 (510,507) (446,237) (956,744) - As restated 12,471,116 8,795,974 21,267,090 Total comprehensive income for the year (1,082,603) (212,516) (1,295,119) Dividends (134,307) (458,694) (593,001) Other movements 28,749 (793,961) (765,212) Balance at 30 June 2020 11,282,955 7,330,803 18,613,758 CONDENSED STATEMENT OF CASH FLOWS THE GROUP 30-Jun-21 Restated 30-Jun-20 MUR ‘000 MUR ‘000 Cash from operating activities before working capital movements 1,548,705 1,189,129 Movement of working capital of specific banking assets and liabilities 1 (272,194) 123,753 Movement of working capital of non-specific banking assets and liabilities (125,322) 583,483 Net cash from operating activities 1,151,189 1,896,365 Net cash from/(used in) investing activities 1,003,697 (1,142,065) Net cash from financing activities 84,610 1,376,428 Increase in cash and cash equivalents 2,239,496 2,130,728 Movement in cash and cash equivalents At 1 July 6,884,244 4,501,358 Increase in cash and cash equivalents 2,239,496 2,130,728 Effect of foreign exchange 68,238 252,158 At 30 June 9,191,978 6,884,244 1 Specific banking assets and liabilities consist of: loans and advances to customers, loans to banks, investment in securities and deposits from customers. In MUR 'M FULL YEAR TEXTILE FINANCE HEALTHCARE PROPERTY HOTELS & RESORTS AGRO CIEL - Holding Company* (a) TOTAL Revenue Jun 2021 10,444 3,782 2,995 103 528 - 17 17,869 Restated Jun 2020 10,390 3,462 2,377 113 4,635 - (21) 20,956 EBITDA Jun 2021 1,321 1,349 584 2 (554) - (5) 2,697 Restated Jun 2020 548 1,289 338 30 923 - (75) 3,053 Profit/(Loss) After Tax Jun 2021 627 608 296 913 (2,145) (b) 244 (97) 446 Restated Jun 2020 (656) 501 (96) 154 (1,849) (23) (209) (2,178) Free Cash Flow (c) Jun 2021 891 825 388 (33) (828) - (257) 986 Restated Jun 2020 1,047 660 42 (25) 729 - (1,128) 1,325 FULL YEAR SEGMENTAL INFORMATION * Net of Group eliminations a) Includes CIEL Limited’s figures as well as wholly owned subsidiaries - CIEL Corporate Services & Azur Financial Services (Head Office & Treasury services of CIEL Group), Procontact Ltd (44.43%), and EM Insurance Brokers Limited (51%) b) Includes share of results Anahita Golf & Spa Resorts (50%) c) Cash flow from operations net of working capital movements after recurrent capital expenditure (excluding specific banking working capital movements) 29% Textile 10% Hotels & Resorts 9% Agro 16% Finance 16% Property 20% Healthcare 30 June 2021 MUR 18,586M 30 June 2020 MUR13,068M A DIVERSIFIED AND WELL-BALANCED INVESTMENT PORTFOLIO Company Net Asset Value per share rose by 55% to MUR 9.28 as at 30 June 2021 from MUR 6.00 as at 30 June 2020, reflecting the positive impact on the total portfolio value of the appreciation of the share prices of our listed entities and increase in the valuation of our unquoted investments. 2021: 44% 2021: 20% A STRONG PRESENCE ACROSS EMERGING MARKETS WHERE WE GENERATE OUR REVENUE 2020: 35% AFRICA 2021: 36% 2020:48% MAURITIUS 2020:17% ASIA

Welcome message from author
This document is posted to help you gain knowledge. Please leave a comment to let me know what you think about it! Share it to your friends and learn new things together.
Transcript
Cluster ReviewIn 2021, the Group made progress on its journey of adapting its operating model to the global pace of change, as uncertainty endured. In parallel, it continued to revisit and
reshape its asset allocation strategy and de-risk the profile of its portfolio.
• CIEL Textile Continued and robust momentum in the Textile cluster with an outstanding performance from the Knits and Knitwear segments led to a 2.4 times increase in the
cluster’s EBITDA versus the prior period, further supported by favourable exchange rates despite higher raw material prices, logistics and restructuring costs. All lines of business are currently seeing an increase in demand, coming back from pre-COVID levels, following the reopening of our main markets, namely the UK, EU and USA, the renewed competitiveness of our operations and the ongoing supply chain shift away from China. The risk of new lockdowns in countries where the Textile cluster operates, particularly in India and Madagascar, continues to be on the agenda if local vaccination rates remain low. In August 2021, CIEL Textile, through its subsidiary Aquarelle, entered a strategic partnership with the SOCOTA Group (COTONA) in Madagascar for the creation of the largest woven fabric mill in the Indian Ocean region which should ensure the sustainability and competitiveness of our woven operations in the region.
• CIEL Finance The Finance cluster continued to show resilience with a 5% increase in EBITDA on the prior period, a good performance given the high pandemic related risk provisions
under the IFRS 9 model. However specific write-offs on the loan book for our two banks have cumulatively been reduced by 65% over the prior year. The strength of the banking operations in Madagascar is reflected in the revenue increase over the last twelve months leading to excellent fourth quarter profits. The banking businesses maintained strong capital and liquidity positions, giving management the opportunity to invest in growth and digital transformation projects despite challenging macroeconomic conditions.
• CIEL Healthcare The utmost importance of healthcare and its effect on populations across the globe has been greatly highlighted over the last 18 months since the outbreak of the
pandemic. In Mauritius, the Healthcare cluster demonstrated a strong performance on the back of increased activities at C-Care owing to the addition of more beds, and lab collection centres. Revenue picked up better than expected after the initial lockdown in March 2020. International Medical Group, the Ugandan operations, were optimised with the transfer of the insurance book in May 2021. EBITDA increased by 73%, largely due to growing demand for our healthcare services and increased bed capacity. The cluster continues to invest in new clinics and targeted projects and has a deliberate focus on further improving patient experience, expertise, and supply chain management.
• CIEL Properties Non-core Group properties will be consolidated into a property portfolio with assets under management of MUR 4.2 bn. The strategy includes converting non-core
industrial properties into yielding assets as part of the new property company which will operate as a stand-alone subsidiary by June 2022 and be managed by a dedicated asset management team. The conversion of Ferney into an integrated sustainable development under a smart city scheme, a medium to long term project, will start from next calendar year. In addition, the potential use of non-developed land owned by the Group will be assessed over the coming year and could include property development. Profitability of the cluster was positively impacted by the revaluation of Ferney land.
• CIEL Hotels & Resorts Operations continued to be impacted by the pandemic with border closures in Mauritius and subsequent low rates of travel tourism. Consequently, EBITDA was substantially
reduced from prior year due to 2021 taking the full impact of the pandemic, which resulted in the destination being closed to foreign visitors for the entire financial year under review. The Hotels & Resorts cluster managed to significantly lower its cost base, bringing its fourth quarter EBITDA into positive territory for the first time since March 2020. The restructuring of operations, the divestment of Kanuhura and financial support from the MIC, have restored cash flows and facilitated the alleviation of the debt burden. Other government support measures such as the Wage Assistance Scheme and Bank of Mauritius lines of credit, and the moratorium period on existing debt repayments with banks, were successfully negotiated. The necessary funding was therefore secured to meet short to medium term commitments. As borders reopen, trading revenues are still uncertain as sanitary protocols prevail, but management is however encouraged by the recent increase in the reservation trend.
• CIEL Agro Significant improvement in the Agro cluster (reflecting the 20.96% stake in Alteo) over the financial year with CIEL’s share of profit attributable increasing to MUR 244M
(2020: loss of MUR 23M). Sugar businesses in Mauritius, Tanzania and Kenya showed marked improvement on the prior period, mainly due to the strengthening of sugar operations on the back of higher production in Kenya and better sugar prices in Mauritius and Tanzania.
OutlookOn 29th September, the CIEL Board on consideration of the Group’s marked improvement in its financial performance and its strong capital position, declared an interim dividend of 5 cents per share relating to the financial year ended 30 June 2021. This dividend will be exceptionally paid this year on or around 29th October 2021. Going forward CIEL will be declaring its annual dividend around the end of June.
CIEL is encouraged by the strength of its portfolio and the ongoing turnaround in most of its underlying businesses. The teams continue to optimise business operations, capital allocation and digitalisation journeys to enhance the long-term value of the Group. With its long-standing diversification and presence in the region and in South East Asia, CIEL is well positioned to benefit from the recovery in global markets, while generating net positive foreign currency income.
CIEL Limited returns to profitability for the year ended 30 June 2021 and reinstates dividendAudited Financial Performance for the year ended 30 June 2021
A detailed review is available on the Company’s website at : www.cielgroup.com/financial-publications
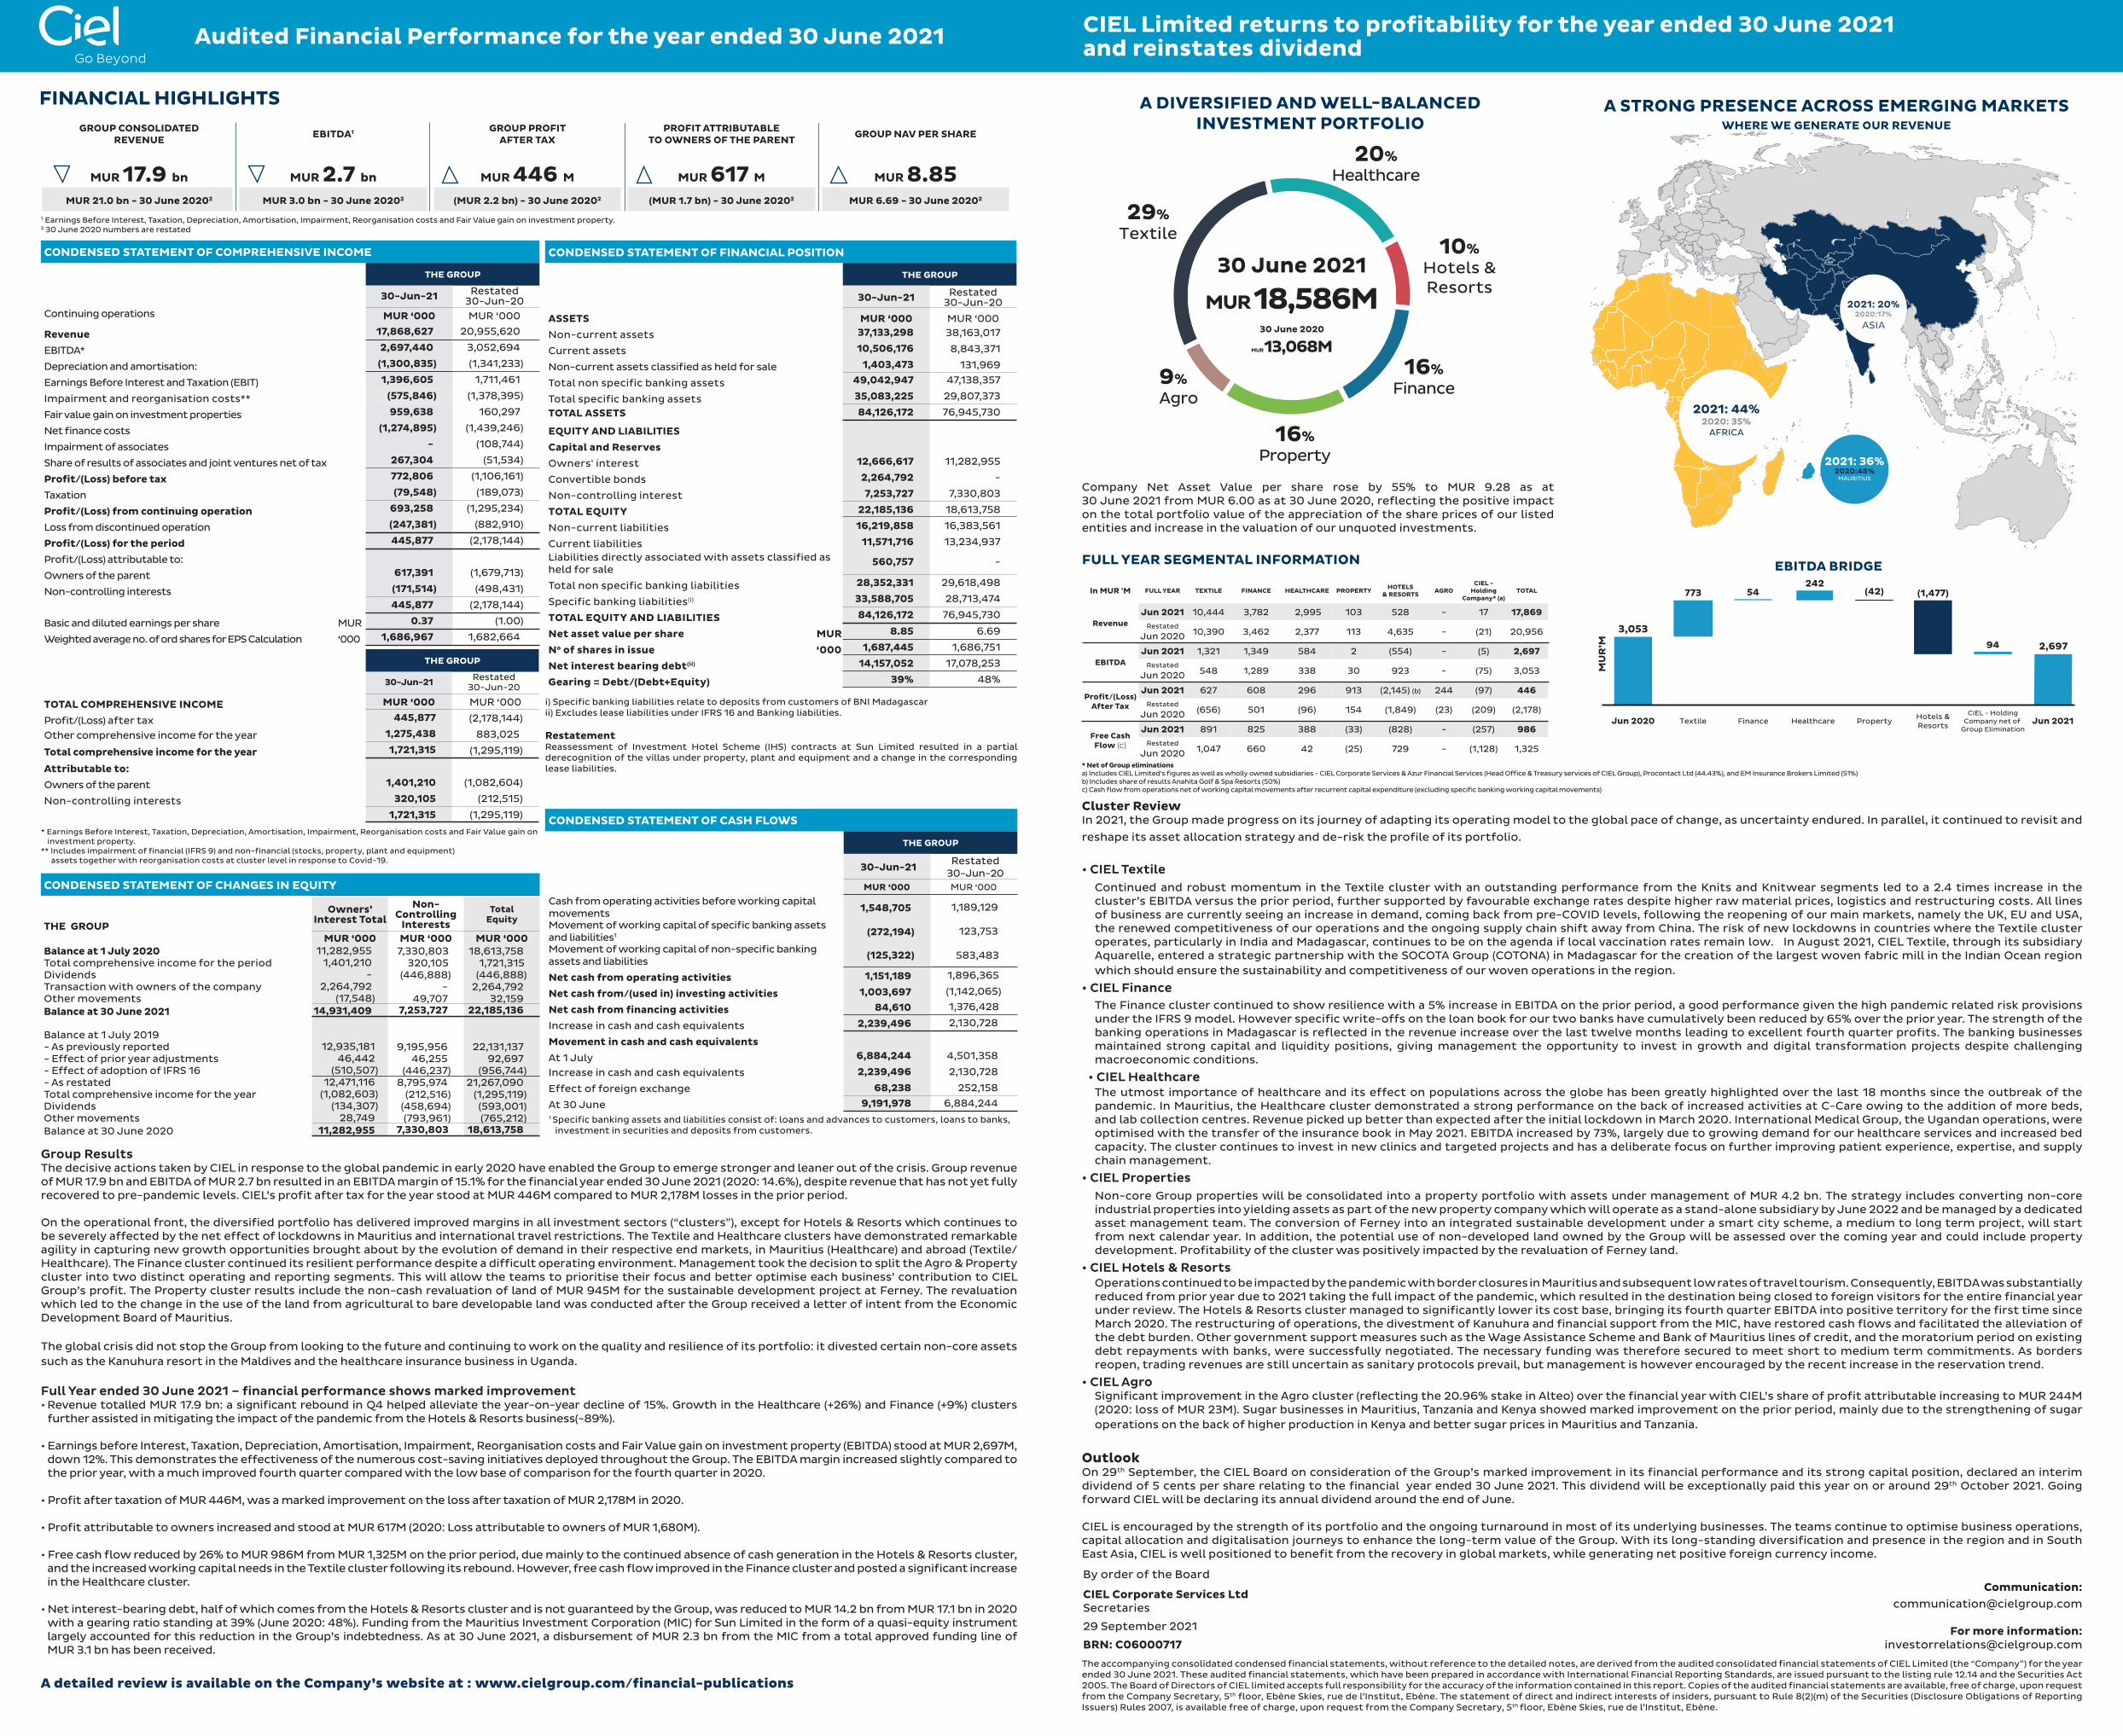
Group ResultsThe decisive actions taken by CIEL in response to the global pandemic in early 2020 have enabled the Group to emerge stronger and leaner out of the crisis. Group revenue of MUR 17.9 bn and EBITDA of MUR 2.7 bn resulted in an EBITDA margin of 15.1% for the financial year ended 30 June 2021 (2020: 14.6%), despite revenue that has not yet fully recovered to pre-pandemic levels. CIEL’s profit after tax for the year stood at MUR 446M compared to MUR 2,178M losses in the prior period.
On the operational front, the diversified portfolio has delivered improved margins in all investment sectors (“clusters”), except for Hotels & Resorts which continues to be severely affected by the net effect of lockdowns in Mauritius and international travel restrictions. The Textile and Healthcare clusters have demonstrated remarkable agility in capturing new growth opportunities brought about by the evolution of demand in their respective end markets, in Mauritius (Healthcare) and abroad (Textile/Healthcare). The Finance cluster continued its resilient performance despite a difficult operating environment. Management took the decision to split the Agro & Property cluster into two distinct operating and reporting segments. This will allow the teams to prioritise their focus and better optimise each business’ contribution to CIEL Group’s profit. The Property cluster results include the non-cash revaluation of land of MUR 945M for the sustainable development project at Ferney. The revaluation which led to the change in the use of the land from agricultural to bare developable land was conducted after the Group received a letter of intent from the Economic Development Board of Mauritius.
The global crisis did not stop the Group from looking to the future and continuing to work on the quality and resilience of its portfolio: it divested certain non-core assets such as the Kanuhura resort in the Maldives and the healthcare insurance business in Uganda.
Full Year ended 30 June 2021 – financial performance shows marked improvement• Revenue totalled MUR 17.9 bn: a significant rebound in Q4 helped alleviate the year-on-year decline of 15%. Growth in the Healthcare (+26%) and Finance (+9%) clusters
further assisted in mitigating the impact of the pandemic from the Hotels & Resorts business(-89%).
• Earnings before Interest, Taxation, Depreciation, Amortisation, Impairment, Reorganisation costs and Fair Value gain on investment property (EBITDA) stood at MUR 2,697M, down 12%. This demonstrates the effectiveness of the numerous cost-saving initiatives deployed throughout the Group. The EBITDA margin increased slightly compared to the prior year, with a much improved fourth quarter compared with the low base of comparison for the fourth quarter in 2020.
• Profit after taxation of MUR 446M, was a marked improvement on the loss after taxation of MUR 2,178M in 2020. • Profit attributable to owners increased and stood at MUR 617M (2020: Loss attributable to owners of MUR 1,680M).
• Free cash flow reduced by 26% to MUR 986M from MUR 1,325M on the prior period, due mainly to the continued absence of cash generation in the Hotels & Resorts cluster, and the increased working capital needs in the Textile cluster following its rebound. However, free cash flow improved in the Finance cluster and posted a significant increase in the Healthcare cluster.
• Net interest-bearing debt, half of which comes from the Hotels & Resorts cluster and is not guaranteed by the Group, was reduced to MUR 14.2 bn from MUR 17.1 bn in 2020 with a gearing ratio standing at 39% (June 2020: 48%). Funding from the Mauritius Investment Corporation (MIC) for Sun Limited in the form of a quasi-equity instrument largely accounted for this reduction in the Group’s indebtedness. As at 30 June 2021, a disbursement of MUR 2.3 bn from the MIC from a total approved funding line of MUR 3.1 bn has been received.
The accompanying consolidated condensed financial statements, without reference to the detailed notes, are derived from the audited consolidated financial statements of CIEL Limited (the “Company”) for the year ended 30 June 2021. These audited financial statements, which have been prepared in accordance with International Financial Reporting Standards, are issued pursuant to the listing rule 12.14 and the Securities Act 2005. The Board of Directors of CIEL limited accepts full responsibility for the accuracy of the information contained in this report. Copies of the audited financial statements are available, free of charge, upon request from the Company Secretary, 5th floor, Ebène Skies, rue de l’Institut, Ebène. The statement of direct and indirect interests of insiders, pursuant to Rule 8(2)(m) of the Securities (Disclosure Obligations of Reporting Issuers) Rules 2007, is available free of charge, upon request from the Company Secretary, 5th floor, Ebène Skies, rue de l’Institut, Ebène.
By order of the Board
CIEL Corporate Services LtdSecretaries
29 September 2021
BRN: C06000717
Communication:[email protected]
For more information:
CONDENSED STATEMENT OF COMPREHENSIVE INCOME
THE GROUP
30-Jun-21 Restated 30-Jun-20
Continuing operations MUR ‘000 MUR ‘000
Revenue 17,868,627 20,955,620
EBITDA* 2,697,440 3,052,694
Depreciation and amortisation: (1,300,835) (1,341,233)
Earnings Before Interest and Taxation (EBIT) 1,396,605 1,711,461
Impairment and reorganisation costs** (575,846) (1,378,395)
Fair value gain on investment properties 959,638 160,297
Net finance costs (1,274,895) (1,439,246)
Impairment of associates - (108,744)
Share of results of associates and joint ventures net of tax 267,304 (51,534)
Profit/(Loss) before tax 772,806 (1,106,161)
Taxation (79,548) (189,073)
Profit/(Loss) from continuing operation 693,258 (1,295,234)
Loss from discontinued operation (247,381) (882,910)
Profit/(Loss) for the period 445,877 (2,178,144)
Profit/(Loss) attributable to:
Owners of the parent 617,391 (1,679,713)
Non-controlling interests (171,514) (498,431)
445,877 (2,178,144)
Basic and diluted earnings per share MUR 0.37 (1.00)
Weighted average no. of ord shares for EPS Calculation ‘000 1,686,967 1,682,664
FINANCIAL HIGHLIGHTSGROUP CONSOLIDATED
REVENUE EBITDA1 GROUP PROFIT AFTER TAX
PROFIT ATTRIBUTABLE TO OWNERS OF THE PARENT GROUP NAV PER SHARE
MUR 17.9 bn MUR 2.7 bn MUR 446 M MUR 617 M MUR 8.85MUR 21.0 bn - 30 June 20202 MUR 3.0 bn - 30 June 20202 (MUR 2.2 bn) - 30 June 20202 (MUR 1.7 bn) - 30 June 20202 MUR 6.69 - 30 June 20202
CONDENSED STATEMENT OF FINANCIAL POSITION
THE GROUP
30-Jun-21 Restated 30-Jun-20
ASSETS MUR ‘000 MUR ‘000
Non-current assets 37,133,298 38,163,017
Current assets 10,506,176 8,843,371
Non-current assets classified as held for sale 1,403,473 131,969
Total non specific banking assets 49,042,947 47,138,357
Total specific banking assets 35,083,225 29,807,373
TOTAL ASSETS 84,126,172 76,945,730
EQUITY AND LIABILITIES
Capital and Reserves
Owners' interest 12,666,617 11,282,955
Convertible bonds 2,264,792 -
Non-controlling interest 7,253,727 7,330,803
TOTAL EQUITY 22,185,136 18,613,758
Non-current liabilities 16,219,858 16,383,561
Current liabilities 11,571,716 13,234,937
Liabilities directly associated with assets classified as held for sale
560,757 -
Total non specific banking liabilities 28,352,331 29,618,498
Specific banking liabilities(i) 33,588,705 28,713,474
TOTAL EQUITY AND LIABILITIES 84,126,172 76,945,730
Net asset value per share MUR 8.85 6.69
No of shares in issue ‘000 1,687,445 1,686,751
Net interest bearing debt(ii) 14,157,052 17,078,253
Gearing = Debt/(Debt+Equity) 39% 48%
i) Specific banking liabilities relate to deposits from customers of BNI Madagascarii) Excludes lease liabilities under IFRS 16 and Banking liabilities.
RestatementReassessment of Investment Hotel Scheme (IHS) contracts at Sun Limited resulted in a partial derecognition of the villas under property, plant and equipment and a change in the corresponding lease liabilities.
2,697
Jun 2021
MU
R’M
(42)
Healthcare
242
Property
(1,477)
Hotels &Resorts
94
CIEL - HoldingCompany net of
Group Elimination
54
Finance
773
Textile
3,053
Jun 2020
EBITDA BRIDGE
1 Earnings Before Interest, Taxation, Depreciation, Amortisation, Impairment, Reorganisation costs and Fair Value gain on investment property.2 30 June 2020 numbers are restated
THE GROUP
30-Jun-21 Restated 30-Jun-20
TOTAL COMPREHENSIVE INCOME MUR ‘000 MUR ‘000
Profit/(Loss) after tax 445,877 (2,178,144)
Other comprehensive income for the year 1,275,438 883,025
Total comprehensive income for the year 1,721,315 (1,295,119)
Attributable to:
Owners of the parent 1,401,210 (1,082,604)
Non-controlling interests 320,105 (212,515)
1,721,315 (1,295,119)
* Earnings Before Interest, Taxation, Depreciation, Amortisation, Impairment, Reorganisation costs and Fair Value gain on investment property.
** Includes impairment of financial (IFRS 9) and non-financial (stocks, property, plant and equipment) assets together with reorganisation costs at cluster level in response to Covid-19.
CONDENSED STATEMENT OF CHANGES IN EQUITY
THE GROUP
Owners’ Interest Total
Non-Controlling
Interests
Total Equity
MUR ‘000 MUR ‘000 MUR ‘000Balance at 1 July 2020 11,282,955 7,330,803 18,613,758Total comprehensive income for the period 1,401,210 320,105 1,721,315Dividends - (446,888) (446,888)Transaction with owners of the company 2,264,792 - 2,264,792Other movements (17,548) 49,707 32,159Balance at 30 June 2021 14,931,409 7,253,727 22,185,136
Balance at 1 July 2019- As previously reported 12,935,181 9,195,956 22,131,137- Effect of prior year adjustments 46,442 46,255 92,697- Effect of adoption of IFRS 16 (510,507) (446,237) (956,744)- As restated 12,471,116 8,795,974 21,267,090Total comprehensive income for the year (1,082,603) (212,516) (1,295,119)Dividends (134,307) (458,694) (593,001)Other movements 28,749 (793,961) (765,212)Balance at 30 June 2020 11,282,955 7,330,803 18,613,758
CONDENSED STATEMENT OF CASH FLOWS
THE GROUP
30-Jun-21Restated
30-Jun-20MUR ‘000 MUR ‘000
Cash from operating activities before working capital movements 1,548,705 1,189,129
Movement of working capital of specific banking assets and liabilities1 (272,194) 123,753
Movement of working capital of non-specific banking assets and liabilities
(125,322) 583,483
Net cash from operating activities 1,151,189 1,896,365
Net cash from/(used in) investing activities 1,003,697 (1,142,065)
Net cash from financing activities 84,610 1,376,428
Increase in cash and cash equivalents 2,239,496 2,130,728
Movement in cash and cash equivalents
At 1 July 6,884,244 4,501,358
Increase in cash and cash equivalents 2,239,496 2,130,728
Effect of foreign exchange 68,238 252,158
At 30 June 9,191,978 6,884,244 1 Specific banking assets and liabilities consist of: loans and advances to customers, loans to banks, investment in securities and deposits from customers.
In MUR 'M FULL YEAR TEXTILE FINANCE HEALTHCARE PROPERTY HOTELS& RESORTS AGRO
CIEL - Holding
Company* (a)TOTAL
RevenueJun 2021 10,444 3,782 2,995 103 528 - 17 17,869
Restated
Jun 2020 10,390 3,462 2,377 113 4,635 - (21) 20,956
EBITDAJun 2021 1,321 1,349 584 2 (554) - (5) 2,697
Restated
Jun 2020 548 1,289 338 30 923 - (75) 3,053
Profit/(Loss) After Tax
Jun 2021 627 608 296 913 (2,145) (b) 244 (97) 446Restated
Jun 2020 (656) 501 (96) 154 (1,849) (23) (209) (2,178)
Free Cash Flow (c)
Jun 2021 891 825 388 (33) (828) - (257) 986Restated
Jun 2020 1,047 660 42 (25) 729 - (1,128) 1,325
FULL YEAR SEGMENTAL INFORMATION
* Net of Group eliminationsa) Includes CIEL Limited’s figures as well as wholly owned subsidiaries - CIEL Corporate Services & Azur Financial Services (Head Office & Treasury services of CIEL Group), Procontact Ltd (44.43%), and EM Insurance Brokers Limited (51%)b) Includes share of results Anahita Golf & Spa Resorts (50%)c) Cash flow from operations net of working capital movements after recurrent capital expenditure (excluding specific banking working capital movements)
29%Textile
10%Hotels &Resorts
9%Agro
16%Finance
16%Property
20%Healthcare
30 June 2021
MUR 18,586M30 June 2020
MUR 13,068M
A DIVERSIFIED AND WELL-BALANCED INVESTMENT PORTFOLIO
Company Net Asset Value per share rose by 55% to MUR 9.28 as at 30 June 2021 from MUR 6.00 as at 30 June 2020, reflecting the positive impact on the total portfolio value of the appreciation of the share prices of our listed entities and increase in the valuation of our unquoted investments.
2021: 44%
2021: 20%
A STRONG PRESENCE ACROSS EMERGING MARKETSWHERE WE GENERATE OUR REVENUE
2020: 35% AFRICA
2021: 36%2020:48%
MAURITIUS
2020:17% ASIA
Related Documents