AUDITED ANNUAL REPORT 2014

Welcome message from author
This document is posted to help you gain knowledge. Please leave a comment to let me know what you think about it! Share it to your friends and learn new things together.
Transcript

AUDITED ANNUAL REPORT 2014

ii ANNUAL REPORT 2014

ANNUAL REPORT 2014 3
CONTENTS
1. INTRODUCTORY WORD FROM THE MANAGEMENT BOARD .................................................. 5
2. THE ACTIVITIES OF THE COMPANY AND THE GROUP AND ITS DEVELOPMENT ............ 6
3. COMPANY BODIES ................................................................................................................................. 6
3.1. REPORT ON THE WORK OF THE SUPERVISORY BOARD OF PRVA GROUP .......................................... 7 3.2. STATEMENT OF THE RESPONSIBILITY OF THE MANAGEMENT BOARD ............................................. 8 3.3. CORPORATE GOVERNANCE STATEMENT ......................................................................... 9
4. SHARE CAPITAL AND SHAREHOLDERS ....................................................................................... 10
5. THE ECONOMIC ENVIRONMENT .................................................................................................... 11
5.1. MACROECONOMIC ENVIRONMENT ............................................................................. 11
6. CAPITAL MARKETS ............................................................................................................................. 12
6.1. MONETARY MARKETS AND INTEREST RATES ................................................................... 12 6.2. BOND MARKETS .............................................................................................. 12 6.3. STOCK MARKETS .............................................................................................. 13 6.4. COMMODITY MARKETS ........................................................................................ 15
7. FINANCIAL RESULT OF THE COMPANY AND THE GROUP .................................................... 18
8. INFORMATION TECHNOLOGY ........................................................................................................ 18
9. ORGANISATION AND PERSONNEL ................................................................................................. 19
10. RISK MANAGEMENT ........................................................................................................................... 19
10.1. MANAGEMENT OF CAPITAL AND CAPITAL ADEQUACY ........................................................... 19 10.2. FINANCIAL RISK .............................................................................................. 19 10.3. INTEREST RATE RISK .......................................................................................... 19 10.4. RISK OF CHANGES IN SHARE PRICES ........................................................................... 20 10.5. LIQUIDITY RISK ............................................................................................... 20 10.6. CURRENCY RISK .............................................................................................. 20 10.7. CREDIT RISK .................................................................................................. 20 10.8. OPERATIONAL RISK ........................................................................................... 21 10.9. FUTURE PLANS ............................................................................................... 21 10.10. SIGNIFICANT SUBSEQUENT EVENTS ............................................................................ 21
11. INDEPENDENT AUDITOR’S REPORT .............................................................................................. 22
12. FINANCIAL STATEMENTS OF THE COMPANY AND THE GROUP ......................................... 23
12.1. INCOME STATEMENT .......................................................................................... 23 12.2. STATEMENT OF COMPREHENSIVE INCOME OF THE COMPANY AND THE GROUP ................................. 24 12.3. STATEMENT OF FINANCIAL POSITION OF THE COMPANY AND THE GROUP ...................................... 25 12.4. CASH FLOW STATEMENT OF THE COMPANY AND THE GROUP .................................................. 26 12.5. STATEMENT OF CHANGES IN EQUITY OF PRVA GROUP ......................................................... 27 12.6. STATEMENT OF CHANGES IN EQUITY OF THE GROUP .......................................................... 28
13. NOTES TO THE FINANCIAL STATEMENTS OF THE COMPANY AND THE GROUP ........... 29
13.1. SUMMARY OF SIGNIFICANT ACCOUNTING POLICIES ............................................................. 29 13.2. ADDITIONAL DISCLOSURES OF THE STATEMENT OF FINANCIAL POSITION AND THE INCOME STATEMENT ITEMS ... 46 13.3. SEGMENT REPORTING ........................................................................................ 47
1. Geographic segments ........................................................................................................................ 47 2. Operating segments ........................................................................................................................... 48
13.4. NOTES TO THE INCOME STATEMENT........................................................................... 48 1. Operating income .............................................................................................................................. 48 1.1 Net income from insurance premiums ............................................................................................... 48 1.2 Other insurance income .................................................................................................................... 48 2. Interest income and expense .............................................................................................................. 49

4 ANNUAL REPORT 2014
2.1 Interest income .................................................................................................................................. 49 2.2 Interest expense ................................................................................................................................. 49 3. Dividend Income ............................................................................................................................... 50 4. Net gains/losses from investments ..................................................................................................... 50 5. Net expenses for claims and changes in technical provisions ........................................................... 50 5.1 Net expenses for claims ..................................................................................................................... 50 5.2 Changes in technical provisions ........................................................................................................ 51 6. Costs of acquiring insurants .............................................................................................................. 51 7. Employee benefit costs ...................................................................................................................... 51 8. Other costs ........................................................................................................................................ 52 9. Other revenue and expenses .............................................................................................................. 52 9.1 Other revenue .................................................................................................................................... 52 9.2 Other expenses .................................................................................................................................. 52 10. Deferred and current tax ................................................................................................................... 53 11. Net earnings per share ...................................................................................................................... 54
13.5. NOTES TO THE STATEMENT OF FINANCIAL POSITION ........................................................... 55 12. Property, plant and equipment .......................................................................................................... 55 13. Intangible assets ................................................................................................................................ 56 14. Interests in subsidiaries and associates ............................................................................................ 56 14.1 Interests in subsidiaries ..................................................................................................................... 56 15. Assets of unit-linked policy holders ................................................................................................... 57 16. Investments in securities .................................................................................................................... 57 16.1 Investments in securities held to maturity ......................................................................................... 58 16.2 Investments in securities, available for sale ...................................................................................... 58 16.3 Investments in securities measured at fair value through profit and loss ......................................... 59 17. Other receivables and short-term deferred costs and accrued income ............................................. 59 18. Assets from financial contracts ......................................................................................................... 59 19. Issued loans and deposits .................................................................................................................. 61 20. Cash and cash equivalents ................................................................................................................ 61 21. Equity ................................................................................................................................................ 61 21.1 Reserves ............................................................................................................................................. 62 21.2 Dividends proposed and paid ............................................................................................................ 63 22. Technical provisions ......................................................................................................................... 63 23. Liabilities from financial contracts ................................................................................................... 63 24. Financial liabilities from borrowings ............................................................................................... 64 25. Other liabilities, other provisions and short-term accrued costs and deferred income .................... 65 26. Off balance liabilities of the Company .............................................................................................. 65
13.6. OTHER DISCLOSURES TO THE FINANCIAL STATEMENTS OF THE COMPANY AND THE GROUP ..................... 65 27. Remunerations of members of the Management Board and the Supervisory Board, and related party
transactions ....................................................................................................................................... 65 28. Financial instruments and risk management..................................................................................... 67 28.1 Insurance risk management ............................................................................................................... 67 28.2 Financial risk management ............................................................................................................... 67 28.3 Capital management ......................................................................................................................... 68 29. Credit risk .......................................................................................................................................... 68 30. Liquidity risk ..................................................................................................................................... 70 31. Interest rate risk ................................................................................................................................ 73 32. Currency risk ..................................................................................................................................... 73 33. The risk of changes to the market prices of securities ....................................................................... 74 34. Fair value .......................................................................................................................................... 75 34.1 Assets and liabilities according to fair value hierarchy .................................................................... 75 35. Other details ...................................................................................................................................... 78 36. Significant subsequent events ............................................................................................................ 78
14. INDEX OF TABLES ................................................................................................................................ 79
15. INDEX OF DIAGRAMS ......................................................................................................................... 80

ANNUAL REPORT 2014 5
1. INTRODUCTORY WORD FROM THE MANAGEMENT BOARD
In 2014, the Group continued its traditional role of primarily engaging in pension insurance in Slovenia,
Macedonia, Serbia and Kosovo. Supplementary pension markets in Macedonia and Slovenia are most important
parts of the Group. KB Prvo penzisko društvo AD Skopje is one of two providers on Macedonia’s mandatory pension
insurance market. In 2014 the Company grew in line with the market and managed to keep the market share at
52%. In Slovenia there are 11 providers of supplementary pension schemes. Prva osebna zavarovalnica holds more
than 27% of the market. Prva managed to maintain the position of largest provider in Slovenian market in terms
of AUM and number of policyholders. Both market share indicators were kept on same level in 2014.
The Company in Slovenia, i.e. Prva osebna zavarovalnica, recorded a significant growth also in the insurance
sector: In line with the company’s strategy up to 2018, the insurance sector is becoming an ever more important
activity as well as a driver of the profit increase. Despite of the fact that Life insurance market as a whole
recorded a fall of 3.4%, Prva had recorded 31% increase in gross written premium and 40% increase in number of
new life policies. Main product still remains Prva Varnost, which shows that update of this product in 2013 was
appropriate and that this is the only product of its kind on Slovenian market. Additionally in 2014 new product
was launched, which covers population of 55+ years. With this Prva has concluded a comprehensive list of life
insurance products that cover a person from cradle to grawe.
All the companies in the Group reported profits at the end of the year, as well as an increase in the number of
insurants, premiums and assets under management. In 2014, the Group reported EUR 3.9 million of gross profit,
and 4.5 million of comprehensive income. In addition, the volume of assets under management rose by over EUR
87 million to EUR 590 million, which is 17.3% more than in 2013. Moreover, the total number of the Group's
insurants surpassed the milestone of 400.000, as the Group ended the year with 412,938 insurants.
In 2015, we expect to achieve even more milestones, including surpassing EUR 600 million in Asset under
management, out of which Macedonia will surpass EUR 300 million and at the same time the boundery of 200
thousand insurees. In addition, we expect to obtain the confirmed rules of management from Insurance
supervision agency in Slovenia that base on the pension plans confirmed by the Ministry of labour, family, social
affairs and equal opportunities. This is crucial since it would enable the company to introduce the urgently
needed life cycle funds.

6 ANNUAL REPORT 2014
2. THE ACTIVITIES OF THE COMPANY AND THE GROUP AND ITS DEVELOPMENT
Prva Group - Skupina Prva, zavarovalniški holding, d.d. (formerly Prva pokojninska družba d.d.) is an insurance
holding in which 3 pension companies, 1 insurance undertaking and 1 company in the process of acquiring licences
for pension insurance of a sister company, operated in 2014.
The Company’s activity includes holding operations in insurance and pension funds.
Ernst & Young was appointed the auditor of the Company.
Prva Group - Skupina Prva, insurance holding company, plc. is a public limited company set up for an indefinite
period of time.
In 2014, the following enterprises operated within the Group: Prva osebna zavarovalnica d.d. in Slovenia, KB Prvo
in Macedonia, DDOR Garant in Serbia, FSKP in Kosovo, and Prva zavarovalniško zastopniška družba, d.o.o. in
Slovenia.
Prva Group - Skupina Prva, insurance holding company, plc. compiled consolidated financial statements under
IFRS for the Group, which includes five subsidiaries. The consolidated financial statements are based on the
original financial statements of the enterprises included in consolidation, inclusive of the necessary consolidation
adjustments which, however, are not subject to posting in the financial statements of the enterprises included
in consolidation. In the financial statements, subsidiaries are accounted for under the acquisition method. The
report includes presentation of the operations of the long-term business funds managed by the subsidiaries.
Prva Group does not have any branch offices either in Slovenia or abroad.
In the Annual Report, Skupina Prva plc. is referred to as Skupina Prva, Prva Group or the Company, whereas Skupina Prva Group is referred to as Skupina Prva Group or the Group.
3. COMPANY BODIES
The Company’s bodies consist of the General Assembly, the Supervisory Board, the Management Board, and the
Audit Committee.
The General Assembly of the Company is comprised of legal entities and natural persons, holders of the Prva
Group plc. shares.
The Supervisory Board consists of four members. All are representatives of the capital.
The Management Board represents and presents the Company. Dr Alenka Žnidaršič Kranjc is the President of
Management Board.
The owners of the Company have the right to change the financial statements after their approval by the
Management Board.
The registered seat of the Company: Skupina Prva d.d. (Prva Group plc.) Ameriška ulica 8 1000 Ljubljana Slovenia

ANNUAL REPORT 2014 7
3.1. REPORT ON THE WORK OF THE SUPERVISORY BOARD OF PRVA GROUP
The four-member Supervisory Board performed its duties and tasks in accordance with provisions of the Insurance
Act, Companies Act, Articles of Association, and Rules of Procedure of the Supervisory Board in 2014. In 2014,
the Supervisory Board was composed of Nicholas Andrew Lindsay Stuart (Chairman), Jože Mermal, Andreea Moraru
and Tanja Tuš.
In 2014, the Supervisory Board monitored and discussed the operations of the Company and the work of the
Management Board in two regular sessions and two conference calls. It carried out the legally prescribed
supervision of the Company’s operations and supervised the implementation of the resolutions adopted in
previous sessions and at the General Meetings of the Company.
In 2014, the work of the Supervisory Board further consisted of addressing the Annual Report of Prva Group,
insurance holding company, plc., for 2013, forming the opinion of the Supervisory Board on the Annual Report
for 2013, addressing the Auditor’s Report for 2013, and Reports of the Audit Committee for 2014, drafting a
proposal for the General Meeting to nominate the company’s auditor for 2014, addressing and adopting the
Business Plan for 2015, and ongoing supervision of all the Company’s operations and the comparison of the
objectives realised with those planned.
At its last session in 2014 and with an outlook on the future operations of the Company, the Supervisory Board
adopted the Business Plan for 2015 and was informed of the plans of all the subsidiaries for 2015.
The Supervisory Board was informed about the decisions of the supervisory bodies in a timely fashion and
monitored their implementation.
The Supervisory Board reviewed the Annual Report on the Prva Group plc. for 2014 and had no objections to the
report. On the basis of the monitoring and supervision of the Company’s operations, it has established that the
Company followed its set objectives. The Supervisory Board had no objections to the opinion of the audit
company.
The Supervisory Board hereby approves the Annual Report of Prva Group, insurance holding company, plc. for
2014 and will propose it for adoption at the General Meeting.
Ljubljana, 14 May 2015

8 ANNUAL REPORT 2014
3.2. STATEMENT OF THE RESPONSIBILITY OF THE MANAGEMENT BOARD
The Management Board approved the publication of the financial statements, accounting policies used and notes
to the financial statements on 16 April 2015.
The Management Board is responsible for preparing the annual report which represents a true and fair view of
the Company’s and the Group’s financial position and of their financial results for the year 2014.
Members of the Management Board and the Supervisory Board confirm that the Annual Report of Prva Group,
insurance holding company, plc., and its integral parts, inclusive of the corporate governance statement, have
been compiled and published in accordance with the Companies Act and International Financial Reporting
Standards, as adopted by the EU.
The Management Board is responsible for the preparation of the annual report of Prva Group, insurance holding
company, plc., including the financial statements and consolidated financial statements and notes thereto that
give a true and fair presentation of the financial position of the Company and the Group.
The Management Board confirms that the financial statements of the Company and the Group have been compiled
under the assumption of a going concern, that the appropriate accounting policies have been consistently
applied, and that any changes in these have been disclosed, and that accounting estimates have been made
based on the principle of prudence.
The Management Board is also responsible for the adoption of measures to secure the assets of Prva Group,
insurance holding company, plc., and to prevent and detect fraud and other irregularities and/or illegal acts.
The Tax Authorities may, at any time within a period of 5 years after the end of the year for which a tax
assessment was due, carry out an audit of the company's operations, which may lead to assessment of additional
tax liabilities, default interest, and penalties with regards to corporate income tax or other taxes and levies.
The Management Board is not aware of any circumstances that may result in a significant tax liability.
Ljubljana, 16 April 2015

ANNUAL REPORT 2014 9
3.3. CORPORATE GOVERNANCE STATEMENT
1. The Company applies the Corporate Governance Code for Public Limited Companies adopted by the Ljubljana
Stock Exchange, the Association of Supervisory Board Members of Slovenia and the Association of Managers on 18
March 2004 as amended and supplemented on 14 December 2005 and 5 February 2007. The revised Corporate
Governance Code was adopted on 8 December 2009. The Corporate Governance Code was published in the Official
Gazette of the RS no. 44/2004 on 28 April 2004 and is available on the web sites of all three signatories.
2. The Company complies with the obligatory provisions of the Code.
3. Within the framework of the internal control system and risk management related to the financial reporting
process, special attention is devoted to:
Identifying important business events that have a direct or significant impact on the financial reporting;
Accounting categories and individual accounts and the related processes;
Regular updating the documenting of the business processes flow;
Assessing the results and eliminating the weaknesses identified in the planned or existing internal
controls.
4. Company rules regarding appointment and replacement of members of the Management Board and the
Supervisory Board are specified in the Articles of Association. All amendments to the Articles of Association are
adopted by a majority of no less than 75% of the share capital represented.
5. The Management Board convenes the General Meeting of Shareholders at least one month in advance. Usually,
it is convened at the head office of the Company. The competences of the General Meeting of Shareholders are
stipulated in the Companies Act (ZGD-1). The General Meeting decides with a majority of votes cast by the share
capital represented. Shareholders can exercise their rights at the General Meeting either in person or by proxy.
Shareholders' rights are specified in the Articles of Association and legislation.
6. The managing and corporate governance of the Company are conducted under a two-tier system based on
statutory provisions, Articles of Association, internal rules and the established and generally accepted good
business practices.
Ljubljana, 16 April 2015

10 ANNUAL REPORT 2014
4. SHARE CAPITAL AND SHAREHOLDERS
The Company’s share capital amounts to EUR 13,386,247 and underwent changes in 2014, which are detailed in
section 21: Equity.
The owners of Prva Group, insurance holding company, plc. are successful Slovenian companies, a foreign bank,
members of the Supervisory and Management Boards and other shareholders, as well as companies that have
included their insurants in one of the pension schemes of Prva osebna zavarovalnica, d.d. The ultimate parent
company of Prva Group, insurance holding company, plc. is A-Z Finance d.o.o.. A-Z Finance was founded in 1998
and is 100% owned by Alenka Žnidaršič Kranjc.
Table 1: Ten largest shareholders of ordinary and preference shares of Prva Group, plc. as at 31 December 2014
Name of shareholder/ordinary shares Holding as at 31 December 2014
in %
DEJ d.o.o. 50.20%
EUROPEAN BANK FOR RECONSTRUCTION AND DEVELOPMENT 20.00%
KYMAH LIMITED 12.22%
BTC d.d. 4.16%
ADRIATIC SLOVENICA D.D. KOPER. KRITNI SK 3.10%
PRVA OSEBNA ZAVAROVALNICA D.D. - KS3 1.91%
PRVA OSEBNA ZAVAROVALNICA D.D. - KS4 1.26%
PRVA OSEBNA ZAVAROVALNICA D.D. - KS2 0.98%
OMEGAT d.o.o. 0.90%
PRVA OSEBNA ZAVAROVALNICA D.D. - KS1 0.59%
10 MAJOR SHAREHOLDERS 95.29%
OTHER LEGAL ENTITIES 2.28%
OTHER NATURAL PERSONS 2.43%
TOTAL AS AT 31 DECEMBER 2014 100.00%
Name of shareholder/preference shares Holding as at 31 December 2014
in %
PRVA OSEBNA ZAVAROVALNICA D.D. - KS3 15.02%
PRVA OSEBNA ZAVAROVALNICA D.D. - KS4 11.28%
PRVA OSEBNA ZAVAROVALNICA D.D. - KS1 11.26%
PRVA OSEBNA ZAVAROVALNICA D.D. - KS2 8.23%
CIMOS d.d. 7.35%
NFD 1. mešani fleksibilni podsklad - Jug 5.88%
FACTOR BANKA d.d. 5.88%
SKUPNA POKOJNINSKA DRUŽBA D.D.. LJUBLJANA 4.61%
Sava Re d.d. 4.04%
SALONIT ANHOVO. d.d. 3.79%
10 MAJOR SHAREHOLDERS 77.34%
OTHER LEGAL ENTITIES 16.88%
OTHER NATURAL PERSONS 5.78%
TOTAL AS AT 31 DECEMBER 2014 100.00%
Source: The Share Register of Prva Group plc.
46 legal entities or natural persons are owners of class A ordinary shares. The largest shareholders among them
are Dej d.o.o. with a 50.20% share, EBRD with a 20% share, Kymah Limited with a 12.22% share, and BTC with a
4.16% share. The others own 13.42% of ordinary shares.

ANNUAL REPORT 2014 11
B Class shares are owned by 67 legal entities or natural persons. The largest stake is owned by Prva osebna
zavarovalnica d.d. – KS3 in the amount of 15.02%, followed by Prva osebna zavarovalnica d.d. – KS4 with an
11.28% share, Prva osebna zavarovalnica d.d. – KS1 with 11.26% share and Prva osebna zavarovalnica d.d. – KS2
holding an 8.23% share. The others own 54.21% of preference shares.
At the end of 2014, the Company does not possess any authorised capital for the payment of shares.
5. THE ECONOMIC ENVIRONMENT
5.1. MACROECONOMIC ENVIRONMENT
Economic crisis raging in Europe managed to stay centre stage in 2014. Nevertheless, also some notable success
stories were seen in the same period. Such a situation yet again pointed out the vast structural problems of some
(overly indebted) EU countries. Therefore, it is safe to say that the year 2014 was full of mixed messages, but
with a positive spin at the end. It comes as no surprise that austerity measures were yet again a phrase we kept
on hearing about and even more so, how the strategy is not working for everyone. Mostly in context with Germany
on one and Greece on the other side of the argument with the later yet again beginning a fresh cycle of debt
terms negotiation. Among other staples, we also found debates surrounding the role of UK in the EU, whether
UK needs to be a part of EU, unemployment levels in Italy and Spain as well as some minor political instability in
several other countries.
USA at the same time had a predominantly good year where the economy expanded in 2014, despite the negative
growth of 2.4% GDP in the first quarter of the year. The country achieved good marks in all major macroeconomic
indicators with any short-term importance chief amongst them being steadily falling unemployment. Along with
the soaring stock markets, such a situation convicted FED to announce a gradual end to the quantitative easing
policy they have been driving for so long (the time for key interest rate hikes is also getting nearer and nearer).
In 2014, we also saw some activity in Japan, where the central bank has taken an even more active role in
expanding their QE programme, although the results are mixed. Emerging markets have not behaved
homogenous, with most of them missing the analysts’ expectations of economic growth. Beyond their own
specific problems that include unstable currencies, emerging market economies were also hit by volatile
commodity prices. We also witnessed escalation of the Crimea situation in Ukraine with the region later being
annexed to Russia as well as China successfully achieving the lowest GDP growth in 24 years with it being closer
to the goal growth at 7.4%. The fastest growing emerging market superpower thus officially became India.
The mentioned commodity market volatility manifested itself predominantly in the second half of 2014 with oil
prices more then halving to some 53 USD a barrel. Reasons behind the dynamic can besides speculative and
geopolitical reasons that can mostly be attributed to long debated demand fall (emerging markets struggling
with their economic recovery) on one hand and the rising supply on the other (with US strategic reserves
reportedly almost maxing out in early 2015).
Outlook for the 2015 seems to be favouring general conditions in USA with more then 4 years of rising employment
combined with relatively low export set to improve domestic consumption. With low oil prices the disposable
income of the vast majority notably improves, further driving the economic growth. Even from a market
standpoint, the macroeconomic indicators in US (especially unemployment levels) coupled with absence of other
short-term problems (social problems and tax inequalities can wait) there are no noticeable hurdles to prevent
market indices from completing yet another consecutive year in the green. Another bonus for the US economy
are inflationary pressures in Europe and consequent low yields of EUR denominated bonds which to some extend
limits US borrowing costs. The favourable conditions in USA however do not translate into European markets
being any less attractive for investors. Quite the opposite is true due to ECB monetary policy changes (QE) that
should translate into a couple of good years for EUs main stock indices.
Table 2: Main Economic Indicators - Slovenia:
2011 2012 2013 2014 estimate 2015 forecast
4Q 13 1Q 14 2Q 14 3Q 14 IMAD BS IIMF EC IMAD BS IMF EC
Real BDP (YoY %) 0.7 -2.6 -1.0 2.1 2.1 2.9 3.2 2.5 1.6 1.4 2.6 2.0 1.3 1.4 1.8
Cur. Acc. (% BDP) 0.4 2.8 5.8 5.4 4.2 5.7 6.5 5.5 5.2 5.9 5.9 5.6 4.8 5.8 6.7
Debt/ BDP 46.2 53.4 70.4 70.4 77.1 78.3 78.1 82.2 82.2 83.0
09 14 10 14 11 14 12 14
CPI (YoY %) 1.8 2.6 1.8 -0.3 -0.1 -0.2 0.2 0.3 0.5 0.5 0.2 0.6 0.7 1.0 -0.3
Unemplo. (%) 11.8 12.0 13.1 12.3 12.6 12.5 13.0 13.1 9.9 13.9 13.0 9.5 9.5
Budget (% BDP) -6.4 -4 -14.7 -4.4 -5.4 -2.8 -2.9

12 ANNUAL REPORT 2014
Judging by the reported growth, the economic environment in Slovenia improved in 2014 as the country is
officially out of recession. Yet, in contrast with US, the Slovenian job market remained staled with much the
same levels, as we have seen throughout the second half of 2013. Following five straight quarters of growth and
a 1% decrease in the year 2013 official data states that gross domestic product increased by 2.5% in 2014, which
is the highest recorded annual growth since 2008. Most analysts agree that we are heading for growth
deceleration in 2016, which is still a vast improvement considering the consensus of about a year ago which
pointed at recession continuing throughout 2015 and 2016.
It is not unusual for such an economy that the economic growth in the first part of the economic recovery is
mostly a result of the improved export and a hike in investments with virtually no improvements in other GDP
components as of yet. Inflation remains low with hardly any price growth in 2014 (0.2%), where excluding the
effect of the excise duties on fuel actually results in a price deflation of 0.7%.
Pessimistic IMAD forecasts have also not come true in regards of further unemployment growth as the
unemployment level (after a brief hike to 14.2% in the first months) fell from about 13.5% at the end of 2013 to
the yearly low at 12.3% in September, followed by a slightly rise to 13% at the end of the year. On a positive
note, results of the latest ESS survey of employers view for the 2015 predict a 0.5% higher employment levels.
6. CAPITAL MARKETS
6.1. MONETARY MARKETS AND INTEREST RATES
ECB trend of setting record low key interest rates that started in 2012 did not disappoint in 2014 either. Monetary
policy maker gradually decreased interest rates three times since the start of 2012 (when the rate was set to 1%)
to 0.25% at the start of 2014. After two further decreases in June and September, the key interest rate was set
at the current 0.05%. This was not unexpected at all as Mario Draghi hinted heavily to this in the previous years,
however there was also heavy speculation that quantitative easing programme would be introduced in 2014
(instead it was officially announced at the start of 2015).
Similarly, Euribor achieved record lows, despite a slight increase in the second quarter of the year.
Graph 1: Key interest rate trend of the ECB and 3 M Euribor in 2014
Source: Bloomberg
6.2. BOND MARKETS
The chart below encompasses only two government bonds, yet it pretty much sums up bond trends of 2014. In
accordance with the inflationary pressures, the interest rate plummeted (especially Euro denominated ones)
over the course of the year. German government bond with maturity in early 2024 started the year yielding about
1.9% to the investor but ended the year at just 0.4% market yield. Due to some inherit risks and recent
instabilities, the Slovenian yield curve has seen shifts that are even more dramatic. The Slovenian bond maturing
in 2024, presented in Graph 2, continued the trend from the last quarter of 2013 and ended the year with yield
ECB key interes rate0.05%
3M Euribor0.08%
0.00%
0.05%
0.10%
0.15%
0.20%
0.25%
0.30%
0.35%
Jan
Feb
Mar
Apr
May
Jun
Jul
Aug
Sep
Oct
Nov
Dec

ANNUAL REPORT 2014 13
to maturity at just over 2%. Not even some prolonged domestic problems (political instability, unemployment
levels etc.) managed to sway the trend, as Slovenia did not face any problems in regards to liquidity or access
to funding last year.
As the only agency with a speculative grade rating for Slovenian government bonds, Moody’s stuck with their Ba1
rating thorough the 2014 but raised it a notch to Baa3 in early 2015, rising the grade back to investment grade
joining Standards & Poor’s (A-) and Fitch (BBB+).
Graph 2: Rate of return trend of Slovene and German 10-year state bonds in 2014
Source: Bloomberg
Graph 3: Risk premium trend of 5- and 10-year corporate bonds in 2014
Source: Bloomberg
6.3. STOCK MARKETS
The bullish market of 2013 had some momentum left for the 2014, though the end results were a bit less green.
We were disappointed with the overall performance of the main indices from the old continent as we were left
with single digit gains (Euro Stoxx 50 +1.2%, DAX +2,7%) instead of some 20% gains from the preceding year. In
addition, FTSE 100 even lost 2.7% YoY. Overseas the main three indices offered better returns at around 10%
SLOREP4 ⅝ 09/242.10%
DBR 6 ¼ 01/04/24 €0.39%
0.%
0.1%
0.2%
0.3%
0.4%
0.5%
Jan
Feb
Mar
Apr
May
Jun
Jul
Aug
Sep
Oct
Nov
Dec
MARKIT ITRX EUROPE 12/18 PRICE 72.735 CMA
New York62.85
MARKIT ITRX EUROPE 12/23 PRICE 119.500 CMA
New York101.07
50
60
70
80
90
100
110
120
130
Jan
Feb
Mar
Apr
May
Jun
Jul
Aug
Sep
Oct
Nov
Dec

14 ANNUAL REPORT 2014
(S&P 500 gained 11%, DJIA 8%, NASDAQ Composite 13%), but were also missing high-set watermarks from the
previous year. Worth noting is the Japanese Nikkei 225 that offered its investors a +7% increase last year and
Indian BSE SENSEX 30 that soared 30%.
Slovenian index SBI TOP grew on a yearly basis for the third consecutive year in 2014 ending the year just shy of
20% higher.
Table 3: Market capitalisation of the Ljubljana Stock Exchange
in million € 31/12/2010 31/12/2011 31/12/2012 31/12/2013 31/12/2014
EQUITY MARKET 7,028 4,873 4,911 5,173 6,214
Prime Market 4,714 3,696 3,992 4,487 5,217
Standard Market 1,499 578 318 235 581
BOND MARKET 13,193 14,459 12,736 13,956 17,520
FUND MARKET 107 20 17 14 /
CLOSE-END FUND MARKET 159 / / / /
TOTAL 20,486 19,352 17,644 19,143 23,734
Source: LJSE
Graph 4: SBITOP index in 2014
Source: Bloomberg
SBI TOP784.12
650
670
690
710
730
750
770
790
810
830
850
Jan
Feb
Mar
Apr
May
Jun
Jul
Aug
Sep
Oct
Nov
Dec
SBI TOP
ANNUAL REPORT 2014 15
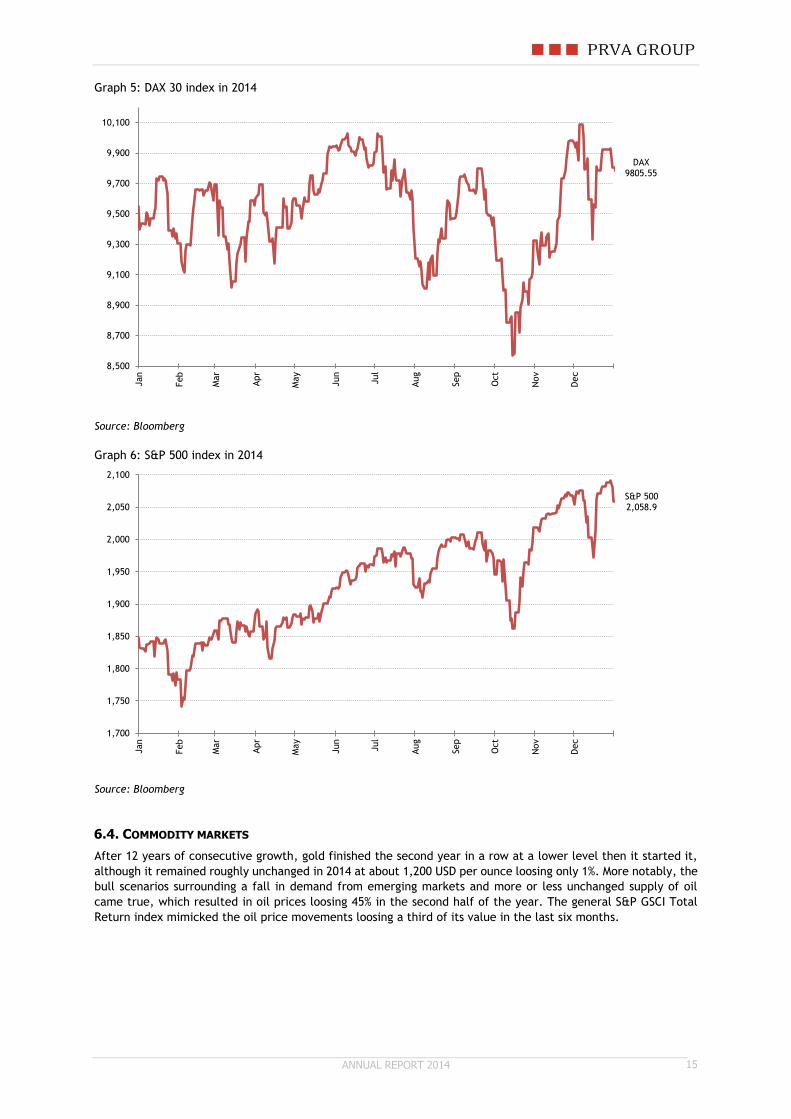
Graph 5: DAX 30 index in 2014
Source: Bloomberg
Graph 6: S&P 500 index in 2014
Source: Bloomberg
6.4. COMMODITY MARKETS
After 12 years of consecutive growth, gold finished the second year in a row at a lower level then it started it,
although it remained roughly unchanged in 2014 at about 1,200 USD per ounce loosing only 1%. More notably, the
bull scenarios surrounding a fall in demand from emerging markets and more or less unchanged supply of oil
came true, which resulted in oil prices loosing 45% in the second half of the year. The general S&P GSCI Total
Return index mimicked the oil price movements loosing a third of its value in the last six months.
DAX 9805.55
8,500
8,700
8,900
9,100
9,300
9,500
9,700
9,900
10,100
Jan
Feb
Mar
Apr
May
Jun
Jul
Aug
Sep
Oct
Nov
Dec
S&P 500 2,058.9
1,700
1,750
1,800
1,850
1,900
1,950
2,000
2,050
2,100
Jan
Feb
Mar
Apr
May
Jun
Jul
Aug
Sep
Oct
Nov
Dec

16 ANNUAL REPORT 2014
Graph 7: Commodities index S&P GSCI Total Return in 2014
Source: Bloomberg
Graph 8: Gold spot price in 2014
Source: Bloomberg
S&P GSCI Tot Return 3,232.80
3,000
3,500
4,000
4,500
5,000
5,500
Jan
Feb
Mar
Apr
May
Jun
Jul
Aug
Sep
Oct
Nov
Dec
S&P GSCI Tot Return
GOLD SPOT $/OZ1,187.96
1,100
1,150
1,200
1,250
1,300
1,350
1,400
Jan
Feb
Mar
Apr
May
Jun
Jul
Aug
Sep
Oct
Nov
Dec
GOLD SPOT $/OZ

ANNUAL REPORT 2014 17
Graph 9: CL1 oil price in 2014
Source: Bloomberg
CL1 Oil price53.27 USD
50
60
70
80
90
100
110
Jan
Feb
Mar
Apr
May
Jun
Jul
Aug
Sep
Oct
Nov
Dec

18 ANNUAL REPORT 2014
7. FINANCIAL RESULT OF THE COMPANY AND THE GROUP
The Company ended the 2014 financial year with a net profit of EUR 1,055,841, primarily as a result of the
investment part of operations. In the same period, the Group recorded a net profit of EUR 3,905,143.
Table 4: Key financial indicators of Prva Group plc. and the Group
Prva Group The Group
2014 2013 2014 2013
Net premium income 0 0 11,368,005 8,568,697
Net claims costs 0 0 -3,441,179 -2,154,811
Costs of acquiring insurants 0 0 -3,430,979 -2,725,420
Profit before tax 1,105,841 450,597 4,090,845 261,278
Net profit 1,055,841 717,000 3,905,143 580,575
Income tax -50,000 266,403 -185,702 319,297
Assets under management* - - 589,543,883 503,065,943
Number of policyholders - - 412,938 392,351
Net increase in the number of policyholders - - 20,587 27,863
Average annual premium - - 180 194
Management fee - - 0.87% 0.93%
Yields of funds - - 7.70% 4.03%
(attributed weighted average)
Capital
ROE from operations 8.07% 8.97%
ROE from investments 5.72% -7.99%
Total ROE 13.80% 2.19%
Number of employees on the last day of the year 108 109
* Sum of balances in disclosure: Assets from financial contracts (Disclosure 18, table 38) in the amount of EUR 237,782,919; assets from pension annuities in disclosure of technical provisions (Disclosure 22, Table 48) in the amount of EUR 10,855,376 and in disclosure of off balance sheet liabilities of the Company (Disclosure 26, Table 55) in the amount of EUR 334,402,316; assets of unit-linked insurants in the amount of 1,458,080 (Statement of the financial position of the Company); the assets for covering other technical provisions in the amount of 4,943,939.
8. INFORMATION TECHNOLOGY
Through close monitoring, developing and implementing of new information technology solutions, enterprises in
the Group successfully enhanced their data security and business process with implementing Business continuity
plan.

ANNUAL REPORT 2014 19
9. ORGANISATION AND PERSONNEL
Based on the hours worked, Prva Group, insurance holding company plc. had an average of 1.2 employees in
2014. The number of employees varies depending on the requirements in a specific period. As at the last day of
2014, 1.2 person was employed in the Company. As on 31 December 2014, the Group employs 108 employees
(109 on 31 December 2013).
Table 5: The number of employees by level of education as at 31 December 2014
Organisational unit
Headcount
Professional education level
Headcount
Management Board 0.2 PhD 0.2
Analytics 1 University degree 1
Total 1.2 Total 1.2
10. RISK MANAGEMENT
Risk management is an integral part of all business process of the Group and the Company.
A detailed description of the risk management process is included in Sections 28 to 30 of the financial
report.
Risk management has become an integral part of all business process, based on clear and specific organisation
and well-thought processes, responsibilities and authorisations of individual functions and committees. Risk
management provides for the control and management of uncertainties stemming from business opportunities,
which is of fundamental importance for superior business decisions and consequently improved performance
results.
10.1. MANAGEMENT OF CAPITAL AND CAPITAL ADEQUACY
The primary goal of capital management is to ensure sufficient and appropriate capital adequacy of all companies
within the Group.
Pursuant to the current Slovene legislation, capital is measured in terms of its availability to comply with
regulatory capital requirements at the level of individual insurance companies as well as at the level of the
Group.
10.2. FINANCIAL RISK
In managing assets of guarantee funds and financing operations we are exposed to the following core risks as
part of the capital and capital adequacy management:
Risk of changes in prices of securities and fluctuation of interest rates
Credit risk and
Liquidity risk.
When forming the investment policies of individual long-term business funds, we consider the nature and
characteristics of an insurance company's liabilities as we aim to achieve optimum spread of assets and an
optimum return.
10.3. INTEREST RATE RISK
Interest rate risk is the risk of fluctuating market interest rates impacting the value of interest-sensitive assets,
bonds and other debt securities whose value is sensitive to the interest rate fluctuation. In the event of interest
rates increase, the value of debt securities usually falls. On the other hand, in the event of a fall in interest
rates, the value of debt securities usually increases. Interest sensitivity of debt securities is usually increased
though prolonged maturity periods, reduced absolute level of interest rate in the economy, and lower instrument
coupon.
Interest rate risk is managed primarily through balancing of investment maturities (debt financial instruments)
restructuring of investments from debt financial instruments at fixed interest rate to debt financial instruments

20 ANNUAL REPORT 2014
with variable rates of interest, maturity balancing, and average modified duration of debt financial instruments
while considering anticipated changes in interest rates, and the use of derivatives.
10.4. RISK OF CHANGES IN SHARE PRICES
The Company and the Group manage the risk of changes in prices of its portfolio securities through setting limits
of acceptable exposure and through spread of investments both geographically and industry-wise. The security
portfolio is comprised primarily of debt securities and as a result of this diversification, the risk of changes in
prices of securities is further mitigated. Another important factor affecting investment decisions is the liquidity
of securities.
10.5. LIQUIDITY RISK
Liquidity risk is the risk that due to limited liquidity of investments on securities market, the Company or the
Group will not be able to trade an individual investment or trade the investment at significantly unfavourable
conditions (primarily pricing conditions) than those at which the investment was valued. The risk or threat of
imbalanced liquidity or imbalances between maturities of assets and liabilities may result in liquidity issues i.e.
lack of monetary assets needed for the settlement of liabilities on maturity.
Liquidity risk is minimised through balancing investments' liquidity (liquidity is measured in terms of the issue's
volume and the gap between its cost and its selling price), considering individual capital market's liquidity, and
regular monitoring of the dynamics of inflow and outflows of portfolio assets, as well as by balancing the required
additional liquidity assets under the ALM principle.
10.6. CURRENCY RISK
Currency risk is the risk of changes in foreign currency exchange rates impacting the value of the local currency
investments, which are denominated in a foreign currency.
Our exposure to currency risk is only minor as most of our assets are invested in the euro.
Of other currency exposures, major exposure risk derives from currencies of the former Yugoslav countries.
Currency risk is mitigated predominantly through balancing of the assets and liabilities currency structure, by
selecting investments in foreign currencies whose exchange rates in comparison with the local currency on
average fluctuate in opposite directions (appropriate currency spread), and by use of derivatives.
10.7. CREDIT RISK
Credit risk, as one of the most significant financial risks is the risk of the counter party or the issuer of a financial
instrument held by long-term business funds or the Company, failing to fulfil its obligations in full amount either
on maturity or subsequently. It also includes the risk of a reduction in the value of securities as a consequence
of increased probability of default, which is usually reflected in the reduction of the credit rating of the issuer's
debt instruments.
A subgroup of the credit risk is the settlement risk, which is the risk of loss due to the process of payments
between two or more parties in the settlement systems failing to proceed as expected or as agreed. This occurs
mostly on exchange of assets when one of the parties to the settlement fails to settle its liabilities to one or
several creditors after they had already fulfilled their individual obligations.
Credit risk is measured through daily monitoring of the issuers' operations or those of counter parties, to which
the funds or the Company are exposed to in the form of deposits or receivables on account of derivative financial
instruments. As part of the business performance monitoring, credit ratings, direction of changes in credit
ratings, the volume of share capital of these entities, their performance result etc. are monitored particularly
closely.
In addition, the basis for determining the risk of counter party default includes the contractual relationship
between the Company and its counter party or the issuer, regulatory provisions, Rules of Procedures of the
Central Securities Clearing Corporation in relation to transaction settlement, and rules on compliance with
obligations on organised markets on which financial instruments are traded.
Settlement risk is managed by following high quality standards of business partners, their services and payment
discipline, which are monitored during the business relationship duration.

ANNUAL REPORT 2014 21
10.8. OPERATIONAL RISK
Operational risk is the risk of a loss, including a legal risk, arising due to the following circumstances:
inadequate or inaccurate performance of internal processes
other inappropriate conduct of persons belonging to the internal business sphere of the legal entity
inadequate or inaccurate operation of systems belonging to the internal business sphere of the entity,
or
other external events or actions.
Examples of operational risks include: external criminal activities, strategic risk, natural disasters, internal
control system, process management, terrorist attacks and war, information technology infrastructure, software
applications, legal risk, risk of loss of reputation, human error etc.
Operational risk is managed through well-defined investment process including internal and external controls,
which minimise the likelihood of losses arising from operational risk. In the event that in spite of a well
establishes system of preventative measures and rules a loss event occurs stemming from operational risk, the
Company applies a system of specific corrective measures, aimed at mitigating and annulling the loss at the
earliest opportunity.
10.9. FUTURE PLANS
In the next few years, the Group will consolidate its vision of becoming the strongest provider of pension
insurance in the region, with a minimum 25-percent market share on all markets on which the Group operates.
Through the growth in the pension insurance, we will expand our business to life insurance on those markets,
where we have competitive advantages due to our presence as the provider of pension insurance services. Life
insurance development will be based on the development of pension annuities and innovative life insurance
products that are available to a wider circle of individuals.
The Group expects to have over 430 thousand insurants by the end of 2015, more than EUR 600 million assets
under management and over EUR 85 million of insurance premium. The consolidated profit for 2015 is planned
at EUR 3.7 million. In line with the adopted strategy for 2014-2018, we expect to increase the number of insurants
to nearly 550 thousand and surpassing the 1 billion threshold in assets under management in the next five years.
In the next years, we aim to focus our operations on existing markets. The major growth in assets under
management is expected to be recorded in our subsidiary KB Prvo, Macedonia, whereas the Prva osebna
zavarovalnica d.d., Slovenia expects to record growth primarily in its share of life insurance. Stable growth and
increase in the profits are planned in subsidiaries DDOR Garant in Serbia and FSKP Kosovo.
Therefore, despite deteriorated economic conditions we remain committed to growth and progress.
10.10. SIGNIFICANT SUBSEQUENT EVENTS
No events or circumstances occurred after the reporting date that would have an impact on the financial
statements for the year ended on 31 December 2014.

22 ANNUAL REPORT 2014
11. INDEPENDENT AUDITOR’S REPORT

ANNUAL REPORT 2014 23
12. FINANCIAL STATEMENTS OF THE COMPANY AND THE GROUP
12.1. INCOME STATEMENT
EUR Notes Prva Group The Group
2014 2013 2014 2013
Net premium income 1.1 0 0 11,368,005 8,568,697
Other insurance income 1.2 344,100 254,476 7,342,899 7,053,105
Revenue from financial assets
Interest income 2.1 68,240 120,920 1,415,870 1,450,098
Interest expense 2.2 0 0 -697 0
Dividend Income 3 1,231,002 2,173,876 161,618 347,366
Net foreign exchange differences 4 0 0 133,039 -13,771
Net gains/losses from disposal of 4 -140,043 70,775 61,211 81,906
investments
Revaluation operating revenue 4 0 49,715 67,664
(net)
Impairment loss 4 -128,756 -1,899,829 -133,815 -4,053,924
Net expenses for claims 5.1 0 0 -3,441,179 -2,154,811
Change of technical provisions 5.2 0 0 -3,654,201 -3,421,833
Operating costs
Costs of acquiring insurants 6 0 0 -3,430,979 -2,725,420
Employee benefits 7 -107,692 -90,646 -2,855,580 -2,574,056
Depreciation and amortisation 12.13 -39,513 -42,101 -359,336 -320,721
Other costs 8 -123,356 -140,620 -2,001,000 -1,751,872
Other revenue 9.1 1,858 3,746 173,615 167,665
Other expenses 9.2 0 0 -738,340 -458,816
Profit before tax 1,105,841 450,597 4,090,845 261,278
Income tax and deferred tax 10 50,000 266,403 -185,702 319,300
Net profit 1,055,841 717,000 3,905,143 580,575
- attributable to equity holders of the parent - - 3,242,905 14,674
- non controlling interest - - 662,238 565,901
Net/diluted earnings per share 11 - - 9.75 0.05
The notes on pages 29 through 78 are an integral part of the financial statements.

24 ANNUAL REPORT 2014
12.2. STATEMENT OF COMPREHENSIVE INCOME OF THE COMPANY AND THE GROUP
EUR Prva Group The Group
Notes 2014 2013 2014 2013
I. Net profit/loss for the year 1.055.841 717.000 3.905.143 580.575
II. Other comprehensive income after tax (1 + 2 + 3 + 4 + 5 + 6 + 7 + 8 + 9)
64.687 607.395 573.074 572.885
4 Net gains/losses on re-measurement of AFS financial assets
40.782 711.274 906.201 646.458
4.1. Gains / (losses) recognised in the revaluation reserve
-155.732 -96.534 955.990 -161.350
4.2. Transfer of gains / (losses) from the revaluation reserve to profit or loss
196.514 807.808 -49.789 807.808
5 Exchange rate differences 0 0 -181.204 -49.009
6 Tax on other comprehensive income 10 -23.905 -103.879 -151.923 -24.564
III. Total comprehensive income for the period (I + II) 1.120.528 1.324.395 4.478.216 1.153.460
attributable to equity holders of the parent - - 3.980.958 601.031
non-controlling interest - - 497.258 552.429
The notes on pages 29 through 78 are an integral part of the financial statements.

ANNUAL REPORT 2014 25
12.3. STATEMENT OF FINANCIAL POSITION OF THE COMPANY AND THE GROUP
EUR Notes Prva Group The Group
31.12.2014 31.12.2013 31.12.2014 31.12.2013
ASSETS
Property, plant and equipment 12 18,214 24,100 642,847 634,585
Intangible assets 13 21,240 56,296 563,126 813,356
Deferred tax assets 10 339,581 413,486 705,437 776,464
Investments in subsidiaries 14.1 16,660,326 16,706,212 0 0
Financial assets
Assets attributable to unit holders 15 0 0 1,458,080 1,043,151
Investments in securities 1,453,377 1,873,238 31,936,479 25,463,405
1. Held-to-maturity 16.1 0 0 0 18,002,101
2. Available-for-sale 16.2 1,453,377 1,873,238 31,175,836 6,826,440
3. Measured at fair value through profit or loss 16.3 0 0 760,643 634,863
Deferred expenses and accrued income 17 1,098 15,428 254,371 234,606
Assets from financial contracts 18 0 0 237,782,319 220,001,692
Issued loans and deposits 19 1,972,416 2,516,740 7,721,494 8,144,757
Other receivables 17 188,144 197,086 1,676,928 1,348,467
Cash and cash equivalents 20 41,782 55,195 1,510,462 1,134,137
TOTAL ASSETS 20,696,178 21,857,780 284,251,543 259,594,619
EQUITY and LIABILITIES
Equity
1. Issued share capital 13,386,247 13,386,247 13,386,247 13,386,247
2. Reserves 6,021,220 6,021,220 6,021,220 6,021,220
3. Revaluation reserve -52,028 -116,715 371,865 -366,189
4. Retained earnings 1,320,344 1,064,763 6,705,854 4,263,210
5. Issued shares -1,110 -1,110 -1,110 -1,110
6. Non-controlling interest 0 0 3,162,907 3,238,458
Total capital 21 20,674,673 20,354,405 29,646,983 26,541,837
Technical provisions 22 0 0 13,718,867 9,492,426
Of that: gross provisions in favour of unit-linked insurance underwriters
0 0 1,378,104 1,024,736
Liabilities from financial contracts 23 0 0 237,435,509 220,001,692
Financial liabilities from borrowings 24 0 0 0 77,161
Other liabilities 25 16,369 1,494,261 1,502,476 2,392,375
Deferred tax liabilities 0 0 177,258 0
Other provisions 25 0 0 110,014 88,578
Short-term accrued cost and deferred income 25 5,136 9,114 1,660,437 1,000,551
TOTAL EQUITY and LIABILITIES 20,696,178 21,857,780 284,251,543 259,594,619
The notes on pages 29 through 78 are an integral part of the financial statements.

26 ANNUAL REPORT 2014
12.4. CASH FLOW STATEMENT OF THE COMPANY AND THE GROUP
EUR Prva Group The Group
2014 2013 2014 2013
Cash flows from operating activities
Profit or loss before taxes 1,105,841 450,597 5,189,137 2,214,809
Adjustments for: -941,869 1,552,677 -998,162 1,908,877
Profit/loss from investments measured at 0 0 -15,889 -4,804
Net interest income -67,240 -120,920 -1,423,513 -1,443,724
Dividend income -1,231,002 -197,558 -161,618 -347,366
Investment impairment 174,642 1,899,829 228,411 3,967,501
Depreciation of fixed assets 39,513 42,101 365,250 -185,398
Gains/losses from disposal of investments 142,218 -70,775 142,218 -83,584
Net foreign exchange differences 0 0 -133,021 6,253
Profit from operating activities prior to changes in working capital
163,972 2,003,274 4,190,975 4,123,686
Increase in receivables/liabilities -658,338 -1,178,410 2,589,615 1,392,237
Cash flow from operations -494,366 824,864 6,780,590 5,515,923
Interest income 88,969 0 2,219,417 260,863
Interest paid 0 0 -1,254 88,955
Taxes paid 0 0 -12,929 0
Net cash from operating activities -405,397 824,864 8,985,824 5,865,741
Cash flows from investing activities
Disbursements to acquire property, plant and equipment -1,428 0 -156,335 -109,752
Disbursements to acquire intangible assets 0 0 131,150 -134,162
Proceeds/disbursements from disposal of AFS financial assets
1,880,732 2,108,636 2,395,848 2,108,636
Disbursements to acquire financial assets measured at fair value
-1,247,157 0 -8,967,207 -4,146,749
Proceeds/disbursements for non-current investments 0 0 -14,958 -220,168
Proceeds/disbursements for non-current HTM investments 0 0 -34,666 -208,344
Net receipts from repayments and expenditure for issued loans and deposits
556,963 -237,262 -666,439 -237,262
Proceeds/disbursements for the establishment of new entities, payment of additional capital
0 0 0 0
Dividends received 3,135 0 77,712 0
Net cash from investing activities 1,192,244 1,871,374 -7,234,895 -2,947,801
Cash flows from financing activities
Payment of preference and ordinary dividends and repayment of capital
-800,260 -2,683,847 -800,260 -2,522,249
Dividends paid to non-controlling interests 0 -572,808
Net cash from financing activities -800,260 -2,683,847 -1,373,068 -2,522,249
Net cash flows -13,413 12,391 377,861 395,691
Net foreign exchange differences 0 0 -1,536 3,176
Cash and cash equivalents as at 1 January 55,195 42,804 1,134,137 728,358
Cash and cash equivalents at 31 December 41,782 55,195 1,510,462 1,134,137
The notes on pages 29 through 78 are an integral part of the financial statements.

ANNUAL REPORT 2014 27
12.5. STATEMENT OF CHANGES IN EQUITY OF PRVA GROUP
EUR Share
capital Share
premium Treasury
shares
Profit reserves
and other
reserves Revaluation
reserve Retained earnings Total
Balance at 1 January 2013 14,026,588 6,859,429 0 3,386 -724,109 1,549,674 21,714,968
Comprehensive income for the year 0 0 0 0 607,394 717,000 1,324,394
a.) Net profit 0 0 0 0 0 717,000 717,000 b.) Other comprehensive income 0 0 0 0 607,394 0 607,394
Ordinary share dividends 0 0 0 0 0 -1,200,000 -1,200,000
Preference share dividends 0 0 0 0 0 -1,910 -1,910 Capital increase from own assets 841,596 -841,596 0 0
Repayment of capital -1,481,937 0 0 -1,481,937
Acquisition of treasury shares 0 0 -1,110 0 0 0 -1,110
Balance at 31 December 2013 13,386,247 6,017,833 -1,110 3,386 -116,715 1,064,764 20,354,405
Balance at 1 January 2014 13,386,247 6,017,833 -1,110 3,386 -116,715 1,064,764 20,354,405
Comprehensive income for the year 0 0 0 0 64,687 1,055,841 1,120,528
a.) Net profit 0 0 0 0 0 1,055,841 1,055,841 b.) Other comprehensive income 0 0 0 0 64,687 0 64,687
Ordinary share dividends 0 0 0 0 0 -399,364 -399,364
Preference share dividends 0 0 0 0 0 -400,897 -400,897 Capital increase from own assets 0 0 0 0
Repayment of capital 0 0 0 0
Acquisition of treasury shares 0 0 0 0 0 0 0
Balance at 31 December 2014 13,386,247 6,017,833 -1,110 3,386 -52,028 1,320,344 20,674,673
The notes on pages 29 through 78 are an integral part of the financial statements.

28 ANNUAL REPORT 2014
12.6. STATEMENT OF CHANGES IN EQUITY OF THE GROUP
EUR
Share capital
Share premium
and profit reserves
Revaluation reserve
Retained earnings
Total equity
holders of the parent
Non-controlling
interest Total
Balance at 1 January 2013 14,026,588 6,862,816 -939,073 5,450,446 25,400,777 2,672,556 28,073,333
Comprehensive income for the year 0 0 572,885 14,674 587,559 565,901 1,153,460
a.) Net profit 0 0 0 14,674 14,674 565,901 580,575 b.) Other comprehensive income 0 0 572,885 0 572,885 0 572,885 Ordinary share dividends - the Group 0 0 0 -1,200,000 -1,200,000 0 -1,200,000
Preference share dividends - the Group 0 0 0 -1,910 -1,910 0 -1,910
Capital increase from own assets - the Group 841,596 -841,596 0 0 0 0 0 Repayment of capital - the Group -1,481,937 0 0 0 -1,481,937 0 -1,481,937
Acquisition of treasury shares - the Group 0 -1,110 0 0 -1,110 0 -1,110
Balance at 31 December 2013 13,386,247 6,020,110 -366,189 4,263,210 23,303,379 3,238,458 26,541,837
Balance at 1 January 2014 13,386,247 6,020,110 -366,189 4,263,210 23,303,379 3,238,458 26,541,837
Comprehensive income for the year 0 0 738,054 3,242,905 3,980,958 497,258 4,478,216
a.) Net profit 0 0 0 3,242,905 3,242,905 662,238 3,905,143 b.) Other comprehensive income 0 0 738,054 0 738,054 -164,980 573,074 Ordinary share dividends - the Group 0 0 0 -399,364 -399,364 0 -399,364
Preference share dividends - the Group 0 0 0 -400,897 -400,897 0 -400,897
Dividends paid to non-controlling interests 0 0 0 0 0 -572,808 -572,808 Repayment of capital - the Group 0 0 0 0 0 0 0
Balance at 31 December 2014 13,386,247 6,020,110 371,865 6,705,854 26,484,076 3,162,908 29,646,983
The notes on pages 29 through 78 are an integral part of the financial statements.
ANNUAL REPORT 2014 29
13. NOTES TO THE FINANCIAL STATEMENTS OF THE COMPANY AND THE GROUP
13.1. SUMMARY OF SIGNIFICANT ACCOUNTING POLICIES
Profile of the Company and the Group
The financial statements of Prva Group, insurance holding company, plc. and the Group for the year ended 31
December 2014, were approved by the Management Board on 16 April 2015. Prva Group, insurance holding
company, plc., is a public limited company, established in the Republic of Slovenia. Preference shares of the
Company are listed on the free market of the Ljubljana Stock Exchange.
In line with the Insurance Act, Prva Group, insurance holding company, plc., is a mixed-activity insurance holding
company since it holds a significant share in at least one insurance company. In line with its activities, the
Company performs holding activities in its subsidiary companies. At the end of 2014, the Company employed 1.2
persons (2013: 1.2).
The Company is a legal successor of Prva pokojninska družba, which modified its status in 2007. The new company
- Prva osebna zavarovalnica d.d. was established, to which all voluntary supplementary pension insurance
operations were transferred on 1 September 2007. Prva Group, insurance holding company, plc., changed the
name of the company (formerly Prva pokojninska družba, d.d.) and its activities.
In addition to the Prva Group, insurance holding company, plc. the Group includes:
Prva osebna zavarovalnica d.d.
The company was established in 2007 when the insurants from supplementary pension insurance were transferred
from Prva pokojninska družba d.d.. Prva Group, insurance holding company, plc, is the 100% owner of Prva osebna
zavarovalnica d.d. The operations of Prva osebna zavarovalnica, d. d. in 2013 were predominantly related to
supplementary pension insurance within the framework of the third pillar in Slovenia. Beside supplementary
pension insurance, which belongs to the insurance group with proceeds capitalization, the company started in
2009 to promote accident insurance, life insurance (class of insurance 19), life insurance with investment risk
(class of insurance 21) and health insurance. Prva osebna zavarovalnica is currently manager of four pension
funds, three funds of unit-linked insurance with different investment policies, four long-term business funds
belonging to other classes of insurance, and own funds portfolio. The company offers seven pension schemes. As
at 31 December 2014, the company employed 56 full-time members of staff (2013: 57).
KB Prvo penzisko društvo AD Skopje
The operations of KB Prvo penzisko društvo AD Skopje relate to the second and third pillar supplementary pension
insurance in Macedonia. The company was established in 2005.
Prva Group, insurance holding company, plc., is a 51% owner of KB Prvo penzisko društvo AD Skopje. The
remaining 49% stake is owned by the largest Macedonian bank, the Komercijalna banka a.d. Skopje. The company
had 31 full-time employees on 31 December 2014 (2013: 31).
DDOR-GARANT društvo za upravljnanje dobrovoljnim penzijskim fondom AD Beograd
The operations of DDOR-GARANT AD Beograd relate to the third pillar supplementary pension insurance in Serbia.
On 31 December 2014, Prva Group, insurance holding company, plc., held a 60% interest in the company, which
was established in May 2006. On 31 December 2014, the company had 15 full-time employees (2013: 15).
Fondi Slloveno-Kosovar I Pensioneve Sh.A Pristhine Kosovo
The operations of Fondi Slloveno-Kosovar I Pensioneve Sh.A Pristhine Kosovo relate to supplementary pension
insurance of the third pillar in Kosovo.
Prva Group, insurance holding company, plc., held a 67.4% interest in the company, which was established on 4
September 2006. The remaining 32.6% of the company is owned by Dukagjini Sh.p.k.. The company started to
perform pension insurance transactions in 2007. On 31 December 2014 the company had 5 members of staff in
full-time employment (2013: 4).
Prva zavarovalniško zastopniška družba d.o.o., Slovenia
The company was established at the end of 2010 and is in the 100% ownership of Prva Group plc. The company's
core activity is the sale of insurance services and products of Prva osebna zavarovalnica d.d. to current and new
clients, as well as the increase of market shares of Prva osebna zavarovalnica d.d. within the personal insurance
group.

30 ANNUAL REPORT 2014
Table 6: Investments into subsidiary and associated companies as at 31 December 2014
EUR Ownership Carrying amount
Company capital
Profit/loss for 2014
Subsidiaries
Prva osebna zavarovalnica d.d. 100% 12,730,000 18,790,788 2,562,889
Ameriška ulica 8, 1000 Ljubljana
KB Prvo penzisko društvo AD Skopje 51% 918,272 5,112,318 1,213,219
Blv.Ilinden 1, 1000 Skopje
Fondi Slloveno- Kosovar I Pensioneve Sh.A Pristhine Kosovo 67.40% 511,985 420,098 11,149
Rr.UCK, nr.50/2, 10000 Prishtine
DDOR Garant Beograd 60% 2,435,768 1,302,300 160,315
Maršala Birjuzova 3-5, 11000 Beograd
PRVA zavarovalniško zastopniška družba, d.o.o. 100% 64,300 7,133 -195
Ameriška ulica 8, 1000 Ljubljana
Total 16,660,326 25,632,636 3,947,377
Ultimate parent
A-Z Finance d.o.o.
The ultimate parent of Prva Group plc. is A-Z Finance d.o.o. based at Devinska 1, Ljubljana. A-Z Finance was
founded in 1998 and is 100% owned by Alenka Žnidaršič Kranjc. The company holds a 62.5% interest in DEJ d.o.o.,
which holds a 50.21% stake in Prva Group plc. A-Z Finance compiles a consolidated annual report, which can be
obtained at the head office of the company. DEJ d.o.o. does not prepare a consolidated annual report and is
included in the consolidated annual report of A-Z Finance d.o.o.
Summary of significant accounting policies
Statement of compliance
The enclosed separate and consolidated financial statements of Prva Group plc. and the Group have been
prepared in accordance with International Financial Reporting Standards (IFRS) adopted by the International
Accounting Standards Board (IASB), and interpretations adopted by the IFRS Interpretations Committee, as
adopted by the European Union.
On the balance sheet date, in terms of the EU’s standard confirmation process, there are no discrepancies in the
accounting policies of Prva Group, and the International Financial Reporting Standards (IFRS) adopted by the EU.
The financial statements have been compiled in accordance with the current regulations governing reporting
requirements of insurance and pension companies applicable in the financial year 2014.
Basis of preparation
The financial statements of Prva Group plc. and the Group are prepared on the basis of accounting policies shown
below.
The accounting policies used are consistent with those applied in previous years, except for the newly adopted
standards and interpretations effective for periods beginning on or after 1 January 2014 as presented below.
Basic Policies
The consolidated financial statements of the Group and the separate financial statements of the Company are
prepared based on original values, except for the assets measured at fair value through profit or loss, and
available- for-sale assets at fair value through the comprehensive income statement. The financial statements
are presented in the euro. All values are rounded to one euro, except when specifically indicated otherwise.

ANNUAL REPORT 2014 31
Significant accounting assumptions and estimates
Significant accounting estimates
The preparation of financial statements requires the management to make certain estimates and assumptions
that affect the carrying amounts of assets and liabilities of the Company and the Group, disclosure of potential
liabilities on the reporting date and the amounts of revenues and expenses of the Company and the Group for
the period ending on the reporting date.
Management estimates include but are not limited to: depreciation period and the residual value of intangible
assets and property, plant and equipment, allowances for inventories and doubtful receivables, and claims arising
from lawsuits. Future events and their effects cannot be determined with certainty. Accordingly, the accounting
estimates made require the exercise of judgment and those used in the preparation of the financial statements
will change as new events occur, as more experience is acquired, as additional information is obtained and as
the Company’s operating environment changes. Actual results may differ from those estimates.
The key assumptions concerning the future and other key sources of estimation uncertainty at the reporting
sheet date that have a significant risk of causing a material adjustment to the carrying amounts of assets and
liabilities within the next financial year are discussed below.
Investment property - pension funds
Investment property (land and buildings) are carried separately from all other items of property, plant and
equipment. The following qualifying criteria applies for classification of real estate in the group of investment
property:
Investment property generates economic benefits Investment property is held for the purpose of lease
to bring rental income or increase its cost
The assets are not designated for sales in the immediate future during ordinary course of business.
The asset's cost can be estimated reliably.
On its acquisition, an item of investment property is measured at cost comprising transaction costs; after initial
recognition, they are measured at fair value. Fair value of investment property is its market price on the reporting
date, determined by application of established valuation techniques for market values of real estate (comparable
market prices, most recent transaction prices). Revaluation of investment property is made at least at the end
of the financial year or, in the event of major market changes, it can also be made during the financial year as
and when necessary.
Non-marketable investments - pension funds
Fair value of financial assets whose price cannot be determined on an active capital market is assessed in
consideration of a number of assumptions. Potential changes in these assumptions are reflected in the amount
and potentially also in the impairment of these assets. As a result of the financial crisis, uncertainty associated
with the assessment of the fair value is even greater.
If no active market exists for a financial instrument, its fair value is determined using one of the valuation
techniques. Valuation techniques use the most recent transactions between willing and well informed parties if
available, comparison of the current fair value of an instrument with similar characteristics, consideration of
discounted cash flows, and techniques used for pricing of options. When a valuation technique is most frequently
used by market participants to determine prices of financial instruments and the technique has been proven
reliable in assessment of prices achieved in actual market transaction, the insurance undertaking applies this
particular technique.
The discounted cash flow method uses management's assessment of future cash flows and discount rate that
reflects interest rates of comparable financial instruments.
When fair value cannot be determined, financial instruments are measured at cost (the amount paid or received)
increased by the cost of transaction.
Technical provisions - Prva osebna zavarovalnica d.d.
Technical provisions are set aside according to the Insurance Act and its implementing regulations, and provisions
of IFRS 4.
The Company and the Group recognise technical provisions for coverage of future liabilities from insurance
contracts as well as losses incurred as a result of risks stemming from insurance contracts.
The Company and the Group set aside provisions for unearned premium, provisions for claims outstanding and
mathematical provisions in accordance with provisions of the Insurance Act and the Regulation on Detailed Rules
and Minimum Standards for Calculation of Technical Provisions. The Company sets aside special provisions that

32 ANNUAL REPORT 2014
have a status of mathematical provisions for unit-linked insurance contracts were investment risk stems from
changes in the value of investment funds' units.
Adequacy of the amount of technical provisions that provides assurance that the insurance undertaking will be
able to fulfil all of its obligations stemming from insurance contracts, their compliance with relevant regulations,
as well as the accuracy of insurance premium calculation, are checked and approved by the appointed certified
actuary.
Significant assumptions include mortality tables, cancellations, discount factors, loss ratios and other
assumptions, which were not changed in 2014 as compared to the previous year, and which comply with the
actuarial principles.
Significant management assumptions
In the process of applying the accounting policies, management had made the following judgments apart from
those involving estimations, which have the most significant impact on the amounts recognised in the financial
statement.
The most significant assumptions relate to:
The classification of financial instruments, namely the division between financial instruments the
Company intends to hold to maturity and those available for trading or sale.
Technical provisions Technical provisions are calculated based on insurance contracts, considering past
development of claims events and expectations for the future.
Fair value of financial assets and their impairment: Fair value of financial assets whose price cannot be
determined on an active capital market is assessed in consideration of a number of assumptions.
Potential changes in these assumptions are reflected in the amount and potentially also in the
impairment of these assets. Due to the financial crisis, the uncertainty in measurement of fair value has
been increased.
Investments into subsidiaries and associated companies in the separate financial statements of Prva Group,
plc.
Investments into subsidiaries and associated companies are recognised at cost less impairment losses.
Subsidiaries are those companies over which the parent maintains a controlling interest. Investments in
associated companies refer to enterprises where although the parent has a significant influence, they are not
subsidiaries of the parent.
Consolidation bases
The consolidated financial statements comprise the financial statements of Prva Group, insurance holding
company, plc., and its subsidiaries as at 31 December 2014 and comparable data as at 31 December 2013.
Subsidiaries are fully consolidated from the date of acquisition, being the date on which the Group obtains
control, and continue to be consolidated until the date when such control ceases. The financial statements of
the subsidiaries are prepared for the same reporting period as the parent company using consistent accounting
policies. All intra-group balances, transactions, unrealised gains and losses resulting from intra-group
transactions, as well as intra-group dividends, are eliminated in full.
Losses within a subsidiary are attributed to the non-controlling interest even if that results in a deficit balance.
A change in the ownership interest of a subsidiary, without a loss of control, is accounted for as an equity
transaction. When the Group loses control over a subsidiary during the financial year, it:
Derecognises the assets (including goodwill) and liabilities of the subsidiary
Derecognises the carrying amount off any non-controlling interest
Derecognises the cumulative exchange rate differences, recorded in equity
Recognises the fair value of the consideration received
Recognises the fair value of any investment retained
Recognises any surplus or deficit in profit or loss
Reclassifies the parent’s share of components previously recognised in other comprehensive income to
profit or loss or retained earnings, as appropriate.

ANNUAL REPORT 2014 33
Bases for consolidation before 1 January 2010
Certain of the above-mentioned requirements were applied on a prospective basis. The following differences,
however, are carried forward in certain instances from the previous basis of consolidation:
Acquisitions of non-controlling interests, prior to 1 January 2010, were accounted for using the parent
entity extension method, whereby the difference between the consideration and the carrying amount
of the share of the net assets acquired was recognised in equity.
Losses incurred by the Group were attributed to the non-controlling interest until the balance was
reduced to nil. Any further excess losses were attributed to the parent, unless the non-controlling
interest had a binding commitment to cover these. Losses incurred prior to 1 January 2010 were not
allocated between NCI and the parent shareholders.
Upon loss of control, the Group accounted for the investment retained as its proportionate share of net
assets at the date control was lost. The carrying value of such investments at 1 January 2010 has not
been restated.
Business combinations
Business combinations are accounted for using the acquisition method. The cost of an acquisition is measured as
the aggregate of the consideration transferred, measured at acquisition date fair value and the amount of any
non-controlling interest in the acquiree. For each business combination, the acquirer measures the non-
controlling interest in the acquiree either at fair value or the proportionate share of the acquiree’s identifiable
net assets. Acquisition costs incurred are expensed and included in the general administrative costs.
When the Group acquires a business, it assesses the financial assets acquired and liabilities assumed for
appropriate classification and designation in accordance with the contractual terms, economic circumstances
and pertinent conditions as at the acquisition date. This includes the separation of embedded derivatives in host
contracts by the acquiree.
If the business combination is achieved in stages (step acquisitions), the acquisition date fair value of the
acquirer's previously held interest in the acquiree is re-measured to fair value at the acquisition date through
profit or loss. Any contingent consideration to be transferred by the acquirer is recognised at fair value at the
acquisition date. Subsequent changes to the fair value of the contingent consideration which is deemed to be an
asset or liability will be recognised in accordance with IAS 39 either in profit or loss or as a change in other
comprehensive income. When contingent consideration is recognised in equity, it should not be re-measured
until it is finally settled within equity.
Goodwill is initially measured at cost being the excess of the aggregate of the consideration transferred and the
amount recognised for non-controlling interest over the net identifiable assets acquired and liabilities assumed.
If this consideration is lower than the fair value of the net assets of the subsidiary acquired, the difference is
recognised in profit or loss.
After initial recognition, goodwill is measured at cost less any accumulated impairment losses. For the purpose
of impairment testing, goodwill acquired in a business combination is, from the acquisition date, allocated to
each of the Group’s cash-generating unit that are expected to benefit from the combination, irrespective of
whether other assets or liabilities of the acquiree are assigned to those units.
Where goodwill forms part of a cash-generating unit and part of the operation within that unit is disposed of,
the goodwill associated with the operation disposed of is included in the carrying amount of the operation when
determining the gain or loss on disposal of the operation. Goodwill disposed of in this circumstance is measured
based on the relative values of the operation disposed of and the portion of the cash-generating unit retained.
Investments in associates and joint ventures
Investments in associated companies and joint-ventures are recognised using the equity method. An associated
company is a company where the parent company has a considerable influence but the company is neither a
subsidiary nor a joint-venture. A joint-venture is an investment in jointly controlled enterprises in line with the
founding contract. Financial statements of associated companies and joint-ventures provide the basis for the use
of the equity method. The reporting date of associated companies and joint-ventures is the same as for the
Group. Associated companies and joint-ventures use the same accounting policies as the Group.
Investments in associated companies and joint-ventures are recognised in the statement of financial position at
acquisition cost plus changes (after the purchase) in the capital of an associate company or a joint-venture, less
potential impairment losses. A share of the result of an associated company or a joint-venture is reported in the
income statement. If changes are recognised in the statement of comprehensive income or the capital of the
associated company or a joint-venture, the Group recognises the share of these changes and discloses significant
differences in the statement of comprehensive income or statement of changes in equity.

34 ANNUAL REPORT 2014
Foreign currency translation
The financial statements of the Company and the Group are presented in euro (EUR), which is the functional and
reporting currency of the parent company and its subsidiaries in Slovenia. Transactions in a foreign currency are
translated at the exchange rate of the European Central Bank prevailing on the date of the transaction.
Monetary assets and liabilities denominated in a foreign currency are translated at the exchange rate of the
functional currency on the reporting date. All differences arising from the translation of foreign currency are
recognised in the profit or loss. Non-monetary assets and liabilities, recognised in terms of historical cost in a
foreign currency, are translated using the exchange rate on the day of the transaction. Non-monetary assets and
liabilities measured at fair value in a foreign currency are translated at the exchange rate prevailing on the day
when the fair value was determined.
The functional currencies of the foreign subsidiaries are as follows:
Macedonian denar for KB Prvo penzisko drustvo Skopje
euro for Fondi Slloveno-Kosovar I Pensioneve Sh.A Pristhine Kosovo,
Serbian dinar for DDOR GARANT Beograd
On the reporting day, the financial statements of the aforementioned subsidiaries were translated into the
reporting currency of the consolidated financial statements. The exchange rate of the European Central Bank on
the reporting day was used for the statement of financial position, while the average exchange rate for the
financial year was used for the income statement.
Exchange rate differences arising from the translation of the functional currencies into the reporting currency
are recognised directly in the statement of other comprehensive income until the sale of a subsidiary when the
exchange rate differences are transferred to the profit or loss.
Land, buildings and equipment
Equipment is recognised at cost, which includes direct costs of acquisition, less accumulated depreciation and
impairment losses. The Company and the Group use the straight-line depreciation method over the estimated
useful life of the assets. The depreciation rates did not change in 2014 and are identical to those used in 2013.
Asset Depreciation rate in %
Land and Buildings 2.5%
Equipment 10 – 33.33 Impairment test of carrying amounts of equipment is performed when events and changes in the circumstances
show that the carrying amount exceeds the recoverable amount. If events occur which show that the book value
of an asset exceeds its estimated recoverable value, the asset is impaired to its recoverable value. The
recoverable value of an asset is the net sales value or value in use, namely the higher of the two. The value in
use is determined by discounting expected future cash flows to the net current value using pre-tax discount
rates, which reflect the current market estimate of the time value of money and potential risks associated with
each individual asset. For assets whose future cash flows are also dependent on the remaining assets in individual
cash-generating units, the value in use is calculated on the basis of future cash flows of this cash-generating
unit. Impairment losses are recognised as an item of operating expenses from revaluation.
Derecognition of equipment is carried out when the asset is sold or when economic benefits are no longer
expected from the continued use of the individual asset. Gains and losses on derecognition of an asset are
reported in the profit or loss in the year the individual asset is deleted from the books.
Residual value of assets, assessed on the basis of their useful life or the amortisation method are reviewed or
changed if necessary on an annual basis prior to the preparation of the annual financial statements.
Subsequent expenditure that increases future economic benefits of the asset, increases the value of an item of
property, plant and equipment.
Borrowing costs
Borrowing costs comprise interest and other costs incurred by the Company and the Group in relation to the
borrowing of financial assets. Borrowing costs may also include interest on overdrawn accounts at banks and
interest on borrowings raised, foreign exchange differences from borrowings raised in foreign currency, and
financial lease costs. Borrowing costs are recognised in the period to which they pertain as expenses associated
with financial assets and liabilities.

ANNUAL REPORT 2014 35
Intangible assets
Intangible assets acquired individually are recognised at cost while intangible assets acquired on the basis of a
business combination are recognised at fair value on the day of the takeover. After initial recognition the
historical cost method is used. The value in use of an individual intangible asset is limited. Amortisation of an
item of intangible assets is recognised through profit or loss.
Intangible assets are amortised according to the straight-line amortisation method over their estimated useful
lives using annual amortisation rates ranging from 10.0% to 33.3%.
Intangible assets created within the Group are not capitalised. The costs represent expenses in the period in
which they arise.
Intangible assets are tested on an annual basis for impairment individually or as a portion of the cash-generating
unit. The useful life of an individual intangible asset is assessed once a year and adjusted as required.
Subsequent expenditure that increases future economic benefits of the asset, increases the value of an item of
intangible assets.
Investments
The Company and the Group classify investments into the following categories:
Investments at fair value through profit or loss
Available-for-sale investments,
Investments held to maturity,
Issued loans and receivables.
The classifications are dependent on the purpose of acquisition.
Recognition of financial assets
The Company and the Group initially recognise all investments, except for investments classified at fair value
through profit or loss, at fair value, which includes the purchase costs that are directly attributable to the
acquisition. Investments classified at fair value through profit or loss are recognised at fair value (direct costs of
acquisition are not included in the acquisition value).
Financial assets at fair value through profit or loss
Financial assets at fair value through profit or loss are measured at fair value. Realised gains and losses on
investments classified at fair value through profit or loss are recognised directly in the profit or loss.
The fair value of investments which are actively traded on organised markets is their closing quoted price on the
reporting date. If the financial instruments are not listed on the stock exchange, the fair value is determined on
the basis of a similar instrument or, the fair value may be determined as the net current value of future cash
flows which the Company or the Group expect from the financial investment.
Acquisition and sale of individual financial investments classified at fair value through profit or loss are recognised
on the trading day, which is the day the Company or the Group commit to purchase or sell an individual asset.
Available-for-sale investments
After the initial recognition, all investments which the Company or the Group classify as available-for-sale are
stated at fair value. Gains or losses from available-for-sale investments are recognised in the statement of
comprehensive income as net unrealised gains or losses on available-for-sale investments until the investment is
sold or otherwise divested. If the investment is impaired, the impairment is recognised in the profit or loss.
The acquisition and sale of individual financial assets classified as available-for-sale are recognised on the trading
day; this is the day the Company or the Group commit to purchase or sell an individual asset.
On the reporting date the Company assesses whether there is objective evidence that an impairment loss on
available-for-sale financial assets has been incurred. Financial assets available for sale are assessed for any
important and long term decrease in fair value which means that the assets are overestimated. In assessing the
prolonged decrease of fair value of equity securities below their cost, the Company checks whether the period
from the first decrease of fair value of an equity instrument below its cost exceeds 9 months and if the decrease
was below cost for the whole duration of the nine month period. An important decrease of fair value is considered
at least 40-percent decrease in fair value of an asset compared to its cost.
If any such signs of impairment of available-for-sale investments are present, the cumulative loss, measured as
the difference between the estimated costs and the present fair value, less impairment losses previously
recognised in profit or loss, is recognised and the expenses are recognised in the profit or loss.

36 ANNUAL REPORT 2014
Investments held to maturity
The Company or the Group recognise financial assets with fixed or determinable payments and fixed maturities
which are not derivative instruments, as financial investments held to maturity, if the Company has a positive
intention and ability to hold the investment until maturity. Investments which the Company maintains for an
indefinite period of time are not classified into this group.
Investments which are recognised as held-to-maturity are carried at amortised cost using the effective interest
rate method. The amortised cost is computed through the allocation of the premium or discount upon acquisition
throughout the holding period until maturity. Gains and losses on investments designated at amortised cost are
recognised in the profit or loss (disposal, impairment or effects of amortised discounts/premiums).
Investments classified as held-to-maturity financial assets are recognised on the transaction date.
Loans and receivables
Loans and receivables are financial assets with fixed and determinable payments which are not traded on the
organised market. This group includes both loans and receivables obtained by the Company, as well as loans and
receivables originating from the Company. Loans and receivables are carried at amortised cost using the effective
interest rate method. Investments classified into loans and receivables are recognised on the transaction date.
Fair value measurement
Fair value is the price that would be received to sell an asset or paid to transfer a liability in an orderly transaction
between market participants at the measurement date. The measurement of fair value of an asset or a liability
considers the asset's or liability's characteristics assuming exchange of an asset or a liability in an ordinary
transaction in current market conditions, on the principal market or the most advantageous market for the asset
or liability.
In the fair value measurement on non-financial assets, the ability of market participants to generate economic
benefits from the highest and best use of the asset or from the asset's sale to another market participant who
would use the asset to its highest and best use.
Fair value of financial instruments traded on organised financial markets is their quoted price on the reporting
date. If the price is not quoted on an active market, the stockbrokers' bid price is used as the reference price. If
no active market exists for a financial instrument, the Company and the Group determine its fair value based on
one of the valuation techniques. Valuation techniques use the most recent transactions between willing and well
informed parties if available, comparison of the current fair value of an instrument with similar characteristics,
consideration of discounted cash flows, and techniques used for pricing of options. When a valuation technique
is most frequently used by market participants to determine prices of financial instruments and the technique
has been proven reliable in assessment of prices achieved in actual market transaction, the Company and the
Group apply this particular technique.
The discounted cash flow method uses management's assessment of future cash flows and discount rate that
reflects interest rates of comparable financial instruments.
When fair value cannot be determined, financial instruments are measured at cost (the amount paid or received)
increased by the cost of transaction.
The following fair value hierarchy is used to disclose fair value measurement of financial assets:
Level 1: quoted inputs in active markets for identical assets (quoted prices).
Level 2 comparable market inputs (other than quoted inputs of identical assets) obtained directly or indirectly
for identical or similar assets and includes also generic prices obtained from Bloomberg.
Level 3: the use of valuation models using mostly unobservable market inputs.
Derecognition of financial instruments
A financial asset is written-off when the risks and benefits and the control over contractual rights related to financial instruments are transferred. A financial liability is derecognised once it has been paid, extinguished or has become statute-barred.

ANNUAL REPORT 2014 37
Investment property - pension funds
Investment property (land and buildings) are carried separately from all other items of property, plant and
equipment. The following qualifying criteria applies for classification of real estate in the group of investment
property:
1. Investment property generates economic benefits Investment property is held for the purpose of lease
to bring rental income or increase its cost
2. The asset is not designated for sales in the immediate future during ordinary course of business.
3. The asset's cost can be estimated reliably.
On its acquisition, an item of investment property is measured at cost comprising transaction costs; after initial
recognition, they are measured at fair value. Fair value of investment property is measured at market prices on
the reporting date, determined by application of established valuation techniques used in measurement of real
estate's market values (comparable market prices, most recent transaction prices). Revaluation of investment
property is made at least at the end of the financial year or, in the event of major market changes, it can also
be made during the financial year as and when necessary.
Operating and other receivables
Operating receivables are recognised in the amounts arising from invoices issued less any bad debt allowances.
The assessed bad debt allowances are based on the reasonable expectation of the Company that payment is no
longer probable either in full or in a certain amount.
Cash and cash equivalents
Cash and cash equivalents comprise cash in banks and cash in hand as well as deposits with maturity of up to
three months.
Equity
The equity of the Company consists of ordinary and preference shares.
Direct additional costs of issuing new shares less tax effects are recognised in equity. In the event that any of
the Group companies purchase shares of the parent, the payment including the direct transaction costs less tax
effects is recognised in equity as treasury shares until these shares are reissued, sold or withdrawn. In the event
of a subsequent sale or reissue of these shares, all effects of the sale or issue are included in the equity.
Ordinary shares
An ordinary share entitles its owner to a voting right and, based on the decision of the General Meeting, to
dividends.
Preference shares
Preference shares are cumulative shares without voting rights which entitle their owners to a fixed 6% dividend
per annum. The General Meeting adopts decisions on the payment of dividends at its sessions upon the proposal
of the Management Board. Preference shares are considered as a part of equity, since holders of ordinary shares
decide at the General Meeting whether dividends will be paid out to preference shareholders or not.
Borrowings
All borrowings are initially recognised at fair value less the cost of acquisition. At initial recognition, borrowings
are recognised at amortised cost using the effective interest rate method through profit or loss, taking into
consideration the costs of acquisition and any discount or premium upon acquisition.
Upon elimination of these liabilities, gains or losses are recognised in the profit or loss.
Employee benefits
Employee benefits include salaries and other allowances in accordance with the collective employment
agreement. Contributions to the pension fund at the national level, social security, health insurance and
unemployment insurance are recognised by the Company as expenses of the period. The Company also recognises
any potential future costs arising from the collective agreement in connection to employees in accordance with
IAS 19. The aforementioned expenses are calculated in accordance with the actuarial method and are recognised
over the entire employment period for individual employees for whom the collective agreement applies.

38 ANNUAL REPORT 2014
In the calculation, the following assumptions are used:
Full mortality table for Slovenia 2007,
Retirement age and pension qualifying years in accordance with ZPIZ-2
2.5% salary increase,
Amount of termination benefit on retirement pursuant to the law, which is equal to the value of two
average salaries of an employee or two average salaries in Slovenia, whichever is the highest,
Amount of jubilee awards and solidarity assistance pursuant to the Decree,
Discounted interest rate of 2.54%
Assumptions used in 2014 are the same as those used in 2013, except for discount rate, which is 2.45% in year
2014 (2013 it was 3.9%). The Company or the Group do not recognise actuarial gains or losses from changes in
each significant actuarial assumptions used in calculation of provisions for termination benefits on retirement in
the equity, as prescribed by the amended IAS 19, since the impact on the financial position of the Company or
the Group would be insignificant. For the same reason the Company or the Group do not provide additional
disclosures pursuant to requirements of the amended IAS 19.
Operating and finance lease
A lease is a contractual relationship in which the lessor transfers to the lessee the right to use of an asset for a
set period of time in exchange for payment.
When the Company or the Group appears as a lessor, the lease is classified as a finance lease if substantially all
of the risks and benefits associated with the ownership of an asset are transferred. When an asset is subject to
a finance lease, the present value of the lease is recognised as a receivable and reported under the item “Loans”.
The difference between the gross amount and the receivable's present value is recognised as a financial income.
Lease income is recognised over the duration of the lease using the net investment method (before tax) that
reflects fixed periodical rate of earnings and is reported as the interest income.
When the Company or the Group appears as a lessee, the item of property, plant and equipment obtained under
finance lease is reported at the lower of fair value or present amount of minimum lease payments until the end
of the lease, less accumulated depreciation and accumulated impairment losses. These assets are depreciated
over their useful life. If there is no reasonable certainty that the lessee will obtain ownership by the end of the
lease term, the property, plant and equipment acquired under finance leases are depreciated over the shorter
of the useful life of the asset or the lease term.
Ally leases other than finance leases are considered operating leases. In operating lease, the book value of the
leased asset is increased by initial costs of the operating lease and recognised on a straight-line basis over the
lease term much like the lease income. Rental income is recognised when received.
Insurance contracts classification
Classification of insurance contracts of subsidiary Prva osebna zavarovalnica is consistent with:
International Financial Reporting Standard 4 (IFRS 4)
International Actuarial Standard of Practice IASP 3
An insurance contract is a contract under which one party (the insurer) accepts significant risk from another
party (the policyholder) by agreeing to compensate the policyholder if a specified uncertain future event (the
insured event) adversely affects the policyholder.
IFRS 4 states that uncertain event is when at the time of agreeing the contract it is not clear:
Whether the insured event will happen,
When will it happen and
What the policy benefit will be.
The insurance risk is deemed significant if an insured event could cause the policyholder to pay significant extra
amounts by whatever scenario other than those that do not include market component (they do not affect the
economy of business). If under a scenario that includes a market component, significant extra amounts must be
paid, condition specified in the previous sentence may be fulfilled even when there is an extremely low
probability that the insured event will occur or when the expected (i.e. probability-weighted) present value of
conditional cash flows accounts for a minor share of expected present value of all remaining cash flows.
The insurer assesses the importance of insurance risk in each individual case rather than based on the importance
of financial statements. Therefore, the insurance risk is important also when there is a minimal probability of
material claim for the whole group of contracts. Such assessment of individual contracts facilitates their
classification as insurance contracts. However, when a relatively homogeneous group of contracts is comprised

ANNUAL REPORT 2014 39
of contracts that transfer insurance risks, the insurer does not need to verify each individual contract in the
group to identify a few contracts that transfer an insignificant insurance risk.
Prva osebna zavarovalnica d.d. and the Group classify insurance contracts into homogeneous groups for which
the insurance company estimates the significance of insurance risk. Contracts in individual groups have common
characteristics such as the class of insurance, insurance conditions, type of cover and premium payment method
(one time premium or regular payments of a premium).
Insurance contracts that bear significant risk are accounted for in line with IFRS 4. If the insurance contracts do
not have significant insurance risk, they are accounted for as financial contracts in line with IAS 39.
Detailed accounting treatments of individual categories stated above are explained below.
Liabilities for insurance contracts – technical provisions
Long term technical provisions for insurance contracts are set aside according to the Insurance Act and its
implementing regulations, as well as in compliance with IFRS 4.
For all insurance transactions, Prva osebna zavarovalnica d.d. and the Group have to make adequate technical
provisions which are designed to cover future liabilities from insurances and risk losses arising from insurance
transactions. The insurance company is required to set aside the following technical provisions:
Provisions for unearned premiums
Provision for bonuses, rebates and reversals
Claim reserves
Other technical provisions
Mathematical provisions
Provisions for unit–linked insurances
Technical provisions are calculated based on the balance as at the last day of the period.
At least once a year Prva osebna zavarovalnica and the Group assess the adequacy of the technical provisions. In
case they are not adequate, additional provisions are formed and charged to the profit for the period.
Revenue and expenses from investments are recognised in the income statement. Written premium and written
gross claims are also included in the income statement of the insurance company. The same applies to entry,
exit and management fees.
Accounting treatment of technical provisions is classified by type of provision as specified in the chart of accounts
of insurance companies.
Assets and liabilities from financial contracts
These represent pension funds’ assets, which guarantee the fulfilment of liabilities to the insurants. The
subsidiary Prva osebna zavarovalnica manages four pension funds in accordance with the pension and Disability
Insurance Act (ZPIZ-1).
The assets comprise investments and cash. Investments in funds are categorised into:
Investments at fair value through profit or loss
Held-to-maturity investments
Loans and receivables and
Investment property.
Revenues and expenditures in respect of investments are recognised directly to insurants. Payment of premiums,
realised and unrealised capital gains or losses are also included under this item rather than in the income
statement of the Company. Entry, exit and management fees are included in Group income statement as
revenues.
Liabilities in respect of voluntary supplementary pension insurance are mathematical provisions, which are
divided into mathematical provisions for net premium paid, and provisions for guaranteed return and excess over
the guaranteed return. All pension plans have a guaranteed yield in range of 40-50% of guaranteed yield
calculated in line with pension regulation (ZPIZ-1).
Net liabilities to pension policyholders represent mathematical provisions which are managed separately for each
individual pension fund. Mathematical provisions must comply with the Decision on Detailed Rules and Minimum
Standards to be Applied in the Calculation of Technical Provisions and at any time equal at least the amount of
the redemption value of the insurance. Thus, provisions are formed for each individual long-term business fund,
which comprises the guaranteed funds on the personal account of policyholders and provisions for excess returns
over the guaranteed return.

40 ANNUAL REPORT 2014
The guaranteed value of the fund consists of the net premium paid and the prescribed guaranteed return. Under
the Slovenian legislation, the Company is liable for guaranteed liabilities and guaranteed yields.
Mathematical provisions from voluntary supplementary pension insurance are not reinsured.
Reinsurance
With reinsurance the insurance company transfers part of the risk to the Reinsurance Company and pays
reinsurance fee.
Prva osebna zavarovalnica plc. draws up reinsurance calculation at the end of each quarter of the year.
Reinsurance premium is recognised as a liability towards Reinsurance Company. At each end of the quarter, claim
calculation is drawn up A and reinsurance claims are recognized as a receivable from Reinsurance Company.
Changes in unearned premium reinsured and changes in outstanding claim reserve reinsured are determined by
Prva osebna zavarovalnica at the end of every month when calculating unearned premium and claim reserve.
The reinsurance part of technical provisions in the statement of financial position is stated as an item of the
insurance company’s assets.
Revenue
Revenues are recognised if it is likely that the Company will acquire economic benefits from them and if such
benefits can be reliably measured. Revenues originate from services offered by the Company to its subsidiary
companies, namely services relating to investment, internal auditing, and lease of hardware and software.
The majority of revenues of the Group originate from:
Revenues from insurance premiums
Net revenues from insurance premiums are calculated as gross insurance premiums less the reinsurers'
share adjusted for the change in gross unearned premium, which is further adjusted by the reinsurance
undertaking's share in the unearned premium. The written gross insurance premium in insurance
contracts is the insurance premium written in a period.
Gross insurance premiums are recognised in accounting records on the day of settlement of account
rather than on the day of payment.
Fee and commission income
o Entry fees
The Group, in performing its activity in accordance with the pension schemes, and general terms and
conditions, charges an entry fee, meaning that the collected assets transferred into an individual long-
term business fund are decreased by the amount of the entry fees and the fund is managed with assets
which represent net premiums. The entire amount of revenue from entry fees is recognised when
statements of account are made.
o Management fees
The Group manages eleven pension funds, for which it charges a management fee, meaning that the
monthly value of assets in individual pension fund is decreased by the amount of the management fee.
o Exit fees
The Group is entitled to an exit fee in accordance with the pension schemes and general terms and
conditions, meaning that the redemption value is decreased by the exit fee and this net value is then
paid to the individual terminating the insurance.
Interest
Interest income is calculated and recognised on the basis of the effective interest rate.
Dividends
Dividends are recognised when the Company or the Group obtain the right to issue dividend pay-outs.
Other financial income
Income from changes in fair value of financial assets arises on subsequent re-measurement of fair value of
financial assets designated at fair value through profit or loss. Gains on disposal arise on derecognition of financial
assets other than financial assets measured at fair value through profit or loss. Gains on disposal is the difference
between the asset'' carrying amount and its selling price.

ANNUAL REPORT 2014 41
Costs and expenses
Net claims costs
Net expenses for claims are gross claims (compensation and appraisal expenses), deducted for reinsured part and
amended for the change in gross claim reserves, which are adjusted for the share of reinsurance in these reserves.
Appraisal expenses include external and internal expenses for assessing the eligibility of claims for loss events.
Net operating expenses and acquisition costs
Net operating expenses comprise of direct and indirect acquisition costs as well as other operating expenses such
as depreciation, payroll, costs of natural persons not engaged in activity and other operating expenses which are
not included under other items of costs.
IFRS, BC 116, neither prohibits nor requires the deferral of acquisition costs. The standard does not state which
costs can be deferred, the period of the deferral or the method of depreciation. Majority of direct and indirect
acquisition costs are the costs of the period, whereas the direct costs of the insurances which are marketed via
external network, are deferred over a prolonged period of time. Deferred costs are recognised as an asset in the
statement of financial position, whereas the change between the opening and closing balance of the period is
stated as a separate item of acquisition costs in the income statement. The depreciation rate is set by actuary
based on the dynamics of the utilisation of future corresponding premiums collected.
Financial expenses
Financial expenses comprise expenses arising as a result of fair value changes, loss on disposal of financial assets,
impairment losses and other financial expense.
Expenses resulting from fair value changes of financial assets arise on subsequent re-measurement of fair value
of financial assets designated at fair value through profit or loss.
Gains on disposal arise on derecognition of financial assets other than financial assets designated at fair value
through profit or loss. Loss on disposal is the difference between the asset's carrying amount and its selling price.
Taxes
Current tax
Current tax assets or liabilities for current and past periods are measured at amounts the Company or the Group
expect to pay or at amounts of tax credits. Current tax assets or liabilities are measured using tax rates valid on
the reporting date.
Deferred tax
Deferred income tax assets and liabilities are accounted for using the balance sheet liability method. Only
deferred tax assets and liabilities originating from temporary differences are recognised.
Deferred tax assets are also recognised for unused tax losses and unused tax credits which are carried over into
the following period if it is probable that the relevant amount of taxable profits will be available in future periods
against which unused tax losses may be utilised.
Deferred tax assets are reviewed on the reporting date and are impaired for that portion of the assets for which
it is no longer probable that a sufficient taxable profit will be available against which the unused tax losses could
be utilised.
Deferred tax assets and liabilities are measured using tax rates expected to be effective when the asset is realised
or the liability is settled. The tax rates (and tax regulations) valid on or substantially valid on the reporting date
are used.
Deferred tax is recognised directly in the statement of comprehensive income if it refers to items recognised
directly in the statement of comprehensive income.
Deferred tax assets and liabilities are offset when the Company:
has a legal right to offset assessed tax assets and assessed tax liabilities, and
deferred tax assets and deferred tax liabilities relate to the same tax authority in relation to
o the same taxable unit, or to
o different taxable units who intend to either settle the assessed tax liabilities and assessed tax
assets with the difference, or simultaneously recover tax assets and settle tax liabilities in each of
the future financial periods in which significant amounts of deferred tax assets or liabilities are
expected to be either recovered or settled.
42 ANNUAL REPORT 2014
Impairments
An impairment loss in respect of an available-for-sale financial asset is calculated by reference to its current fair
value. When objective evidence exist that an available-for-sale financial asset is impaired, the accrued
impairment loss transitionally recognised in other comprehensive income, is reclassified to profit or loss.
Objective evidence of equity securities' impairment includes statutory changes of the issuer (bankruptcy,
liquidation), significant reduction in fair value of securities (a reduction in of 40 percent or more), or a prolonged
reduction in the securities’ fair value that continues over a period of more than 9 months. Objective evidence
of debt securities' impairment includes statutory changes of the issuer (bankruptcy, liquidation), delay in
repayments, or other significant negative events that impact the issuer's creditworthiness.
Reversals of impairment on equity securities classified as available for sale financial assets, is recognised in other
comprehensive income.
Impairment loss incurred on a financial asset recognised at amortised cost is the difference between its carrying
amount and present value of future cash flows, determined using the effective interest rate method.
For financial assets measured at amortised cost and available-for-sale financial assets that are debt instruments,
the impairment reversal is recognised in profit or loss. An impairment loss is reversed if the reversal can be
related objectively to an event occurring after the impairment loss was recognised.
Investment property is checked annually for any indication of impairment. When an item of investment property
has been impaired, its recoverable amount is assessed. The asset's recoverable amount is the higher of its net
selling amount less cost of sales and its value in use. When the net carrying amount of investment property
exceeds its recoverable amount, the difference is recognised as an impairment loss.
Amendments to standards and interpretations
The accounting policies adopted are consistent with those of the previous financial year except for the following
amended IFRSs which have been adopted by the Group/Company as of 1 January 2014:
IAS 28 Investments in Associates and Joint Ventures (Revised)
IAS 32 Financial Instruments: Presentation (Amended) - Offsetting Financial Assets and Financial Liabilities
IFRS 10 Consolidated Financial Statements, IAS 27 Separate Financial Statements
IFRS 11 Joint Arrangements
IFRS 12 Disclosures of Interests in Other Entities
IAS 39 Financial Instruments (Amended): Recognition and Measurement - Novation of Derivatives and Continuation of Hedge Accounting
IAS 36 Impairment of Assets (Amended) – Recoverable Amount Disclosures for Non-Financial Assets
IFRIC Interpretation 21: Levies
Effects of the adoption of the standard or interpretation on the Group/Company’s financial statements or its
performance is described below.
IAS 28 Investments in Associates and Joint Ventures (Revised)
As a consequence of the new IFRS 11 Joint arrangements and IFRS 12 Disclosure of Interests in Other Entities, IAS 28 Investments in Associates, has been renamed IAS 28 Investments in Associates and Joint Ventures, and describes the application of the equity method to investments in joint ventures in addition to associates. Revision does not effect the financial position or performance of the Group.
IAS 32 Financial Instruments: Presentation (Amended) - Offsetting Financial Assets and Financial Liabilities
These amendments clarify the meaning of “currently has a legally enforceable right to set-off”. The amendments also clarify the application of the IAS 32 offsetting criteria to settlement systems (such as central clearing house systems) which apply gross settlement mechanisms that are not simultaneous. Amendment does not effect the financial position or performance of the Group.

ANNUAL REPORT 2014 43
IFRS 10 Consolidated Financial Statements, IAS 27 Separate Financial Statements
IFRS 10 replaces the portion of IAS 27 Consolidated and Separate Financial Statements that addresses the accounting for consolidated financial statements. It also addresses the issues raised in SIC-12 Consolidation — Special Purpose Entities. IFRS 10 establishes a single control model that applies to all entities including special purpose entities. The changes introduced by IFRS 10 will require management to exercise significant judgment to determine which entities are controlled and therefore are required to be consolidated by a parent, compared with the requirements that were in IAS 27. New standard does not effect the financial position or performance of the Group.
IFRS 11 Joint Arrangements
IFRS 11 replaces IAS 31 Interests in Joint Ventures and SIC-13 Jointly-controlled Entities — Non-monetary Contributions by Venturers. IFRS 11 removes the option to account for jointly controlled entities (JCEs) using proportionate consolidation. Instead, JCEs that meet the definition of a joint venture must be accounted for using the equity method. New standard does not effect the financial position or performance of the Group.
IFRS 12 Disclosures of Interests in Other Entities
IFRS 12 includes all of the disclosures that were previously in IAS 27 related to consolidated financial statements, as well as all of the disclosures that were previously included in IAS 31 and IAS 28. These disclosures relate to an entity’s interests in subsidiaries, joint arrangements, associates and structured entities. A number of new disclosures are also required. All required disclosures are included in financial statements of the Group.
IAS 39 Financial Instruments (Amended): Recognition and Measurement - Novation of Derivatives and Continuation of Hedge Accounting
Under the amendment there would be no need to discontinue hedge accounting if a hedging derivative was novated, provided certain criteria are met. The IASB made a narrow-scope amendment to IAS 39 to permit the continuation of hedge accounting in certain circumstances in which the counterparty to a hedging instrument changes in order to achieve clearing for that instrument. Amendment does not effect the financial position or performance of the Group.
IAS 36 Impairment of Assets (Amended) – Recoverable Amount Disclosures for Non-Financial Assets
These amendments remove the unintended consequences of IFRS 13 on the disclosures required under IAS 36. In addition, these amendments require disclosure of the recoverable amounts for the assets or CGUs for which impairment loss has been recognised or reversed during the period. Amendment does not effect the financial position, performance or disclosures of the Group.
IFRIC Interpretation 21: Levies
The Interpretations Committee was asked to consider how an entity should account for liabilities to pay levies imposed by governments, other than income taxes, in its financial statements. This Interpretation is an interpretation of IAS 37 Provisions, Contingent Liabilities and Contingent Assets. IAS 37 sets out criteria for the recognition of a liability, one of which is the requirement for the entity to have a present obligation as a result of a past event (known as an obligating event). The Interpretation clarifies that the obligating event that gives rise to a liability to pay a levy is the activity described in the relevant legislation that triggers the payment of the levy. Interpretation does not effect the financial position or performance of the Group.
Standards issued but not yet effective and not early adopted
In line with requirements of IFRS and EU, Group will have to take into account in future periods new or amended standards and interpretations. Group is examining the effects of these standards that will become aplicable on or after 1 January 2015, when they are approved by IASB and endorsed by EU.
IAS 16 Property, Plant & Equipment and IAS 38 Intangible assets (Amendment): Clarification of Acceptable Methods of Depreciation and Amortization
The amendment is effective for annual periods beginning on or after 1 January 2016. This amendment clarifies the principle in IAS 16 Property, Plant and Equipment and IAS 38 Intangible Assets that revenue reflects a pattern of economic benefits that are generated from operating a business (of which the asset is part) rather than the economic benefits that are consumed through use of the asset. As a result, the ratio of revenue generated to total revenue expected to be generated cannot be used to depreciate property, plant and equipment and may only be used in very limited circumstances to amortise intangible assets. The amendment has not yet been endorsed by the EU. Group does not expect that amendment will have effect on its financial statements.

44 ANNUAL REPORT 2014
IAS 16 Property, Plant & Equipment and IAS 41 Agriculture (Amendment): Bearer Plants
The amendment is effective for annual periods beginning on or after 1 January 2016. The amendment has not yet been endorsed by the EU. Group does not expect that amendment will have effect on its financial statements.
IAS 19 Employee benefits (Amended): Employee Contributions
The amendment is effective for annual periods beginning on or after 1 February 2015. The amendment applies to contributions from employees or third parties to defined benefit plans. The objective of the amendment is to simplify the accounting for contributions that are independent of the number of years of employee service, for example, employee contributions that are calculated according to a fixed percentage of salary. Group does not expect that amendment will have effect on its financial statements.
IFRS 9 Financial Instruments – Classification and measurement
The standard is applied for annual periods beginning on or after 1 January 2018 with early adoption permitted. The final phase of IFRS 9 reflects all phases of the financial instruments project and replaces IAS 39 Financial Instruments: Recognition and Measurement and all previous versions of IFRS 9. The standard introduces new requirements for classification and measurement, impairment, and hedge accounting. The standard has not yet been endorsed by the EU. The Group is assessing the effect of new standards on financial performance and financial statements.
IFRS 11 Joint arrangements (Amendment): Accounting for Acquisitions of Interests in Joint Operations
The amendment is effective for annual periods beginning on or after 1 January 2016. IFRS 11 addresses the accounting for interests in joint ventures and joint operations. The amendment adds new guidance on how to account for the acquisition of an interest in a joint operation that constitutes a business in accordance with IFRS and specifies the appropriate accounting treatment for such acquisitions. The amendment has not yet been endorsed by the EU. Group does not expect that amendment will have effect on its financial statements.
IFRS 14 Regulatory Deferral Accounts
The standard is effective for annual periods beginning on or after 1 January 2016. This standard has not yet been endorsed by the EU. Group does not expect that amendment will have effect on its financial statements.
IFRS 15 Revenue from Contracts with Customers
The standard is effective for annual periods beginning on or after 1 January 2017. IFRS 15 establishes a five-step model that will apply to revenue earned from a contract with a customer (with limited exceptions), regardless of the type of revenue transaction or the industry. The standard’s requirements will also apply to the recognition and measurement of gains and losses on the sale of some non-financial assets that are not an output of the entity’s ordinary activities (e.g., sales of property, plant and equipment or intangibles). Extensive disclosures will be required, including disaggregation of total revenue; information about performance obligations; changes in contract asset and liability account balances between periods and key judgments and estimates. The standard has not been yet endorsed by the EU. The Group is assessing the effect of new standards on financial performance and financial statements.
IAS 27 Separate Financial Statements (amended)
The amendment is effective from 1 January 2016. This amendment will allow entities to use the equity method to account for investments in subsidiaries, joint ventures and associates in their separate financial statements and will help some jurisdictions move to IFRS for separate financial statements, reducing compliance costs without reducing the information available to investors. This amendment has not yet been endorsed by the EU. Group does not expect that amendment will have effect on its financial statements
Amendment in IFRS 10 Consolidated Financial Statements and IAS 28 Investments in Associates and Joint Ventures: Sale or Contribution of Assets between an Investor and its Associate or Joint Venture
The amendments address an acknowledged inconsistency between the requirements in IFRS 10 and those in IAS 28, in dealing with the sale or contribution of assets between an investor and its associate or joint venture. The main consequence of the amendments is that a full gain or loss is recognized when a transaction involves a business (whether it is housed in a subsidiary or not). A partial gain or loss is recognized when a transaction involves assets that do not constitute a business, even if these assets are housed in a subsidiary. The amendments will be effective from annual periods commencing on or after 1 January 2016. The amendments have not yet been endorsed by the EU. Group does not expect that amendment will have effect on its financial statements

ANNUAL REPORT 2014 45
Annual improvements - 2010 – 2012 Cycle
The IASB has issued the Annual Improvements to IFRSs 2010 – 2012 Cycle, which is a collection of amendments to
IFRSs. The amendments are effective for annual periods beginning on or after 1 February 2015. Group does not
expect that amendment will have effect on its financial statements.
IFRS 2 Share-based Payment: This improvement amends the definitions of 'vesting condition' and
'market condition' and adds definitions for 'performance condition' and 'service condition' (which were
previously part of the definition of 'vesting condition').
IFRS 3 Business combinations: This improvement clarifies that contingent consideration in a business
acquisition that is not classified as equity is subsequently measured at fair value through profit or loss
whether or not it falls within the scope of IFRS 9 Financial Instruments.
IFRS 8 Operating Segments: This improvement requires an entity to disclose the judgments made by
management in applying the aggregation criteria to operating segments and clarifies that an entity shall
only provide reconciliations of the total of the reportable segments' assets to the entity's assets if the
segment assets are reported regularly.
IFRS 13 Fair Value Measurement: This improvement in the Basis of Conclusion of IFRS 13 clarifies that
issuing IFRS 13 and amending IFRS 9 and IAS 39 did not remove the ability to measure short-term
receivables and payables with no stated interest rate at their invoice amounts without discounting if
the effect of not discounting is immaterial.
IAS 16 Property Plant & Equipment: The amendment clarifies that when an item of property, plant
and equipment is revalued, the gross carrying amount is adjusted in a manner that is consistent with
the revaluation of the carrying amount.
IAS 24 Related Party Disclosures: The amendment clarifies that an entity providing key management
personnel services to the reporting entity or to the parent of the reporting entity is a related party of
the reporting entity.
IAS 38 Intangible Assets: The amendment clarifies that when an intangible asset is revalued the gross
carrying amount is adjusted in a manner that is consistent with the revaluation of the carrying amount.
Annual improvements - 2011 – 2013 Cycle
The IASB has issued the Annual Improvements to IFRSs 2011 – 2013 Cycle, which is a collection of amendments to
IFRSs. The amendments are effective for annual periods beginning on or after 1 January 2015. Group does not
expect that amendment will have effect on its financial statements.
IFRS 3 Business Combinations: This improvement clarifies that IFRS 3 excludes from its scope the
accounting for the formation of a joint arrangement in the financial statements of the joint arrangement
itself.
IFRS 13 Fair Value Measurement: This improvement clarifies that the scope of the portfolio exception
defined in paragraph 52 of IFRS 13 includes all contracts accounted for within the scope of IAS 39
Financial Instruments: Recognition and Measurement or IFRS 9 Financial Instruments, regardless of
whether they meet the definition of financial assets or financial liabilities as defined in IAS 32 Financial
Instruments: Presentation.
IAS 40 Investment Properties: This improvement clarifies that determining whether a specific
transaction meets the definition of both a business combination as defined in IFRS 3 Business
Combinations and investment property as defined in IAS 40 Investment Property requires the separate
application of both standards independently of each other.
Annual improvements - 2012 – 2014 Cycle
The IASB has issued the Annual Improvements to IFRSs 2012 – 2014 Cycle, which is a collection of amendments to
IFRSs. The amendments are effective for annual periods beginning on or after 1 January 2016. These annual
improvements have not yet been endorsed by the EU. Group does not expect that amendment will have effect
on its financial statements.
IFRS 5 Non-current Assets Held for Sale and Discontinued Operations: The amendment clarifies that
changing from one of the disposal methods to the other (through sale or through distribution to the
owners) should not be considered to be a new plan of disposal, rather it is a continuation of the original
plan. There is therefore no interruption of the application of the requirements in IFRS 5. The amendment
also clarifies that changing the disposal method does not change the date of classification.

46 ANNUAL REPORT 2014
IFRS 7 Financial Instruments: Disclosures: The amendment clarifies that a servicing contract that
includes a fee can constitute continuing involvement in a financial asset. Also, the amendment clarifies
that the IFRS 7 disclosures relating to the offsetting of financial assets and financial liabilities are not
required in the condensed interim financial report.
IAS 19 Employee Benefits: The amendment clarifies that market depth of high quality corporate bonds
is assessed based on the currency in which the obligation is denominated, rather than the country where
the obligation is located. When there is no deep market for high quality corporate bonds in that
currency, government bond rates must be used.
IAS 34 Interim Financial Reporting: The amendment clarifies that the required interim disclosures must
either be in the interim financial statements or incorporated by cross-reference between the interim
financial statements and wherever they are included within the greater interim financial report (e.g.,
in the management commentary or risk report). The Board specified that the other information within
the interim financial report must be available to users on the same terms as the interim financial
statements and at the same time. If users do not have access to the other information in this manner,
then the interim financial report is incomplete.
IFRS 10, IFRS 12 and IAS 28: Investment Entities: Applying the Consolidation Exception (Amendments)
The amendments address three issues arising in practice in the application of the investment entities
consolidation exception. The amendments are effective for annual periods beginning on or after 1 January 2016.
The amendments clarify that the exemption from presenting consolidated financial statements applies to a
parent entity that is a subsidiary of an investment entity, when the investment entity measures all of its
subsidiaries at fair value. Also, the amendments clarify that only a subsidiary that is not an investment entity
itself and provides support services to the investment entity is consolidated. All other subsidiaries of an
investment entity are measured at fair value. Finally, the amendments to IAS 28 Investments in Associates and
Joint Ventures allow the investor, when applying the equity method, to retain the fair value measurement
applied by the investment entity associate or joint venture to its interests in subsidiaries. These amendments
have not yet been endorsed by the EU. Group does not expect that amendments will have effect on its financial
statements
IAS 1: Disclosure Initiative (Amendment)
The amendments to IAS 1 Presentation of Financial Statements further encourage companies to apply professional
judgment in determining what information to disclose and how to structure it in their financial statements. The
amendments are effective for annual periods beginning on or after 1 January 2016. The narrow-focus
amendments to IAS clarify, rather than significantly change, existing IAS 1 requirements. The amendments relate
to materiality, order of the notes, subtotals and disaggregation, accounting policies and presentation of items
of other comprehensive income (OCI) arising from equity accounted Investments. These amendments have not
yet been endorsed by the EU. Group does not expect that amendment will have effect on its financial statements.
13.2. ADDITIONAL DISCLOSURES OF THE STATEMENT OF FINANCIAL POSITION AND THE INCOME
STATEMENT ITEMS
Disclosures which the Company is obliged to include in its annual report in compliance with the Companies Act
and International Financial Reporting Standards are presented under separate headings and under the items to
which they correspond.

ANNUAL REPORT 2014 47
13.3. SEGMENT REPORTING
1. GEOGRAPHIC SEGMENTS
The Group operates or has operated in two main geographic areas. The primary geographic segment of the Group
is Slovenia. In addition, the Group is present in other non-member countries of the south-eastern Europe.
The following table displays revenues, data on profits, assets and certain liabilities broken down by geographical
segments.
Table 7: Geographical segments
Year Ended on 31 December 2014 Slovenia Third countries Total
Revenues by segment in 2014 18,134,480 4,098,071 22,232,551
Other data by segment
Assets by segment 277,123,495 7,216,979 284,340,474
Financing:
Property, plant and equipment 80,152 72,033 152,184
Intangible assets 219,611 26,913 246,525
Total financing 299,763 98,946 398,709
* before consolidation entries
Year Ended on 31 December 2013 Slovenia Third countries Total
Revenues by segment in 2013 13,962,354 3,660,941 17,623,295
Other data by segment
Assets by segment 252,212,486 7,000,090 259,212,576
Financing:
Property, plant and equipment 80,401 72,257 152,658
Intangible assets 389,722 47,761 437,483
Total financing 470,123 120,018 590,141
Revenues earned in Slovenia by individual segment relate to income generated by Prva Osebna zavarovalnica
d.d., the Group, and Prva zavarovalno zastopniška družba. Amounts earned by segments in third countries relate
to subsidiaries in Kosovo, Macedonia and Serbia. The amounts presented are exclusive of consolidation entries.

48 ANNUAL REPORT 2014
2. OPERATING SEGMENTS
Primary operating segments of the Group include:
Non-life insurance,
Life assurance,
Other
Table 8: Operating segments
Year Ended on 31 December 2014
Non-life insurance Life insurance Other Total
Revenues by segment 2,023,216 18,704,178 1,505,157 22,232,551
Net profit 257,956 3,689,421 1,055,841 5,003,218
Total assets 3,768,497 276,536,125 4,035,852 284,340,474
* before consolidation entries
Year Ended on 31 December 2013
Non-life insurance Life insurance Other Total
Revenues by segment 546,815 14,452,687 2,623,793 17,623,295
Net profit 271,103 1,549,604 717,000 2,537,707
Total assets 3,358,368 250,702,640 5,151,568 259,212,576
Non-life insurance represents amounts earned by Prva osebna zavarovalnica; Other relates to income generated
by the Group, Life insurance relates to amounts earned by Prva osebna zavarovalnica from sale of life
insurance and the remaining amount relates to other pension funds included in the consolidation. The amounts
presented are exclusive of consolidation entries.
13.4. NOTES TO THE INCOME STATEMENT
1. OPERATING INCOME
Operating income of the Company refers only to services the Company charges to subsidiary companies for
services rendered. These incomes are eliminated from the consolidated revenues.
Income of the Group consists of:
Net income from insurance premiums
Other insurance income
1.1 Net income from insurance premiums
Table 9: Net income from insurance premiums
EUR Prva Group The Group
2014 2013 2014 2013
Gross insurance premiums written 0 0 11,963,190 9,097,099
Premiums written re-insured 0 0 -587,216 -508,818
Change of unearned premium 0 0 -7,969 -19,584
Total 0 0 11,368,005 8,568,697
1.2 Other insurance income
Other insurance income is composed from:
entry fees,
management fees,
exit fees,
other services.

ANNUAL REPORT 2014 49
Table 10: Other insurance income
EUR Prva Group The Group
2014 2013 2014 2013
Entry fees 0 0 1,896,892 1,955,903
Management fees 0 0 5,253,286 4,879,486
Exit fees 0 0 182,288 202,874
Revenues from operations 344,100 254,476 10,433 14,842
Total 344,100 254,476 7,342,899 7,053,105
Main part of other insurance income represents entry and management fees from supplementary pension
insurance.
The entry fees are charged from paid-in premiums, not exceeding 2.95% of the paid-in premium at the year-end
(2013: 2.95%).
The Group also charges annual management fee ranging from 1.0% to 1.5% for the administration and
management of all pension funds (2013: 1.0% to 1.5%).
Upon the termination of the supplementary pension insurance, the administrator is entitled to an exit fee in the
amount of 1% of the redemption value upon termination of the insurance contract (2013: 1%).
2. INTEREST INCOME AND EXPENSE
Interest income mainly includes interest from issued loans and deposits and interest from investments earned in
2014.
2.1 Interest income
Table 11: Interest income
EUR Prva Group The Group
2014 2013 2014 2013
Financial assets 66,953 112,718 1,374,221 1,399,880
1. Held to maturity 66,953 0 911,376 907,287
2. Available-for-sale 0 112,718 435,160 462,139
3. Measured at fair value through profit or loss 0 0 27,685 30,455
Issued loans and deposits 1,287 8,202 41,145 50,218
Other 0 0 504 0
Total 68,240 120,920 1,415,870 1,450,098
2.2 Interest expense
Table 12: Interest expense
EUR Prva Group The Group
2014 2013 2014 2013
Other interest expense 0 0 -697 0
Total 0 0 -697 0
In 2014, the Company raised no loans and incurred no related expense. The interest expense of the Group relates
to the interest expense incurred by Prva Osebna Zavarovalnica d.d. (2013: The Company and the Group raised
no loans and incurred no related expense).

50 ANNUAL REPORT 2014
3. DIVIDEND INCOME
Table 13: Dividend Income
EUR Prva Group The Group
2014 2013 2014 2013
Dividend income on available-for-sale financial assets 1,231,002 2,173,876 161,618 347,366
Total 1,231,002 2,173,876 161,618 347,366
4. NET GAINS/LOSSES FROM INVESTMENTS
Table 14: Net gains/losses from investments
EUR Prva Group The Group
2014 2013 2014 2013
Net gains from revaluation of investments measured at fair value through profit or loss
0 0 49,715 67,664
Net gains/losses from disposal of securities
-140,043 70,775 61,211 77,212
Impairment of investments not measured at fair value through profit or loss
-128,756 -1,899,829 -133,815 -4,053,924
Net foreign exchange differences 0 0 133,039 -13,771
Total -268,800 -1,829,054 110,150 -3,918,124
Net gains from revaluation and net gains from investments relate to various shares and bonds of the Company
and the Group. Investment impairment in 2013 was primarily recognised on investments in subordinated bonds
of Slovenian banks. As a result of the write-off of subordinated bonds, the Company and other affected companies
in the Group instigated a legal dispute against each of the Bank of Slovenia's decisions and resolution.
5. NET EXPENSES FOR CLAIMS AND CHANGES IN TECHNICAL PROVISIONS
5.1 Net expenses for claims
Table 15: Net expenses for claims
EUR Prva Group The Group
2014 2013 2014 2013
Gross claims charged 0 0 -3,208,964 -2,531,696
Re-insurance share of gross claims 0 0 132,075 332,419
Change of provisions for outstanding claims 0 0 -570,277 -45,446
Change of provisions for outstanding claims re-insured 0 0 205,986 89,912
Total 0 0 -3,441,179 -2,154,811

ANNUAL REPORT 2014 51
5.2 Changes in technical provisions
Table 16: Changes in technical provisions
EUR Prva Group The Group
2014 2013 2014 2013
Change of gross mathematical provisions
- Life insurance guarantee fund 0 0 -3,297,745 -3,145,850
- Investment risk guarantee fund 0 0 -353,368 -276,544
- Health insurance guarantee fund 0 0 -3,088 561
Total 0 0 -3,654,202 -3,421,833
6. COSTS OF ACQUIRING INSURANTS
Commissions to agents and marketing promotion costs directly attributed to the acquisition of insurants are
included under costs of acquiring insurance. Commissions to agents refer to fees that are paid to outside
contractors as an award for the successful acquisition of insurants. The presented item comprises also changes
in deferred insurance acquiring costs.
Table 17: Costs of acquiring insurants
Prva Group The Group
EUR 2014 2013 2014 2013
Commissions to agents costs 0 0 -3,092,949 -2,507,321
Marketing campaigns costs 0 0 -338,030 -218,098
Total 0 0 -3,430,979 -2,725,420
7. EMPLOYEE BENEFIT COSTS
Salaries, holiday pay, reimbursements for meals and transportation to work, employer contributions and taxes
for remitted salaries and payments of supplementary pension insurance are included under labour costs for 2014.
Prva Group plc. employed 1.2 employee at the end of 2014 (2013:1.2), while there were 108 persons employed
in the Group at the end of 2014 (2013: 109).
Table 18: Employee benefit costs
EUR Prva Group The Group
2014 2013 2014 2013
Employee salaries -91,079 -77,434 -2,272,918 -2,052,157
Holiday pay -800 -267 -53,129 -48,195
Reimbursements for meals and transportation to work -832 -214 -119,864 -91,710
Employer's contributions and taxes on salaries paid -14,499 -12,451 -314,370 -297,957
- Pension insurance contributions -7,974 -6,845 -149,109 -141,531
- Social security contributions -6,526 -5,606 -165,261 -156,426
Payments to employees for supplementary pension insurance -378 -281 -81,684 -81,341
Other labour costs -103 0 -13,615 -2,696
Total -107,692 -90,646 -2,855,580 -2,574,056

52 ANNUAL REPORT 2014
8. OTHER COSTS
Other costs comprise the cost of services by individual persons, material operating costs, service operating costs,
marketing costs, supervisory board costs, rental costs, deferred employee benefits and other costs.
Table 19: Other costs
EUR Prva Group The Group
2014 2013 2014 2013
Reimbursement of work-related costs -11,092 -7,770 -142,180 -128,637
Costs of intellectual and personal services -40,070 -43,290 -381,824 -326,024
Rental costs -11,841 -14,206 -422,196 -409,577
Costs of other services -49,589 -62,187 -533,148 -567,832
Other costs -10,764 -13,167 -578,252 -433,809
Profit sharing from reinsurance 0 0 56,600 114,007
Total -123,356 -140,620 -2,001,000 -1,751,872
Table 20: Audit fees
EUR Prva Group The Group
2014 2013 2014 2013
Audit of the annual report -8,540 -13,464 -68,359 -79,933
Other non-auditing services 0 0 0 0
Other auditing services 0 0 0 0
Tax advisory services 0 0 0 0
Total -8,540 -13,464 -68,359 -79,933
9. OTHER REVENUE AND EXPENSES
9.1 Other revenue
The majority of other revenue of the Group represent fee and commission received for acquiring of insurances
amounting to EUR 173,615 in 2014 (2013: EUR 167,665)
9.2 Other expenses
Table 21: Other expenses
Prva Group The Group
EUR 2014 2013 2014 2013
Other expenses 0 0 -738,340 -458,816
Total 0 0 -738,340 -458,816
Other expenses were incurred by Prva osebna zavarovalnica d.d.. These costs are charged to the Company and
cannot be included under any other income statement item.

ANNUAL REPORT 2014 53
10. DEFERRED AND CURRENT TAX
Table 22: Deferred tax - Prva Group
EUR Statement of financial position
Recognised in statement of
comprehensive income
Recognised in
profit or loss
31.12.2014 31.12.2013 2014 2014
Impairment of investments and receivables 117,682 126,284 0 -8,602
Unutilised tax losses 221,899 263,297 0 -41,398
Revaluation of AFS investments to fair value 0 23,905 -23,905 0
Total deferred income tax assets (+)/liabilities (-)
339,581 413,486 -23,905 -50,000
Table 23: Deferred tax – The Group
EUR Statement of financial position
Recognised in statement of
comprehensive income
Recognised in
profit or loss
31.12.2014 31.12.2013 2014 2014
Deferred income tax assets 705,437 801,799 0 -47,384
Fixed asset depreciation 5,966 0 0 5,966
Impairment of investments and receivables 117,682 127,062 0 -9,380
Provisions for employees 2,542 0 0 2,542
Unutilised tax losses 579,247 674,737 0 -46,512
Deferred income tax liabilities 177,258 25,335 151,923 0
Revaluation of AFS investments to fair value 177,258 25,335 151,923 0
Total deferred income tax assets (+)/liabilities (-)
528,179 776,464 -151,923 -47,384
As at 31 December 2014, deferred tax amounts were restated using tax rates effective at the time the Company
expects to utilise these tax assets i.e. at the rate of 17% (2013: 17%).

54 ANNUAL REPORT 2014
Table 24: Reconciliation of tax and accounting profit multiplied by the tax rate applicable in Slovenia
EUR Prva Group The Group
2014 2013 2014 2013
Pre-tax profit 1,105,841 450,597 4,090,845 261,279
Income tax paid in Slovenia at 17% (2012 – 18%)
-1,011,437 -2,065,183 -1,075,644 -2,169,502
Net increase/decrease in the tax basis 136,695 246,480 200,902 315,280
Expenses not recognised for tax purposes 0 0 103,074 54,257
Tax relief 0 0 103,074 0
Deduction of foreign tax 0 0 0 0
Deferred tax -50,000 266,403 -47,384 324,372
Income tax payable 0 0 -138,318 -5,075
Total tax -50,000 266,403 -185,702 319,297
Effective tax rate 4.52% -59.12% 4.54% -122.21%
In the financial year under review, the Company /the Group accounted for the amount of current income tax
payable using the applicable tax rate of 17% (2013: 17%).
11. NET EARNINGS PER SHARE
The basic earnings per share is calculated by dividing the net profit for the financial period belonging to ordinary
shareholders by the weighted average number of outstanding ordinary shares in the financial period. The
weighted average number of outstanding ordinary shares is calculated using data on the number of outstanding
ordinary shares while taking into consideration eventual purchases and sales within the period and the period in
which the shares participated in the generating of profit. The adjusted earnings per share also take into account
all potential ordinary shares. The Company does not have any potential ordinary shares, therefore the net
earnings per share equals to the adjusted earnings per share.
Table 25: Earnings per share
EUR The Group
2014 2013
Net profit for the year attributable to the Group 3,242,905 16,584
Less dividends paid out to owners of preference shares -400,897 -1,910
Net profit attributable to ordinary equity holders of the parent (EUR) 2,842,008 14,674
Weighted average number of ordinary shares for basic earnings per share 291,484 283,256
Earnings per share (in EUR) 9.75 0.05

ANNUAL REPORT 2014 55
13.5. NOTES TO THE STATEMENT OF FINANCIAL POSITION
12. PROPERTY, PLANT AND EQUIPMENT
Table 26: Movement in property, plant and equipment in 2014
EUR Prva Group The Group
Equipment TOTAL Buildings and
equipment TOTAL
COST
Balance at 31 December 2013 166,521 166,521 1,524,031 1,524,031
Additions 0 0 152,184 152,184
Disposals -14,238 -14,238 -11,513 -11,513
Balance at 31 December 2014 152,283 152,283 1,591,390 1,591,390
ACCUMULATED AMORTISATION
Balance at 31 December 2013 142,421 142,421 889,445 889,445
Amortisation in 2014 5,886 5,886 110,121 110,121
Disposals -14,238 -14,238 -17,472 -17,472
Balance at 31 December 2014 134,069 134,069 948,543 948,543
CARRYING AMOUNT
Balance at 31 December 2013 24,100 24,100 634,585 634,585
Balance at 31 December 2014 18,214 18,214 642,848 642,848
The Company has not pledged any items of property, plant and equipment as collateral for loans.
Table 27: Movement in property, plant and equipment in 2013
Prva Group The Group
EUR Equipment TOTAL Buildings and equipment TOTAL
COST
Balance at 31 December 2012 167,281 167,281 1,409,538 1,409,538
Additions 0 0 152,658 152,658
Disposals -760 -760 -38,165 -38,165
Balance at 31 December 2013 166,521 166,521 1,524,031 1,524,031
ACCUMULATED AMORTISATION
Balance at 31 December 2012 136,136 136,136 818,652 818,652
Amortisation in 2013 7,045 7,045 87,934 87,934
Disposals -760 -760 -17,142 -17,142
Balance at 31 December 2013 142,421 142,421 889,445 889,445
CARRYING AMOUNT
Balance at 31 December 2012 31,145 31,145 590,886 590,886
Balance at 31 December 2013 24,100 24,100 634,585 634,585

56 ANNUAL REPORT 2014
13. INTANGIBLE ASSETS
Table 28: Movements in intangible fixed assets in 2014
EUR
Prva Group The Group
Software Investments in progress
Long-term deferred
acquisition costs
TOTAL Software Investments in progress
Long-term deferred
acquisition costs
TOTAL
COST
Balance at 31 December 2013 178,858 0 0 178,858 1,830,647 7,360 169,126 2,007,132
Additions 0 0 0 0 90,743 78,479 77,304 246,525
Transfers 0 0 0 0 58,412 -58,412 -108,336 -108,336
Disposals 0 0 0 0 -303,497 0 -11,879 -315,376
Balance at 31 December 2014 178,858 0 0 178,858 1,676,305 27,426 126,215 1,829,945
ACCUMULATED AMORTISATION
Balance at 31 December 2013 122,562 0 0 122,562 1,193,777 0 0 1,193,777
Amortisation in 2014 35,056 0 0 35,056 250,659 0 22,050 272,709
Disposals 0 0 0 0 -199,666 0 0 -199,666
Balance at 31 December 2014 157,618 0 0 157,618 1,244,771 0 0 1,266,821
CARRYING AMOUNT
Balance at 31 December 2013 56,296 0 0 56,296 636,870 7,360 169,126 813,356
Balance at 31 December 2014 21,240 0 0 91,352 494,039 41,140 202,330 563,124
Table 29: Movements in intangible assets in 2013
EUR
Prva Group The Group
Software Investments in progress
Long-term deferred
acquisition costs
TOTAL Software Investments in progress
Long-term deferred
acquisition costs
TOTAL
COST
Balance at 31 December 2012 178,858 0 0 178,858 1,457,500 41,140 202,330 1,700,970
Additions 0 0 0 0 340,900 904 95,678 437,483
Transfers 0 0 0 0 32,246 -34,684 128,882 126,444
Disposals 0 0 0 0 0 0 0 0
Balance at 31 December 2013 178,858 0 0 178,858 1,830,647 7,360 169,126 2,007,132
ACCUMULATED AMORTISATION
Balance at 31 December 2012 87,506 0 0 87,506 963,462 0 0 963,462
Amortisation in 2013 35,056 0 0 35,056 230,315 0 0 230,315
Disposals 0 0 0 0 0 0 0 0
Balance at 31 December 2013 122,562 0 0 122,562 1,193,777 0 0 1,193,777
CARRYING AMOUNT 0
Balance at 31 December 2012 91,352 0 0 91,352 494,039 41,140 202,330 737,510
Balance at 31 December 2013 56,296 0 0 56,296 636,870 7,360 169,126 813,356
14. INTERESTS IN SUBSIDIARIES AND ASSOCIATES
14.1 Interests in subsidiaries
Interests in subsidiaries represent investments of Prva Group plc. in the following companies: Prva osebna
zavarovalnica d.d., KB Prvo penzisko društvo AD, Skopje, Fondi Slloveno-Kosovar I Pensioneve sh.A Pristhine
Kosovo, DDOR GARANT Beograd, PRVA zavarovalniško zastopniška družba, d.o.o.. These companies and the
parent company Prva Group plc. form the Group.

ANNUAL REPORT 2014 57
Table 30: Interests in subsidiaries
EUR Ownership Prva Group Changes during
the year 31.12.2014 31.12.2013
Prva osebna zavarovalnica d.d. 100% 12,730,000 12,730,000
KB Prvo penzisko društvo AD Skopje 51% 918,272 918,272
Fondi Slloveno- Kosovar I Pensioneve Sh.A Pristhine Kosovo
67% 511,985 511,985
DDOR Garant Beograd 60% 2,435,768 2,481,654 Investment
impairment to fair value
PRVA zavarovalniško zastopniška družba, d.o.o. 100% 64,300 64,300
Total 16,660,326 16,706,212
In 2014 the Company Prva Group plc. recognised impairment of its investment in DDOR GARANT Beograd in the
amount of EUR 45,886. The impairment loss was recognised based on the assessment of expected future cash
flows.
Voting rights in subsidiaries are equal to the ownership share.
15. ASSETS OF UNIT-LINKED POLICY HOLDERS
Table 31: Assets of unit-linked policy holders
Prva Group The Group
EUR 31.12.2014 31.12.2013 31.12.2014 31.12.2013
Assets of unit-linked policyholders 0 0 1,458,080 1,043,151
Total 0 0 1,458,080 1,043,151
16. INVESTMENTS IN SECURITIES
Investments in securities represent investments in shares and bonds.
Table 32: Investments in securities
EUR Prva Group The Group
31.12.2014 31.12.2013 31.12.2014 31.12.2013
Investments into securities held-to-maturity 0 0 0 18,002,101
Investments into securities available for sale 1,453,377 1,873,238 31,175,836 6,826,440
Investments into securities designated at fair value through profit or loss
0 0 760,643 634,863
Total 1,453,377 1,873,238 31,936,479 25,463,405

58 ANNUAL REPORT 2014
Table 33: Structure of securities based on type of interest rate
EUR Prva Group The Group
31.12.2014 31.12.2013 31.12.2014 31.12.2013
Investments into securities held to maturity: 0 0 0 18,002,101
- debt securities at fixed rate of interest 0 0 0 18,002,101
- debt securities at variable rate of interest 0 0 0 0
Investments into securities available for sale 1,453,377 1,873,238 31,175,836 6,826,440
- debt securities at fixed rate of interest 1,453,377 887,297 31,175,836 5,219,565
- debt securities at variable rate of interest 0 0 0 0
- equity securities 985,940 0 1,606,875
Investments into securities designated at fair value through profit or loss
0 0 760,643 634,863
- debt securities at fixed rate of interest 0 0 760,643 634,863
- debt securities at variable rate of interest 0 0 0 0
- equity securities 0 0 0 0
Total 1,453,377 1,873,238 31,936,479 25,463,405
The effective interest rate on securities ranges from 1.0% to 7.6% (2013: from 2.13% do 8.26%)
16.1 Investments in securities held to maturity
Table 34: Investments in securities held to maturity
EUR Prva Group The Group
31.12.2014 31.12.2013 31.12.2014 31.12.2013
Investments traded on the organised market 0 0 0 16,682,094
Investments not traded on the organised market 0 0 0 1,320,008
Total 0 0 0 18,002,101
Non-trading securities held to maturity for the year 2013 are securities issued by the Republic of Macedonia.
16.2 Investments in securities, available for sale
Table 35: Investments in securities, available for sale
EUR Prva Group The Group
31.12.2014 31.12.2013 31.12.2014 31.12.2013
Investments traded on the organised market 1,453,377 1,873,238 31,175,836 6,826,440
Investments not traded on the organised market 0 0 0 0
Total 1,453,377 1,873,238 31,175,836 6,826,440
Investments traded on the organised market are valued on the basis of market prices. Investments not traded on
the organised market are valued using valuation technique models, taking into account variables, gained on
available market data.

ANNUAL REPORT 2014 59
16.3 Investments in securities measured at fair value through profit and loss
Table 36: Investments in securities measured at fair value through profit and loss
EUR Prva Group The Group
31.12.2014 31.12.2013 31.12.2014 31.12.2013
Investments traded on the organised market 0 0 760,643 634,863
Investments not traded on the organised market 0 0 0 0
Total 0 0 760,643 634,863
Investments traded on the organised market are valued on the basis of market prices.
17. OTHER RECEIVABLES AND SHORT-TERM DEFERRED COSTS AND ACCRUED INCOME
Table 37: Other receivables and short-term deferred costs and accrued income
EUR Prva Group The Group
31.12.2014 31.12.2013 31.12.2014 31.12.2013
Receivables arising out of insurance operations 0 0 221,612 148,733
Short-term trade receivables 50,224 19,976 380,330 313,115
Short-term advance payments 1,312 1,613 1,312 1,613
Income tax assets 0 0 0 0
Other receivables and assets 136,609 175,497 1,073,675 885,005
Deferred expenses and accrued income 1,098 15,428 254,371 234,606
Total 189,242 212,515 1,931,299 1,583,073
18. ASSETS FROM FINANCIAL CONTRACTS
Assets from financial contracts relate to the Prva osebna zavarovalnica d.d. pension funds. Assets from
financial contracts abroad are recognised in the off balance sheet accounts.
Table 38: Assets from financial contracts
EUR Carrying amount Fair value
31.12.2014 31.12.2013 31.12.2014 31.12.2013
Investments in securities 186,255,383 171,649,825 186,255,383 180,170,354
1. Held-to-maturity 0 141,802,180 0 150,322,709
2. Available-for-sale 0 0 0 0
3. Measured at fair value through profit or loss 186,255,383 29,847,645 186,255,383 29,847,645
Investment property 17,531,795 18,610,762 17,531,795 18,610,762
Issued loans and deposits 31,338,557 27,659,543 31,338,557 27,659,543
Short-term trade receivables 0 0 0 0
Other receivables and assets 671,392 712,172 671,392 712,172
Cash and cash equivalents 1,985,193 1,369,390 1,985,193 1,369,390
Total assets 237,782,319 220,001,692 237,782,319 228,522,221
Technical provisions 237,435,509 219,690,995 237,435,509 219,690,996
Other liabilities from financial contracts 346,810 310,697 346,810 310,697
Total liabilities 237,782,319 220,001,692 237,782,319 220,001,692

60 ANNUAL REPORT 2014
Table 39: Assets less receivables on accounts of pension insurants
EUR 31.12.2014 31.12.2013
Pension fund 1
Investments in securities held to maturity 0 0
Investments measured at fair price 19,738,979 21,756,066
Issued loans and deposits 6,969,396 4,735,614
Investment property 1,594,981 1,711,938
Cash and cash equivalents 300,937 289,680
Pension fund 2
Investments in securities held to maturity 0 36,163,216
Investments measured at fair price 43,009,989 2,217,973
Issued loans and deposits 6,249,723 5,226,847
Investment property 3,671,420 4,078,672
Cash and cash equivalents 439,968 199,624
Pension fund 3
Investments in securities held to maturity 0 61,950,704
Investments measured at fair price 71,567,271 3,379,381
Issued loans and deposits 10,407,631 9,655,140
Investment property 7,116,551 7,418,501
Cash and cash equivalents 584,724 486,894
Pension fund 4
Investments in securities held to maturity 0 43,688,262
Investments measured at fair price 51,939,144 2,494,225
Issued loans and deposits 7,711,807 8,041,941
Investment property 5,148,844 5,401,651
Cash and cash equivalents 659,565 393,192
Total 237,110,927 219,289,521
Investments of pension funds in deposits with banks and savings banks represent long-term and short-term
deposits, denominated in euros. The annual interest rate ranges from 1.40% - 8.20% (2013: 3.00% - 7.70%)
Investments in held-to-maturity securities represent bonds of the Republic of Slovenia, EC/OECD countries and
other countries, and corporate bonds from the organised markets of the Republic of Slovenia and EC and OECD
countries as well as other countries. On pension funds 2, 3 and 4 the Company has fully switched to fair value
pricing (On pension fund 1 the company has switched to fair value pricing in 2013).
Investments in securities designated at fair value through profit or loss represent shares traded on the securities
market, shares not traded on the securities market, and corporate bonds from the organised markets of the
Republic of Slovenia and EC and EOCD countries as well as other countries.
Investments in property are investments in investment property measured at fair value. New purchases and a
revaluation to the fair value was made in 2014, which is the reason behind the decrease in the investment
property value compared to 2013.
Table 40: Movement in investments on accounts of pension insurants
EUR 2014 2013
Balance at 1 January 219,289,521 218,886,109
Increase 41,578,349 31,797,314
Restatement 22,644,508 -10,708,078
Decrease -46,401,451 -20,685,824
Balance at 31 December 237,110,927 219,289,521

ANNUAL REPORT 2014 61
Table 41: Structure of securities based on type of interest rate on accounts of policy holders of Prva osebna
zavarovalnica
EUR 31.12.2014 31.12.2013
Debt securities 180,303,925 165,289,839
- Fixed interest rate 178,835,420 161,999,041
- Variable interest rate 1,468,505 3,290,797
Equity securities 5,951,457 6,359,986
Total 186,255,383 171,649,825
The effective interest rate on securities of pension funds ranges from 0.01% to 10.29% (2013: from 0.60% to
8.40%).
19. ISSUED LOANS AND DEPOSITS
Table 42: Issued loans and deposits
EUR Prva Group The Group
31.12.2014 31.12.2013 31.12.2014 31.12.2013
Issued loans and deposits 1,972,416 2,516,740 7,721,494 8,144,757
Total 1,972,416 2,516,740 7,721,494 8,144,757
Issued loans and deposits of Prva Group plc. represent deposits in banks. The interest rate for new deposits
amounts to an average 1.10 – 2.25% nominal interest rate. The interest rates on deposits are fixed.
58% of the Company’s deposits mature in 2015. As for the Group, 49% of deposits will mature in the next financial
year.
All of the Company’s deposits are denominated in euros. Within the Group, 5.8% of the deposits are denominated
in the Macedonian denar; all other deposits are denominated in euro.
20. CASH AND CASH EQUIVALENTS
Table 43: Cash and cash equivalents
EUR Prva Group The Group
31.12.2014 31.12.2013 31.12.2014 31.12.2013
Cash in hand 0 0 322 851
Cash on current accounts (local currency) 1,582 7,176 111,492 74,695
Cash on current accounts (foreign currency) 0 0 8,234 6,432
Deposits with up to 3-month maturity at banks 40,199 48,019 1,390,414 1,052,159
Total 41,782 55,195 1,510,462 1,134,137
Deposits with up to three month maturity are disclosed inclusive of related interest as accrued in accordance
with contractual terms. These funds are intended for the current coverage of costs and current placements.
21. EQUITY
At 31 December 2014, the share capital of the Company amounted to EUR 13,386,247, of which EUR 6,704,638
relates to ordinary shares, with the difference in the amount of EUR 6,681,609 relating to preference shares.
The capital of the Group represents the capital of Prva Group plc. and the capital of the non-controlling interest.

62 ANNUAL REPORT 2014
Table 44: Share capital
EUR 31.12.2014 31.12.2013
Approved share capital (ordinary shares with a face value of EUR 23.00) 6,704,638 6,704,638
Approved share capital (preference shares with a face value of EUR 33.00) 6,681,609 6,681,609
Share capital (ordinary shares with a face value of EUR 23.00) 6,704,638 6,704,638
Share capital (preference shares with a face value of EUR 33.00) 6,681,609 6,681,609
Total share capital (issued and paid-up shares) 13,386,247 13,386,247
Table 45: Number of issued and paid-up shares
EUR Ordinary shares Preference shares
2014 2013 2014 2013
At 1 January 291,420 275,006 202,372 191,012
Issued 64 16,414 65 11,360
At 31 December 291,484 291,420 202,437 202,372
The Company/the Group owns 18 ordinary and 51 preference shares on 31.12.2014
21.1 Reserves
Share premium comprises the surplus of capital paid (payments above the minimum emission values of shares or
stakes) in the amount of EUR 6,017,833 (2013: EUR 6,017,833) and cannot be distributed. Other profit reserves
amount to EUR 3,386 (2013: EUR 3,386).
Reserves for exchange rate differences arising from the translation of the functional currencies into the reporting
currency are recognised directly in the statement of comprehensive income until the sale of a subsidiary when
the exchange rate differences are transferred to the profit or loss. These reserves cannot be distributed.
Retained earnings have not been earmarked for any specific purpose and can be used to finance dividend
payments in subsequent years.
Table 46: The structure and movement of reserves in 2014
Prva Group The Group
Share premium
and other profit
reserves
Retained earnings Total
Share premium
and other profit
reserves Revaluation
reserves Retained earnings Total
Revaluation reserves
1.1.2014 6,020,110 -116,715 1,064,763 6,968,158 6,020,110 -366,189 4,263,210 9,917,132
Change 0 64,687 255,580 320,267 0 738,054 2,442,644 3,180,697
31.12.2014 6,020,110 -52,028 1,320,343 7,288,425 6,020,110 371,865 6,705,854 13,097,830
Table 47: The structure and movement of reserves in 2013
Prva Group The Group
Share premium
and other profit
reserves
Retained earnings Total
Share premium
and other profit
reserves Revaluation reserves
Retained earnings Total
Revaluation reserves
1.1.2013 6,862,816 -724,111 1,549,674 7,688,379 6,862,816 -939,073 5,450,446 10,835,204
Change -842,706 607,396 -484,911 -720,221 -842,706 572,884 -1,187,235 -1,455,947
31.12.2013 6,020,110 -116,715 1,064,763 6,968,158 6,020,110 -366,189 4,263,210 9,379,257
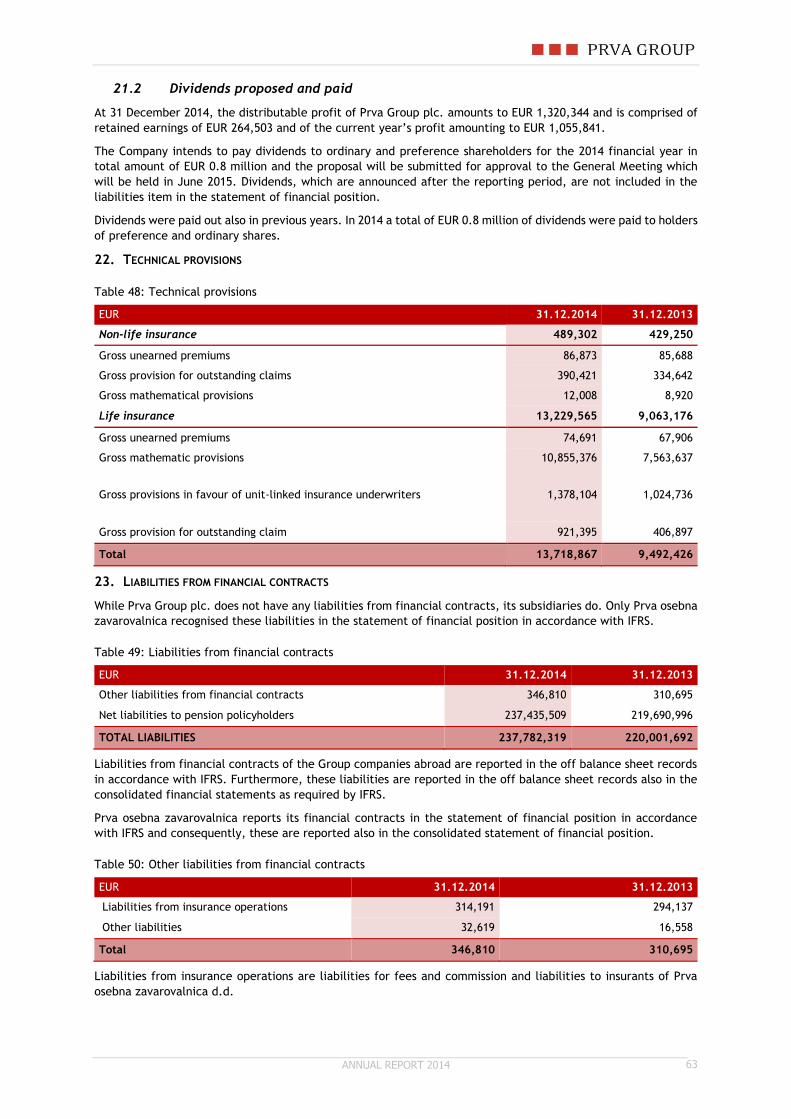
ANNUAL REPORT 2014 63
21.2 Dividends proposed and paid
At 31 December 2014, the distributable profit of Prva Group plc. amounts to EUR 1,320,344 and is comprised of
retained earnings of EUR 264,503 and of the current year’s profit amounting to EUR 1,055,841.
The Company intends to pay dividends to ordinary and preference shareholders for the 2014 financial year in
total amount of EUR 0.8 million and the proposal will be submitted for approval to the General Meeting which
will be held in June 2015. Dividends, which are announced after the reporting period, are not included in the
liabilities item in the statement of financial position.
Dividends were paid out also in previous years. In 2014 a total of EUR 0.8 million of dividends were paid to holders
of preference and ordinary shares.
22. TECHNICAL PROVISIONS
Table 48: Technical provisions
EUR 31.12.2014 31.12.2013
Non-life insurance 489,302 429,250
Gross unearned premiums 86,873 85,688
Gross provision for outstanding claims 390,421 334,642
Gross mathematical provisions 12,008 8,920
Life insurance 13,229,565 9,063,176
Gross unearned premiums 74,691 67,906
Gross mathematic provisions 10,855,376 7,563,637
Gross provisions in favour of unit-linked insurance underwriters 1,378,104 1,024,736
Gross provision for outstanding claim 921,395 406,897
Total 13,718,867 9,492,426
23. LIABILITIES FROM FINANCIAL CONTRACTS
While Prva Group plc. does not have any liabilities from financial contracts, its subsidiaries do. Only Prva osebna
zavarovalnica recognised these liabilities in the statement of financial position in accordance with IFRS.
Table 49: Liabilities from financial contracts
EUR 31.12.2014 31.12.2013
Other liabilities from financial contracts 346,810 310,695
Net liabilities to pension policyholders 237,435,509 219,690,996
TOTAL LIABILITIES 237,782,319 220,001,692
Liabilities from financial contracts of the Group companies abroad are reported in the off balance sheet records
in accordance with IFRS. Furthermore, these liabilities are reported in the off balance sheet records also in the
consolidated financial statements as required by IFRS.
Prva osebna zavarovalnica reports its financial contracts in the statement of financial position in accordance
with IFRS and consequently, these are reported also in the consolidated statement of financial position.
Table 50: Other liabilities from financial contracts
EUR 31.12.2014 31.12.2013
Liabilities from insurance operations 314,191 294,137
Other liabilities 32,619 16,558
Total 346,810 310,695
Liabilities from insurance operations are liabilities for fees and commission and liabilities to insurants of Prva
osebna zavarovalnica d.d.

64 ANNUAL REPORT 2014
Table 51: Net liabilities to pension policyholders
EUR Pension fund
1 Pension
fund 2 Pension
fund 3 Pension
fund 4 Total
Guaranteed value of mathematical provisions
in 2013 28,309,669 47,577,847 82,251,040 59,625,198 217,763,754
in 2014 28,315,175 48,952,482 82,513,954 60,198,564 219,980,174
Value of mathematical provisions not guaranteed
in 2013 254,460 382,486 798,331 491,965 1,927,242
in 2014 391,087 4,468,120 7,278,299 5,317,829 17,455,335
Total mathematical provisions
in 2013 28,564,129 47,960,333 83,049,371 60,117,163 219,690,996
in 2014 28,706,261 53,420,602 89,792,253 65,516,393 237,435,509
Net liabilities to pension policyholders represent mathematical provisions, which are managed separately by the
subsidiary Prva osebna zavarovalnica and the Group for each individual long term business fund.
Mathematical provisions must comply with the Decision on Detailed Rules and Minimum Standards to be Applied
in the Calculation of Technical Provisions and at any time equal at least the amount of the redemption value of
the insurance.
Thus, provisions are formed for each individual pension fund and comprise the guaranteed funds on the personal
account of policyholders and provisions for returns exceeding the guaranteed return. The guaranteed value of
the fund consists of the payment of the net premium and prescribed guaranteed return. Mathematical provisions
are not reinsured.
Table 52: Movement in liabilities due to pension insurance policyholders in 2013 and 2012
EUR Pension fund
1 Pension fund
2 Pension fund
3 Pension fund
4 TOTAL
Balance at 1 January 2014 28,564,128 47,960,333 83,049,372 60,117,164 219,690,996
Payments 2,959,430 5,973,154 7,543,490 5,005,149 21.481.222
Redemption and net transfers -3,562,193 -5,364,429 -8,410,960 -5,237,889 -22,575,470
Net result from investments 1,109,968 5,611,274 9,144,949 6,720,151 22,586,343
Fees -365,073 -759,730 -1,534,597 -1,088,181 -3.747.581
Balance at 31 December 2014
28,706,261 53,420,602 89,792,253 65,516,393 237,435,509
EUR Pension fund
1 Pension fund
2 Pension fund
3 Pension fund
4 TOTAL
Balance at 1 January 2013 28,254,525 46,742,160 83,438,425 60,797,395 219,232,504
Payments 2,637,389 5,918,605 8,179,918 5,830,459 22.566.371
Redemption and net transfers -2,505,050 -3,930,568 -6,929,403 -5,579,409 -18,944,430
Net result from investments 573,422 -47,918 -78,731 170,439 617,213
Fees -396,158 -721,945 -1,560,839 -1,101,720 -3.780.662
Balance at 31 December 2013
28,564,128 47,960,333 83,049,372 60,117,164 219,690,996
24. FINANCIAL LIABILITIES FROM BORROWINGS
The Company and the Group do not have any financial liabilities from borrowings. In 2014, the Company has
repaid the borrowings in Macedonia, for which the Company has pledged real estates as collateral. Thus the real
estates are free of burden at 31.12.2014.

ANNUAL REPORT 2014 65
25. OTHER LIABILITIES, OTHER PROVISIONS AND SHORT-TERM ACCRUED COSTS AND DEFERRED INCOME
Table 53: Liabilities
EUR Prva Group The Group
31.12.2014 31.12.2013 31.12.2014 31.12.2013
Other provisions 0 0 110,014 88,578
Other liabilities 16,369 1,494,261 1,502,476 2,392,375
Short-term accrued cost and deferred income 5,136 9,114 1,660,437 1,000,551
Total 21,505 1,503,375 3,272,927 3,481,504
The Group companies settle their liabilities at maturity. Only larger companies i.e. KB Prvo, Macedonia and Prva
osebna zavarovalnica, Slovenia have open liabilities above EUR 100,000. These are accounts payable to suppliers,
to employees and liabilities relating to the purchase of securities. Short-term accrued and deferred items of the
Group represent deferred income from insurance premiums.
26. OFF BALANCE LIABILITIES OF THE COMPANY
The Company's and the Group's off balance sheet liabilities refer to liabilities arising from the lease contract for
business premises and the assets of the companies’ funds abroad.
Table 54: Movements in rent liabilities (EUR)
Prva Group Skupina
Maturity 2014 2013 2014 2013
In one year 11,832 11,832 247,896 247,896
In one to five years 5,136 16,968 477,775 725,671
In more than 5 years 0 0 0 0
TOTAL 16,968 28,800 725,671 973,567
In accordance with IFRS, liabilities from financial contracts of subsidiaries abroad are carried in the off balance
sheet records.
Table 55: Assets of long-term business funds of subsidiaries abroad recognised in the off balance sheet items
(Group disclosure)
EUR 31.12.2014 31.12.2013
Fondi Kosovo 5,775,240 5,407,759
KB Prvo Makedonija 291,259,746 235,827,991
DDOR Garant Srbija 37,367,330 33,221,713
Skupaj 334,402,316 274,457,463
13.6. OTHER DISCLOSURES TO THE FINANCIAL STATEMENTS OF THE COMPANY AND THE GROUP
27. REMUNERATIONS OF MEMBERS OF THE MANAGEMENT BOARD AND THE SUPERVISORY BOARD, AND RELATED PARTY
TRANSACTIONS
In 2014, a total of EUR 78,567 was paid to the Management Board and members of the Supervisory Board of Prva
Group plc. (2013: EUR 80,824), which is 2.8% less than in 2013.
Table 56: Costs of the Management and Supervisory Boards (including attendance fees of subsidiaries) for Prva
Group
2014 2012
Management Board 67,311 66,352
Supervisory Board 11,256 14,472
Total pay-outs 78,567 80,824

66 ANNUAL REPORT 2014
In 2014, Prva Group did not provide members of its Management or Subsidiary boards with any prepayments or
loans, nor did it assume any liabilities on their behalf. Remunerations made in 2014 are presented below.
Table 57: Remunerations to members of the Management and Supervisory Boards of Prva Group plc. in 2014
Salary Pension insurance
Benefits Holiday pay Attendance
fee Reward Total
Alenka Žnidaršič Kranjc
31,000 0 311 0 0 36,000 67,311
Total 31,000 0 311 0 0 36,000 67,311
Members Function Attendance
fee Total gross Income tax Net
Contr. for pension and
disab. insurance
Tanja Tuš 1,250 358 1,608 336 1,272 151
Jože Mermal 2,500 716 3,216 672 2,544 302
Lindsay Stuart 2,500 716 3,216 672 2,544 302
Andreja Moraru - EBRD
3,216 - - - - -
Total 9,466 1,790 8,040 1,681 6,359 754
Table 58: Remunerations to members of the Management and Supervisory Boards of Prva Group plc. in 2013
Salary Pension insurance
Benefits Holiday
pay Attendance
fee Reward Total
Alenka Žnidaršič Kranjc 24.031 0 322 0 0 42.000 66.352
Total 24.031 0 322 0 0 42.000 66.352
Members Function Attendance
fee Total gross Income tax Net
Contr. for pension and
disab. insurance
Tanja Tuš 1.250 358 1.608 362 1.246 142
Jože Mermal 2.500 716 3.216 724 2.492 285
Zvonimir Kristančič 1.250 358 1.608 362 1.246 142
Lindsay Stuart 2.500 716 3.216 724 2.492 285
Dušan Šešok 1.250 358 1.608 362 1.246 142
Andreja Moraru - EBRD 3.216 - - - - -
Total 11.966 2.506 11.256 2.533 8.722 996
The following other entities are considered related to Prva Group plc. and the Group:
A-Z Finance d.o.o.
EBRD, United Kingdom
Dej d.o.o.
Druga d.o.o
Makrofin d.o.o.
Deos, d.d.

ANNUAL REPORT 2014 67
Table 59: Transactions of Prva Group plc. with subsidiaries in 2014
PG – related parties
Costs – purchases from related parties
Revenue - sales to related parties
Receivables due from subsidiaries
Liabilities to subsidiaries
POZ 14,958 142,500 35,812 35,810
KB Prvo 0 165,000 13,750 0
DDOR 0 14,400 850 0
FONDI 0 60,719 38,519 0
POZ - PZZD, DEOS Costs – purchases from
related parties Revenue- sales to
related parties Receivables due from
subsidiaries Liabilities to subsidiaries
Prva zavarovalno zastopniška družba d.d.
0 0 0 0
Deos d.d. 27 0 0 0
PG – related parties Dividend Income Interest income Interest expense
POZ 620,000 0 0
KB Prvo 478,075 0 0
DDOR 45,886 0 0
FONDI 0 0 0
The Company, the Group and individual subsidiaries recorded no other significant related-party transactions in
2014.
The parent charged to its subsidiaries fees for investment management and internal audit services, as well as
rent for hardware and software.
All transactions with subsidiaries have been carried out under market conditions.
28. FINANCIAL INSTRUMENTS AND RISK MANAGEMENT
28.1 Insurance risk management
Each insurance contract is exposed to uncertainties whether insurance event will appear, when it will appear
and what the repayment will be. By nature, the insurance risks that arise from insurance contrast are coincidental
and thus unpredictable.
Insurance risks relate to uncertainty of the insurance transactions. The most important components of insurance
risks are:
Risk of unsuitable amount of premium (premium risk) and
Risk of inappropriate amount of technical provisions (provision risk)
Premium risk is the risk that costs and claims will be higher than written premiums. This can occur when the
frequency or the amount of claims is higher than expected. Claim events are random variables and therefore
actual numbers and amounts vary from statistical average. Provision risk is the risk of inappropriate amount of
technical provisions set aside.
Experiences show that portfolio size and spread decrease these variances. Prva osebna zavarovalnica has
implemented a process of accepting insurances that differentiates among different types of risks and aims to
achieve appropriate portfolio size risks in order to decrease variability of expected claims.
The insurance company manages risks with the help of criteria set for accepting insurances which depends on
the amount of the sum insured and the type of risk. Furthermore, the insurance company manages these risks
through appropriate development of products, pricing and reinsurance.
28.2 Financial risk management
The basic financial instruments of the Company and the Group comprise financial investments, bank loans, money
deposits and cash on accounts at banks. The main purpose of these financial instruments is to attain the long-
term yields of the insurance company. The insurance company also has other financial instruments such as trade
receivables and supplier payables which arise upon its business operations.
The main types of risk originating from the financial instruments of the insurance company include market risk,
liquidity risk and credit risk. The Management Board reviews and approves risk management policies which are
summarised below.

68 ANNUAL REPORT 2014
28.3 Capital management
Prva Group manages its capital with an aim of ensuring both smooth and continued operations of the Company
and maximum profitability for its shareholders through optimal capital adequacy.
The Group monitors capital balances of its subsidiaries to ensure adequate amount of capital. All of the
subsidiaries fully comply with the relevant capital adequacy requirements.
29. CREDIT RISK
The Company and the Group operate only with well established, trustworthy clients. They are exposed to credit
risk in terms of investments in securities, issued loans, deposits, cash and other receivables. The credit risk arises
from the fact that the Company is exposed to the risk of insolvency of counterparties.
The following table presents the exposures to credit risk based on different credit ratings. When determining a
credit rating, the credit rating of agencies Moody’s, S&P and Fitch are used. In case when there are different
credit ratings from different agencies, the second best rating is used. The table consists of debt instruments,
issued loans and deposits, cash and other receivables. Equity and real estate exposure are not presented in the
table, because no credit risk arises from this type of investments.
Table 60: The credit quality of the financial assets of Prva Group plc.
in EUR 31.12.2014 % 31.12.2013 %
1. Rating - AAA 0 0.00% 0 0.00%
2. Rating - AA 0 0.00% 0 1.22%
3. Rating - A 279,857 0.85% 0 7.24%
4. Rating - BBB 631,450 1.92% 448,983 22.07%
5. Below BBB 814,881 2.47% 387,080 37.70%
6. Without rating 1,929,531 5.85% 3,806,196 31.77%
Total 3,655,719 11.09% 4,642,259 100.00%
Table 61: The credit quality of the financial assets of the Group
in EUR 31.12.2014 % 31.12.2013 %
1. Rating - AAA 20,693 0.06% 0 0.00%
2. Rating - AA 626,116 1.90% 305,106 1.22%
3. Rating - A 5,747,214 17.44% 1,812,245 7.24%
4. Rating - BBB 15,444,473 46.86% 5,977,054 22.07%
5. Below BBB 9,782,161 29.68% 13,880,270 37.70%
6. Without rating 10,464,063 31.75% 13,481,227 31.77%
Total 42,084,720 127.69% 35,455,902 100.00%
In the rating group below BBB are in 2014 mainly investments in securities issued by domestic entities of the
Company and its subsidiaries and deposits of local banks with below BBB ratings. In the rating group without
rating are mainly deposits of local banks without rating and securities issued by domestic entities of the Company
and its subsidiaries.
Table 62: the structure of assets of Prva Group plc. exposed to credit risk
in EUR 31.12.2014 31.12.2013
Financial assets: 3,425,793 4,389,978
Deposits and loans 1,972,416 2,516,740
HTM 0 0
AFS 1,453,377 1,873,238
FVTPL 0 0
Receivables and other financial assets 188,144 197,086
Cash and cash equivalents 41,782 55,195
Total 3,655,719 4,642,259

ANNUAL REPORT 2014 69
Table 63: the structure of assets of the Group plc. to credit risk
in EUR 31.12.2014 31.12.2013
Financial assets: 38,897,330 32,973,298
Deposits and loans 7,721,494 8,144,757
HTM 0 18,002,101
AFS 31,175,836 6,826,440
FVTPL 760,643 634,863
Receivables and other financial assets 1,676,928 1,348,467
Cash and cash equivalents 1,510,462 1,134,137
Total 42,084,720 35,455,902
The investments are highly spread, therefore the Company and the Group are not significantly exposed to one
individual issuer. The investments are not pledged as collateral.
Table 64: The credit quality of the financial investments of pension funds
31.12.2014 % 31.12.2013 %
1. Rating - AAA 2,515,773 1.17% 4,163,059 2.13%
2. Rating - AA 2,027,602 0.95% 967,371 0.50%
3. Rating - A 38,231,308 17.84% 25,890,770 13.28%
4. Rating - BBB 93,070,827 43.43% 49,183,451 25.22%
5. Nižje od BBB 45,230,016 21.11% 76,122,972 39.03%
6. Brez ratinga 33,223,541 15.50% 38,703,321 19.84%
Total 214,299,067 100.00% 195,030,944 100.00%
In accordance with the Insurance Act, investments are spread, therefore the long term business funds are not
significantly exposed to one individual issuer. As a result of the financial crisis in the euro zone, the amount of
no rating investments and investments with low creditworthiness of debtors has risen. The "no rating" class
includes mainly investments in cash deposits held at Slovenian banks and debt securities of Slovenian issuers.
Class 5 "Below BBB" includes mainly the bonds of Slovenian issuers and bonds of companies engaged in cyclical
industries, whose credit rating deteriorated due to the economic crisis. Equity securities and real estate are not
included in the analysis as they carry no direct credit risk.
The Company and pension funds have no outstanding receivables or investments. None of the investments are
pledged as collateral.
The Company and Group regularly assess credit risk arising from deposits at banks and by following a conservative
investments policy invest any surplus assets in deposits of local banks for which the Company and the Group
believe there is no risk of default on repayment i.e. no significant credit risk.
Table 65: Credit risk structure of pension funds per investment type
31.12.2014 31.12.2013
Investments in securities 211,642,483 192,949,383
1. in loans and deposits 31,338,557 27,659,541
2. Held-to-maturity 0 141,802,183
3. Available-for-sale 180,303,926 23,487,659
Other receivables and assets 671,392 712,170
Cash and cash equivalents 1,985,193 1,369,391
Total 214,299,067 195,030,944

70 ANNUAL REPORT 2014
Table 66: Maturity structure of receivables
Gross receivables Prva Group Skupina
(EUR) 31.12.2014 31.12.2013 31.12.2014 31.12.2013
Not matured 188,144 197,086 1,622,296 1,284,151
Up to 90 days 0 0 85,086 55,790
More than 90 days 0 0 29,840 186,176
Total 188,144 197,086 1,737,222 1,526,117
Receivable allowances Prva Group Skupina
(EUR) 31.12.2014 31.12.2013 31.12.2014 31.12.2013
Not matured 0 0 0 0
Up to 90 days 0 0 33,878 10,087
More than 90 days 0 0 26,416 167,563
Total 0 0 60,294 177,650
Carrying amount of receivables Prva Group Skupina
(EUR) 31.12.2014 31.12.2013 31.12.2014 31.12.2013
Not matured 188,144 197,086 1,622,296 1,284,151
Up to 90 days 0 0 51,208 45,703
More than 90 days 0 0 3,424 18,613
Total 188,144 197,086 1,676,928 1,348,467
30. LIQUIDITY RISK
The Company and the Group manage liquidity risk through cash flow forecasting. The Company uses cash flow
forecasts to take into account the maturity of financial investment including planned outflows which relate to
the Company’s operations.
Financial investments of the Company and the Group are financed with the Company’s capital. At the end of the
year, the Company and the Group report only liabilities for running costs with maturity of up to 3 months. The
following tables represent the structure of assets and liabilities according to maturities.
Table 67: Overview of the contractual liquidity of the financial assets and liabilities of Prva Group plc.
EUR
31.12.2014 31.12.2013
TOTAL Maturity up to 12 months
Maturity above 12 months
TOTAL Maturity up to 12 months
Maturity above 12 months
ASSETS
Investments 18.113.702 232.240 17.881.462 18.579.450 452.730 18.126.720
Share in subsidiaries 16.660.326 0 16.660.326 16.706.212 0 16.706.212
Share in associated company 0 0 0 0 0 0
Investments into securities 1.453.377 232.240 1.221.137 1.873.238 452.730 1.420.508
1. Held to maturity 0 0 0 0 0 0
2. Available-for-sale 1.453.377 232.240 1.221.137 1.873.238 452.730 1.420.508
Issued loans and deposits 1.972.416 1.142.416 830.000 2.516.740 2.516.740 0
Cash 41.782 41.782 0 55.195 55.195 0
Other receivables 188.144 188.144 0 197.086 197.086 0
Assets from financial contracts 0 0 0 0 0 0
TOTAL ASSETS 20.316.044 1.604.582 18.711.462 21.348.471 3.221.751 18.126.720
LIABILITIES
Other liabilities 16.369 16.369 0 1.494.261 1.494.261 0
TOTAL LIABILITIES 16.369 16.369 0 1.494.261 1.494.261 0

ANNUAL REPORT 2014 71
Table 68: Overview of the contractual liquidity of the financial assets and liabilities of the Group
EUR
31.12.2014 31.12.2013
TOTAL Maturity up
to 12 months
Maturity above 12
months TOTAL
Maturity up to 12
months
Maturity above 12
months
ASSETS
Investments 33,394,559 5,524,768 27,869,791 26,506,555 2,650,972 23,855,583
Share in associated company 0 0 0 0 0 0
Assets of unit-linked insurants 1,458,080 0 1,458,080 1,043,151 0 1,043,151
Investments into securities 31,936,479 5,524,768 26,411,711 25,463,404 2,650,972 22,812,432
1. Held to maturity 0 0 0 18,002,101 1,179,523 16,822,578
2. Available for sale 31,175,836 5,492,203 25,683,633 6,826,440 1,429,252 5,397,188
3. Measured at fair value through profit or loss
760,643 32,565 728,078 634,863 42,197 592,666
Issued loans and deposits 7,721,494 3,757,948 3,963,546 8,144,757 7,044,133 1,100,624
Cash 1,510,462 1,510,462 0 1,134,137 1,134,137 0
Other receivables 1,676,928 1,676,928 0 1,348,467 1,348,467 0
Assets from financial contracts 237,782,319 51,049,833 186,732,486 220,001,692 17,771,972 202,229,720
TOTAL ASSETS 282,085,763 63,519,939 218,565,824 257,135,608 29,949,681 227,185,927
LIABILITIES
Other liabilities 1,502,476 1,502,476 0 2,392,375 2,392,375 0
Liabilities from financial contracts 237,435,509 19,060,403 218,375,106 220,001,692 17,771,972 202,229,720
TOTAL LIABILITIES 222,394,067 20,164,347 202,229,720 222,394,067 20,164,347 202,229,720
Table 69: Overview of the structure of liabilities of Prva Group considering expected non-discounted cash flow
in 2014
The Company 31.12.2014
EUR Maturity up to 1
year
Maturity from 1 to
5 years
Maturity more than
5 years Up to 1 year
/ demand Total Carrying amount
ASSETS
Deferred tax assets 0 339,581 0 0 339,581 339,581
Investments into securities 108,997 1,222,794 118,019 0 1,449,809 1,453,377
1, Held-to-maturity 0 0 0 0 0 0
2, Available-for-sale 108,997 1,222,794 118,019 114,749 1,564,558 1,453,377
3, Investments into securities designated at fair value through profit or loss
0 0 0 0 0 0
Deferred expenses and accrued income 1,098 0 0 0 1,098 1,098
Assets from financial contracts 0 0 0 0 0 0
Issued loans and deposits 1,155,739 849,112 0 0 2,004,852 1,972,416
Other receivables 188,144 0 0 0 188,144 188,144
Cash 0 0 0 41,782 41,782 41,782
TOTAL ASSETS 1,793,559 2,071,906 118,019 156,531 4,140,015 3,996,398
LIABILITIES
Other liabilities and short-term accrued costs and deferred income
16,369 0 0 0 16,369 16,369
TOTAL LIABILITIES 16,369 0 0 0 16,369 16,369

72 ANNUAL REPORT 2014
Table 70: Overview of the structure of assets and liabilities of Prva Group considering expected non-discounted
cash flow in 2013
The Company 31.12.2013
EUR Maturity up to 1
year
Maturity from 1 to
5 years
Maturity more than
5 years Up to 1 year
/ demand Total Carrying amount
ASSETS
Deferred tax assets 0 413,486 0 0 413,486 413,486
Investments into securities 416,914 385,770 202,117 0 1,004,801 887,298
1. Held-to-maturity 0 0 0 0 0 0
2. Available-for-sale 416,914 385,770 202,117 0 1,004,801 887,298 3. Investments into securities designated at fair value through profit or loss 0 0 0 0 0 0
Deferred expenses and accrued income 15,428 0 0 0 15,428 15,428
Assets from financial contracts 0 0 0 0 0 0
Issued loans and deposits 2,592,242 0 0 48,019 2,640,261 2,516,740
Other receivables 197,086 0 0 0 197,086 197,086
Cash 55,195 0 0 0 55,195 55,195
TOTAL ASSETS 3,690,351 385,770 202,117 48,019 4,326,257 4,085,233
LIABILITIES
Other liabilities and short-term accrued costs and deferred income 1,494,261 0 0 0 1,494,261 1,494,261
TOTAL LIABILITIES 1,494,261 0 0 0 1,494,261 1,494,261
Table 71: Overview of the structure of assets and liabilities of the Group considering expected non-discounted
cash flow in 2014
The Group 31.12.2014
EUR Maturity up
to 1 year
Maturity from 1 to 5
years
Maturity more than 5
years
Up to 1 year /
demand Total
Carrying amount
ASSETS
Investments into securities 5,579,690 15,084,095 7,542,048 5,843,409 34,049,242 31,936,479
1. Held to maturity 0 0 0 0 0 0
2. Available for sale 5,547,125 14,999,426 7,499,713 5,192,109 33,238,373 31,175,836
3. Held for trading 32,565 84,669 42,335 651,300 810,869 760,643
Assets of unit-linked insurants Risk
0 0 1,458,080 0 1,458,080 1,458,080
Issued loans and deposits 3,795,528 4,003,182 0 0 7,798,709 7,721,494
Cash 1,510,462 0 0 0 1,510,462 1,510,462
Other receivables 1,676,928 0 0 0 1,676,928 1,676,928
Assets from financial contracts 33,977,778 144,757,983 63,099,398 25,999,837 267,834,996 237,782,319
TOTAL ASSETS 46,540,386 163,845,260 72,099,526 31,843,246 314,328,418 282,085,763
LIABILITIES
Other liabilities 1,502,476 0 0 0 1,502,476 1,502,476
Liabilities from financial contracts 19,060,403 30,869,009 187,506,097 0 237,435,509 237,435,509
TOTAL LIABILITIES 20,562,879 30,869,009 187,506,097 0 238,937,985 238,937,985

ANNUAL REPORT 2014 73
Table 72: Overview of the structure of assets and liabilities of the Group considering expected non-discounted
cash flow in 2013
The Group 31.12.2013
EUR Maturity up
to 1 year
Maturity from 1 to 5
years
Maturity more than 5
years Up to 1 year
/ demand Total Carrying amount
ASSETS
Investments into securities 3,173,650 15,978,222 6,438,010 1,491,814 27,081,696 25,463,404
1. Held to maturity 1,240,157 10,976,438 6,226,298 0 18,442,893 18,002,101
2. Available for sale 1,889,978 4,930,661 204,422 545,526 7,570,587 6,826,440
3. Held for trading 43,515 71,123 7,290 946,288 1,068,216 634,863 Assets of unit-linked insurants Risk 0 0 1,043,151 0 1,043,151 1,043,151
Issued loans and deposits 7,397,414 758,074 0 48,019 8,203,507 8,144,757
Cash 1,134,137 0 0 0 1,134,137 1,134,137
Other receivables 1,348,467 0 0 0 1,348,467 1,348,467
Assets from financial contracts 28,774,787 128,122,711 83,497,821 24,970,747 265,366,066 220,001,692
TOTAL ASSETS 41,828,455 144,859,007 90,978,982 26,510,580 265,366,066 257,135,608
LIABILITIES
Other liabilities 2,392,375 0 0 0 2,392,375 2,392,375 Liabilities from financial contracts 17,771,972 27,028,396 220,565,698 0 265,366,066 220,001,692
TOTAL LIABILITIES 20,164,347 27,028,396 220,565,698 0 267,758,441 222,394,067
31. INTEREST RATE RISK
The exposure of the Company and the Group to changes in market interest rates is very low as they did not have
investments with variable interest rate on 31.12.2014 (as on 31.12.2013).
An overview of the classification of assets per fixed and variable interest rate per type of financial investment is
presented in the disclosure of investments.
The Company and the Group adopt decisions for mitigating interest risk on the basis of active monitoring of the
development of events on international capital markets. At the same time, interest rate risk of funds managed
by Prva osebna zavarovalnica relates to guaranteed return that the fund must ensure to policyholders in line with
pension schemes. The Group mitigates its interest rate risk through active portfolio management.
Table 73: Interest rate risk - pension funds
Change in market interest rate
2014 2013
Impact on assets Impact on assets
(EUR) (EUR)
+/-10 bps 3,362 8,013
32. CURRENCY RISK
The Group's liabilities and receivables are converted according to the reference exchange rate of the European
Central Bank as at 31 December 2014. Due to regulating exposure by currencies on individual level of
subsidiaries, the Group is not exposed to major currency risk. Foreign currency translation reserves arising due
to exchange rates are recognized through statement of comprehensive income.
As at 31 December 2014 the pension funds have no investments in foreign currency. All liabilities are
denominated in euro.
Table below represents sensitivity to changes in important currencies to which the Group is exposed given that
all other parameters remain the same.
The MKD currency represents the volatility in the assets of the Macedonian subsidiary. The same applies to
bonds denominated in RSD which are included in the portfolio of the Belgrade subsidiary. The Group has
lowered its exposure to BAM to zero, as it has sold all the shares of Nova Banka Bjelina.
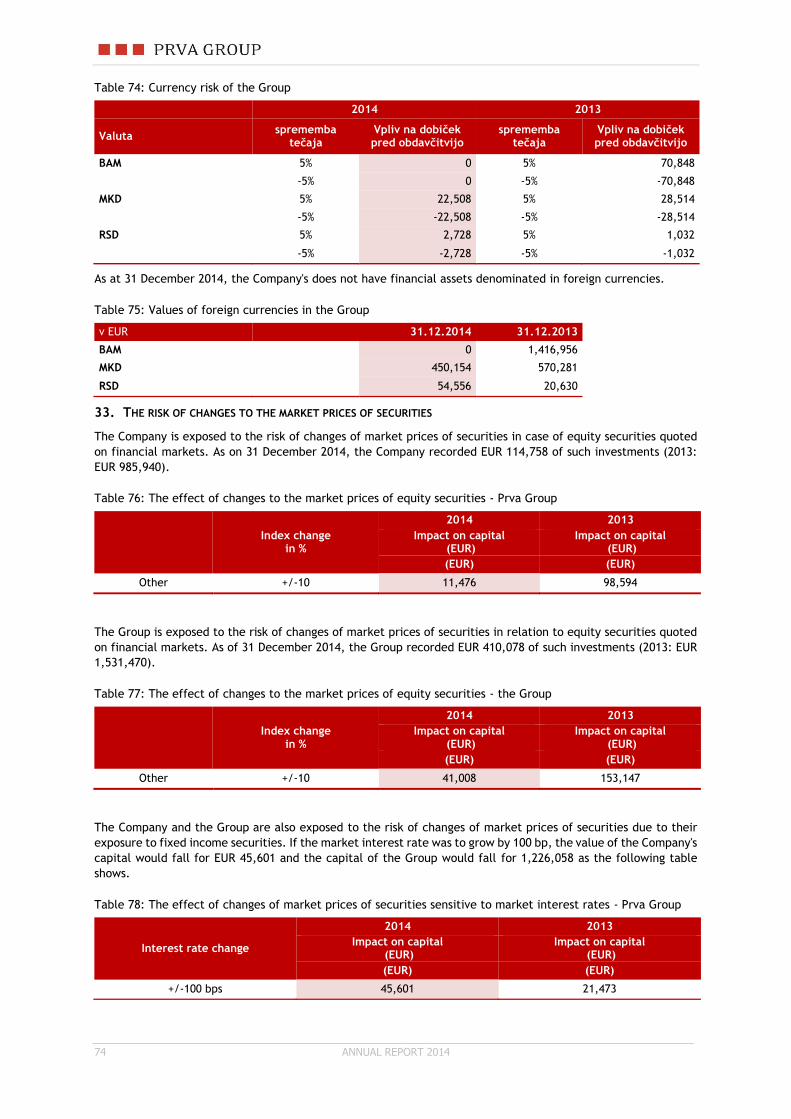
74 ANNUAL REPORT 2014
Table 74: Currency risk of the Group
2014 2013
Valuta sprememba
tečaja Vpliv na dobiček pred obdavčitvijo
sprememba tečaja
Vpliv na dobiček pred obdavčitvijo
BAM 5% 0 5% 70,848
-5% 0 -5% -70,848
MKD 5% 22,508 5% 28,514
-5% -22,508 -5% -28,514
RSD 5% 2,728 5% 1,032
-5% -2,728 -5% -1,032
As at 31 December 2014, the Company's does not have financial assets denominated in foreign currencies.
Table 75: Values of foreign currencies in the Group
v EUR 31.12.2014 31.12.2013
BAM 0 1,416,956
MKD 450,154 570,281
RSD 54,556 20,630
33. THE RISK OF CHANGES TO THE MARKET PRICES OF SECURITIES
The Company is exposed to the risk of changes of market prices of securities in case of equity securities quoted
on financial markets. As on 31 December 2014, the Company recorded EUR 114,758 of such investments (2013:
EUR 985,940).
Table 76: The effect of changes to the market prices of equity securities - Prva Group
Index change
in %
2014 2013
Impact on capital (EUR)
Impact on capital (EUR)
(EUR) (EUR)
Other +/-10 11,476 98,594
The Group is exposed to the risk of changes of market prices of securities in relation to equity securities quoted
on financial markets. As of 31 December 2014, the Group recorded EUR 410,078 of such investments (2013: EUR
1,531,470).
Table 77: The effect of changes to the market prices of equity securities - the Group
Index change
in %
2014 2013
Impact on capital (EUR)
Impact on capital (EUR)
(EUR) (EUR)
Other +/-10 41,008 153,147
The Company and the Group are also exposed to the risk of changes of market prices of securities due to their
exposure to fixed income securities. If the market interest rate was to grow by 100 bp, the value of the Company's
capital would fall for EUR 45,601 and the capital of the Group would fall for 1,226,058 as the following table
shows.
Table 78: The effect of changes of market prices of securities sensitive to market interest rates - Prva Group
Interest rate change
2014 2013
Impact on capital (EUR)
Impact on capital (EUR)
(EUR) (EUR)
+/-100 bps 45,601 21,473

ANNUAL REPORT 2014 75
Table 79: The effect of changes of market prices of securities sensitive to market interest rates – the Group
Interest rate change
2014 2013
Impact on capital (EUR)
Impact on capital (EUR)
(EUR) (EUR)
+/-100 bps 1,226,058 135,873
Neither of the illustrations above includes securities of the long-term business fund carrying investment risk,
with respect to which the insurance company is not exposed to market risk as a result of the management
arrangement.
34. FAIR VALUE
Table 80: Overview of the carrying and fair value of financial instruments of the Company
EUR Carrying amount Fair value
31.12.2014 31.12.2013 31.12.2014 31.12.2013
Total financial assets 6,515,497 6,515,497 6,515,497 6,515,497
Investment into securities: 1,453,377 1,873,238 1,453,377 1,873,238
1. Held to maturity 0 0 0 0
2. Available for sale 1,453,377 1,873,238 1,453,377 1,873,238
Issued loans and deposits 1,972,416 2,516,740 1,972,416 2,516,740
Trade receivables (insurants) 0 0 0 0
Other receivables (assets) 188,144 197,086 188,144 197,086
Cash 41,782 55,195 41,782 55,195
Assets on accounts of pension insurance holders 0 0 0 0
Table 81: Overview of the carrying and fair value of financial instruments held by the Group
EUR Carrying amount Fair value
31.12.2014 31.12.2013 31.12.2014 31.12.2013
Total financial assets 282,085,763 257,135,607 282,085,763 265,709,324
Investment into securities: 31,936,479 25,463,405 31,936,479 25,516,594
1. Held to maturity 0 18,002,101 0 18,055,291
2. Available for sale 31,175,836 6,826,440 31,175,836 6,826,440
3. Designated at fair value through profit or loss 760,643 634,863 760,643 634,863
Issued loans and deposits 7,721,494 8,144,757 7,721,494 8,144,757
Trade receivables (insurants) 145,589 148,733 145,589 148,733
Other receivables (assets) 1,531,339 1,199,733 1,531,339 1,199,733
Cash 1,510,462 1,134,137 1,510,462 1,134,137
Investments in favour of unit-linked insurants 1,458,080 1,043,151 1,458,080 1,043,151
Assets on accounts of pension insurance holders 237,782,319 220,001,692 237,782,319 228,522,219
Total financial liabilities 238,813,613 221,026,428 238,813,613 229,546,955
Liabilities to pension insurance holders 237,435,509 220,001,692 237,435,509 228,522,219
ZTR in favour of unit-linked insurants 1,378,104 1,024,736 1,378,104 1,024,736
34.1 Assets and liabilities according to fair value hierarchy
In fair value measurement of assets and liabilities, the Company and the Group followed the following fair value
hierarchy:
Level 1: quoted prices in active markets for identical assets (quoted prices and generic prices from the
Bloomberg system).

76 ANNUAL REPORT 2014
Level 2 comparable market prices (other than quoted prices of identical assets) obtained directly or
indirectly for identical or similar assets and also includes the generic prices obtained in the Bloomberg
sxtem.
Level 3: the use of valuation models using mostly unobservable market inputs.
Table 82: Assets and liabilities of the Company in terms of fair value hierarchy in 2014
EUR Level 1 Level 2 Level 3 Total
ASSETS at fair value
Investments 1,453,377 0 0 1,453,377
Investments into securities 1,453,377 0 0 1,453,377
Held for sale 1,453,377 0 0 1,453,377
ASSETS whose fair value is disclosed
Receivables 0 0 188,144 188,144
Issued loans and deposits 0 0 1,972,416 1,972,416
Cash 41,782 0 0 41,782
LIABILITIES whose fair value is disclosed
Other liabilities 16,369 0 0 16,369
There were no transfers from level 1 to level 2 or 3 in 2014.
Table 83: Assets and liabilities of the Company in terms of fair value hierarchy in 2013
EUR Level 1 Level 2 Level 3 Total
ASSETS at fair value
Investments 1,720,436 0 0 1,873,238
Investments into securities 1,873,238 0 0 1,873,238
Held for sale 1,873,238 0 0 1,873,238
ASSETS whose fair value is disclosed
Receivables 0 0 197,086 197,086
Issued loans and deposits 0 0 2,516,740 2,516,740
Cash 55,195 0 0 55,195
LIABILITIES whose fair value is disclosed
Other liabilities 0 0 1,494,261 1,494,261
Table 84: Assets and liabilities of the Group in terms of fair value hierarchy in 2014
EUR Level 1 Level 2 Level 3 Total
ASSETS at fair value 5,969,891 27,412,151 12,517 33,394,559
Investments 5,969,891 27,412,151 12,517 33,394,559
Assets of unit-linked policyholders 522,942 922,621 12,517 1,458,080
Investments into securities 5,446,948 26,489,530 0 31,936,479
Designated at fair value through profit or loss 760,643 0 0 760,643
Held for sale 2,341,284 24,456,164 0 26,797,448
ASSETS whose fair value is disclosed 11,886,392 172,734,702 64,070,110 248,691,204
Receivables 0 0 1,676,928 1,676,928
Assets from financial contracts 10,375,931 172,734,702 54,671,687 237,782,319
Issued loans and deposits 0 0 7,721,494 7,721,494
Cash 1,510,462 0 0 1,510,462
LIABILITIES whose fair value is disclosed 0 0 254,034,957 254,034,957
Technical provisions 0 0 13,718,867 13,718,867
ZTR in favour of unit-linked insurants 0 0 1,378,104 1,378,104
Other liabilities 0 0 1,502,476 1,502,476
Liabilities from financial contracts 0 0 237,435,509 237,435,509

ANNUAL REPORT 2014 77
In order to reach the required return, to manage liquidity requirements and due to asset liability management
the Group sold / reclassified part of the securities in 2014, which it had previously classified as held-to-maturity
(HTM). Given the significance of sales / reclassification The Group had to reclassify complete HTM portfolio and
marked it to market in accordance with IFRS. Since Group values certain investments at BGN model (®Bloomberg)
it ha to transfer them to level 2. The amount of securities that were transferred to level 2 was € 22,665,546.
There were no other transfers between the levels in 2014.
Table 85: Assets and liabilities of the Group in terms of fair value hierarchy in 2013
EUR Level 1 Level 2 Level 3 Total
ASSETS at fair value 8,407,500 0 86,931 8,494,431
Investments 8,407,500 0 86,931 8,494,431
Assets of unit-linked policyholders 946,197 0 86,931 1,033,128
Investments into securities 7,461,303 0 0 7,461,303
Designated at fair value through profit or loss 634,863 0 0 634,863
Held for sale 6,826,440 0 0 6,826,440
ASSETS whose fair value is disclosed 23,282,113 1,429,312 225,330,778 250,042,203
Investments into securities 0 0 18,002,101 18,002,101
Held to maturity 0 0 18,002,101 18,002,101
Receivables 0 0 1,348,467 1,348,467
Assets of unit-linked policyholders (loans and deposits) 0 0 10,023 10,023
Assets from financial contracts 22,147,976 1,429,312 196,424,404 220,001,692
Issued loans and deposits 0 0 8,144,757 8,144,757
Cash 1,134,137 0 0 1,134,137
LIABILITIES whose fair value is disclosed 22,147,976 1,429,312 209,411,102 232,988,390
Technical provisions 0 0 9,492,426 9,492,426
ZTR in favour of unit-linked insurants 0 0 1,024,736 1,024,736
Borrowings 0 0 77,161 77,161
Other liabilities 0 0 2,392,375 2,392,375
Liabilities from financial contracts 0 0 220,001,692 220,001,692
Table 86: Level 3 valuation technique
Investments into securities - Level 3
Valuation techniques
Significant assumptions Valuation technique's sensitivity to inputs and market value impact
Non-marketable equity securities
The model takes into account the median of the ratio between the market and carrying price (P/B ratio) and the median of the ratio between the total value of the company, its market price, and earnings per share (P/E ratio) for comparable entities.
Inputs from entities in the comparable sector are based on the latest available business information (annual reports for 2013).
Liquidity discount for non-marketable securities of between 10 and 20% is considered.
Changes in prices and/or valuation of comparable entities and subsequent change in the P/E and P/B ratios.
In the event of a 20% fall in stock markets or share prices and subsequent reduction in ratios, the market value of total portfolio would on average fall by 0.3% assuming that all other parameters remain unchanged.

78 ANNUAL REPORT 2014
35. OTHER DETAILS
Prva Group had not issued any participation rights instruments, convertible bonds or similar securities or issued
rights.
36. SIGNIFICANT SUBSEQUENT EVENTS
No events or circumstances occurred after the reporting date that would impact the financial statements for the
year ended 31 December 2014.

ANNUAL REPORT 2014 79
14. INDEX OF TABLES
Table 1: Ten largest shareholders of ordinary and preference shares of Prva Group, plc. as at 31 December 2014 ....................................................................................................................................................... 10
Table 2: Main Economic Indicators - Slovenia: .............................................................................................. 11 Table 3: Market capitalisation of the Ljubljana Stock Exchange ...................................................................... 14 Table 4: Key financial indicators of Prva Group plc. and the Group ................................................................. 18 Table 5: The number of employees by level of education as at 31 December 2014 .......................................... 19 Table 6: Investments into subsidiary and associated companies as at 31 December 2014 ................................ 30 Table 7: Geographical segments ................................................................................................................. 47 Table 8: Operating segments ...................................................................................................................... 48 Table 9: Net income from insurance premiums ............................................................................................. 48 Table 10: Other insurance income ............................................................................................................... 49 Table 11: Interest income ........................................................................................................................... 49 Table 12: Interest expense ......................................................................................................................... 49 Table 13: Dividend Income ......................................................................................................................... 50 Table 14: Net gains/losses from investments ................................................................................................ 50 Table 15: Net expenses for claims ............................................................................................................... 50 Table 16: Changes in technical provisions .................................................................................................... 51 Table 17: Costs of acquiring insurants ......................................................................................................... 51 Table 18: Employee benefit costs ................................................................................................................ 51 Table 19: Other costs ................................................................................................................................. 52 Table 20: Audit fees ................................................................................................................................... 52 Table 21: Other expenses ........................................................................................................................... 52 Table 22: Deferred tax - Prva Group ............................................................................................................ 53 Table 23: Deferred tax – The Group ............................................................................................................ 53 Table 24: Reconciliation of tax and accounting profit multiplied by the tax rate applicable in Slovenia ................ 54 Table 25: Earnings per share ...................................................................................................................... 54 Table 26: Movement in property, plant and equipment in 2014 ...................................................................... 55 Table 27: Movement in property, plant and equipment in 2013 ...................................................................... 55 Table 28: Movements in intangible fixed assets in 2014 ................................................................................. 56 Table 29: Movements in intangible assets in 2013......................................................................................... 56 Table 30: Interests in subsidiaries ............................................................................................................... 57 Table 31: Assets of unit-linked policy holders ............................................................................................... 57 Table 32: Investments in securities ............................................................................................................. 57 Table 33: Structure of securities based on type of interest rate ...................................................................... 58 Table 34: Investments in securities held to maturity ..................................................................................... 58 Table 35: Investments in securities, available for sale ................................................................................... 58 Table 36: Investments in securities measured at fair value through profit and loss .......................................... 59 Table 37: Other receivables and short-term deferred costs and accrued income .............................................. 59 Table 38: Assets from financial contracts ..................................................................................................... 59 Table 39: Assets less receivables on accounts of pension insurants ................................................................ 60 Table 40: Movement in investments on accounts of pension insurants ............................................................ 60 Table 41: Structure of securities based on type of interest rate on accounts of policy holders of Prva osebna
zavarovalnica .................................................................................................................................... 61 Table 42: Issued loans and deposits ............................................................................................................ 61 Table 43: Cash and cash equivalents ........................................................................................................... 61 Table 44: Share capital ............................................................................................................................... 62 Table 45: Number of issued and paid-up shares ........................................................................................... 62 Table 46: The structure and movement of reserves in 2014 ........................................................................... 62 Table 47: The structure and movement of reserves in 2013 ........................................................................... 62 Table 48: Technical provisions .................................................................................................................... 63 Table 49: Liabilities from financial contracts ................................................................................................. 63 Table 50: Other liabilities from financial contracts ......................................................................................... 63 Table 51: Net liabilities to pension policyholders ........................................................................................... 64 Table 52: Movement in liabilities due to pension insurance policyholders in 2013 and 2012 .............................. 64 Table 53: Liabilities .................................................................................................................................... 65 Table 54: Movements in rent liabilities (EUR) ................................................................................................ 65 Table 55: Assets of long-term business funds of subsidiaries abroad recognised in the off balance sheet items
(Group disclosure) ............................................................................................................................. 65 Table 56: Costs of the Management and Supervisory Boards (including attendance fees of subsidiaries) for Prva
Group .............................................................................................................................................. 65 Table 57: Remunerations to members of the Management and Supervisory Boards of Prva Group plc. in 2014 ... 66 Table 58: Remunerations to members of the Management and Supervisory Boards of Prva Group plc. in 2013 ... 66 Table 59: Transactions of Prva Group plc. with subsidiaries in 2014 ................................................................ 67

80 ANNUAL REPORT 2014
Table 60: The credit quality of the financial assets of Prva Group plc. ............................................................. 68 Table 61: The credit quality of the financial assets of the Group ..................................................................... 68 Table 62: the structure of assets of Prva Group plc. exposed to credit risk .................................................... 68 Table 63: the structure of assets of the Group plc. to credit risk .................................................................. 69 Table 64: The credit quality of the financial investments of pension funds ....................................................... 69 Table 65: Credit risk structure of pension funds per investment type .............................................................. 69 Table 66: Maturity structure of receivables ................................................................................................... 70 Table 67: Overview of the contractual liquidity of the financial assets and liabilities of Prva Group plc. .............. 70 Table 68: Overview of the contractual liquidity of the financial assets and liabilities of the Group ...................... 71 Table 69: Overview of the structure of liabilities of Prva Group considering expected non-discounted cash flow in
2014 ................................................................................................................................................ 71 Table 70: Overview of the structure of assets and liabilities of Prva Group considering expected non-discounted
cash flow in 2013 .............................................................................................................................. 72 Table 71: Overview of the structure of assets and liabilities of the Group considering expected non-discounted
cash flow in 2014 .............................................................................................................................. 72 Table 72: Overview of the structure of assets and liabilities of the Group considering expected non-discounted
cash flow in 2013 .............................................................................................................................. 73 Table 73: Interest rate risk - pension funds .................................................................................................. 73 Table 74: Currency risk of the Group ........................................................................................................... 74 Table 75: Values of foreign currencies in the Group ...................................................................................... 74 Table 76: The effect of changes to the market prices of equity securities - Prva Group ..................................... 74 Table 77: The effect of changes to the market prices of equity securities - the Group ...................................... 74 Table 78: The effect of changes of market prices of securities sensitive to market interest rates - Prva Group .... 74 Table 79: The effect of changes of market prices of securities sensitive to market interest rates – the Group ..... 75 Table 80: Overview of the carrying and fair value of financial instruments of the Company ............................... 75 Table 81: Overview of the carrying and fair value of financial instruments held by the Group ............................ 75 Table 82: Assets and liabilities of the Company in terms of fair value hierarchy in 2014 .................................... 76 Table 83: Assets and liabilities of the Company in terms of fair value hierarchy in 2013 .................................... 76 Table 84: Assets and liabilities of the Group in terms of fair value hierarchy in 2014 ........................................ 76 Table 85: Assets and liabilities of the Group in terms of fair value hierarchy in 2013 ........................................ 77 Table 86: Level 3 valuation technique .......................................................................................................... 77
15. INDEX OF DIAGRAMS
Graph 1: Key interest rate trend of the ECB and 3 M Euribor in 2014 .............................................................. 12 Graph 2: Rate of return trend of Slovene and German 10-year state bonds in 2014 ......................................... 13 Graph 3: Risk premium trend of 5- and 10-year corporate bonds in 2014 ........................................................ 13 Graph 4: SBITOP index in 2014 ................................................................................................................... 14 Graph 5: DAX 30 index in 2014 ................................................................................................................... 15 Graph 6: S&P 500 index in 2014 .................................................................................................................. 15 Graph 7: Commodities index S&P GSCI Total Return in 2014 ......................................................................... 16 Graph 8: Gold spot price in 2014 ................................................................................................................. 16 Graph 9: CL1 oil price in 2014 ..................................................................................................................... 17
Related Documents


