CHRYSLER KOKOMO CASTING PLANT LIGHTING AUDIT REPORT ECET 53500 Energy Management

Audit Report
Dec 14, 2015
Application of Energy management
Welcome message from author
This document is posted to help you gain knowledge. Please leave a comment to let me know what you think about it! Share it to your friends and learn new things together.
Transcript

CHRYSLER KOKOMO CASTING PLANT LIGHTING AUDIT REPORT
ECET 53500 Energy Management

Building InformationAddress: 1001 East Boulevard, Kokomo , Indiana , United States Floor Space: 625,000 square feet Products: Aluminum parts for automotive components, transmission and transaxle cases; engine block castings Employment: 1,245 (1,190 hourly; 155 salaried) Mechanical Systems: Primarily die cast machines and furnacesSources of energy: Main sources of energy are electric and natural gasOperating schedule: 24/7 production, labor schedule in offices.
Lighting systems
Administration Area• Recently halogen to LED in all offices, break room areas, bathrooms, etc. • voltage 120-277V. • The fixtures used are Lithonia 2RTL4 48L D49 LP850 N100.• Hours of operation: 24 hours• Future initiatives: Add occupation sensors to shut the lights off when no
movement is detected.
Plant Production Areas• Recently, 250 W induction fixtures instead 400W pulse-start metal halide fixtures.• Hours of operation: 24/7 • Operating voltages: varies between 480V and 277V. There are also lights at 120V
in the old building. • Future initiatives: Corporate Chrysler has suggested to use the T8 fixtures.

Exterior Areas• Replacing with LED lights in all outside areas. • only when it is dark outside. • Most are currently run with a timer but I in the future they could be changed to photo-eyes. • Parking lot and out front lights works with 480V a• Lithonia Fixture DSX2 80C 1000 50K T3M MVOLT RPA DDBXD. • Under outside mezzanine is 120V and the fixtures recently installed are Kenall MS11FD-PP-MW-26L50K-1-DV.
Fan Rooms/Substations • Removing lights and putting in sealed LEDs. • On couple hours each day. • No occupation sensors • Light fixture used: Kenall MS11FD-PP-MW-26L50K-1-DV. • Operating voltages: 120V.
Basements• Similar as the fan rooms and substations except that they are on 24/7 due to cameras monitoring scrap conveyors.

Utility Summary
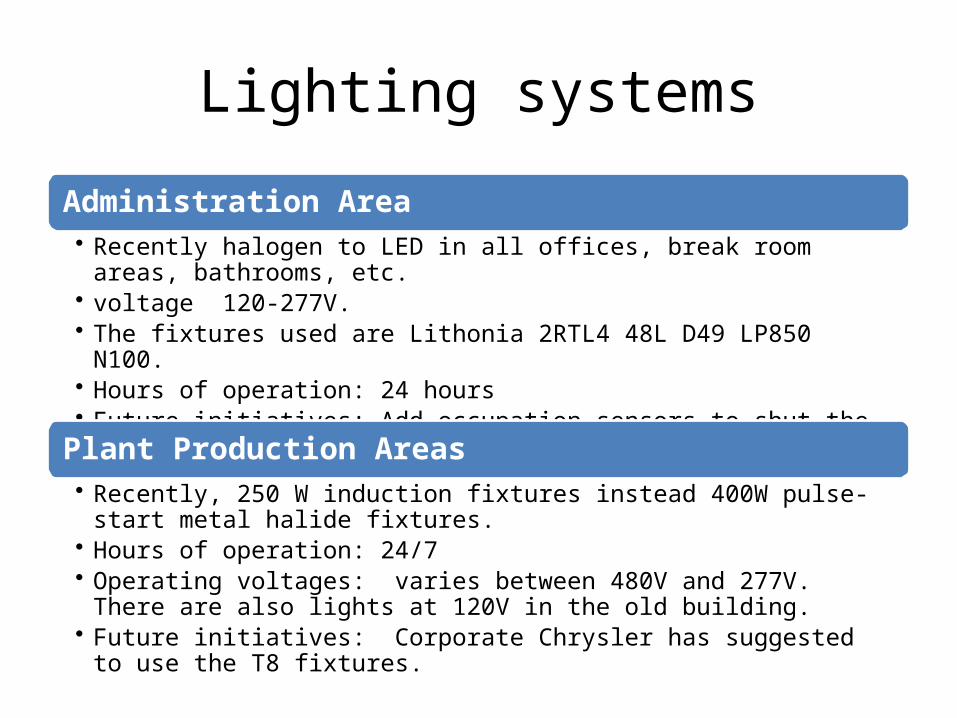
Electricity AnalysisTotal $
Meter 106917141
KWh Usage
Meter 106917139
KWh Usage
Meter 106917140
KWh Usage Billed KWhsep-13 2.677.411,28$ 9882288 13831728 12071688 35785704,00oct-13 2.531.962,78$ 9706872 12857520 11306520 33870912,00
nov-13 2.537.419,71$ 10839192 13896480 11961240 36696912,00dic-13 2.428.053,09$ 9870312 12562392 10128312 32561016,00
ene-14 2.407.659,42$ 9459240 12097800 10407816 31964856,00feb-14 2.454.208,09$ 9669504 12220968 10902528 32793000,00mar-14 2.575.823,30$ 11031840 13366272 11724600 36122712,00abr-14 2.462.531,73$ 9819288 12293856 10895352 33008496,00
may-14 2.735.169,22$ 10580568 13788380 12491852 36860800,00jun-14 3.080.686,73$ 11600040 15246240 13873104 40719384,00jul-14 2.875.230,83$ 10915392 14095488 12594792 37605672,00
Actual KW Actual KvaPower factor Billed Kvar
Date of Peak
Time of peak
Average cost per
KWhsep-13 62400,00 70532,60 88,50% 32880,00 11/09/2013 9:00:00 0,0748$ oct-13 58272,00 65829,00 88,50% 30624,00 03/10/2013 14:00:00 0,0748$
nov-13 53568,00 59869,40 89,50% 26736,00 13/11/2013 10:30:00 0,0691$ dic-13 53136,00 59832,30 88,80% 27504,00 12/10/2013 10:00:00 0,0746$
ene-14 54000,00 60842,40 88,80% 28032,00 01/22/2014 10:00:00 0,0753$ feb-14 54672,00 61200,50 89,30% 27504,00 02/27/2014 10:00:00 0,0748$ mar-14 54480,00 61246,80 89,00% 27984,00 04/16/2014 11:30:00 0,0713$ abr-14 54816,00 61329,14 89,38% 27504,00 0,0746$
may-14 60528,00 60074,10 88,90% 31152,00 06/03/2014 7:30:00 0,0742$ jun-14 61920,00 69707,30 88,80% 32016,00 06/18/2014 12:00:00 0,0757$ jul-14 61488,00 69169,30 88,90% 31680,00 07/22/2014 13:00:00 0,0765$

KWh use
smaller during the winter months and higher in the summer months.
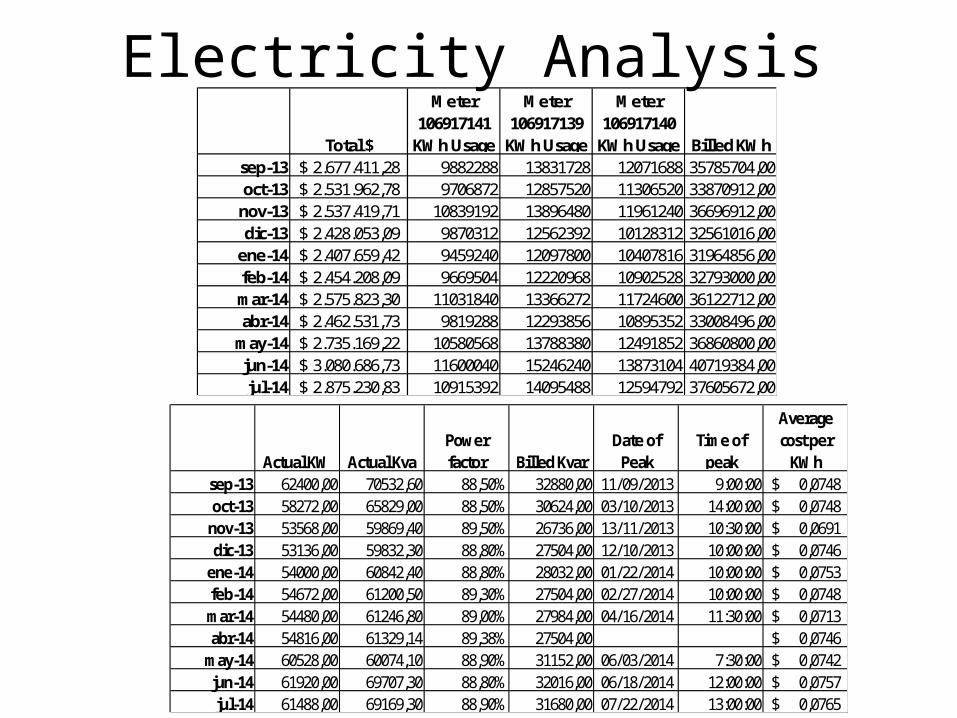
KW profile
Similar pattern than the KWh usage

PF
Fluctuating between 88.5% and 89.5%. Around $8000 per month.

Gas Analysis
2013 Volume
Commodity price
(NYMEX Strip)/Actual
Consumed MMBtu
Commodity Cost
Distribution Cost
Total Cost 2013
Cost per MMBtu
Consumed Jan 174023,00 $3,3540 55.999 $206.094 $14.115 $220.209 $3,9324 Feb 175395,00 $3,2260 50.164 $175.450 $13.402 $188.852 $3,7647 Mar 189637,00 $3,4270 50.342 $197.084 $13.880 $210.964 $4,1906 Apr 189471,00 $3,9760 33.401 $148.003 $10.655 $158.658 $4,7501 May 190472,00 $4,1520 27.462 $125.425 $8.906 $134.331 $4,8915 Jun 187817,00 $4,1480 26.888 $122.630 $8.741 $131.371 $4,8859 Jul 196570,00 $3,7070 28.172 $114.336 $9.078 $123.414 $4,3807
Aug 216050,00 $3,4590 27.067 $103.660 $8.787 $112.447 $4,1544 Sep 209374,00 $3,5670 24.819 $97.608 $8.205 $105.813 $4,2634 Oct 231040,00 $3,4980 31.051 $120.902 $9.598 $130.500 $4,2028 Nov 219915,00 $3,4960 43.728 $169.158 $11.495 $180.653 $4,1313 Dec 173303,00 $3,8180 52.703 $222.610 $15.207 $237.817 $4,5124
Contrary to electricity pattern.

Energy Utilization Index (EUI)

Energy Conservation of Lighting System ROW 20 - 30
High temperature and an amount of lube/steam mist the die cast machines generate.
Relamped with the 250 W induction fixtures AGT-GC01C-W250-UNV-5000K instead of 400W pulse-start metal halide fixtures.
64 fixtures hanging from the ceiling. The light is used to illuminate the corridor and machinery as is shown in Figure 10 .
The operator tables at the die cast machines have T8 fixtures whose lenses mostly are dirty.
No controls for the plant production lights.

2D Row 20 – 30 Plot

3D Row 20 – 30 Plot


Foot Candle Measurements
A B C D1 45 27 33 142 45 42 47 453 34 40 43 464 45 41 40 455 34 44 45 356 45 47 49 437 82 51 50 458 45 55 44 459 35 54 54 53
10 82 56 51 4411 63 58 50 2412 45 51 43 5313 12 36 42 31
A B C D1 17 11 10 72 17 10 11 173 5 13 13 464 17 12 13 55 5 13 14 356 17 13 14 437 62 15 15 178 17 16 15 179 6 17 18 53
10 62 18 18 4411 63 20 19 2412 17 21 20 5313 12 19 18 16
ROW 20 - 30 ROW 60 - 70
Working spaces where visual tasks are only occasional performed: Category C, 10 - 15- 20 foot candles. Performance of visual tasks of medium contrast or small size: Category E, 50-75-100

Illuminance profileROW 20 - 30 ROW 60 - 70

ECM Descriptionfoot candle levels very high in the corridor and in the machine areas, but between machines the levels are low. Some levels in the operator tables are high because of the T8 fixtures.
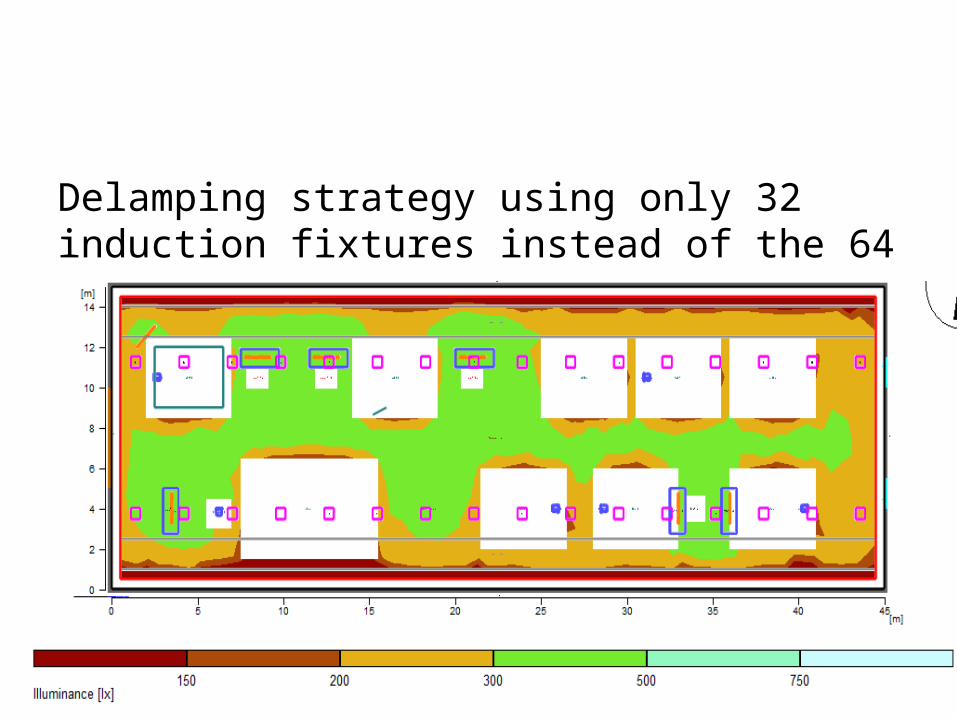
Delamping strategy using only 32 induction fixtures instead of the 64

($5045.76*0.30) = $1513.73 per year
With Motion sensors:

Renewable energy or DG integration
KWfixture
Wfixtures 8
250$32
KWhmonth
days
day
hoursKW 576030248
The Power needed is:
The energy needed per month is :
Initial Economic Comparison
Average Cost of Electricity Purchased
from Utility 0.08 $/kWh
Initial Cost 2.60 $/Wdc
Cost of Electricity Generated by System 0.12 $/kWh
Month Solar Radiation ( kWh / m2 / day )
AC Energy ( kWh )
Energy Value ( $ )
January 2.70 589 50
February 3.67 710 60
March 4.27 877 74
April 5.26 1,005 85
May 6.16 1,184 100
June 6.44 1,154 98
July 6.44 1,178 100
August 5.90 1,100 93
September 5.07 929 79
October 4.25 842 71
November 2.68 538 46
December 2.06 448 38
Annual 4.58 10,554 $ 894
20800$8000*/60.2$ WattsWatt
The cost of the PV project
The payback years26.23894$
20800$

Operation and Maintenancenot operation and maintenance plans scheduled for lighting at KCP
the T8 lenses at operator tables dirty due to the lube/stem mist generated by the machinery
Related Documents