AUBURN UNIVERSITY STRATEGIC PLANNING SITUATION ASSESSMENT SUPPLEMENT May 2007 Messina & Graham DRAFT FOR DISCUSSION

AUBURN UNIVERSITY STRATEGIC PLANNING SITUATION ASSESSMENT SUPPLEMENT May 2007 Messina & Graham DRAFT FOR DISCUSSION.
Dec 22, 2015
Welcome message from author
This document is posted to help you gain knowledge. Please leave a comment to let me know what you think about it! Share it to your friends and learn new things together.
Transcript
AUBURN UNIVERSITYSTRATEGIC PLANNING
SITUATION ASSESSMENTSUPPLEMENT
May 2007
Messina & Graham
DRAFT FOR DISCUSSION
Introduction
This draft document is a supplement to the Situation Assessment produced in October 2006. It contains two chapters that extend the information base for strategic planning.
The first chapter, Overview of Graduate Education, profiles graduate programs at Auburn and illustrates the interrelationships among graduate studies, undergraduate instruction, and the funded-research enterprise.
The second chapter, Faculty Profile, summarizes basic information about Auburn’s approximately 1,200 faculty members.
Both these information sets also contain comparisons of Auburn data with corresponding measures at selected peer institutions.

OVERVIEW OF GRADUATE EDUCATION
Messina & GrahamGeorge Flowers, Interim Dean, Graduate School
Joe Pittman, Interim Dean, Graduate SchoolSharon Gaber, Associate Provost, Academic Administration
DRAFT FOR DISCUSSION
May 2007
Contents
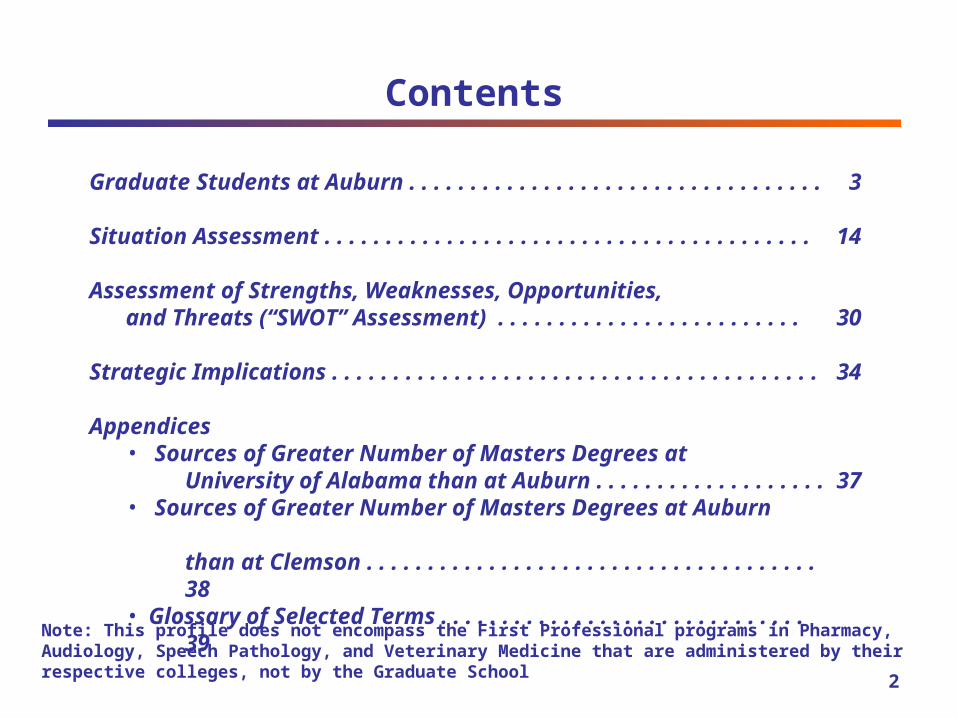
Graduate Students at Auburn . . . . . . . . . . . . . . . . . . . . . . . . . . . . . . . . . . 3
Situation Assessment . . . . . . . . . . . . . . . . . . . . . . . . . . . . . . . . . . . . . . . . 14 Assessment of Strengths, Weaknesses, Opportunities,
and Threats (“SWOT” Assessment) . . . . . . . . . . . . . . . . . . . . . . . . . 30
Strategic Implications . . . . . . . . . . . . . . . . . . . . . . . . . . . . . . . . . . . . . . . . 34
Appendices• Sources of Greater Number of Masters Degrees at
University of Alabama than at Auburn . . . . . . . . . . . . . . . . . . . 37• Sources of Greater Number of Masters Degrees at Auburn
than at Clemson . . . . . . . . . . . . . . . . . . . . . . . . . . . . . . . . . . . . .38
• Glossary of Selected Terms . . . . . . . . . . . . . . . . . . . . . . . . . . . . . .39
2
Note: This profile does not encompass the First Professional programs in Pharmacy, Audiology, Speech Pathology, and Veterinary Medicine that are administered by their respective colleges, not by the Graduate School
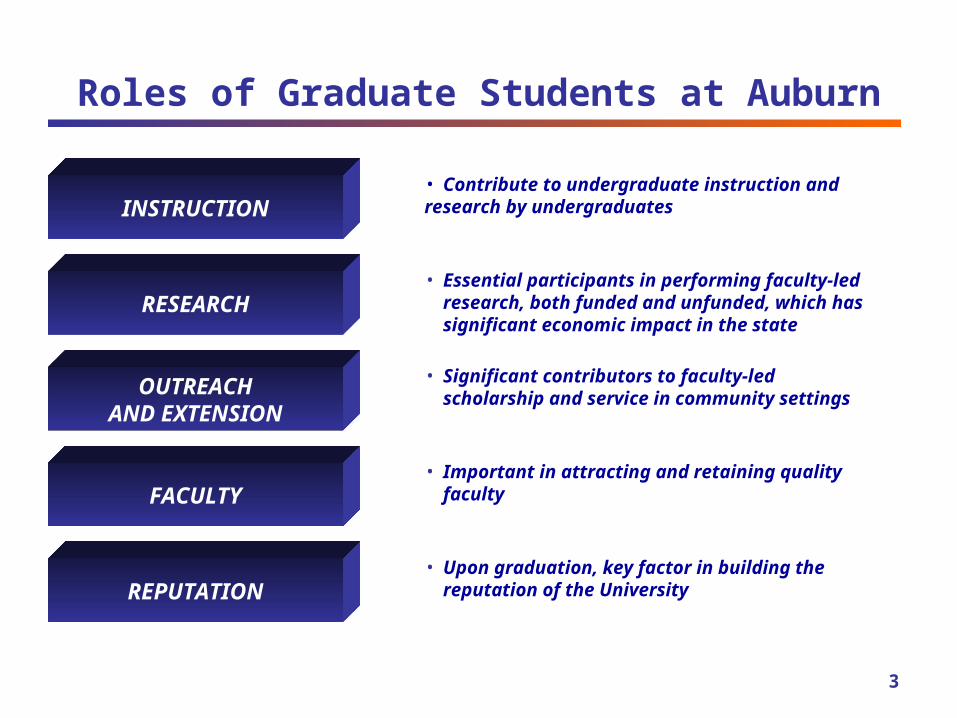
INSTRUCTION• Contribute to undergraduate instruction and research by undergraduates
• Essential participants in performing faculty-led research, both funded and unfunded, which has
significant economic impact in the state
• Important in attracting and retaining quality faculty
• Significant contributors to faculty-led scholarship and service in community settings
RESEARCH
OUTREACHAND EXTENSION
FACULTY
REPUTATION• Upon graduation, key factor in building the
reputation of the University
3
Roles of Graduate Students at Auburn
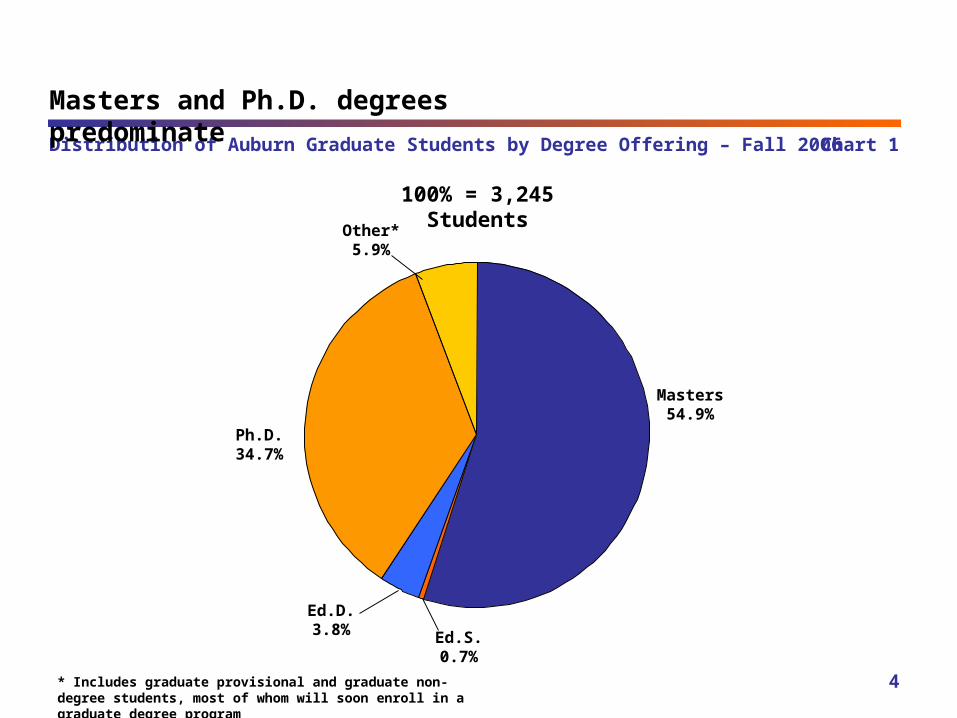
Distribution of Auburn Graduate Students by Degree Offering – Fall 2006 Chart 1
4
Masters 54.9%
Ed.S.0.7%
Ed.D.3.8%
Other*5.9%
Ph.D.34.7%
Masters and Ph.D. degrees predominate
100% = 3,245 Students
* Includes graduate provisional and graduate non-degree students, most of whom will soon enroll in a graduate degree program
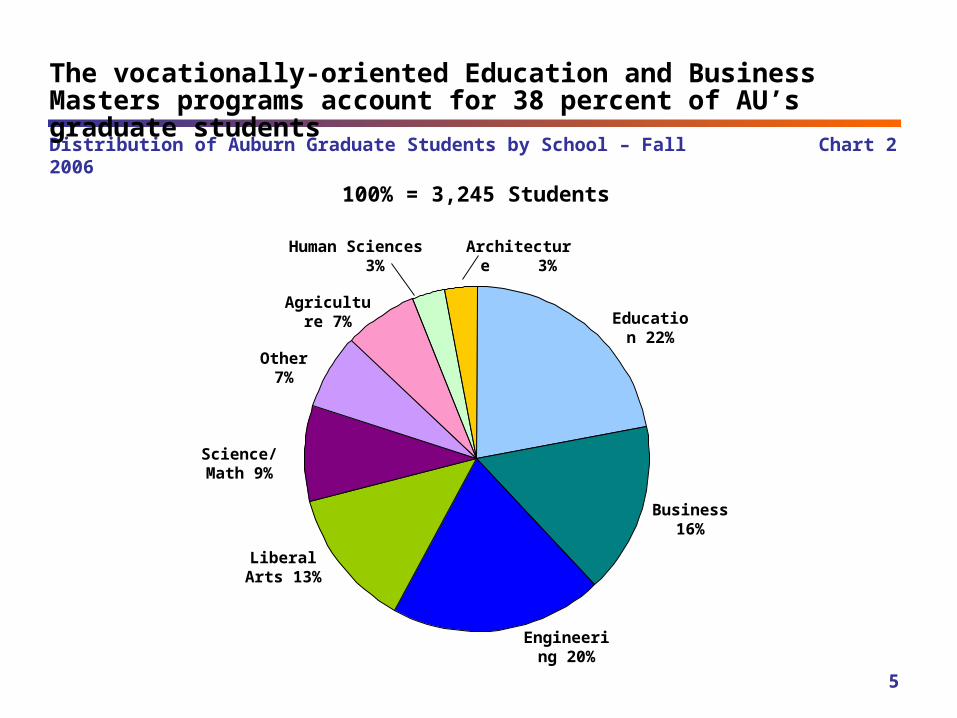
Distribution of Auburn Graduate Students by School – Fall 2006 Chart 2
Education 22%
Liberal Arts 13%
Business 16%
Engineering 20%
Architecture 3%
Science/Math 9%
Agriculture 7%
100% = 3,245 Students
5
Other 7%
The vocationally-oriented Education and Business Masters programs account for 38 percent of AU’s graduate students
Human Sciences 3%
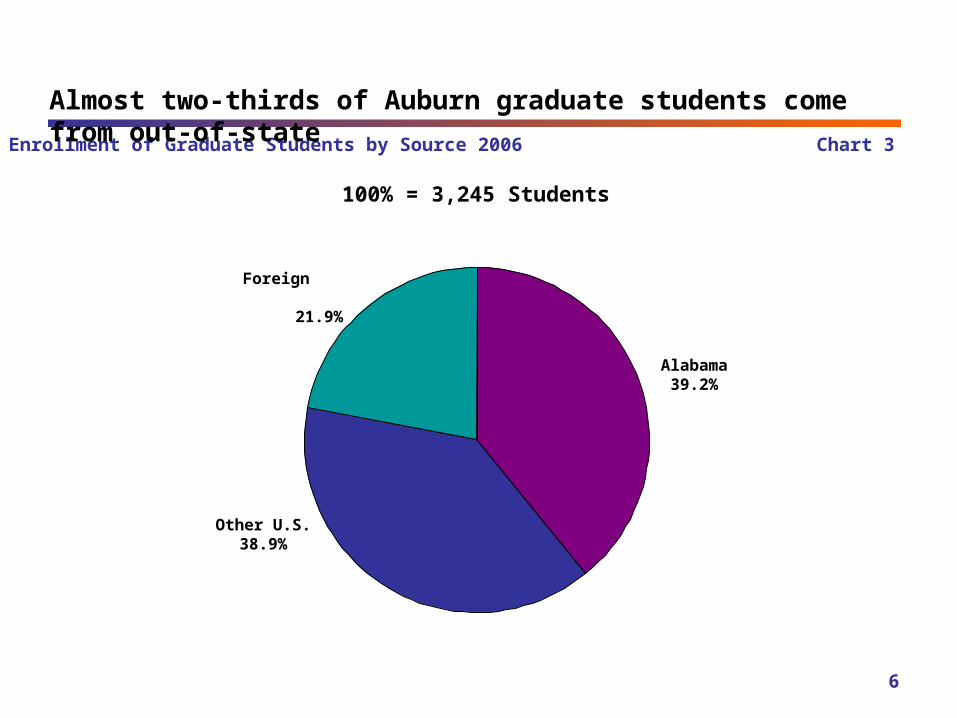
Enrollment of Graduate Students by Source 2006 Chart 3
6
Other U.S.38.9%
Alabama39.2%
Foreign 21.9%
Almost two-thirds of Auburn graduate students come from out-of-state
100% = 3,245 Students
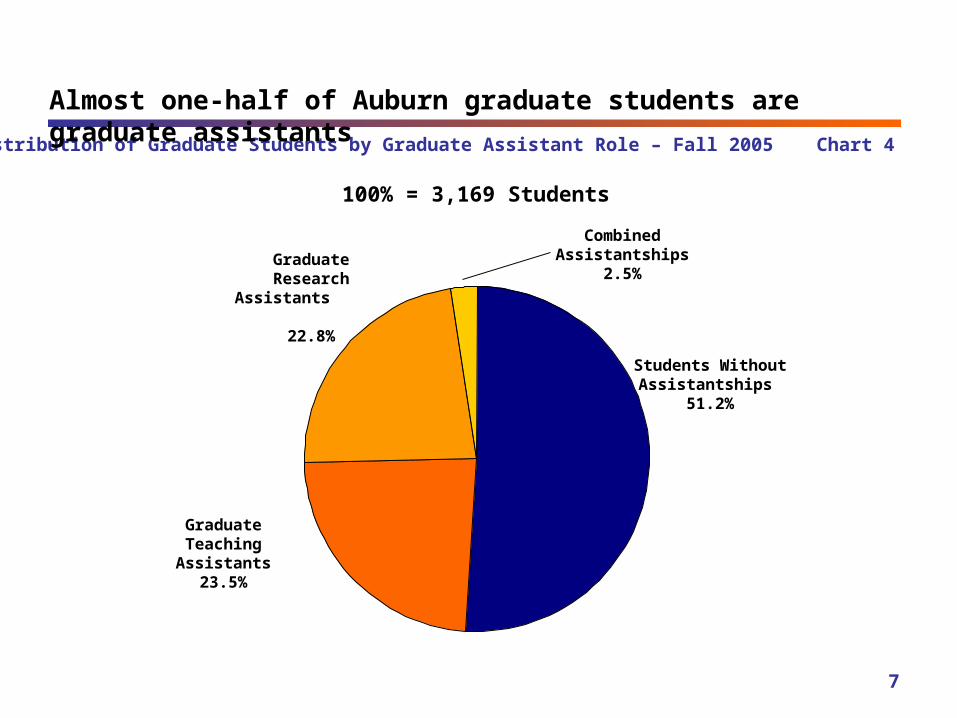
Distribution of Graduate Students by Graduate Assistant Role – Fall 2005 Chart 4
7
Graduate Teaching Assistants
23.5%
Students Without Assistantships
51.2%
Graduate Research Assistants
22.8%
Almost one-half of Auburn graduate students are graduate assistants
100% = 3,169 Students
Combined Assistantships
2.5%
8
Contributions to Mission Elementsby Graduate Students at Auburn
INSTRUCTION
• High-quality graduate students are models of academic seriousness for undergraduates
• Graduate teaching assistants interact in small groups and one-on-one with undergraduates
• Graduate assistants act as mentors for undergraduate students doing project and research activities
RESEARCH
• Graduate students are essential for serious research programs
• Graduate student involvement in research provides an apprenticeship for future researchers
• Graduate students conduct experimental and field research; do data analysis, modeling and simulation; and contribute through team activity to the training of new graduate students
OUTREACH AND EXTENSION
• Graduate students are on the front lines of delivery and evaluation through “service learning,” practicum experiences, internships, and/or assistantships
• Graduate students amplify the faculty’s outreach effort, with accompanying economic benefits
9
Contributions to Mission Elementsby Graduate Students at Auburn
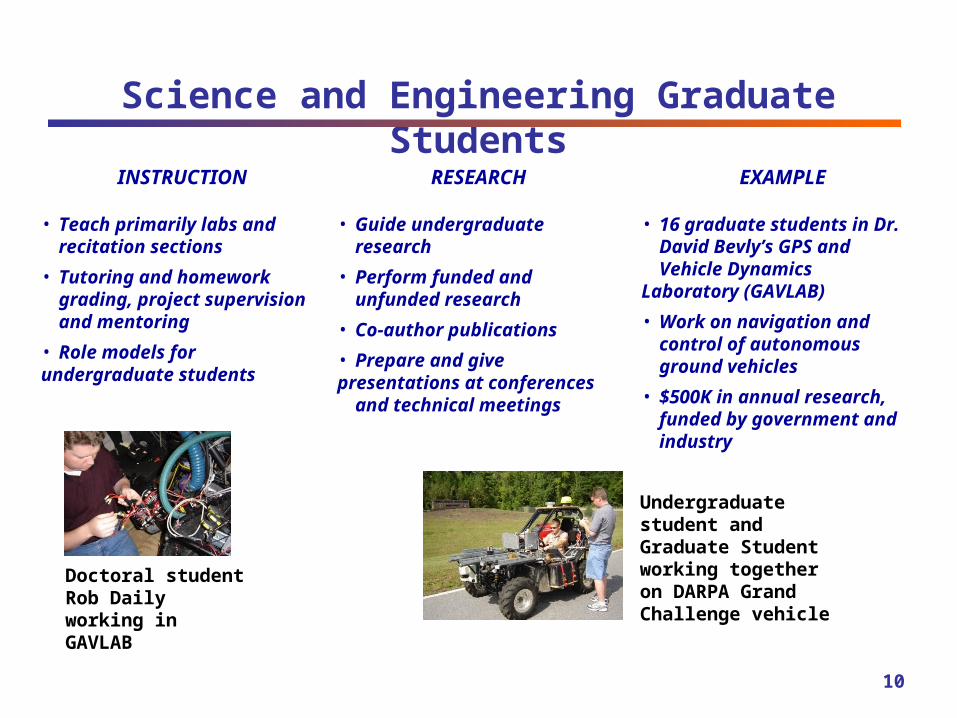
Science and Engineering Graduate Students
EXAMPLEINSTRUCTION
• Teach primarily labs and recitation sections
• Tutoring and homework grading, project supervision and mentoring
• Role models for undergraduate students
RESEARCH
10
• Guide undergraduate research
• Perform funded and unfunded research
• Co-author publications
• Prepare and give presentations at conferences
and technical meetings
• 16 graduate students in Dr. David Bevly’s GPS and Vehicle Dynamics
Laboratory (GAVLAB)
• Work on navigation and control of autonomous ground vehicles
• $500K in annual research, funded by government and industry
Doctoral student Rob Daily working in GAVLAB
Undergraduate student and Graduate Student working together on DARPA Grand Challenge vehicle

Agriculture, Forestry, and Human Sciences Students
EXAMPLEINSTRUCTION (class and community)
• Assist faculty in classes
• Teach classes with faculty supervision
• Help develop and implement extension curricula and materials
• Participate in faculty-led community outreach activities
• Help supervise interns and service learning students
RESEARCH (basic and applied)
11
• Help design experimental and field research
• Help guide student research
• Evaluate outreach andextension efforts
• Co-author reports and publications
• 10 graduate students on Dr. Francesca Adler-Baeder’s Community Capacity Projects
• Work with community groups across Alabama to enhance and evaluate educational services in support of marriage and families
• $1.3M in annual outreach service, research, and evaluation funded by Federal and State government (through the Healthy
Marriage Initiative)Drs. Adler-Baeder and Ketring (at ends) with four graduate students and Governor Riley at the Governor’s Mansion for the “Marriage Celebration” event on 2/18/07
Department of History
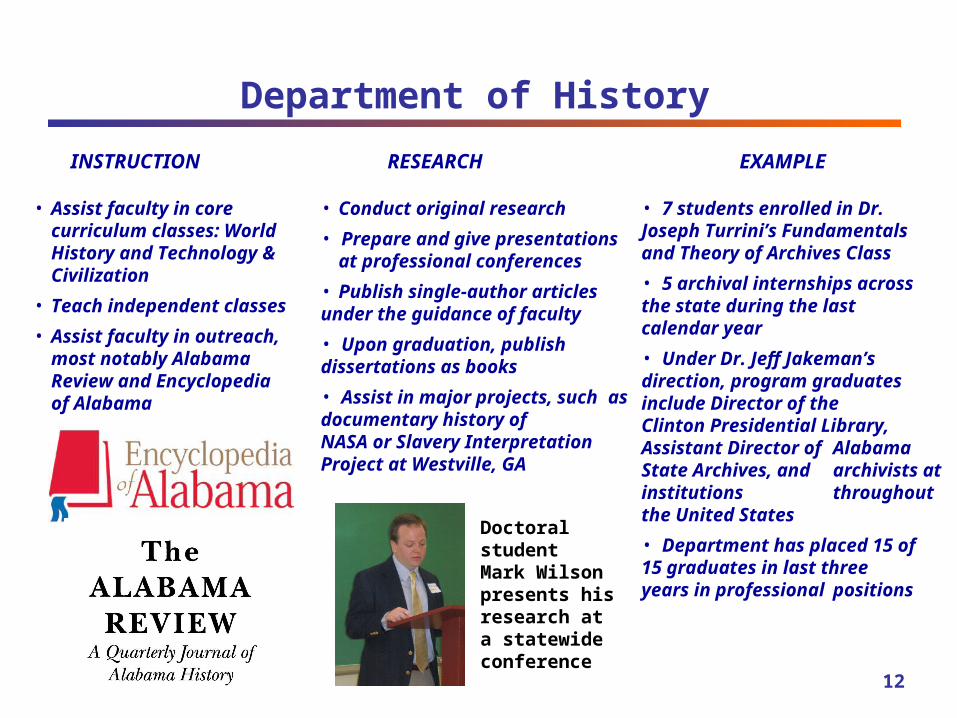
EXAMPLEINSTRUCTION
• Assist faculty in core curriculum classes: World History and Technology & Civilization
• Teach independent classes
• Assist faculty in outreach, most notably Alabama Review and Encyclopedia of Alabama
RESEARCH
12
• Conduct original research
• Prepare and give presentations at professional conferences
• Publish single-author articles under the guidance of faculty
• Upon graduation, publish dissertations as books
• Assist in major projects, such as documentary history of
NASA or Slavery Interpretation Project at Westville, GA
• 7 students enrolled in Dr. Joseph Turrini’s Fundamentals and Theory of Archives Class
• 5 archival internships across the state during the last calendar year
• Under Dr. Jeff Jakeman’s direction, program graduates include Director of the Clinton Presidential Library, Assistant Director of Alabama State Archives, and archivists at institutions throughout the United States
• Department has placed 15 of 15 graduates in last three years in professional positions
Doctoral studentMark Wilsonpresents his research at a statewide conference

0
10
20
30
40
50
60
70
80
Emphasis on Research
Students Involved in Teaching and Research
Emphasis on Teaching Core
13Agriculture Forestry Human
SciencesEngineering Science/
Math Liberal Arts
Percentage of Graduate Students With a Research or Teaching Assistantship 2005-06
Chart 5
Research is the primary assistantship role in agriculture and forestry, while core-curriculum teaching is emphasized in science/math and liberal arts
% ResearchAssistants
% TeachingAssistants
• AU’s graduate programs are small relative to SREB peers. Chart 6. Some schools award more
graduate degrees because they have large Social Work, Communications, and Public Health programs
that AU does not offer. Charts 7 and 8. The somewhat erratic growth trend in graduate degrees
awarded may reflect the priorities of different Presidents and the impact of strategy reviews. Chart 9.
In general, however, AU’s graduate program growth lags behind both Alabama and SREB schools
overall. Chart 10
• AU faculty have fewer graduate students and graduate assistants to leverage their instruction and
research than do faculty at peer institutions. Charts 11 and 12
• AU is significantly less selective in its admissions than are many leading competitors, and GPA, GRE,
and GMAT scores of entering graduate students are somewhat lower than at many peer institutions.
Charts 13 and 14
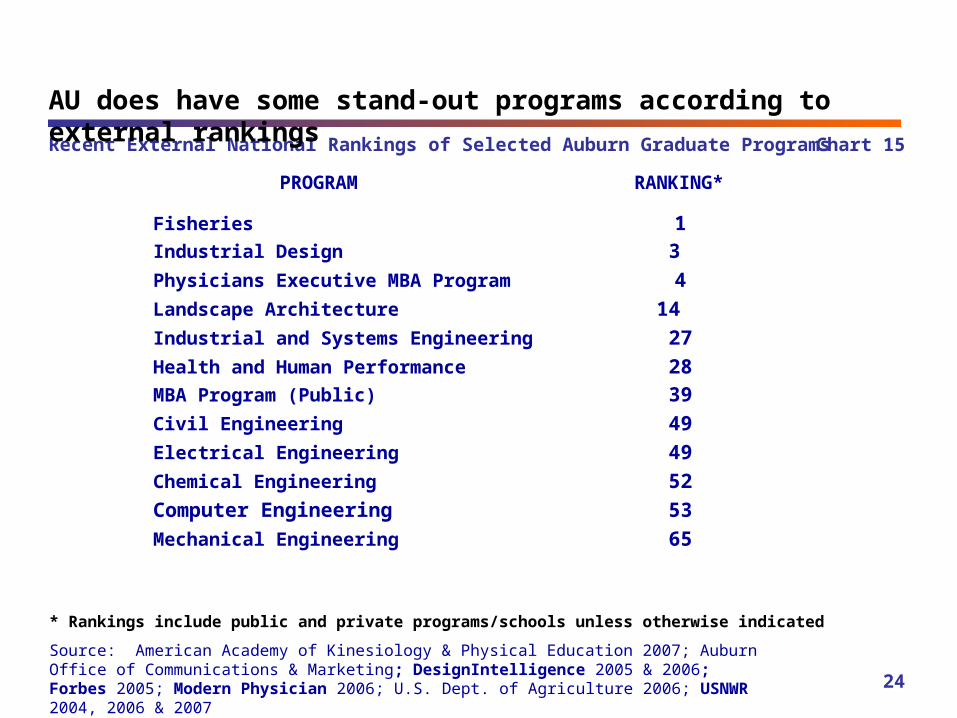
• AU does have some stand-out programs according to external rankings. Chart 15. Nevertheless,
many AU programs – such as Mathematics and Engineering – are in the middle of the pack relative to
regional competitors. Chart 16. Others – such as Education and Business – rank lower relative to
regional competitors. Chart 17
• The financial package offered to graduate assistants is uncompetitive compared to regional peers.
Charts 18, 19, and 20 14
Situation Assessment
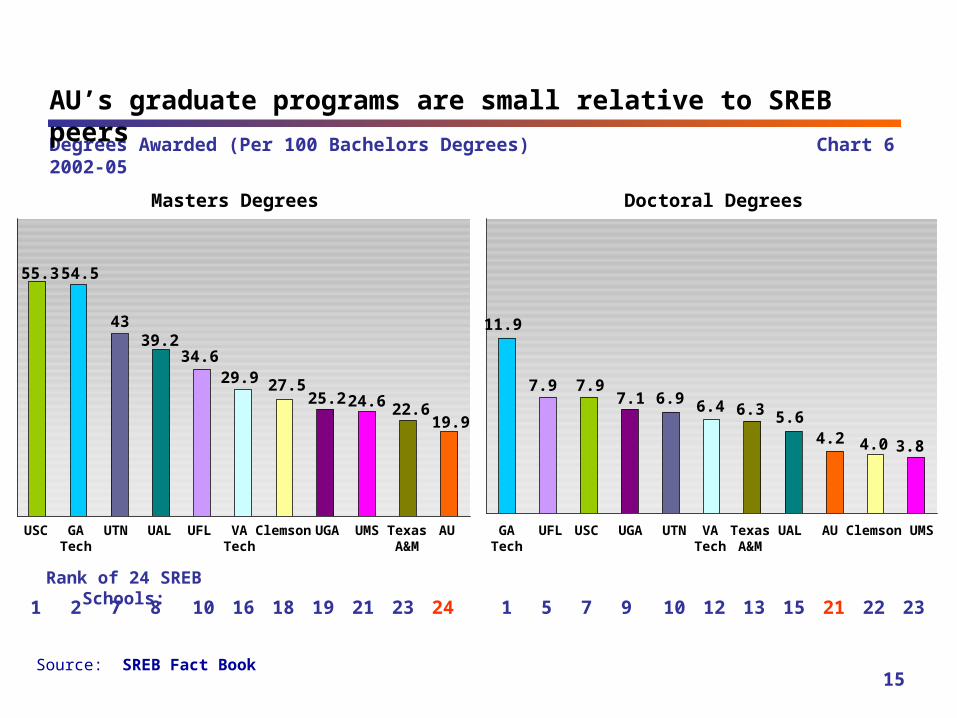
Degrees Awarded (Per 100 Bachelors Degrees) 2002-05
15
Chart 6
4.04.2
6.47.1
AUUAL ClemsonUFL USC
7.9
GATech
11.9
6.3
UGA
1 5 9 10 15 21 22
Rank of 24 SREB Schools:
Masters Degrees Doctoral Degrees
22.624.6
29.9
39.2
AUUAL ClemsonUFLUSC
54.5
GATech
55.3
27.5
UGA
1 7 8 10 18 19 24
Source: SREB Fact Book
AU’s graduate programs are small relative to SREB peers
43
34.6
25.2
19.9
VATech
UMS TexasA&M
2 16 21 23
7.9
7
UTN
6.9
VATech
12 13
TexasA&M
5.6
UMS
3.8
23
UTN
Source: University of South Carolina Fact Book
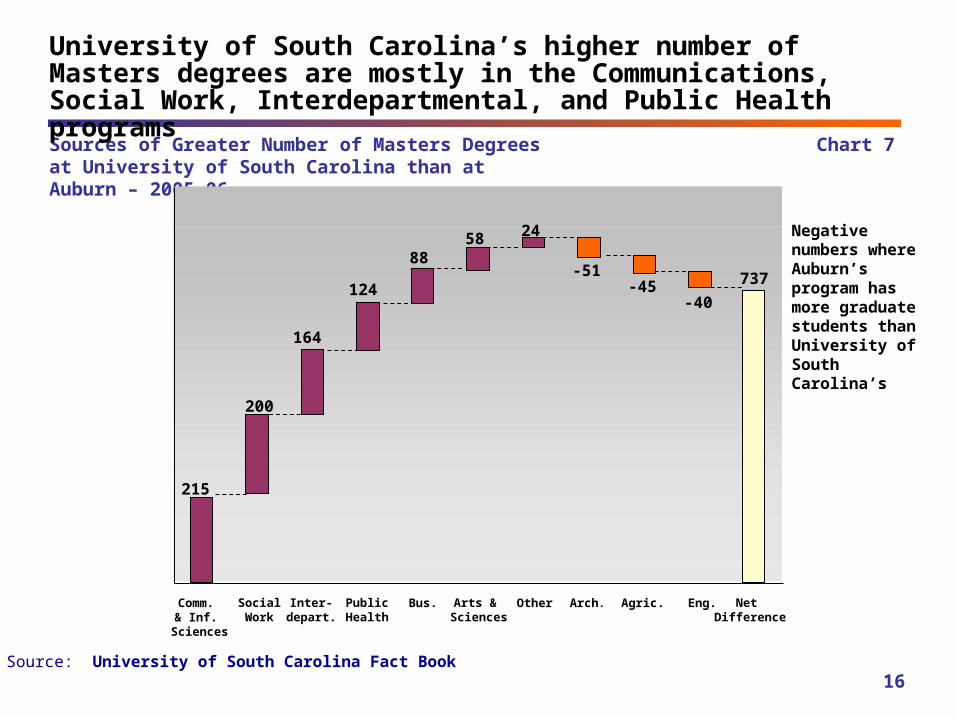
Chart 7
16
Sources of Greater Number of Masters Degrees at University of South Carolina than at Auburn – 2005-06
University of South Carolina’s higher number of Masters degrees are mostly in the Communications, Social Work, Interdepartmental, and Public Health programs
Comm. & Inf.
Sciences
Inter-depart.
Arts & Sciences
Eng.Arch. Agric. SocialWork
Net Difference
OtherBus.PublicHealth
215
164
124
88-51
-45-40
737
200
58 24 Negative numbers where Auburn’s program has more graduate students than University of South Carolina’s
Source: University of Tennessee Fact Book
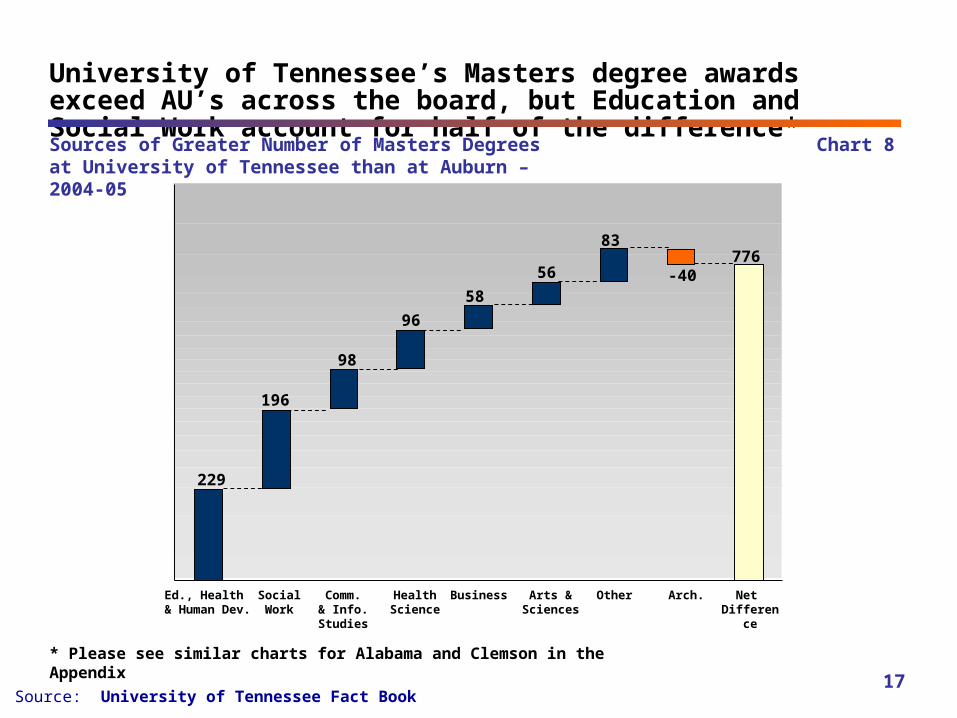
Chart 8
17
Sources of Greater Number of Masters Degrees at University of Tennessee than at Auburn – 2004-05
University of Tennessee’s Masters degree awards exceed AU’s across the board, but Education and Social Work account for half of the difference*
229
196
98
96
56
83
-40776
58
* Please see similar charts for Alabama and Clemson in the Appendix
Ed., Health & Human Dev.
SocialWork
Business Arts &Sciences
Net Difference
OtherComm.& Info.Studies
HealthScience
Arch.
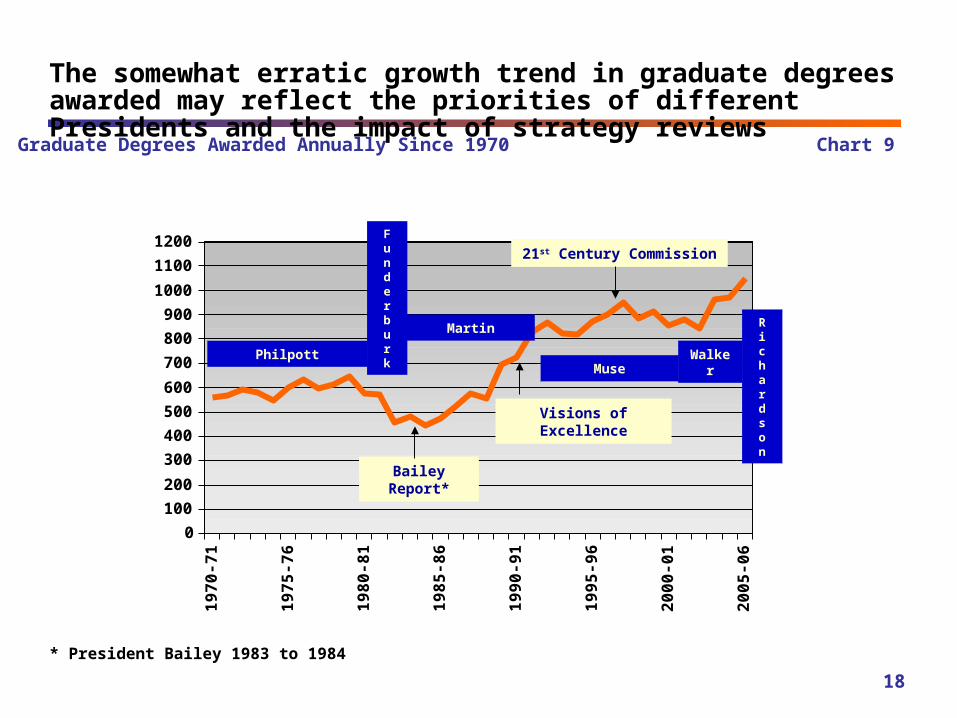
Graduate Degrees Awarded Annually Since 1970 Chart 9
18
The somewhat erratic growth trend in graduate degrees awarded may reflect the priorities of different Presidents and the impact of strategy reviews
0
100
200
300
400
500
600
700
800
900
1000
1100
1200
19
70
-71
19
75
-76
19
80
-81
19
85
-86
19
90
-91
19
95
-96
20
00
-01
20
05
-06
PhilpottMuse
Martin
Visions of Excellence
21st Century Commission
Bailey Report*
Walker
Funderburk
Richardson
* President Bailey 1983 to 1984
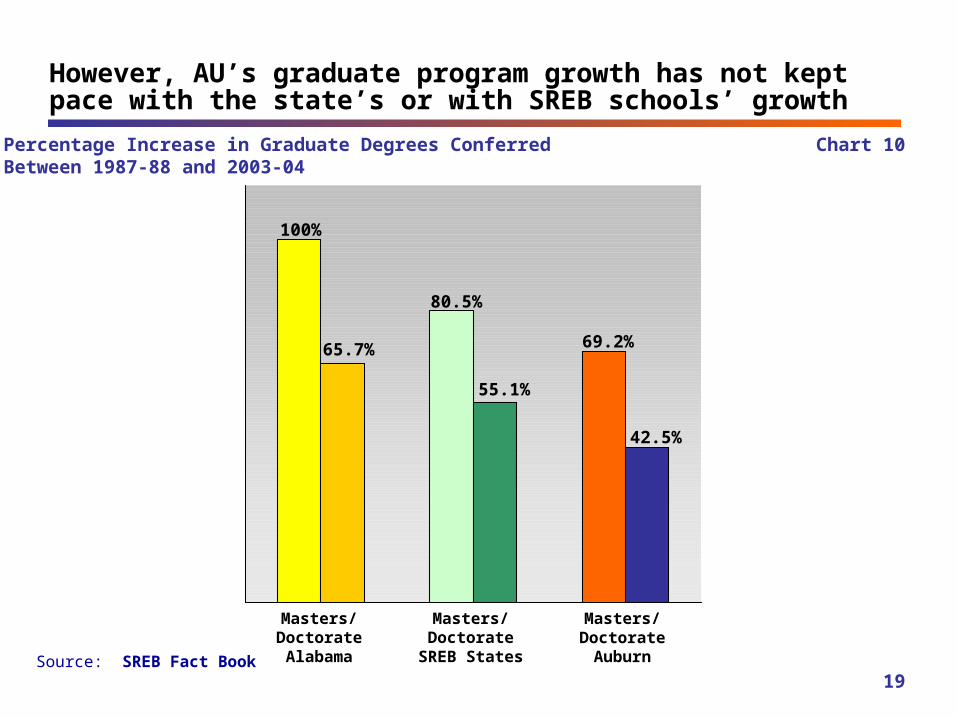
Percentage Increase in Graduate Degrees Conferred Between 1987-88 and 2003-04
Source: SREB Fact Book
Chart 10
19
65.7%
100%
80.5%
55.1%
69.2%
42.5%
However, AU’s graduate program growth has not kept pace with the state’s or with SREB schools’ growth
Masters/DoctorateAlabama
Masters/DoctorateSREB States
Masters/DoctorateAuburn
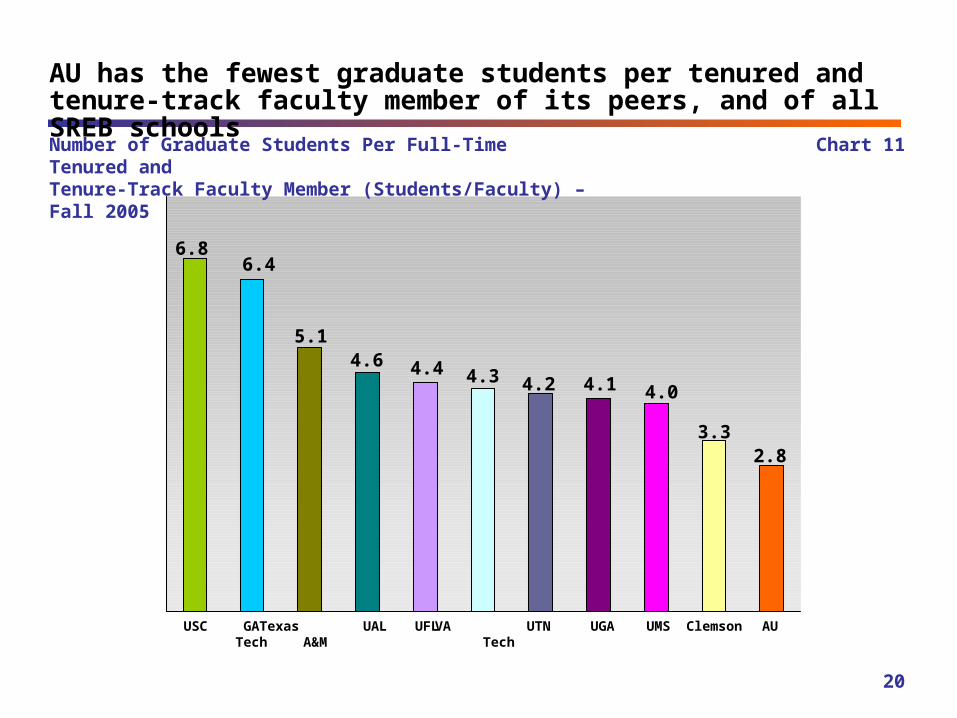
Number of Graduate Students Per Full-Time Tenured and Tenure-Track Faculty Member (Students/Faculty) – Fall 2005
Chart 11
20
4.4
6.8
4.6
6.4
AU
5.1
4.3 4.2 4.1 4.0
3.32.8
VA Tech
UGAUFL ClemsonUTNTexas A&M
UMS UALUSC GATech
AU has the fewest graduate students per tenured and tenure-track faculty member of its peers, and of all SREB schools
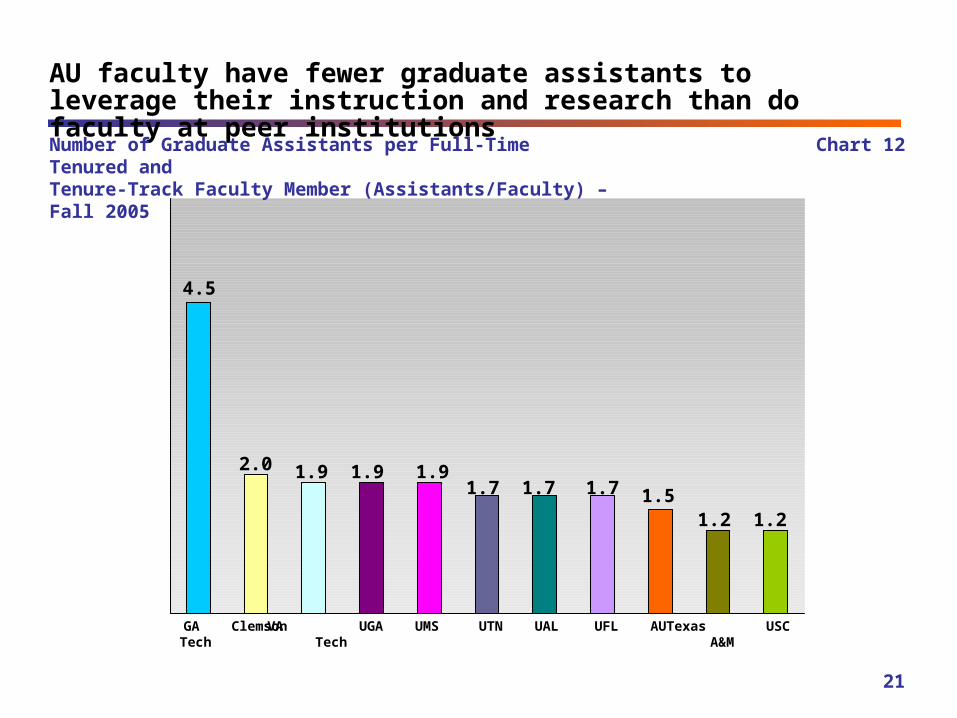
Chart 12
21
1.9
4.5
1.92.0 1.91.7 1.7 1.7 1.5
1.2 1.2
AU faculty have fewer graduate assistants to leverage their instruction and research than do faculty at peer institutions
AUVA Tech
UGA UFLClemson UTN Texas A&M
UMS UAL USCGA Tech
Number of Graduate Assistants per Full-Time Tenured and Tenure-Track Faculty Member (Assistants/Faculty) – Fall 2005
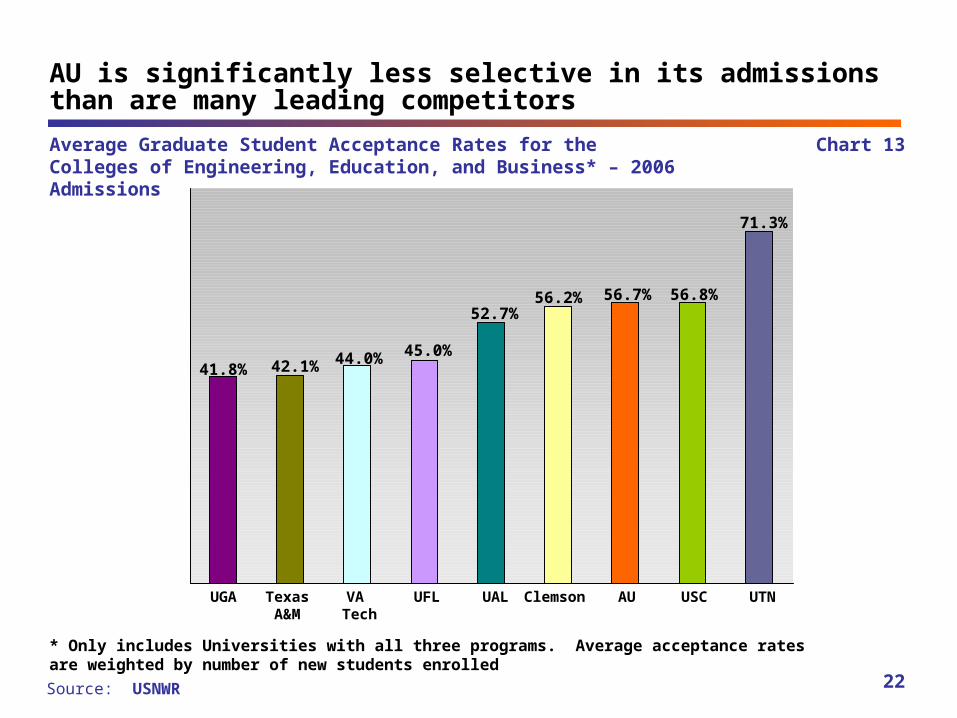
Average Graduate Student Acceptance Rates for theColleges of Engineering, Education, and Business* – 2006 Admissions
Source: USNWR
Chart 13
22
AUUGA UFL
56.8%56.2%
Clemson
56.7%
USC
AU is significantly less selective in its admissions than are many leading competitors
VA Tech
UALTexas A&M
41.8% 42.1% 44.0% 45.0%
52.7%
71.3%
UTN
* Only includes Universities with all three programs. Average acceptance rates are weighted by number of new students enrolled
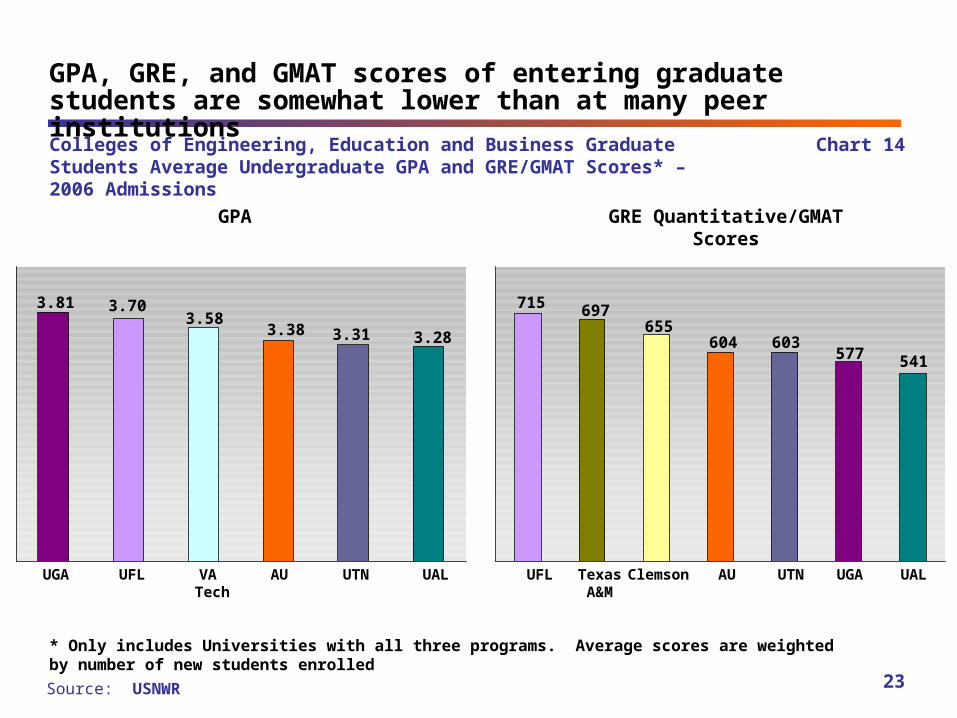
Chart 14
23
AU UAL UFL
3.28
3.703.81
3.38
Source: USNWR
Colleges of Engineering, Education and Business Graduate Students Average Undergraduate GPA and GRE/GMAT Scores* – 2006 Admissions
GPA GRE Quantitative/GMAT Scores
AUClemson
603
697 655
541
GPA, GRE, and GMAT scores of entering graduate students are somewhat lower than at many peer institutions
VA Tech
3.31
UGA UFL UAL Texas A&M
715
577
UTNUGA UTN
3.58
604
* Only includes Universities with all three programs. Average scores are weighted by number of new students enrolled
Source: American Academy of Kinesiology & Physical Education 2007; Auburn Office of Communications & Marketing; DesignIntelligence 2005 & 2006; Forbes 2005; Modern Physician 2006; U.S. Dept. of Agriculture 2006; USNWR 2004, 2006 & 2007
Fisheries 1
Industrial Design 3
Physicians Executive MBA Program 4
Landscape Architecture 14
Industrial and Systems Engineering 27
Health and Human Performance 28
MBA Program (Public) 39
Civil Engineering 49
Electrical Engineering 49
Chemical Engineering 52
Computer Engineering 53
Mechanical Engineering 65
Recent External National Rankings of Selected Auburn Graduate Programs
PROGRAM RANKING*
Chart 15
24
AU does have some stand-out programs according to external rankings
* Rankings include public and private programs/schools unless otherwise indicated
1 1 MIT
2 2 Stanford
4 4 Georgia Tech
14 14 Texas A&M
26 26 Univ. of Florida
30 33 Virginia Tech
71 66 Univ. of Tennessee
74 74 Auburn
68 77 Clemson
NR NR Florida State
NR NR Univ. of Alabama
NR NR Univ. of S. Carolina
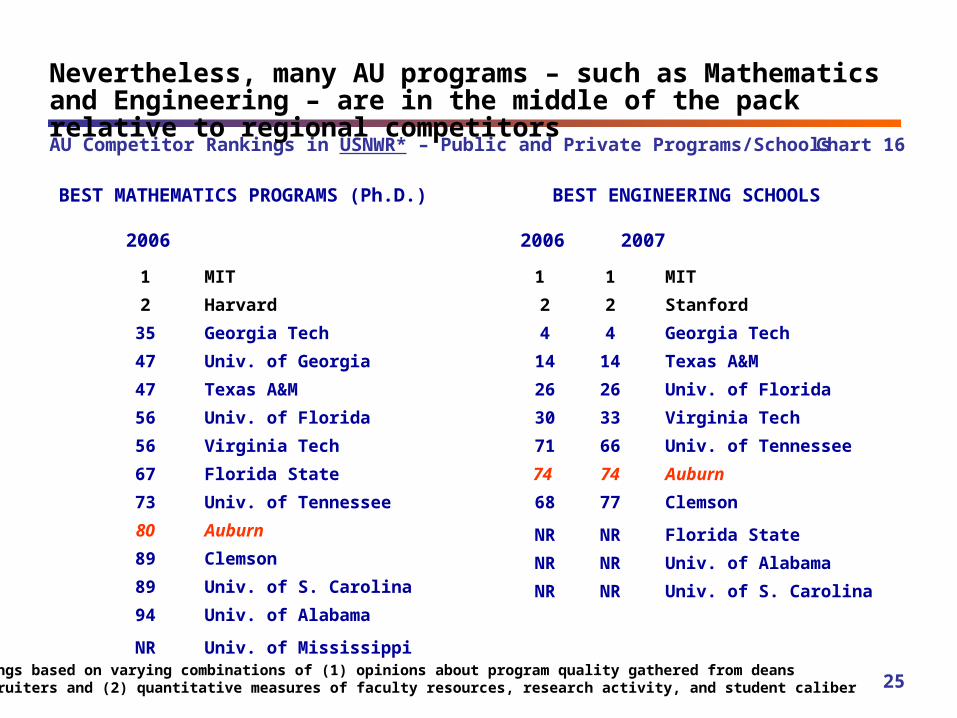
AU Competitor Rankings in USNWR* – Public and Private Programs/Schools
BEST MATHEMATICS PROGRAMS (Ph.D.)
1 MIT
2 Harvard
35 Georgia Tech
47 Univ. of Georgia
47 Texas A&M
56 Univ. of Florida
56 Virginia Tech
67 Florida State
73 Univ. of Tennessee
80 Auburn
89 Clemson
89 Univ. of S. Carolina
94 Univ. of Alabama
NR Univ. of Mississippi
BEST ENGINEERING SCHOOLS
Chart 16
25
Nevertheless, many AU programs – such as Mathematics and Engineering – are in the middle of the pack relative to regional competitors
2006 2006 2007
* Rankings based on varying combinations of (1) opinions about program quality gathered from deansand recruiters and (2) quantitative measures of faculty resources, research activity, and student caliber
1 1 Harvard
2 2 Stanford
34 25 Georgia Tech
31 29 Texas A&M
41 37 Univ. of Florida
46 46 Univ. of Georgia
59 55 Univ. of S. Carolina
66 NR Univ. of Tennessee
69 NR Auburn
73 NR University of Alabama
NR NR Clemson
NR NR Florida State
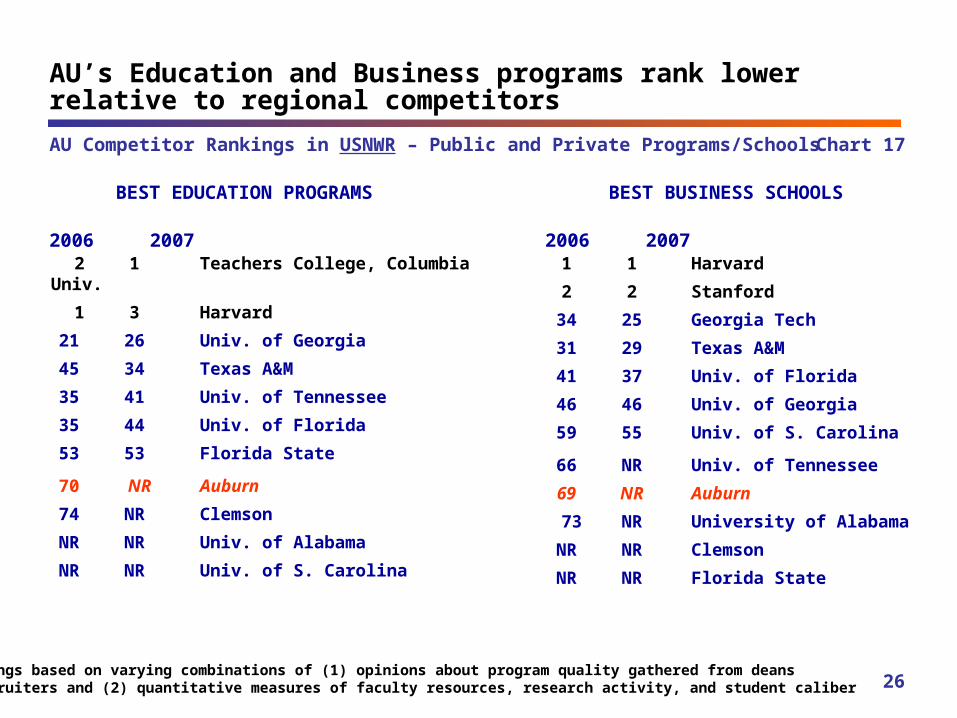
BEST BUSINESS SCHOOLSBEST EDUCATION PROGRAMS
2 1 Teachers College, Columbia Univ.
1 3 Harvard
21 26 Univ. of Georgia
45 34 Texas A&M
35 41 Univ. of Tennessee
35 44 Univ. of Florida
53 53 Florida State
70 NR Auburn
74 NR Clemson
NR NR Univ. of Alabama
NR NR Univ. of S. Carolina
Chart 17
26
AU’s Education and Business programs rank lower relative to regional competitors
AU Competitor Rankings in USNWR – Public and Private Programs/Schools
2006 2007 2006 2007
* Rankings based on varying combinations of (1) opinions about program quality gathered from deansand recruiters and (2) quantitative measures of faculty resources, research activity, and student caliber
27
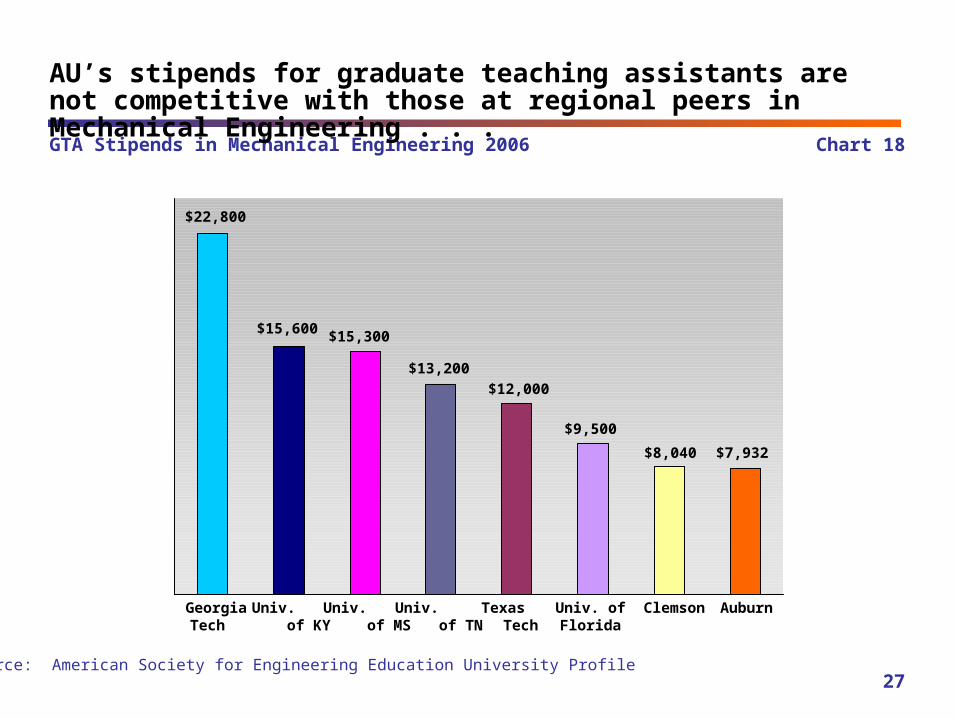
AuburnUniv. of MS
ClemsonUniv. of Florida
Univ. of KY
Texas Tech
Georgia Tech
Univ. of TN
GTA Stipends in Mechanical Engineering 2006 Chart 18
$7,932$8,040
$9,500
$12,000
$13,200
$15,300$15,600
$22,800
AU’s stipends for graduate teaching assistants are not competitive with those at regional peers in Mechanical Engineering . . .
Source: American Society for Engineering Education University Profile
28
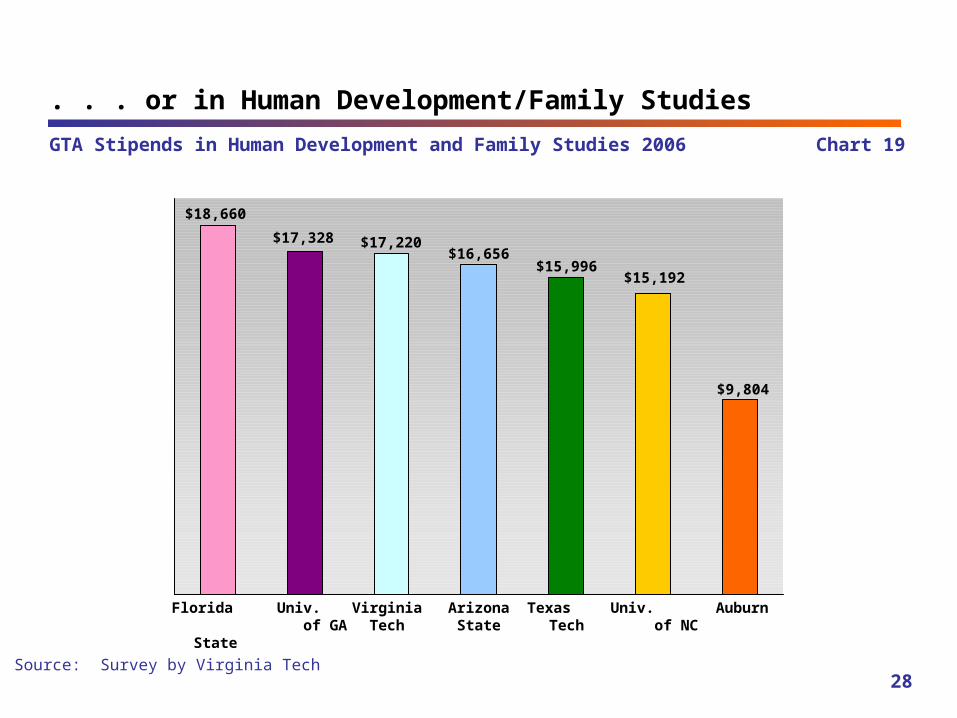
GTA Stipends in Human Development and Family Studies 2006 Chart 19
. . . or in Human Development/Family Studies
Source: Survey by Virginia Tech
AuburnArizona State
Florida State
Virginia Tech
Texas Tech
Univ. of GA
Univ. of NC
$9,804
$15,192$15,996
$16,656$17,220$17,328
$18,660
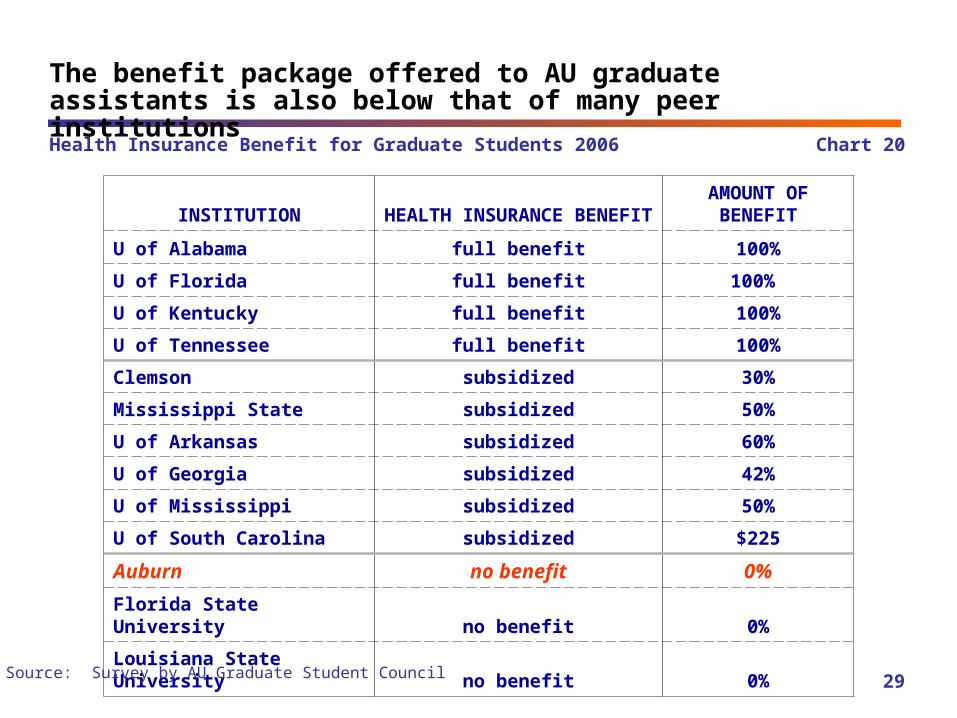
Health Insurance Benefit for Graduate Students 2006
29
INSTITUTIONHEALTH INSURANCE
BENEFITAMOUNT OF
BENEFIT
U of Alabama full benefit 100%
U of Florida full benefit 100%
U of Kentucky full benefit 100%
U of Tennessee full benefit 100%
Clemson subsidized 30%
Mississippi State subsidized 50%
U of Arkansas subsidized 60%
U of Georgia subsidized 42%
U of Mississippi subsidized 50%
U of South Carolina subsidized $225
Auburn no benefit 0%
Florida State University no benefit 0%
Louisiana State University no benefit 0%
Chart 20
The benefit package offered to AU graduate assistants is also below that of many peer institutions
Source: Survey by AU Graduate Student Council
STRENGTHS
• AU offers a wide array of graduate programs, both vocational and academic
• AU’s graduate programs in Fisheries, Industrial Design, and Landscape Architecture, as well as the Physicians Executive MBA program, rank very highly at a national level
• Several other AU graduate programs – including Engineering, Business, and Kinesiology – rank well among public universities
30
Assessment of Strengths, Weaknesses, Opportunities,and Threats (“SWOT” Assessment)Auburn University Graduate Programs

31
WEAKNESSES
• The size of the graduate programs at Auburn does not reflect a deliberate strategic decision by the University. Overall, based on comparisons with other institutions, the number
of graduate students may be too small to effectively support Auburn’s research and instruction missions
• The average caliber of students in AU’s graduate programs is lower than that at many national institutions and regional peers
• The three large programs that US News & World Report ranks do not fare as well as those at leading national institutions and regional competitors
OPPORTUNITIES
• Grow overall graduate program size by selectively supporting programs that have most potential to contribute to the research mission and to undergraduate instruction
• Rationalize programs by rigorously assessing the viability, competitiveness, growth prospects, and graduate student quality of each
• Build on strengths to attract additional research-oriented faculty who tend to recruit high- quality graduate students
• Fund competitive graduate assistant stipends and benefit packages while setting a high standard for students to receive financial support
32
33
THREATS
• A lack of strategic direction for – and resources behind – the graduate programs may inhibit AU from reaching its potential in both research and undergraduate education
• Uncompetitive stipends and benefits may lead to erosion of the size and quality of the graduate student body in the research-oriented programs, and may demoralize faculty
and undermine the University’s research mission
34
Strategic Implications
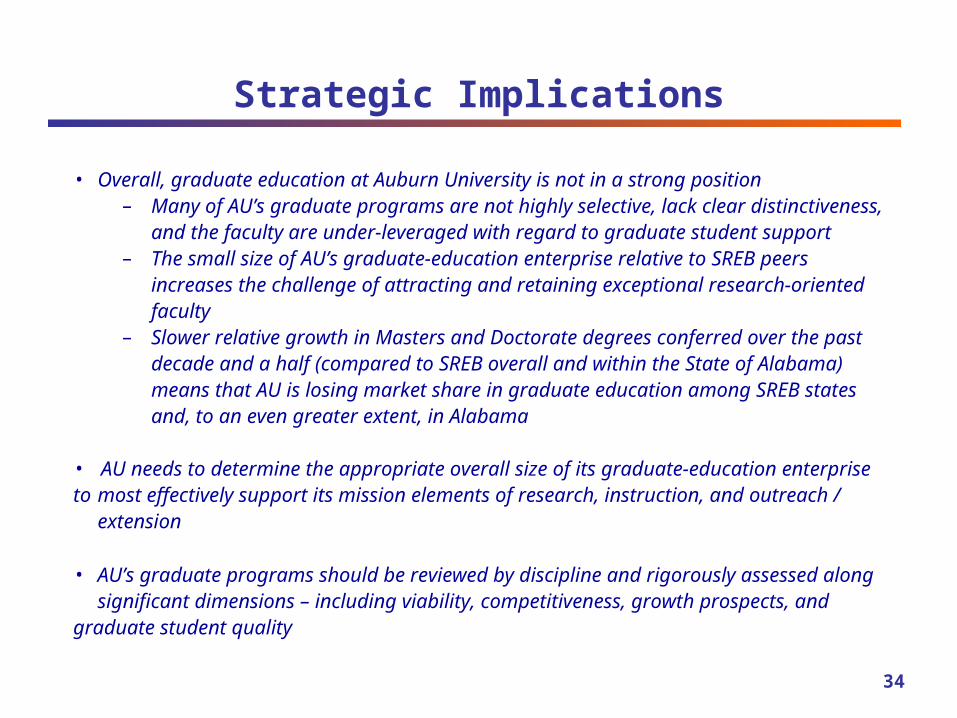
• Overall, graduate education at Auburn University is not in a strong position– Many of AU’s graduate programs are not highly selective, lack clear
distinctiveness, and the faculty are under-leveraged with regard to graduate student support
– The small size of AU’s graduate-education enterprise relative to SREB peers increases the challenge of attracting and retaining exceptional research-oriented faculty
– Slower relative growth in Masters and Doctorate degrees conferred over the past decade and a half (compared to SREB overall and within the State of Alabama) means that AU is losing market share in graduate education among SREB states and, to an even greater extent, in Alabama
• AU needs to determine the appropriate overall size of its graduate-education enterprise to most effectively support its mission elements of research, instruction, and outreach /
extension
• AU’s graduate programs should be reviewed by discipline and rigorously assessed along significant dimensions – including viability, competitiveness, growth prospects, and
graduate student quality
35
Strategic Implications (continued)
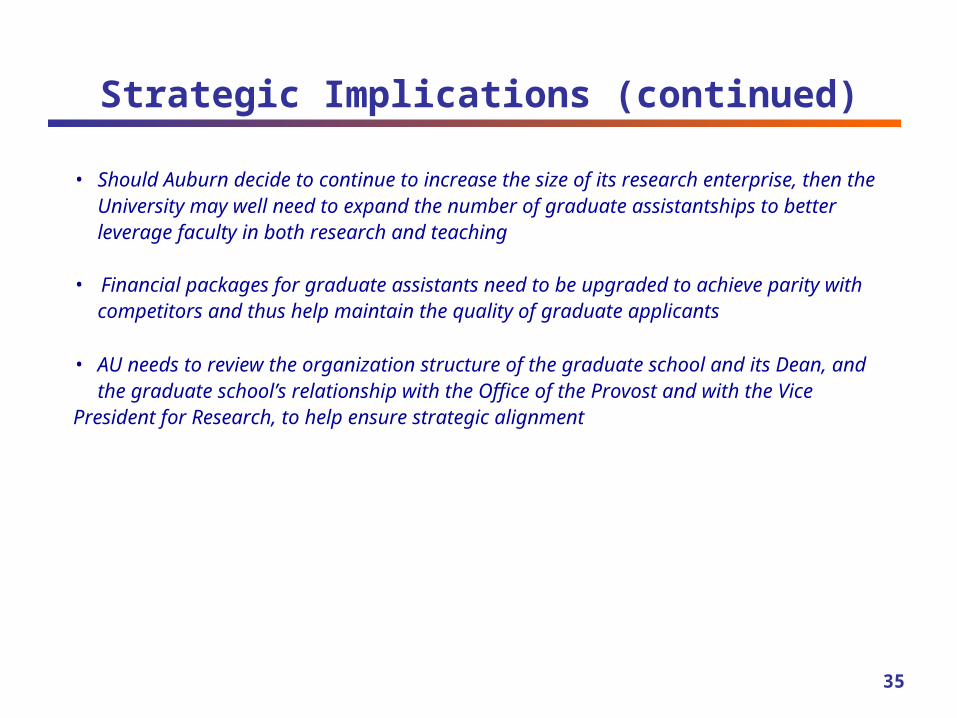
• Should Auburn decide to continue to increase the size of its research enterprise, then the University may well need to expand the number of graduate assistantships to better leverage faculty in both research and teaching
• Financial packages for graduate assistants need to be upgraded to achieve parity with competitors and thus help maintain the quality of graduate applicants
• AU needs to review the organization structure of the graduate school and its Dean, and the graduate school’s relationship with the Office of the Provost and with the Vice
President for Research, to help ensure strategic alignment
Appendices
36
• Sources of Greater Number of Masters Degrees at University of Alabama than at Auburn
• Sources of Greater Number of Masters Degrees at Auburn than at Clemson
• Glossary of Selected Terms
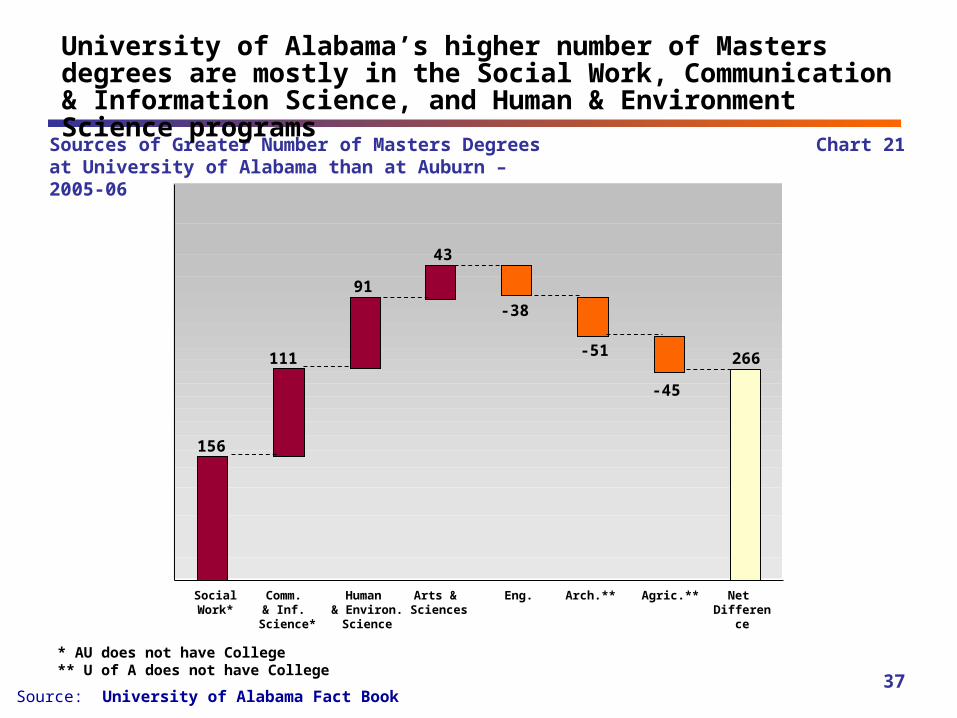
Source: University of Alabama Fact Book
Chart 21
37
Sources of Greater Number of Masters Degrees at University of Alabama than at Auburn – 2005-06
University of Alabama’s higher number of Masters degrees are mostly in the Social Work, Communication & Information Science, and Human & Environment Science programs
SocialWork*
Comm. & Inf.
Science*
Human & Environ.
Science
Arts & Sciences
Eng. Arch.** Agric.** Net Difference
* AU does not have College** U of A does not have College
156
111
91
43
-38
-51
-45
266
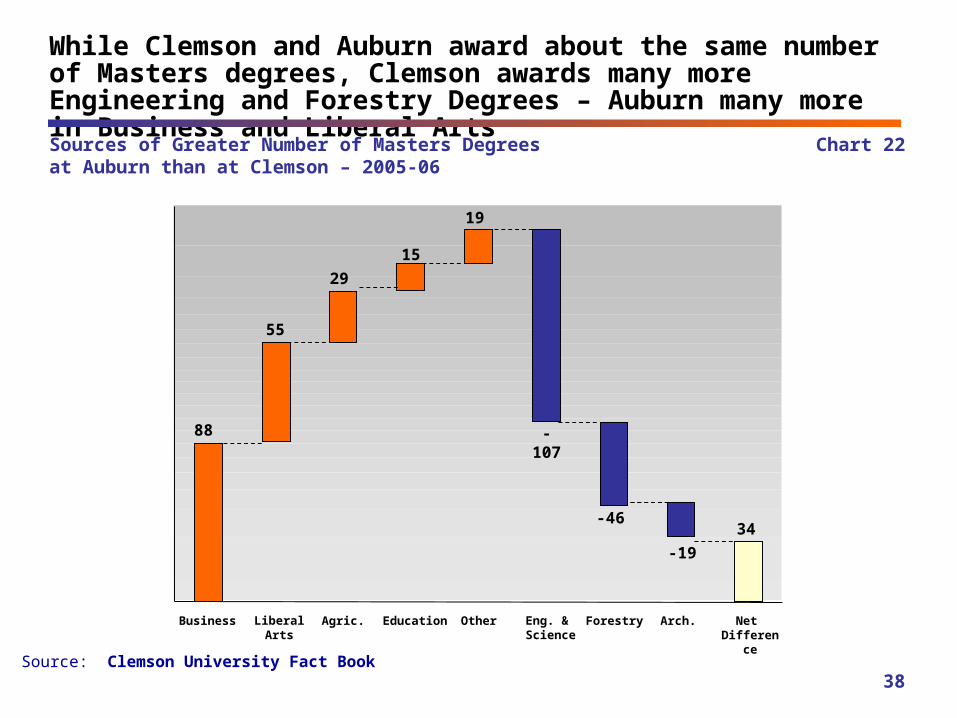
Chart 22Sources of Greater Number of Masters Degrees at Auburn than at Clemson – 2005-06
While Clemson and Auburn award about the same number of Masters degrees, Clemson awards many more Engineering and Forestry Degrees – Auburn many more in Business and Liberal Arts
38Source: Clemson University Fact Book
Eng. & Science
Forestry Arch.LiberalArts
Agric.Business Education Other
88
55
29
19
15
-107
-46
-19
34
Net Difference
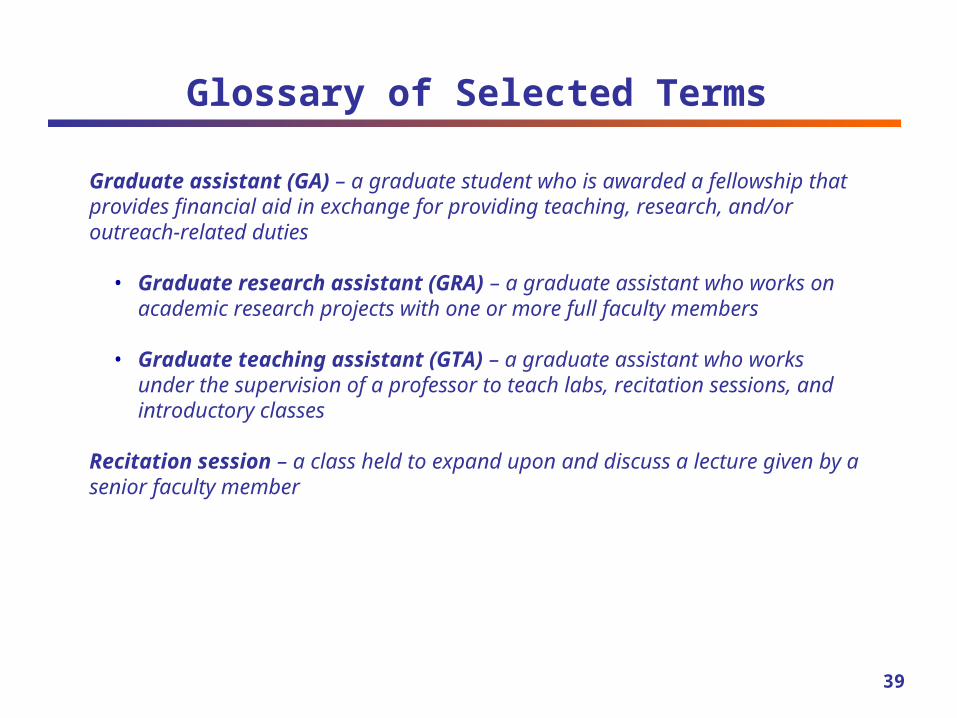
Glossary of Selected Terms
Graduate assistant (GA) – a graduate student who is awarded a fellowship that provides financial aid in exchange for providing teaching, research, and/or outreach-related duties
• Graduate research assistant (GRA) – a graduate assistant who works on academic research projects with one or more full faculty members
• Graduate teaching assistant (GTA) – a graduate assistant who works under the supervision of a professor to teach labs, recitation sessions, and
introductory classes
Recitation session – a class held to expand upon and discuss a lecture given by a senior faculty member
39
Related Documents