Article Atypical Visual Saliency in Autism Spectrum Disorder Quantified through Model-Based Eye Tracking Highlights d A novel three-layered saliency model with 5,551 annotated natural scene semantic objects d People with ASD who have a stronger image center bias regardless of object distribution d Generally increased pixel-level saliency but decreased semantic-level saliency in ASD d Reduced saliency for faces and locations indicated by social gaze in ASD Authors Shuo Wang, Ming Jiang, Xavier Morin Duchesne, Elizabeth A. Laugeson, Daniel P. Kennedy, Ralph Adolphs, Qi Zhao Correspondence [email protected] In Brief Wang et al. use a comprehensive saliency model and eye tracking to quantify the relative contributions of each image attribute to visual saliency. People with ASD demonstrate atypical visual attention across multiple levels and categories of objects. Wang et al., 2015, Neuron 88, 604–616 November 4, 2015 ª2015 Elsevier Inc. http://dx.doi.org/10.1016/j.neuron.2015.09.042

Welcome message from author
This document is posted to help you gain knowledge. Please leave a comment to let me know what you think about it! Share it to your friends and learn new things together.
Transcript

Article
Atypical Visual Saliency in
Autism SpectrumDisorder Quantified through Model-Based EyeTrackingHighlights
d A novel three-layered saliency model with 5,551 annotated
natural scene semantic objects
d People with ASD who have a stronger image center bias
regardless of object distribution
d Generally increased pixel-level saliency but decreased
semantic-level saliency in ASD
d Reduced saliency for faces and locations indicated by social
gaze in ASD
Wang et al., 2015, Neuron 88, 604–616November 4, 2015 ª2015 Elsevier Inc.http://dx.doi.org/10.1016/j.neuron.2015.09.042
Authors
Shuo Wang, Ming Jiang, Xavier Morin
Duchesne, Elizabeth A. Laugeson,
Daniel P. Kennedy, Ralph Adolphs, Qi
Zhao
In Brief
Wang et al. use a comprehensive saliency
model and eye tracking to quantify the
relative contributions of each image
attribute to visual saliency. People with
ASD demonstrate atypical visual
attention across multiple levels and
categories of objects.

Neuron
Article
Atypical Visual Saliencyin Autism Spectrum Disorder Quantifiedthrough Model-Based Eye TrackingShuo Wang,1,2,6 Ming Jiang,3,6 Xavier Morin Duchesne,4 Elizabeth A. Laugeson,5 Daniel P. Kennedy,4 Ralph Adolphs,1,2
and Qi Zhao3,*1Computation and Neural Systems, California Institute of Technology, Pasadena, CA 91125, USA2Humanities and Social Sciences, California Institute of Technology, Pasadena, CA 91125, USA3Department of Electrical and Computer Engineering, National University of Singapore, Singapore 117583, Singapore4Department of Psychological and Brain Sciences, Indiana University, Bloomington, IN 47405, USA5Department of Psychiatry and PEERS Clinic, Semel Institute for Neuroscience and Human Behavior, University of California, Los Angeles,
Los Angeles, CA 90024, USA6Co-first author
*Correspondence: [email protected]
http://dx.doi.org/10.1016/j.neuron.2015.09.042
SUMMARY
The social difficulties that are a hallmark of autismspectrum disorder (ASD) are thought to arise, at leastin part, from atypical attention toward stimuliand their features. To investigate this hypothesiscomprehensively, we characterized 700 complexnatural scene images with a novel three-layered sa-liency model that incorporated pixel-level (e.g.,contrast), object-level (e.g., shape), and semantic-level attributes (e.g., faces) on 5,551 annotated ob-jects. Compared with matched controls, peoplewith ASD had a stronger image center bias regard-less of object distribution, reduced saliency for facesand for locations indicated by social gaze, and yet ageneral increase in pixel-level saliency at theexpense of semantic-level saliency. These resultswere further corroborated by direct analysis of fixa-tion characteristics and investigation of feature inter-actions. Our results for the first time quantify atypicalvisual attention in ASD across multiple levels andcategories of objects.
INTRODUCTION
People with autism spectrum disorder (ASD) show altered
attention to, and preferences for, specific categories of visual in-
formation. When comparing social versus non-social stimuli, in-
dividuals with autism show reduced attention to faces as well as
to other social stimuli such as the human voice and hand ges-
tures but pay more attention to non-social objects (Dawson
et al., 2005; Sasson et al., 2011), notably including gadgets, de-
vices, vehicles, electronics, and other objects of idiosyncratic
‘‘special interest’’ (Kanner, 1943; South et al., 2005). Such atyp-
ical preferences are already evident early in infancy (Osterling
and Dawson, 1994), and the circumscribed attentional patterns
604 Neuron 88, 604–616, November 4, 2015 ª2015 Elsevier Inc.
in eye tracking data can be found in 2–5 year olds (Sasson
et al., 2011), as well as in children and adolescents (Sasson
et al., 2008). Several possibly related attentional differences
are reported in children with ASD as well, including reduced so-
cial and joint attention behaviors (Osterling and Dawson, 1994)
and orienting driven more by non-social contingencies rather
than biological motion (Klin et al., 2009). We recently showed
that people with ASD orient less toward socially relevant stimuli
during visual search, a deficit that appeared independent of low-
level visual properties of the stimuli (Wang et al., 2014). Taken
together, these findings suggest that visual attention in people
with ASD is driven by atypical saliency, especially in relation to
stimuli that are usually considered socially salient, such as faces.
However, the vast majority of prior studies has used restricted
or unnatural stimuli, e.g., faces and objects in isolation or even
stimuli with only low-level features. There is a growing recogni-
tion that it is important to probe visual saliency with more natural
stimuli (e.g., complex scenes taken with a natural background)
(Itti et al., 1998; Parkhurst and Niebur, 2005; Cerf et al., 2009;
Judd et al., 2009,; Chikkerur et al., 2010; Freeth et al., 2011;
Shen and Itti, 2012; Tseng et al., 2013; Xu et al., 2014), which
have greater ecological validity and likely provide a better under-
standing of how attention is deployed in people with ASD when
viewed in the real world (Ames and Fletcher-Watson, 2010).
Although still relatively rare, natural scene viewing has been
used to study attention in people with ASD, finding reduced
attention to faces and the eye region of faces (Klin et al., 2002;
Norbury et al., 2009; Riby and Hancock, 2009; Freeth et al.,
2010; Riby et al., 2013), reduced attention to social scenes (Bir-
mingham et al., 2011; Chawarska et al., 2013) and socially salient
aspects of the scenes (Shic et al., 2011; Rice et al., 2012), and
reduced attentional bias toward threat-related scenes when pre-
sented with pairs of emotional or neutral images (Santos et al.,
2012). However, people with ASD seem to have similar atten-
tional effects for animate objects, as do controls whenmeasured
with a change detection task (New et al., 2010).
What is missing in all these prior studies is a comprehensive
characterization of the various attributes of complex visual stim-
uli that could influence saliency. We aimed to address this issue

in the present study, using natural scenes with rich semantic
content to assess the spontaneous allocation of attention in a
context closer to real-world free viewing. Each scene included
multiple dominant objects rather than a central dominant one,
and we included both social and non-social objects to allow
direct investigation of the attributes that may differentially guide
attention in ASD. Natural scene stimuli are less controlled, there-
fore requiring more sophisticated computational methods for
analysis, along with a larger sampling of different images. We
therefore constructed a three-layered saliency model with a
principled vocabulary of pixel-, object-, and semantic-level attri-
butes, quantified for all the features present in 700 different nat-
ural images (Xu et al., 2014). Furthermore, unlike previous work
that focused on one or a few object categories with fixed prior
hypotheses (Benson et al., 2009; Freeth et al., 2010; New
et al., 2010; Santos et al., 2012), we used a data-driven approach
free of assumptions that capitalized on usingmachine learning to
provide an unbiased comparison among subject groups.
RESULTS
People with ASD Have Higher Saliency Weights forLow-Level Properties of Images but Lower Weights forObject- and Semantic-Based PropertiesTwenty people with ASD and 19 controls who matched on age,
IQ, gender, race, and education (see Experimental Procedures;
Table S1), freely viewed natural scene images for three seconds
each (see Experimental Procedures for details). As can be seen
qualitatively from the examples shown in Figure 1 (more exam-
ples in Figure S1), people with ASD made more fixations to the
center of the images (Figures 1A–1D), fixated on fewer objects
when multiple similar objects were present in the image (Figures
1E and 1F), and seemed to have atypical preferences for partic-
ular objects in natural images (Figures 1G–1L).
To formally quantify these phenomena and disentangle their
contribution to the overall viewing pattern of people with ASD,
we applied a computational saliency model with support vector
machine (SVM) classifier to evaluate the contribution of five
different factors in gaze allocation: (1) the image center, (2) the
grouped pixel-level (color, intensity, and orientation), (3) object-
level (size, complexity, convexity, solidity, and eccentricity), (4)
semantic-level (face, emotion, touched, gazed, motion, sound,
smell, taste, touch, text, watchability, and operability; see Fig-
ure S2A for examples) features shown in each image, and
(5) the background (i.e., regions without labeled objects) (see
Experimental Procedures and Figure 2A for a schematic over-
view of the computational saliency model; see Table 1 for
detailed description of features). Note that besides pixel-level
features, each labeled object always had all object-level features
andmay have one or multiple semantic-level features (i.e., its se-
mantic label[s]), whereas regions without labeled objects only
had pixel-level features.
Our computational saliency model could predict fixation allo-
cation with an area under the receiver operating characteristic
(ROC) curve (AUC) score of 0.936 ± 0.048 (mean ± SD across
700 images) for people with ASD and 0.935 ± 0.043 for controls
(paired t test, p = 0.52; see Supplemental Experimental Proce-
dures and Figures S2B and S2C), suggesting that all subsequent
reported differences between the two groups could not be attrib-
uted to differences in model fit between the groups. Model fit
was also in accordance with our prior work on an independent
sample of subjects and a different model training procedure
(Xu et al., 2014) (0.940 ± 0.042; Supplemental Experimental Pro-
cedures and Figures S2B and S2C). The computational saliency
model outputs a saliency weight for each feature, which repre-
sents the relative contribution of that feature to predict gaze
allocation. As can be seen in Figure 2B, there was a large image
center bias for both groups, a well-known effect (e.g., Binde-
mann, 2010). This was followed by effects driven by object-
and semantic-level features. Note that before training the SVM
classifier, we Z scored the feature vector for each feature dimen-
sion by subtracting it from its mean and dividing it by its SD. This
assured that saliency weights could be compared and were not
confounded by possibly different dynamic ranges for different
features.
Importantly, people with ASD had a significantly greater image
center, background, and pixel-level bias, but a reduced object-
level bias and semantic-level bias (see Figure 2B legend for sta-
tistical details). The ASD group did not have any greater variance
in saliency weights compared with controls (one-tailed F test; all
p > 0.94; significantly less variance for all features except pixel-
level features). Notably, when we controlled for individual differ-
ences in the duration of total valid eye tracking data (due to slight
differences in blinks, etc.; Figures S2D–S2G), as well as for
the Gaussian blob size for objects, and Gaussian map s for
analyzing the image center, we observed qualitatively the
same results (Figure S3), further assuring their robustness.
Finally, we addressed the important issue that the different fea-
tures in our model were necessarily intercorrelated to some
extent. We used a leave-one-feature-out approach (Yoshida
et al., 2012) that effectively isolates the non-redundant contribu-
tion of each feature by training the model each time with all but
one feature from the full model (‘‘minus-one’’ model). The ob-
tained relative contribution of features with this approach was
still consistent with the results shown in Figure 2B (Figure S3),
showing that our findings could not result from confounding cor-
relations among features in our stimulus set. Note that the very
first fixation in each trial was excluded from all analyses (see
Experimental Procedures) since each trial began with a drift
correction that required subjects to fixate on a dot at the very
center of the image to begin with.
When fitting the model for each fixation individually, fixation-
by-fixation analysis confirmed the above results and further re-
vealed how the relative importance of each factor evolved over
time (Figure 3). Over successive fixations, both subject groups
weighted objects (Figure 3D) and semantics (Figure 3E) more,
but low-level features (Figures 3A–3C) less, suggesting that there
was an increase in the role of top-down factors based on evalu-
ating the meaning of the stimuli over time. This observation is
consistent with previous findings that we initially use low-level
features in the image to direct our eyes (‘‘bottom-up attention’’),
but that scene understanding emerges as the dominant factor as
viewing proceeds (‘‘top-down attention’’) (Mannan et al., 2009;
Xu et al., 2014). The decreasing influence of the image center
over time resulted from exploration of the image with successive
fixations (Zhao and Koch, 2011). Importantly, people with ASD
Neuron 88, 604–616, November 4, 2015 ª2015 Elsevier Inc. 605

Figure 1. Examples of Natural Scene Stimuli and Fixation Densities from People with ASD and Controls
(A–L) Heat map represents the fixation density. People with ASD allocated more fixations to the image centers (A–D), fixated on fewer objects (E and F), and had
different semantic biases compared with controls (G–L). See also Figure S1.
606 Neuron 88, 604–616, November 4, 2015 ª2015 Elsevier Inc.

A B
Figure 2. Computational Saliency Model and Saliency Weights
(A) An overview of the computational saliency model. We applied a linear SVM classifier to evaluate the contribution of five general factors in gaze allocation: the
image center, the grouped pixel-level, object-level and semantic-level features, and the background. Feature maps were extracted from the input images and
included the three levels of features (pixel-, object-, and semantic-level) together with the image center and the background. We applied a pixel-based random
sampling to collect the training data and trained on the ground-truth actual fixation data. The SVM classifier output were the saliency weights, which represented
the relative importance of each feature in predicting gaze allocation.
(B) Saliency weights of grouped features. People with ASD had a greater image center bias (ASD: 0.99 ± 0.041 [mean ± SD]; controls: 0.90 ± 0.086; unpaired t test,
t(37) = 4.18, p = 1.72 3 10�4, effect size in Hedges’ g [standardized mean difference]: g = 1.34; permutation p < 0.001), a relatively greater pixel-level bias
(ASD: �0.094 ± 0.060; controls: �0.17 ± 0.087; t(37) = 3.06, p = 0.0041, g = 0.98; permutation p < 0.001), as well as background bias (ASD: �0.049 ± 0.030;
controls: �0.091 ± 0.052; t(37) = 3.09, p = 0.0038, g = 0.99; permutation p = 0.004), but a reduced object-level bias (ASD: 0.091 ± 0.067; controls: 0.20 ± 0.13;
t(37) = �3.47, p = 0.0014, g = �1.11; permutation p = 0.002) and semantic-level bias (ASD: 0.066 ± 0.059; controls: 0.16 ± 0.11; t(37) = �3.37, p = 0.0018,
g =�1.08; permutation p = 0.002). Error bar denotes the standard error over the group of subjects. Asterisks indicate significant difference between people with
ASD and controls using unpaired t test. **p < 0.01, ***p < 0.001. See also Figures S2, S3, and S4.
showed less of an increase in the weight of object and semantic
factors, compared with controls, resulting in increasing group
differences over time (Figures 3D and 3E) and a similar but in-
verted group divergence for effects of image background,
pixel-level saliency, and image centers (Figures 3A–3C). Similar
initial fixations were primarily driven by the large center bias for
both groups, while the diverged later fixations were driven by ob-
ject-based and semantic factors (note different y axis scales in
Figure 3).
Thus, these results show an atypically large saliency in favor of
low-level properties of images (image center, background tex-
tures, and pixel-level features) over object-based properties (ob-
ject and semantic features) in people with ASD. We further
explore the differences in center bias and semantic attributes
in the next sections.
People with ASD LookedMore at the Image Center Evenwhen There Was No ObjectWe examined whether the tendency to look at image center
could be attributed to stimulus content. We first selected all
images with no objects in the center 2� circular area, resulting
in a total of 99 images. We then compared the total number of
fixations in this area on these images. The ASD group had
more than twice the number of fixations of the control group
(ASD: 61.6 ± 34.1; controls: 29.1 ± 25.5; unpaired t test, t(37) =
3.36, p = 0.0018, effect size in Hedges’ g [standardized mean
difference]: g = 1.06; permutation p < 0.001). We further analyzed
temporal differences and observed that in the early stage of the
free-viewing (the first second) the difference was smaller (ASD:
14.5 ± 10.2; controls: 7.74 ± 8.42; t(37) = 2.23, p = 0.032,
g = 0.70; permutation p = 0.022), while in the second second
(ASD: 16.9 ± 12.6; controls: 6.74 ± 5.71; t(37) = 3.22,
p = 0.0027, g = 1.010; permutation p < 0.001) and the third sec-
ond (ASD: 30.3 ± 16.6; controls: 14.6 ± 13.9; t(37) = 3.18,
p = 0.0030, g = 1.00; permutation p = 0.008), the difference
was larger. In conclusion, these findings suggested that the
stronger center bias in people with ASD could not be attributed
to object distribution in the images.
The mean distance of all fixations from the image center was
significantly smaller than in the control group (ASD: 5.63 ±
0.56�; controls: 6.17 ± 0.60�; unpaired t test, t(37) = �2.92,
p = 0.0059, g = �0.92; permutation p = 0.010), and there were
more fixations at the image center than periphery compared
with the control group (Fisher’s exact test: p < 0.001). As viewing
proceeded, people with ASD also tended to return to fixating
more central locations, as shown by decreasing distance to cen-
ter for later fixations (Figure S4A). This re-centering was even
evident in individual trials.
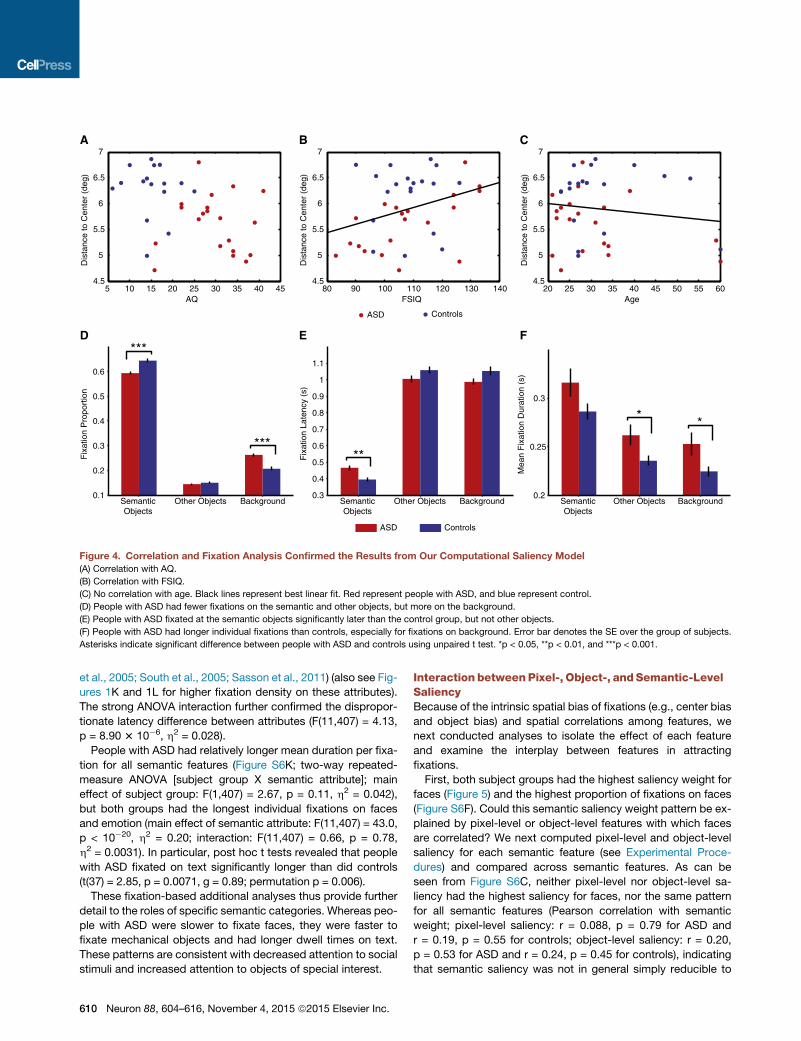
In exploratory analyses of individual differences, we found that
subjects with higher Autism Quotient (AQ) scores (Pearson cor-
relation; pooled ASD and controls: r = �0.42, p = 0.010; ASD
only: r = �0.0064, p = 0.98; controls only: r = �0.095, p = 0.73;
the correlation was primarily driven by the group difference; Fig-
ure 4A) and lower IQ (pooled ASD and controls: r = 0.33,
p = 0.039; Figure 4B) looked closer to the image center, suggest-
ing that stronger autistic traits and lower cognitive ability
contribute to a more pronounced center bias. However, we
found no correlation of center bias with age (pooled ASD and
controls: r = �0.15, p = 0.38; Figure 4C), arguing against any
simple explanation due to motor slowing. We note that these
Neuron 88, 604–616, November 4, 2015 ª2015 Elsevier Inc. 607
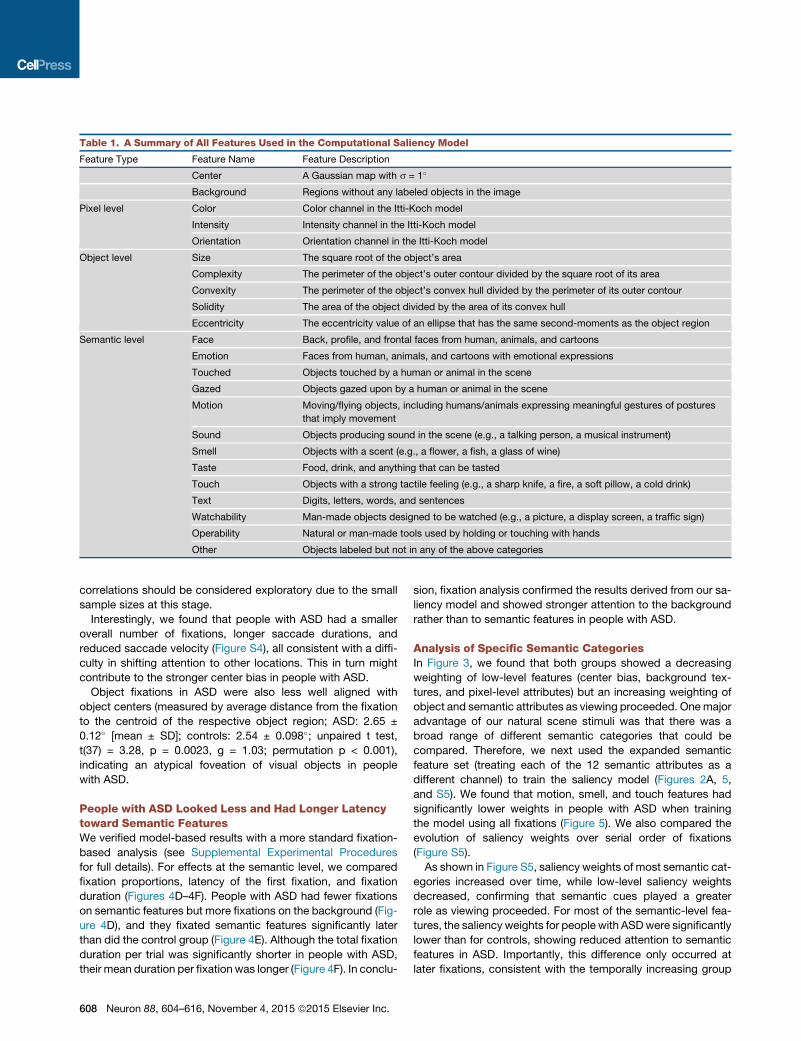
Table 1. A Summary of All Features Used in the Computational Saliency Model
Feature Type Feature Name Feature Description
Center A Gaussian map with s = 1�
Background Regions without any labeled objects in the image
Pixel level Color Color channel in the Itti-Koch model
Intensity Intensity channel in the Itti-Koch model
Orientation Orientation channel in the Itti-Koch model
Object level Size The square root of the object’s area
Complexity The perimeter of the object’s outer contour divided by the square root of its area
Convexity The perimeter of the object’s convex hull divided by the perimeter of its outer contour
Solidity The area of the object divided by the area of its convex hull
Eccentricity The eccentricity value of an ellipse that has the same second-moments as the object region
Semantic level Face Back, profile, and frontal faces from human, animals, and cartoons
Emotion Faces from human, animals, and cartoons with emotional expressions
Touched Objects touched by a human or animal in the scene
Gazed Objects gazed upon by a human or animal in the scene
Motion Moving/flying objects, including humans/animals expressing meaningful gestures of postures
that imply movement
Sound Objects producing sound in the scene (e.g., a talking person, a musical instrument)
Smell Objects with a scent (e.g., a flower, a fish, a glass of wine)
Taste Food, drink, and anything that can be tasted
Touch Objects with a strong tactile feeling (e.g., a sharp knife, a fire, a soft pillow, a cold drink)
Text Digits, letters, words, and sentences
Watchability Man-made objects designed to be watched (e.g., a picture, a display screen, a traffic sign)
Operability Natural or man-made tools used by holding or touching with hands
Other Objects labeled but not in any of the above categories
correlations should be considered exploratory due to the small
sample sizes at this stage.
Interestingly, we found that people with ASD had a smaller
overall number of fixations, longer saccade durations, and
reduced saccade velocity (Figure S4), all consistent with a diffi-
culty in shifting attention to other locations. This in turn might
contribute to the stronger center bias in people with ASD.
Object fixations in ASD were also less well aligned with
object centers (measured by average distance from the fixation
to the centroid of the respective object region; ASD: 2.65 ±
0.12� [mean ± SD]; controls: 2.54 ± 0.098�; unpaired t test,
t(37) = 3.28, p = 0.0023, g = 1.03; permutation p < 0.001),
indicating an atypical foveation of visual objects in people
with ASD.
People with ASD Looked Less and Had Longer Latencytoward Semantic FeaturesWe verified model-based results with a more standard fixation-
based analysis (see Supplemental Experimental Procedures
for full details). For effects at the semantic level, we compared
fixation proportions, latency of the first fixation, and fixation
duration (Figures 4D–4F). People with ASD had fewer fixations
on semantic features but more fixations on the background (Fig-
ure 4D), and they fixated semantic features significantly later
than did the control group (Figure 4E). Although the total fixation
duration per trial was significantly shorter in people with ASD,
their mean duration per fixation was longer (Figure 4F). In conclu-
608 Neuron 88, 604–616, November 4, 2015 ª2015 Elsevier Inc.
sion, fixation analysis confirmed the results derived from our sa-
liency model and showed stronger attention to the background
rather than to semantic features in people with ASD.
Analysis of Specific Semantic CategoriesIn Figure 3, we found that both groups showed a decreasing
weighting of low-level features (center bias, background tex-
tures, and pixel-level attributes) but an increasing weighting of
object and semantic attributes as viewing proceeded. Onemajor
advantage of our natural scene stimuli was that there was a
broad range of different semantic categories that could be
compared. Therefore, we next used the expanded semantic
feature set (treating each of the 12 semantic attributes as a
different channel) to train the saliency model (Figures 2A, 5,
and S5). We found that motion, smell, and touch features had
significantly lower weights in people with ASD when training
the model using all fixations (Figure 5). We also compared the
evolution of saliency weights over serial order of fixations
(Figure S5).
As shown in Figure S5, saliency weights of most semantic cat-
egories increased over time, while low-level saliency weights
decreased, confirming that semantic cues played a greater
role as viewing proceeded. For most of the semantic-level fea-
tures, the saliency weights for people with ASDwere significantly
lower than for controls, showing reduced attention to semantic
features in ASD. Importantly, this difference only occurred at
later fixations, consistent with the temporally increasing group

A B C D
1 2 3 4 5 6 7 8 9 10−0.1
−0.08
−0.06
−0.04
−0.02
0
0.02
Fixation Order
Background
1 2 3 4 5 6 7 8 9 100.85
0.9
0.95
1
1.05
1.1
Fixation Order
Sal
ienc
y W
eigh
t
Center
1 2 3 4 5 6 7 8 9 10−0.2
−0.15
−0.1
−0.05
0
0.05
Fixation Order
Pixel−Level
1 2 3 4 5 6 7 8 9 10−0.1
−0.05
0
0.05
0.1
0.15
0.2
0.25
Fixation Order
Object−Level
1 2 3 4 5 6 7 8 9 10−0.02
00.020.040.060.08
0.10.120.140.160.18
Fixation Order
Semantic−Level
ControlsASD
E*** * *** ** ** ** **** *** *** *** *** *** * *** ** *** ** ** ** ** *** ** *** *** ** *** ** *** ** *** *** ** ** **
Figure 3. Evolution of Saliency Weights of Grouped Features(A–E) Note that all data are excluded the starting fixation, which was always at a fixation dot located at the image center; thus, fixation number 1 shown in the
figure is the first fixation away from the location of the fixation dot post stimulus onset. Shaded area denotes ± SEM over the group of subjects. Asterisks indicate
significant difference between people with ASD and controls using unpaired t test. *p < 0.05, **p < 0.01, and ***p < 0.001.
differences in aggregate semantic weights we had shown earlier
(Figure 3).
It is notable that the weights of face and emotion attributes
were relatively high for initial fixations, suggesting that these
attributes attracted attention more rapidly, an effect that could
not be explained by a possible center bias for faces appearing
in the images (see Figures S6A and S6B). We next examined in
more detail the face and emotion attributes, two attributes that
are at the focus of autism research.
We first observed that people with ASD had marginally
reduced weights for faces (Figure 5; using all fixations: unpaired
t test, t(37) =�1.71, p = 0.095, g =�0.54; permutation p = 0.088;
also see Figure S5E for fixation-by-fixation weights; see Figures
1G and 1H for examples) but not emotion (t(37) = �0.042,
p = 0.97, g = �0.013; permutation p = 0.99), as well as a signif-
icant interaction (two-way repeated-measure ANOVA [subject
group X semantic attribute of face versus emotion]; main effect
of subject group: F(1,37) = 1.91, p = 0.17, h2 = 0.017; main effect
of semantic attribute: F(1,37) = 120, p = 3.423 10�13, h2 = 0.48;
interaction: F(1,37) = 4.17, p = 0.048, h2 = 0.017). The face attri-
bute contained all faces (neutral and emotional), and the emotion
attribute contained a subset of the faces from the face attribute
with emotional expressions (all faces with the emotion attribute
label also had the face attribute label by definition). These
patterns thus indicate that people with ASD had reduced atten-
tion toward faces, regardless of facial emotions, an effect
that became significant however only at later fixations (see
Figure S5E).
Additionally, people with ASD had reduced attention to look at
objects gazed upon by a human or animal in the scene (Figures
S5G and 5: t(37) = �1.88, p = 0.069, g = �0.60; permutation
p = 0.062; see Figures 1I and 1J for examples), consistent with
many other studies showing impaired joint attention in ASD
(Mundy et al., 1994; Osterling and Dawson, 1994; Leekam and
Ramsden, 2006; Brenner et al., 2007; Mundy et al., 2009; Freeth
et al., 2010; Chevallier et al., 2012). However, compared with
faces, people with ASD had disproportionately smaller atten-
tional difference in written text, another highly salient cue in nat-
ural scenes (Cerf et al., 2009; Xu et al., 2014) (Figure S5N).
Fixation-Based Analysis of Semantic FeaturesAn examination of fixation density corroborated the above re-
sults. In Figure S6F, we can see that people with ASD had fewer
fixations on all semantic features compared with controls (two-
way repeated-measure ANOVA [subject group X semantic attri-
bute]; main effect of subject group: F(1,407) = 18.6, p = 1.15 3
10�4, h2 = 0.0035; main effect of semantic attribute:
F(11,407) = 732, p < 10�20, h2 = 0.94; interaction: F(11,407) =
1.64, p = 0.084, h2 = 0.0021), especially for gazed, motion, taste,
touch, text, and watchability. Since different features had
different sizes and the larger the feature, the more likely it was
fixated, we analyzed maximum fixation density for each feature
so as to minimize this size effect—as long as fixations were
evenly spread out within features, the maximum density would
be similar. People with ASD still showed smaller fixation den-
sities for all semantic features (Figure S6G). Moreover, given
that the strong fixation center bias could lead to more fixations
on semantic features situated in the center of the image (Figures
S6A and S6E), we discounted the center bias by applying an in-
verted Gaussian kernel (Figure S6D) to the fixation distribution
and found similar results (Figure S6H). Finally, since the fixation
distribution was intrinsically spatially biased (Figure S6E), we
further removed this spatial bias by normalizing the fixation dis-
tribution to a spatially uniform distribution and then recomputed
fixation proportion. Again, results were similar (Figure S6I).
Since the computational saliency model was solely based on
fixation density without incorporating any information of fixation
latency and fixation duration, we next analyzed these two as-
pects through fixation-based analyses.
Both people with ASD and controls fixated on social attributes
like faces (combined neutral and emotional) and emotion
(emotional faces only) more rapidly than on other features
(two-way repeated-measure ANOVA [subject group X semantic
attribute]; main effect of semantic attribute: F(11,407) = 93.3,
p < 10�20, h2 = 0.63), consistent with their higher saliency
weights (more potent in attracting fixations). People with ASD
had in general compatible latency with controls (main effect of
subject group: F(1,407) = 0.039, p = 0.85,h2 = 9.483 10�5); how-
ever, notably, compared with controls, people with ASD were
significantly slower to fixate on face and emotion attributes,
but faster to fixate on the non-social attributes of operability (nat-
ural or man-made tools used by holding or touching with hands)
and touch (objects with a strong tactile feeling, e.g., a sharp
knife, a fire, a soft pillow, and a cold drink) (Figure S6J), consis-
tent with some of the categories of circumscribed interests that
have been reported in ASD (Lewis and Bodfish, 1998; Dawson
Neuron 88, 604–616, November 4, 2015 ª2015 Elsevier Inc. 609
5 10 15 20 25 30 35 40 454.5
5
5.5
6
6.5
7
AQ
Dis
tanc
e to
Cen
ter
(deg
)
80 90 100 110 120 130 1404.5
5
5.5
6
6.5
7
FSIQD
ista
nce
to C
ente
r (d
eg)
ASD Controls
20 25 30 35 40 45 50 55 604.5
5
5.5
6
6.5
7
Age
Dis
tanc
e to
Cen
ter
(deg
)
A B C
D E F
ASD Controls
Fix
atio
n P
ropo
rtio
n
***
***
SemanticObjects
Other Objects Background0.1
0.2
0.3
0.4
0.5
0.6
Fix
atio
n La
tenc
y (s
)
**
SemanticObjects
Other Objects Background0.3
0.4
0.5
0.6
0.7
0.8
0.9
1
1.1
Mea
n F
ixat
ion
Dur
atio
n (s
)
* *
SemanticObjects
Other Objects Background0.2
0.25
0.3
Figure 4. Correlation and Fixation Analysis Confirmed the Results from Our Computational Saliency Model
(A) Correlation with AQ.
(B) Correlation with FSIQ.
(C) No correlation with age. Black lines represent best linear fit. Red represent people with ASD, and blue represent control.
(D) People with ASD had fewer fixations on the semantic and other objects, but more on the background.
(E) People with ASD fixated at the semantic objects significantly later than the control group, but not other objects.
(F) People with ASD had longer individual fixations than controls, especially for fixations on background. Error bar denotes the SE over the group of subjects.
Asterisks indicate significant difference between people with ASD and controls using unpaired t test. *p < 0.05, **p < 0.01, and ***p < 0.001.
et al., 2005; South et al., 2005; Sasson et al., 2011) (also see Fig-
ures 1K and 1L for higher fixation density on these attributes).
The strong ANOVA interaction further confirmed the dispropor-
tionate latency difference between attributes (F(11,407) = 4.13,
p = 8.90 3 10�6, h2 = 0.028).
People with ASD had relatively longer mean duration per fixa-
tion for all semantic features (Figure S6K; two-way repeated-
measure ANOVA [subject group X semantic attribute]; main
effect of subject group: F(1,407) = 2.67, p = 0.11, h2 = 0.042),
but both groups had the longest individual fixations on faces
and emotion (main effect of semantic attribute: F(11,407) = 43.0,
p < 10�20, h2 = 0.20; interaction: F(11,407) = 0.66, p = 0.78,
h2 = 0.0031). In particular, post hoc t tests revealed that people
with ASD fixated on text significantly longer than did controls
(t(37) = 2.85, p = 0.0071, g = 0.89; permutation p = 0.006).
These fixation-based additional analyses thus provide further
detail to the roles of specific semantic categories. Whereas peo-
ple with ASD were slower to fixate faces, they were faster to
fixate mechanical objects and had longer dwell times on text.
These patterns are consistent with decreased attention to social
stimuli and increased attention to objects of special interest.
610 Neuron 88, 604–616, November 4, 2015 ª2015 Elsevier Inc.
Interaction betweenPixel-, Object-, and Semantic-LevelSaliencyBecause of the intrinsic spatial bias of fixations (e.g., center bias
and object bias) and spatial correlations among features, we
next conducted analyses to isolate the effect of each feature
and examine the interplay between features in attracting
fixations.
First, both subject groups had the highest saliency weight for
faces (Figure 5) and the highest proportion of fixations on faces
(Figure S6F). Could this semantic saliency weight pattern be ex-
plained by pixel-level or object-level features with which faces
are correlated? We next computed pixel-level and object-level
saliency for each semantic feature (see Experimental Proce-
dures) and compared across semantic features. As can be
seen from Figure S6C, neither pixel-level nor object-level sa-
liency had the highest saliency for faces, nor the same pattern
for all semantic features (Pearson correlation with semantic
weight; pixel-level saliency: r = 0.088, p = 0.79 for ASD and
r = 0.19, p = 0.55 for controls; object-level saliency: r = 0.20,
p = 0.53 for ASD and r = 0.24, p = 0.45 for controls), indicating
that semantic saliency was not in general simply reducible to

Sal
ienc
y W
eigh
t
Face
Emotion
TouchedGazed
MotionSound
SmellTaste
TouchText
Watchability
Operability
***
*
−0.02
0
0.02
0.04
0.06
0.08
0.1
0.12ASDControls
Figure 5. SaliencyWeights of Each of the 12
Semantic Features
We trained the classifier with the expanded full set
of semantic features, rather than pooling over
them (as in Figure 2B). Error bar denotes the SE
over the group of subjects. Asterisks indicate
significant difference between people with ASD
and controls using unpaired t test. *p < 0.05 and
**p < 0.01. See also Figures S5 and S6.
pixel- or object-level saliency. Furthermore, center bias (occupa-
tion of center, Figure S6A: r = 0.43, p = 0.16 for ASD and r = 0.52,
p = 0.083 for controls) and distribution of objects (distance
to center, Figure S6B: r = �0.067, p = 0.84 for ASD and
r = �0.0040, p = 0.99 for controls) could not explain semantic
saliency either. In conclusion, our results argue that semantic
saliency is largely independent of our set of low-level or object-
level attributes.
Second, we examined the role of pixel-level saliency and
object-level saliency when controlling for semantic saliency.
For each semantic feature, we computed pixel-level saliency
and object-level saliency for those semantic features that were
most fixated (top 30% fixated objects across all images and all
subjects) versus least fixated (bottom30%fixatedobjects across
all images and all subjects). Since comparisonsweremadewithin
the same semantic feature category, this analysis controlled se-
mantic preference and could study the impact of pixel- and
object-level saliency independently of semantic saliency.
We first explored two semantic features of interest—face and
text. More fixated faces had both higher pixel-level saliency (Fig-
ure 6A; two-way repeated-measure ANOVA [subject group X ob-
ject type]; main effect of object type: F(1,37) = 109, p = 1.38 3
10�12,h2 = 0.66) and object-level saliency (Figure 6B;main effect
of object type: F(1,37) = 201, p = 1.11 3 10�16, h2 = 0.79) than
less fixated faces. Similarly, more fixated texts also had higher
pixel-level saliency (Figure 6C; main effect of object type:
F(1,37) = 609, p < 10�20, h2 = 0.91) and object-level saliency (Fig-
ure 6D; main effect of object type: F(1,37) = 374, p < 10�20,
h2 = 0.88) than less fixated texts. These results suggested that
both pixel-level saliency and object-level saliency contributed
to attract more fixations to semantic features when controlling
for semantic meanings. Interestingly, we found no difference
between people with ASD and controls for all comparisons
(main effect of subject group: all p > 0.05; unpaired t test: all
p > 0.05), suggesting that the different saliency weight (Figure 5)
and fixation characteristics (Figure S6) of faces and text that we
reported above between people with ASD and controls were not
driven by pixel-level or object-level properties of faces and texts,
but resulted from processes related to interpretation of the se-
mantic meaning of those stimuli.
When we further analyzed the rest of the semantic features
(Figure S7), we found that all features had reduced pixel-level
Neuron 88, 604–616, N
saliency (main effect of object type: all
p < 0.01) and object-level saliency (all
p < 10�4) for less fixated objects, confirm-
ing the role of pixel-level and object-level
saliency in attracting attention. Again, we
found no difference between people with ASD and controls for all
comparisons (main effect of subject group: all p > 0.05; unpaired
t test: all p > 0.05) except gazed (Figure S7C; less fixated in ASD
for pixel- and object-level saliency) and operability (Figure S7J;
more fixated in ASD for object-level saliency only), suggesting
that pixel-level and object-level saliency played a minimal role
in reduced semantic saliency in people with ASD. This was
further supported by no interaction between subject group and
object type (all p > 0.05 except for gazed and operability).
Furthermore, we tried different definitions of more fixated and
less fixated objects (e.g., top versus bottom 10% fixated), and
we found qualitatively the same results. Finally, it is worth noting
that the positive contribution of pixel-level saliency to semantic
features does not conflict with its otherwise negative saliency
weight (compare Figure 3C) because (1) in the computational sa-
liency model, all fixations were considered, including those on
the background and other objects and (2) the negative samples
typically came from background textures instead of the less
fixated semantic objects here (semantic objects mostly con-
tained all positive samples) (see Discussion and Supplemental
Experimental Procedures for further details).
In summary, we found that pixel-level and object-level sa-
liency as well as center bias could not explain all of the saliency
of semantic features, whereas even when controlling for seman-
tic saliency, pixel-level and object-level saliency was potent in
attracting fixations. Importantly, neither pixel-level nor object-
level saliency alone could explain the reduced semantic saliency
that we found in ASD.
DISCUSSION
In this study, we used natural scenes and a general data-driven
computational saliency framework to study visual attention
deployment in people with ASD. Our model showed that people
with ASD had a stronger central fixation bias, stronger attention
toward low-level saliency, and weaker attention toward seman-
tic-level saliency. In particular, there was reduced attention to
faces and to objects of another’s gaze compared with controls,
an effect that became statistically significant mainly at later fixa-
tions. The strong center bias in ASD was related to slower
saccade velocity, but not fewer numbers of fixations nor object
distribution. Furthermore, temporal analysis revealed that all
ovember 4, 2015 ª2015 Elsevier Inc. 611

Obj
ect-
Leve
l Sal
ienc
y (T
ext)
Less Fixated More Fixated0.5
0.6
0.7
0.8
0.9
1
Obj
ect-
Leve
l Sal
ienc
y (F
ace)
Less Fixated More Fixated0.5
0.6
0.7
0.8
0.9
1
Pix
el-L
evel
Sal
ienc
y (T
ext)
Less Fixated More Fixated0.5
0.6
0.7
0.8
0.9
1
Pix
el-L
evel
Sal
ienc
y (F
ace)
Less Fixated More Fixated0.5
0.6
0.7
0.8
0.9
1
A B C D
ASD Controls
Figure 6. Pixel- and Object-Level Saliency for More versus Less Fixated Features
(A) Pixel-level saliency for more versus less fixated faces.
(B) Object-level saliency for more versus less fixated faces.
(C) Pixel-level saliency for more versus less fixated texts.
(D) Object-level saliency for more versus less fixated texts. More fixated was defined as those 30% of faces/texts that were most fixated across all images and all
subjects, and less fixated was defined as those 30% of faces/texts that were least fixated across all images and all subjects. Error bar denotes the SE over
objects. See also Figure S7.
attentional differences in people with ASD were most pro-
nounced at later fixations, when semantic-level effects generally
became more important. The results derived from the computa-
tional saliency model were further corroborated by direct anal-
ysis of fixation characteristics, which further revealed increased
saliency for operability (i.e., mechanical and manipulable ob-
jects) and for text in ASD. We also found that the semantic
saliency difference in ASD could not be explained solely by
low-level or object-level saliency.
Possible CaveatsBecause of an overall spatial bias in fixations and spatial corre-
lations among object features, interactions between saliency
weights are inevitable. For example, fixations tend to be on ob-
jects more often than on the background (Figure 4D), so pixel-
level saliency will be coupled with object- and semantic-level
saliency. If a fixated object has relatively lower pixel-level
saliency than the background or unfixated objects, then the
pixel-level saliency weights could be negative. Similarly, if the
center region of an image has lower pixel-level saliency, center
bias will lead to negative pixel-level saliency weights. To account
for such interactions, we repeated our analysis by discounting
the center bias using an inverted Gaussian kernel and by
normalizing the spatial distribution of fixations. We also analyzed
pixel-level and object-level saliency within a semantic feature
category. It is worth noting that even when training the model
with pixel-level features only (no object-level or semantic-level),
the trained saliency weight of ‘‘intensity’’ was still negative for
both groups, suggesting that subjects indeed fixated on some
regions with lower pixel-level saliency and the negative weights
were not computational artifacts of feature interactions.
It is important to keep in mind that, by and large, our images,
as well as the selection and judgment of some of the semantic
features annotated on them, were generated by people who
do not have autism. That is, the photographs shown in the im-
ages themselves were presumably taken mostly by people
who do not have autism (we do not know the details, of course).
612 Neuron 88, 604–616, November 4, 2015 ª2015 Elsevier Inc.
To some extent, it is thus possible that the stimuli and our anal-
ysis already builds in a bias and would not be fully representative
of how people with autism look at the world. There are two re-
sponses to this issue and a clear direction for future studies.
First, the large number of images drawn from an even larger
set ensures wide heterogeneity; it is thus highly likely that at least
some images will correspond to familiar and preferred items for
any given person, even though there are, of course, big individual
differences across people in such familiarity and preference (this
applies broadly to all people, not just to the comparison with
autism). Second, there is in fact good reason to think that people
with autism have generally similar experience and also share
many preferences to typically developed individuals. That is,
the case is not the same as if we were testing a secluded Amazo-
nian tribe who has never seen many of the objects shown in our
images. Our people with autism are all high-functioning individ-
uals that live in our shared environment; they interact with the
internet, all have cell phones, drive in cars, and so forth. Although
there are differences (e.g., the ones we discover in this paper),
they are sufficiently subtle that the general approach and set of
images is still valid. Finally, these considerations suggest an
obvious future experiment: have people with autism take digital
photos of their environment to use as stimuli and have people
with autism annotate the semantic aspects of the images—a
study beginning in our own laboratory.
Advantage of Our Stimuli, Model, and TaskIn this study, we used natural-scene stimuli to probe saliency
representation in people with ASD. Compared with most autism
studies using more restricted stimulus sets and/or more artificial
stimuli, our natural scene stimuli offer a rich platform to study
visual attention in autism under more ecologically relevant
conditions (Ames and Fletcher-Watson, 2010). Furthermore,
compared with previous studies that focused only on one or a
few hypothesized categories like faces (Freeth et al., 2010) or
certain scene types (Santos et al., 2012), our broad range of
semantic objects in a variety of scene contexts (see Figures 1
and S1; Experimental Procedures) offered a comprehensive
sample of natural scene objects, and we could thus readily
compare the relative contribution of multiple features to visual
attention abnormalities in people with ASD. Importantly, previ-
ous studies used either low-level stimuli or specific object cate-
gories but rarely studied their combined interactions or relative
contributions to attention. One prior study showed that when
examining fixations onto faces, pixel-level saliency does not
differ between individuals with ASD and controls within the first
five fixations (Freeth et al., 2011), consistent with our findings
in the present study (see Figure 3C).
Furthermore, compared with studies with explicit top-down
instructions (e.g., visual search tasks), the free-viewing para-
digm used in the present study assesses the spontaneous
allocation of attention in a context closer to real-world viewing
conditions. We previously found that people with ASD have
reduced attention to target-congruent objects in visual search
and that this abnormality is especially pronounced for faces
(Wang et al., 2014). Other studies using natural scenes have
found that people with ASD do not sample scenes according
to top-down instructions (Benson et al., 2009), whereas one
study reported normal attentional effects of animals and people
in a scene in a change detection task (New et al., 2010). How-
ever, all of these prior studies used a much smaller stimulus
set than we did in the present work, and none systematically
investigated the effects of specific low-level and high-level fac-
tors as we do here.
Finally, it is important to note that while our results are of
course relative to the stimulus set and the list of features we
used our selection of stimuli and features was unbiased with
respect to hypotheses about ASD (identical to those in a prior
study that was not about ASD at all; Xu et al., 2014). Similarly,
the parameters used in our modeling were not in any way biased
for hypotheses about ASD. Thus, the computational method that
quantified the group differences we report could contribute to
automated and data-driven classification and diagnosis for
ASD and aid in the identification of subtypes and outliers, as
has been demonstrated already for some other disorders (Tseng
et al., 2013).
Impaired Attentional Orienting in Natural ScenesPrevious work has reported deficits in orienting to both social
and non-social stimuli in people with ASD (e.g., Wang et al.,
2014 and Birmingham et al., 2011), and increased autistic traits
are associated with reduced social attention (Freeth et al.,
2013). Studies have shown that while children with autism are
able to allocate sustained attention (Garretson et al., 1990; Allen
and Courchesne, 2001), they have difficulties in disengagement
and shifting (Dawson et al., 1998; Swettenham et al., 1998). Our
results likewise showed that, in natural scene viewing, people
with ASD had longer dwell times on objects, a smaller overall
number of fixations, longer saccade durations, and reduced
saccade velocity, all consistent with a difficulty in shifting atten-
tion to other locations. Some of our stimuli contained multiple
objects of the same category or with similar semantic properties
(e.g., two cups in Figure 1E and two pictures in Figure 1F), but
people with ASD tended to focus on only one of the objects
rather than explore the entire image.
Altered Saliency Representation in ASDIn this study, we found reduced saliency for faces and gazed ob-
jects in ASD, consistent with prior work showing reduced atten-
tion to faces compared with inanimate objects (Dawson et al.,
2005; Sasson et al., 2011). Given our spatial resolution, we did
not analyze the features within faces, but it is known that the rela-
tive saliency of facial features is also altered in autism (Pelphrey
et al., 2002; Neumann et al., 2006; Spezio et al., 2007; Kliemann
et al., 2010). The atypical facial fixations are complemented by
neuronal evidence of abnormal processing of information from
the eye region of faces in blood-oxygen-level-dependent
(BOLD) fMRI (Kliemann et al., 2012) and in single cells recorded
from the amygdala in neurosurgical patients with ASD (Rutish-
auser et al., 2013). It is thus possible that at least some of the
reduced saliency for faces in ASD that we report in the present
paper derived from an atypical saliency for the features within
those faces.
We also report a reduced saliency toward gazed objects (ob-
jects in the image toward which people or animals in image are
looking), consistent with the well-studied abnormal joint atten-
tion in ASD (Mundy et al., 1994; Osterling and Dawson, 1994;
Leekam and Ramsden, 2006; Brenner et al., 2007; Mundy
et al., 2009; Freeth et al., 2010; Chevallier et al., 2012) (see Bir-
mingham and Kingstone, 2009 for a review). Neuroimaging
studies have shown that in autism, brain regions involved in
gaze processing, such as the superior temporal sulcus (STS)
region, are not sensitive to intentions conveyed by observed
gaze shifts (Pelphrey et al., 2005). In contrast, our fixation la-
tency analysis revealed that people with ASD had faster sac-
cades toward objects with the non-social feature of operability
(mechanical or manipulable objects), consistent with increased
valence rating on tools (especially hammer, wrench, scissors,
and lock) (Sasson et al., 2012) and special interest in gadgets
(South et al., 2005) in ASD. Thus, the decreased ASD saliency
we found for faces and objects of shared attention and the
increased saliency for mechanical/manipulable objects are
quite consistent with what one would predict from the prior
literature.
It remains an important further question to elucidate exactly
what it is that is driving the saliency differences we report here.
Saliency could arise from at least three separate factors:
(1) low-level image properties (encapsulated in our pixel-wise sa-
liency features), (2) reward value of objects (contributing to their
semantic saliency weights), and (3) information value of objects
(a less well understood factor that motivates people to look to lo-
cations where they expect to derive more information, such as
aspects of the scene about which they are curious). An increased
contribution of pixel-level saliency was apparent in our study, but
was not the only factor contributing to altered attention in ASD.
People with ASD have been reported to show a disproportionate
impairment in learning based on social reward (faces) compared
with monetary reward (Lin et al., 2012a) and have reduced pref-
erence for making donations to charities that benefit people (Lin
et al., 2012b). This suggests that at least some of the semantic-
level differences in saliency we report may derive from altered
reward value for those semantic features in ASD. Future studies
using instrumental learning tasks based on such semantic cate-
gories could further elucidate this issue (e.g., studies using
Neuron 88, 604–616, November 4, 2015 ª2015 Elsevier Inc. 613

faces, objects of shared attention, and mechanical objects as
the outcomes in reward learning tasks).
SummaryIn this comprehensive model-based study of visual saliency, we
found that (1) people with ASD look more at image centers, even
when there is no object at the center. This may be due in part to
slower overall saccade velocity. (2) Temporal analyses showed
that low-level saliency decreased but object- and semantic-level
saliency increased over time for both groups. However, saliency
weights diverged at later times, such that people with ASD
fixated more on regions with pixel-level saliency and less on re-
gions with object-level and semantic-level saliency. (3) People
with ASD had atypical attention to specific semantic objects:
they were slower to fixate on faces, but faster to fixate on
mechanical and manipulable objects. (4) Pixel- and object-level
saliency could not explain the group differences in semantic
saliency.
EXPERIMENTAL PROCEDURES
Subjects
Twenty high-functioning people with ASD were recruited (Table S1). All ASD
participants met DSM-IV/ICD-10 diagnostic criteria for autism, and all met
the cutoff scores for ASD on the Autism Diagnostic Observation Schedule
(ADOS) (Lord et al., 1989) and the Autism Diagnostic Interview-Revised
(ADI-R) (Le Couteur et al., 1989) or Social Communication Questionnaire
(SCQ) when an informant was available (Table S1). We assessed IQ for partic-
ipants using the Wechsler Abbreviated Scale of Intelligence (WASI). The ASD
group had a full scale IQ of 108.0 ± 15.6 (mean ± SD) and a mean age of 30.8 ±
11.1 years.
Nineteen neurologically and psychiatrically healthy subjects with no family
history of ASD were recruited as controls. Controls had a comparable full-
scale IQ of 108.2 ± 9.6 (t test, p = 0.95) and a comparable mean age of
32.3 ± 10.4 years (t test, p = 0.66). Controls were also matched on gender,
race, and education. As expected, the ASD group had higher scores than
controls in Social Responsiveness Scale-2 Adult Form Self Report (SRS-AR)
(ASD: 83.8 ± 18.5; control: 34.8 ± 16.4; p = 8.463 10�7) and Autism Spectrum
Quotient (AQ) (ASD: 29.6 ± 7.1; control: 15.2 ± 4.8; p = 5.45 3 10�8).
Subjects gave written informed consent, and the experiments were
approved by the Caltech Institutional Review Board. All subjects had normal
or corrected-to-normal visual acuity. No enrolled subjects were excluded for
any reasons.
Stimuli and Task
We employed a free-viewing task with natural scene images from the OSIE da-
taset. This dataset has been characterized and described in detail previously
(Xu et al., 2014). Briefly, the dataset contains 700 images, which have been
quantified according to three pixel-level attributes (color, intensity, and orien-
tation), five object-level attributes (size, complexity, convexity, solidity, and ec-
centricity), and 12 semantic attributes (face, emotion, touched, gazed, motion,
sound, smell, taste, touch, text, watchability, and operability) annotated on a
total of 5,551 segmented objects. Since there are a large number and variety
of objects in natural scenes, to make the ground truth data least dependent on
subjective judgments, we followed several guidelines for the segmentation, as
described in (Xu et al., 2014). Similar hand-labeled stimuli (Shen and Itti, 2012)
have demonstrated advantages in understanding the saliency contributions
from semantic features.
Images contain multiple dominant objects in a scene. The 12 semantic
attributes fall into four categories: (1) directly relating to humans (i.e., face,
emotion, touched, gazed), (2) objects with implied motion in the image,
(3) relating to other (non-visual) senses of humans (i.e., sound, smell, taste,
touch), and (4) designed to attract attention or for interaction with
humans (i.e., text, watchability, operability). The details of all attributes are
614 Neuron 88, 604–616, November 4, 2015 ª2015 Elsevier Inc.
described in Table 1, and some examples of semantic attributes are shown
in Figure S2A.
Subjects viewed 700 images freely for three seconds each, in random
orders. There was a drift correction before each trial. Images were randomly
grouped into seven blocks with each block containing 100 images. No trials
were excluded.
Computational Modeling and Data Analysis
We used SVM classification to analyze the eye tracking data. We built a three-
layered architecture including pixel-, object-, and semantic-level features (see
above). In addition, we included the image center and the background as fea-
tures in our model to account for the strong image center effect in people with
ASD. The SVMmodel was trained using the feature maps and the ground-truth
human fixation maps and generated as output feature weights, which were lin-
early combined to best fit the human fixation maps. Thus, feature weights rep-
resented the relative contribution of each feature in predicting gaze allocation.
A schematic flow chart of themodel is detailed in Figure 2A. Importantly, sepa-
rate models were trained individually (and hence saliency weights derived
individually) for each individual subject, permitting statistical comparisons be-
tween ASD and control groups.
To compute the feature maps, we resized each image to 200 3 150 pixels.
The pixel-level feature maps were generated using the well-known Itti-Koch
saliency model (Itti et al., 1998), while the object- and semantic-level feature
maps were generated by placing a 2D Gaussian blob (s = 2�) at each object’s
center. The Gaussian blobs only existed in the maps representing the corre-
sponding attributes. The magnitude of the Gaussian was the calculated ob-
ject-level or manually labeled semantic-level feature value.
To learn this model from the ground-truth human fixation maps (plotting all
fixation points with a Gaussian blur, s = 1�), 100 pixels in each image were
randomly sampled from the 10% most fixated regions as positive samples,
and 300 pixels were sampled from the 30% least fixated regions as negative
samples. All samples were normalized to have zero mean and unit variance
in the feature space. Different from Xu et al. (2014), where fixations were
pooled from all subjects to generate a fixation map for model learning, in
this work, we learned one SVM model for each individual subject in order to
statistically compare the attribute weights between people with ASD and
controls.
In the saliency interaction analysis, pixel-level saliency for each object was
selected as the maximum value of the object region in order to minimize the
object size effect. This was because big objects tend to include uniform texture
regions and thus have much smaller average pixel-level saliency, while fixa-
tions were normally attracted to the most salient region of an object. Thus,
maximum saliency rather than average saliency was more representative of
pixel-level saliency of an object. By definition, object-level saliency was
computed as a single value for each object (Xu et al., 2014). Our center bias
feature was defined as a Gaussian map (s = 1�) around the image center
(Figure 2A).
In order to compare themodel fit between people with ASD and controls, we
also pooled all fixations for each group and used a subset of the data to train
the model and a subset of data to test the model. Details of this model training
and testing to compare model fit between groups are described in Supple-
mental Experimental Procedures.
In all analyses, we excluded the very first fixation since it was always in the
center due to preceding drift correction. In fixation-by-fixation analyses, we
included the subsequent first ten fixations based on the average number of fix-
ations for both groups. For trials with less than ten fixations, we included data
up to their last fixation, and thus, there were fewer trials being averaged
together for these later fixations.
Eye tracking, permutation, and fixation analyses methods are described in
Supplemental Experimental Procedures.
SUPPLEMENTAL INFORMATION
Supplemental Information includes Supplemental Experimental Procedures,
seven figures, and one table and can be found with this article online at
http://dx.doi.org/10.1016/j.neuron.2015.09.042.

AUTHOR CONTRIBUTIONS
S.W., D.P.K., R.A., and Q.Z. designed experiments. S.W., M.J., and X.M.D.
performed experiments. S.W., M.J., and Q.Z. analyzed data. E.A.L. helped
with subject recruitment and assessment. S.W., R.A., and Q.Z. wrote the pa-
per. All authors discussed the results and contributed toward the manuscript.
ACKNOWLEDGMENTS
We thank Elina Veytsman and Jessica Hopkins for help in recruiting research
participants, Justin Lee and Tim Armstrong for collecting the data, Lynn Paul
for psychological assessments, and Laurent Itti for valuable comments. This
research was supported by a post-doctoral fellowship from the Autism
Science Foundation (S.W.), a Fonds de Recherche du Quebec en Nature
et Technologies (FRQNT) predoctoral fellowship (X.M.D.), a NIH grant
(K99MH094409/R00MH094409) and NARSAD Young Investigator Award
(D.P.K.), the Caltech Conte Center for the Neurobiology of Social Decision
Making from NIMH and a grant from Simons Foundation (SFARI Award
346839, R.A.), and the Singapore Defense Innovative Research Program
9014100596 and the Singapore Ministry of Education Academic Research
Fund Tier 2 MOE2014-T2-1-144 (Q.Z.).
Received: April 25, 2015
Revised: July 21, 2015
Accepted: September 21, 2015
Published: October 22, 2015
REFERENCES
Allen, G., and Courchesne, E. (2001). Attention function and dysfunction in
autism. Front. Biosci. 6, D105–D119.
Ames, C., and Fletcher-Watson, S. (2010). A review of methods in the study of
attention in autism. Dev. Rev. 30, 52–73.
Benson, V., Piper, J., and Fletcher-Watson, S. (2009). Atypical saccadic scan-
ning in autistic spectrum disorder. Neuropsychologia 47, 1178–1182.
Bindemann, M. (2010). Scene and screen center bias early eye movements in
scene viewing. Vision Res. 50, 2577–2587.
Birmingham, E., and Kingstone, A. (2009). Human social attention: A new look
at past, present, and future investigations. Ann. N Y Acad. Sci. 1156, 118–140.
Birmingham, E., Cerf, M., and Adolphs, R. (2011). Comparing social attention
in autism and amygdala lesions: effects of stimulus and task condition. Soc.
Neurosci. 6, 420–435.
Brenner, L.A., Turner, K.C., and Muller, R.-A. (2007). Eye movement and visual
search: are there elementary abnormalities in autism? J. Autism Dev. Disord.
37, 1289–1309.
Cerf, M., Frady, E.P., and Koch, C. (2009). Faces and text attract gaze inde-
pendent of the task: Experimental data and computer model. J. Vis. 9, 1–15.
Chawarska, K., Macari, S., and Shic, F. (2013). Decreased spontaneous atten-
tion to social scenes in 6-month-old infants later diagnosed with autism spec-
trum disorders. Biol. Psychiatry 74, 195–203.
Chevallier, C., Kohls, G., Troiani, V., Brodkin, E.S., and Schultz, R.T. (2012).
The social motivation theory of autism. Trends Cogn. Sci. 16, 231–239.
Chikkerur, S., Serre, T., Tan, C., and Poggio, T. (2010). What and where: a
Bayesian inference theory of attention. Vision Res. 50, 2233–2247.
Dawson, G., Meltzoff, A.N., Osterling, J., Rinaldi, J., and Brown, E. (1998).
Children with autism fail to orient to naturally occurring social stimuli.
J. Autism Dev. Disord. 28, 479–485.
Dawson, G., Webb, S.J., and McPartland, J. (2005). Understanding the nature
of face processing impairment in autism: insights from behavioral and electro-
physiological studies. Dev. Neuropsychol. 27, 403–424.
Freeth, M., Chapman, P., Ropar, D., and Mitchell, P. (2010). Do gaze cues in
complex scenes capture and direct the attention of high functioning adoles-
cents with ASD? Evidence from eye-tracking. J. Autism Dev. Disord. 40,
534–547.
Freeth, M., Foulsham, T., and Chapman, P. (2011). The influence of visual sa-
liency on fixation patterns in individuals with Autism Spectrum Disorders.
Neuropsychologia 49, 156–160.
Freeth, M., Foulsham, T., and Kingstone, A. (2013). What affects social atten-
tion? Social presence, eye contact and autistic traits. PLoS ONE 8, e53286.
Garretson, H.B., Fein, D., and Waterhouse, L. (1990). Sustained attention in
children with autism. J. Autism Dev. Disord. 20, 101–114.
Itti, L., Koch, C., and Niebur, E. (1998). A model of saliency-based visual atten-
tion for rapid scene analysis. IEEE Trans. Pattern Anal. Mach. Intell. 20, 1254–
1259.
Judd, T., Ehinger, K., Durand, F., and Torralba, A. (2009). Learning to predict
where humans look. In Proceedings of the 2009 IEEE 12th International
Conference on Computer Vision (IEEE), pp. 2106–2113.
Kanner, L. (1943). Autistic disturbances of affective contact. The NervousChild
2, 217–250.
Kliemann, D., Dziobek, I., Hatri, A., Steimke, R., and Heekeren, H.R. (2010).
Atypical reflexive gaze patterns on emotional faces in autism spectrum disor-
ders. J. Neurosci. 30, 12281–12287.
Kliemann, D., Dziobek, I., Hatri, A., Baudewig, J., and Heekeren, H.R. (2012).
The role of the amygdala in atypical gaze on emotional faces in autism spec-
trum disorders. J. Neurosci. 32, 9469–9476.
Klin, A., Jones, W., Schultz, R., Volkmar, F., and Cohen, D. (2002). Visual fixa-
tion patterns during viewing of naturalistic social situations as predictors of so-
cial competence in individuals with autism. Arch. Gen. Psychiatry 59, 809–816.
Klin, A., Lin, D.J., Gorrindo, P., Ramsay, G., and Jones, W. (2009). Two-year-
olds with autism orient to non-social contingencies rather than biological mo-
tion. Nature 459, 257–261.
Le Couteur, A., Rutter, M., Lord, C., Rios, P., Robertson, S., Holdgrafer, M.,
and McLennan, J. (1989). Autism diagnostic interview: a standardized investi-
gator-based instrument. J. Autism Dev. Disord. 19, 363–387.
Leekam, S.R., and Ramsden, C.A. (2006). Dyadic orienting and joint attention
in preschool children with autism. J. Autism Dev. Disord. 36, 185–197.
Lewis, M.H., and Bodfish, J.W. (1998). Repetitive behavior disorders in autism.
Ment. Retard. Dev. Disabil. Res. Rev. 4, 80–89.
Lin, A., Rangel, A., and Adolphs, R. (2012a). Impaired learning of social
compared to monetary rewards in autism. Front. Neurosci. 6, 143.
Lin, A., Tsai, K., Rangel, A., and Adolphs, R. (2012b). Reduced social prefer-
ences in autism: evidence from charitable donations. J. Neurodev. Disord. 4, 8.
Lord, C., Rutter, M., Goode, S., Heemsbergen, J., Jordan, H., Mawhood, L.,
and Schopler, E. (1989). Autism diagnostic observation schedule: a standard-
ized observation of communicative and social behavior. J. Autism Dev. Disord.
19, 185–212.
Mannan, S.K., Kennard, C., and Husain, M. (2009). The role of visual salience in
directing eye movements in visual object agnosia. Curr. Biol. 19, R247–R248.
Mundy, P., Sigman, M., and Kasari, C. (1994). The theory of mind and joint-
attention deficits in autism. In Understanding Other Minds: Perspectives
from Autism, S. Baron-Cohen, H. Tager-Flusberg, and M.V. Lombardo, eds.
(Oxford University Press), pp. 181–203.
Mundy, P., Sullivan, L., and Mastergeorge, A.M. (2009). A parallel and distrib-
uted-processing model of joint attention, social cognition and autism. Autism
Res. 2, 2–21.
Neumann, D., Spezio, M.L., Piven, J., and Adolphs, R. (2006). Looking you in
the mouth: abnormal gaze in autism resulting from impaired top-down modu-
lation of visual attention. Soc. Cogn. Affect. Neurosci. 1, 194–202.
New, J.J., Schultz, R.T., Wolf, J., Niehaus, J.L., Klin, A., German, T.C., and
Scholl, B.J. (2010). The scope of social attention deficits in autism: prioritized
orienting to people and animals in static natural scenes. Neuropsychologia 48,
51–59.
Norbury, C.F., Brock, J., Cragg, L., Einav, S., Griffiths, H., and Nation, K.
(2009). Eye-movement patterns are associated with communicative compe-
tence in autistic spectrum disorders. J. Child Psychol. Psychiatry 50, 834–842.
Neuron 88, 604–616, November 4, 2015 ª2015 Elsevier Inc. 615
Osterling, J., and Dawson, G. (1994). Early recognition of children with autism:
a study of first birthday home videotapes. J. Autism Dev. Disord. 24, 247–257.
Parkhurst, D., and Niebur, E. (2005). Stimulus-driven guidance of visual atten-
tion in natural scenes. In Neurobiology of Attention, L. Itti, G. Rees, and J.K.
Tsotsos, eds. (Academic Press/Elsevier), pp. 240–245.
Pelphrey, K.A., Sasson, N.J., Reznick, J.S., Paul, G., Goldman, B.D., and
Piven, J. (2002). Visual scanning of faces in autism. J. Autism Dev. Disord.
32, 249–261.
Pelphrey, K.A., Morris, J.P., andMcCarthy, G. (2005). Neural basis of eye gaze
processing deficits in autism. Brain 128, 1038–1048.
Riby, D., and Hancock, P.J.B. (2009). Looking at movies and cartoons: eye-
tracking evidence from Williams syndrome and autism. J. Intellect. Disabil.
Res. 53, 169–181.
Riby, D.M., Hancock, P.J., Jones, N., and Hanley, M. (2013). Spontaneous
and cued gaze-following in autism and Williams syndrome. J. Neurodev.
Disord. 5, 13.
Rice, K., Moriuchi, J.M., Jones, W., and Klin, A. (2012). Parsing heterogeneity
in autism spectrum disorders: visual scanning of dynamic social scenes in
school-aged children. J. Am. Acad. Child Adolesc. Psychiatry 51, 238–248.
Rutishauser, U., Tudusciuc, O., Wang, S., Mamelak, A.N., Ross, I.B., and
Adolphs, R. (2013). Single-neuron correlates of atypical face processing in
autism. Neuron 80, 887–899.
Santos, A., Chaminade, T., Da Fonseca, D., Silva, C., Rosset, D., and Deruelle,
C. (2012). Just another social scene: evidence for decreased attention to nega-
tive social scenes in high-functioning autism. J. Autism Dev. Disord. 42, 1790–
1798.
Sasson, N.J., Turner-Brown, L.M., Holtzclaw, T.N., Lam, K.S.L., and Bodfish,
J.W. (2008). Children with autism demonstrate circumscribed attention during
passive viewing of complex social and nonsocial picture arrays. Autism Res. 1,
31–42.
Sasson, N.J., Elison, J.T., Turner-Brown, L.M., Dichter, G.S., and Bodfish,
J.W. (2011). Brief report: Circumscribed attention in young children with
autism. J. Autism Dev. Disord. 41, 242–247.
616 Neuron 88, 604–616, November 4, 2015 ª2015 Elsevier Inc.
Sasson, N.J., Dichter, G.S., and Bodfish, J.W. (2012). Affective responses by
adults with autism are reduced to social images but elevated to images related
to circumscribed interests. PLoS ONE 7, e42457.
Shen, J., and Itti, L. (2012). Top-down influences on visual attention during
listening are modulated by observer sex. Vision Res. 65, 62–76.
Shic, F., Bradshaw, J., Klin, A., Scassellati, B., and Chawarska, K. (2011).
Limited activity monitoring in toddlers with autism spectrum disorder. Brain
Res. 1380, 246–254.
South, M., Ozonoff, S., and McMahon, W.M. (2005). Repetitive behavior pro-
files in Asperger syndrome and high-functioning autism. J. Autism Dev.
Disord. 35, 145–158.
Spezio, M.L., Adolphs, R., Hurley, R.S.E., and Piven, J. (2007). Analysis of face
gaze in autism using ‘‘Bubbles’’. Neuropsychologia 45, 144–151.
Swettenham, J., Baron-Cohen, S., Charman, T., Cox, A., Baird, G., Drew, A.,
Rees, L., and Wheelwright, S. (1998). The frequency and distribution of spon-
taneous attention shifts between social and nonsocial stimuli in autistic, typi-
cally developing, and nonautistic developmentally delayed infants. J. Child
Psychol. Psychiatry 39, 747–753.
Tseng, P.-H., Cameron, I.G., Pari, G., Reynolds, J.N., Munoz, D.P., and Itti, L.
(2013). High-throughput classification of clinical populations from natural
viewing eye movements. J. Neurol. 260, 275–284.
Wang, S., Xu, J., Jiang, M., Zhao, Q., Hurlemann, R., and Adolphs, R. (2014).
Autism spectrum disorder, but not amygdala lesions, impairs social attention
in visual search. Neuropsychologia 63, 259–274.
Xu, J., Jiang, M., Wang, S., Kankanhalli, M.S., and Zhao, Q. (2014). Predicting
human gaze beyond pixels. J. Vis. 14, 28.
Yoshida, M., Itti, L., Berg, D.J., Ikeda, T., Kato, R., Takaura, K., White, B.J.,
Munoz, D.P., and Isa, T. (2012). Residual attention guidance in blindsight mon-
keys watching complex natural scenes. Curr. Biol. 22, 1429–1434.
Zhao, Q., and Koch, C. (2011). Learning a saliency map using fixated locations
in natural scenes. J. Vis. 11, 9.
Related Documents