1 The world leader in serving science Proprietary & Confidential Daisy Kuo Assistant Product Manager, SEA/TW Life Sciences Solutions Attune NxT: Acoustic Focusing Flow Cytometer Experience the Ultimate Speed without Compromising Performance

Welcome message from author
This document is posted to help you gain knowledge. Please leave a comment to let me know what you think about it! Share it to your friends and learn new things together.
Transcript
1
The world leader in serving science
Proprietary & Confidential
Daisy KuoAssistant Product Manager, SEA/TW
Life Sciences Solutions
Attune NxT: Acoustic Focusing Flow Cytometer
Experience the Ultimate Speed without Compromising Performance
2
The world leader in serving science
Introduction to Flow Cytometry
3
What is Flow Cytometry?
CYTOMETRY is the measurement of physical or chemical characteristics of cells or particles
FLOW CYTOMETRY measurements are made as individual cells or particles in flowing stream pass through a flow cytometry instrument
• Performed on single cell suspensions
• Provides discrete measurements from each cell in the sample
• Provides a distribution of the measured characteristics in the sample
4
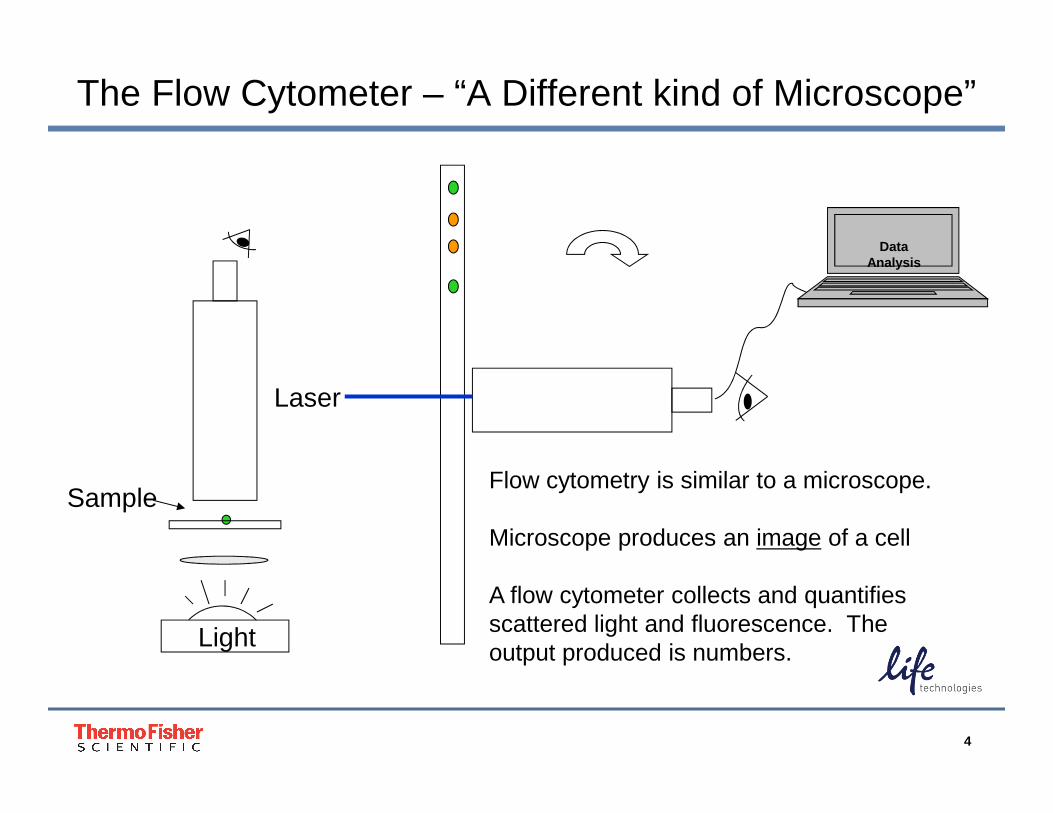
The Flow Cytometer – “A Different kind of Microscope”
Light
Sample
Laser
Data Analysis
Flow cytometry is similar to a microscope.
Microscope produces an image of a cell
A flow cytometer collects and quantifies scattered light and fluorescence. The output produced is numbers.
5
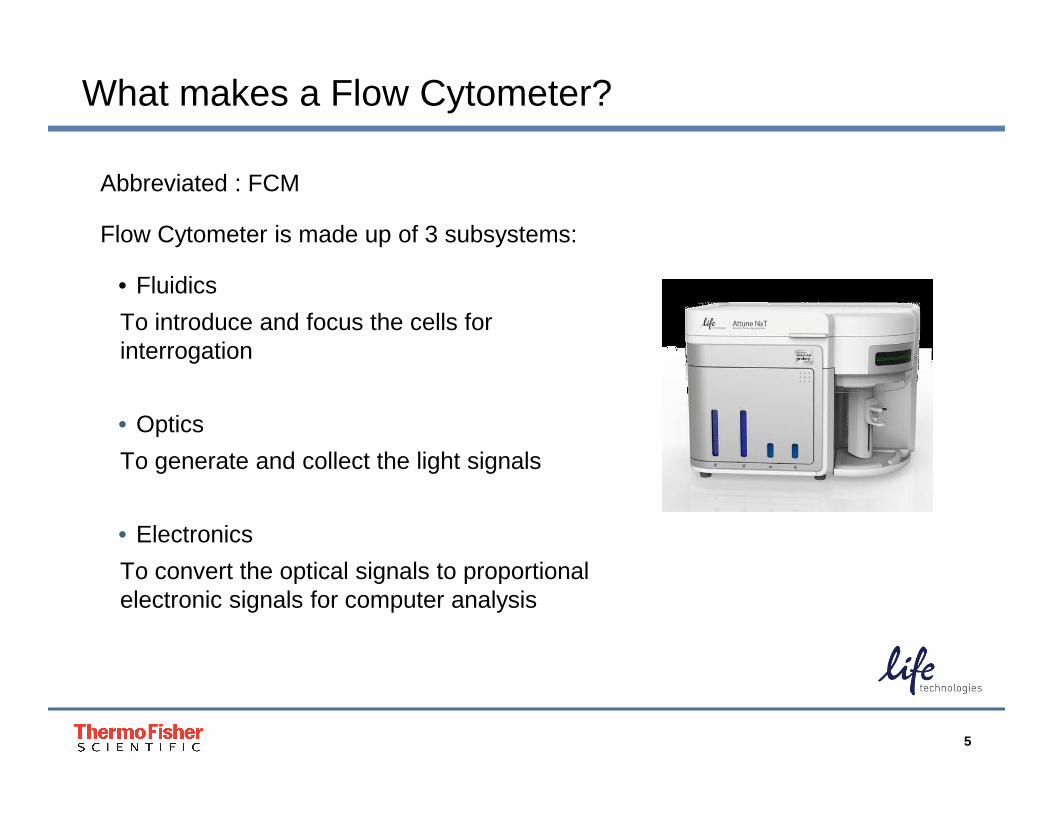
What makes a Flow Cytometer?
Abbreviated : FCM
Flow Cytometer is made up of 3 subsystems:
• Fluidics
To introduce and focus the cells for interrogation
• Optics
To generate and collect the light signals
• Electronics
To convert the optical signals to proportional electronic signals for computer analysis
6
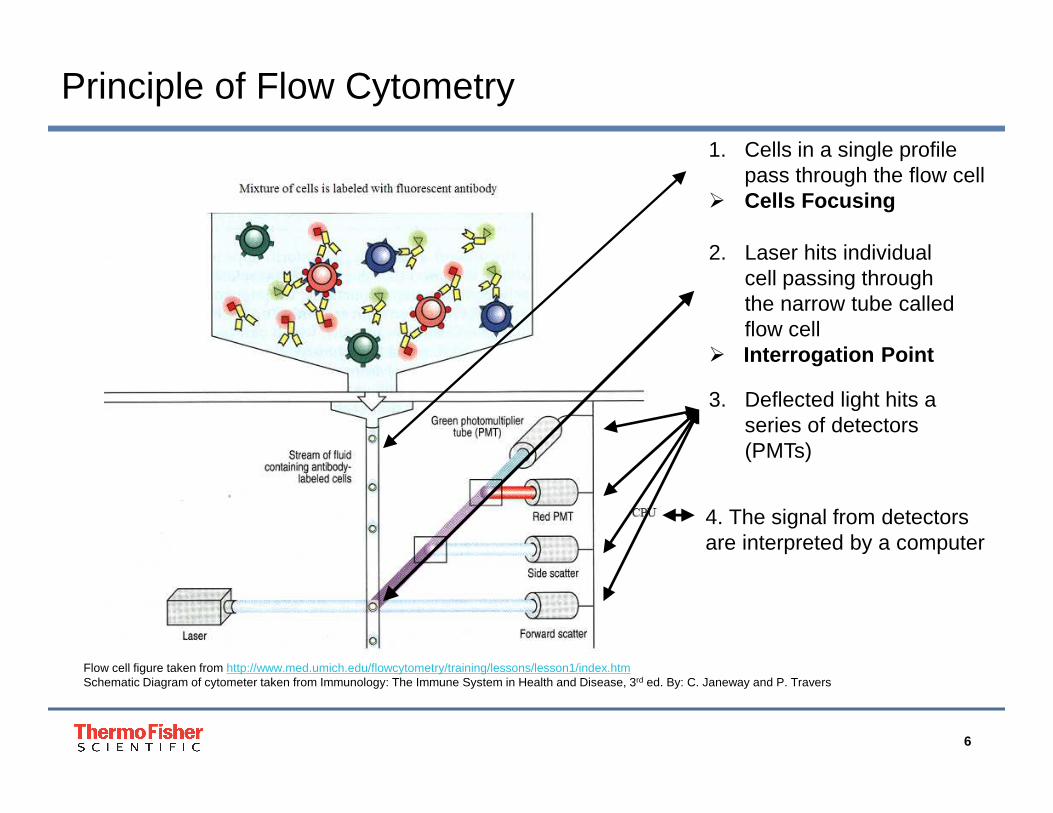
1. Cells in a single profile pass through the flow cell
� Cells Focusing
2. Laser hits individual cell passing through the narrow tube called flow cell
� Interrogation Point
3. Deflected light hits a series of detectors (PMTs)
4. The signal from detectors are interpreted by a computer
Flow cell figure taken from http://www.med.umich.edu/flowcytometry/training/lessons/lesson1/index.htmSchematic Diagram of cytometer taken from Immunology: The Immune System in Health and Disease, 3rd ed. By: C. Janeway and P. Travers
Principle of Flow Cytometry
7
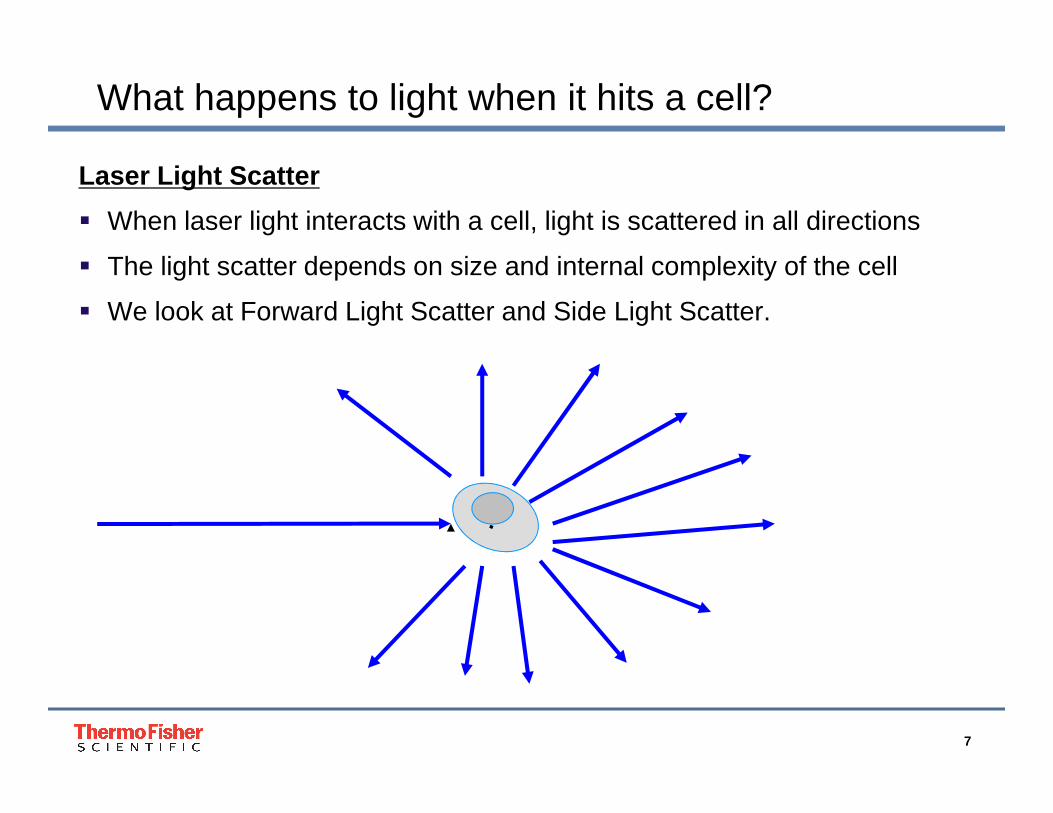
What happens to light when it hits a cell?
Laser Light Scatter
� When laser light interacts with a cell, light is scattered in all directions
� The light scatter depends on size and internal complexity of the cell
� We look at Forward Light Scatter and Side Light Scatter.
8
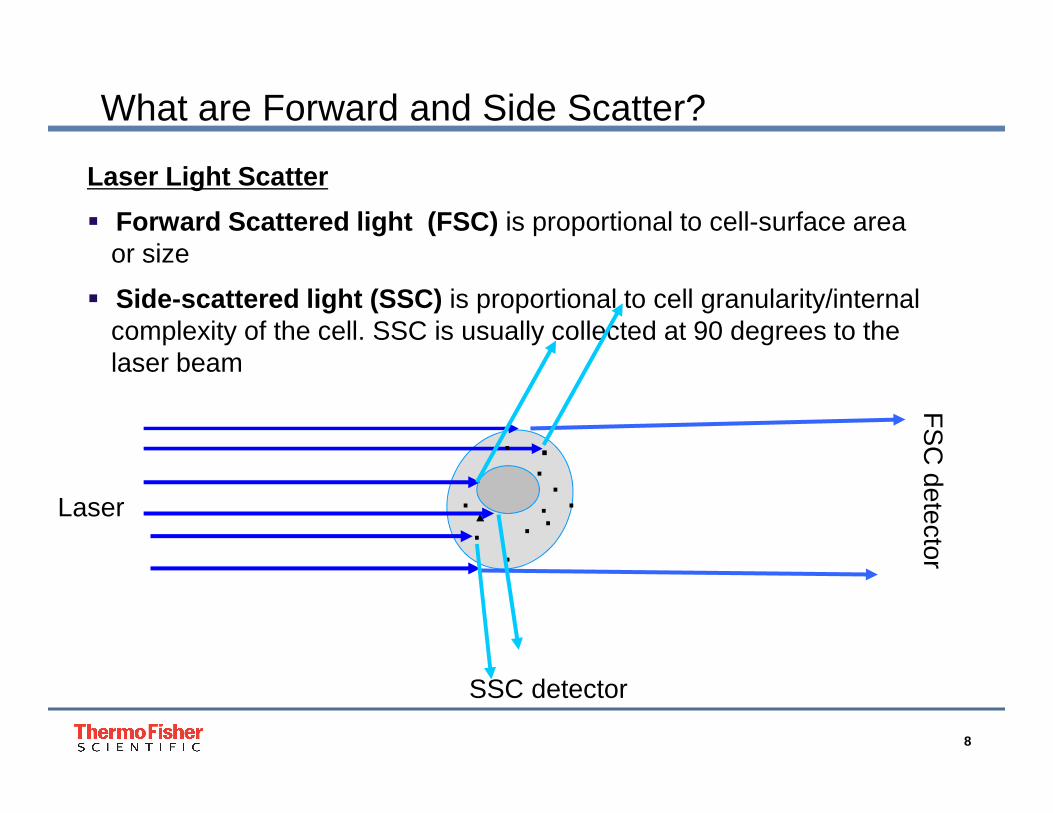
What are Forward and Side Scatter?
Laser Light Scatter
� Forward Scattered light (FSC) is proportional to cell-surface area or size
� Side-scattered light (SSC) is proportional to cell granularity/internal complexity of the cell. SSC is usually collected at 90 degrees to the laser beam
.
..
....
.
. .
.Laser
FS
C detector
SSC detector
9
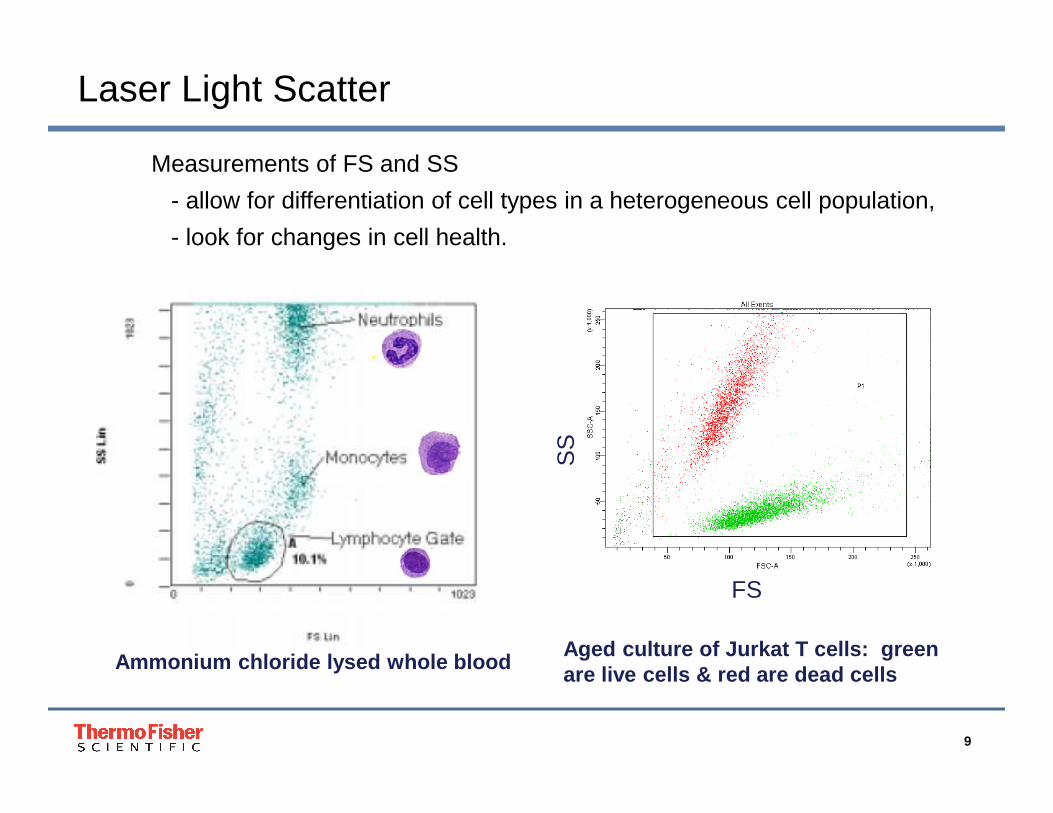
Laser Light Scatter
Measurements of FS and SS
- allow for differentiation of cell types in a heterogeneous cell population,
- look for changes in cell health.
Ammonium chloride lysed whole bloodAged culture of Jurkat T cells: green are live cells & red are dead cells
FSS
S
10
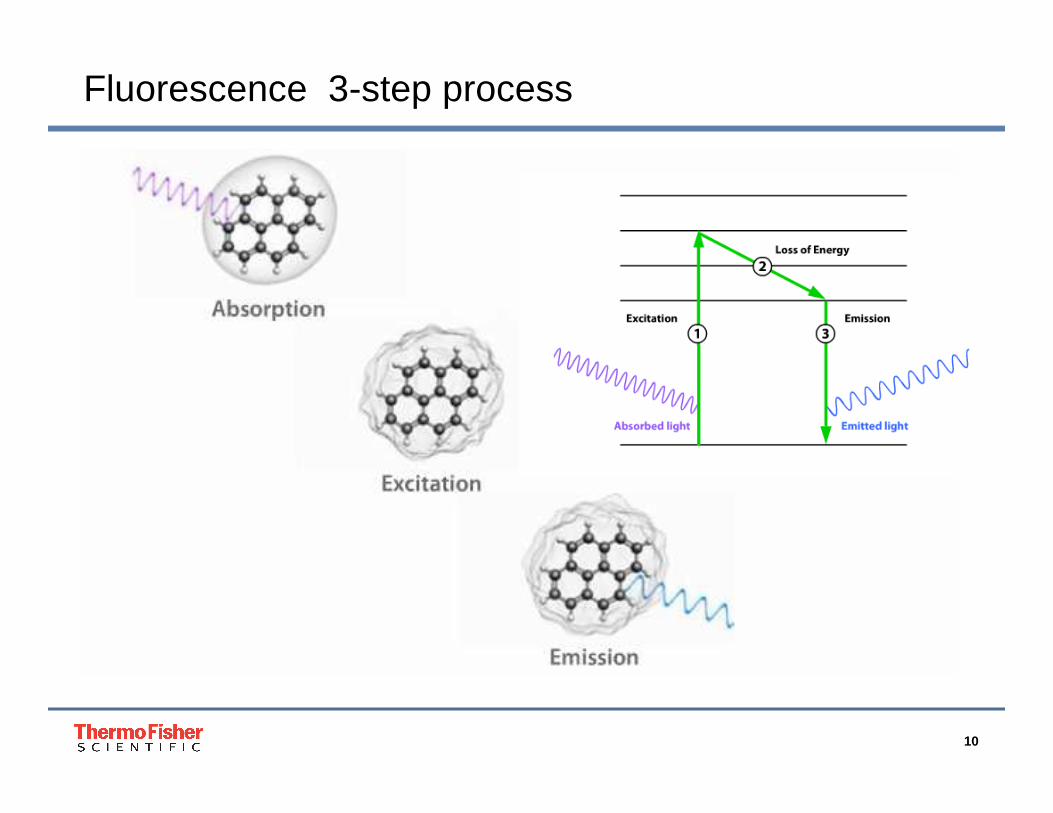
Fluorescence 3-step process

11
Fluorescent Light – Common Definitions
• Fluorescence : is the result of a three stage process in molecules called fluorophores, or fluorescent dyes.
• Absorption spectrum : The wavelength range over which a fluorescent compound can be excited
• Emission spectrum : The range of emitted wavelengths of a fluorescent compound, it is a longer wavelength than the absorption wavelength
• Auto-Fluorescence : Otherwise known as background fluorescence that originates from endogenous sample constituents or from unbound or nonspecifically bound probes
What happens to light when it hits a fluorescently labeled cell?

12
Fluorescence Spectrum
Stokes
Shift
13
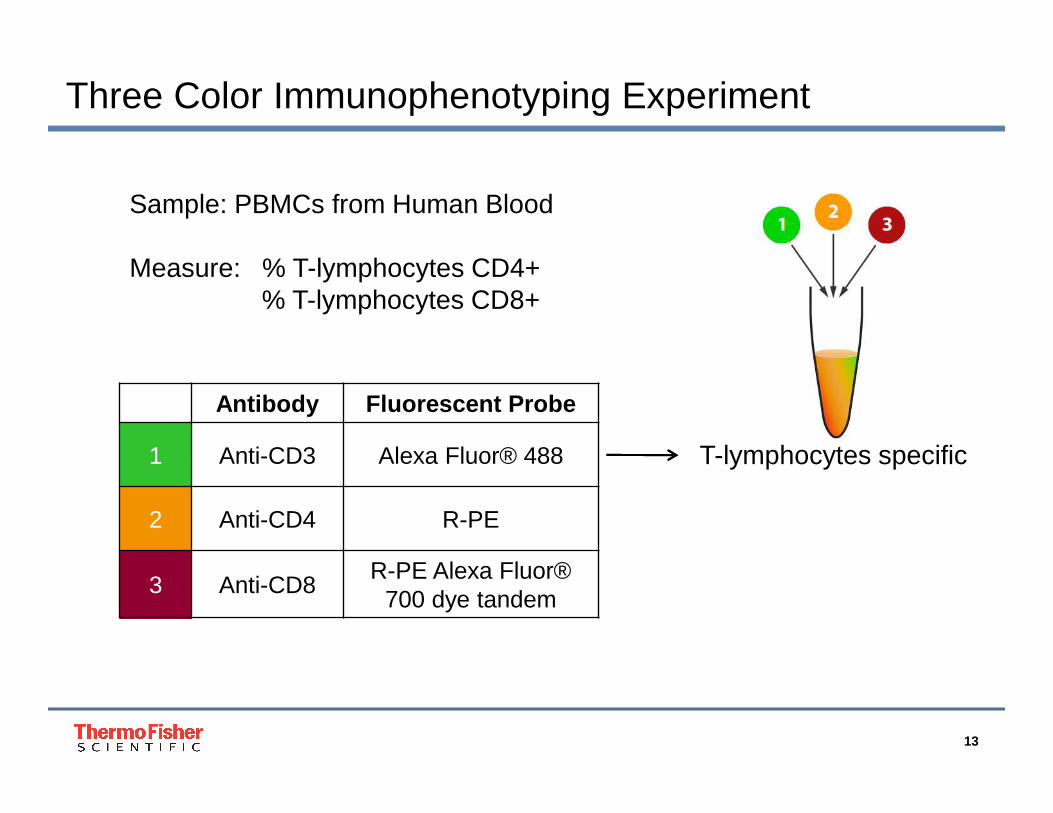
Three Color Immunophenotyping Experiment
Sample: PBMCs from Human Blood
Measure: % T-lymphocytes CD4+% T-lymphocytes CD8+
T-lymphocytes specific
Antibody Fluorescent Probe
1 Anti-CD3 Alexa Fluor® 488
2 Anti-CD4 R-PE
3 Anti-CD8R-PE Alexa Fluor®
700 dye tandem

14
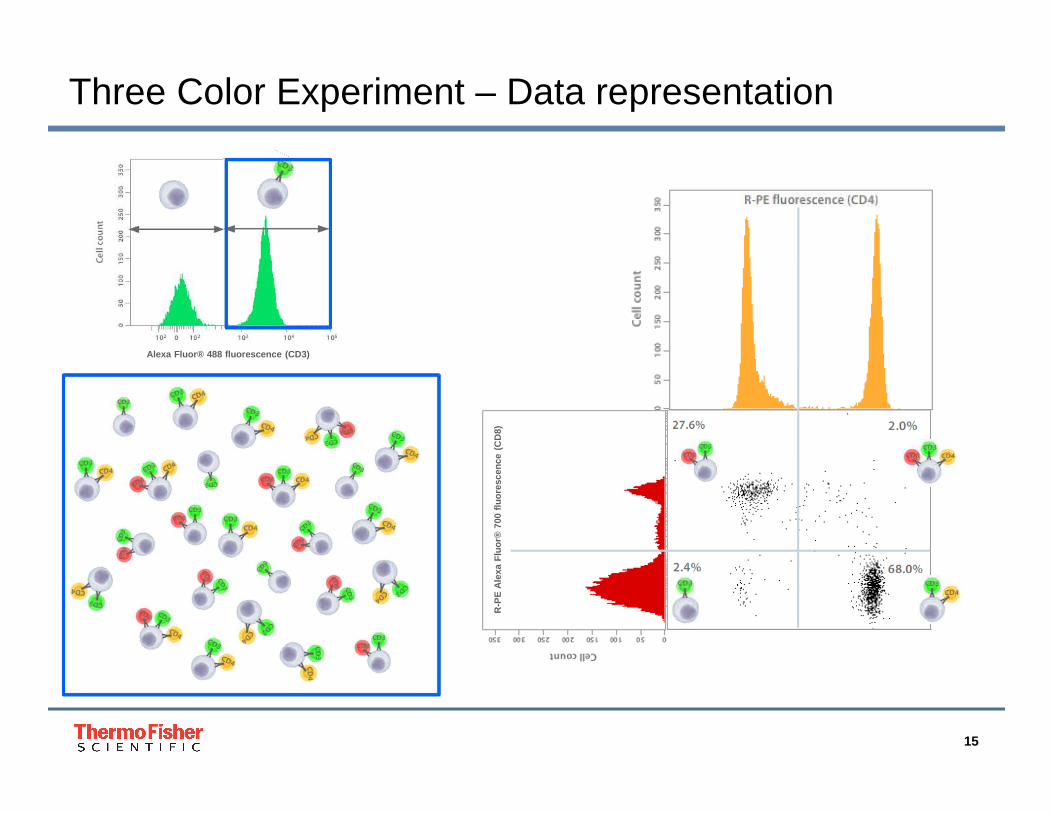
Alexa Fluor® 488 fluorescence (CD3)
Three Color Experiment – Data presentation
15
R-P
E A
lexa
Flu
or®
700
fluo
resc
ence
(C
D8)
Three Color Experiment – Data representation
Alexa Fluor® 488 fluorescence (CD3)
16
The world leader in serving science
Attune ® NxT SystemsFluidicsOpticsElectronics

17
The purpose of a fluidics system is to transport pa rticles in a fluid stream to the laser beam for interrogation
For optimal illumination, the stream transporting the particles should be in the center of the laser beam
Only one particle should move through the laser beam at a time
Fluidics system needs to be free of air bubbles & debris
Fluidics System
18
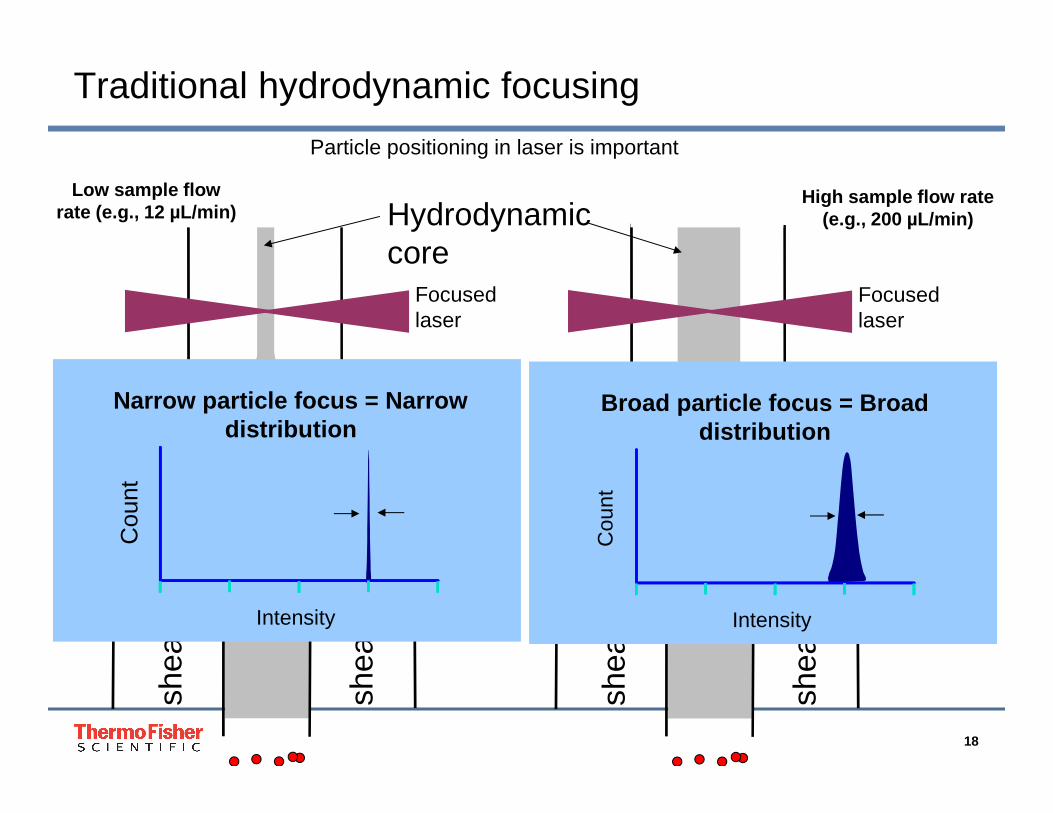
Focused laser
shea
th
shea
th
Hydrodynamic core
Focused laser
shea
th
shea
th
High sample flow rate (e.g., 200 µL/min)
Low sample flow rate (e.g., 12 µL/min)
IntensityC
ount
Broad particle focus = Broad distribution
Intensity
Cou
nt
Narrow particle focus = Narrow distribution
Particle positioning in laser is important
Traditional hydrodynamic focusing
19
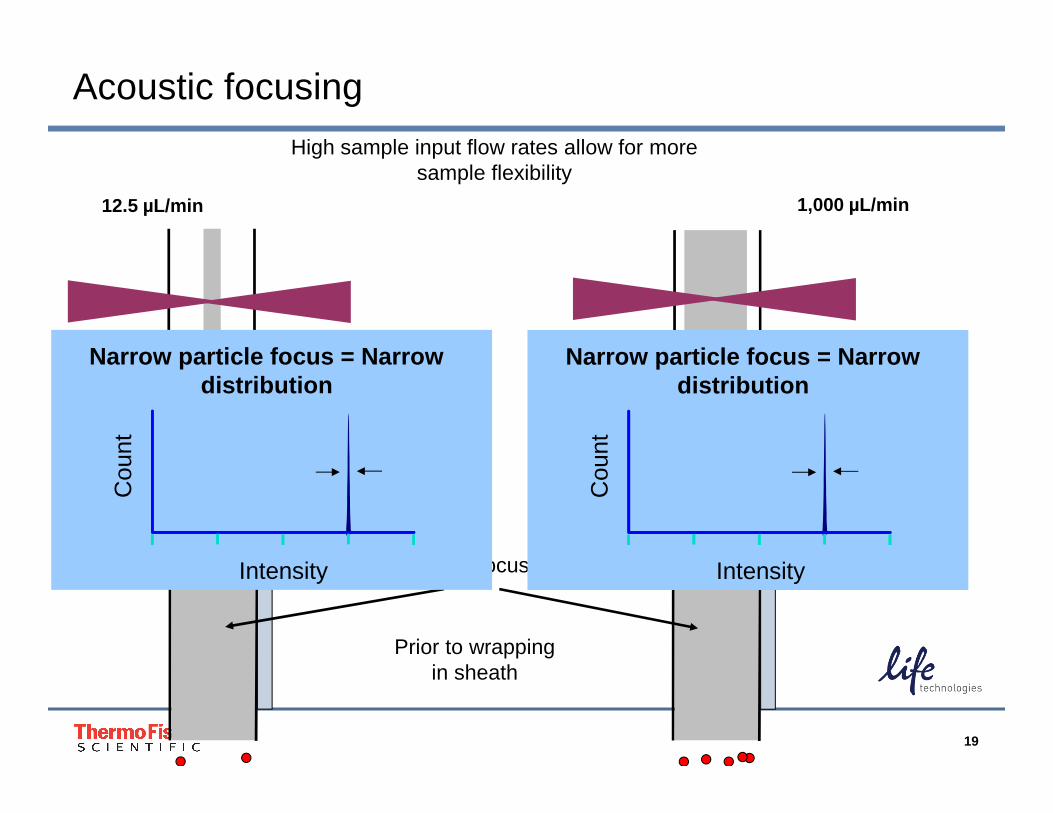
Acoustic focusing
Prior to wrapping in sheath
IntensityC
ount
Narrow particle focus = Narrow distribution
Intensity
Cou
nt
Narrow particle focus = Narrow distribution
1,000 µL/min12.5 µL/min
High sample input flow rates allow for more sample flexibility
Acoustic focusing

20
Comparable Results at Fast Detection Speed
Traditional Cytometers
µl/min
CV= 4.83 CV=6.12 CV=7.76
12 µL/min 35 µL/min 60 µL/min
Hydrodynamic Focusing Only
Attune NxT
µl/min
12.5 µL/min 25 µL/min 100 µL/min 200 µL/min 500 µL/min 1,000 µL/min
CV=2.99
CV=3.03
CV=2.76
CV=2.94
CV=2.70
CV=2.96
Up to10x Faster than Traditional Cytometers
Acoustically Enhanced Hydrodynamic Focusing
22
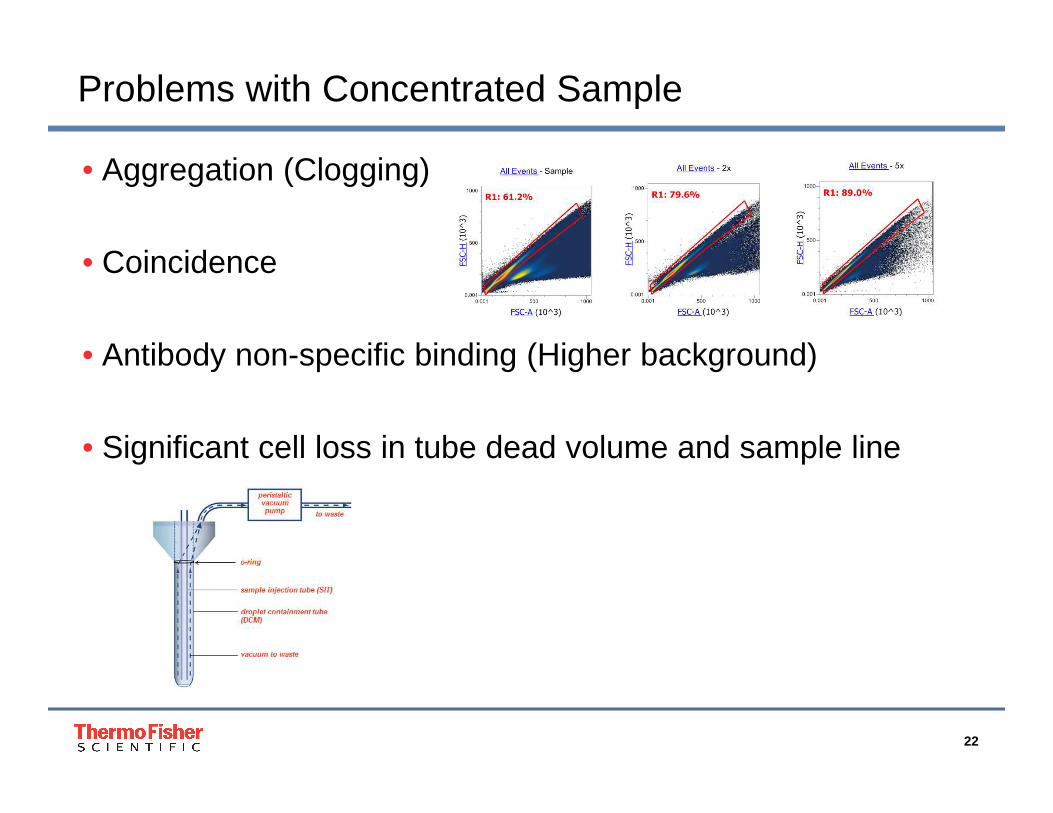
Problems with Concentrated Sample
• Aggregation (Clogging)
• Coincidence
• Antibody non-specific binding (Higher background)
• Significant cell loss in tube dead volume and sample line

23
Status indicator lights
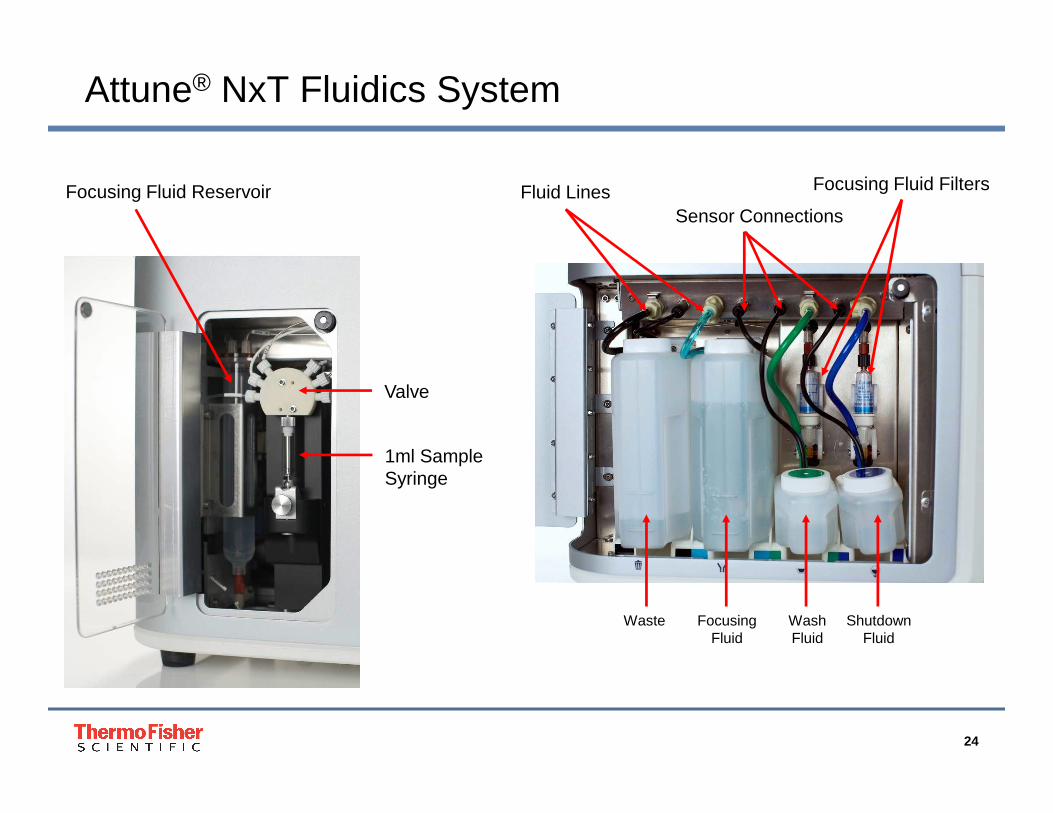
Attune® NxT Fluidics System
24
Focusing Fluid Reservoir
1ml SampleSyringe
Attune® NxT Fluidics System
Valve
Fluid LinesSensor Connections
Waste FocusingFluid
WashFluid
ShutdownFluid
Focusing Fluid Filters

25
Determining Sample Concentration
• The Concentration Statistic can be selected from the Statistics Ribbon
• Values are displayed as Events/µL
26The world leader in serving science
Attune ® NxT Optical System
27
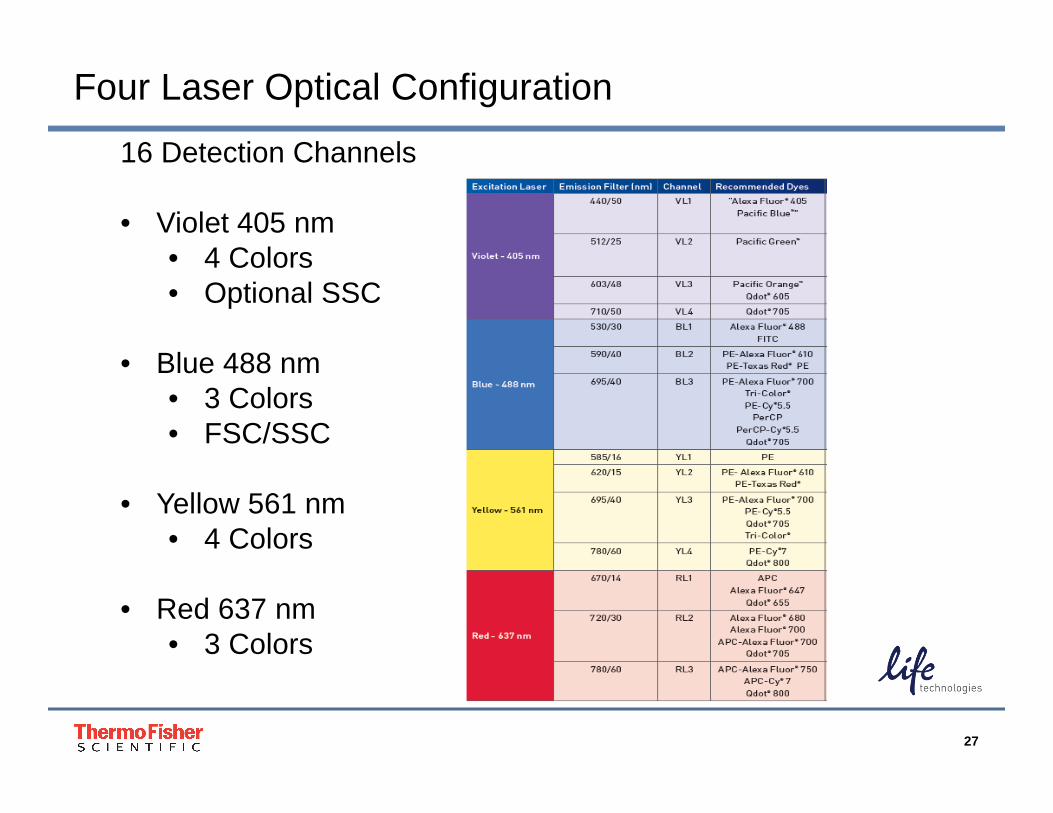
Four Laser Optical Configuration
16 Detection Channels
• Violet 405 nm• 4 Colors• Optional SSC
• Blue 488 nm• 3 Colors• FSC/SSC
• Yellow 561 nm• 4 Colors
• Red 637 nm• 3 Colors
28
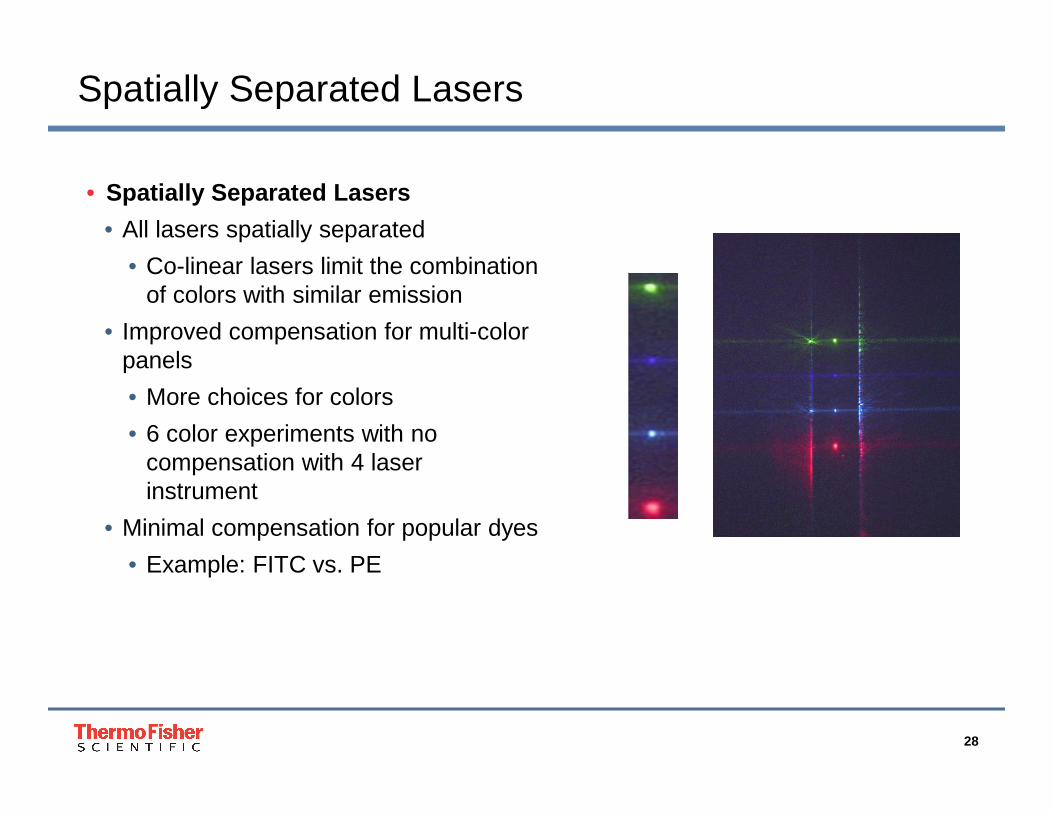
Spatially Separated Lasers
• Spatially Separated Lasers
• All lasers spatially separated
• Co-linear lasers limit the combination of colors with similar emission
• Improved compensation for multi-color panels
• More choices for colors
• 6 color experiments with no compensation with 4 laser instrument
• Minimal compensation for popular dyes
• Example: FITC vs. PE

29
561nm Yellow Laser
• Closest wavelength to PE excitation peak, provides better sensitivity to PE and PE tandems
• Optimal excitation for DsRed, mCherry, RFP, and other fruit proteins
• No spillover from FITC
561nm is close to the PE max. excitation peak
488nm488nm48
8nm
561n
m
30
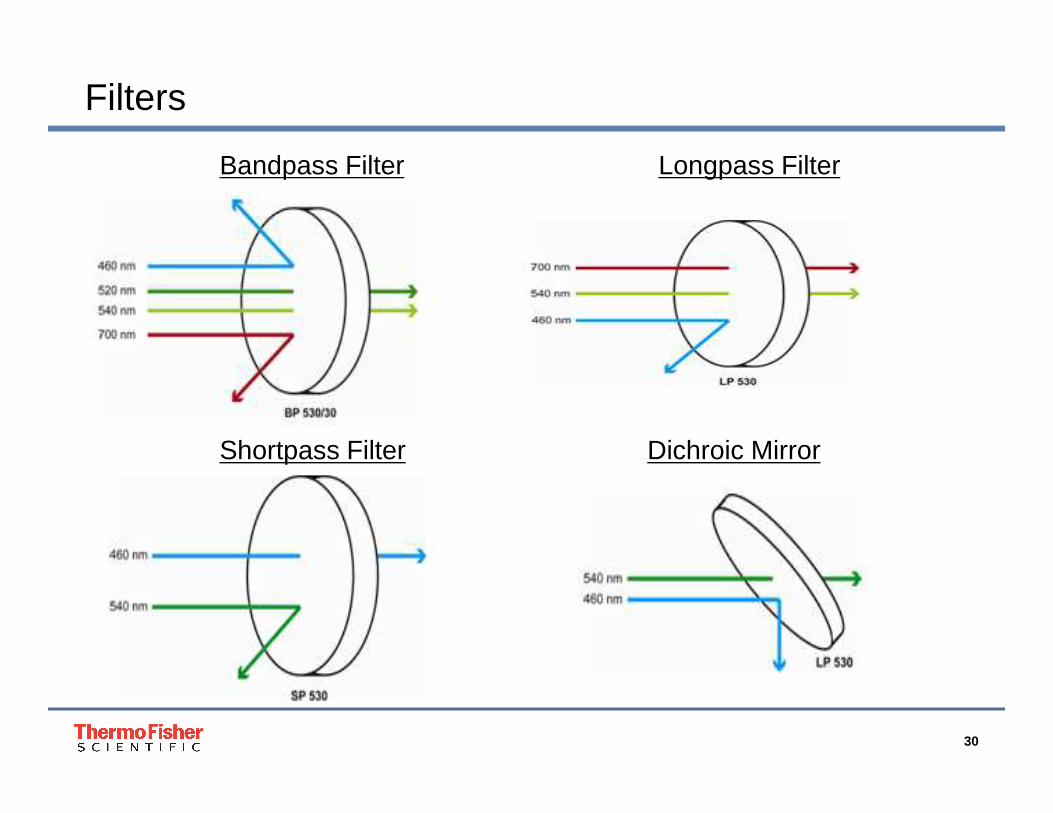
Filters
Bandpass Filter Longpass Filter
Shortpass Filter Dichroic Mirror
31
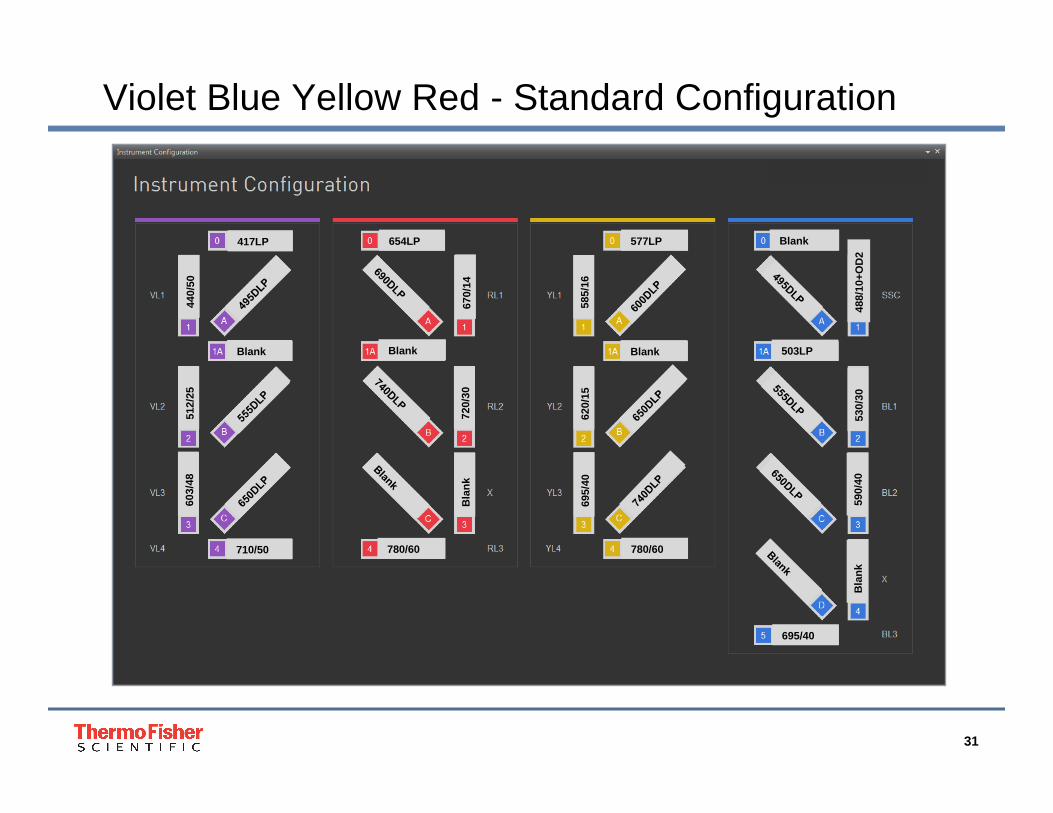
Violet Blue Yellow Red - Standard Configuration
417LP
Blank
577LP
BlankBlank
654LP
780/60710/50
503LP
780/60
Blank
695/40
603/
48
Bla
nk
440/
5051
2/25
670/
1472
0/30
Bla
nk
585/
1662
0/15
695/
40
488/
10+O
D2
530/
3059
0/40
32
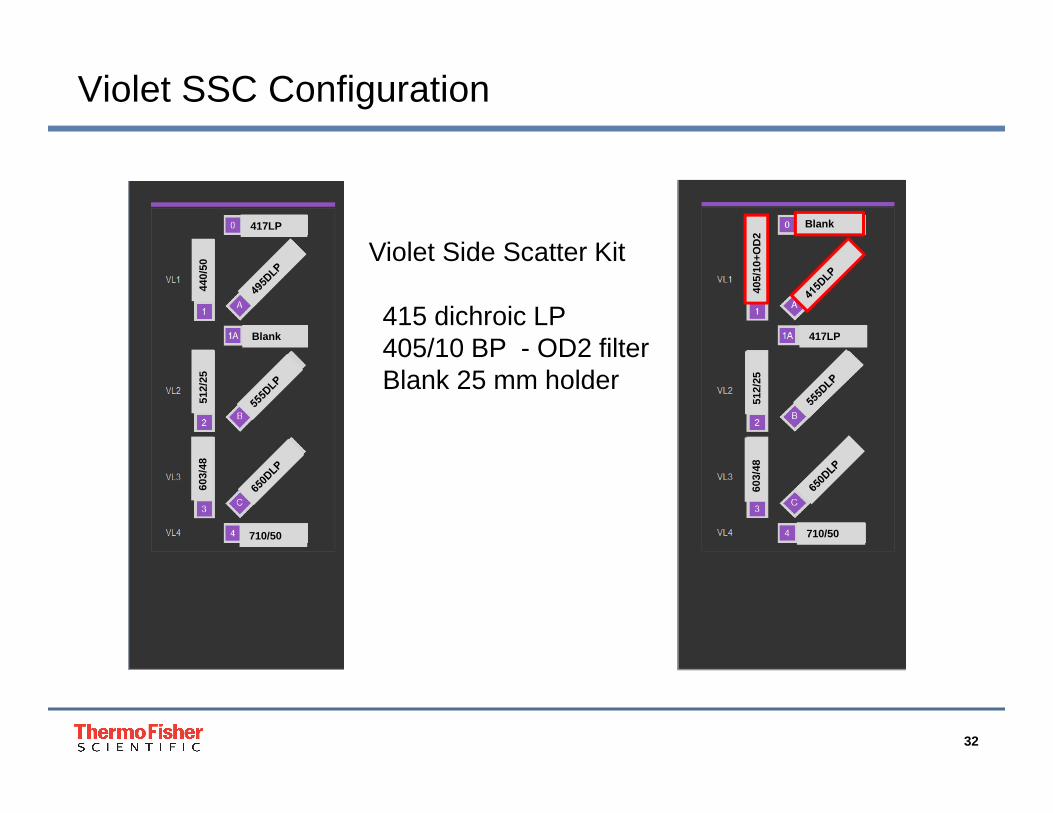
Violet SSC Configuration
417LP
Blank
440/
50
710/50
603/
4851
2/25
Blank
405/
10+O
D2
417LP
710/50
603/
4851
2/25
415 dichroic LP405/10 BP - OD2 filterBlank 25 mm holder
Violet Side Scatter Kit
33
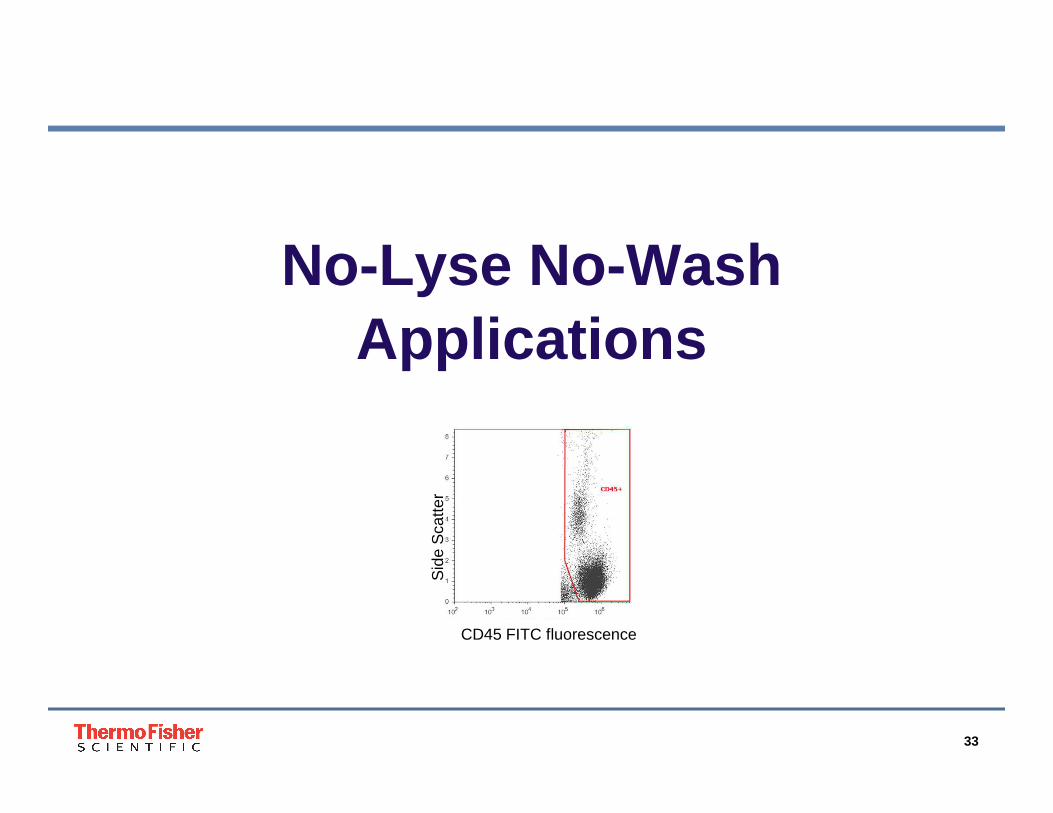
No-Lyse No -Wash Applications
Sid
e S
catte
r
CD45 FITC fluorescence
34
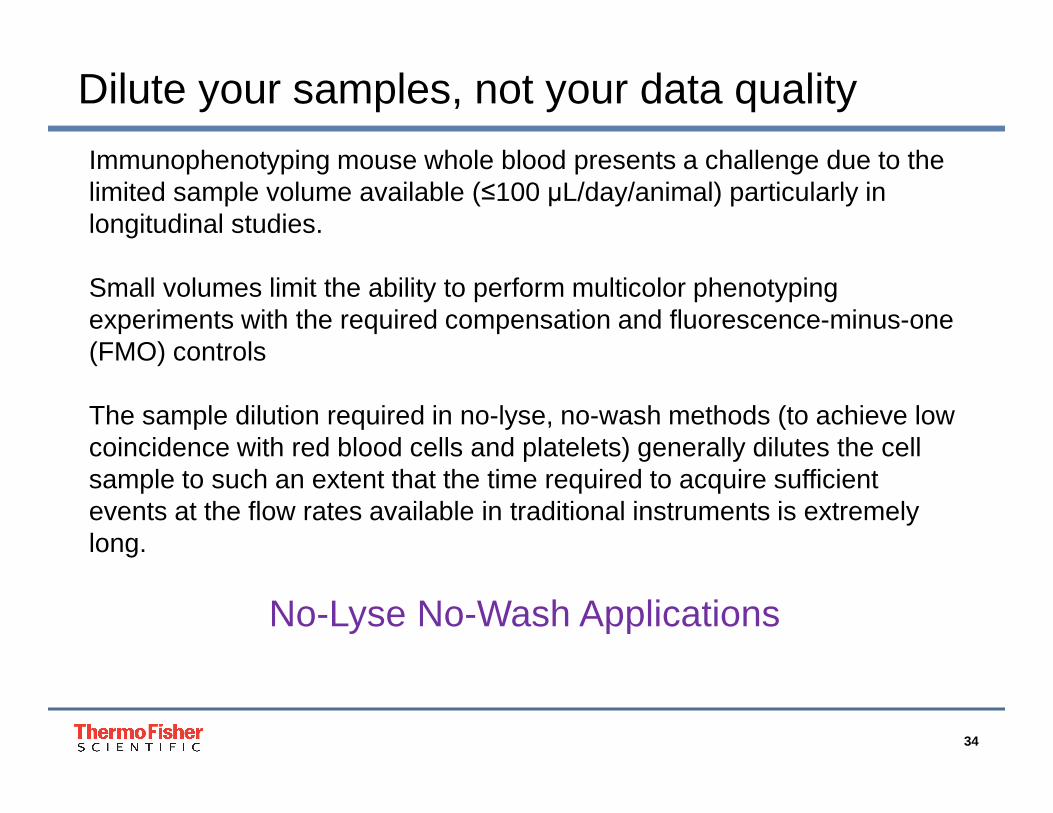
Dilute your samples, not your data quality
Immunophenotyping mouse whole blood presents a challenge due to the limited sample volume available (≤100 µL/day/animal) particularly in longitudinal studies.
Small volumes limit the ability to perform multicolor phenotypingexperiments with the required compensation and fluorescence-minus-one (FMO) controls
The sample dilution required in no-lyse, no-wash methods (to achieve low coincidence with red blood cells and platelets) generally dilutes the cell sample to such an extent that the time required to acquire sufficient events at the flow rates available in traditional instruments is extremely long.
No-Lyse No-Wash Applications
35
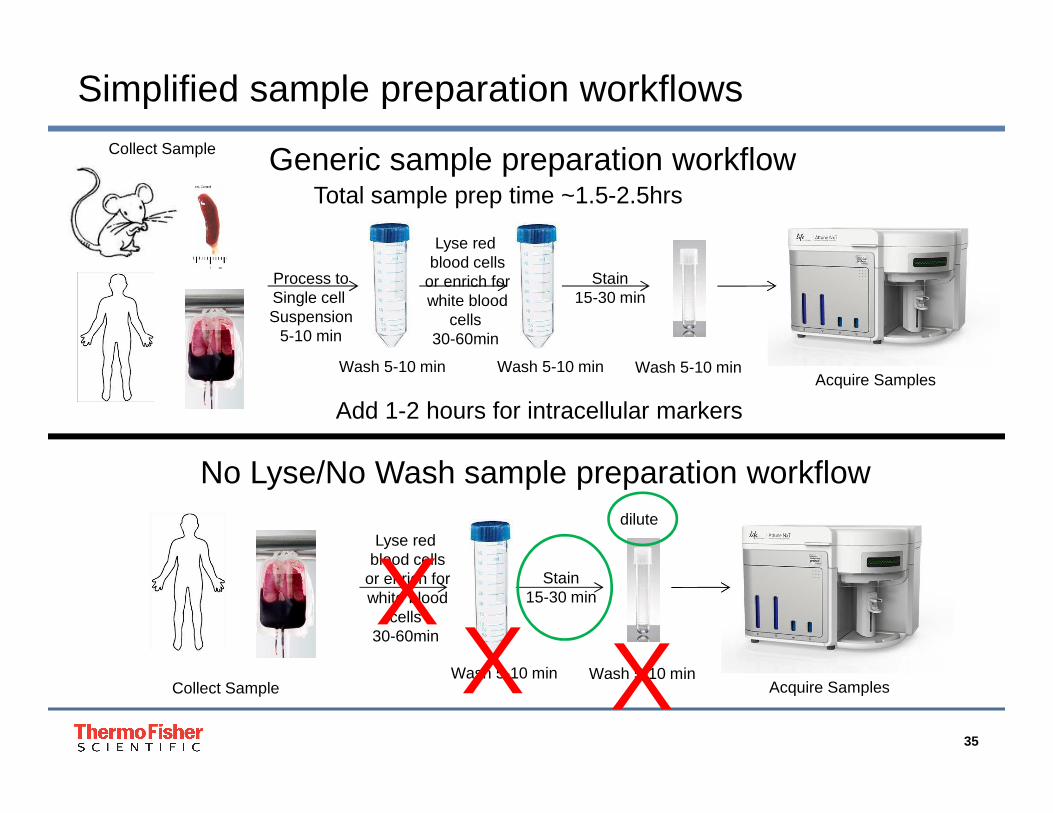
Simplified sample preparation workflowsCollect Sample
Process toSingle cell Suspension
5-10 min
Lyse red blood cells
or enrich forwhite blood
cells 30-60min
Stain15-30 min
Wash 5-10 min Wash 5-10 min Wash 5-10 minAcquire Samples
Total sample prep time ~1.5-2.5hrs
Add 1-2 hours for intracellular markers
Collect Sample
Lyse red blood cells
or enrich forwhite blood
cells 30-60min
Stain15-30 min
Wash 5-10 min Wash 5-10 minAcquire Samples
XX X
dilute
Generic sample preparation workflow
No Lyse/No Wash sample preparation workflow
36
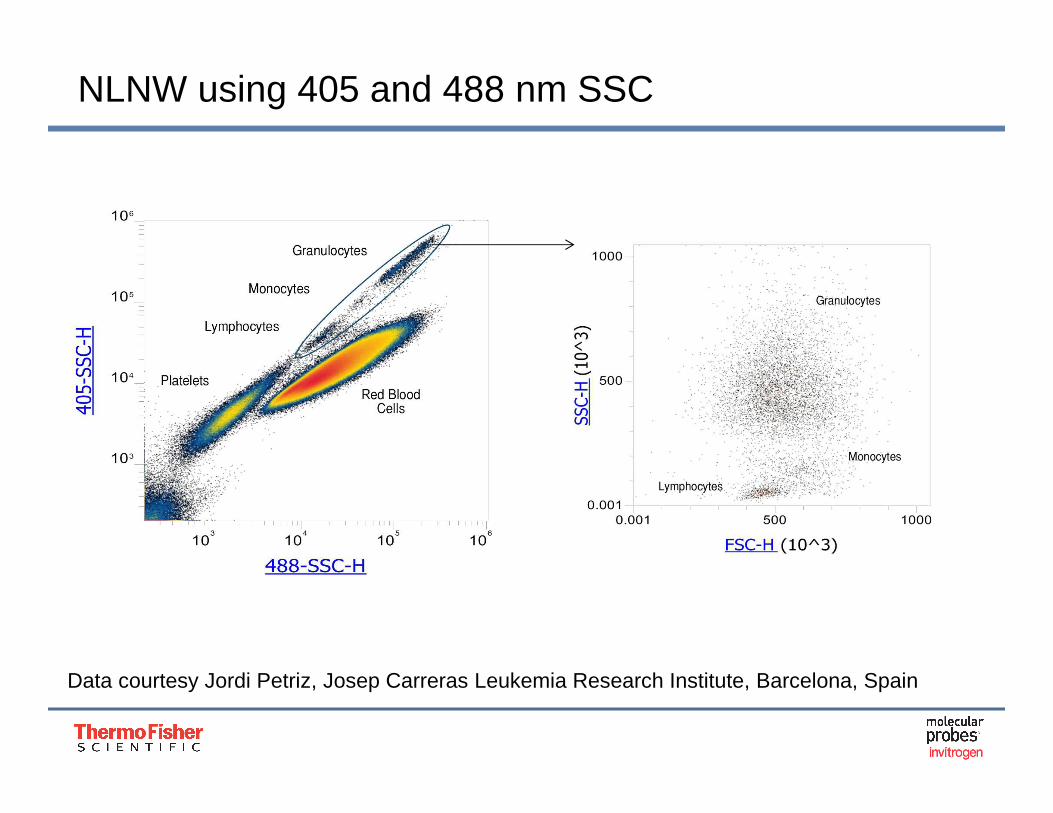
NLNW using 405 and 488 nm SSC
Data courtesy Jordi Petriz, Josep Carreras Leukemia Research Institute, Barcelona, Spain
37
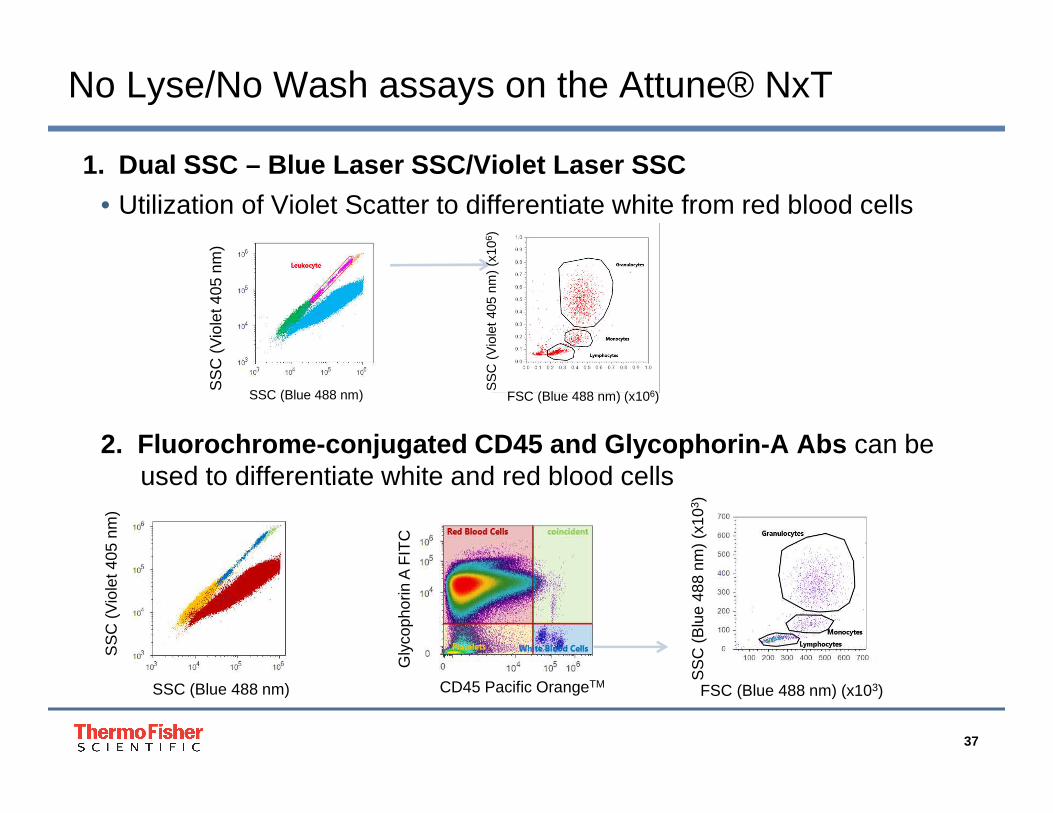
1. Dual SSC – Blue Laser SSC/Violet Laser SSC
• Utilization of Violet Scatter to differentiate white from red blood cells
2. Fluorochrome-conjugated CD45 and Glycophorin-A Abs can be used to differentiate white and red blood cells
No Lyse/No Wash assays on the Attune® NxT
FSC (Blue 488 nm) (x106)
SS
C (
Vio
let 4
05 n
m)
(x10
6 )
SSC (Blue 488 nm)
SS
C (
Vio
let 4
05 n
m)
CD45 Pacific OrangeTM
Gly
coph
orin
A F
ITC
FSC (Blue 488 nm) (x103)S
SC
(B
lue
488
nm)
(x10
3 )
SSC (Blue 488 nm)
SS
C (
Vio
let 4
05 n
m)
38
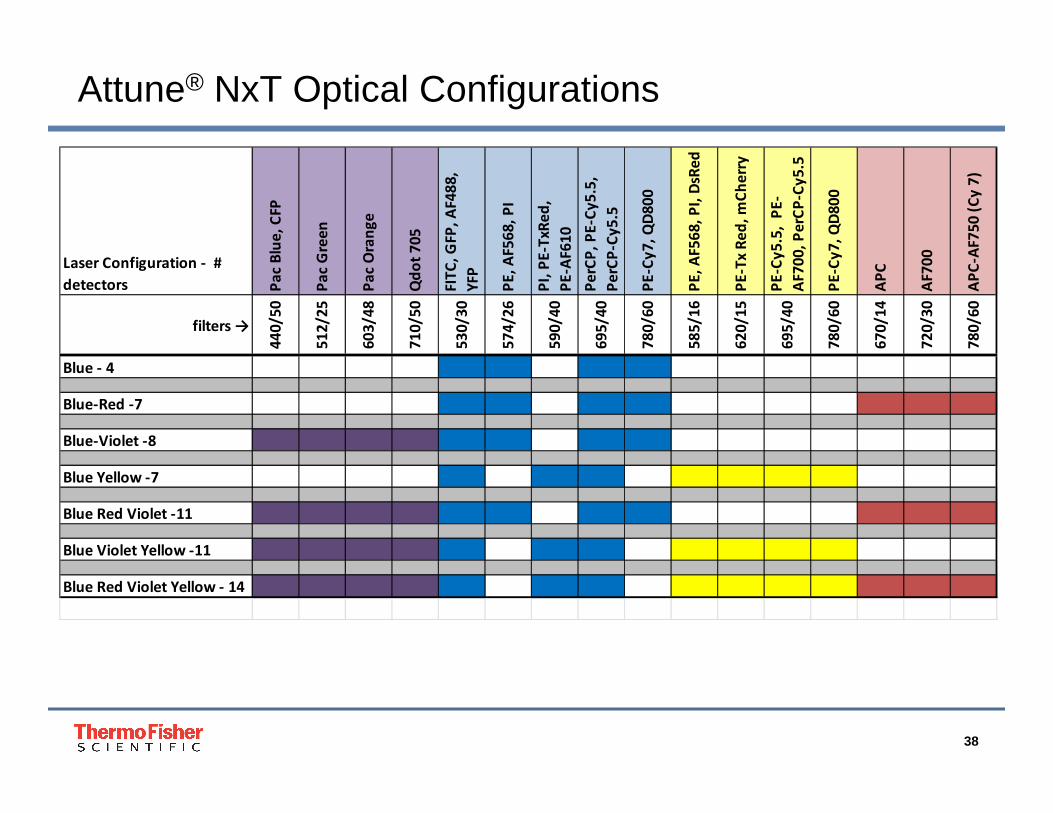
Attune® NxT Optical Configurations
Laser Configuration - #
detectors Pa
c B
lue
, C
FP
Pa
c G
ree
n
Pa
c O
ran
ge
Qd
ot
70
5
FIT
C,
GFP
, A
F48
8,
YFP
PE
, A
F56
8,
PI
PI,
PE
-TxR
ed
,
PE
-AF6
10
Pe
rCP
, P
E-C
y5
.5,
Pe
rCP
-Cy
5.5
PE
-Cy
7,
QD
80
0
PE
, A
F56
8,
PI,
DsR
ed
PE
-Tx
Re
d,
mC
he
rry
PE
-Cy
5.5
, P
E-
AF7
00
, P
erC
P-C
y5
.5
PE
-Cy
7,
QD
80
0
AP
C
AF7
00
AP
C-A
F75
0 (
Cy
7)
filters →
44
0/5
0
51
2/2
5
60
3/4
8
71
0/5
0
53
0/3
0
57
4/2
6
59
0/4
0
69
5/4
0
78
0/6
0
58
5/1
6
62
0/1
5
69
5/4
0
78
0/6
0
67
0/1
4
72
0/3
0
78
0/6
0
Blue - 4
Blue-Red -7
Blue-Violet -8
Blue Yellow -7
Blue Red Violet -11
Blue Violet Yellow -11
Blue Red Violet Yellow - 14
39The world leader in serving science
Attune ® NxT Electronics System

40
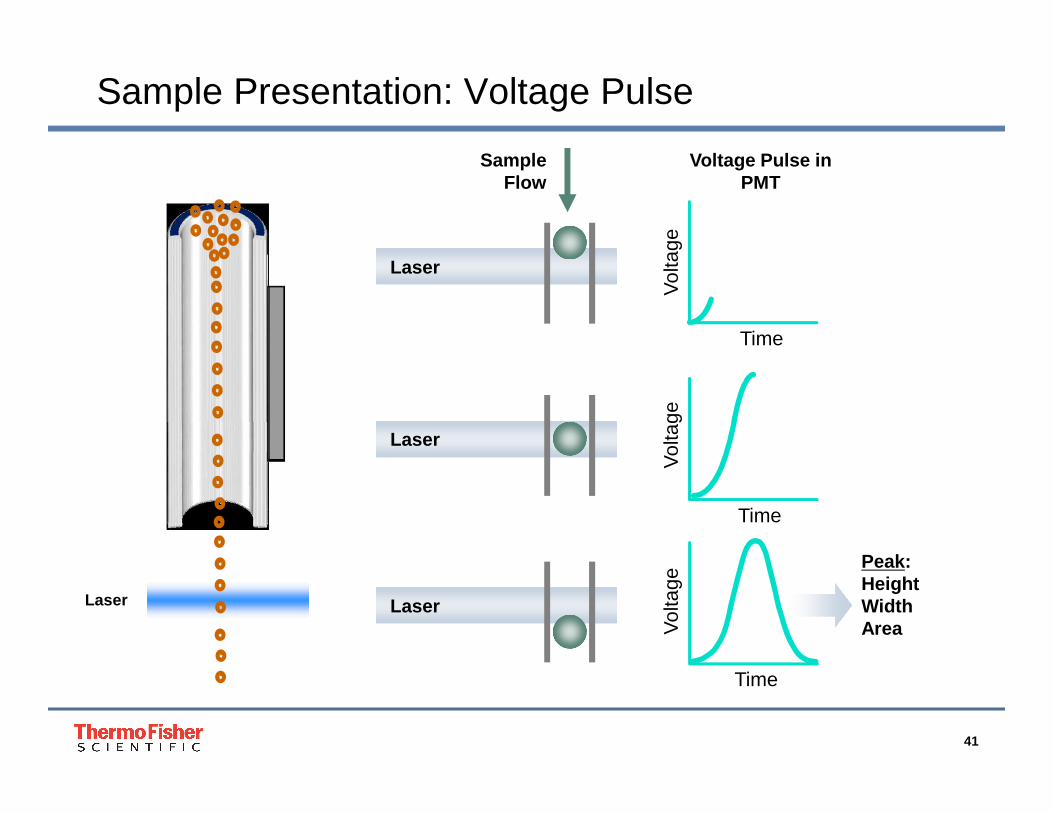
Electronics
Function of Electronic System:
• Converts detected light signals into proportional electronic signals (voltage pulses)
• Electronic signals are processed by the on-board processor
• Converts electronic signals from the detectors into digital data used for analysis
• Interface with the computer for data transfer
41
Sample Presentation: Voltage Pulse
Time
Vol
tage
Time
Vol
tage
TimeV
olta
ge
Laser
Laser
SampleFlow
Laser
Voltage Pulse in PMT
Peak:HeightWidthArea
Laser

42
Time(µ Seconds)
Vol
ts
Pulse Area
Pul
se H
eigh
t
Pulse Width
0
Sample Presentation: Voltage Pulse
43
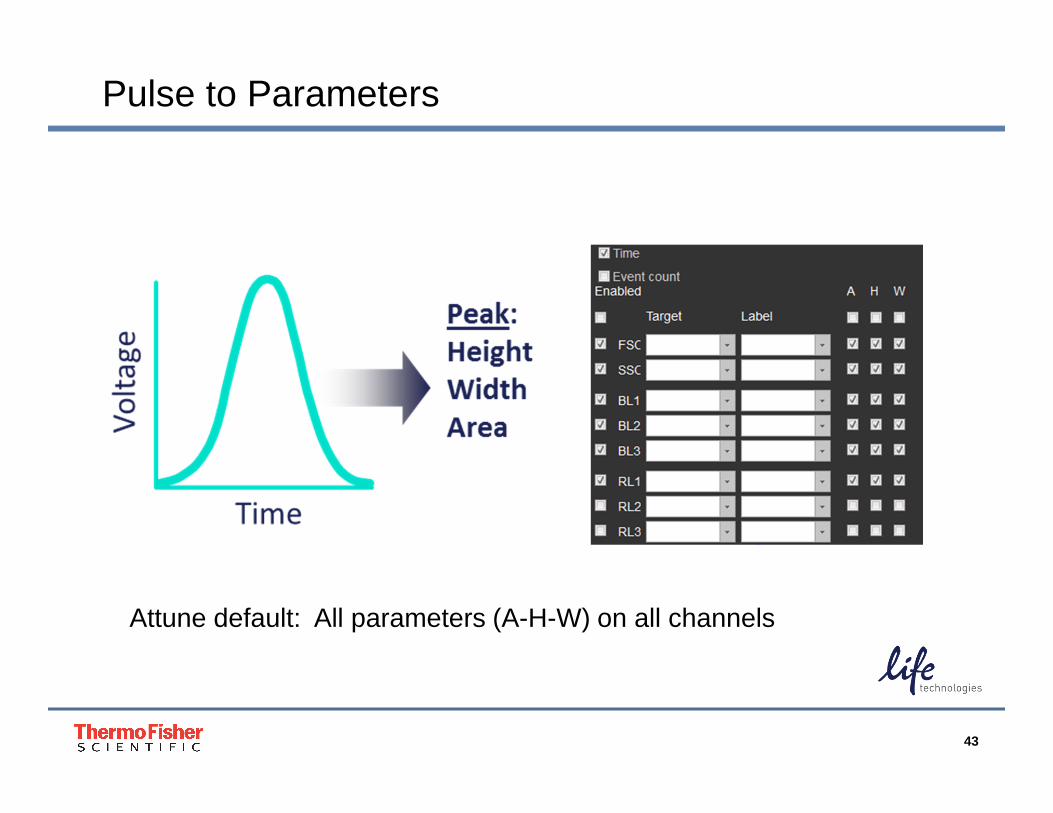
Pulse to Parameters
Attune default: All parameters (A-H-W) on all channels
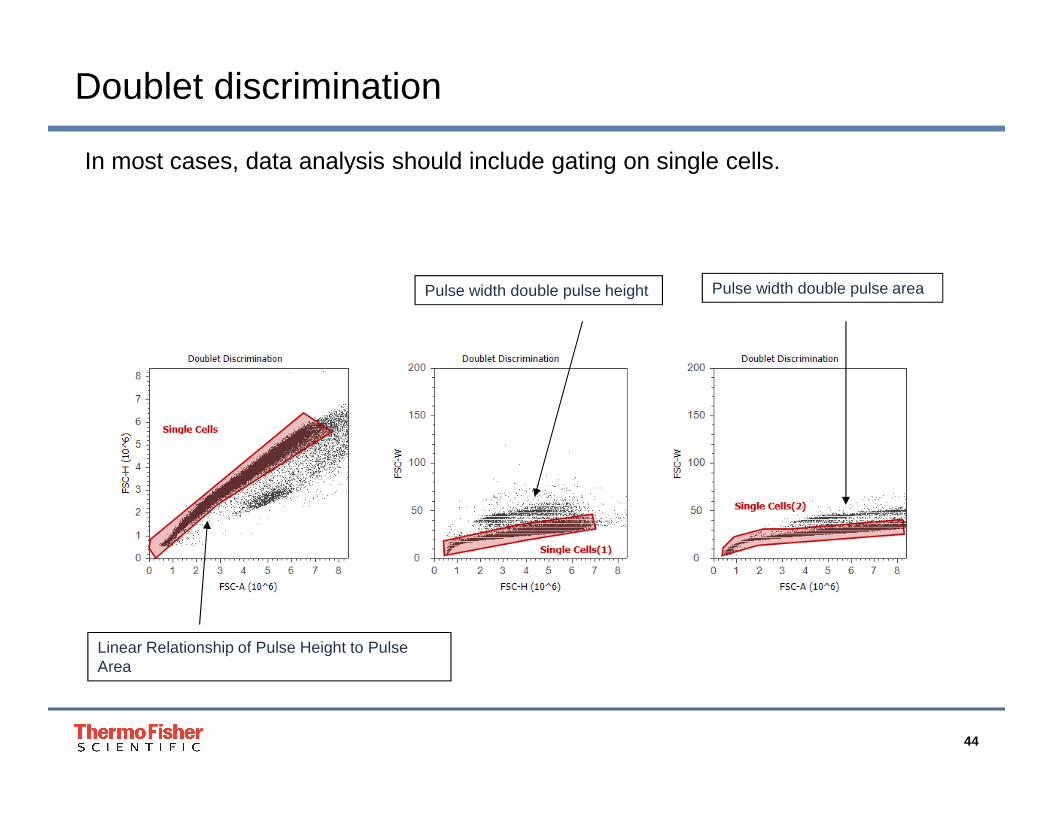
44
In most cases, data analysis should include gating on single cells.
Linear Relationship of Pulse Height to Pulse Area
Pulse width double pulse height Pulse width double pulse area
Doublet discrimination

45
• Every fluorescent molecule emits light with a particular spectrum unique to that molecule
• These emission spectra overlap and is in some cases very significant• Compensation is the process by which we correct for "spillover“
Compensation
AF488 R-PE PerCP-Cy5.5530/30 574/26 695/40 780/60
Laser 488nm
46
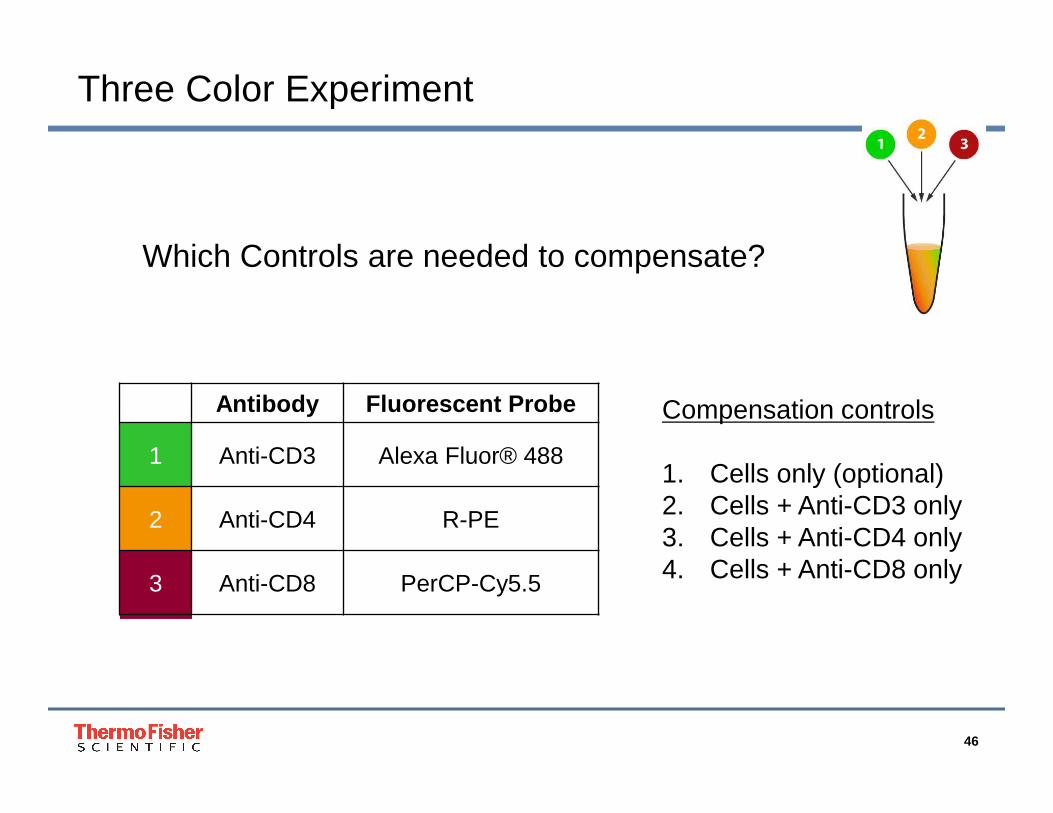
Three Color Experiment
Compensation controls
1. Cells only (optional)2. Cells + Anti-CD3 only3. Cells + Anti-CD4 only4. Cells + Anti-CD8 only
Which Controls are needed to compensate?
Antibody Fluorescent Probe
1 Anti-CD3 Alexa Fluor® 488
2 Anti-CD4 R-PE
3 Anti-CD8 PerCP-Cy5.5
47
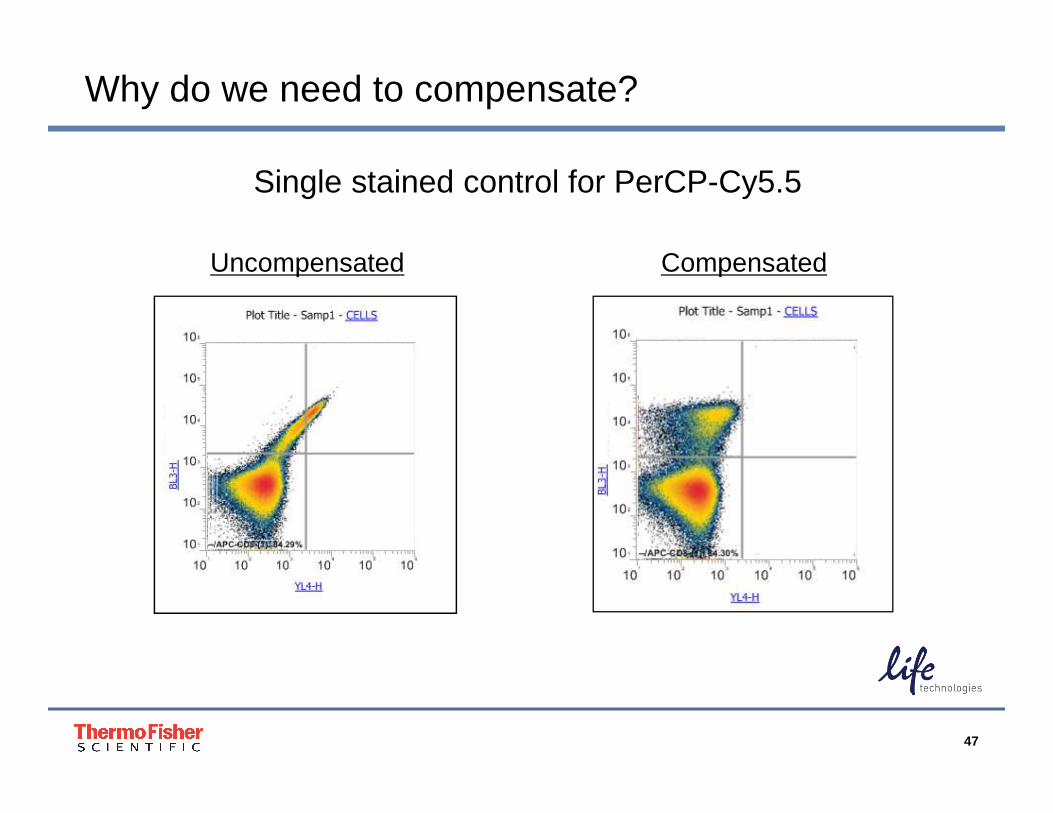
Why do we need to compensate?
Uncompensated Compensated
Single stained control for PerCP-Cy5.5

48
Compensation: Background Fluorescence Modes
• Auto Fluorescence Correction Choices:
• Negative Gate
• Unstained Control
• None
Background Mode When to Use?
Negative GateWith a “mixed bag” of controls such as cells and beads; or using different cell populations (lymphs and monos).
Unstained Control When all controls are of the same type (beads, all lymphs)
NoneRarely used but in cases where background is negligible or cannot be ascertained.
49
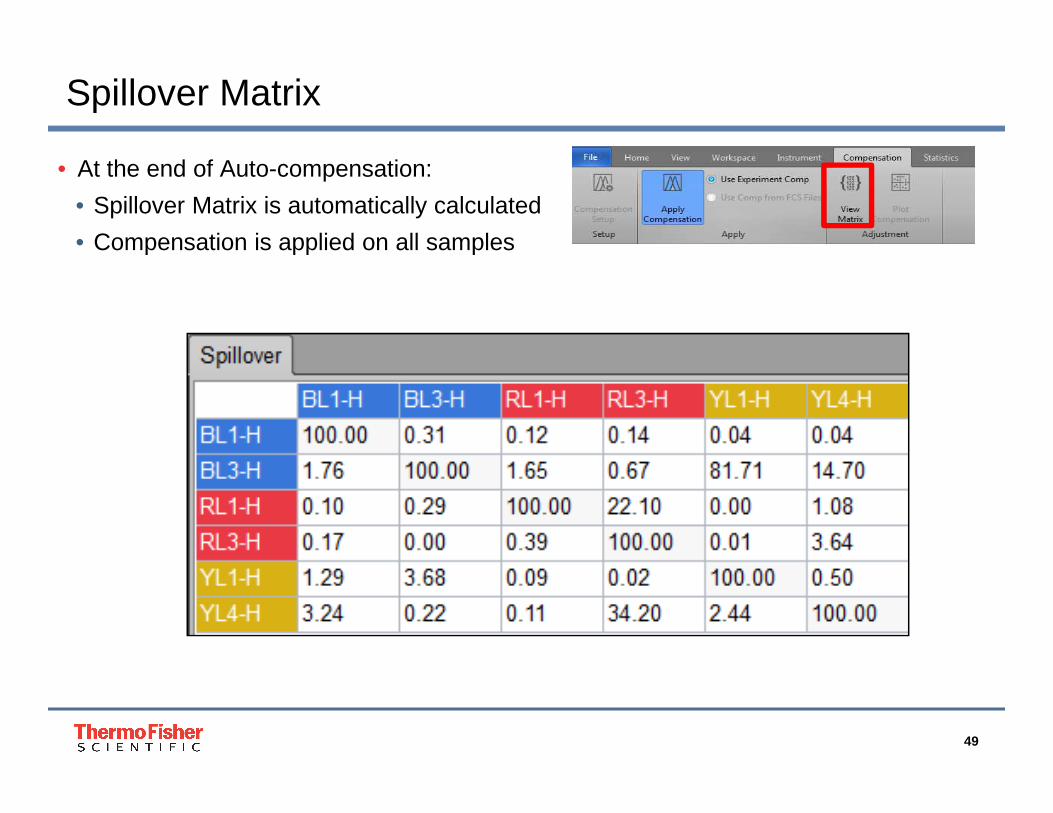
Spillover Matrix
• At the end of Auto-compensation:
• Spillover Matrix is automatically calculated
• Compensation is applied on all samples
50
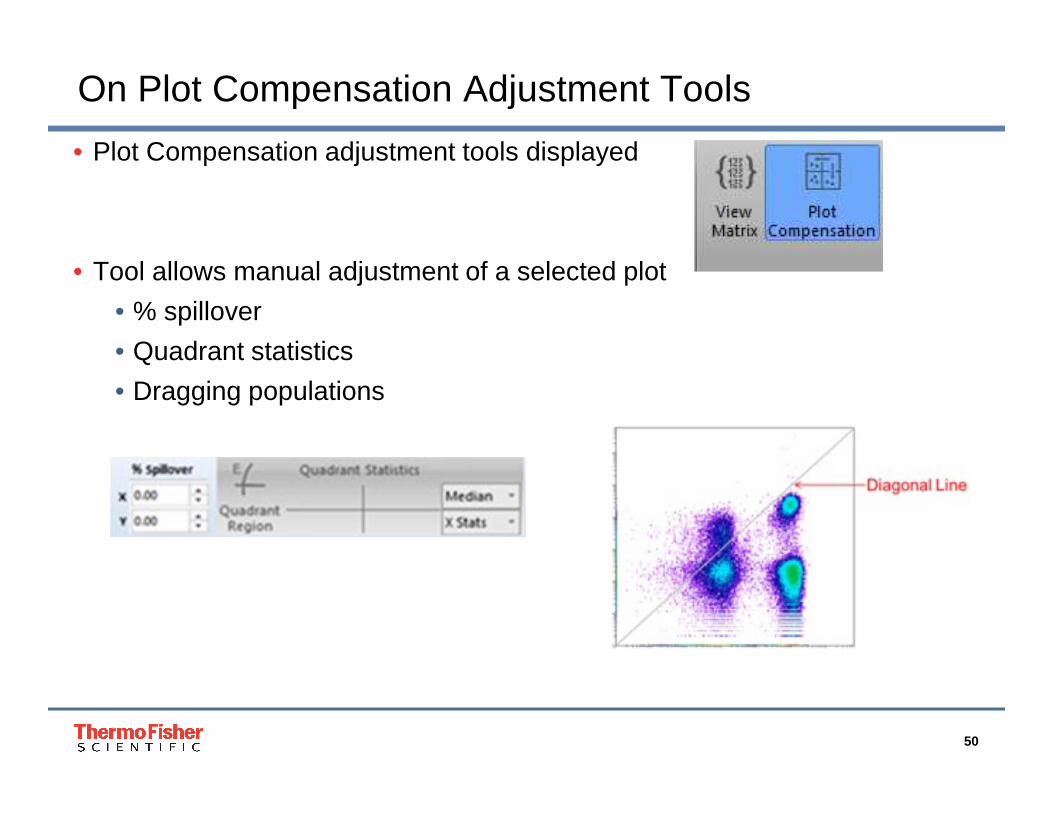
On Plot Compensation Adjustment Tools
• Plot Compensation adjustment tools displayed
• Tool allows manual adjustment of a selected plot
• % spillover
• Quadrant statistics
• Dragging populations
51
The world leader in serving science
Thank you!
Related Documents


![Lg Attune Un270 Lgun270 [ET]](https://static.cupdf.com/doc/110x72/55cf9063550346703ba56977/lg-attune-un270-lgun270-et.jpg)


