1 Attribute Clustering for Grouping, Selection, and Classification of Gene Expression Data Wai-Ho Au * , Member, IEEE, Keith C. C. Chan, Andrew K. C. Wong, Fellow, IEEE, and Yang Wang, Member, IEEE Abstract This paper presents an attribute clustering method which is able to group genes based on their interdependence so as to mine meaningful patterns from the gene expression data. It can be used for gene grouping, selection and classification. The partitioning of a relational table into attribute subgroups allows a small number of attributes within or across the groups to be selected for analysis. By clustering attributes, the search dimension of a data mining algorithm is reduced. The reduction of search dimension is especially important to data mining in gene expression data because such data typically consist of a huge number of genes (attributes) and a small number of gene expression profiles (tuples). Most data mining algorithms are typically developed and optimized to scale to the number of tuples instead of the number of attributes. The situation becomes even worse when the number of attributes overwhelms the number of tuples, in which case, the likelihood of reporting patterns that are actually irrelevant due to chances becomes rather high. It is for the aforementioned reasons that gene grouping and selection are important preprocessing steps for many data mining algorithms to be effective when applied to gene expression data. This paper defines the problem of attribute clustering and introduces a methodology to solving it. Our proposed method groups interdependent attributes into clusters by optimizing a criterion function derived from an information measure that reflects the interdependence between attributes. By applying our algorithm to gene expression data, meaningful clusters of genes are discovered. The grouping of genes based on attribute interdependence within group helps to capture different aspects of gene association patterns in each group. Significant genes selected from each group then contain useful information for gene expression classification and identification. To evaluate the performance of the * Corresponding author Manuscript received Sep. 15, 2004; revised Dec. 1, 2004; accepted March 1, 2005. The work by W.-H. Au and K. C. C. Chan was supported in part by The Hong Kong Polytechnic University under Grants A-P209 and G-V958. W.-H. Au and K. C. C. Chan are with the Department of Computing, The Hong Kong Polytechnic University, Hung Hom, Kowloon, Hong Kong (e-mail: [email protected]; [email protected]). A. K. C. Wong is with the Department of Systems Design Engineering, University of Waterloo, Waterloo, Ontario N2L 3G1, Canada (e-mail: [email protected]). Y. Wang is with Pattern Discovery Software Systems, Ltd., Waterloo, Ontario N2L 5Z4, Canada (e-mail: [email protected]).

Welcome message from author
This document is posted to help you gain knowledge. Please leave a comment to let me know what you think about it! Share it to your friends and learn new things together.
Transcript
1
Attribute Clustering for Grouping, Selection, and
Classification of Gene Expression Data
Wai-Ho Au*, Member, IEEE, Keith C. C. Chan, Andrew K. C. Wong, Fellow, IEEE,
and Yang Wang, Member, IEEE
Abstract This paper presents an attribute clustering method which is able to group genes based on their
interdependence so as to mine meaningful patterns from the gene expression data. It can be used for gene
grouping, selection and classification. The partitioning of a relational table into attribute subgroups allows
a small number of attributes within or across the groups to be selected for analysis. By clustering
attributes, the search dimension of a data mining algorithm is reduced. The reduction of search dimension
is especially important to data mining in gene expression data because such data typically consist of a
huge number of genes (attributes) and a small number of gene expression profiles (tuples). Most data
mining algorithms are typically developed and optimized to scale to the number of tuples instead of the
number of attributes. The situation becomes even worse when the number of attributes overwhelms the
number of tuples, in which case, the likelihood of reporting patterns that are actually irrelevant due to
chances becomes rather high. It is for the aforementioned reasons that gene grouping and selection are
important preprocessing steps for many data mining algorithms to be effective when applied to gene
expression data. This paper defines the problem of attribute clustering and introduces a methodology to
solving it. Our proposed method groups interdependent attributes into clusters by optimizing a criterion
function derived from an information measure that reflects the interdependence between attributes. By
applying our algorithm to gene expression data, meaningful clusters of genes are discovered. The
grouping of genes based on attribute interdependence within group helps to capture different aspects of
gene association patterns in each group. Significant genes selected from each group then contain useful
information for gene expression classification and identification. To evaluate the performance of the
* Corresponding author Manuscript received Sep. 15, 2004; revised Dec. 1, 2004; accepted March 1, 2005. The work by W.-H. Au and K.
C. C. Chan was supported in part by The Hong Kong Polytechnic University under Grants A-P209 and G-V958. W.-H. Au and K. C. C. Chan are with the Department of Computing, The Hong Kong Polytechnic University,
Hung Hom, Kowloon, Hong Kong (e-mail: [email protected]; [email protected]). A. K. C. Wong is with the Department of Systems Design Engineering, University of Waterloo, Waterloo,
Ontario N2L 3G1, Canada (e-mail: [email protected]). Y. Wang is with Pattern Discovery Software Systems, Ltd., Waterloo, Ontario N2L 5Z4, Canada (e-mail:
2
proposed approach, we applied it to two well-known gene expression datasets and compared our results
with those obtained by other methods. Our experiments show that the proposed method is able to find the
meaningful clusters of genes. By selecting a subset of genes which have high multiple-interdependence
with others within clusters, significant classification information can be obtained. Thus a small pool of
selected genes can be used to build classifiers with very high classification rate. From the pool, gene
expressions of different categories can be identified.
Index Terms: Data mining, attribute clustering, gene selection, gene expression classification,
microarray analysis.
1 Introduction Clustering is an important topic in data mining research. Given a relational table, a conventional
clustering algorithm groups tuples, each of which is characterized by a set of attributes, into clusters based
on similarity [27]. Intuitively, tuples in a cluster are more similar to each other than those belonging to
different clusters. It has been shown that clustering is very useful in many data mining applications (e.g.,
[22], [46]).
When applied to gene expression data analysis, conventional clustering algorithms often encounter the
problem related to the nature of gene expression data which is normally “wide” and “shallow.” In another
words, data sets usually contain a huge number of genes (attributes) and a small number of gene
expression profiles (tuples). This characteristic of gene expression data often compromises the
performance of conventional clustering algorithms. In this paper, we present a methodology to group
attributes that are interdependent or correlated with each other. We refer to such a process as attribute
clustering. In this sense, attributes in a cluster are more correlated with each other whereas attributes in
different clusters are less correlated. Attribute clustering is able to reduce the search dimension of a data
mining algorithm to effectuate the search of interesting relationships or for construction of models in a
tightly correlated subset of attributes rather than in the entire attribute space. After attributes are clustered,
one can select a smaller number for further analysis.
A gene expression dataset from a microarray can be represented by an expression table, T = {wij | i = 1, …,
p, j = 1, …, n}, where wij ∈ ℜ is the measured expression level of gene gi in sample sj [19]. Each row in
the expression table corresponds to one particular gene and each column to a sample. Such a dataset is
typically composed of a large number of genes but a small number of samples. For example, the colon-
cancer dataset [4] consists of 62 samples and 2,000 genes and the leukemia dataset [24] contains 72
3
samples and 7,129 genes. The number of samples is likely to remain small for many areas of investigation,
especially for human data, due to the difficulty of collecting and processing microarray samples [47].
The distinctive characteristic of gene expression data allows clustering both genes and samples [19], [29].
With conventional gene clustering methods, the genes are considered as the tuples and the samples as the
attributes. Thus it allows genes with similar expression patterns (i.e., co-expressed genes) to be identified
[29]. On the other hand, to cluster samples, the samples are considered as the tuples and the genes as the
attributes. The clustering analysis of samples is to find new biological classes or to refine existing ones
[47]. By this token, conventional clustering algorithms are able to group both samples and genes from the
data. In general, Euclidean distance and Pearson’s correlation coefficient are widely used as the distance
measure for clustering [29]. However, when Euclidean distance is applied to measure the similarity
between genes, it is not effective to reflect functional similarity such as positive and negative correlation,
interdependency as well as closeness in values. In fact, Euclidean distance accounts only for the last. In
another words, the primary interest of the overall shapes of genes [29] is not well accounted for. Hence,
Pearson’s correlation coefficient is proposed by some researchers. An empirical study [25] has also
shown that Pearson’s correlation coefficient is not robust to outliers and it may assign high similarity
score to a pair of dissimilar genes. Hence, a new method to cluster attributes in a relation is presented in
this paper which takes into consideration the abovementioned issues. It is known as k-modes Attribute
Clustering Algorithm, referred to as ACA. ACA employs an information measure to evaluate the
interdependence between attributes. It is used to direct the grouping of attributes into clusters. By
applying ACA to gene expression data, clusters of genes based on their mutual correlation can be
discovered. We can then select a small number of the top-ranked genes in each cluster for further analysis.
Furthermore, having so many genes relative to so few samples is likely to result in the discovery of
irrelevant patterns (i.e., gene combinations which correlate with a target variable purely by chance) [47].
A useful technique to deal with it is to select a small number of the most promising genes and use them
solely to build models [47]. To select genes, the t-value is widely used [47]. It is important to note that the
t-value can only be used when the samples are pre-classified. If no class information is provided, it cannot
be used for gene selection. In this paper, we introduce a multiple interdependence measure [15], [57] for
selection of genes with the highest correlation with the rest of attributes within a cluster.
To demonstrate ACA’s usefulness for mining and analyzing gene expression data and to evaluate its
performance, two gene expression datasets, colon-cancer and leukemia, are used. We first applied ACA
to each of them, selecting the most promising genes; then fed the selected genes into several well-known
4
classification algorithms and compared their classification accuracies with those yielded by other gene
selection methods. These classification algorithms, including a decision-tree based algorithm, neural
networks, the nearest neighbor approach, and the naïve Bayes method, are used in this paper because they
have been employed in classification of gene expression data in the literature [8], [20], [23], [31], [32],
[38], [63]. The experimental results demonstrate that ACA is more effective.
The rest of this paper is organized as follows. In Section 2, we present the related work in the literature.
We define the problem of attribute clustering and then present ACA in Section 3. To evaluate the
performance of ACA, we applied it to a synthetic dataset and two well-known gene expression datasets.
The experimental results are presented in Sections 4 and 5. In Section 6, we conclude this paper with a
summary.
2 Related Work Classification and clustering are two major tasks in gene expression data analysis. Classification is
concerned with assigning memberships to samples based on expression patterns, and clustering aims at
finding new biological classes and refining existing ones [47]. To cluster and/or recognize patterns in
gene expression datasets, dimension problems are encountered. Typically, gene expression datasets
consist of a large number of genes (attributes) but a small number of samples (tuples). Many data mining
algorithms (e.g., classification [1], [5], [7], [12], [13], [28], [40], [48], [52], association rule mining [2],
[3], [6], [10], [11], [16], [36], [45], [53], pattern discovery [58], [59], linguistic summaries [30], [61], and
context-sensitive fuzzy clustering [26]) are developed and/or optimized to be scalable with respect to the
number of tuples, so as not to handle a large number of attributes.
To apply existing clustering algorithms to genes, various algorithms have been used. Well-known
examples are: k-means algorithms [17], [25], [49]; Kohonen’s self-organizing maps (SOM) [54]; and
various hierarchical clustering algorithms [4], [21]. As for distance measures, Euclidean distance and
Pearson’s correlation coefficient are widely used for clustering genes [29].
Given two genes Ai and Aj, i, j ∈ {1, …, p}, i ≠ j, the Euclidean distance between Ai and Aj is given by:
∑=
−=n
kjkikjiE wwAAd
1
2)() ,( , (1)
where w ∈ ℜ is the measured expression level.
5
dE measures the difference in the individual magnitudes of each gene. The genes regarded as similar by
Euclidean distance may be very dissimilar in terms of their shapes or vice versa. For example, let us
consider the two genes, which have an identical shape but only differ from each other by a large scaling
factor. Their Euclidean distance is large although they have an identical shape. However, for gene
expression data, the overall shapes of genes are of the primary interest [29]. It is for this reason that
Euclidean distance may not be able to yield a good proximity measurement of genes.
The Pearson’s correlation coefficient between genes Ai and Aj is defined as:
∑∑
∑
==
=
−−
−−=
n
kjjk
n
kiik
n
kjjkiik
jiC
wwww
wwwwAAd
1
2
1
2
1
)()(
))(() ,( , (2)
where iw and jw are the means of wik and wjk, k = 1, …, n, respectively. It considers each gene as a
random variable with n observations and measures the similarity between the two genes by calculating the
linear relationship between the distributions of the two corresponding random variables. An empirical
study [25] has shown that Pearson’s correlation coefficient is not robust to outliers and it may assign high
similarity score to a pair of dissimilar genes.
Recently, biclustering algorithms (e.g., [14], [42]) have been proposed to cluster both genes and samples
simultaneously. Biclustering algorithms aim at identifying subsets of genes and subsets of samples by
performing simultaneous clustering of both rows and columns of a gene expression table instead of
clustering columns and rows (genes and samples) separately [42]. Specifically, these algorithms group a
subset of genes and a subset of samples into a bicluster such that the genes and samples exhibit similar
behavior. A popular measure of the coherence of genes and samples in a bicluster is the mean squared
residue [14]. Let I ⊆ {1, …, p} and J ⊆ {1, …, n}. The mean squared residue of a bicluster,
TIJ = {wij | i ∈ I, j ∈ J}, is defined in [14] as:
∑∈∈
+−−=JjIi
IJIjiJijIJR wwwwJI
Td,
2)(||||
1)( , (3)
where wiJ is the mean of wij, j ∈ J, wIj is the mean of wij, i ∈ I, and wIJ is the mean of wij, i ∈ I, j ∈ J. A
bicluster is formed if its mean squared residue is less than or equal to a user-specified threshold.
Instead of using the Euclidean distance, Pearson’s correlation coefficient, and the mean squared residue in
most of the current methods, our proposed ACA employs an information measure to evaluate the
6
interdependence of genes and groups the genes that are dependent on each other into clusters. The use of
this information measure allows ACA to discover meaningful clusters of genes using interdependent
information reflecting similarity, both positive and negative correlation between expressions among genes.
The details of the information measure and its significance in gene expression correlation are given later
in Section 3.1 and Sections 4 and 5.
Gene selection is another important step to further narrowing down the attribute number prior to data
mining. A good number of algorithms have been developed for this purpose (e.g., [43], [44]). To select
genes, the t-value is widely used in the literature [47]. Assuming that there are two classes of samples in a
gene expression dataset, the t-value t(Ai) for gene Ai is given by:
2
221
21
21)(nn
At iσσ
µµ
+
−= , (4)
where µr and σr are the mean and the standard deviation of the expression levels of gene Ai for class r,
respectively, and nr is the number of samples in class r for r = 1, 2. The top genes ranked by the t-value
can then be selected for data mining. When there are multiple classes of samples, the t-value is typically
computed for one class versus all the other classes.
A weakness of using the t-value to select genes is the redundancy among the selected genes [18], [60],
[62]. To solve this problem, methods that can handle both the gene-class relevance and the gene-gene
redundancy have been proposed (e.g., [18], [60], [62]). These methods typically use some metric to
measure the gene-class relevance (e.g., mutual information, the F-test value [18], information gain,
symmetrical uncertainty [61], etc.) and employ the same or a different metric to measure the gene-gene
redundancy (e.g., mutual information, the L1 distance [18], Pearson’s correlation coefficient, etc.). To find
a subset of relevant but non-redundant genes, they usually use a methodology called redundant cover to
eliminate redundant genes with respect to a subset of genes selected according to the metric for measuring
the gene-class relevance and the gene-gene redundancy (see, e.g., [60], [62]). Another approach to doing
so combines the metric for measuring the gene-class relevance and that for measuring the gene-gene
redundancy into a single criterion function and then selects genes so that the criterion function is
optimized (see, e.g., [18]). Actually the class-feature and class-pattern dependence was proposed by one
of our authors in the 70’s [55].
It is important to note that both the t-value and the methods that handle the gene-class relevance and the
gene-gene redundancy can only be used to select genes when the samples are pre-classified. In this paper,
7
a more general multiple interdependence measure for selecting attributes with the highest correlation with
others is proposed.
3 Attribute Clustering Each tuple in a relation R is characterized by a set of attributes, A1, …, Ap. If Ai, i ∈ {1, …, p}, takes on
discrete values, let its domain be represented by } ..., ,{)( 1 iimii aaAdom = . Otherwise, if Ai, i ∈ {1, …, p},
is continuous, let its domain be represented by dom(Ai) = [li, ui], where li, ui ∈ ℜ. Let us suppose that R
consists of n tuples, t1, …, tn. Each tuple, tu, u ∈ {1, …, n}, is represented by a vector of p attribute values:
tu = (xu1, …, xup), where xui ∈ dom(Ai), i = 1, …, p.
Definition 1. Attribute clustering is a process which finds c disjoint clusters, C1, …, Cc, of correlated
attributes by assigning each attribute in {A1, …, Ap} to one of these clusters. Formally, we define attribute
clustering as a process that ∀ Ai, i ∈ {1, …, p}, Ai is assigned to a Cr, r ∈ {1, …, c}, where Cr ∩ Cs = ∅
for all s ∈ {1, …, c} – {r}.
To find meaningful clusters, attribute clustering is conducted so that attributes within a cluster should
have high correlation with or high interdependence to each other whereas attributes in different clusters
are less correlated or more independent. Most of the conventional clustering methods use some distance
metric to measure the dissimilarity or distance between two objects. In this paper, we introduce the new
interdependence information measure which we believe are more meaningful if interdependent patterns
are the most significant characteristics of a cluster reflecting the inter-relationship among attributes.
3.1 The Attribute Interdependence Measure For each continuous attribute in relation R, its domain is typically discretized into a finite number of
intervals for data mining. In this paper, we use an Optimal Class-Dependence Discretization Algorithm
(OCDD) developed by us [37] to discretize the continuous data. It uses the normalized mutual
information measure that reflects interdependence between the class label and the attribute to be
discretized as the objective function, and fractional programming (iterative dynamic programming) to
find a global optimal solution.
Let us suppose that the domain of Ai, i ∈ {1, …, p}, is discretized by OCDD into mi intervals. After
discretization, the domains of all the attributes in R can be represented by } ..., ,{)( 1 iimii vvAdom = ,
8
i = 1, …, p, where vik = aik, k = 1, …, mi, if Ai is discrete and vik = [bik, bi(k + 1)] ⊆ [li, ui], k = 1, …, mi,
bi1 = li, imi ubi
=+ )1( , if Ai is a discretized continuous attribute.
Let σ denote the SELECT operation from relational algebra and |S| denote the cardinality of set S. The
probability of a record in R having Ai = vik, i ∈ {1, …, p}, k ∈ {1, …, mi}, is then given by:
|)(|
|)(|)Pr(
NULL RR
vAi
iki
A
vAiki
≠
===σσ
(5)
and the joint probability of a record in R having Ai = vik and Aj = vjl, i, j ∈ {1, …, p}, i ≠ j, k ∈ {1, …, mi},
l ∈ {1, …, mj}, is calculated by:
|)(|
|)(|)Pr(
NULL NULL R
RvAvA
ji
jljiki
AA
vAvAjljiki
≠∧≠
=∧===∧=
σ
σ. (6)
Definition 2. The interdependence redundancy measure [56] between two attributes, Ai and Aj,
i, j ∈ {1, …, p}, i ≠ j, is defined as:
) ,() :(
) :(ji
jiji AAH
AAIAAR = , (7)
where I(Ai : Aj) is the mutual information between Ai and Aj, which is given by:
∑∑= = ==
=∧==∧==
i jm
k
m
l jljiki
jljikijljikiji vAvA
vAvAvAvAAAI
1 1 )Pr()Pr()Pr(
log)Pr() :( (8)
and H(Ai, Aj) is the joint entropy of Ai and Aj and is calculated by:
∑∑= =
=∧==∧=−=i jm
k
m
ljljikijljikiji vAvAvAvAAAH
1 1)Pr(log)Pr() ,( . (9)
I(Ai : Aj) measures the average reduction in uncertainty about Ai that results from learning the value of Aj
[39]. If I(Ai : Aj) > I(Ai : Ah), h ∈ {1, …, p}, h ≠ i ≠ j, the dependence of Ai on Aj is greater than the
dependence of Ai on Ah. I(Ai : Aj) initially appears to be a good candidate for measuring the
interdependence between Ai and Aj. However, a weakness of using I(Ai : Aj) is that its value increases with
the number of possible attribute values (i.e., mi and mj). It is for this reason that we need to normalize
I(Ai : Aj) by H(Ai, Aj), which yields the interdependence redundancy measure, R(Ai : Aj).
More accurately stated, R(Ai : Aj) reflects the degree of deviation from independence between Ai and Aj. If
R(Ai : Aj) = 1, Ai and Aj are strictly dependent. If R(Ai : Aj) = 0, they are statistically independent. If
9
0 < R(Ai : Aj) < 1, then Ai and Aj are partially dependent. The definition of the interdependence
redundancy measure shows that it is independent of the composition of Ai and Aj. This implies that the
number of attribute values does not affect the interdependence relationship between Ai and Aj. The
properties of the interdependence redundancy measure clearly render an ideal candidate to measure the
dependence between different attributes.
If two attributes are dependent on each other, they are more correlated with each other when compared to
two independent attributes. The interdependence redundancy measure is therefore able to evaluate the
interdependence or correlation of attributes. If R(Ai : Aj) > R(Ai : Ah), h ∈ {1, …, p}, h ≠ i ≠ j, the
dependence between Ai and Aj is greater than that between Ai and Ah. In attribute clustering, we use
R(Ai : Aj) to measure the interdependence between attributes Ai and Aj.
In order to investigate the interdependency of an attribute with all the other within a group, we introduce
the concept of significant multiple interdependency.
Definition 3. The multiple interdependence redundancy measure [15], [57] of an attribute Ai within an
attribute group or cluster, C = {Aj | j = 1, …, p}, is defined as:
∑=
=p
jjii AARAMR
1
) :()( , (10)
where R(Ai : Aj) is the interdependence redundancy measure between Ai and Aj.
Based on the concept of MR(Ai), we introduce the concept of the “mode” which is an attribute with the
highest multiple interdependence redundancy in an attribute group.
Definition 4. The mode of an attribute group, C = { Aj | j = 1, …, p}, denoted by η(C) is an attribute, say
Ai, in that group such that
MR(Ai) ≥ MR(Aj) for all j ∈ {1, …, p}.
3.2 The Attribute Clustering Algorithm To group attributes A1, …, Ap into clusters, we build our information-theoretic attribute clustering
algorithm by converting the popular k-means algorithm into what we call the k-modes algorithm by
replacing: 1) the concept of the term “mean,” which represents the center of a cluster of entities, by the
concept of mode which is the attribute with the highest multiple interdependence within an attribute group
10
and 2) the distance measure used in k-means by the interdependence redundancy measure between
attributes. We can then formulate the k-modes algorithm in the following.
1. Initialization. Let us assume that the number of clusters, k, where k is an integer greater than or
equal to 2, is given. Of the p attributes, we randomly select k attributes, each of which represents
a candidate for a mode ηr, r ∈ {1, …, k}. Formally, we have ηr = Ai, r ∈ {1, …, k}, i ∈ {1, …, p},
to be the mode of Cr and ηr ≠ ηs for all s ∈ {1, …, k} – {r}.
2. Assignment of each attribute to one of the clusters. For each attribute, Ai, i ∈ {1, …, p}, and
each cluster mode, ηr, r ∈ {1, …, k}, we calculate the interdependence redundancy measure
between Ai and ηr , R(Ai : ηr). We assign Ai to Cr if R(Ai : ηr) ≥ R(Ai : ηs) for all
s ∈ {1, …, k} – {r}.
3. Computation of mode for each attribute cluster. For each cluster, Cr, r ∈ {1, …, k}, we set
ηr = Ai if MR(Ai) ≥ MR(Aj) for all Ai, Aj ∈ Cr, i ≠ j.
4. Termination. Steps 2 and 3 are repeated until the ηr for the clusters does not change.
Alternatively, ACA also terminates when the pre-specified number of iterations is reached.
It is important to note that the number of clusters, k, is fed to ACA as an input parameter. To find the best
choice for k, we use the sum of the multiple significant interdependence redundancy measure,
∑ ∑= ∈
k
r CAri
ri
AR1
) :( η , to evaluate the overall performance of each clustering. With this measure, we can run
ACA for all k ∈ {2, …, p} and select the value k that maximizes the sum of the multiple significant
interdependence redundancy measure over all the clusters as the number of clusters. That is,
∑∑= ∈
∈=k
r CAripk
ri
ARk1
} ..., ,2{ ) :(maxarg η . (11)
To investigate the complexity of ACA algorithm, we consider a gene expression table, which is composed
of n samples such that each sample is characterized by p gene expression levels. The k-modes algorithm
requires O(np) operations to assign each gene to a cluster (Step 2). It then performs O(np2) operations to
compute the mode for each cluster (Step 3). Let t be the number of iterations, the computational
complexity of the k-modes algorithm is given by:
)(
))(()ACA(2
2
tknpO
tnpnpkOO
=
+=. (12)
11
This kind of task is able to be completed in a reasonable amount of time by any modern off-the-shelf
single-processor machine. Furthermore, the k-modes algorithm can easily be parallelized to run on
clusters of processors because the calculation of the interdependence redundancy measure is an
independent task.
4 Experimental Results on a Synthetic Dataset To evaluate the clusters of attributes formed by ACA, we first applied it to a synthetic dataset. Each tuple
in the synthetic dataset is composed of 20 continuous attributes and is pre-classified into one of the 3
classes: C1, C2, and C3. Let us denote the attributes as A1, …, A20. In the designed experiment, attribute
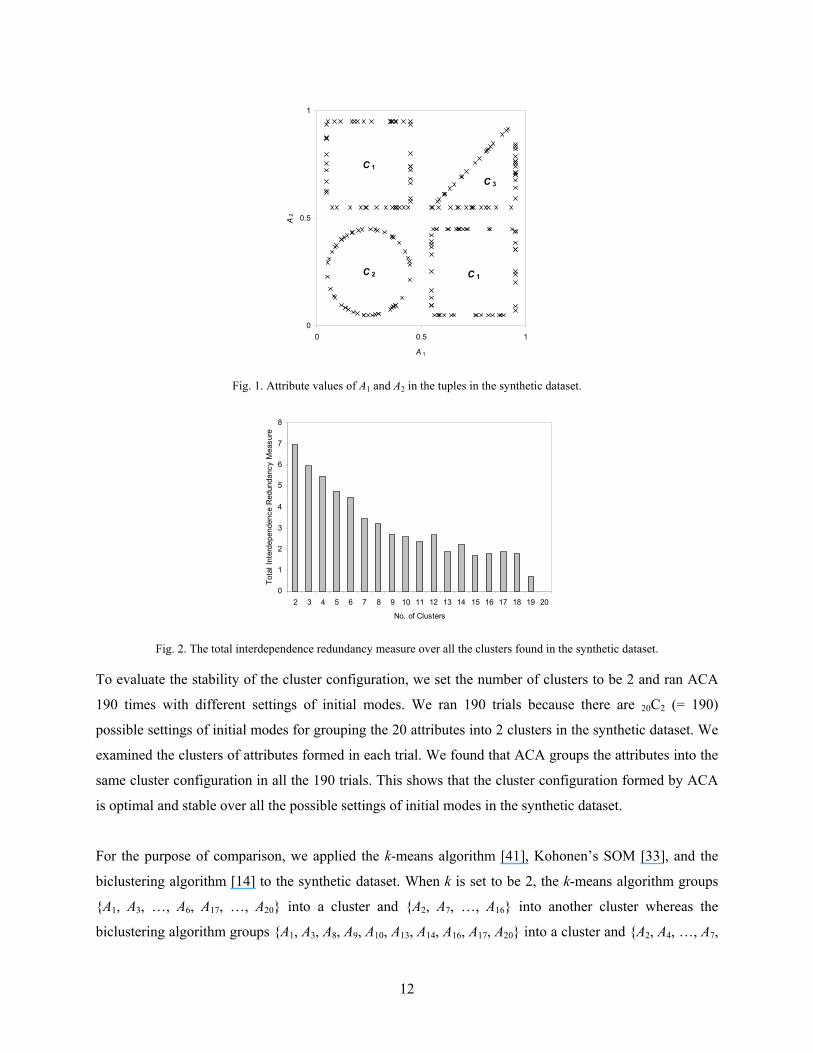
values of A1 and A2 alone can determine the class membership of a tuple (Fig. 1). As shown in Fig. 1, data
points lying on the rectangles, the circle, and the triangle belong to C1, C2, and C3, respectively. Values of
the other attributes (i.e., A3, …, A20) in the tuple are randomly generated in the following manner:
A3–A6: uniformly distributed from 0 to 0.5 if the value of A1 < 0.5; uniformly distributed from 0.5
to 1, otherwise.
A7–A11: uniformly distributed from 0 to 0.5 if the value of A1 ≥ 0.5; uniformly distributed from 0.5
to 1, otherwise.
A12–A15: uniformly distributed from 0 to 0.5 if the value of A2 < 0.5; uniformly distributed from
0.5 to 1, otherwise.
A16–A20: uniformly distributed from 0 to 0.5 if the value of A2 ≥ 0.5; uniformly distributed from
0.5 to 1, otherwise.
It is obvious that A3, …, A11 are correlated with A1 whereas A12, …, A20 are correlated with A2. For an
attribute clustering algorithm to be effective, it should be able to reveal such correlations. In our
experiments, we generated 200 tuples in the synthetic dataset and added noises to the dataset by replacing
the attribute values of A3, …, A20 in 25% of the tuples with a random real number between 0 and 1.
We first used OCDD [37] to discretize the domain of each attribute. As expected, OCDD discretizes the
domain of each attribute into 2 intervals: [0, x] and (x, 1], where x ≈ 0.5. We then applied ACA to the
discretized data to find clusters of attributes. Fig. 2 shows the sum of the interdependence redundancy
measure over all the clusters versus the number of clusters found in the synthetic dataset. As shown in Fig.
2, it finds that the optimal number of clusters is 2. ACA identifies 2 clusters of attributes: {A1, A3, …, A11}
and {A2, A12, …, A20}. A1 is the mode of the former cluster whereas A2 is the mode of the latter. It shows
that ACA is able to reveal the correlations between the attributes hidden in the synthetic dataset.
12
0
0.5
1
0 0.5 1
A 1
A2
C 1
C 1C 2
C 3
Fig. 1. Attribute values of A1 and A2 in the tuples in the synthetic dataset.
0
1
2
3
4
5
6
7
8
2 3 4 5 6 7 8 9 10 11 12 13 14 15 16 17 18 19 20
No. of Clusters
Tota
l Int
erde
pend
ence
Red
unda
ncy
Mea
sure
Fig. 2. The total interdependence redundancy measure over all the clusters found in the synthetic dataset.
To evaluate the stability of the cluster configuration, we set the number of clusters to be 2 and ran ACA
190 times with different settings of initial modes. We ran 190 trials because there are 20C2 (= 190)
possible settings of initial modes for grouping the 20 attributes into 2 clusters in the synthetic dataset. We
examined the clusters of attributes formed in each trial. We found that ACA groups the attributes into the
same cluster configuration in all the 190 trials. This shows that the cluster configuration formed by ACA
is optimal and stable over all the possible settings of initial modes in the synthetic dataset.
For the purpose of comparison, we applied the k-means algorithm [41], Kohonen’s SOM [33], and the
biclustering algorithm [14] to the synthetic dataset. When k is set to be 2, the k-means algorithm groups
{A1, A3, …, A6, A17, …, A20} into a cluster and {A2, A7, …, A16} into another cluster whereas the
biclustering algorithm groups {A1, A3, A8, A9, A10, A13, A14, A16, A17, A20} into a cluster and {A2, A4, …, A7,
13
A11, A12, A15, A18, A19} into another cluster. SOM produces 7 clusters: {A12, A16}, {A7, A8, A10, A11}, {A9},
{A2, A13, A14, A15}, {A1, A3, A5}, {A17, …, A20}, and {A4, A6}. It is clear that the cluster configurations
obtained by the k-means algorithm, SOM, and the biclustering algorithm are not able to represent the
correlations between attributes hidden in the data.
After clusters of attributes were obtained, we selected the top attribute in each cluster for classification.
The selected attributes were fed to C5.0 (a commercial version of C4.5 [48], which is a popular decision
tree based classification algorithm) for building classification models. We used C5.0 in this experiment
because the classification models it builds are represented in the form of decision trees, which can be
further examined.
For ACA, attributes A1 and A2 are selected and fed to C5.0. C5.0 builds a decision tree consisting of 5 leaf
nodes and 4 non-leaf nodes that classifies all the tuples in the synthetic dataset correctly. For k-means, A2
and A6 are selected and fed to C5.0. The decision tree built is composed of 6 leaf nodes and 5 non-leaf
nodes. It misclassifies 23 tuples, which belong to C3 but are classified as C2. Biclusering algorithm selects
A12 and A14. The decision tree built upon this result consists of 5 leaf nodes and 4 non-leaf nodes. It
misclassifies 72 tuples, including 1 tuple belonging to C1, 48 tuples belonging to C2, and 23 tuples
belonging to C3. For SOM, A2, A4, A5, A8, A9, A12, and A19 are selected. The decision tree built consists of
9 leaf nodes and 8 non-leaf nodes. Although the decision tree is rather complicated when compared to
those constructed using the genes selected by ACA, the k-means algorithm, and the biclustering algorithm,
it correctly classifies all of the tuples in the synthetic dataset.
The experimental results on the synthetic dataset show that ACA is a very promising and robust technique
1) to group attributes into clusters; 2) to select a subset of attributes from the clusters formed; and 3) to
allow classification algorithms to build accurate classification models.
5 Experimental Results on Gene Expression Datasets To evaluate the performance of ACA, we applied it to two well-known gene expression datasets: the
colon-cancer dataset [4] and the leukemia dataset [24]. They are the same datasets used in [34], [35] for
gene selection.
5.1 The Methodology for Evaluation The difficulty of evaluation of the attribute clustering results is that we know too little about how genes
actually associate among themselves. Although the rationale behind ACA is to group attributes by
14
optimizing the intra-group attribute interdependence, we still have to justify the meaningfulness of such
assumption backed by certain ground truth. Hence to have an objective and meaningful evaluation of
ACA and others, we have to use what we know about the data to devise an evaluation scheme.
What we know about the two test data sets we used is that each of them could be classified into classes.
The colon-cancer dataset consists of 62 samples and 2,000 genes, which is represented by a
2,000 × 62 expression table. The samples are composed of tumor biopsies collected from tumors and
normal biopsies collected from healthy part of the colons of the same patient. Each sample has been pre-
classified into one of the two classes: normal and cancer. The leukemia dataset consists of 72 samples and
7,129 genes, which is represented by a 7,129 × 72 expression table. The samples are taken from 63 bone
marrow samples and 9 peripheral blood samples. They are either of type AML of leukemia or of type
ALL as the two classes. Taking the pre-classified knowledge as ground truth we could devise an
evaluation scheme as follows.
Since the task objective of the proposed methodology is clustering, we would like to ask how meaningful
the clusters obtained are and what more useful information they contain. In view of this, we should first
examine the cluster configuration and infer by observation, which one reveals more information about the
data and gene groupings obtained. Next, we would like to get significant and insightful information from
each cluster by selecting a subset of most representative genes and examining their patterns. Finally, we
could use this extracted information for classification to see how the results obtained are backed by the
ground truth. Our proposed scheme for evaluation and comparison can be outlined as follows.
1. The study of the cluster configuration obtained by different methods.
2. The study of representative patterns in each cluster found by them.
3. The result of gene classification based on the pool of top significant genes selected from each of
the clusters.
5.2 The Cluster Configurations In this study we would like to find out:
1. how optimal is the cluster configurations;
2. how do the clustering configuration patterns look like, viz. how evenly or lopsided are the cluster
configurations; and
3. does each cluster contain distinctive patterns, and how discriminative they are between classes.
15
We first used OCDD [37] to discretize the domains of the genes (attributes) in the colon-cancer and
leukemia datasets into 2 intervals since there are only two classes in each case. This method was used
because it can minimize the information lost in the discretization [37]. We then applied ACA to the
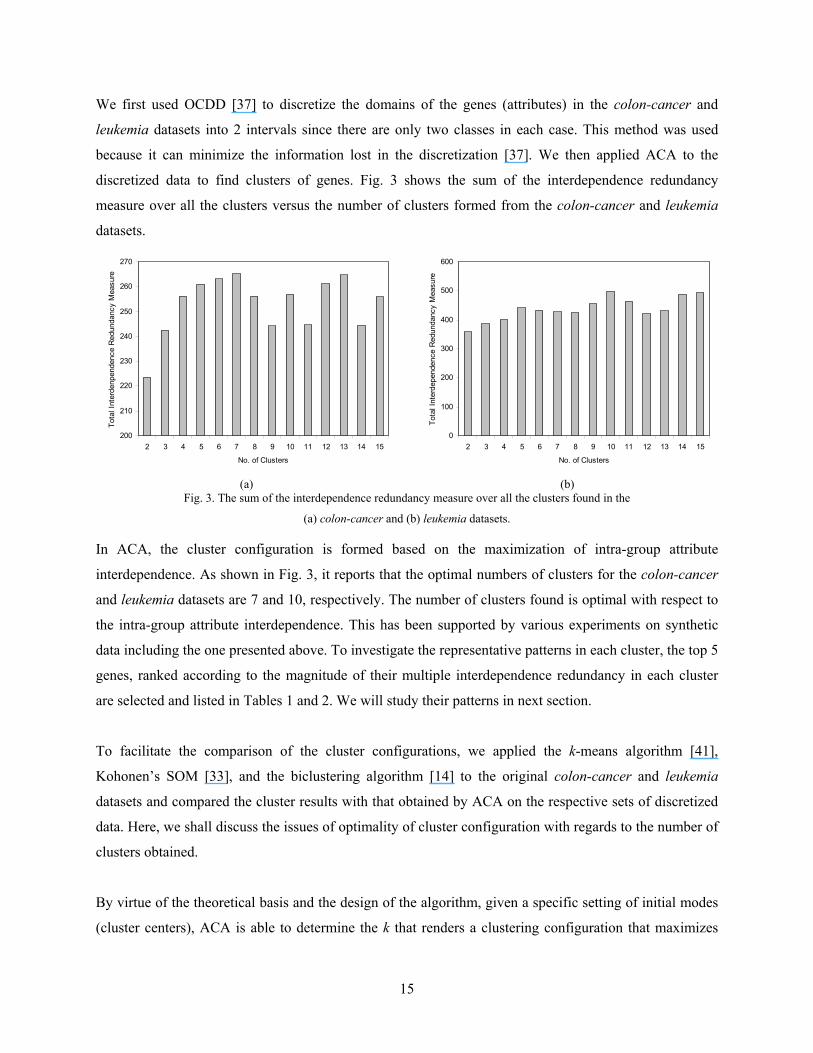
discretized data to find clusters of genes. Fig. 3 shows the sum of the interdependence redundancy
measure over all the clusters versus the number of clusters formed from the colon-cancer and leukemia
datasets.
200
210
220
230
240
250
260
270
2 3 4 5 6 7 8 9 10 11 12 13 14 15
No. of Clusters
Tota
l Int
erde
npen
denc
e R
edun
danc
y M
easu
re
(a)
0
100
200
300
400
500
600
2 3 4 5 6 7 8 9 10 11 12 13 14 15
No. of Clusters
Tota
l Int
erde
pend
ence
Red
unda
ncy
Mea
sure
(b)
Fig. 3. The sum of the interdependence redundancy measure over all the clusters found in the
(a) colon-cancer and (b) leukemia datasets.
In ACA, the cluster configuration is formed based on the maximization of intra-group attribute
interdependence. As shown in Fig. 3, it reports that the optimal numbers of clusters for the colon-cancer
and leukemia datasets are 7 and 10, respectively. The number of clusters found is optimal with respect to
the intra-group attribute interdependence. This has been supported by various experiments on synthetic
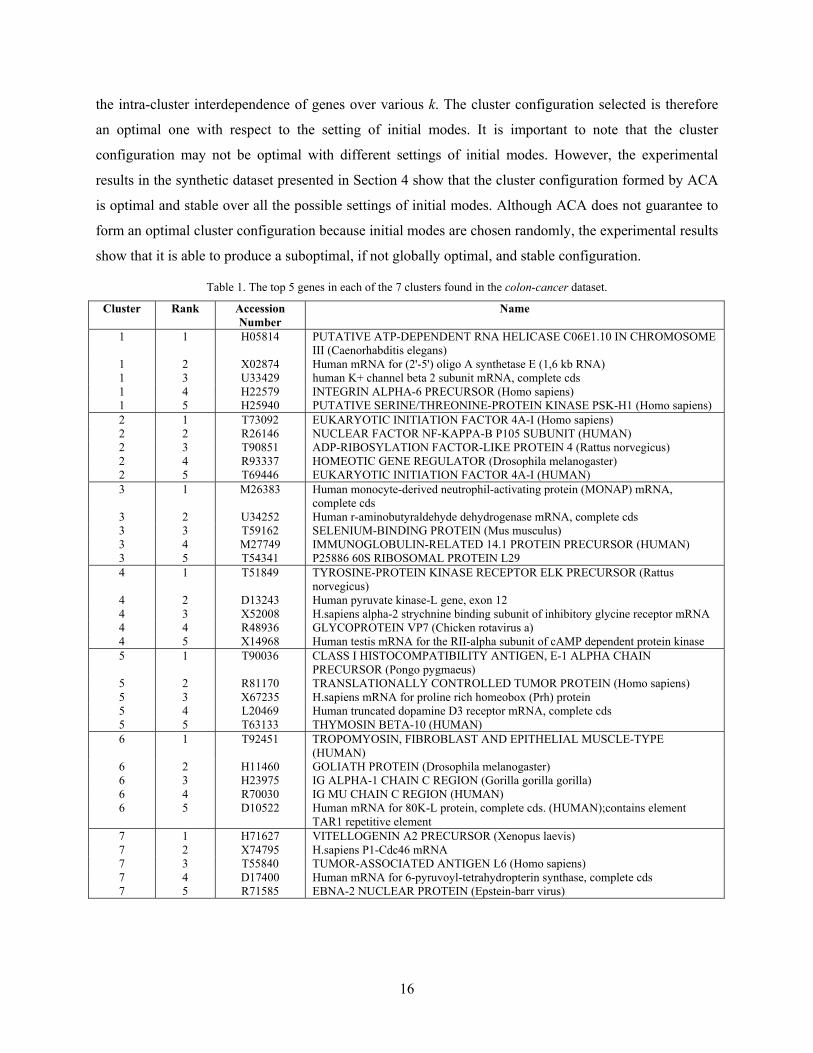
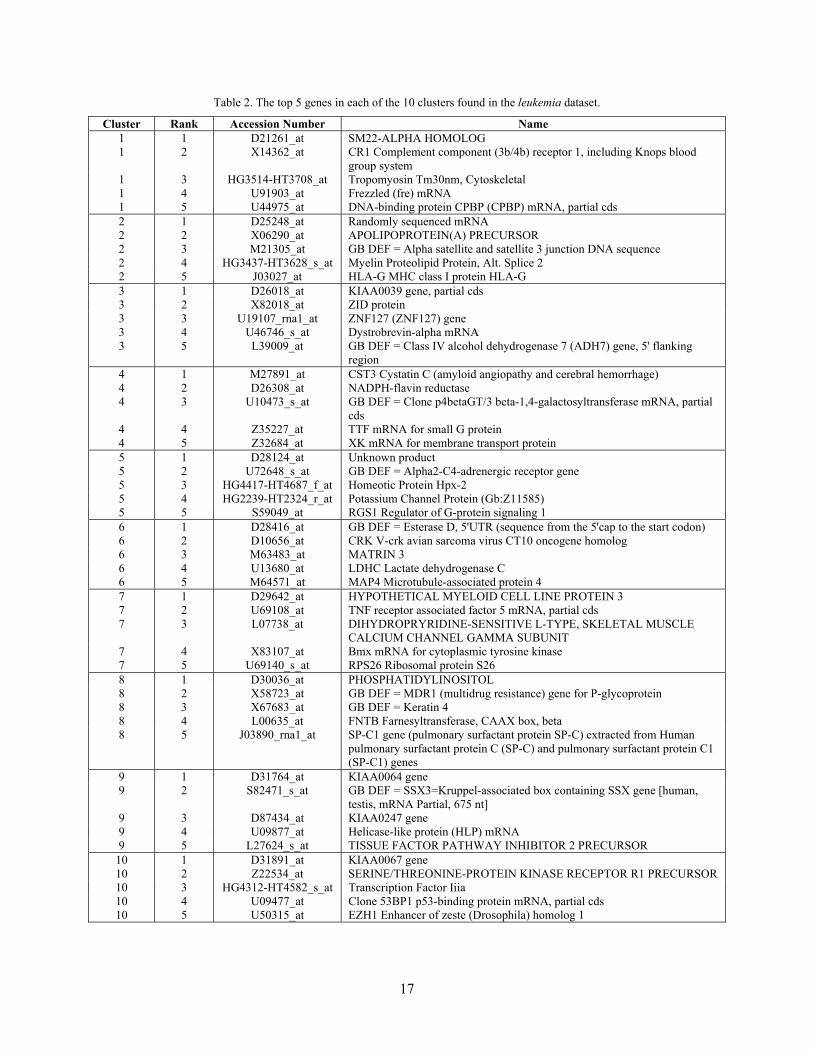
data including the one presented above. To investigate the representative patterns in each cluster, the top 5
genes, ranked according to the magnitude of their multiple interdependence redundancy in each cluster
are selected and listed in Tables 1 and 2. We will study their patterns in next section.
To facilitate the comparison of the cluster configurations, we applied the k-means algorithm [41],
Kohonen’s SOM [33], and the biclustering algorithm [14] to the original colon-cancer and leukemia
datasets and compared the cluster results with that obtained by ACA on the respective sets of discretized
data. Here, we shall discuss the issues of optimality of cluster configuration with regards to the number of
clusters obtained.
By virtue of the theoretical basis and the design of the algorithm, given a specific setting of initial modes
(cluster centers), ACA is able to determine the k that renders a clustering configuration that maximizes
16
the intra-cluster interdependence of genes over various k. The cluster configuration selected is therefore
an optimal one with respect to the setting of initial modes. It is important to note that the cluster
configuration may not be optimal with different settings of initial modes. However, the experimental
results in the synthetic dataset presented in Section 4 show that the cluster configuration formed by ACA
is optimal and stable over all the possible settings of initial modes. Although ACA does not guarantee to
form an optimal cluster configuration because initial modes are chosen randomly, the experimental results
show that it is able to produce a suboptimal, if not globally optimal, and stable configuration.
Table 1. The top 5 genes in each of the 7 clusters found in the colon-cancer dataset.
Cluster Rank Accession Number
Name
1 1 H05814 PUTATIVE ATP-DEPENDENT RNA HELICASE C06E1.10 IN CHROMOSOME III (Caenorhabditis elegans)
1 2 X02874 Human mRNA for (2'-5') oligo A synthetase E (1,6 kb RNA) 1 3 U33429 human K+ channel beta 2 subunit mRNA, complete cds 1 4 H22579 INTEGRIN ALPHA-6 PRECURSOR (Homo sapiens) 1 5 H25940 PUTATIVE SERINE/THREONINE-PROTEIN KINASE PSK-H1 (Homo sapiens) 2 1 T73092 EUKARYOTIC INITIATION FACTOR 4A-I (Homo sapiens) 2 2 R26146 NUCLEAR FACTOR NF-KAPPA-B P105 SUBUNIT (HUMAN) 2 3 T90851 ADP-RIBOSYLATION FACTOR-LIKE PROTEIN 4 (Rattus norvegicus) 2 4 R93337 HOMEOTIC GENE REGULATOR (Drosophila melanogaster) 2 5 T69446 EUKARYOTIC INITIATION FACTOR 4A-I (HUMAN) 3 1 M26383 Human monocyte-derived neutrophil-activating protein (MONAP) mRNA,
complete cds 3 2 U34252 Human r-aminobutyraldehyde dehydrogenase mRNA, complete cds 3 3 T59162 SELENIUM-BINDING PROTEIN (Mus musculus) 3 4 M27749 IMMUNOGLOBULIN-RELATED 14.1 PROTEIN PRECURSOR (HUMAN) 3 5 T54341 P25886 60S RIBOSOMAL PROTEIN L29 4 1 T51849 TYROSINE-PROTEIN KINASE RECEPTOR ELK PRECURSOR (Rattus
norvegicus) 4 2 D13243 Human pyruvate kinase-L gene, exon 12 4 3 X52008 H.sapiens alpha-2 strychnine binding subunit of inhibitory glycine receptor mRNA 4 4 R48936 GLYCOPROTEIN VP7 (Chicken rotavirus a) 4 5 X14968 Human testis mRNA for the RII-alpha subunit of cAMP dependent protein kinase 5 1 T90036 CLASS I HISTOCOMPATIBILITY ANTIGEN, E-1 ALPHA CHAIN
PRECURSOR (Pongo pygmaeus) 5 2 R81170 TRANSLATIONALLY CONTROLLED TUMOR PROTEIN (Homo sapiens) 5 3 X67235 H.sapiens mRNA for proline rich homeobox (Prh) protein 5 4 L20469 Human truncated dopamine D3 receptor mRNA, complete cds 5 5 T63133 THYMOSIN BETA-10 (HUMAN) 6 1 T92451 TROPOMYOSIN, FIBROBLAST AND EPITHELIAL MUSCLE-TYPE
(HUMAN) 6 2 H11460 GOLIATH PROTEIN (Drosophila melanogaster) 6 3 H23975 IG ALPHA-1 CHAIN C REGION (Gorilla gorilla gorilla) 6 4 R70030 IG MU CHAIN C REGION (HUMAN) 6 5 D10522 Human mRNA for 80K-L protein, complete cds. (HUMAN);contains element
TAR1 repetitive element 7 1 H71627 VITELLOGENIN A2 PRECURSOR (Xenopus laevis) 7 2 X74795 H.sapiens P1-Cdc46 mRNA 7 3 T55840 TUMOR-ASSOCIATED ANTIGEN L6 (Homo sapiens) 7 4 D17400 Human mRNA for 6-pyruvoyl-tetrahydropterin synthase, complete cds 7 5 R71585 EBNA-2 NUCLEAR PROTEIN (Epstein-barr virus)
17
Table 2. The top 5 genes in each of the 10 clusters found in the leukemia dataset.
Cluster Rank Accession Number Name 1 1 D21261_at SM22-ALPHA HOMOLOG 1 2 X14362_at CR1 Complement component (3b/4b) receptor 1, including Knops blood
group system 1 3 HG3514-HT3708_at Tropomyosin Tm30nm, Cytoskeletal 1 4 U91903_at Frezzled (fre) mRNA 1 5 U44975_at DNA-binding protein CPBP (CPBP) mRNA, partial cds 2 1 D25248_at Randomly sequenced mRNA 2 2 X06290_at APOLIPOPROTEIN(A) PRECURSOR 2 3 M21305_at GB DEF = Alpha satellite and satellite 3 junction DNA sequence 2 4 HG3437-HT3628_s_at Myelin Proteolipid Protein, Alt. Splice 2 2 5 J03027_at HLA-G MHC class I protein HLA-G 3 1 D26018_at KIAA0039 gene, partial cds 3 2 X82018_at ZID protein 3 3 U19107_rna1_at ZNF127 (ZNF127) gene 3 4 U46746_s_at Dystrobrevin-alpha mRNA 3 5 L39009_at GB DEF = Class IV alcohol dehydrogenase 7 (ADH7) gene, 5' flanking
region 4 1 M27891_at CST3 Cystatin C (amyloid angiopathy and cerebral hemorrhage) 4 2 D26308_at NADPH-flavin reductase 4 3 U10473_s_at GB DEF = Clone p4betaGT/3 beta-1,4-galactosyltransferase mRNA, partial
cds 4 4 Z35227_at TTF mRNA for small G protein 4 5 Z32684_at XK mRNA for membrane transport protein 5 1 D28124_at Unknown product 5 2 U72648_s_at GB DEF = Alpha2-C4-adrenergic receptor gene 5 3 HG4417-HT4687_f_at Homeotic Protein Hpx-2 5 4 HG2239-HT2324_r_at Potassium Channel Protein (Gb:Z11585) 5 5 S59049_at RGS1 Regulator of G-protein signaling 1 6 1 D28416_at GB DEF = Esterase D, 5'UTR (sequence from the 5'cap to the start codon) 6 2 D10656_at CRK V-crk avian sarcoma virus CT10 oncogene homolog 6 3 M63483_at MATRIN 3 6 4 U13680_at LDHC Lactate dehydrogenase C 6 5 M64571_at MAP4 Microtubule-associated protein 4 7 1 D29642_at HYPOTHETICAL MYELOID CELL LINE PROTEIN 3 7 2 U69108_at TNF receptor associated factor 5 mRNA, partial cds 7 3 L07738_at DIHYDROPRYRIDINE-SENSITIVE L-TYPE, SKELETAL MUSCLE
CALCIUM CHANNEL GAMMA SUBUNIT 7 4 X83107_at Bmx mRNA for cytoplasmic tyrosine kinase 7 5 U69140_s_at RPS26 Ribosomal protein S26 8 1 D30036_at PHOSPHATIDYLINOSITOL 8 2 X58723_at GB DEF = MDR1 (multidrug resistance) gene for P-glycoprotein 8 3 X67683_at GB DEF = Keratin 4 8 4 L00635_at FNTB Farnesyltransferase, CAAX box, beta 8 5 J03890_rna1_at SP-C1 gene (pulmonary surfactant protein SP-C) extracted from Human
pulmonary surfactant protein C (SP-C) and pulmonary surfactant protein C1 (SP-C1) genes
9 1 D31764_at KIAA0064 gene 9 2 S82471_s_at GB DEF = SSX3=Kruppel-associated box containing SSX gene [human,
testis, mRNA Partial, 675 nt] 9 3 D87434_at KIAA0247 gene 9 4 U09877_at Helicase-like protein (HLP) mRNA 9 5 L27624_s_at TISSUE FACTOR PATHWAY INHIBITOR 2 PRECURSOR
10 1 D31891_at KIAA0067 gene 10 2 Z22534_at SERINE/THREONINE-PROTEIN KINASE RECEPTOR R1 PRECURSOR 10 3 HG4312-HT4582_s_at Transcription Factor Iiia 10 4 U09477_at Clone 53BP1 p53-binding protein mRNA, partial cds 10 5 U50315_at EZH1 Enhancer of zeste (Drosophila) homolog 1
18
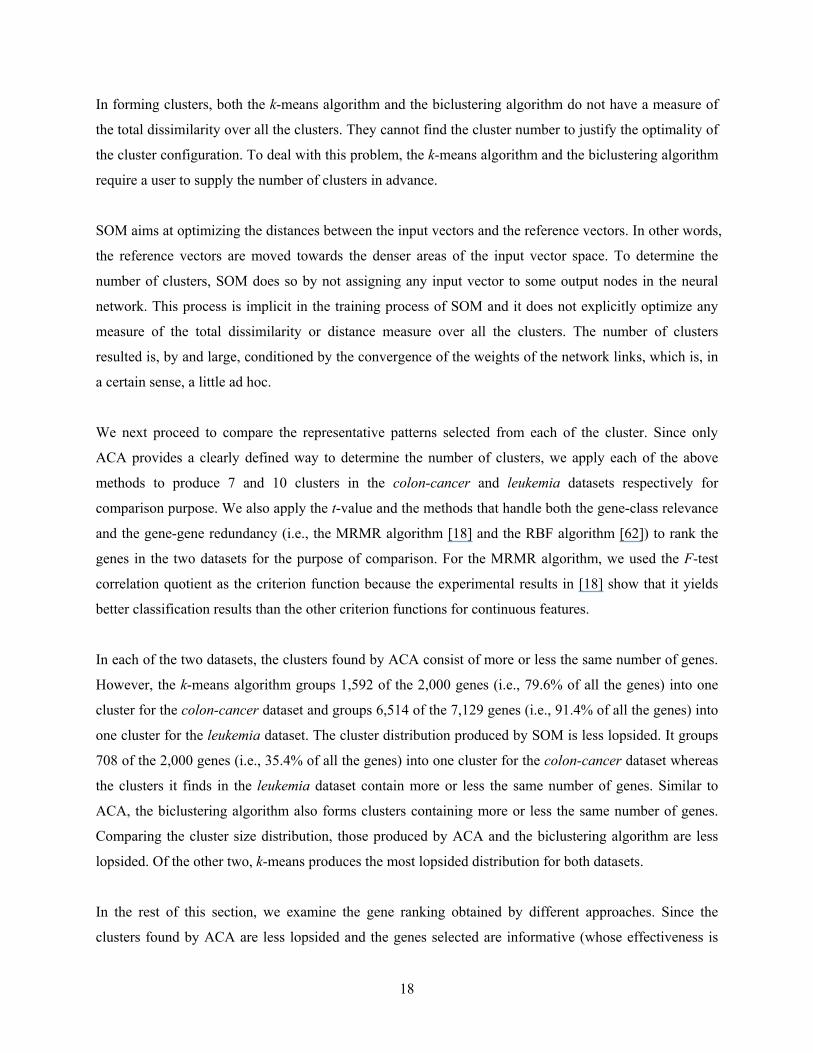
In forming clusters, both the k-means algorithm and the biclustering algorithm do not have a measure of
the total dissimilarity over all the clusters. They cannot find the cluster number to justify the optimality of
the cluster configuration. To deal with this problem, the k-means algorithm and the biclustering algorithm
require a user to supply the number of clusters in advance.
SOM aims at optimizing the distances between the input vectors and the reference vectors. In other words,
the reference vectors are moved towards the denser areas of the input vector space. To determine the
number of clusters, SOM does so by not assigning any input vector to some output nodes in the neural
network. This process is implicit in the training process of SOM and it does not explicitly optimize any
measure of the total dissimilarity or distance measure over all the clusters. The number of clusters
resulted is, by and large, conditioned by the convergence of the weights of the network links, which is, in
a certain sense, a little ad hoc.
We next proceed to compare the representative patterns selected from each of the cluster. Since only
ACA provides a clearly defined way to determine the number of clusters, we apply each of the above
methods to produce 7 and 10 clusters in the colon-cancer and leukemia datasets respectively for
comparison purpose. We also apply the t-value and the methods that handle both the gene-class relevance
and the gene-gene redundancy (i.e., the MRMR algorithm [18] and the RBF algorithm [62]) to rank the
genes in the two datasets for the purpose of comparison. For the MRMR algorithm, we used the F-test
correlation quotient as the criterion function because the experimental results in [18] show that it yields
better classification results than the other criterion functions for continuous features.
In each of the two datasets, the clusters found by ACA consist of more or less the same number of genes.
However, the k-means algorithm groups 1,592 of the 2,000 genes (i.e., 79.6% of all the genes) into one
cluster for the colon-cancer dataset and groups 6,514 of the 7,129 genes (i.e., 91.4% of all the genes) into
one cluster for the leukemia dataset. The cluster distribution produced by SOM is less lopsided. It groups
708 of the 2,000 genes (i.e., 35.4% of all the genes) into one cluster for the colon-cancer dataset whereas
the clusters it finds in the leukemia dataset contain more or less the same number of genes. Similar to
ACA, the biclustering algorithm also forms clusters containing more or less the same number of genes.
Comparing the cluster size distribution, those produced by ACA and the biclustering algorithm are less
lopsided. Of the other two, k-means produces the most lopsided distribution for both datasets.
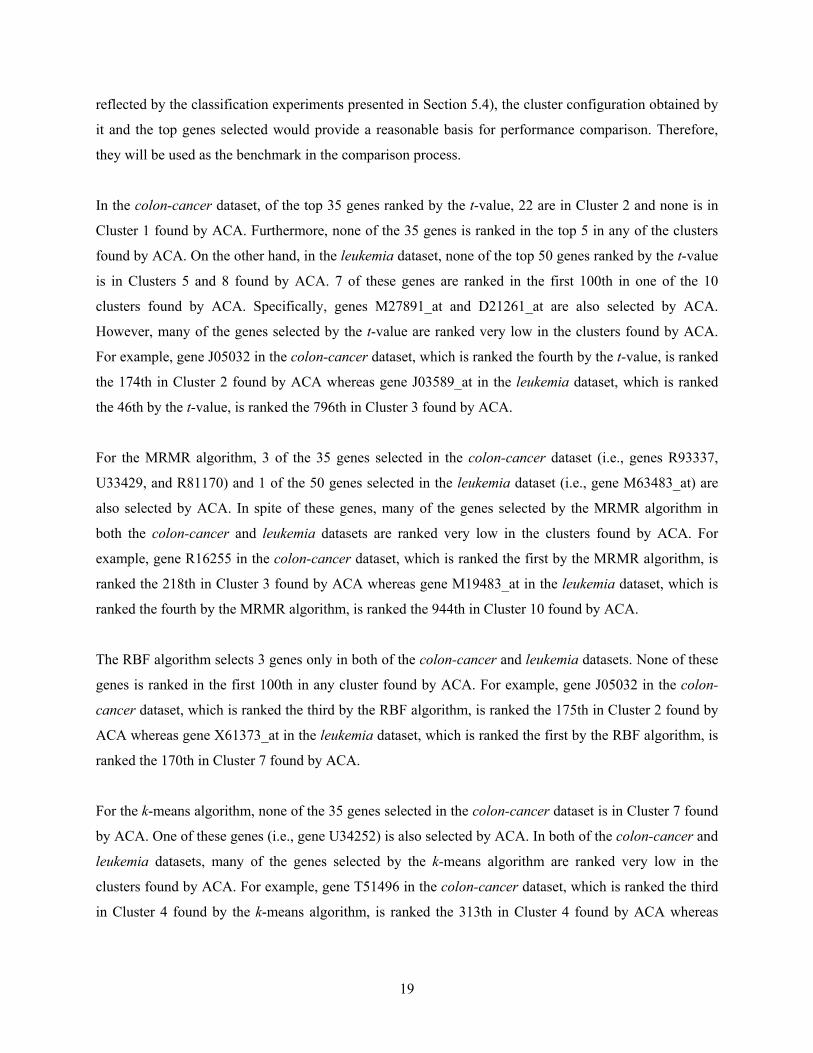
In the rest of this section, we examine the gene ranking obtained by different approaches. Since the
clusters found by ACA are less lopsided and the genes selected are informative (whose effectiveness is
19
reflected by the classification experiments presented in Section 5.4), the cluster configuration obtained by
it and the top genes selected would provide a reasonable basis for performance comparison. Therefore,
they will be used as the benchmark in the comparison process.
In the colon-cancer dataset, of the top 35 genes ranked by the t-value, 22 are in Cluster 2 and none is in
Cluster 1 found by ACA. Furthermore, none of the 35 genes is ranked in the top 5 in any of the clusters
found by ACA. On the other hand, in the leukemia dataset, none of the top 50 genes ranked by the t-value
is in Clusters 5 and 8 found by ACA. 7 of these genes are ranked in the first 100th in one of the 10
clusters found by ACA. Specifically, genes M27891_at and D21261_at are also selected by ACA.
However, many of the genes selected by the t-value are ranked very low in the clusters found by ACA.
For example, gene J05032 in the colon-cancer dataset, which is ranked the fourth by the t-value, is ranked
the 174th in Cluster 2 found by ACA whereas gene J03589_at in the leukemia dataset, which is ranked
the 46th by the t-value, is ranked the 796th in Cluster 3 found by ACA.
For the MRMR algorithm, 3 of the 35 genes selected in the colon-cancer dataset (i.e., genes R93337,
U33429, and R81170) and 1 of the 50 genes selected in the leukemia dataset (i.e., gene M63483_at) are
also selected by ACA. In spite of these genes, many of the genes selected by the MRMR algorithm in
both the colon-cancer and leukemia datasets are ranked very low in the clusters found by ACA. For
example, gene R16255 in the colon-cancer dataset, which is ranked the first by the MRMR algorithm, is
ranked the 218th in Cluster 3 found by ACA whereas gene M19483_at in the leukemia dataset, which is
ranked the fourth by the MRMR algorithm, is ranked the 944th in Cluster 10 found by ACA.
The RBF algorithm selects 3 genes only in both of the colon-cancer and leukemia datasets. None of these
genes is ranked in the first 100th in any cluster found by ACA. For example, gene J05032 in the colon-
cancer dataset, which is ranked the third by the RBF algorithm, is ranked the 175th in Cluster 2 found by
ACA whereas gene X61373_at in the leukemia dataset, which is ranked the first by the RBF algorithm, is
ranked the 170th in Cluster 7 found by ACA.
For the k-means algorithm, none of the 35 genes selected in the colon-cancer dataset is in Cluster 7 found
by ACA. One of these genes (i.e., gene U34252) is also selected by ACA. In both of the colon-cancer and
leukemia datasets, many of the genes selected by the k-means algorithm are ranked very low in the
clusters found by ACA. For example, gene T51496 in the colon-cancer dataset, which is ranked the third
in Cluster 4 found by the k-means algorithm, is ranked the 313th in Cluster 4 found by ACA whereas
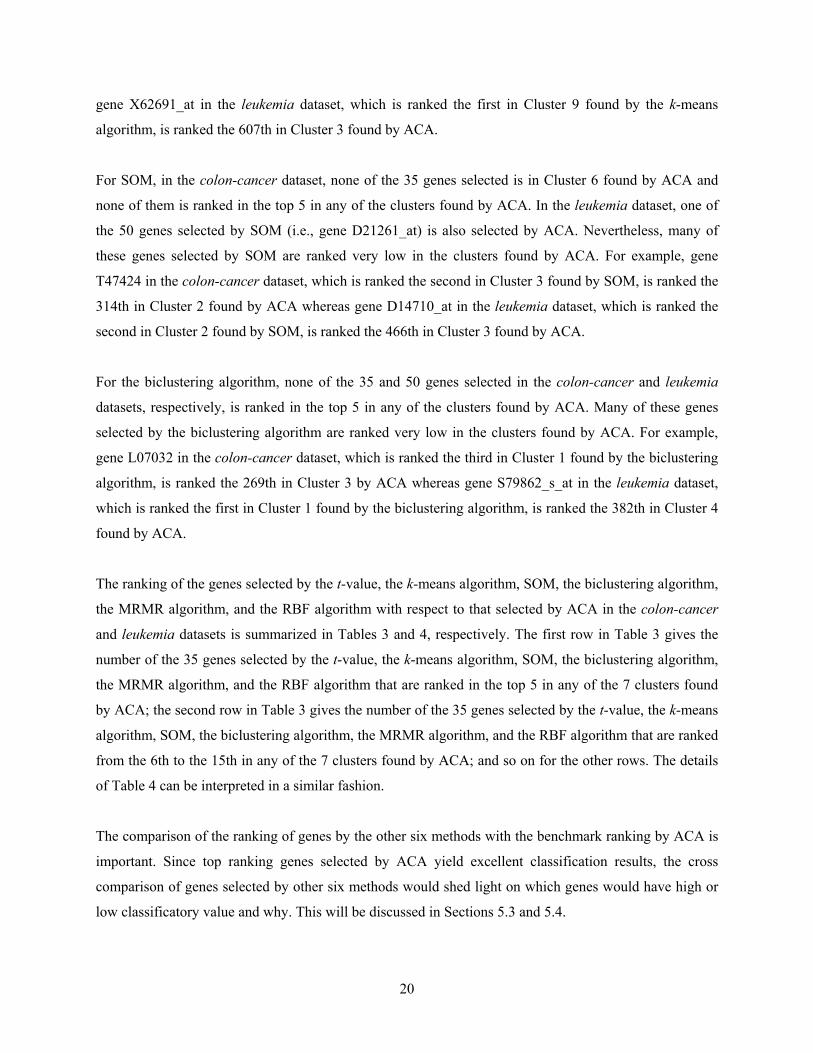
20
gene X62691_at in the leukemia dataset, which is ranked the first in Cluster 9 found by the k-means
algorithm, is ranked the 607th in Cluster 3 found by ACA.
For SOM, in the colon-cancer dataset, none of the 35 genes selected is in Cluster 6 found by ACA and
none of them is ranked in the top 5 in any of the clusters found by ACA. In the leukemia dataset, one of
the 50 genes selected by SOM (i.e., gene D21261_at) is also selected by ACA. Nevertheless, many of
these genes selected by SOM are ranked very low in the clusters found by ACA. For example, gene
T47424 in the colon-cancer dataset, which is ranked the second in Cluster 3 found by SOM, is ranked the
314th in Cluster 2 found by ACA whereas gene D14710_at in the leukemia dataset, which is ranked the
second in Cluster 2 found by SOM, is ranked the 466th in Cluster 3 found by ACA.
For the biclustering algorithm, none of the 35 and 50 genes selected in the colon-cancer and leukemia
datasets, respectively, is ranked in the top 5 in any of the clusters found by ACA. Many of these genes
selected by the biclustering algorithm are ranked very low in the clusters found by ACA. For example,
gene L07032 in the colon-cancer dataset, which is ranked the third in Cluster 1 found by the biclustering
algorithm, is ranked the 269th in Cluster 3 by ACA whereas gene S79862_s_at in the leukemia dataset,
which is ranked the first in Cluster 1 found by the biclustering algorithm, is ranked the 382th in Cluster 4
found by ACA.
The ranking of the genes selected by the t-value, the k-means algorithm, SOM, the biclustering algorithm,
the MRMR algorithm, and the RBF algorithm with respect to that selected by ACA in the colon-cancer
and leukemia datasets is summarized in Tables 3 and 4, respectively. The first row in Table 3 gives the
number of the 35 genes selected by the t-value, the k-means algorithm, SOM, the biclustering algorithm,
the MRMR algorithm, and the RBF algorithm that are ranked in the top 5 in any of the 7 clusters found
by ACA; the second row in Table 3 gives the number of the 35 genes selected by the t-value, the k-means
algorithm, SOM, the biclustering algorithm, the MRMR algorithm, and the RBF algorithm that are ranked
from the 6th to the 15th in any of the 7 clusters found by ACA; and so on for the other rows. The details
of Table 4 can be interpreted in a similar fashion.
The comparison of the ranking of genes by the other six methods with the benchmark ranking by ACA is
important. Since top ranking genes selected by ACA yield excellent classification results, the cross
comparison of genes selected by other six methods would shed light on which genes would have high or
low classificatory value and why. This will be discussed in Sections 5.3 and 5.4.
21
Table 3. The ranking of the 35 genes selected by different approaches in the colon-cancer dataset.
Rank in the clusters found by ACA
t-value k-means SOM Biclustering MRMR RBF
1–5 0 1 0 0 3 0 6–15 4 1 3 3 2 0 16–50 2 6 6 5 1 0
51–100 14 5 2 5 6 0 101–200 7 5 9 3 17 2 201–350 8 17 15 19 21 1
Table 4. The ranking of the 50 genes selected by different approaches in the leukemia dataset.
Rank in the clusters found by ACA
t-value k-means SOM Biclustering MRMR RBF
1–10 2 1 1 1 1 0 11–50 2 2 1 2 2 0
51–100 3 3 3 1 4 0 101–200 7 8 7 6 4 1 201–300 4 5 10 10 6 1 301–500 13 21 12 11 15 1 501–700 8 9 9 8 6 0
701–1000 11 1 7 11 12 0
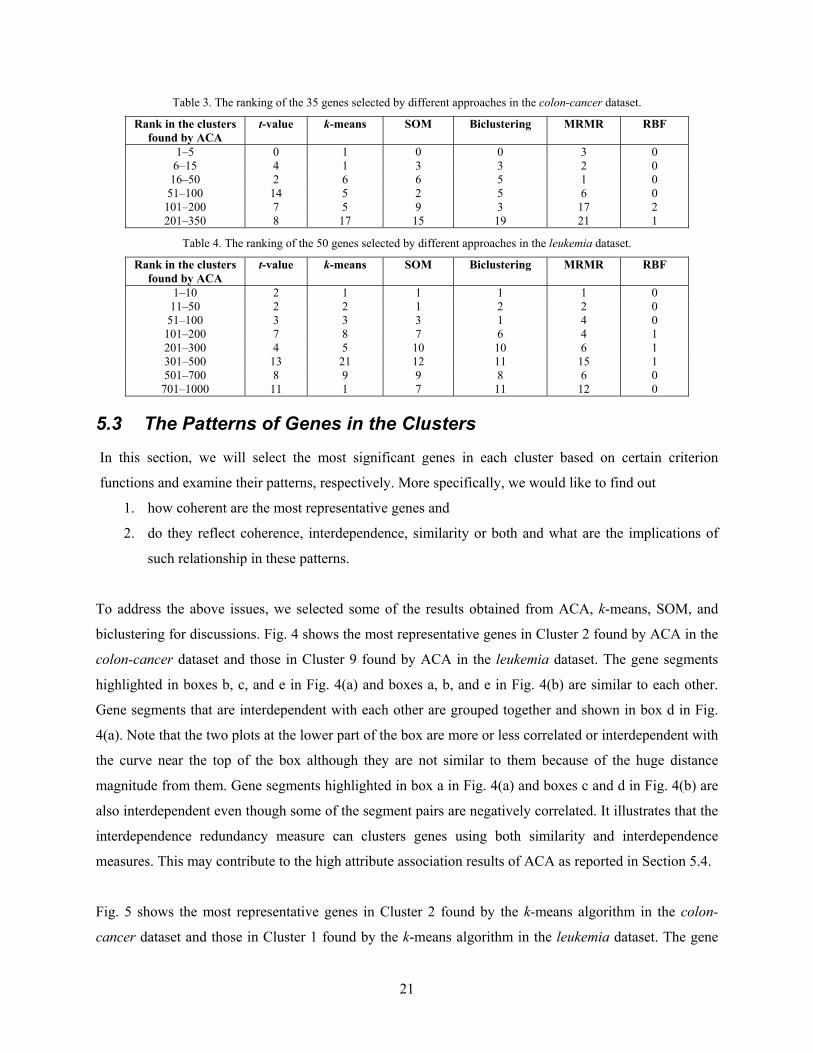
5.3 The Patterns of Genes in the Clusters In this section, we will select the most significant genes in each cluster based on certain criterion
functions and examine their patterns, respectively. More specifically, we would like to find out
1. how coherent are the most representative genes and
2. do they reflect coherence, interdependence, similarity or both and what are the implications of
such relationship in these patterns.
To address the above issues, we selected some of the results obtained from ACA, k-means, SOM, and
biclustering for discussions. Fig. 4 shows the most representative genes in Cluster 2 found by ACA in the
colon-cancer dataset and those in Cluster 9 found by ACA in the leukemia dataset. The gene segments
highlighted in boxes b, c, and e in Fig. 4(a) and boxes a, b, and e in Fig. 4(b) are similar to each other.
Gene segments that are interdependent with each other are grouped together and shown in box d in Fig.
4(a). Note that the two plots at the lower part of the box are more or less correlated or interdependent with
the curve near the top of the box although they are not similar to them because of the huge distance
magnitude from them. Gene segments highlighted in box a in Fig. 4(a) and boxes c and d in Fig. 4(b) are
also interdependent even though some of the segment pairs are negatively correlated. It illustrates that the
interdependence redundancy measure can clusters genes using both similarity and interdependence
measures. This may contribute to the high attribute association results of ACA as reported in Section 5.4.
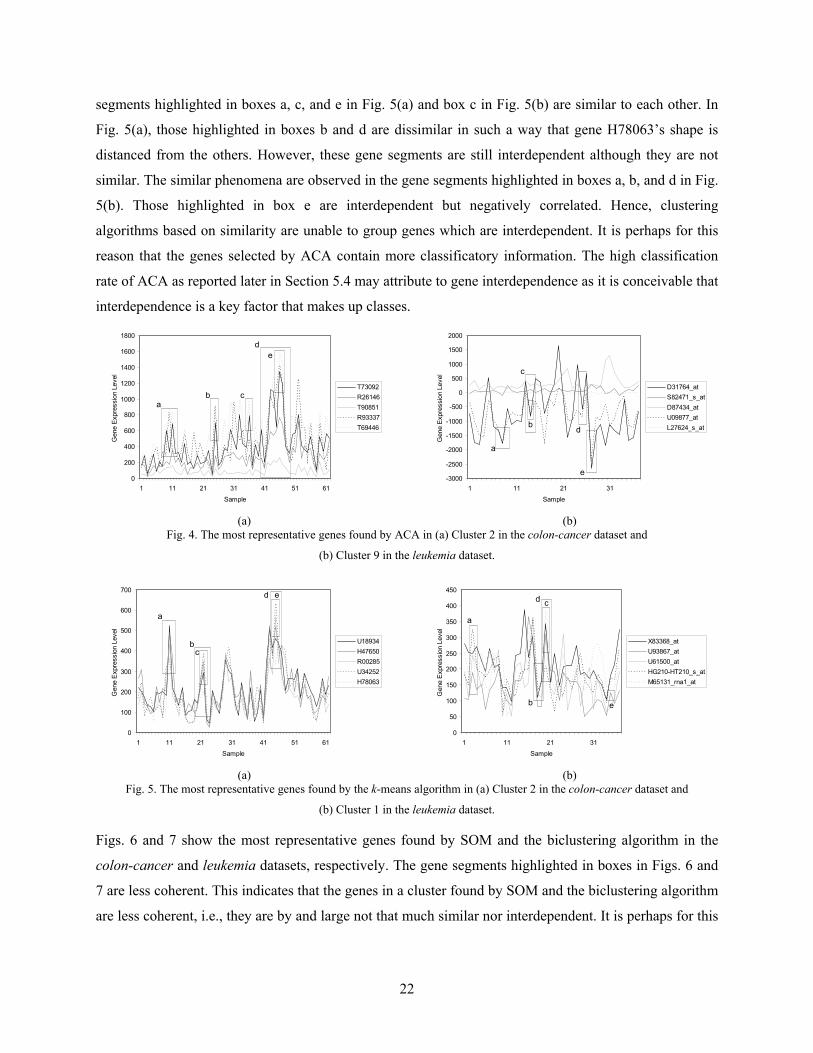
Fig. 5 shows the most representative genes in Cluster 2 found by the k-means algorithm in the colon-
cancer dataset and those in Cluster 1 found by the k-means algorithm in the leukemia dataset. The gene
22
segments highlighted in boxes a, c, and e in Fig. 5(a) and box c in Fig. 5(b) are similar to each other. In
Fig. 5(a), those highlighted in boxes b and d are dissimilar in such a way that gene H78063’s shape is
distanced from the others. However, these gene segments are still interdependent although they are not
similar. The similar phenomena are observed in the gene segments highlighted in boxes a, b, and d in Fig.
5(b). Those highlighted in box e are interdependent but negatively correlated. Hence, clustering
algorithms based on similarity are unable to group genes which are interdependent. It is perhaps for this
reason that the genes selected by ACA contain more classificatory information. The high classification
rate of ACA as reported later in Section 5.4 may attribute to gene interdependence as it is conceivable that
interdependence is a key factor that makes up classes.
0
200
400
600
800
1000
1200
1400
1600
1800
1 11 21 31 41 51 61
Sample
Gen
e Ex
pres
sion
Lev
el
T73092R26146T90851R93337T69446
ab c
de
(a)
-3000
-2500
-2000
-1500
-1000
-500
0
500
1000
1500
2000
1 11 21 31
Sample
Gen
e Ex
pres
sion
Lev
el
D31764_atS82471_s_atD87434_atU09877_atL27624_s_at
a
b
c
d
e
(b)
Fig. 4. The most representative genes found by ACA in (a) Cluster 2 in the colon-cancer dataset and
(b) Cluster 9 in the leukemia dataset.
0
100
200
300
400
500
600
700
1 11 21 31 41 51 61Sample
Gen
e E
xpre
ssio
n Le
vel
U18934H47650R00285U34252H78063
a
bc
d e
(a)
0
50
100
150
200
250
300
350
400
450
1 11 21 31Sample
Gen
e E
xpre
ssio
n Le
vel
X83368_atU93867_atU61500_atHG210-HT210_s_atM65131_rna1_at
a
b
cd
e
(b)
Fig. 5. The most representative genes found by the k-means algorithm in (a) Cluster 2 in the colon-cancer dataset and
(b) Cluster 1 in the leukemia dataset.
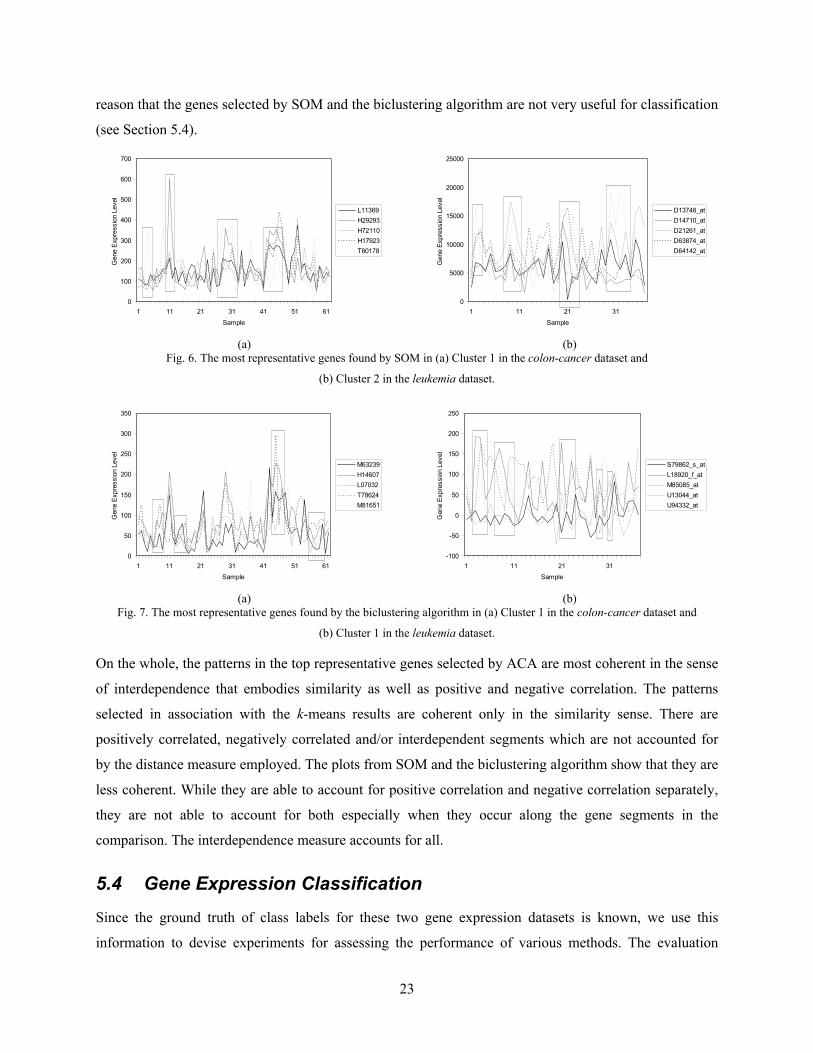
Figs. 6 and 7 show the most representative genes found by SOM and the biclustering algorithm in the
colon-cancer and leukemia datasets, respectively. The gene segments highlighted in boxes in Figs. 6 and
7 are less coherent. This indicates that the genes in a cluster found by SOM and the biclustering algorithm
are less coherent, i.e., they are by and large not that much similar nor interdependent. It is perhaps for this
23
reason that the genes selected by SOM and the biclustering algorithm are not very useful for classification
(see Section 5.4).
0
100
200
300
400
500
600
700
1 11 21 31 41 51 61
Sample
Gen
e Ex
pres
sion
Lev
el
L11369H29293H72110H17923T80178
(a)
0
5000
10000
15000
20000
25000
1 11 21 31
Sample
Gen
e Ex
pres
sion
Lev
el
D13748_atD14710_atD21261_atD63874_atD64142_at
(b)
Fig. 6. The most representative genes found by SOM in (a) Cluster 1 in the colon-cancer dataset and
(b) Cluster 2 in the leukemia dataset.
0
50
100
150
200
250
300
350
1 11 21 31 41 51 61Sample
Gen
e E
xpre
ssio
n Le
vel
M63239H14607L07032T78624M81651
(a)
-100
-50
0
50
100
150
200
250
1 11 21 31Sample
Gen
e E
xpre
ssio
n Le
vel
S79862_s_atL18920_f_atM85085_atU13044_atU94332_at
(b)
Fig. 7. The most representative genes found by the biclustering algorithm in (a) Cluster 1 in the colon-cancer dataset and
(b) Cluster 1 in the leukemia dataset.
On the whole, the patterns in the top representative genes selected by ACA are most coherent in the sense
of interdependence that embodies similarity as well as positive and negative correlation. The patterns
selected in association with the k-means results are coherent only in the similarity sense. There are
positively correlated, negatively correlated and/or interdependent segments which are not accounted for
by the distance measure employed. The plots from SOM and the biclustering algorithm show that they are
less coherent. While they are able to account for positive correlation and negative correlation separately,
they are not able to account for both especially when they occur along the gene segments in the
comparison. The interdependence measure accounts for all.
5.4 Gene Expression Classification Since the ground truth of class labels for these two gene expression datasets is known, we use this
information to devise experiments for assessing the performance of various methods. The evaluation
24
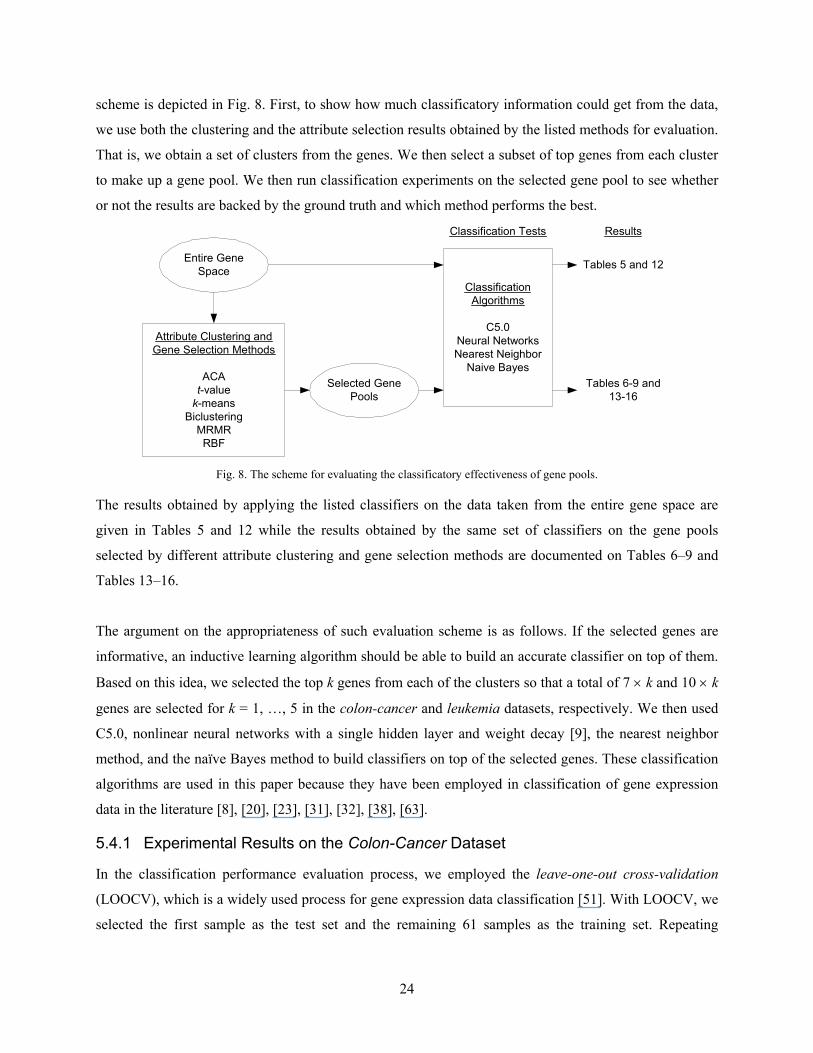
scheme is depicted in Fig. 8. First, to show how much classificatory information could get from the data,
we use both the clustering and the attribute selection results obtained by the listed methods for evaluation.
That is, we obtain a set of clusters from the genes. We then select a subset of top genes from each cluster
to make up a gene pool. We then run classification experiments on the selected gene pool to see whether
or not the results are backed by the ground truth and which method performs the best.
ClassificationAlgorithms
C5.0Neural NetworksNearest Neighbor
Naive Bayes
Entire GeneSpace
Selected GenePools
Attribute Clustering andGene Selection Methods
ACAt-valuek-means
BiclusteringMRMRRBF
Classification Tests Results
Tables 5 and 12
Tables 6-9 and13-16
Fig. 8. The scheme for evaluating the classificatory effectiveness of gene pools.
The results obtained by applying the listed classifiers on the data taken from the entire gene space are
given in Tables 5 and 12 while the results obtained by the same set of classifiers on the gene pools
selected by different attribute clustering and gene selection methods are documented on Tables 6–9 and
Tables 13–16.
The argument on the appropriateness of such evaluation scheme is as follows. If the selected genes are
informative, an inductive learning algorithm should be able to build an accurate classifier on top of them.
Based on this idea, we selected the top k genes from each of the clusters so that a total of 7 × k and 10 × k
genes are selected for k = 1, …, 5 in the colon-cancer and leukemia datasets, respectively. We then used
C5.0, nonlinear neural networks with a single hidden layer and weight decay [9], the nearest neighbor
method, and the naïve Bayes method to build classifiers on top of the selected genes. These classification
algorithms are used in this paper because they have been employed in classification of gene expression
data in the literature [8], [20], [23], [31], [32], [38], [63].
5.4.1 Experimental Results on the Colon-Cancer Dataset
In the classification performance evaluation process, we employed the leave-one-out cross-validation
(LOOCV), which is a widely used process for gene expression data classification [51]. With LOOCV, we
selected the first sample as the test set and the remaining 61 samples as the training set. Repeating
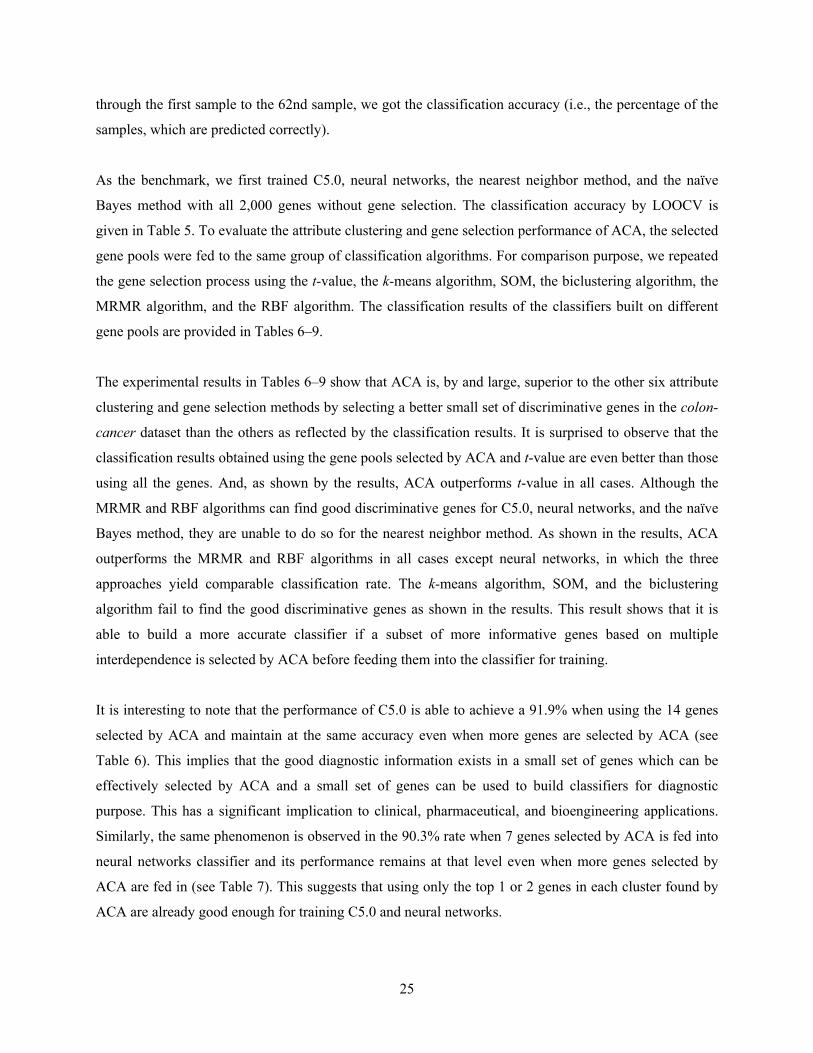
25
through the first sample to the 62nd sample, we got the classification accuracy (i.e., the percentage of the
samples, which are predicted correctly).
As the benchmark, we first trained C5.0, neural networks, the nearest neighbor method, and the naïve
Bayes method with all 2,000 genes without gene selection. The classification accuracy by LOOCV is
given in Table 5. To evaluate the attribute clustering and gene selection performance of ACA, the selected
gene pools were fed to the same group of classification algorithms. For comparison purpose, we repeated
the gene selection process using the t-value, the k-means algorithm, SOM, the biclustering algorithm, the
MRMR algorithm, and the RBF algorithm. The classification results of the classifiers built on different
gene pools are provided in Tables 6–9.
The experimental results in Tables 6–9 show that ACA is, by and large, superior to the other six attribute
clustering and gene selection methods by selecting a better small set of discriminative genes in the colon-
cancer dataset than the others as reflected by the classification results. It is surprised to observe that the
classification results obtained using the gene pools selected by ACA and t-value are even better than those
using all the genes. And, as shown by the results, ACA outperforms t-value in all cases. Although the
MRMR and RBF algorithms can find good discriminative genes for C5.0, neural networks, and the naïve
Bayes method, they are unable to do so for the nearest neighbor method. As shown in the results, ACA
outperforms the MRMR and RBF algorithms in all cases except neural networks, in which the three
approaches yield comparable classification rate. The k-means algorithm, SOM, and the biclustering
algorithm fail to find the good discriminative genes as shown in the results. This result shows that it is
able to build a more accurate classifier if a subset of more informative genes based on multiple
interdependence is selected by ACA before feeding them into the classifier for training.
It is interesting to note that the performance of C5.0 is able to achieve a 91.9% when using the 14 genes
selected by ACA and maintain at the same accuracy even when more genes are selected by ACA (see
Table 6). This implies that the good diagnostic information exists in a small set of genes which can be
effectively selected by ACA and a small set of genes can be used to build classifiers for diagnostic
purpose. This has a significant implication to clinical, pharmaceutical, and bioengineering applications.
Similarly, the same phenomenon is observed in the 90.3% rate when 7 genes selected by ACA is fed into
neural networks classifier and its performance remains at that level even when more genes selected by
ACA are fed in (see Table 7). This suggests that using only the top 1 or 2 genes in each cluster found by
ACA are already good enough for training C5.0 and neural networks.
26
Table 5. The performance of different classification algorithms in the colon-cancer dataset.
Classification Algorithm Classification Accuracy C5.0 82.3%
Neural Networks 83.9% Nearest Neighbor 79.0%
Naïve Bayes 35.5%
Table 6. The performance of C5.0 on the top genes selected by different techniques in the colon-cancer dataset.
Classification Accuracy No. of Genes Selected ACA t-value k-means SOM Biclustering MRMR
7 88.7% 83.9% 64.5% 64.5% 67.7% 80.6% 14 91.9% 77.4% 77.4% 59.7% 58.1% 75.8% 21 91.9% 82.3% 75.8% 58.1% 69.4% 83.9% 28 91.9% 85.5% 74.2% 48.4% 77.4% 83.9% 35 91.9% 74.2% 71.0% 43.5% 75.8% 83.9%
* The RBF algorithm selects 3 genes only and achieves a classification accuracy of 82.3%.
Table 7. The performance of neural networks on the top genes selected by different techniques in the colon-cancer dataset.
Classification Accuracy No. of Genes Selected ACA t-value k-means SOM Biclustering MRMR
7 90.3% 80.6% 71.0% 64.5% 75.8% 87.1% 14 90.3% 87.1% 83.9% 75.8% 72.6% 90.3% 21 90.3% 83.9% 77.4% 75.8% 82.3% 87.1% 28 90.3% 80.6% 85.5% 67.7% 72.6% 90.3% 35 90.3% 80.6% 87.1% 67.7% 79.0% 90.3%
* The RBF algorithm selects 3 genes only and achieves a classification accuracy of 90.3%.
Table 8. The performance of the nearest neighbor method on the top genes selected by different techniques
in the colon-cancer dataset.
Classification Accuracy No. of Genes Selected ACA t-value k-means SOM Biclustering MRMR
7 83.9% 80.6% 58.1% 50.0% 69.4% 64.5% 14 82.3% 80.6% 69.4% 59.7% 62.9% 56.5% 21 82.3% 80.6% 64.5% 59.7% 53.2% 61.3% 28 82.3% 79.0% 61.3% 58.1% 64.5% 67.7% 35 80.6% 75.8% 62.9% 54.8% 53.2% 72.6%
* The RBF algorithm selects 3 genes only and achieves a classification accuracy of 67.7%.
Table 9. The performance of the naïve Bayes method on the top genes selected by different techniques
in the colon-cancer dataset.
Classification Accuracy No. of Genes Selected ACA t-value k-means SOM Biclustering MRMR
7 64.5% 56.5% 62.9% 64.5% 67.7% 64.5% 14 67.7% 53.2% 62.9% 29.0% 67.7% 64.5% 21 67.7% 45.2% 62.9% 29.0% 48.4% 38.7% 28 67.7% 35.5% 56.5% 29.0% 48.4% 43.5% 35 67.7% 38.7% 56.5% 29.0% 48.4% 43.5%
* The RBF algorithm selects 3 genes only and achieves a classification accuracy of 64.5%.
On the other hand, the poor classification performance using the set selected by the k-means algorithm,
SOM, and the biclustering algorithm (see Tables 5–9) may be explained by our observation that their
selected top genes are ranked very low by ACA (see Table 3). In another words, they are less
27
interdependent with other genes in the group. To further this argument, we also observe that the genes
selected by t-value are ranked relatively high by ACA in comparison to the other three (see Table 3).
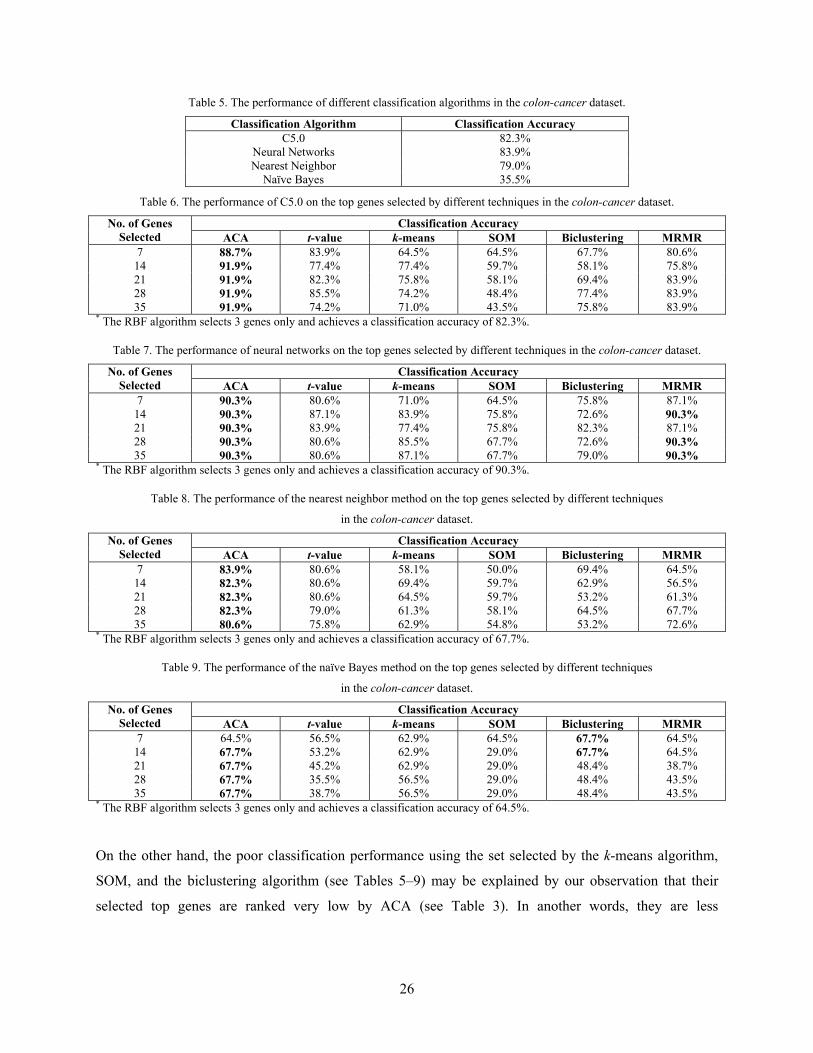
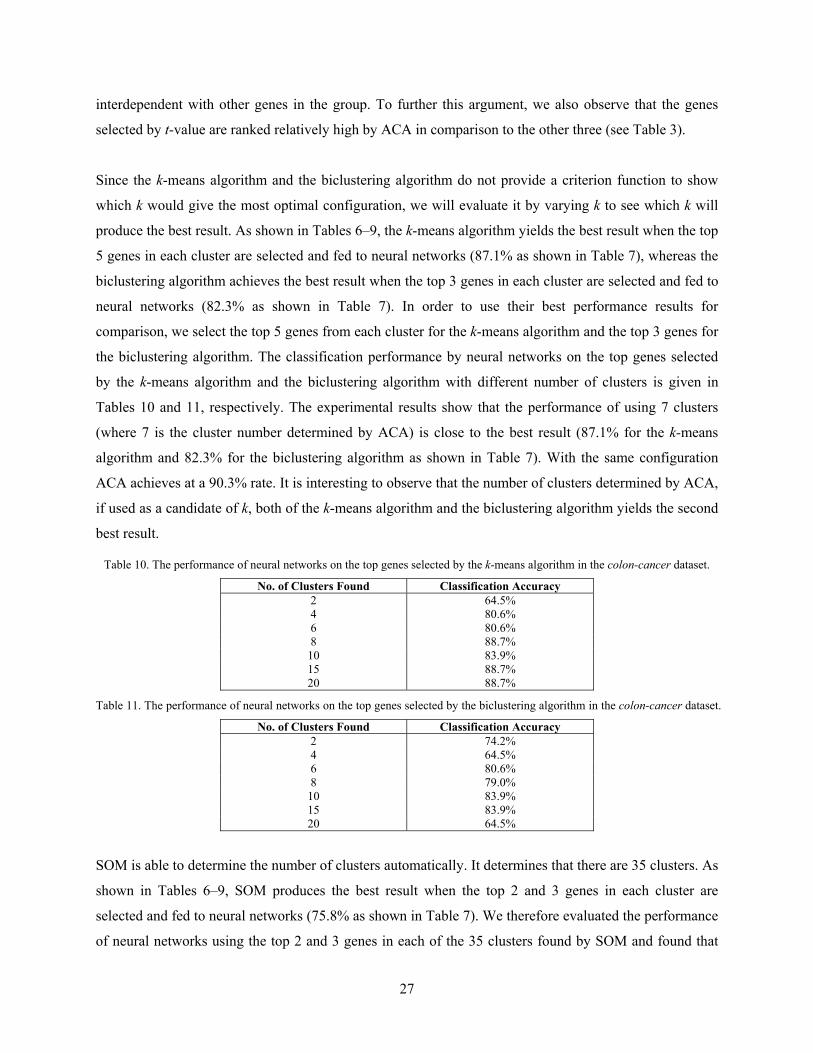
Since the k-means algorithm and the biclustering algorithm do not provide a criterion function to show
which k would give the most optimal configuration, we will evaluate it by varying k to see which k will
produce the best result. As shown in Tables 6–9, the k-means algorithm yields the best result when the top
5 genes in each cluster are selected and fed to neural networks (87.1% as shown in Table 7), whereas the
biclustering algorithm achieves the best result when the top 3 genes in each cluster are selected and fed to
neural networks (82.3% as shown in Table 7). In order to use their best performance results for
comparison, we select the top 5 genes from each cluster for the k-means algorithm and the top 3 genes for
the biclustering algorithm. The classification performance by neural networks on the top genes selected
by the k-means algorithm and the biclustering algorithm with different number of clusters is given in
Tables 10 and 11, respectively. The experimental results show that the performance of using 7 clusters
(where 7 is the cluster number determined by ACA) is close to the best result (87.1% for the k-means
algorithm and 82.3% for the biclustering algorithm as shown in Table 7). With the same configuration
ACA achieves at a 90.3% rate. It is interesting to observe that the number of clusters determined by ACA,
if used as a candidate of k, both of the k-means algorithm and the biclustering algorithm yields the second
best result.
Table 10. The performance of neural networks on the top genes selected by the k-means algorithm in the colon-cancer dataset.
No. of Clusters Found Classification Accuracy 2 64.5% 4 80.6% 6 80.6% 8 88.7%
10 83.9% 15 88.7% 20 88.7%
Table 11. The performance of neural networks on the top genes selected by the biclustering algorithm in the colon-cancer dataset.
No. of Clusters Found Classification Accuracy 2 74.2% 4 64.5% 6 80.6% 8 79.0%
10 83.9% 15 83.9% 20 64.5%
SOM is able to determine the number of clusters automatically. It determines that there are 35 clusters. As
shown in Tables 6–9, SOM produces the best result when the top 2 and 3 genes in each cluster are
selected and fed to neural networks (75.8% as shown in Table 7). We therefore evaluated the performance
of neural networks using the top 2 and 3 genes in each of the 35 clusters found by SOM and found that
28
the classification accuracy is 87.1% and 88.7%, respectively. It is important to note that ACA obtains a
classification accuracy of 90.3% using 7 genes only (see Table 7).
5.4.2 Experimental Results on the Leukemia Dataset
We next report the performance of ACA based on the classification results on the leukemia dataset. The
dataset taken from the website is already divided into a training set, which consists of 38 samples, and a
test set, which consists of 34 samples, by the donor of the dataset. Like what we did for the colon-cancer
data, we used C5.0, neural networks, the nearest neighbor method, and the naïve Bayes method to build
classifiers using the selected genes as the training set. The classifiers thus built were tested on the samples
in the test set.
Again, as the benchmark, we first trained C5.0, neural networks, the nearest neighbor method, and the
naïve Bayes method with all 7,129 genes. The classification results are given in Table 12. To evaluate the
attribute clustering and gene selection performance of ACA, its selected gene pools were fed to the same
group of classification algorithms. For the classification comparison purpose, we fed into the same group
of classifiers the gene selected by the t-value, the k-means algorithm, SOM, the biclustering algorithm,
the MRMR algorithm, and the RBF algorithm using the similar process. The classification results of the
classifiers built on respective gene pools are provided in Tables 13–16.
The experimental results in Tables 13–16 show that ACA is, by and large, superior to the other six
attribute clustering and gene selection methods as it selects a better small set of discriminative genes from
the leukemia dataset than the others. As in the colon-cancer cases, the classification results obtained using
the gene pools selected by ACA are also better than those using all the leukemia genes. In all cases, ACA
outperforms t-value. However, although the t-value can also find the good discriminative genes for C5.0
and the nearest neighbor method, yet it fails to find good discriminative genes for the training of neural
networks and the naïve Bayes method. The MRMR and RBF algorithms find good discriminative genes
for C5.0, neural networks, and the naïve Bayes method but are unable to do so for the nearest neighbor
method. ACA outperforms the MRMR and RBF algorithms in all cases except neural networks, in which
the three approaches produce comparable classification accuracy. The k-means algorithm, SOM, and the
biclustering algorithm cannot find the good discriminative genes as shown in the results. Similar to the
result found in the colon-cancer dataset, this result shows that it is able to build a more accurate classifier
if a subset of more informative genes based on multiple interdependence selected by ACA are fed into the
classifier for training.
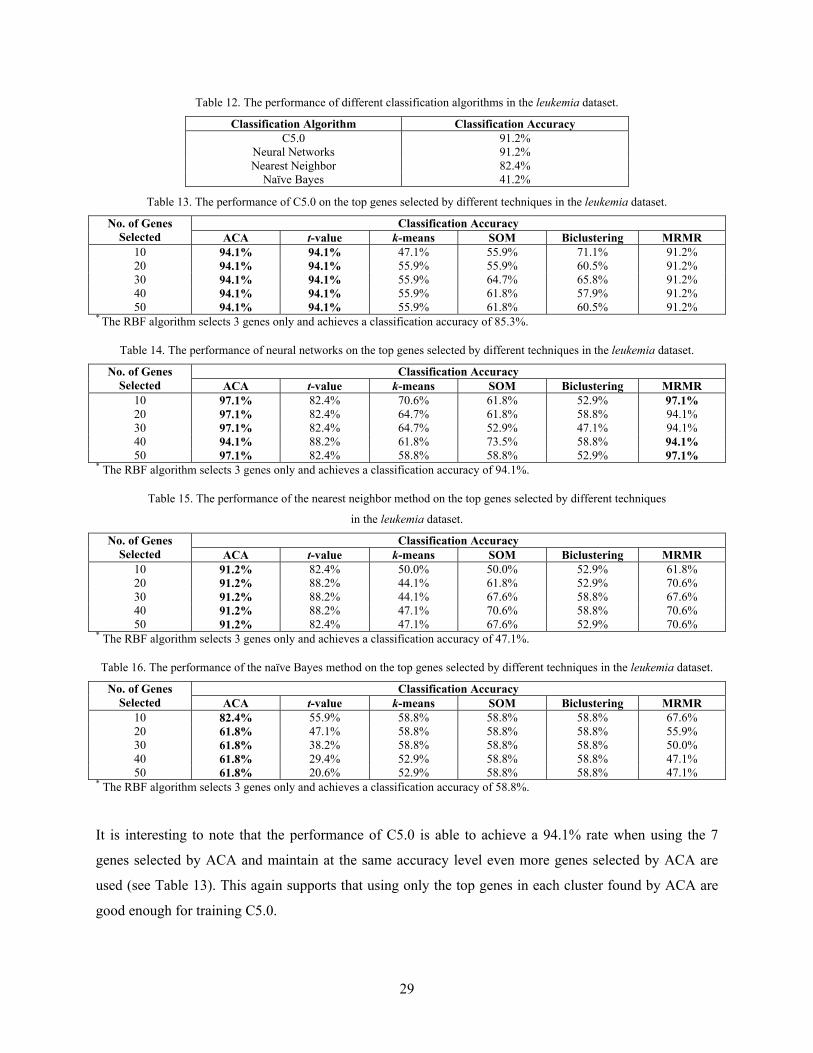
29
Table 12. The performance of different classification algorithms in the leukemia dataset.
Classification Algorithm Classification Accuracy C5.0 91.2%
Neural Networks 91.2% Nearest Neighbor 82.4%
Naïve Bayes 41.2%
Table 13. The performance of C5.0 on the top genes selected by different techniques in the leukemia dataset.
Classification Accuracy No. of Genes Selected ACA t-value k-means SOM Biclustering MRMR
10 94.1% 94.1% 47.1% 55.9% 71.1% 91.2% 20 94.1% 94.1% 55.9% 55.9% 60.5% 91.2% 30 94.1% 94.1% 55.9% 64.7% 65.8% 91.2% 40 94.1% 94.1% 55.9% 61.8% 57.9% 91.2% 50 94.1% 94.1% 55.9% 61.8% 60.5% 91.2%
* The RBF algorithm selects 3 genes only and achieves a classification accuracy of 85.3%.
Table 14. The performance of neural networks on the top genes selected by different techniques in the leukemia dataset.
Classification Accuracy No. of Genes Selected ACA t-value k-means SOM Biclustering MRMR
10 97.1% 82.4% 70.6% 61.8% 52.9% 97.1% 20 97.1% 82.4% 64.7% 61.8% 58.8% 94.1% 30 97.1% 82.4% 64.7% 52.9% 47.1% 94.1% 40 94.1% 88.2% 61.8% 73.5% 58.8% 94.1% 50 97.1% 82.4% 58.8% 58.8% 52.9% 97.1%
* The RBF algorithm selects 3 genes only and achieves a classification accuracy of 94.1%.
Table 15. The performance of the nearest neighbor method on the top genes selected by different techniques
in the leukemia dataset.
Classification Accuracy No. of Genes Selected ACA t-value k-means SOM Biclustering MRMR
10 91.2% 82.4% 50.0% 50.0% 52.9% 61.8% 20 91.2% 88.2% 44.1% 61.8% 52.9% 70.6% 30 91.2% 88.2% 44.1% 67.6% 58.8% 67.6% 40 91.2% 88.2% 47.1% 70.6% 58.8% 70.6% 50 91.2% 82.4% 47.1% 67.6% 52.9% 70.6%
* The RBF algorithm selects 3 genes only and achieves a classification accuracy of 47.1%.
Table 16. The performance of the naïve Bayes method on the top genes selected by different techniques in the leukemia dataset.
Classification Accuracy No. of Genes Selected ACA t-value k-means SOM Biclustering MRMR
10 82.4% 55.9% 58.8% 58.8% 58.8% 67.6% 20 61.8% 47.1% 58.8% 58.8% 58.8% 55.9% 30 61.8% 38.2% 58.8% 58.8% 58.8% 50.0% 40 61.8% 29.4% 52.9% 58.8% 58.8% 47.1% 50 61.8% 20.6% 52.9% 58.8% 58.8% 47.1%
* The RBF algorithm selects 3 genes only and achieves a classification accuracy of 58.8%.
It is interesting to note that the performance of C5.0 is able to achieve a 94.1% rate when using the 7
genes selected by ACA and maintain at the same accuracy level even more genes selected by ACA are
used (see Table 13). This again supports that using only the top genes in each cluster found by ACA are
good enough for training C5.0.
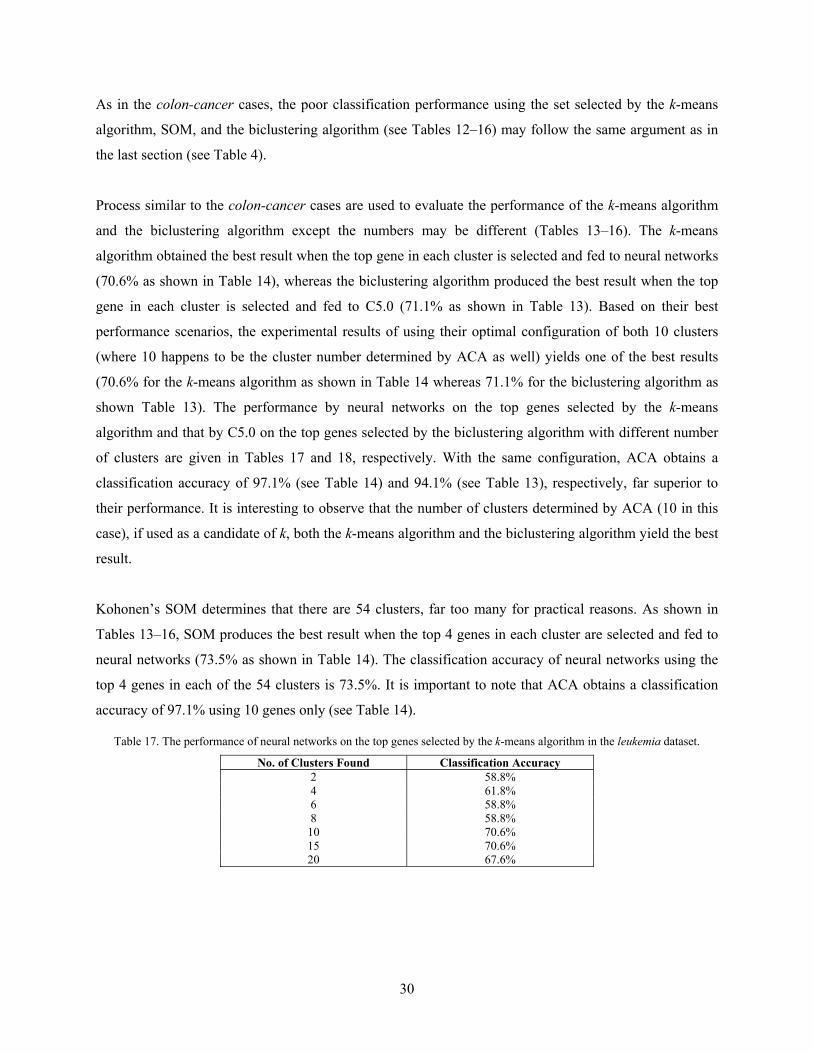
30
As in the colon-cancer cases, the poor classification performance using the set selected by the k-means
algorithm, SOM, and the biclustering algorithm (see Tables 12–16) may follow the same argument as in
the last section (see Table 4).
Process similar to the colon-cancer cases are used to evaluate the performance of the k-means algorithm
and the biclustering algorithm except the numbers may be different (Tables 13–16). The k-means
algorithm obtained the best result when the top gene in each cluster is selected and fed to neural networks
(70.6% as shown in Table 14), whereas the biclustering algorithm produced the best result when the top
gene in each cluster is selected and fed to C5.0 (71.1% as shown in Table 13). Based on their best
performance scenarios, the experimental results of using their optimal configuration of both 10 clusters
(where 10 happens to be the cluster number determined by ACA as well) yields one of the best results
(70.6% for the k-means algorithm as shown in Table 14 whereas 71.1% for the biclustering algorithm as
shown Table 13). The performance by neural networks on the top genes selected by the k-means
algorithm and that by C5.0 on the top genes selected by the biclustering algorithm with different number
of clusters are given in Tables 17 and 18, respectively. With the same configuration, ACA obtains a
classification accuracy of 97.1% (see Table 14) and 94.1% (see Table 13), respectively, far superior to
their performance. It is interesting to observe that the number of clusters determined by ACA (10 in this
case), if used as a candidate of k, both the k-means algorithm and the biclustering algorithm yield the best
result.
Kohonen’s SOM determines that there are 54 clusters, far too many for practical reasons. As shown in
Tables 13–16, SOM produces the best result when the top 4 genes in each cluster are selected and fed to
neural networks (73.5% as shown in Table 14). The classification accuracy of neural networks using the
top 4 genes in each of the 54 clusters is 73.5%. It is important to note that ACA obtains a classification
accuracy of 97.1% using 10 genes only (see Table 14).
Table 17. The performance of neural networks on the top genes selected by the k-means algorithm in the leukemia dataset.
No. of Clusters Found Classification Accuracy 2 58.8% 4 61.8% 6 58.8% 8 58.8%
10 70.6% 15 70.6% 20 67.6%
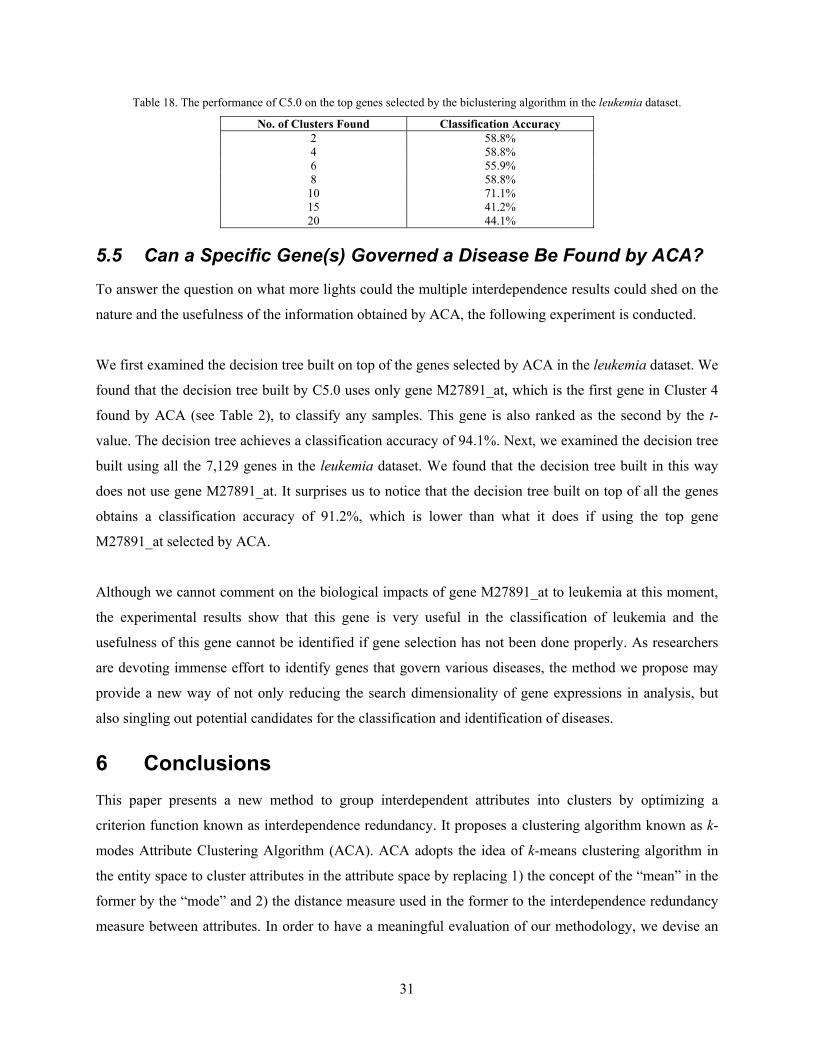
31
Table 18. The performance of C5.0 on the top genes selected by the biclustering algorithm in the leukemia dataset.
No. of Clusters Found Classification Accuracy 2 58.8% 4 58.8% 6 55.9% 8 58.8%
10 71.1% 15 41.2% 20 44.1%
5.5 Can a Specific Gene(s) Governed a Disease Be Found by ACA? To answer the question on what more lights could the multiple interdependence results could shed on the
nature and the usefulness of the information obtained by ACA, the following experiment is conducted.
We first examined the decision tree built on top of the genes selected by ACA in the leukemia dataset. We
found that the decision tree built by C5.0 uses only gene M27891_at, which is the first gene in Cluster 4
found by ACA (see Table 2), to classify any samples. This gene is also ranked as the second by the t-
value. The decision tree achieves a classification accuracy of 94.1%. Next, we examined the decision tree
built using all the 7,129 genes in the leukemia dataset. We found that the decision tree built in this way
does not use gene M27891_at. It surprises us to notice that the decision tree built on top of all the genes
obtains a classification accuracy of 91.2%, which is lower than what it does if using the top gene
M27891_at selected by ACA.
Although we cannot comment on the biological impacts of gene M27891_at to leukemia at this moment,
the experimental results show that this gene is very useful in the classification of leukemia and the
usefulness of this gene cannot be identified if gene selection has not been done properly. As researchers
are devoting immense effort to identify genes that govern various diseases, the method we propose may
provide a new way of not only reducing the search dimensionality of gene expressions in analysis, but
also singling out potential candidates for the classification and identification of diseases.
6 Conclusions This paper presents a new method to group interdependent attributes into clusters by optimizing a
criterion function known as interdependence redundancy. It proposes a clustering algorithm known as k-
modes Attribute Clustering Algorithm (ACA). ACA adopts the idea of k-means clustering algorithm in
the entity space to cluster attributes in the attribute space by replacing 1) the concept of the “mean” in the
former by the “mode” and 2) the distance measure used in the former to the interdependence redundancy
measure between attributes. In order to have a meaningful evaluation of our methodology, we devise an

32
experimental evaluation scheme to provide a common base of performance assessment and comparison
with other methods. From the experiments on the two gene expression datasets colon-cancer and
leukemia, we find that our attribute clustering algorithm that maximizes intra-group interdependences and
the attribute selection method based on multiple attribute interdependence measure works well and yields
meaningful and useful results in terms of 1) finding good clustering configurations which contain
interdependence information within clusters and discriminative information for classification; 2) selecting
from each cluster significant genes with high multiple interdependence with other genes within each
cluster; and 3) yielding very high classification results on both of gene expression datasets using a small
pool of genes selected from the clusters found by ACA as the training set. When comparing the
experimental results of ACA with those of t-value, k-means algorithm, Kohonen’s SOM, biclustering
algorithm, MRMR algorithm, and RBF algorithm, we find that, by and large, ACA outperforms the others.
As shown by the surprising results in both the colon-cancer and the leukemia cases, ACA is able to select
very small subsets of genes (14 out of 2,000 in the former and 10 of 7,129 in the latter) to achieve very
high classification accuracy (91.9% in the former and 97.1% in the latter) much higher than when the
entire set of genes are used. This reveals that the good diagnostic information existing in a small set of
genes can be effectively selected by ACA for diagnostic purpose. We believe that this has a significant
implication to clinical, pharmaceutical, and bioengineering applications. Another very interesting finding
in our experiments for the leukemia dataset is that a specific gene(s) M27891_at selected as a top gene in
one of the clusters found by ACA when put onto C5.0 for classifying leukemia yields a very high average
classification rate of 94.1%. Such percentage is even higher than the 91.2% when C5.0 is applied to the
entire pool of 7,129 genes. However, the decision tree generated from the entire pool does not include
M27891_at. This convinces us that with our ACA, attribute clustering and selection of top genes from
each cluster based on MR are able to extract useful information from the gene expression data set for
classification and specific gene identification.
References [1] R. Agrawal, S. Ghost, T. Imielinski, B. Iyer, and A. Swami, “An Interval Classifier for Database Mining
Applications,” in Proc. of the 18th Int’l Conf. on Very Large Data Bases, Vancouver, British Columbia, Canada, 1992, pp. 560–573.
[2] R. Agrawal, T. Imielinski, and A. Swami, “Mining Association Rules between Sets of Items in Large Databases,” in Proc. of the ACM SIGMOD Int’l Conf. on Management of Data, Washington D.C., 1993, pp. 207–216.
[3] R. Agrawal and R. Srikant, “Fast Algorithms for Mining Association Rules,” in Proc. of the 20th Int’l Conf. on Very Large Data Bases, Santiago, Chile, 1994, pp. 487–499.
[4] U. Alon, N. Barkai, D. A. Notterman, K. Gish, S. Ybarra, D. Mack, and A. J. Levine, “Broad Patterns of Gene Expression Revealed by Clustering Analysis of Tumor and Normal Colon Tissues Probed by
33
Oligonucleotide Arrays,” Proc. of the National Academy of Sciences of the United States of America, vol. 96, no. 12, pp. 6745–6750, 1999.
[5] W.-H. Au and K. C. C. Chan, “Classification with Degree of Membership: A Fuzzy Approach,” in Proc. of the 1st IEEE Int’l Conf. on Data Mining, San Jose, CA, 2001, pp. 35–42.
[6] W.-H. Au and K. C. C. Chan, “Mining Fuzzy Association Rules in a Bank-Account Database,” IEEE Trans. on Fuzzy Systems, vol. 11, no. 2, pp. 238–248, 2003.
[7] W.-H. Au, K. C. C. Chan, and X. Yao, “A Novel Evolutionary Data Mining Algorithm with Applications to Churn Prediction,” IEEE Trans. on Evolutionary Computation, vol. 7, no. 6, pp. 532–545, 2003.
[8] A. Ben-Dor, L. Bruhn, N. Friedman, I. Nachman, M. Schummer, and Z. Yakhini, “Tissue Classification with Gene Expression Profiles,” in Proc. of the 4th Annual Int’l Conf. on Computational Molecular Biology, Tokyo, Japan, 2000.
[9] C. Bishop, Neural Networks for Pattern Recognition, New York, NY: Oxford Univ. Press, 1995. [10] K. C. C. Chan and W.-H. Au, “Mining Fuzzy Association Rules,” in Proc. of the 6th Int’l Conf. on
Information and Knowledge Management, Las Vegas, Nevada, 1997, pp. 209–215. [11] K. C. C. Chan and W.-H. Au, “Mining Fuzzy Association Rules in a Database Containing Relational and
Transactional Data,” in A. Kandel, M. Last, and H. Bunke (Eds.), Data Mining and Computational Intelligence, New York, NY: Physica-Verlag, 2001, pp. 95–114.
[12] K. C. C. Chan and A. K. C. Wong, “APACS: A System for the Automatic Analysis and Classification of Conceptual Patterns,” Computational Intelligence, vol. 6, no. 3, pp. 119–131, 1990.
[13] K. C. C. Chan and A. K. C. Wong, “A Statistical Technique for Extracting Classificatory Knowledge from Databases,” in [46], pp. 107–123.
[14] Y. Cheng and G. M. Church, “Biclustering of Expression Data,” in Proc. of the 8th Int’l Conf. on Intelligent Systems for Molecular Biology, San Diego, CA, 2000, pp. 93-103.
[15] D. K. Y. Chiu and A. K. C. Wong, “Multiple Pattern Associations for Interpreting Structural and Functional Characteristics of Biomolecules,” Information Sciences, vol. 167, pp. 23–39, 2004.
[16] M. Delgado, N. Márin, D. Sánchez, and M.-A. Vila, “Fuzzy Association Rules: General Model and Applications,” IEEE Trans. on Fuzzy Systems, vol. 11, no. 2, pp. 214–225, 2003.
[17] F. De Smet, J. Mathys, K. Marchal, G. Thijs, B. De Moor, and Y. Moreau, “Adaptive Quality-Based Clustering of Gene Expression Profiles,” Bioinformatics, vol. 18, no. 5, pp. 735–746, 2002.
[18] C. Ding and H. Peng, “Minimum Redundancy Feature Selection from Microarray Gene Expression Data,” in Proc. of the IEEE Computational Systems Bioinformatics Conf., Stanford, CA, 2003, pp. 523–528.
[19] E. Domany, “Cluster Analysis of Gene Expression Data,” Journal of Statistical Physics, vol. 110, pp. 1117–1139, 2003.
[20] S. Dudoit, J. Fridlyand, and T. P. Speed, “Comparison of Discrimination Methods for the Classification of Tumors Using Gene Expression Data,” Journal of the American Statistical Association, vol. 97, no. 457, pp. 77–87, 2002.
[21] M. B. Eisen, P. T. Spellman, P. O. Brown, and D. Botstein, “Cluster Analysis and Display of Genome-Wide Expression Patterns,” Proc. of the National Academy of Sciences of the United States of America, vol. 95, no. 25, pp. 14863–14868, 1998.
[22] U. M. Fayyad, G. Piatetsky-Shapiro, P. Smyth, and R. Uthurusamy (Eds.), Advances in Knowledge Discovery and Data Mining, Menlo Park, CA; Cambridge, MA: AAAI/MIT Press, 1996.
[23] N. Friedman, M. Nachman, and D. Pe’er, “Using Baysian Networks to Analyze Expression Data,” in Proc. of the 4th Annual Int’l Conf. on Computational Molecular Biology, Tokyo, Japan, 2000, pp. 127–135.
[24] T. R. Golub, D. K. Slonim, P. Tamayo, C. Huard, M. Gaasenbeek, J. P. Mesirov, H. Coller, M. L. Loh, J. R. Downing, M. A. Caligiuri, C. D. Bloomfield, and E. S. Lander, “Molecular Classification of Cancer: Class Discovery and Class Prediction by Gene Expression Monitoring,” Science, vol. 286, pp. 531–537, 1999.
34
[25] L. J. Heyer, S. Kruglyak, and S. Yooseph, “Exploring Expression Data: Identification and Analysis of Coexpressed Genes,” Genome Research, vol. 9, pp. 1106–1115, 1999.
[26] K. Hirota and W. Pedrycz, “Fuzzy Computing for Data Mining,” Proc. of the IEEE, vol. 87, no. 9, pp. 1575–1600, 1999.
[27] A. K. Jain, M. N. Murty, and P. J. Flynn, “Data Clustering: A Review,” ACM Computing Surveys, vol. 31, no. 3, pp. 264–323, 1999.
[28] C. Z. Janikow, “Fuzzy Decision Trees: Issues and Methods,” IEEE Trans. on Systems, Man, and Cybernetics – Part B: Cybernetics, vol. 28, no. 1, pp 1–14, 1998.
[29] D. Jiang, C. Tang, and A. Zhang, “Cluster Analysis for Gene Expression Data: A Survey,” IEEE Trans. on Knowledge and Data Engineering, vol. 16, no. 11, pp. 1370–1386, 2004.
[30] J. Kacprzyk and S. Zadrozny, “On Linguistic Approaches in Flexible Querying and Mining of Association Rules,” in H. L. Larsen, J. Kacprzyk, S. Zadrozny, T. Andreasen, and H. Christiansen (Eds.), Flexible Query Answering Systems: Recent Advances, Proc. of the 4th Int’l Conf. on Flexible Query Answering Systems, Heidelberg, Germany: Physica-Verlag, 2001, pp. 475–484.
[31] A. D. Keller, M. Schummer, L. Hood, and W. L. Ruzzo, “Bayesian Classification of DNA Array Expression Data,” Technical Report UW-CSE-2000-08-01, Department of Computer Science and Engineering, University of Washington, 2000.
[32] J. Khan, J. S. Wei, M. Ringner, L. H. Saal, M. Ladanyi, F. Westermann, F. Berthold, M. Schwab, C. R. Antonescu, C. Peterson, and P. S. Meltzer, “Classification and Diagnostic Prediction of Cancers Using Gene Expression Profiling and Artificial Neural Networks,” Nature Medicine, vol. 7, no. 6, pp. 673–679, 2001.
[33] T. Kohonen, Self-Organizing Maps, 3rd Ed., Berlin, Germany: Springer-Verlag, 2001. [34] J. Li and L. Wong, “Identifying Good Diagnostic Gene Groups from Gene Expression Profiles Using the
Concept of Emerging Patterns,” Bioinformatics, vol. 18, no. 5, pp. 725–734, 2002. [35] J. Li and L. Wong, “Identifying Good Diagnostic Gene Groups from Gene Expression Profiles Using the
Concept of Emerging Patterns (Corrigendum),” Bioinformatics, vol. 18, no. 10, pp. 1406–1407, 2002. [36] B. Liu, W. Hsu, and Y. Ma, “Integrating Classification and Association Rule Mining,” in Proc. of the 4th
Int’l Conf. on Knowledge Discovery and Data Mining, New York, NY, 1998, pp. 80–86. [37] L. Liu, A. K. C. Wong, and Y. Wang, “A Global Optimal Algorithm for Class-Dependent Discretization of
Continuous Data,” Intelligent Data Analysis, vol. 8, no. 2, pp. 151–170, 2004. [38] Y. Lu and J. Han, “Cancer Classification Using Gene Expression Data,” Information Systems, vol. 28, pp.
243–268, 2003. [39] D. J. C. MacKay, Information Theory, Inference, and Learning Algorithms, Cambridge, U.K.: Cambridge
University Press, 2003. [40] O. Maimon, A. Kandel, and M. Last, “Information-Theoretic Fuzzy Approach to Knowledge Discovery in
Databases,” in R. Roy, T. Furuhashi, and P. K. Chawdhry (Eds.), Advances in Soft Computing – Engineering Design and Manufacturing, London, U.K.: Springer-Verlag, 1999, pp. 315–326.
[41] J. B. McQueen, “Some Methods for Classification and Analysis of Multivariate Observations,” in Proc. of the 5th Berkeley Symp. on Mathematical Statistics and Probability, Berkeley, CA, 1967, pp. 281–297.
[42] S. C. Madeira and A. L. Oliveira, “Biclustering Algorithms for Biological Data Analysis: A Survey,” IEEE Trans. on Computational Biology and Bioinformatics, vol. 1, no. 1, pp. 24–45, 2004.
[43] S. N. Mukherjee, P. Sykacek, S. J. Roberts, and S. J. Gurr, “Gene Ranking Using Bootstrapped P-Values,” SIGKDD Explorations, vol. 5, no. 2, pp. 16–22, 2003.
[44] W. Pan, “A Comparative Review of Statistical Methods for Discovering Differentially Expressed Genes in Replicated Microarray Experiments,” Bioinformatics, vol. 18, pp. 546–554, 2002.
[45] J. S. Park, M.-S. Chen, and P. S. Yu, “An Efficient Hash-Based Algorithm for Mining Association Rules,” in Proc. of the ACM SIGMOD Int’l Conf. on Management of Data, San Jose, CA, 1995, pp. 175–186.
35
[46] G. Piatetsky-Shapiro and W. J. Frawley (Eds.), Knowledge Discovery in Databases, Menlo Park, CA; Cambridge, MA: AAAI/MIT Press, 1991.
[47] G. Piatetsky-Shapiro, T. Khabaza, and S. Ramaswamy, “Capturing Best Practice for Microarray Gene Expression Data Analysis,” in Proc. of the 9th ACM SIGKDD Int’l Conf. on Knowledge Discovery and Data Mining, Washington, DC, 2003, pp. 407–415.
[48] J. R. Quinlan, C4.5: Programs for Machine Learning, San Mateo, CA: Morgan Kaufmann, 1993. [49] Ralf-Herwig, A. J. Poustka, C. Müller, C. Bull, H. Lehrach, and J. O’Brien, “Large-Scale Clustering of
cDNA-Fingerprinting Data,” Genome Research, vol. 9, pp. 1093–1105, 1999. [50] A. Savasere, E. Omiecinski, and S. Navathe, “An Efficient Algorithm for Mining Association Rules in Large
Databases,” in Proc. of the 21st Int’l Conf. on Very Large Data Bases, Zurich, Switzerland, 1995, pp. 432–444.
[51] R. Simon, “Supervised Analysis When the Number of Candidate Features (p) Greatly Exceeds the Number of Cases (n),” SIGKDD Explorations, vol. 5, no. 2, pp. 31–36, 2003.
[52] P. Smyth and R. M. Goodman, “An Information Theoretic Approach to Rule Induction from Databases,” IEEE Trans. on Knowledge and Data Engineering, vol. 4, no. 4, pp. 301–316, 1992.
[53] R. Srikant and R. Agrawal, “Mining Quantitative Association Rules in Large Relational Tables,” in Proc. of the ACM SIGMOD Int’l Conf. on Management of Data, Montreal, Canada, 1996, pp. 1–12.
[54] P. Tamayo, D. Solni, J. Mesirov, Q. Zhu, S. Kitareewan, E. Dmitrovsky, E. S. Lander, and T. R. Golub, “Interpreting Patterns of Gene Expression with Self-Organizing Maps: Methods and Application to Hematopoietic Differentiation,” Proc. of the National Academy of Sciences of the United States of America, vol. 96, no. 6, pp. 2907–2912, 1999.
[55] C. C. Wang and A. K. C. Wong, “Classification of Discrete-Valued Data with Feature Space Transformation,” IEEE Trans. on Automatic Control, vol. AC-24, no. 3, pp. 434–437, 1979.
[56] A. K. C. Wong and T. S. Liu, “Typicality, Diversity and Feature Patterns of an Ensemble,” IEEE Trans. on Computers, vol. C24, no. 2, pp. 158–181, 1975.
[57] A. K. C. Wong, T. S. Liu, and C. C. Wang, “Statistical Analysis of Residue Variability in Cytochrome C,” Journal of Molecular Biology, vol. 102, pp. 287–295, 1976.
[58] A. K. C. Wong and Y. Wang, “High-Order Pattern Discovery from Discrete-Valued Data,” IEEE Trans. on Knowledge and Data Engineering, vol. 9, no. 6, pp. 877–893, 1997.
[59] A. K. C. Wong and Y. Wang, “Pattern Discovery: A Data Driven Approach to Decision Support,” IEEE Trans. on Systems, Man, and Cybernetics – Part C: Applications and Reviews, vol. 33, no. 1, pp. 114–124, 2003.
[60] E. P. Xing, M. I. Jordan, and R. M. Karp, “Feature Selection for High-Dimensional Genomic Microarray Data,” in Proc. of the 18th Int’l Conf. on Machine Learning, Williamstown, MA, 2001, pp. 601–608.
[61] R. R. Yager, “On Linguistic Summaries of Data,” in [46], pp. 347–363. [62] L. Yu and H. Liu, “Redundancy Based Feature Selection for Microarray Data,” in Proc. of the 10th ACM
SIGKDD Int’l Conf. on Knowledge Discovery and Data Mining, Seattle, Washington, 2004, pp. 737–742. [63] H. Zhang, C. Y. Yu, B. Singer, and M. Xiong, “Recursive Partitioning for Tumor Classification with Gene
Expression Microarray Data,” Proc. of the National Academy of Sciences of the United States of America, vol. 98, no. 12, pp. 6730–6735, 2001.

36
Wai-Ho Au (M’03) received the B.A. degree (with first class honors) in
computing studies and the M.Phil. degree in computing from The Hong
Kong Polytechnic University (PolyU), Hong Kong in 1995 and 1998,
respectively. He is currently working toward the Ph.D. degree in computing
at PolyU.
Prior to joining PolyU, he worked for several software developers for a
number of years. He was in charge of several large-scale software
development projects, including a system integration project for an
international airport, a data warehouse system for a utility company, a smart
home system for a high-tech start-up, a local positioning system, and a face biometrics security system.
He is now a Manager of software development in the Department of Computing at PolyU. His research
interests include data mining, bioinformatics, fuzzy computing, and evolutionary computation.
Keith C. C. Chan received the B.Math. degree in Computer Science and
Statistics, and the M.A.Sc. and Ph.D. degrees in Systems Design
Engineering from the University of Waterloo, Waterloo, Ontario, Canada.
He had worked for a number of years at the IBM Canada Laboratory,
Toronto Ontario, where he was involved in the development of software
engineering tools. In 1993, he joined the Department of Electrical and
Computer Engineering, Ryerson University, Toronto, Ontario, Canada, as
an Associate Professor and in 1994, he joined the Department of
Computing of The Hong Kong Polytechnic University, Hong Kong where he is now Professor and Head.
He is also an Adjunct Professor of the Institute of Software, The Chinese Academy of Sciences, Beijing,
China. He is active in consultancy and has served as a consultant to government agencies and various
companies in Hong Kong, China, Singapore, Malaysia and Canada. His research interests are in data
mining, bioinformatics and software engineering.
37
Andrew K. C. Wong (M’79, SM’01, F’04) received B.Sc (Hons) and
M.Sc degrees from Hong Kong University, Hong Kong and Ph.D. degree
from Carnegie Mellon University (CMU), Pittsburgh, PA, in 1958, 1960
and 1968 respectively. After that he taught at CMU for several years. From
1980 to 2002, he was a Professor of Systems Design Engineering and the
Director of PAMI Laboratory at the University of Waterloo (UW),
Waterloo, Ontario, Canada. From 2000 to 2003, he served as a
Distinguished Chair Professor of Computing Department at Hong Kong
Polytechnic University, Hong Kong. In 2002, he was awarded a
Distinguished Professor Emeritus at UW. Since then he served at UW as an
Adjunct Professor in Systems Design Engineering, Electrical and Computer Engineering and the School
of Computer Sciences. He has published extensively and has been invited as keynote/plenary speaker for
the IEEE International Conferences and IEEE related Conferences and has been in the IEEE
Distinguished Speaker Program.
He served as the General Chair of ISTED Conference of Robotics and Control at Hawaii in 1996 and
General Chair of IEEE/RSJ International Intelligence Robotic Systems (IROS) Conference at Victoria,
British Columbia, Canada in 1998.
Yang Wang (M'00) received the B. Eng. degree (1989) in Electronic
Engineering, and the M. Eng. degree (1991) in Systems Engineering,
from Tsinghua University, Beijing, China. He received his Ph.D.
degree in Systems Design Engineering from the University of Waterloo,
Ontario, Canada in 1997.
Upon his graduation from the University of Waterloo, Dr. Wang
co-founded Pattern Discovery Software Systems Ltd., a software
company specialized in data mining solutions based on Waterloo, ON,
Canada. He has been the CTO of the company since 1997, responsible
for the R&D activities within and in collaboration with other institutes.
His current research interests include exploratory data mining,
intelligent data analysis, knowledge discovery for complex systems and their applications. He is an
adjunct professor of Systems Design Engineering at the University of Waterloo, where he co-supervises
graduate students and conducts academic research.
Dr. Wang is a member of IEEE Computer Society and ACM.
Related Documents