ESPON 2013 i ATTREG The Attractiveness of European regions and cities for residents and visitors Applied Research 2013/1/7 Scientific Report | Version 31 December 2011

Welcome message from author
This document is posted to help you gain knowledge. Please leave a comment to let me know what you think about it! Share it to your friends and learn new things together.
Transcript

ESPON 2013 i
ATTREG The Attractiveness of European regions
and cities for residents and visitors
Applied Research 2013/1/7
Scientific Report | Version 31 December 2011

ESPON 2013 ii
This report presents the final results of an Applied Research Project conducted within the framework of the ESPON 2013 Programme, partly financed by the European Regional Development Fund.
The partnership behind the ESPON Programme consists of the EU Commission and the Member States of the EU27, plus Iceland, Liechtenstein, Norway and Switzerland. Each partner is represented in the ESPON Monitoring Committee.
This report does not necessarily reflect the opinion of the members of the Monitoring Committee.
Information on the ESPON Programme and projects can be found on www.espon.eu
The web site provides the possibility to download and examine the most recent documents produced by finalised and ongoing ESPON projects.
This basic report exists only in an electronic version.
© ESPON & University Rovira i Virgili, 2011.
Printing, reproduction or quotation is authorised provided the source is acknowledged and a copy is forwarded to the ESPON Coordination Unit in Luxembourg.

ESPON 2013 i
Editors
Samo Drobne, University of Ljubljana
Antonio Russo, Rovira i Virgili University
Authors
Authors of each individual chapter are indicated below the chapter title. Contributors by the other team-members in the ATTREG project partner organisations are:
Yolanda Pérez, Salvador Anton, Joan Alberich (Rovira i Virgili University, LP), Leo van den Berg, Erwin Van Tuijl (EURICUR, PP2), Jan van der Borg, Anthony La Salandra, Nicola Camatti, Luca Salmasi (Ca´ Foscari University of Venice, PP3), Henrique Albergaria, Carla Teotónio (University of Coimbra, PP5), Jie Zhang, Anders Hedetoft, Jeppe Madsen, Irena Stefaniak (Center For Regional and Tourism Research, PP6), Mariusz Kowalski, Tomasz Komornicki, Jerzy Solon (IGSO, PP7), Marija Bogataj, Alma Zavodnik, Samo Drobne (University of Ljubljana, PP8), Gülden Demet Oruç, Ferhan Gezici, Ebru Kerimoğlu (Istanbul Technical University, subcontractor of LP).
Cartographic production by:
Anton Magarolas and Jordi Andreu (University Rovira i Virgili)
Tarragona, Spain, 31 December 2011

ESPON 2013 ii
Table of contents
PREFACE ......................................................................................................................... 1
1 ATTRACTIVENESS IS THE EU POLICY DEBATE AND A RESEARCH FIELD FOR TERRITORIAL
COHESION ........................................................................................................ 2
1.1 Introduction .................................................................................................................... 2 1.2 The territorial focus in EU policy: a brief overview ......................................................... 2 1.3 The Quality of Places and the New Cultural-Economic Paradigm .................................. 5 1.4 Milieu, Territorial Capital and Mobilization of Assets ..................................................... 9 1.5 Attracting whom? Mobilities and migrations in the global age .................................... 10 1.6 Research into territorial attractiveness ........................................................................ 14
2 METHODOLOGICAL FRAMEWORK ........................................................................... 18
2.1 Research questions ....................................................................................................... 18 2.2 Methods and research structure................................................................................... 19
3 POPULATION FLOWS ............................................................................................... 24
3.1 Methodology and data cover ........................................................................................ 24 3.2 People movement across Europe ................................................................................. 33 3.3 Regional typologies of people movements ................................................................... 39 3.4 Policy insights from regional typologies of mobility ..................................................... 44 3.5 Cross-typological analysis .............................................................................................. 47
4 TERRITORIAL CAPITAL.............................................................................................. 50
4.1 Methodology and data cover ........................................................................................ 50 4.2 Endowments and spatial distribution of territorial capital assets ................................ 53 4.3 Regional typologies of territorial assets ........................................................................ 59
5 PATTERNS OF ATTRACTIVENESS OF TERRITORIAL CAPITAL ....................................... 62
5.1 Methodology ................................................................................................................. 62 5.2 The attractiveness of territorial capital ......................................................................... 62 5.3 Discussion of outliers .................................................................................................... 69
6 THE MOBILISATION PROCESS .................................................................................. 72
6.1 Objectives and methodology ........................................................................................ 72 6.2 Characterisation of the case studies ............................................................................. 73 6.3 Territorial capital and regional attractiveness .............................................................. 78 6.4 The mobilisation of regional attractiveness .................................................................. 82
7 ATTRACTIVENESS AS A POLICY DIMENSION ............................................................. 87
7.1 Policy framework........................................................................................................... 87 7.1.1 The policy concept of attractiveness ..................................................................... 88 7.1.2 Mobilization processes .......................................................................................... 89 7.1.3 The EU (policy) dimension ..................................................................................... 91 7.1.4 Policy orientation .................................................................................................. 92
7.2 Policy bundles and the attractiveness of EU regions .................................................... 93

ESPON 2013 iii
7.2.1 Normative policy discourses .................................................................................. 95 7.2.2 The “ATTREG-future” model ................................................................................. 97
7.3 Scenario projections and policy interpretation ............................................................. 99 7.3.1 Inclusive Scenario – Convergence Regions ............................................................ 99 7.3.2 Smart Scenario – Convergence Regions .............................................................. 100 7.3.3 Sustainable Scenario – Convergence Regions ..................................................... 101 7.3.4 Inclusive Scenario – Overheating Regions ........................................................... 101 7.3.5 Smart Scenario – Overheating Regions ............................................................... 101 7.3.6 Sustainable Scenario – Overheating Regions ...................................................... 102 7.3.7 General comments on the policy-bundles scenario ............................................ 102
7.4 General conclusions .................................................................................................... 103
8 THE ATTREG FUTURE MODEL: DOCUMENTATION AND APPLICATIONS ................... 106
8.1 Introduction ................................................................................................................ 106 8.2 Scenarios on attractions and mobility......................................................................... 108 8.3 Interregional demographic models and scenarios ...................................................... 111
8.3.1 Migration and population – model based scenario analysis with no links between territorial capital and outcomes - The DEMIFER-project .................................... 112
8.3.2 Reference and Policy Scenario assumption in MULTIPOLES ............................... 112 8.3.3 The demographic model MULTIPOLES ................................................................ 113 8.3.4 Reference and policy scenarios and the demographic model MULTIPOLES ....... 114 8.3.5 Scenarios for migration flows and the demographic model MULTIPOLES ......... 115 8.3.6 Development/Policy experiments with MULTIPOLES within the DEMIFER-
scenarios (Impact assessment) ............................................................................ 116 8.3.7 What can be learned from the DEMIFER MULTIPOLES model project – decision to
be taken by the ATTREG-project? ....................................................................... 116 8.4 Migration and population. Model based scenario analysis with links between
territorial attractiveness and mobility flows: The ATTREG-future model ................... 117 8.4.1 The ATTREG-future model – a graphical presentation ........................................ 117 8.4.2 Attractions and mobility flows in the ATTREG-future model .............................. 120 8.4.3 Economic crisis and attractions and mobility flows in the ATTREG-future model
............................................................................................................................. 128 8.4.4 Results: Technical description ............................................................................. 130
REFERENCES ................................................................................................................. 142

ESPON 2013 iv
Figures
Figure 1.1: Visitor-resident externalities ......................................................................................... 15
Figure 1.2: Process aspects linking territorial capital to its users ................................................... 16
Figure 2.1: ATTREG Workflow chart: organisation of and relation between various research activities .......................................................................................................................................... 20
Figure 2.2: Conceptual model relating mobility to endowment factors and change ..................... 22
Figure 3.1: Cross plot of the average annual number of internal migrants against the average net migration flows into the region....................................................................................................... 27
Figure 3.2: Tourism penetration index from ESPON 1.4.5. ............................................................. 29
Figure 3.3 a-b: Net migration flows (a) and rates (b) highlighting values in capital city regions .... 34
Figure 3.4: Clustered values of net migration rate, 2001-07 (Local Moran’s I) .............................. 37
Figure 3.5: Clustered values of visitor arrivals p. head of population, 2001-07 (Local Moran’s I) . 38
Figure 3.6a-b: Box plots of net migration (a) and visitor arrival rates (b) by typology cluster ....... 40
Figure 3.7a-b: Box plots of net migration rates by younger (a) and older (a) adults by cluster ..... 44
Figure 3.8: Regional typology by mobilities attracted. Position of the four clusters ...................... 45
Figure 3.9: Mobility clusters and regional strategies ...................................................................... 46
Figure 4.1: Scatterplot of highly educated workforce and creative class ....................................... 55
Figure 5.1: Territorial capital endowment by migration/visiting cluster type ................................ 69
Figure 6.1: Territorial capital endowments in the eight case study regions ................................... 76
Figure 7.1: Determination of attractiveness (left) and of attraction (right). .................................. 89
Figure 7.2: Synchronic (left) and diachronic (right) dimension of mobilisation processes. ............ 90
Figure 7.3: Policy orientation of mobilisation strategies ................................................................ 92
Figure 7.4: Methodological framework ........................................................................................... 95
Figure 8.1: Logical structure of the ATTREG model ...................................................................... 109
Figure 8.2: The structure of the ATTREG-future model – a graphical overview ........................... 118
Figure 8.3: The structure of the ATTREG-future model – a graphical overview (2) ...................... 129
Figure 8.5: Attraction variables in the ATTREG-future model – a graphical overview of the full model ............................................................................................................................................ 134
ESPON 2013 v
Tables
Table 3.1: Migration flow rates by size of geographic unit ............................................................ 25
Table 3.2: Stated reasons for migration amongst respondents from European Labour Force Survey, 2008 (ad hoc module)....................................................................................... 26
Table 3.3: Short list of indicators of mobility with specifications .................................................. 32
Table 3.4: Labour market characteristics by cluster group for migration-visiting typology .......... 41
Table 3.5: Economic change by cluster group for the migration-visiting typology ....................... 41
Table 3.6: Aggregate place-based tourism characteristics by cluster group for migration-visiting typology ........................................................................................... 42
Table 3.7: Interaction of foreign-born population and rates of mobility ...................................... 47
Table 3.8: Interaction of migration origins and rates of mobility .................................................. 48
Table 3.9: Interaction of age-related migration typology and mountainous regions ................... 48
Table 3.10: Interaction of age-related migration typology and capital city-region typology .......... 49
Table 4.1: Interaction of age-related migration typology and capital city-region typology .......... 51
Table 4.2: Short list of indicators of territorial capital with specifications .................................... 52
Table 4.3: Final cluster centres from 5-means clustering procedure of values of synthetic indicators of territorial capital ...................................................................................... 59
Table 4.4: Characteristics of five classes of regional typology by territorial capital endowments ................................................................................................................. 60
Table 5.1: Significance of statistical relationships between net migration flows and territorial assets ............................................................................................................................. 64
Table 5.2: Significance of statistical relationships between net migration flows by age group and territorial assets ..................................................................................................... 65
Table 5.3: Significance of statistical relationships between visitor arrivals and territorial assets 67
Table 6.1: Case study regions as ATTREG typologies ..................................................................... 75
Table 7.1: Policy bundles in the ATTREG Future model ................................................................. 98
Table 8.1: The four DEMIFER scenarios based on the dimensions “economy-environment” and “distribution-fairness” .......................................................................................... 113
Table 8.2: Regression statistics by audience in the reduced regression model for territorial attractiveness and mobility flows for the ATTREG-future model ............................... 121
Table 8.3: Assumption for changes in attraction variables in the 3 scenarios (inclusive, sustainable and smart) for impacts assessment with the ATTREG-future model ...... 130
Table A.8.1: Impacts of 3 attraction policy scenarios for the region ATT11 Vienna ..................... 140
Table A.8.2: Impacts of 3 attraction policy scenarios for the region BG31 Severozapaden ......... 141

ESPON 2013 vi
Annexes
Annex 1: List of indicators and missing data
Annex 2: Complete collection of European maps
Annex 3: List of publications resulting from the implementation of the ATTREG project
Annex 4: Complete collection of ATTREG case study reports
4.1 Case study of Algarve
4.2 Case study of Bornholm
4.3 Case study of Cornwall and the Isles of Scilly
4.4 Case study of Istanbul
4.5 Case study of the Euro-metropole Lille-Kortrijk-Tournai
4.6 Case study of Lubelskie
4.7 Case study of Slovenia
4.8 Case study of Trento

ESPON 2013 1
PREFACE
This Scientific Report of the ATTREG project provides the details and documentation on the research steps, methods and results that have been illustrated in a more divulgative form in the Draft Final Report.
The various chapters correspond roughly to the different “blocks” of research conducted in ATTREG. Each chapter reports the list of authors under the title, but a more comprehensive list of collaborators and contributors is listed at page i.
Chapter 1 sets the main concepts and reviews the relevant literature for this project, establishing a link with the current EU policy debate on attractiveness and identifying ambiguities and knowledge gaps that this project intends to address. Chapter 2 establishes a definition and methodological framework for the whole project, presenting the structure of the research steps to follow.
Chapters 3 to 5 all refer to the general geo-statistical analysis of the European territory which lays the bases for the exploration of policy issues. Namely they address the flows of people mobilised, or “output” factors in our framework and the typologies derived from their measurement and mapping, the “input” explanatory variables in terms of territorial capital assets, and the characteristics, operations and results of the statistical model that relates inputs and outcomes.
Chapter 6 present the case study research that was used both to validate and integrate statistical analysis, and to explore scale issues, geographical specificities and process aspects in the mobilisation of territorial capital in eight “exemplary” regions of Europe.
Chapter 7 introduces a framework for the analysis of European policy in the context of this study, presenting the discursive foundations of “policy bundles” relating to overarching territorial cohesion objectives and the results of the application of these bundles in terms of changes over a baseline scenario of territorial development in the year 2025.
Chapter 8 present the background, assumptions, technical specifications and, as an appendix, the detailed statistical results of the scenario model.
The main text of this report is concluded by an extensive reference list.
The Scientific Report comes together with a number of annexes, as requested by the project specs, which are (1) a detailed list of indicators and typologies developed in this project with key metadata information and geographical cover, (2) the whole list of 75 European maps produced and cited in the text, and (3) a list of publications in academic journals and as conference papers produced from this project to this date. Finally, Annex 4 includes the complete collection of full case study reports from the ATTREG project.
Throughout the main text, the diagrams, schemes and maps quoted as “Figures” are included in the text, whereas the European maps formatted according to the ESPON template are referred and numbered as “Maps” and included in consecutive order in Annex 2.
Antonio Paolo Russo, Lead Partner of the ATTREG project
Tarragona, 31 December 2011

ESPON 2013 2
1 ATTRACTIVENESS IS THE EU POLICY DEBATE AND A RESEARCH FIELD FOR TERRITORIAL COHESION
Rob Atkinson and Antonio Russo
1.1 Introduction
The concept of attractiveness refers to how a place is perceived and what types of assets it has to offer to (different types of) residents and visitors. The growing importance of these issues has coincided with an increasing emphasis on spatial issues, in particular concerning European development policy. Over the last two decades, an emerging message in the EU policy debate has been that territory matters (ESPON, 2006b). Yet the extent to which this has actually been absorbed into and structured sectorial policies is debatable.
In this introductory Chapter of the ATTREG Scientific Report, we first of all briefly outline some of the key issues related to understandings of mobility, attractiveness and the development of a spatial dimension in EU, its relationship to the concept of attractiveness and the associated policy implications.
Following this, we present the most interesting insights from various literature fields regarding the notions of territorial capital and mobility. We then use these concepts in the last section to introduce our notion of attractiveness, as constituted through the interaction of a complex set of characteristics based on the presence (or absence) of certain forms of territorial capital (assets or endowments as we have termed them); the relative balance of factors that attract varies depending on the groups that are the object of attraction strategies (high skilled workers, second home owners, tourists, etc).
From this perspective on regional development it is important to identify the roles of environmental, physical and social attributes in reinforcing (or diminishing) the attractiveness of regions for each group. Our discussion of the nature of the relationships between bundles of place-based assets and their influence on the location decisions of the particular communities of interest/stakeholders suggests that three main variables should be taken into account: the different factors that constitute attractiveness, the categories of citizens related to them, and the different scales at which they are considered. For instance, depending on which particular categories of citizens are the focus of interest or the particular scale at which the analysis is conducted will produce different results both in terms of our understanding of how attractiveness functions vis-à-vis a particular group(s) or with reference to the attractiveness of a given territory (e.g. neighbourhood as against city-region).
1.2 The territorial focus in EU policy: a brief overview
Across European there has been an increasing interest in mobility and this needs to be situated in a wider policy context where the primary concern is with achieving “territorial balance and harmonious development” and territorial (and social) cohesion across the European space (see CEC 2001, 2004b, 2008; ESDP, 1999). Yet it is important to bear in mind that the underlying aim is always to improve Europe’s competitiveness. For instance the Green Paper on Territorial Cohesion argues:
Increasingly, competitiveness and prosperity depend on the capacity of the people and businesses located there to make the best use of all of territorial assets. In a globalizing and interrelated world economy, however, competitiveness also depends on building links with

ESPON 2013 3
other territories to ensure that common assets are used in a coordinated and sustainable way. Cooperation along with the flow of technology and ideas as well as goods, services and capital is becoming an ever more vital aspect of territorial development and a key factor underpinning the long-term and sustainable growth performance of the EU as a whole. (CEC, 2008: 3)
Such an approach underlies Europe 2020 (CEC, 2010a) where the emphasis on achieving smart, sustainable and inclusive growth is framed by the need to regain competitiveness or suffer continued relative decline (p. 8-9).
This territorial focus has only gradually emerged in the post 2000 period; for instance neither the Lisbon nor Göteborg Strategies made explicit mention of this issue; nor were the spatial impacts across the European space considered, this only gradually emerged in subsequent years. In order to illustrate these developments we draw on a number of key Commission reports on economic and social cohesion, and associated documents.
The ESDP (1999) signalled the beginning of an acknowledgement that the economic and social dimensions had spatial/territorial impacts which policy needed to take into account. Here we see a line of argumentation that policy, at European, national, regional and local levels, could be developed and applied in an integrated and targeted manner to address regional disparities/imbalances. Following on from this the Second and Third Reports on Economic and Social Cohesion (CEC 2001 and 2004b) contained a more explicit focus on such issues particularly in the context of the accession of a new group of member states. The Third Report stated:
In policy terms, the objective is to help achieve a more balanced development by reducing existing disparities, avoiding territorial imbalances and by making both sectorial policies which have a spatial impact and regional policy more coherent. (CEC 2004b, p. 27)
The focus was on territorial imbalances ‘…that threaten the harmonious development of the Union economy in future years.’ (ibid, p. 27). At this point mobility was primarily understood as taking place at a European level into the Pentagon from elsewhere in Europe and within countries to capital cities and growing cities producing a range of territorial imbalances at different spatial scales. The Report justified these concerns in the following terms: ‘These territorial disparities cannot be ignored, since…they affect the overall competitiveness of the EU economy.’ (ibid, p. 28). The answer proposed was a more ‘balanced development’ that would reduce the disparities. Such arguments were also related to a more general recognition of the role of cities and regions in relation to territorial cohesion and addressing territorial disparities began to emerge in EU policy documents around the same time (c.f. CEC 2004b and 2005). Cities were now viewed as the ‘engines of regional development’ and attractiveness, and by extension mobility, was understood partly in terms of accessibility but also through notions terms related to quality of life and the role of culture as a ‘…”soft” locational factor in attracting knowledge workers.’ (CEC 2005, p. 12).
The Fourth Report on Economic and Social Cohesion (CEC, 2007) views attractiveness and mobility as factors to be addressed because they have impacts on cohesion. However, the forces driving mobility were still understood in mainly economic terms; the following captures this: ‘Economic factors in the form of differences in income levels and employment tend to be the main factors inducing people to move between regions.’ (CEC 2007, p. 44). This applied particularly to capital cities, in all regions, which were attracting population from within their own countries and other countries. Attractiveness was determined by ‘good basic infrastructure and accessibility; a well-educated work force; good ICT infrastructure and extensive use of ICT; a relatively high level of spending on R&D’ (ibid, p74). Again the report pointed to the significance of other non-economic factors arguing that ‘…the quality of life and the attractiveness of the environment, seem to have an increasing effect….’ (ibid, p. 46); related to this were levels of
ESPON 2013 4
health provision and effective institutions (what might be termed “good governance”). Here we see the beginnings of the development of a more complex notion of attractiveness and mobility (and of the reasons for mobility).
The Green Paper on Territorial Cohesion (CEC 2008 – subtitled ‘Turning territorial diversity into strength’) emphasises Europe’s rich territorial diversity and the need to draw on this to increase cohesion and growth. Key to this paper is the argument that:
Territorial cohesion is about ensuring the harmonious development of all these places and about making sure that their citizens are able to make the most of inherent features of these territories. As such, it is a means of transforming diversity into an asset that contributes to sustainable development of the entire EU. (ibid, p4)
The Green Paper represents a significant step in the development of an approach that brings together the territorial, social and economic dimensions, recognising that they cannot be considered isolation and that as a result policies must be developed in an integrated manner and directed at ‘meaningful places of intervention’ (i.e. not limited by administrative boundaries/borders) (see Barca, 2009, p. 93). This approach assumes that only by focusing on the (many) endogenous strengths of places can more harmonious development can be achieved. Following this line of thinking the Fifth Report (CEC, 2010b) argues:
…the regional diversity in the EU, where regions have vastly different characteristics, opportunities and needs, requires going beyond ‘one-size-fits-all’ policies towards an approach that gives regions the ability to design and the means to deliver policies that meet their needs. This is what Cohesion Policy provides through its place-based approach. (p. 13)
The place-based approach has emerged as a mode of action that seeks to support a more long-term, sustainable, development processes, based on the (endogenous) development of territorial assets. As part of this the conception of the dynamics driving population mobility has shifted from one based on an assumption that population movements are determined mainly by economic forces towards one that includes a notion of the ‘search for quality’ thereby pointing to the significance of the variety of factors we have included in our categories that constitute territorial capital. For instance in relation to mobility based around jobs the Second State of European Cities Report (RWI, 2010) argues:
Since it can be expected that labour-oriented migration will continue to focus on large cities, smaller cities may find it increasingly difficult to compete for mobile workers. However, combination of a good quality public (e.g. health care, education, culture) infrastructure, good accessibility, a certain degree of economic specialisation and affordable high-quality housing may prove to be a considerable advantage of smaller cities in competition with the large agglomerations and serve to prevent income disparity and poverty. (p. 17)
The last enlargement of the EU and the subsequent negative macroeconomic trends affecting most new Member States created new and significant social, economic and spatial challenges for several strategic policy sectors, providing a highly challenging context for the territorial cohesion objective of the EU. Partly for this reason, whilst the pursuit of territorial cohesion and balanced and/or sustainable development continues to be central to the EU policy agenda, the period from the turn of the millennium has been characterised by an emphasis on “regional competitiveness and employment”, as the Sapir Report (Sapir et al, 2003) clearly demonstrated in 2003. Nevertheless, the aim of transforming Europe into the most competitive and dynamic knowledge-based economy in the World by 2010 has been combined with a clear commitment to sustainable development and territorial cohesion.
The continuing emphasis on “balanced and sustainable competitiveness”, in relation to cohesion, can be seen as the other face of the political message. It is echoed in all the latest territorial reference documents developed at the EU level; for example the Territorial Agenda and its

ESPON 2013 5
“integrated urban development” complement (the Leipzig Charter) both focus on the “global competitiveness and sustainability” of European cities and regions. The concept of attractiveness must be seen in terms of its relationship with these main aims of the EU.
However, if we take a closer look at the concept of cohesion as contained in policy documents and articulated in its three main connotations (social, economic and territorial cohesion) important differences emerge with regard to the implications of the concept of attractiveness of cities and regions. Different overarching narratives and their associated macro policy approaches have spawned a range of policy discourses, e.g. the differential emphasis accorded to competitiveness, equity and balance and the spatial and area-based orientation (ESPON, 2006a and 2006b). Depending on the reference point the meaning of “spatial attractiveness” changes considerably. Each of these aims can highlight different facets of the role of territories, and more specifically, the way their attractiveness is conceived and the resulting policy approaches.
Different “discourses” have been stressed by different EU policy orientations, leading to different strategic policy options depending upon the particular objectives assigned to cities and regions. Here, several variables may influence the concept of attractiveness of places and its political applicability. First, the role of spatial elements is critical, as for instance is shown in the contrast between cities as engines of growth (e.g. CEC, 2005) and cities as places where the strongest opportunities and the greatest disparities co-exist, where in the first case a strong emphasis in on the role of economic driving forces while in second case concerted efforts should be made to address social exclusion and create sustainable communities (UK Presidency, 2005).
More specifically with regard to the elements that define the concept of attractiveness, a second point can be highlighted. An example of this is the role of SG(E)I (services of general [economic] interest), the subject of a Commission White Paper, CEC 2004a) which lie at the heart of the social cohesion policy and of the EU welfare system and are closely related to the concept of attractiveness, particularly for local needs. From this perspective, attractiveness can be conceived as the presence of services, either for residents (e.g. focus on social cohesion), or for specific types of enterprises, as competitive localisation factors (e.g. focus on economic growth). At the same time, it can lead to a stronger emphasis on the role of culture and knowledge (e.g. as in the work of Richard Florida, 2002 and 2008), where a wider range of possible approaches implies various policy options.
From a general perspective, those approaches are not always compatible. Policies for transport and infrastructure, for instance, make some regions more accessible than others, but sometimes less “attractive” in terms of the quality of their landscape and environment, producing ambiguous effects locally; agricultural policies may be relevant to maintaining the attractiveness of rural areas; urban and cultural programmes enhance the attractiveness of regions for existing residents (and possibly new ones) but also for tourists, which may produce adverse effects for the quality of life of citizens.
What this discussion highlights is the complexity and variable meanings associated with attractiveness in the policy discourses of the EU. In the following section we turn our attention directly to the concept of attractiveness and investigate its, variable, geometry and implications.
1.3 The Quality of Places and the New Cultural-Economic Paradigm
The previous section illustrates the use of “attractiveness” in EU policy documents and statements, revealing that it remains an ambiguous and multifaceted concept, without a generally accepted definition. Moreover, while European and local policymakers have enthusiastically, and somewhat simplistically, embraced the concept, many scholars are less enthusiastic about it. In part this is due to its association with aesthetics: if attractiveness is

ESPON 2013 6
considered as a matter of design, it is by definition a subjective notion1. Petersen (2004) argues that the term “attractiveness” is subjective and the ranking of cities according to their attractiveness is thus highly vulnerable to manipulation. Therefore, it is more common among scholars to define attractiveness as the ability to attract. The question is: to attract what or whom?
Given these problems with the concept in this section we seek to establish a “generic” notion of attractiveness that captures its key elements and how it impacts (positively and negatively) on places and will allow us to bring out its policy implications. Thus we explore it from two main points of view:
First we discuss the “ability to attract” as depending on the quality of the environment and its implications for living, business and visitors. Cities and regions can be considered attractive if they have sufficient urban amenities to offset agglomeration disadvantages such as high housing and land prices (Glaeser et al, 2001; Glaeser and Gottlieb, 2006). The quality of place, however, is far from being an easy notion to quantify, since several aspects can contribute to its perception.
Over the last decade or so the notion of quality of place has taken on an increasing importance in the debates surrounding urban and regional competitiveness. These debates have drawn on a wide ranging literature developed since the 1960s, focusing on aspects of quality of life (a concept defined in various ways), and referring to the level of urban amenities and other characteristics. Since the 1970s these studies have paid increasing attention to “soft,” subjective measures (Pacione, 1982), frequently associated with economic competition (Trip, 2007). However, most attention has been given to their impact on economic development (e.g. how they affect the locational decisions of firms), rather than people (e.g., Festervand et al., 1988; Rogerson, 1999; McCann, 2004). By contrast, for instance Foster (1977) emphasized the importance of investments in social infrastructure for people rather than only for firms, while others (Clark et al., 2002; Dziembowska-Kowalska & Funck, 2000) highlighted the importance of public and lifestyle amenities in cities to attract talented high-tech staff, and Portney (2003) related the level of environmental quality that individuals experience to a city’s economic growth.
The discourse has progressively shifted from “quality of the economic environment” to “quality of places”, bringing to the fore the spatial specificities of place, in particular related to the urban context. Symmetrically, the issue of assessing empirically the attractiveness of regions has been addressed in two ways: either through the measurement of what are believed to be the most important aspects of a region’s factor endowments, or through an evaluation of the outcome of these endowments in terms of actual economic performance. Most studies, however, regardless of whether they see regional development as primarily driven by endogenous or exogenous processes, focus on factor endowments: the more endowed a region is, the greater are its chances of prospering in a context of increasing global competition over development opportunities.
For at least two decades the primary focus, as far as the type of assets considered is concerned, has been on the so-called knowledge society. According to this view, the leading edge of growth and innovation in the contemporary economy is constituted by sectors such as the high-technology industry, neo-artisanal manufacturing, business and financial services, cultural and creative industries. Together these sectors constitute a sort of “new economy” (Trip, 2007) that is strongly reliant on the creation of new symbolic meaning, something which is closely associated with situated knowledge and its articulation with global cultural and information flows. While cultural industries themselves have grown considerably in the last decade, along with their
1 e.g. Bradley et al. (2002) argue that Birmingham has been less successful than Manchester and Glasgow in changing its image because the city is aesthetically less attractive.

ESPON 2013 7
importance for the economy as a whole (KEA, 2006; Russo and Van der Borg, 2010), a whole new “economic order” has emerged (Hall, 1998; Simmie, 2005) that assigns culture and information a key role in regional and urban economies.
The growing profile of this “cultural-economic paradigm” (Amin and Thrift, 2007) not only affects the economic morphology of cities, but, increasingly, also the physical (built) and social landscape2. The face which the “successful” contemporary city presents to the external world tends to be organised around the living (and consuming) environments of the high-end segments of the job market, including up-scale streetscapes, state-of-the-art educational facilities, expensive shopping and catering facilities and high quality residential enclaves, as well as a wealth of cultural amenities (museums, art galleries, concert halls, multi-media entertainment districts).
A corollary of this is that the capacity of cities to access, process and creatively use information and knowledge to produce competitively and innovatively is at stake, and is strongly linked to the characteristics of their social capital and their consumption landscape. On this basis cities seek to actively engage in an “upscaling process” whereby they attempt to become central nodes in the global knowledge economy by nurturing the appropriate conditions (e.g. “openness” of deregulated forms of governance and appropriate forms of social control). By doing this they hope to increase their chances of attracting mobile human capital which is considered to be the main engine of innovative and competitive economies. The ability to do this is thought to create a “virtuous circle” whereby success breeds success related to the synchronisation of urban spatial dynamics with global trends3.
These arguments have been addressed and shifted from a more conceptual dimension to a more practical, policy-oriented discourse by Richard Florida (2002, 2003, and 2008). Florida’s work has exerted considerable influence in the policy debate. It explicitly relates to urban economic development and the behaviour of a wide range of “creative” workers, rather than firms or managers, addressing the conditions that collectively make a city an attractive place of residence and work for the so called “creative class”. The relevant attributes are considered to be economic and spatial diversity, specific leisure and cultural amenities that fit the interest of the creative class, a mixed population, the chance of informal meetings in so-called “third spaces”, safety, vibrancy, as well as indefinable aspects such as authenticity, tolerance, street life, buzz, and urbanity.
Florida developed a measurement method for the quality of places in a series of studies on the quality of U.S. cities (Florida, 2000, 2002; Florida & Gates, 2001), and some years later, in some European countries (Florida & Tinagli, 2004). These analyses were based on a set of indicators for technology, talent and tolerance (the 3Ts). Florida’s work does point to the importance of criteria
2 Among the complex attributes of this new economic order, Scott (2006) highlights three aspects of special importance concerning the production forces: the “flexible specialization” of networks of firms; extremely fluid and competitive labour markets associated with these sectors, with many individuals being engaged in part-time, temporary, and freelance forms of work, where most creative fractions of the labour forces are organized in temporary project-oriented teams; many sectors have a marked propensity to assume geographic expression in the form of specialized locational clusters. Examples of this phenomenon abound: Silicon Valley, Hollywood, the City of London, le Sentier in Paris, the industrial districts of the Third Italy, the leisure economy of a booming tourist destination as Barcelona, etc. Clusters of these sorts are by no means confined to the more economically advanced countries. 3 In terms of spatial organisation we can highlight three key issues. First, cities tends to become simultaneously complementary to one another, in the sense that they are caught up in mutual exchanges of specialized products and strongly competitive with one another, securing their own collective interests in a world of finite resources (Camagni 2002). Second, with the extension of markets due to globalization, trends toward urban agglomeration are actually intensifying across much of the new economy, because growth of output allows divisions of labour at the point of production to deepen and widen, just as it leads to the amplification of external economies of scale and scope. And third, there are also many small and specialized creative agglomerations, as exemplified by places such as Limoges with its porcelain industry, or the craft communities of the Third Italy (Becattini 1987).

ESPON 2013 8
such as creativity and talent, diversity, tolerance and safety, and in particular to the presence of specific amenities as attractive factors. His main research objective is to understand why successful and innovative high tech companies cluster together, and the answer given is “…companies cluster in order to draw from concentrations of talented people who power innovation and economic growth.” (Florida, 2003, p. 5). In this theory, companies follow people and not vice versa; in specific places, the 3Ts interact with one another in a synergistic (one might almost say “mystical”) manner. The next question is how and why do clusters of such people (the creative class) emerge and develop? According to Florida it is because what they are looking for “… are abundant high-quality experiences, an openness to diversity of all kinds, and above all else, the opportunity to validate their identities as creative people.” (ibid, p. 9). Thus, cities that are richly endowed in place amenities catalyse the best “creative talent”, which should lead to higher economic performance.
In spite of its popularity among policymakers, Florida’s work has nevertheless been heavily criticised for a number of shortcomings. Among these is that he treats the “creative class” as an undifferentiated mass (Markusen, 2006) and fails to recognise significant economic, social and political differences between the various groups he lumps together and the very different roles they may play. From this perspective the “creative class” is anything but a class, it is rather an artificially created category designed to support a theory. Furthermore Scott (2006, p. 11; see also Scott, 2008, pp. 80-83) argues that Florida “fails…to articulate the necessary and sufficient conditions under which skilled, qualified, and creative individuals will actually congregate together in particular places and remain there over any reasonably long-run period of time.” Moreover, the process by which pools of creative talent leads place economies to be competitive remains a “black box”: most critics argue that when policy makers go beyond the attractive rhetoric of Florida’s work there is little of substance to guide actions (e.g. Markusen, 2006).
Thus, while insights from Florida’s work are certainly relevant particularly with regard to “quality of place”, more attention needs to be paid to the process elements which coalesce to create attractive and competitive locations. From this point of view one has to question whether Florida’s 3T’s and retention policies for the creative class are sufficient to guarantee the success of local development strategies. A critical element in this process appears to be ability of a city to accommodate and involve a broad range of stakeholders in these processes. Any city or region that lacks a system of employment able to provide all of its residents, and not just the “creative class”, with appropriate and enduring means of earning a living and access to necessary services is unlikely to be in a position to attract significant numbers of people to take up permanent residence. Moreover, it is too simplistic to assume that simply attracting the “right people” is a guarantee of sustainable success (Russo and van der Borg, 2010).
In fact, today while large cities may harbour unprecedented creative capabilities, they are also places where striking social, cultural, and economic inequalities prevail (Kazepov, 2005). In this situation the construction of the “creative city” is unlikely to be sustainable where these problems persist (Fainstein, 2005; Markusen, 2006; Scott, 2008). This is particularly the case in major metropolitan areas and cities where new-economy sectors have flourished and an associated basic division in the labour forces causes social inequality with regard to incomes and access to services and other amenities. Moreover, it involves basic issues of citizenship and democracy, and the full involvement of all social strata into the socioeconomic processes of cities and regions, not just for their own sake but also as a means of giving free rein to the creative powers of the citizenry at large. Martinotti’s conceptualisation of a sustainable and competitive city argues that it should accommodate diversity in its uses and social composition (Martinotti, 1993), thereby supporting social cohesion. This angle will be explored in further detail in section 5.

ESPON 2013 9
1.4 Milieu, Territorial Capital and Mobilization of Assets
A second approach to attractiveness can be identified, which, while addressing similar points to those discussed in the previous sub-section, places more emphasis on a wider number of factors and their complex interrelationship. Moreover, despite the considerable efforts expended on the definition of the concept of (economic) attractiveness and its analytical consequences these all have a specific focus on “urban attractiveness”, however, it is important to recognise that “attractiveness”, in both theoretical and policy terms, is also relevant to rural and “peri-urban” spaces, which are appealing because of different factors such as residential or leisure spaces within metropolitan areas or regional systems.
In this alternative approach there is a greater emphasis on the impact, in combination, of embedded economic, cultural and institutional factors as the driving force behind attractiveness. It is the articulation of these factors, both historically and currently, that lays the foundation (or creates the potential) for attractiveness. Moreover, it does not focus all attention on one particular “group” (e.g. the “creative class”) that is defined as the driving force in the process and on whom all efforts must be focussed. Central to this approach are the concepts of local milieu and innovative milieu which have helped move the debate forward in terms of understanding the complexity of situated economies.
Local milieu can be described by four basic characteristics (Maillat, 1995): 1) a group of actors (firms, institutions), relatively autonomous in terms of decision making and strategy formulation; 2) a specific set of material (firms, infrastructure) and immaterial (knowledge, know-how) elements; 3) institutional (authorities, legal framework) elements and interaction capacity between local actors based on cooperation; 4) internal self-regulating dynamics, and the ability of actors to modify their behaviour and find new solutions as their competitive environment changes. These have been called the “static characteristics” of the milieu, intended as a reasonably rich resource endowment (defined in a broad sense) of a place. Alongside these some form of (local) dynamism is seen as necessary to initiate (and perpetuate) the creative process. This is referred to as an “innovative milieu” characterized by a “common understanding” based on common behavioural practices as well as a “technical culture” linked to a specific type of economic activity (Aydalot, 1986; Coffey and Bailly, 1996).
In this approach the region, the territory, is not seen as a mere container”, in which attractive location factors may happen to exist or not, but rather as a system for collective learning through intense interaction between a broadly composed set of actors (Moulaert and Sekia, 2003; Moulaert and Nussbaumer, 2005). The milieu is a created space that is both a result of and a precondition for learning – an active resource rather than a passive surface (Coffey and Bailly, 1996; Hallin and Malmberg, 1996).
All the above elements – which add to, and do not substitute for, more traditional, material and functional approaches – may be encompassed and summarized by the concept of territorial
capital (Camagni, 2008). This notion was proposed in the regional policy context by the OECD in its Territorial Outlook (OECD, 2001):
A region’s territorial capital is “distinct from other areas and is determined by many factors [which]... may include... geographical location, size, factor of production endowment, climate, traditions, natural resources, quality of life or the agglomeration economies provided by its cities...Other factors may be “untraded interdependencies” such as understandings, customs and informal rules that enable economic actors to work together under conditions of uncertainty, or the solidarity, mutual assistance and co-opting of ideas that often develop in small and medium-size enterprises working in the same sector (social capital). Lastly there is an intangible factor, “something in the air”, called “the environment” and which is the outcome of a combination of institutions, rules, practices, producers,
ESPON 2013 10
researchers and policy-makers, that make a certain creativity and innovation possible. This “territorial capital” generates a higher return for certain kinds of investments than for others, since they are better suited to the area and use its assets and potential more effectively ...”.
This concept has gained authority in the policy-making and institutional debate, as illustrated by its use, initially by the Dutch Presidency in the “Discussion paper for the informal meeting on territorial cohesion” (2004), and more recently in the Luxemburg Presidency’s “The Territorial States and Perspectives of the European Union” (2005).
Based on this approach, despite not explicitly using the term “territorial capital”, several attempts have been made to analyse assets and performances of places. For instance Deas and Giordano (2001) sought to explore the relationship between sources (the initial stock of assets in a city) and outcomes of competitiveness (the result of attempts to exploit these assets by firms) across a sample of urban areas. They argued that urban asset bases provide a strong predictor of competitive performance but that this general pattern is interrupted by some cities for which competitive outcomes are stronger or weaker than might be expected in the light of underlying asset bases. In their research, two aspects can be underlined: a definition of assets that tends to be similar to the notion of territorial capital; and the focus on the mobilization of local assets as key aspect in the difference of performances between places.
In particular the second point reflects the assumption that the effectiveness with which the above-mentioned assets are exploited is conditioned in part by the actions of individual and collective agencies (as well as through more nebulous “market forces”), but also by the way in which a territory is governed. This is a critical aspect, and refers to what Buckley et al. (1988) called the “management process”. While in its original incarnation this referred to the differential ability of firms to exploit resources at their disposal, it can also be used to refer to the efforts of local policy actors to create, exploit, supplement, and replenish local asset bases, and to transform liabilities into assets (Deas and Giordano, 2001). Moreover, it suggests the need to recognise that there are a range of “different users” in the territory and that they do not have a uniform set of needs, the ability to both recognise and find a way of reconciling differing needs is a mark of an inclusive governance system. For instance whilst one can identify businesses and residents as two user groups with potentially different needs they are not homogeneous groups and while they may require different policy responses on some issues they may also have much in common. Many local residents will need work and employers require a well-educated workforce, both also require reliable high quality public services (e.g. transport systems). The point is how a governance system balances out the different needs within a framework that represents and reflects the diversity of local populations.
It is thus worth reflecting on the concept of attractiveness from a governance point of view, underling two main aspects: on the one hand, governance can be a criterion of attractiveness. A well established and reliable governance system of a place can be a factor of localisation. On the other hand, attractiveness is a concept shaping the territorial governance process itself, in particular concerning the “mobilization process” through which territorial assets are activated. Furthermore, it may even become part of an explicit mandate in a governance process: for instance, the definition of a strategic plan for a city can have as its main aim the objective to transform the city into an attractive place. Here the criteria are socially constructed and mobilization has an explicit coordination role.
1.5 Attracting whom? Mobilities and migrations in the global age

ESPON 2013 11
The last part of our literature review addresses the “object” of attraction policies. We now refer to new concepts of mobility, embedded in wider process of what Bauman (2000) called “liquidity” of contemporary society, in which spatial displacement loses its extraordinary character to become a common element of people’s lives. Urry (2007) writes in this regard of a new “mobilities paradigm” for the social sciences, moving away from a sedentarist conception of society and livelihoods, and highlighting that the normal condition in the present day (and a right of individuals) is that of “being on the move”; either physically, in relation to the increasing spatial disarticulation of work and social relations, or symbolically and metaphorically, in relation to the globalisation in the world of signs and meanings that substantiate our cultural life, which also determines a “compulsion for mobility” as a means to satisfy spatially material needs and cultural aspirations (Urry, 2008).
Talking about mobilities and not mobility, he also stresses that in this paradigm we recognise the existence of “fast movers” and “slow movers”, which have different relations to places and a differential capacity to reconfigure them according to their lifestyles and habits, and whose attraction to a particular place are activated by different reasons from the (neo)classical variables, like prices, employment conditions or the push of demography.
This new configuration of lives on a planetary scale engenders, in fact, a cosmopolitan society: a “new international middle class” has emerged, that ‘moves rapidly from one place to he other but that in any place requires (and does) more or less the same things’ (Martinotti, 1993: transl. by aut.). These practices accrue to places the elements that establish a “landscape of familiarity”, in which this cosmopolitan consuming class (Fainstein, 2005) can rapidly realise a process of “homing” (Sheller and Urry 2006, p.211).
The city is the main scenario of globalisation, and the main generative environment of the liquid society. “Global cities” (Sassen 1994) represent the nodal points of a transnational economic and cultural system. The contemporary metropolis does not represent anymore the hierarchic culmination of a national or regional urban system (Martinotti, 1993), but a part of an a-geographic system that promotes global contents and meanings. In this sense, the urban is uprooted from the territorial. A phenomenon that underpinned the “urban renaissance” after the industrial crisis with the shift to the service economy, and that underlines the reconfiguration of the city as a consumption platform open to global flows of “users”, or audiences.
At the same time, the dynamics that characterize the contemporary society contribute new meanings to the spatial displacement of individuals. As the urban postfordist society loses its sedentarity, tourism loses much of its extraordinary character, not only in terms of “persistence in place” or destinations available, but also in regard to the content of the tourist experience. For Urry (2000), tourism could be conceived just as a form of temporary leisure-driven mobility. Tourism, in other words, would cease to be signified by content of the tourist practice and the nature of the visited object or place, to refer to the condition of the individual or, better, to the urban experience realized by those who do no reside in the destination considered. In this sense for the “post-tourist”, as defined by Feifer (1985), the experience is an end in itself. We can thus speak of post-tourism (Ritzer & Liska, 1997) as a phenomenon embedded in postmodernity that supposes processes of encoding of the place and a spatialisation of the experiences (Coleman and Crang, 2002) radically different from that evoked by modern tourism described by seminal authors such as Cohen and MacCannell.
The competitiveness of a destination would be determined, therefore, by its capacity to offer a distinct and stimulating atmosphere where, according to the logic of experience marketing, ordinary activities are transformed in memorable experiences, which is seen to depend to a large extent on the idiosyncratic nature of the encounters and interrelations with other “non tourist” groups present there (Minca and Oakes, 2006). In the end, the object of the tourist experience would come to be the city on its whole as a complex and indefinite cultural product, composed

ESPON 2013 12
by elements of the local tradition, lifestyles, contemporary “glocal” expressions that contribute to an eclectic and above all unique mental landscape.
Martinotti’s work (1993) is pioneering in the sense of questioning the capacity of places to be resilient to such “multiplication” of uses and populations. In his “three population theory” of urbanisation, he postulates that a sustainable city or urban region is one that accommodates and generates synergies between different population characterised by different degrees and mobility and patterns of “consumption of place”. Though his classification of population draws a line between residents, commuting workers, regional consumers, and tourists, his intuition – supported by research into successful cities – could be further elaborated in the lines of Urry’s mobilities paradigm. Different “liquid” populations flow in and out of cities and regions constantly, contributing to the development of contemporary places; it is up to the cities and regions not rather to “select” populations that produce the most beneficial effects (which could be criticised for establishing a new “power hierarchy” that privileges the new cultured elites and possibly affecting others groups), but to accommodate such diversity in one place and generating the social and cultural connections that make such diversity become an asset for more competitive and sustainable environments.
To this regard, it should be acknowledged that “externalities” in this superimposition of different populations may emerge. The attraction exerted by a place on some “audiences” as a consequence of its collective capacity to mobilise territorial assets in a certain direction may either strengthen, or reduce, the attractiveness that the same place has for others. Externalities, by definition, are susceptible to severe problems of market failure and misallocation, and hence management of their genesis and allocation constitutes a further concrete issue that emerges at the local level.
For instance, while it can be unequivocally claimed that, on the one hand, new knowledge workers, university students and neo-bohemians (Quaglieri Domínguez and Russo, 2010), and on the other hand blue collar workers, old-time residents, immigrants, etc, all contribute to some extent to the development of a competitive city (providing, respectively, important inputs to edge sectors, creative capacity and cultural animation, the workforce for residual industrial sectors, stewardship to the local cultural identity, and basic manpower jobs in consumer services and tourism), their mix and compatibility can be problematic. For instance upmarket workers gentrify popular areas and crowd out older residents while students may also create problems in the areas in which they live and concentrate (Hubbard, 2008). Similar points also apply to tourism where the presence of certain groups (e.g. migrants) may be perceived as a ‘problem’.
Acknowledging and characterising this diversity, and its points of friction or potential encounters, is this the first step towards the construction of a competitive local environment. Several angles could be adopted in this regard; we stick with Martinotti’s definitions of levels of “transience” and “motivations” for mobility as the two fundamental dimensions of this multiciplicity, determining all possible combinations of consumption patterns and place practices. Different actors may be attracted in a city o region for different reasons and according to varying patterns of “transience” (the duration or their stay in that area once attracted there), recognising that the range of possible transiencies in our “mobile”, postindustrial and postmodern society overcome the simple binary of extreme volatility (traditional tourism) and sedentary livelihoods: people travel and move around for different reasons, for short or long period. Patterns of differential mobility overlap and intersect locally, defining, among other things, the structure of the local socio-economic environment and the position of cities and regions as nodes in the global web of flows that, according to Castells (1989), has emerged and structures all aspects of the “Information age”. For the sake of simplicity, this range of mobilities can be reduced to three or four main blocks characterised by given combinations of “reasons” for moving into a certain area

ESPON 2013 13
and “levels of transience”. The most obvious combination, as recalled above, is the classic distinction between “residents” and “visitors”, which is also reflected in the title of this project.
As we are discussing, after all, flows and not “capital stocks”, they must be defined dynamically: a region is attractive for residents when new residents come in and become new citizens, that is, the net migration rate is positive, and it is not attractive when existing residents leave the region, or the net migration rate is negative. When we shift the attention to tourists, obviously a region is more or less attractive according to its capacity to attract those “temporary residents” that are tourists (“outward” tourism is less interesting in this respect as a factor of “unattractiveness” of origin regions as it is a natural phenomena of our society that people, when they can, go to holidays aboard, independently on how attractive is the place where they hold the habitual residence). However, as suggested above, we must recognise that among “new residents” there are important differences, among which the structure of the (attracted) workforce, their economic or educational level, their impact on the local economy, and also the “transience” of their stay.
Whereas “traditional” forms of mobility are strongly dependent on neoclassical variables like wages, prices, accessibility, and employment rates, and demographic variables like the age structure of the population, in this project we place a particular emphasis on those aspects of mobility that are more related with the “new geographic” literature concerned with place qualities and territorial capital assets; aspects that are more problematic both to define and to assess, but which may result in an important integration to the comprehension of European mobility and regional development processes.
Also types of tourists may vary considerably. One first important group is represented by traditional mass tourists, typically characterised by medium-length packaged stays in vacation areas, mostly in the “sunny belt” of the Mediterranean Europe, booked through agencies or other intermediaries. The second group takes in categories of unorganised, independent, special interest travellers that have emerged in the last 20 years, like short-stayers in urban destinations, including cultural and business tourists, but also new fluid forms of leisure- or non-work driven mobility which are increasingly blurring with the features of mobile residents: second home owners, retired couples buying property in the sunny belt of Mediterranean Europe and becoming permanent residents there, foreign students on an Erasmus stay and visiting researchers, neo-bohemians “finding themselves” in some big cities for a few months and working on a part-time basis, health tourists on a treatment, etcetera (Quaglieri-Domínguez and Russo, 2010).
It is important to keep these two groups conceptually separated. First, because the attraction factors may be considerably different; again, neoclassical considerations of price and accessibility may be predominant for the first category (which are tied to the level of “industrialisation” in the structure of the local tourist supply), whereas the second group is remarkably more sensible to genuine place qualities and experiences, “mental” or cultural accessibility, and a certain “visitor-friendliness” in the organisation of the tourist experiences (Richards 2007, Russo and van der Borg 2002). Secondly, because different impacts can be expected from each of them, determining differential outcomes of the attraction processes. Distinctions, to this regard, can be subtle and cut across groups: second home residents or “silver” long-stay tourists are believed to bring a sustained contribution to the local societies, but are seen as an intolerable pressure factors in the delivery of public services and health; foreign students and “neo-bohemians” may be low spenders and create all sorts of disturbances for the local community, but they are believed to contribute animation and “buzz” to cities, and they are the best ambassadors for welcoming and exciting places where they settle for a while.
To conclude, the most important corollary of this literature is that every population has something to contribute to local development processes, and that policy and planning have to

ESPON 2013 14
recognise this potential and generate the social and cultural infrastructures that nurture their fecund encounter.
1.6 Research into territorial attractiveness
From this discussion of the uses of attractiveness in the policy arena, and the review of the various literatures that add complexity and depth to this concept, we draw a number of conclusions that are used as entry points for the ATTREG project.
First, the territorial capital concept should be considered as a crucial dimension of the attractiveness of places. This is intended as a complex system of natural and socio-economic elements, defining the uniqueness of local assets. Deas and Giordano (2001), in their research, identified four elements of the “static capital” of a place: economic, institutional, physical/environmental and social environment, to which – for the sake of clarity and to address the key objectives defined by the theme of this project, we will add “social and cultural” and “antropic” capital.
Second, the attractiveness of a place stems from the combination of different assets and from the way(s) they are mobilised, both by non-governmental organisations and institutional actors (sectoral stakeholders, association of categories, NGO, etc.). This approach provides a dynamic perspective on territorial capital, since the relationship between assets and attractiveness is mutually reinforced through a continuous process of mobilisation which seeks to enhance the existing stock of assets. In this context governance arrangements are crucial to the mobilisation and use of assets and this requires the existence of links, often articulated through organisational arrangements (e.g. partnerships) between stakeholders, local authorities, agencies and citizens in order to identify, create and mobilise assets and develop policies to achieve specific (attractive) strategies.
Third, territorial attractiveness is not an undifferentiated concept with regard to all categories of citizens (e.g. young and old, employed and retired), or for all possible target groups.
This interpretative scheme allows us to distinguish the processes of perception of place and spatial economies for different types of users, and to assess the overall outcome(s).
Taking again tourism as an example, the attractiveness of a city is generally defined as the ability to attract tourists, producing benefits for the urban economy. However, from a broader perspective it can be argued that social and environmental balance should also be an equally important objective; from this point of view, according absolute primacy to tourism represents a disruptive factor, often contributing to unwanted social and environmental change. The two macro-categories of residents and visitors can be considered as a first main subdivision among potential users, each being attracted to a place by a specific range of potential factors. In spite of the fact that the attractiveness of place is usually considered to refer to visitors as potential users, and tourism as a development strategy, a balanced relationship between the attractiveness of places for visitors and residents ought to be the core issue in strategies of valorisation and mobilisation of assets.
Today there is a large amount of research on the diseconomies potentially created by tourism at destination level as opposed to a model in which cultural assets disengage a genuine “triple helix-like” virtuous process of capacity-building, whereby (cultural) tourist demand is the strategic trigger for the process through an increase in economic opportunities (OECD, 2005). If cultural assets are not properly mobilised – which hints at notions of conservation, but also dynamic reproduction, value-adding processes, and governance (Russo, 2002), the tourist economy based on their exploitation may well result in a factor that crowds out (or even destroys), rather than
ESPON 2013 15
strengthening local development assets and idiosyncratic place qualities. This argument also has an important spatial element to it; externalities from tourism occur not only within destinations and across sectors, but also across territories, due to the footloose nature of tourist activities and the emergence of what have been called “functional tourist regions” spanning administrative boundaries (Van der Borg et al, 1996).
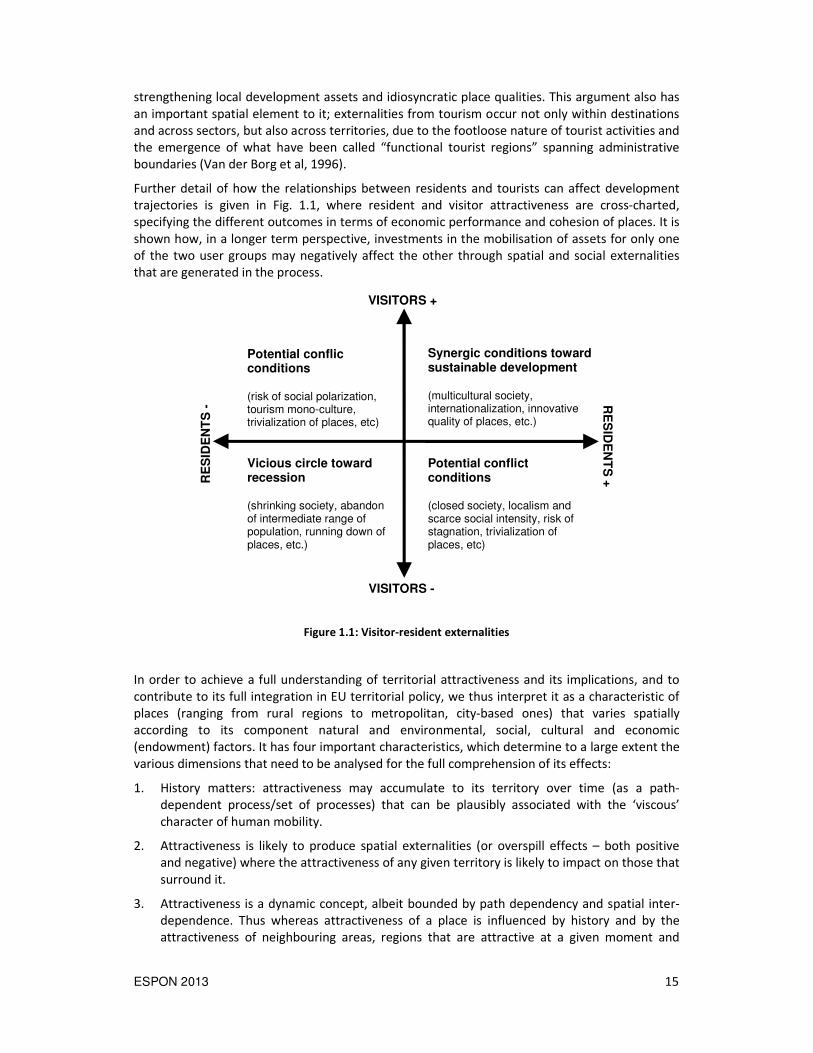
Further detail of how the relationships between residents and tourists can affect development trajectories is given in Fig. 1.1, where resident and visitor attractiveness are cross-charted, specifying the different outcomes in terms of economic performance and cohesion of places. It is shown how, in a longer term perspective, investments in the mobilisation of assets for only one of the two user groups may negatively affect the other through spatial and social externalities that are generated in the process.
Figure 1.1: Visitor-resident externalities
In order to achieve a full understanding of territorial attractiveness and its implications, and to contribute to its full integration in EU territorial policy, we thus interpret it as a characteristic of places (ranging from rural regions to metropolitan, city-based ones) that varies spatially according to its component natural and environmental, social, cultural and economic (endowment) factors. It has four important characteristics, which determine to a large extent the various dimensions that need to be analysed for the full comprehension of its effects:
1. History matters: attractiveness may accumulate to its territory over time (as a path-dependent process/set of processes) that can be plausibly associated with the ‘viscous’ character of human mobility.
2. Attractiveness is likely to produce spatial externalities (or overspill effects – both positive and negative) where the attractiveness of any given territory is likely to impact on those that surround it.
3. Attractiveness is a dynamic concept, albeit bounded by path dependency and spatial inter-dependence. Thus whereas attractiveness of a place is influenced by history and by the attractiveness of neighbouring areas, regions that are attractive at a given moment and
RE
SID
EN
TS
+ R
ES
IDE
NT
S -
VISITORS +
Potential conflic conditions (risk of social polarization, tourism mono-culture, trivialization of places, etc)
Potential conflict conditions (closed society, localism and scarce social intensity, risk of stagnation, trivialization of places, etc)
Synergic conditions toward sustainable development (multicultural society, internationalization, innovative quality of places, etc.)
Vicious circle toward recession (shrinking society, abandon of intermediate range of population, running down of places, etc.)
VISITORS -

ESPON 2013 16
under a set of given exogenous or endogenous circumstances to a particular group (such as short term visitors), may not be such when these conditions change. Attractiveness can change as a result of policy choices taken either within the territory or at a wider spatial scale – there is the possibility of institutional agency.
4. Finally, attractiveness is not an ‘absolute’ quality of territories, but rather a relative factor of spatial differentiation. Thus a given territory can become more attractive not only because it has acquired more endowment factors but because other territories have lost some of their endowment factors.
TERRITORIAL CAPITAL (potential assets)
Environmental Capital(climate, natural resources,
protected landscapes, green areas, rural areas and/or
settlement structures, etc. )
Antropic Capital(built environment, quality of
housing, architecture, infrastructure, hotels, etc. )
Economic Capital(firms and sectors, level of
economic activity,
employment, networks and clusters, innovativeness,
investments, centrality, etc. )
Human and social
Capital(education levels, diversity
of population, social
networks, gender and ethnic participation, crime, etc. )
Institutional Capital(democracy, efficiency of the
system, tax climate, participatory processes,
accessibility, etc. )
Cultural Capital(monuments and landmarks,
cultural activities, infrastructure and services,
higher education institutions,
academic production, etc. )
POTENTIAL USERS AND ATTRACTION FACTORS
Residents(different types by
educational level / income / skills / mobility profiles / etc.)
Visitors(different types by type of
stay / tourism activity / cultural profiles / etc.)
Attraction factors for
residents(accessibility / labour market
/ quality of place / tax climate / security / cultural
and social dynamism / etc.)
Attraction factors for
visitors(accessibility / entertainment
offer / quality of place / costs / specific interest facilities /
etc.)
MOBILISATION (governance processes outcome
Public decision-makers Sectoral stakeholders
Associations of categories
Cultural agencies / NGOs
Economic performance
Redistribution of resources
Figure 1.2: Process aspects linking territorial capital to its users
Attractiveness can thus be conceived as the complex result of interactions between geographical attributes and a set of factors (themselves, possibly, the result of dynamic processes) that are set in a historic (path dependent) trajectory. The investigation on territorial attractiveness needs to be founded in a conceptual “model” that links the three main components of this complex interaction (see Fig. 1.2):
• A set of ‘audiences’ (either targeted explicitly or defined in terms of their mobility characteristics) that can be attracted and for which there is a menu of expectations, each
ESPON 2013 17
with a different profile in terms of the development processes that it is expected to engender locally and in surrounding areas;
• A set of ‘endowment’ factors or territorial assets that potentially determine attractiveness (conceptualised as territorial capital) in either a general sense or to one particular audience;
• A set of processes by which territorial assets may be mobilised to enhance attractiveness either for all or for a specific ‘audience’.
The scheme in Figure 1.2 takes into account the broad perspective elaborated in the previous theoretical debate, including the role of hard and soft assets, social aspects of attractiveness and intangible elements. Moreover, it moves beyond static milieu factors, including dynamic process of mobilization of assets through more or less institutionalised governance processes, giving a policy dimension to the concept, which leads to a further consideration: attractiveness is a concept that should be specified in relation to certain categories of possible users/inhabitants, for who the assets are mobilized.
Underling the policy dimension of the concept, it is then possible to go back to the implications for EU policy and the attention to the diversity of the EU regions, emphasizing how further research could provide scientific support to policy agendas exploring the concept of attractiveness and its implicit valorisation of spatial differences.
ESPON 2013 18
2 METHODOLOGICAL FRAMEWORK
Antonio Russo, Ian Smith and Loris Servillo
2.1 Research questions
Based on the theoretical considerations exposed in the previous chapter, the four key questions in the Terms of Reference for this project:
• What are the key territorial endowments that are associated with attracting different mobility audiences?
• How does our measure of regional attractiveness vary spatially across the EU area and across different types of region?
• What are the likely trends in regional ‘attractiveness’ over the next 20-30 years?
• What are the key policy instruments that impact on regional attractiveness?
• What is the role of sectors and trends for attractive regions and cities?
have been articulated in a wider range of research questions:
1. How do different “audiences” react to different territorial asset endowments? To what extent and how are these responses stratified spatially? What main trends and what key determinants can be observed in the relation between territorial assets and attraction of residents and visitors (of different types)?
2. How does the attraction of specific groups evolve over time? What has been the effect on the sustained capacity of regions and cities to attract other groups?
3. What is the role of mobilisation strategies and specific policies in these outcomes?
4. To what extent has attraction of different groups been a determinant of regional growth and competitiveness? Are such outcomes “sustainable’?
5. What are the roles of different economic sectors in the enhancement of attractiveness for cities and regions? What impact do more general economic trends (e.g. the decline of traditional manufacturing or the increasing importance of services) have on regional attractiveness?
6. What is the likely development in the relation between territorial capital, attraction and competitiveness in the next 15 years under different scenarios?
7. What is the future role of policy, from the local to the pan-European level, in mobilising attraction factors so as to achieve more sustainable development throughout European regions and cities? How can “attractiveness” be integrated into the spatial planning toolbox that is being developed by ESPON?
8. What is particular role of medium-sized cities and small towns as “attractive centres” and how are they integrated in this way into national urban systems and the national economy, depending on the specificities of each country and the specific phase of development, historical and institutional background? And what about other “geographical specificities” like border regions, peripheral sparsely populated areas, islands, etc., that are the focus of attention of recent policy documents like the Territorial Cohesion Agenda of the EU?
ESPON 2013 19
2.2 Methods and research structure
These questions are unravelled in a number of research activities, connected between them (results from one activity became inputs for others) but allowing for feedbacks and loops and also including a number of interaction moments with other ESPON projects, and especially those delivering relevant results for ATTREG during the lifetime of the project. The Inception Report for this project gives a broad overview of the organisational structure of research tasks (p. 7-8).
In synthesis, research work has been divided into seven bundles or – in the nomenclature adopted by this TPG – “Research Activities” (RA’s), which deploy a mix of quantitative and qualitative methods (to be given further detail in this and following sections) that both deal with the pan-European space and engage in the detailed analysis of specific places and local processes, also acknowledging the importance of co-ordinating research efforts both with other ESPON projects and with the “target groups” of this research. Each individual RA is then split into a number of simpler “research tasks”. Fig. 2.1 illustrates the logical workflow sequence between the various tasks, including interrelationships and feedbacks between RAs.
The first four RAs employ a process of conceptualisation and a theory-driven cycle of operationalization that produces measures of attractiveness, to be validated and explored in greater detail in RA4. RA5 to RA7 generate the policy-oriented recommendations explored across the EU territory as a whole but also across time into the future.
Methodology-wise, we distinguish four main blocks of research.
The first is conceptual research on attractiveness and place development, mainly conducted through desk research of the relevant literature. This research identifies a “knowledge gap” between concepts by now established mainly in the regional-economic and geographic studies about human mobility and the way EU policy has until now addressed these issues and integrated them into agendas4. The main objectives of this initial strand of research are, on one hand, to define exactly what we should be looking for, and, on the other, to convert these concepts into variables for analysis and to fine tune analytic methods to the outputs of a new wave of ESPON projects that have become available during this period (EDORA, DEMIFER, FOCI, etc.). This process of specification has involved specifying variables/indicators in terms of content (what does the variable tell us), in terms of time (at what time periods is the variable measured) and in terms of scale (at what scale is data available to construct robust variables). In addition this process has reviewed whether there is sufficient data available within the three European Candidate countries (Turkey, Croatia and FYR of Macedonia) to include them in the analysis.
Connected with this initial stage of the research is the development of a project database as the main scientific tool supporting this project.
This database is structured as usual into a datasets part, including
a) a section of source datasets (e.g. ESPON DB and EUROSTAT data series),
b) a section of datasets constructed by this TPG (by manipulation of the original data sources in a) or by new data collection), and
c) a section of typologies which are further elaborations of b)
plus a metadata part collecting information on original sources, time series, data cover and calculation methodology of a)-c).
4 This part of the research is already published in an academic paper – see Servillo et al. (2011).

ESPON 2013 20
Concept Analysis Data Management ESPON interaction
Coordination with other TPGs ESPON 2013
Coordination with other TPGs ESPON 2013
1.2. Modelling and theoretical framework
2.2. Data gathering
2.3. Harmonisation and integration of existing databases and new sources
2.4. Harmonisation and integration of carto graphic resources
5.3. Scenario analysis based on evolution of matching indicators
6.2. Production and detailed illustration of taxonomy of regional effects of attractiveness
1.1. Discussion and operationalisation of the concept of attractiveness
1.3. Data availability exploration
Coordination with other TPGs ESPON 2013
1.4. Production of detailed work plan and research objectives
2.1. Verification of alternative sources
3.1. Elaboration of indicators
4.3. Fine-scaled analysis of spatial phenomena in a variety of regional types
5.4. Production of scenario cartography
7.1. Emerging policy issues and orientations
3.2. Descriptive cartography
3.3. Cross-analysis of spatial phenomena and testing of models
3.5. Analytic cartography
6.1. Synthesis of the analysis
5.2. Future attractiveness and policy lever case studies
4.2. Case studies analysis 5.1. Scenario methodology and driving forces
4.1. Verification of indicators based on types of regions
7.3. Cartographical elaboration of the policy prescriptions
7.2. General conclusion and follow up
2.5. Production of ATTAREG database
3.4. Typology of regions
Figure 2.1: ATTREG Workflow chart: organisation of and relation between various research activities

ESPON 2013 21
The database has been put on line in the Intranet management platform of the project throughout its life cycle and has been constantly revised as new datasets are produced and typologies elaborated. The final version of the database respects the format and delivery guidelines of ESPON 2013. The datasets included and their key metadata information are listed in the annex.
In a second block, in the conventional way of the ESPON projects, we manipulate this statistical information – organised at the NUTS2 territorial level, which we found to be a good compromised between the availability of data and the level of detail at which we analyse the spatial effects of attractiveness – to derive meaningful information about the main territorial trends characterising Europe according to these research dimensions, and specifically a number of “European maps” describing key territorial trends, the most important of which are analysed and commented upon in this report. Concretely, we:
1. selected and calculated a number of indicators describing the realised attraction of different “audiences”, mapped them, and combined them through clustering statistical techniques to derive a typology of regions according to “flows attracted”;
2. selected and calculated a number of indicators ascribed to dimensions or classes of territorial capital, mapped them, and combined them through clustering statistical techniques to derive a typology of regions according to “potential attractiveness” (for different audiences);
3. related “audiences” to “assets” through multivariate regression in order to verify how much of the territorial diversity in the attraction of flows can be explained by the endowment with different territorial capital assets, but also, focusing on “outliers” (cases that behave differently from what could be expected from the model estimation), how are these stratified (spatially, by geographical types etc.).
It is important at this point to give precise details of the logical structure (outlined in a synthetic form in Fig. 2.2) by which we relate flows (the “mobility” measure), endowment factors (characteristics of territorial areas that together are labelled as “territorial capital”) and their of mobilisation (the force of place-based agency), also taking into account the territorial and spatial effects that mobility of different types could produce on original attraction factors, thus making our model dynamic.
In the first part of the statistical analysis (the ATTREG static model) we selected and measured the flows of a number of audiences (detailed in Section 3 of this Scientific Report), we select and measure a number of territorial capital indicators (detailed in Section 4), and we estimated these mobilities through indicators of endowment (as illustrated in Section 5).
The model includes a time lag between endowments and flows, allowing for a “reputation building” effect (or a necessary mobilisation period) until territorial capital potentials exert their attraction. Thus, we have roughly measured territorial capital endowments at the beginning of the 2000s decade (2001-04) and the flows in the 2004-07 period. The static model can explain to a certain extent such mobilities (40 to 60%); what we cannot explain depends on factors that we haven’t included in our model in our analysis, either because they can’t be measured or the datasets available are not good enough, or because they are not at the core of this study, or finally because of the very simple structure of this model. This divergence also tells something about the importance of the mobilisation process: some regions are very good at exploiting their territorial assets to be attractive through proper policy initiatives or a good governance structure, and some others are not, a question that is further explored in the case study research.

ESPON 2013 22
Endowments of region i at time t
(territorial capital)
Mobility of an audience x at time
t+1 (outcome 1)
Impact measure at time t+1 (short
term)
Changes in endowments at
time t+x (long term)
ATTREG static model
Mobilisation process
ATTREG future model
Endowments of region j at time t
(territorial capital)
Figure 2.2: Conceptual model relating mobility to endowment factors and change
Thus, in a third block, we conduct an in-depth, case-study based research of eight regions and cities that have been characterised as “exemplary” of a certain relationship between assets and audiences (either because they are “outliers”, or because they present the expected “sign” but in a specific geographical setting), combining quantitative and qualitative techniques. These case studies are directed on one hand at explaining cause-effect relationships that are only described statistically in the previous analytic block, and on the other, at exploring aspects of this analysis that for the sake of generality have not been addressed there – for instance, varying the scale of the analysis from country-wide to the finest possible level; or including indicators that were not available Europe-wide. This stage of the research allows us to wrap up the modelling of the relationship between territorial assets and flows attracted, presenting a broad picture of how the process of attraction works, what are its main drivers and context-specific elements, what main spatial trends are observed, and what are the most important elements of complexity that policy should take into account when “operationalizing” these relationships into the regional policy toolbox.
The fourth block expands the general model, projecting it into the future. Going back to the logical scheme of Fig. 2.2, we assume that the impacts of attraction (in terms of population, employment, wealth, etc.) feed back into territorial endowments, thus determining a long-term dynamics of the model for the same regions but also of other regions as there is an obvious linkage between them in terms of population mobility (immigration in a region means a relative decrease of population in some other place, which alters its position). We have modelled this through a more complete set of relationships (identified through the case study research) between attraction factors, flows attracted and their effect; that is, bringing into the model the endogenous processes of restructuring of place which spring from attraction. In a sense, this goes in the direction of relating attractiveness with competitiveness, if only to factor in the net effect of the mobilisation of flows across Europe. We could do this using some of the insights from case studies where this richer dataset was available, and we use this expanded model (called ATTREG
Future) to generate scenarios for the future as impacts of a set of “policy experiments” over a baseline model, which we assume to be the predictions of the DEMIFER project.

ESPON 2013 23
As a necessary word of warning in respect to our scenario analysis, we do not have the ambition to “predict” future developments, but only to present European policymakers with a certain sense of the different impacts of given policy courses, which can be broadly described as relating to the “inclusive”, “smart” and “sustainable” storylines of the Territorial Agenda 2020, and possibly to help devise superior solutions (in terms of spatial strategies) that may bring to a more cohesive and integrated European territory at every scale. This is the way we decided to present our findings to the key target group of European policymakers, within a broader illustration of the value of attraction strategies as part of place policies.

ESPON 2013 24
3 POPULATION FLOWS
Ian Smith and Antonio Russo
3.1 Methodology and data cover
This project focuses on the flow of people within and from without the European Union. The net flows of people (either as the numbers/net number of people or as rates per 1000 inhabitants) are taken as the measure of attraction.
The ATTREG project has built upon the bases constructed by earlier work, and specifically the DEMIFER project, which then projected forward the impact of such patterns of migration in relation to regional demographic profiles and found that patterns of migration were threatening to compound problems associated with an aging European population. The key issue then becomes, either what can spatial development policy-makers do about modifying these patterns of movement or what can spatial development policy-makers do to mitigate the impact of these changes?
However while DEMIFER’s projections are the result of purely demographic model, our measures of mobility (flows of people) are conceived as the outcome of having territorial capital (see Sections 2, 4 and 5).
This analytical framework assumed that we would be able to gather measures of mobility for a period with a slight time delay with respect to the data on territorial assets under scrutiny. Statistics on the flow of people are complicated by definitional issues relating to the way the movement of people are recorded administratively across Europe, the issue of choosing the territorial scale at which one sets the boundary for recording movement and the time period over which individuals qualify as either a visitor or a migrant. It is important to recall that the project also considered the relationship between migratory people movements and shorter term visitor flows.
In terms of migratory movements, it is worth distinguishing four types of flows:
a) International migration from and to outside the EU into/out of the EU area
b) International migration between member-states of the EU
c) Internal inter-regional migration within member-states; and,
d) Intra-regional migration within member-states.
Each of these types of migratory movements is likely to be driven by slightly different bundles of reasons. The ad hoc module to the Labour Force Survey in 2008 explored the reasons given by respondents (who had migrated across a national boundary) that lay behind their decision to migrate. Thus foreign-born migrants from without the European Union would tend to stress work related reasons and family related reasons as the motivation behind migration into the EU, whereas EU-born foreign respondents were more likely to stress economic reasons for migration. This is likely to reflect differences in the migration policies of the receiving country. Drawing on the stated reasons for migration within England, respondents migrating shorter distances (30 miles or under) were more likely to stress a housing-related reason for moving rather than the longer distance migrants. Equally life-cycle theories on migrants would stress the changing motivations for moving based on distinct life cycles in relation to the labour market (transition into labour market, progression within labour market, transition out of labour market).

ESPON 2013 25
At the national level it is possible to distinguish different national contexts for measures of mobility. Map 1 is a typology of nation-states within the ESPON area classified in relation to the relative numeric importance of internal inter-regional (NUTS2) migration and migration between EU member states. On the whole, larger countries offer a context in which internal migration is likely to be dominant, whereas for smaller states intra-EU migration flow would be relatively more important (both in terms of in- and out-migration). The countries for which internal inter-regional migration appears to be more significant (relative to intra-EU migration) are the larger states to the north and West of Europe but also include Greece, Turkey and Hungary. Clearly the drivers and inhibitors for inter-regional migration are likely to be different for internal migrants in comparison to those that need to cross international boundaries (even within the European Union). Issues of language and culture are likely to inhibit international migration (see Barca, 2009) as evidenced in the relatively low levels of inter-state migration in the European Union in comparison to inter-state migration within the United States.
The issue of scale as the defining characteristic of who gets counted is important since survey evidence (Niedomysl, 2008) reveals that the stated motivations for moving by households varies in relation to the distance (physical and cultural/linguistic) over which the move takes place. Table 3.1 illustrates this key issue showing the number of migrants that become incorporated as one changes the scale over which one defines ”migration”5. In the countries where internal migration is relatively important, nearly 43 persons per year move between local authority areas, whereas just over 18 persons not only move between a local authority area but also move across a regional boundary (within a country). In contrast, the migration rate from within the EU but from without the country in question is, on average, a third of the internal migration rate within the countries where internal migration is numerically more important than migration from outside the country.
Table 3.1: Migration flow rates by size of geographic unit
Flows (number of migrants per 1,000 inhabitants)
internal inter-LAU2 moves,
2006 (including
inter-NUTS2 movements)
internal inter-regional (NUTS2) migration,
2006
inter-EU in-migration,
2006
inter-EU out-migration,
2006
Cluster 2 countries: relatively high internal migration flows
42.98 18.66 6.75 4.57
Cluster 3 countries: relatively important intra-EU migration flows
12.81 4.14 9.45 10.03
Thus migration statistics are a product not only of the fact that people move about, but are also structured by the geographies that are adopted to define whether one has migrated at all. The majority of this project has concentrated on the mobility as defined by crossing a NUTS2 boundary although within the case study work there is also work that has considered mobility defined by finer grained geographies (the local area units – LAUs)
Map 2 classifies the nation-states covered by ESPON in relation to the proportion of the registered population who were born in another country, the number of asylum seeking applications per 1,000 inhabitants, and the number of foreign registered visitors who stayed in tourism-related accommodation per 1,000 inhabitants. This typology pretty much divides Europe between the north and west of Europe, where there are relatively high visitor numbers and
5 Luxembourg and Cyprus are excluded from the table as they are individual outliers in this typology.
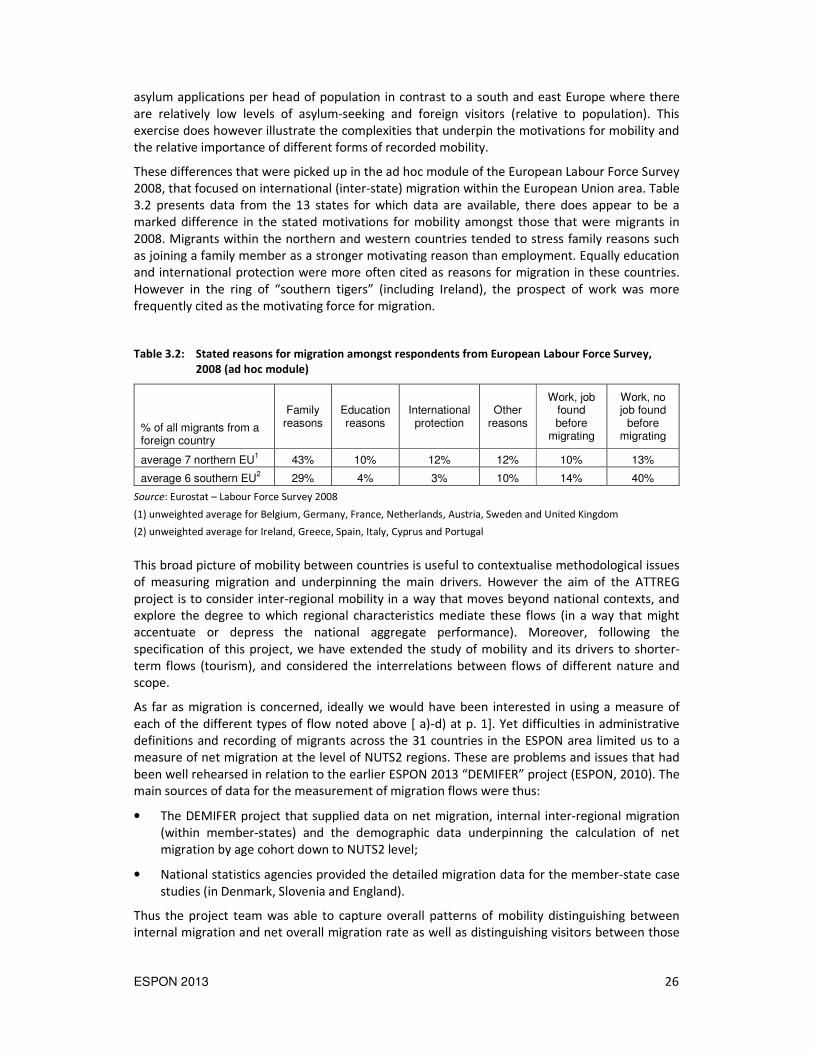
ESPON 2013 26
asylum applications per head of population in contrast to a south and east Europe where there are relatively low levels of asylum-seeking and foreign visitors (relative to population). This exercise does however illustrate the complexities that underpin the motivations for mobility and the relative importance of different forms of recorded mobility.
These differences that were picked up in the ad hoc module of the European Labour Force Survey 2008, that focused on international (inter-state) migration within the European Union area. Table 3.2 presents data from the 13 states for which data are available, there does appear to be a marked difference in the stated motivations for mobility amongst those that were migrants in 2008. Migrants within the northern and western countries tended to stress family reasons such as joining a family member as a stronger motivating reason than employment. Equally education and international protection were more often cited as reasons for migration in these countries. However in the ring of “southern tigers” (including Ireland), the prospect of work was more frequently cited as the motivating force for migration.
Table 3.2: Stated reasons for migration amongst respondents from European Labour Force Survey,
2008 (ad hoc module)
% of all migrants from a foreign country
Family reasons
Education reasons
International protection
Other reasons
Work, job found before
migrating
Work, no job found
before migrating
average 7 northern EU1 43% 10% 12% 12% 10% 13%
average 6 southern EU2 29% 4% 3% 10% 14% 40%
Source: Eurostat – Labour Force Survey 2008
(1) unweighted average for Belgium, Germany, France, Netherlands, Austria, Sweden and United Kingdom
(2) unweighted average for Ireland, Greece, Spain, Italy, Cyprus and Portugal
This broad picture of mobility between countries is useful to contextualise methodological issues of measuring migration and underpinning the main drivers. However the aim of the ATTREG project is to consider inter-regional mobility in a way that moves beyond national contexts, and explore the degree to which regional characteristics mediate these flows (in a way that might accentuate or depress the national aggregate performance). Moreover, following the specification of this project, we have extended the study of mobility and its drivers to shorter-term flows (tourism), and considered the interrelations between flows of different nature and scope.
As far as migration is concerned, ideally we would have been interested in using a measure of each of the different types of flow noted above [ a)-d) at p. 1]. Yet difficulties in administrative definitions and recording of migrants across the 31 countries in the ESPON area limited us to a measure of net migration at the level of NUTS2 regions. These are problems and issues that had been well rehearsed in relation to the earlier ESPON 2013 “DEMIFER” project (ESPON, 2010). The main sources of data for the measurement of migration flows were thus:
• The DEMIFER project that supplied data on net migration, internal inter-regional migration (within member-states) and the demographic data underpinning the calculation of net migration by age cohort down to NUTS2 level;
• National statistics agencies provided the detailed migration data for the member-state case studies (in Denmark, Slovenia and England).
Thus the project team was able to capture overall patterns of mobility distinguishing between internal migration and net overall migration rate as well as distinguishing visitors between those

ESPON 2013 27
that arrived (or who were registered as resident) from another country and those that had arrived (or where registered as residents) within the country. Given the literature on migration that plots changing propensity to migrate based on age (see Pandit 1997 or Plane 1993) the project team was also able to construct a data-set that captured net migration over a 5 year period for three different age groups of working age adults (15-24 years, 25-49 years and 50 to 64 years) based on a residual population model (rather than observed rates of migration). This literature indicates that age is a significant predictor of migrating and motivations for mobility, with younger adults more likely to move regions either through looking for higher education or through looking for a first job (whether after attending university or instead of attending university). Theories of migration related to family cycle also indicate that there are particular moments in households where migration is more likely (marriage, divorce) as well as an emerging body of literature on lifestyle migration where lifestyle choices amongst older adults leave them to seek a better quality of life.
However at the level of NUTS2 regions the project team was not able to call upon a dataset that tracked the flows of migrants or visitors across Europe (i.e. data that included both an origin and a destination). The project team thus worked with mobility data observed at the point where the mobile individuals arrived.
Figure 3.1: Cross plot of the average annual number of internal migrants against the average net
migration flows into the region
It is also important to recall that the project team was using net migration data rather than data that recorded flows into and out of regions. Fig. 3.1 illustrates the point using the internal inter-regional migration data compiled by the DEMIFER project, plotting the average annual number of internal migrants against the average net migration flows into the region over the same period. Whereas for the 4-5 regions at the extreme ends of the range it is possible to say that high net migration flows did equate (on the whole) with higher net in-flows, for most regions in this data-

ESPON 2013 28
set higher net migration rates did not consistently equate to higher migration flows. Thus when using and interpreting net migration flows and rates as the variable for mobility, there is a need to remember that net migration data will pick out regions where there are imbalances in the in and out flows of migrants rather than picking out regions where the in and out flows are highest.
Thus the project team was able to add an important dimension to its consideration of mobility across Europe. There remain however important caveats on the migration data used within this project:
• Migratory flows recorded in “official” statistics will not capture all aspects of migration (e.g. informal or illegal forms of people movement)
• Migratory flows over different types of boundary (into the EU, between states in the EU, inter-regional and intra-regional movements) will each tend to have different (bundles of) migratory drivers
• Migratory flows over different scales of boundary (NUTS0-5) will imply a different magnitude of people flows
• Migratory flows tend to vary over a business cycle but the project team has only had access to data for a short period (2001-07) of relative prosperity and thus its observations will be limited to saying something about only part of the business cycle.
Our understanding of the motivations and drivers behind tourism flows is equally subject to the same degree of complexity. As stated in the first chapter of this report, given the policy focus on regional policy-makers making the most of their territorial assets as a recovery strategy (for example the Territorial Agenda 2020) and the potential role of tourism within such an approach, it is surprising that there is no explicit EU strategic spatial policy (or policy for what matters) dedicated to tourism.
The movement of short term visitors (such as tourists) have traditionally been neglected both from a disciplinary point of view in regional science and in terms of a policy focus that has either considered the economic impacts on places or the economic impacts on sectors rather than considering the role of leisure-motivated travel as an important economic driver. Visitors however today represent a non-negligible share of “regional users” for many regions of Europe and an urban population that may come to be quantitatively at par with other user (and consumers) groups in specific cities; what is most important in this study, tourism is increasingly being understood in the geographical literature as a form of short-term migration. As such flows of shorter terms visitors both relate to structural migration and processes of place creation (see for instance recent works by John Urry – e.g. Urry, 2007, and Sheller and Urry, 2006 - or for a methodological proposal Quaglieri Domínguez & Russo, 2010). Works by Williams and Hall (2000) and Hall (2005) have also started to explore the potential inter-linkages between tourism (visiting) and migrating, and given this migration-tourism nexus it is reasonable to expect that aggregate migration patterns may vary in relation to these three age groups. Moreover it has been by now extensively argued (cf. Ch. 1 of this Scientific Report) that tourism may be a key strategy for:
• the recovery of lagging regions
• the anti-cyclical absorption of workforce from declining sectors
• the promotion of regional identities and the establishment of territorial brands that are increasingly important in times of increased regional and urban competition.
Hence the necessity to extend this study of mobility and its drivers and spatial effects to this essential component. Tourism has not been a primary area of investigation for the ESPON programme, with only one project explicitly devoted to study its spatial patterns in an

ESPON 2013 29
exploratory way in ESPON 2006 (see below) and a few other projects in ESPON 2006 and 2013 incorporating tourism as a place specialisation in the construction of regional typologies.
A first project including tourism data, though not specifically oriented to tourism (ESPON 1.3.3 “The Impacts of cultural heritage and identity”) was tendered in 2004 and executed by a network of 10 research institutes led by Ca’ Foscari University of Venice.
Among others aspects more concerned with the cultural assets of regions, one of the key outputs of ESPON 1.3.3 was a typology classifying regions according to the fact that tourism could be considered a viable strategy to valorise cultural heritage and bring about opportunities for economic development especially in lagging regions, or was constituting an unsustainable source of pressure for the preservation and access to the cultural heritage to autochthonous communities (ESPON 1.3.3, map n. 5).
Figure 3.2: Tourism penetration index from ESPON 1.4.5.

ESPON 2013 30
In 2005 another “methodological” project was tendered, ESPON 1.4.5 “Study on spatially relevant aspects of Tourism”, and executed under the leadership of the EuroFutures institute. This project was explicitly dealing with the existing tourism data from EUROSTAT and a few other sources, and offered a broad picture of the main spatial dimensions of tourist flows and economic impacts throughout Europe. The Map 1.1 from that project, reproduced below (Fig. 3.2), illustrated a “Typology of tourism development based on Tourism Penetration Index” based on a non-weighted average of various indicators capturing the territorial effects of tourism: tourism expenditure per capita, density of tourists per 1,000 head of pop., and bed-places per km2.
The use of this map – which returns a multidimensional evaluation of tourism intensity in EU countries – in understanding the territorial dimension of tourism, however, resents from classic problems, like the limitation of scale (due to the fact that expenditure data are only available at national level), but also the inherent issue of national inconsistencies in the classification of tourism data, which plague EUROSTAT tourism statistics6, especially from the supply side. Moreover, while data allow distinguishing between arrivals from within a member-state and visitor arrivals from outside of the member-state, there is no detail about inter-regional visitor flows within neither states nor the possibility to identify “markets” and classify destinations according to the “type” of visitors attracted beyond the domestic/foreign binary.
Existing tourism statistics maybe used in connection to other ESPON typologies, for instance to identify the degree by which tourism may hinder or intensify spatial phenomena: it is the case of map 10.1 in ESPON 1.4.5, among many other, which generates a complex typology combining the Tourist Penetration Index seen above with an environmental hazard typology. But the focus on tourists as the object of research as mobile population remains poor.
The problems in studying the territorial dimensions of tourism have been addressed at a recent meeting of the UNWTO (“Second International Conference on the Measurement and Economic Analysis of Regional Tourism”, held in Bilbao 27-29/10/2011) where it was pointed out that apart from the methodological fallacies mentioned above there remains an issue of insufficient regional detail to study territorial effects of tourism, given by the fact that supply data are available at NUTS3 detail, but visitor movements at NUTS2, and this scale is arguably too gross to address the effects of a sector of human activity that is strongly concentrated in specific poles of attraction. Moreover there was mention of the incomplete regional cover and “structural breaks” that especially affect new member countries; of the scarceness or absence of data systematically available (especially at regional level) on fundamental aspects of tourism, such as sub-sectors (cultural attractions, restaurants, the tourism filère), tourist expenditure, investments, and quality; on short-term tourist mobility such as excursionism, day tourism, cruise ship passengers, etc., which are likely to produce the most unsustainable impacts; on second residence tourism and other “hybrid” form of tourism, like student exchanges, visiting friends or relatives, etc. , for which data are erratically collected.
As a consequence we do have a large number of national or regional outlooks over tourism trend but we miss the integral character, methodological soundness and analytic insight offered by other ESPON sectorial studies.
While we cannot and are not supposed to obviate for these problem in the ATTREG project we do believe that a certain level of detail has to be given in order to distinguish even among tourism mobilities. Visitor statistics as currently formulated in EUROSTAT do not capture the reasons for visiting and thus the project team has been unable to distinguish between different types of
6 It also does not include two “giants” in European tourism like Turkey and Croatia, which is understandable
as Candidate Countries were not covered in the ESPON 2006 project.

ESPON 2013 31
short term mobility that require hotel accommodation, but we did make a qualitative distinction between tourism forms or markets, looking at
• International tourism vs. domestic and proximity tourism – as captured by EUROSTAT visitor movement data discriminating by country of origin;
• “Traditional” conceptions of tourism (measured by tourist arrivals or overnight stays or bed-places in tourist establishments) vs. Emerging form of non-work related mobility, among which we have mostly focused on retirement and second-home tourism, and student exchanges.
To conclude, having assessed the availability and coverage of data at NUTS2 level across the ESPON area, the project team focused on five measures of mobility:
• Net migration into NUTS2 regions that were derived from statistics that register who is living in an area combined with statistics of births and deaths (ie they are not based on the observation of migration but are an inference on population statistics). These statistics were developed by an earlier ESPON 2013 project (DEMIFER) and was available annually for 2001-07 across all NUTS2 regions within the EU and EFTA area (not for Candidate Countries);
• Migration flows between NUTS2 regions within countries from data collected by the DEMIFER team for the period 2001-06. This data was available with both an origin and a destination (i.e. migrants could be tracked within countries);
• Visitor numbers gathered from tourism statistics (gathered by EUROSTAT) that measure the number of people arriving to stay in registered forms of ‘collective tourist accommodation’ (including but not just hotels). This was available annually for the period 2001-09 across the ESPON area and permitted visitors to be distinguished between those that were resident in the country where they stayed (‘domestic’ arrivals) and those visitors who were not registered as resident (‘foreign’ arrivals);
• The number of air passengers embarking and disembarking at airports within NUTS2 regions (EUROSTAT); and, finally
• The number of ERASMUS students studying within NUTS2 areas was available for the EU area for 2005 and 2007 at the level of the universities with the highest number of ERASMUS students.
In addition to these basic measures of mobility the project team was also able to derive net migration rates for three working age groups using the same technique as had been used for deriving overall net migration rates. The three age groups were selected as:
• A group aged from 15 to 24 years to capture movement by younger adults entering the labour market or looking to attend higher education;
• A group aged from 25 to 49 years to capture movement by mid-aged working adults who might be making decisions in relation to careers and starting families;
• A group aged from 50 to 64 years to capture a group of older working adults who might be making decisions in relation either to on-going career progression or to leaving the labour force.
Table 3.3 sets out the main characteristics of the flow indicators that we used.
The rest of this chapter will outline the patterns of inter-regional movement and mobility across the ESPON area.

ESPON 2013 32
Table 3.3: Short list of indicators of mobility with specifications
Audiences (flows) Indicator specs Time reference Geographical cover (missing data)
Migration rates
Net migration rate of cohort A of population
Cohort A defined as 10-19 y.o. in 2002, 15-24 y.o. in 2007. Net migration rate defined as change in cohort accountable by net migration
2002-2007 TR00
Net migration rate of cohort B of population
Cohort B defined as 20-44 y.o. in 2002, 25-49 y.o. in 2007. Net migration rate defined as change in cohort accountable by net migration
2002-2007 TR00
Net migration rate of cohort C of population
Cohort C defined as 45-59 y.o. in 2002, 50-64 y.o. in 2007. Net migration rate defined as change in cohort accountable by net migration
2002-2007 TR00
Net migration rate Average annual net migration rate for 2001-07 (net migrants per 1000 inhabitants)
2002-2007 No missing data
Internal immigration rate
annual internal inter-NUTS2 in-migration flow rate (per 1,000 residents), averaged on 2001-06 period
2001-2006 CY00; EE00; FR91; FR92; FR93: FR94: HR00; IS00; LI00; LT00; LU00; LV00: MK00; MT00
Internal out-migration rate
annual internal inter-NUTS2 out-migration flow rate (per 1,000 residents), averaged on 2001-06 period
2001-2006 CY00; EE00; FR91; FR92; FR93: FR94: HR00; IS00; LI00; LT00; LU00; LV00: MK00; MT00
Tourism visitation rates
Tourism pressure indicator
Ratio of total number of tourists (nationals) arrived at any types of accommodation by 1,000 head of population. Tourist data averaged over 2006-09 period; population data averaged over same period.
2006-09 No missing data
Tourism pressure indicator
Ratio of total number of tourists (foreign) arrived at any types of accommodation by 1,000 head of population. Tourist data averaged over 2006-09 period; population data averaged over same period.
2006-09 No missing data

ESPON 2013 33
Audiences (flows) Indicator specs Time reference Geographical cover (missing data)
Tourism pressure indicator
Ratio of total number of tourists (nationals and foreign) arrived at any types of accommodation by 1,000 head of population. Tourist data averaged over 2006-09 period; population data averaged over same period.
2006-09 No missing data
Other flows
ERASMUS students per 1,000 students studying for a degree
N. of ERASMUS students per 1,000 students enrolled at local universities, 2008-09, for the top 500 European universities participating to the ERASMUS program in terms of n. of incoming students. The "no data" class returns regions where ERASMUS student numbers in local universities are below this threshold.
2008-09 No missing data
3.2 People movement across Europe
The results of the estimation of net migration rates for the period 2001-07 are illustrated in Map 3. From the Europe-wide perspective, the map reveals a tendency for net out-migration from northern and eastern Europe (Poland, northern Finland, Bulgaria), but also including regions from within the European “Pentagon” in Northern France and parts of (mainly Eastern) Germany, with generally low levels of and net in-migration to a southern and western arc of Europe (in particular the Mediterranean arc of Spain, southern France and northern Italy). A more articulate analysis shows that net migration rates (positive or negative) are generally low in regions to the east and north, while they are consistently high (and pending to the positive side) to the west and south.
Main MEGAs areas, like Madrid, Amsterdam, Prague, also attract population as well as of some urbanised “intermediate” regions like Southern Sweden, Western Ireland, parts of Central Italy and of England. The coastal regions of the Mediterranean that are popular tourist resorts, like the Spanish coasts, Algarve, Central-Eastern Italy, Cyprus are also particularly dynamic, showing a trend for which tourism can be an “agent of urbanisation” attracting workforce and new “lifestyle” residents. The strongest economic core regions of Europe have a moderate attraction capacity with the exception of Paris, London and Berlin, which are probably starting to suffer from dimension (and congestion) diseconomies.
The general trend however is of a relative increase of population in more densely populated areas also within national systems, and of a severe population loss in Eastern countries and peripheral regions, while Eastern European capital cities reinforce their position (Prague standing out as the most attractive place in the 2004 enlargement area). Even within the de-populating north and east generally net migration rates to the NUTS2 region with the capital city are relatively high in comparison to the rest the nation state in which they are based thus within countries there is still on-going processes of centralisation around the primary city.
How does this picture break down with age? Flows by age groups show some distinctive characteristics with regards to where they are occurring.
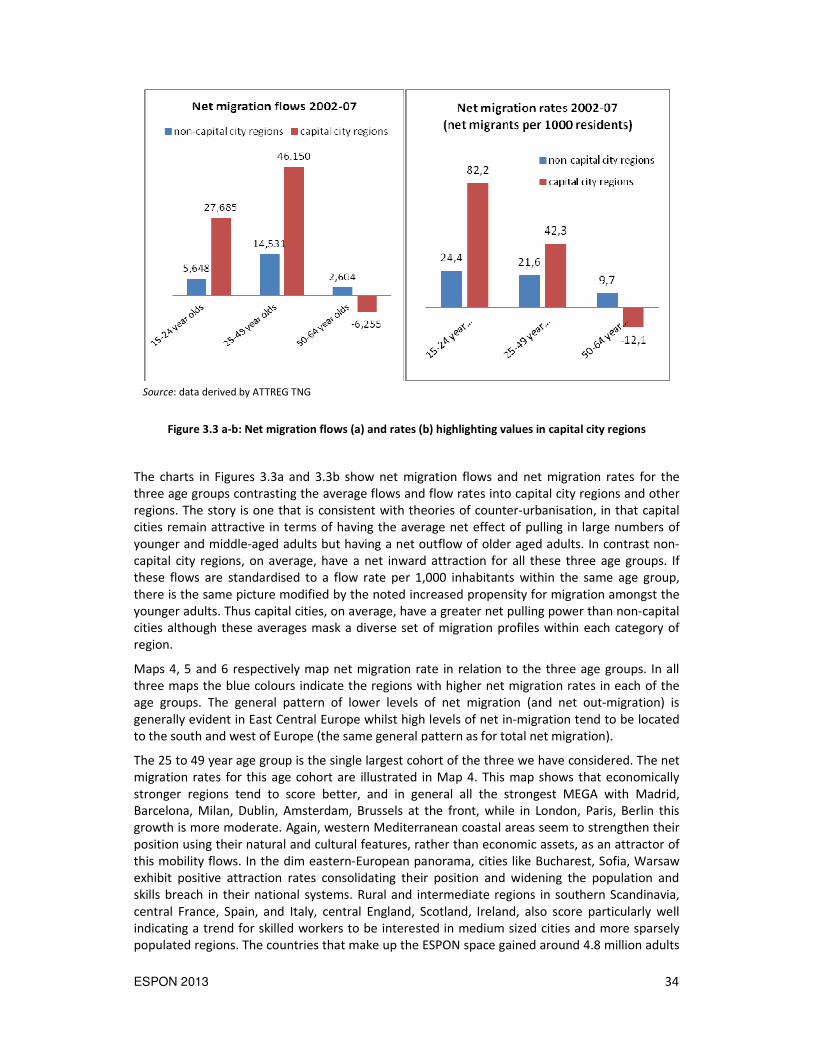
ESPON 2013 34
Source: data derived by ATTREG TNG
Figure 3.3 a-b: Net migration flows (a) and rates (b) highlighting values in capital city regions
The charts in Figures 3.3a and 3.3b show net migration flows and net migration rates for the three age groups contrasting the average flows and flow rates into capital city regions and other regions. The story is one that is consistent with theories of counter-urbanisation, in that capital cities remain attractive in terms of having the average net effect of pulling in large numbers of younger and middle-aged adults but having a net outflow of older aged adults. In contrast non-capital city regions, on average, have a net inward attraction for all these three age groups. If these flows are standardised to a flow rate per 1,000 inhabitants within the same age group, there is the same picture modified by the noted increased propensity for migration amongst the younger adults. Thus capital cities, on average, have a greater net pulling power than non-capital cities although these averages mask a diverse set of migration profiles within each category of region.
Maps 4, 5 and 6 respectively map net migration rate in relation to the three age groups. In all three maps the blue colours indicate the regions with higher net migration rates in each of the age groups. The general pattern of lower levels of net migration (and net out-migration) is generally evident in East Central Europe whilst high levels of net in-migration tend to be located to the south and west of Europe (the same general pattern as for total net migration).
The 25 to 49 year age group is the single largest cohort of the three we have considered. The net migration rates for this age cohort are illustrated in Map 4. This map shows that economically stronger regions tend to score better, and in general all the strongest MEGA with Madrid, Barcelona, Milan, Dublin, Amsterdam, Brussels at the front, while in London, Paris, Berlin this growth is more moderate. Again, western Mediterranean coastal areas seem to strengthen their position using their natural and cultural features, rather than economic assets, as an attractor of this mobility flows. In the dim eastern-European panorama, cities like Bucharest, Sofia, Warsaw exhibit positive attraction rates consolidating their position and widening the population and skills breach in their national systems. Rural and intermediate regions in southern Scandinavia, central France, Spain, and Italy, central England, Scotland, Ireland, also score particularly well indicating a trend for skilled workers to be interested in medium sized cities and more sparsely populated regions. The countries that make up the ESPON space gained around 4.8 million adults

ESPON 2013 35
in this age band over the period 2002-07 with the UK (around 530,000 net in-migration), Spain (around 1.7 million net increase) and Italy (around 1.2 million net increase) were the principal destinations7. The highest level of net migration in a NUTS2 region in Spain is 18% change in population through net in-migration.
By contrast Map 5 maps net migration rates for the age group who were 15 to 24 years old in 2007. Globally ESPON countries combined (excluding Turkey) gained 2.2 million adults in this age cohort over this period. Again the UK, Italy and Spain account for the largest numeric components to this increase (around 1.3 million net increase). Across Europe the average net migration rate for capital cities is around 8% increase in contrast to the mean of 2% for all other NUTS2 regions. Net migration rates for this age group correlate with net migration rates for adults aged 25 to 49 years in 2007 suggesting that in an aggregate sense these two age cohorts are finding similar types of area to be attractive.
Finally, Map 6 provides an insight into “silver migration”, which is proxied by the net migration rates of the 50-64 age cohort over the 2001-2007 period. Whereas the ESPON countries gained around 500,000 people over this period in this age cohort from outside of the ESPON area, the patterns of net in-migration vary slightly from the younger age cohorts. However the general pattern of net migration in this pre-retirement cohort correlates with that of the age cohort aged 25 to 49 years there is no correlation with net migration rates for the age cohort aged 15 to 24 years. We can thus hypothesise that the types of areas that attract this age group of “silver migrants” do not consistently attract younger migrants.
The “silver age drain” seems to be working from the north-east to the south west of Europe, also at the level of individual countries, towards regions offering higher place amenities, a better climate, and convenient properties, or inland regions well-known for their amenities like Dordogne. In numeric terms it is Spain, Italy and France that are net winners of population in this age cohort (posing important questions in terms of social security systems that may be analysed later in our project). Some NUTS2 areas in these countries are gaining as much as 6 to 10% of population in this age cohort as a result of net migration. Both the UK and capital cities become net losers of population in this age cohort. Peri-urban regions of large metropolitan areas also score very well to this respect (Flevoland in relation to Amsterdam, the Cornwall area, and the suburban rings of Prague, Vienna, and Castilla-La-Mancha in relation to Madrid. Paris and London, conversely, seem to be places from where many workers are likely to flee from as soon as they retire.
The analysis of this latest cohort brings us closer to a form of mobility that is increasingly disconnected from traditional neoclassical factors of having a good job and raising the family in a convenient place, and whose drivers are to some extent merging with those of tourists.
Next we take into consideration the “short mobilities”. The first is that of tourists. The countries with the largest number of yearly visitor arrivals in 2007-09 were Germany (128 million), France (124 million), Spain (100 million) and Italy (94 million), with hotspots in southern Spain and Catalonia, Paris and the lower Rhone valley, northern to central Italy. Classic destination regions in the Mediterranean Arc, including coastal resort areas, islands, as well as large urban regions like Istanbul and Barcelona, some metropolitan areas, with Paris, London, Amsterdam, Berlin, and Madrid on top, and a number of rural areas in Scotland, eastern France, central Italy, Sweden, receive the largest share of tourist flows. Anyway it is difficult to understand the significance of visitor numbers without giving some notion of their relative value either in terms
7 Our estimations for net migration in Ireland (Republic) and Cyprus at around 12% increase in the population in this age band due to net migration is an under-estimate because we do not have figures on how many people died in this age cohort over this period in the NUTS2 regions in these countries.

ESPON 2013 36
of the number of visitors per resident (a measure of potential social impact) or in terms of the numbers of visitors per area, giving an idea of ecological pressure.
Mapping visitor arrivals in 2006-09 (see Map 7) shows high levels of tourism activity in Italy, Germany, the Netherlands and the UK, and highlights the prominent position of “classic destinations” of different types: coastal, rural, islands, and urban. The “blue banana” regions on the whole score very well, confirming the hypothesis that within mobility flows it is increasingly difficult to distinguish between a purely leisure-driven mobility (traditional tourism), driven by climate and natural and cultural attractions, and other forms of temporary mobility, like congress and business tourism, health tourism, educational tourism, which seem to follow the logic of “GDP plus accessibility”. Some regions are clearly under-performing given their location and endowments (e.g. Calabria, Sardinia). The Tallinn-Helsinki cross-border region area offers an interesting insight of an intense flow.
The next maps are based on the index of “tourism intensity” that was used in our estimation model (visitors per 1,000 head of population), which represents the size of the “floating” tourist population in relation to that of the “stable” population in a region; it is an index frequently used in tourism studies to capture the socioeconomic pressure of tourism in a community. The picture of tourism activity calculated separately for domestic and international tourists, and mapped in Maps 8 and 9, reveals somewhat different patterns. While domestic tourism (Map 8) privileges rural and coastal areas within each country, international tourism (Map 9) clearly favours the Mediterranean arc, with coasts, islands and mountain regions at the forefront. France is the only country where tourism activity is mostly evenly spread in inland regions. Sparsely populated peripheral regions like Iceland, the north of Norway and the north of Scotland also get a high share of tourism activity. Among capital city regions, Prague, Vienna, Budapest, Amsterdam, Bratislava and Budapest seem to be the only ones that stand out even after the “urban smoothing” effect.
Finally, we considered the attraction of a non-conventional form of mobility which is statistically included in the category of tourism but obviously is removed from the organisational models and drivers of traditional tourism. Thus Map 10 returns the number of incoming Erasmus students in the academic year 2008/09 for the “top 500” universities in the ESPON space, normalised by the number of university students in regional universities in that same year. Clearly the ability of a NUTS2 region to attract ERASMUS students is somewhat dependent upon a university being located within it. With few exceptions (Paris, Lyon, the south of Sweden and Finland, Copenhagen) the general trend seem to favour exchanges in “amenable areas” rather than in places with the most famous and established universities; for instance the UK and Germany do not score particularly well (maybe due to language barriers), while the Mediterranean coasts and urban areas are very popular. Prague, Berlin, Budapest, Vienna also do very well in attracting Erasmus students.
Does this all appear to be spatially clustered? The analysis of the mobility data suggests that there is some spatial clustering in the patterns of net migration rates and in terms of the number of visitors per 1,000 residents (described here as tourism impact). Our measure of spatial clustering is the Local Moran’s I statistic that measures the likelihood of a similar value of mobility being a neighbour. Calculating the Local Moran’s I statistics identifies whether regions with low values of either net migration rate (per 1,000 residents) or of visitor impact (number of visitors per 1,000 head of population) are close to similar values of net migration or visitor rate. Figure 3.4 sets out the measure of Local Moran’s I for net migration rates for the period 2001-07. This suggests that there is a cluster of high net migration rate values for a western Mediterranean arc through Spain, Southern France and Northern Italy and a Western Atlantic arc through Western France, South Western England and Southern Ireland. Conversely there are clusters of regions with net out-migration rates through East-Central Europe and in the Eastern

ESPON 2013 37
half of Turkey. Turkey is interesting in that it demonstrates high net migration rate outlier regions around Istanbul and on the Mediterranean coast.
Legend: HH: clustering of high values LL: clustering of low values HL: high values of this indicator surrounded by low values LH: low values of this indicator surrounded by high values
Figure 3.4: Clustered values of net migration rate, 2001-07 (Local Moran’s I)
Fig. 3.5 repeats the mapping exercise for the total visitor arrival rate (the number of arrivals in tourist accommodation per 1,000 head of pop. in the region). Standardising visitor number

ESPON 2013 38
relative to the resident population starts to pick out rural areas that might have important populations of visitors relative to their resident population even if the absolute number of visitors is relatively small.
Legend: HH: clustering of high values LL: clustering of low values HL: high values of this indicator surrounded by low values LH: low values of this indicator surrounded by high values
Figure 3.5: Clustered values of visitor arrivals p. head of population, 2001-07 (Local Moran’s I)

ESPON 2013 39
Thus the clusters of regions with relatively large numbers of visitors relative to their resident population include such places as Cumbria (in England), Iceland and Swedish High Coast and Lapland are recorded as “high impact” regions. The regions with relatively high number of visitors relative to population form a more compact cluster than is the case for high net migration rate regions: this covers a restricted portion of the Western Mediterranean arc from Catalunya, Southern France (with Corsica) and Tuscany, and an Alpine arc from France through to Austria incorporating the regions located on the northern Adriatic Coast (Veneto). The cluster of regions with low numbers of visitors relative to population incorporates much of South-Eastern Europe and most of Turkey. These are places where there is a relatively un-developed tourism sector. The region of Piedmont in Italy stands out as poorly visited region in an area that generally welcomes many tourists, while the southern Turkish region including the large resort of Antalya, as well as Cyprus, stand out as “positive outliers” for tourism in an area that is generally poorly visited compared to its population size.
3.3 Regional typologies of people movements
There are two basic relationships explored in the people movement data: the relationship between visiting and migrating; and, differences in net migration by age. Regional typologies have been developed within the ATTREG project in order to capture a complex pattern of movements. The project team has used the technique of k-means clustering in order to generate plausible groupings of regions with similar characteristics for the chosen measures of mobility. Given the degree of spatial clustering demonstrated in Section 3.2 it would be reasonable to predict that the typologies might equally demonstrate regional clustering.
Map 11 illustrates a regional typology based on two mobility variables: the annual average net migration rate for the period 2001-07; and the average annual visitor arrival rate (for visitors both domiciled within the country and domiciled abroad) for 2001-04. The k-means clustering algorithm generates four clusters:
• Cluster 1 (2001-07) is made up of 93 NUTS2 regions (coloured brown in the map) where the average net migration rates over the period are either negative (there is net out-migration) or very small and positive combined with very low visitor arrival rates;
• Cluster 2 (2001-07) is made up of 157 NUTS2 regions (in green in the map) where net migration rates are positive (ie there is net in-migration) but small and where net visitor arrival rates are greater than for Cluster 1 but smaller than the other clusters;
• Cluster 3 (2001-07) is a small group of 16 regions (in pink in the map) where the net migration rates are markedly greater than for cluster 2 regions but this group have distinctively very high levels of visitor arrival rates; and, finally
• Cluster 4 (2001-07) is a group of 50 regions (in blue in the map) that have a range of net migration rates similar to that of Cluster 3 but a range of visitor arrival rates similar to that of Cluster 2.
Figures 3.6 a and b plot the basic mobility values in these clusters through a series of box plots. The box plot sets out the median value for the group (the thick black line) and the box plots the value of the 25th and 75th percentiles values of the group (the pale box). The whisker (line above and below the box) sets out a range of ”expected” values defined in relation to the inter-quartile range (the difference between the 25th and 75th percentiles) where outlier regions are given by a circle and “extreme” values are indicated by a star.

ESPON 2013 40
Thus these boxplots also start to indicate regions that are in some respects standing out from the cluster in which they are associated. In the case of the average net migration rates, six Turkish regions are given as either outliers or extreme values within the cluster (Cluster 1) to which they have been assigned. The data suggests that these regions (mainly Turkish regions along the Syrian and Eastern borders but also including Severozapaden in Bulgaria) have experienced very marked net out-migration. These extreme regions are amongst the poorest in the ESPON area. Equally within Cluster 4 there are three Spanish outliers (Valencia, Murcia and La Rioja) where net migration rates are markedly higher than the group to which they are attached.
This typology work suggests that there is a broad correlation between receiving visitors and net migration although there are clearly the 16 regions of Cluster 3 that are playing a more specialised role in attracting a high volume of visitors relative to their population. These regions are located in the Austrian Alps, along the Adriatic (Croatian), on Mediterranean Islands and along the Atlantic seaboard from the Algarve to Iceland. These are regional locations where special thought may be required to manage the pressure of tourism on their regional economies and societies.
Figure 3.6a-b: Box plots of net migration (a) and visitor arrival rates (b) by typology cluster
The conventional wisdom is that migrants are attracted by economic buoyancy and tight labour markets. In this case based on a comparison of labour market statistics averaged by regional category, the most attractive region type (cluster 3 or 4 for net migration) does not have the highest average GDP per capita nor has the tightest labour market for highly skilled workers. Although conversely regions with the lowest net migration rates and low visitor arrival rates consistently demonstrate lower GDP per capita and employment rates for workers with all forms of qualification.

ESPON 2013 41
Table 3.4: Labour market characteristics by cluster group for migration-visiting typology
N (number
of regions)
Average GDP per
capita 2001-03*
Average employment
rate for workers (25-64) 2001-03*
Average employment
rate for workers (25-
64) with tertiary
education 2001-03*
Average employment
rate for workers (25-
64) with primary
education 2001-03*
Cluster 1 (2001-07): low migration low arrival rate
93 € 10,011 60.3% 82.8% 43.1%
Cluster 2 (2001-07): mid migration mid arrival rate
156 € 23,468 71.0% 85.1% 57.4%
Cluster 3 (2001-07): mid migration high arrival rate
15 € 21,988 70.6% 85.1% 63.0%
Cluster 4 (2001-07): high migration mid arrival rate
50 € 22,337 68.5% 83.9% 59.5%
* Source: average (mean) calculated by ATTREG TNG based on data from Eurostat
Thus the labour market conditions (Table 3.4) are consistent with the idea that poor labour market conditions result in regions being unable to retain residents but it does not mean that competitive labour market conditions necessarily makes a region attractive. Considering labour market conditions alone it is clearly most advantageous for workers with fewer qualifications to consider economic migration since the differences in employment rates are greatest for this category of worker. In the case of employment rates for highly skilled adults (measured in terms of educational attainment) there is a very narrow difference between all four types of region. Repeating the exercise for incomes and for life expectancy reveals a similar split between the “less retentive” (Cluster 1) regions that are generally experiencing net out-migration (and population decline) and the other three categories. Thus although employment rates for more highly qualified adults are comparable across Europe, in the “more retentive” regions people on average earn more and live longer.
Table 3.5: Economic change by cluster group for the migration-visiting typology
change in GDP 2001-06
change in number of
persons aged 15 and above in employment
2001-09
average % of unemployed
(as % all adults) for
adults aged 25 to 64 years,
2007-09
Average proportion of
net migrants to the average number of
inhabitants in a 1 year age cohort aged between 20
and 24 years, 2001-04
Cluster 1 (2001-07): low migration low arrival rate
43.2% 5.0% 5.9% -12.2%
Cluster 2 (2001-07): mid migration mid arrival rate
27.3% 6.8% 4.2% 24.6%
Cluster 3 (2001-07): mid migration high arrival rate
29.0% 13.7% 4.1% 74.6%
Cluster 4 (2001-07): high migration mid arrival rate
38.8% 12.0% 4.7% 91.2%
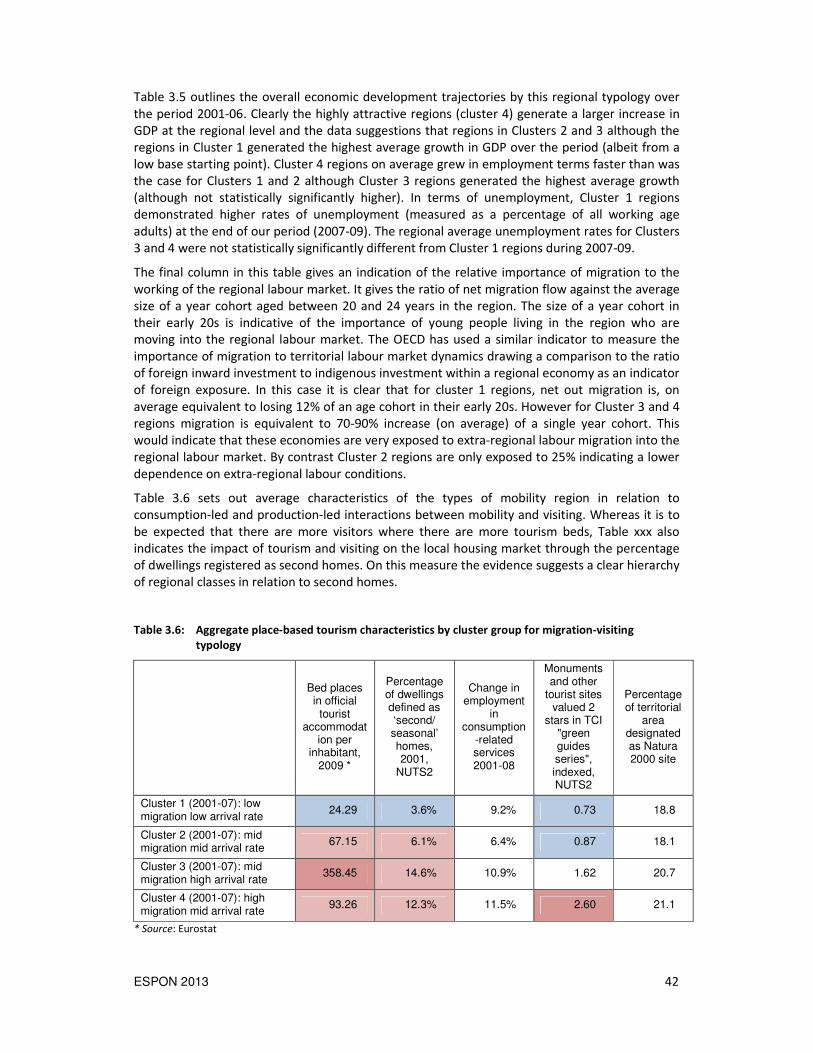
ESPON 2013 42
Table 3.5 outlines the overall economic development trajectories by this regional typology over the period 2001-06. Clearly the highly attractive regions (cluster 4) generate a larger increase in GDP at the regional level and the data suggestions that regions in Clusters 2 and 3 although the regions in Cluster 1 generated the highest average growth in GDP over the period (albeit from a low base starting point). Cluster 4 regions on average grew in employment terms faster than was the case for Clusters 1 and 2 although Cluster 3 regions generated the highest average growth (although not statistically significantly higher). In terms of unemployment, Cluster 1 regions demonstrated higher rates of unemployment (measured as a percentage of all working age adults) at the end of our period (2007-09). The regional average unemployment rates for Clusters 3 and 4 were not statistically significantly different from Cluster 1 regions during 2007-09.
The final column in this table gives an indication of the relative importance of migration to the working of the regional labour market. It gives the ratio of net migration flow against the average size of a year cohort aged between 20 and 24 years in the region. The size of a year cohort in their early 20s is indicative of the importance of young people living in the region who are moving into the regional labour market. The OECD has used a similar indicator to measure the importance of migration to territorial labour market dynamics drawing a comparison to the ratio of foreign inward investment to indigenous investment within a regional economy as an indicator of foreign exposure. In this case it is clear that for cluster 1 regions, net out migration is, on average equivalent to losing 12% of an age cohort in their early 20s. However for Cluster 3 and 4 regions migration is equivalent to 70-90% increase (on average) of a single year cohort. This would indicate that these economies are very exposed to extra-regional labour migration into the regional labour market. By contrast Cluster 2 regions are only exposed to 25% indicating a lower dependence on extra-regional labour conditions.
Table 3.6 sets out average characteristics of the types of mobility region in relation to consumption-led and production-led interactions between mobility and visiting. Whereas it is to be expected that there are more visitors where there are more tourism beds, Table xxx also indicates the impact of tourism and visiting on the local housing market through the percentage of dwellings registered as second homes. On this measure the evidence suggests a clear hierarchy of regional classes in relation to second homes.
Table 3.6: Aggregate place-based tourism characteristics by cluster group for migration-visiting
typology
Bed places in official
tourist accommodat
ion per inhabitant,
2009 *
Percentage of dwellings defined as ‘second/ seasonal’ homes, 2001,
NUTS2
Change in employment
in consumption
-related services 2001-08
Monuments and other
tourist sites valued 2
stars in TCI "green guides series", indexed, NUTS2
Percentage of territorial
area designated as Natura 2000 site
Cluster 1 (2001-07): low migration low arrival rate
24.29 3.6% 9.2% 0.73 18.8
Cluster 2 (2001-07): mid migration mid arrival rate
67.15 6.1% 6.4% 0.87 18.1
Cluster 3 (2001-07): mid migration high arrival rate
358.45 14.6% 10.9% 1.62 20.7
Cluster 4 (2001-07): high migration mid arrival rate
93.26 12.3% 11.5% 2.60 21.1
* Source: Eurostat

ESPON 2013 43
This table includes evidence of production-led interaction between visiting and migrating through changes in employment in consumption related services that would include retail and hospitality sectors (NACE sectors G-I) although the average figures mask a high degree of variation within each regional category. Cluster 3 and 4 regions however have experienced a larger average growth in employment in this sector over the period 2001-08 indicating that some regions may be experiencing a production-led interaction between tourism and migration in these regions. Combining this evidence with the evidence presented in Section 3.2 it is plausible to suggest that the extremely attractive regions have benefited (on average) from a visiting-migrating inter-relation that has particularly depends on contact with foreign born potential migrants in combination with local labour markets that have been relatively tight for relatively low skilled labour.
Thus in broad terms, there appears to be a set of regions that have a great capacity to attract and retain migrants and to attract visitors. The data suggests that much of East-Central Europe extending deep into northern and eastern Germany, the peripheral north of Scandinavia and the north-eastern France and southern Italy are relatively unable to attract either migrants or visitors. These are areas that appear to be relatively poor but equally appeared to have benefited from the re-balancing offered by migration patterns during this period. We will discuss later the policy implications of this situation.
A second regional typology by flows was developed looking at net migration rates by age group. This was a typology for which we were unable to generate data for Turkey but it does cover all EU27 member-states plus EFTA countries. Again a k-means cluster algorithm was used to generate four clusters (mapped in Map 12):
• Cluster 1 (age related) is made up of 152 regions (coloured green in the map) that demonstrate net migration rates around zero (a mix of net out and in migration rates) for the younger adults and older adult groups;
• Cluster 2 (age related) is made up of 82 regions (in pink in the map) that demonstrate broadly positive net in-migration rates for both younger and older adult groups (greater than cluster 1);
• Cluster 3 (age-related) is a group of 36 regions (in brown) that demonstrate relatively high net migration rate for younger adults but net out-migration rates for older adults (lower than Clusters 1 and 2);
• Cluster 4 (age related) is a small group of 21 regions (in blue) that demonstrate net positive migration rates for younger adults (similar to the range of Cluster 3) but net migration rates for older adults higher than for all the other clusters.
Figures 3.7 a and b plot the net migration rates for older and younger adults as box plots by cluster. As with the typology capturing net migration rate and visitor arrival rate, the box plots both capture the range of net migration rates in the data-set by each cluster and indicate outlier regions within each cluster. The net migration rates for older and younger adults are plotted because the spatial patterns of movement between these two groups were the least similar of the possible combinations of the three variables making up the typology.
The box plot for net migration by younger adults identifies a number of outlier regions. In Cluster 2 it is notable that there are three outlier regions: the Åland Islands (Finland), Cumbria and the Highlands of Scotland. These three regions are outliers in that the data suggests unusually high levels of net out-migration by younger adults. These three regions are included within Cluster 3 of the previous typology (migration and visiting) and thus experience very high levels of visitor arrivals per inhabitant. In these three cases one might pose the question as to whether there is a link between very high visitor arrival rates and exceptional out-migration by younger adults in

ESPON 2013 44
these three peripheral and rural regions. The outliers of age-related Cluster 3 pick out five regions with a large university presence (London, Vienna, Bremen, Hamburg and Groningen) and again it is tempting to hypothesise that the higher than expected net in-migration of younger adults is linked to the general out-migration of older adults in these city-regions.
For net migration rates amongst older adults, it is mainly Cluster 1 that demonstrates the presence of outliers and extreme values. Eight of these outlier regions are in France where net migration rates for older adults appear to be higher than might be expected for the age-related Cluster 1 in a set of regions neighbouring the Ile de France and in three of the DOM-TOM regions of France. By contrast the regions of Inner and Outer London (UKI1 and UK2 respectively) show outlier net out-migration rate values for older adults.
The regions in Cluster 3 appear to be the most interesting in this typology in terms of policy messages. This group includes many regions of capital cities such as Inner London, Paris, Berlin, Stockholm, and some other major economic hubs of Europe like Bavaria and the region of Frankfurt. These regions may have been so attractive to the point of having reached some sort of threshold by which, even if they continue being very attractive for starting workers, they experience problems retaining the older age groups possibly due to declining urban quality and high prices.
Figure 3.7a-b: Box plots of net migration rates by younger (a) and older (a) adults by cluster
3.4 Policy insights from regional typologies of mobility
The ATTREG typologies illustrated in 3.3 offer a first insights into classes of problems relative to regional attractiveness that should be addressed with specific local policies.
Starting with the regional typologies based on different wavelengths of mobility, we can identify four ideal situations corresponding to combination of high/low values of the two indicators on

ESPON 2013 45
which it is based: net migration rates and visitor attraction rates. Fig. 3.8 shows the approximate position of the four clusters identified with respect to these two discriminating variables, based on the central normalised values for each cluster. Though they don’t mach completely with the four quadrants of the scheme, this figure offer indications on the local responses that adapt to each situation.
Focusing on Cluster 4, which is almost coinciding with the first quadrant of this scheme (high visitor attraction rates and high retentiveness) these are the regions that we described as possibly “superheating” from excessive attractiveness due to factors that are not totally embedded in the local territorial assets, like the expansion of the tourist sector or other driving economic sectors whose capital structure is relatively more “footloose” and exposed to external shocks: for instance they have been the ones that resented more from the economic slump of the late 2000s.
+1 +2 +3 +4 +5−1−2−3−4−5
+1+2
+3+4
+5−1
−2−3
−4−5
+1+2
+3+4
+5−1
−2−3
−4−5
Net migration rate
Visitor arrivals per
head of pop.
CLUSTER 2
CLUSTER 1
CLUSTER 3
CLUSTER 4
Figure 3.8: Regional typology by mobilities attracted. Position of the four clusters
The other ideal combinations could be equally described in these terms. For instance regions in the second quadrant (characterised by higher-than-average visitor attraction rates and lower-than-average retentiveness) could be characterised as “revolving doors” regions whose main strength is the capacity to attract tourists and other shorter-term mobilities. This does not need be a bad thing (as emerged from our conversation with policy stakeholders during the ATTREG Second International Workshop, held in Tarragona on October 27, 2011) if it is the only available

ESPON 2013 46
attraction strategy, as is the case especially for small university cities retaining a medium-term population which does produce important “structural” impacts on the local economy and social capital. However, it might be the case that these regions should to more to try to retain these transient populations through a “rooting” strategy (for instance fidelising tourists into converting them in temporary residents or offering favourable housing conditions to young educated people at the end of their study careers).
Regions in the fourth quadrant offer no great insight except from the fact that they may be seen as having been successful in capitalising on their local assets for retention of the workforce in spite of their low capacity to attract visitors; finally regions in the third quadrant, that have low attraction rates for both migrants and tourists, are possibly the most problematic cases (in spite of the fact that this does not necessary means that their economic performance was bad, as noted earlier); arguably they could design a growth strategy based on an “attraction kick” in terms of attractiveness for visitors and short term mobilities (as having an event strategy, new and differentiated visitor attractions, or a new university) and using this potential to enhancing their human capital base in the medium term. In Fig. 3.9 we chart the four clusters and some of the regions that are therein included, marking in red the regions chosen as ATTREG case studies to illustrate the diversity of situations in this respect that we have addressed in the next step of our research.
Retentiveness
Visitor attraction
“Risk” regions – have capitalised on their attractiveness but possibly overheating
“Miracle” regions – Very good at retaining what they attract
“Revolving doors” regions –High attractiveness for fast mobilities as a potential “knowledge capitalisation”strategy
Problem regions – Not attractive nor retentive
“Slow down” approach needed?
Possibly a template for problem
regions?
Should be looking to retain
more human capital?
Do they need a kick in terms of
attractiveness, followed by a
long term strategy to retain?
Brussels
País Vasco
Ile de France
Attiki (Athens)
Hovedstaden(Copengahen)
Noord Holland (Amsterdam)
Istanbul
Inner London
Slovenia
Zuid Holland (Rotterdam)
Nord-pas-de Calais (LKT)
Lubelskie
Eastern Finland
Van (Eastern Turkey)
Vienna
Cyprus
CataloniaVeneto
Devon
Prague
Trento
Algarve
Cornwall
Salzburg
Balearic Isl.
Iceland
Figure 3.9: Mobility clusters and regional strategies

ESPON 2013 47
3.5 Cross-typological analysis
The typologies of mobility outcome described in Section 1.3 can be cross tabulated with other typologies in order to explore their significance. In this section we will run the two ATTREG typologies firstly against the national context typologies set out in Section 3.1 and then against a series of pre-existing ESPON typologies.
Table 3.7 cross-correlates the national context capturing aspects of the interaction of an indigenous and foreign-born resident populations with the typology capturing net migration and visitor arrival rates. Given the notion that international migrants might follow earlier waves of migration one might expect to see higher levels of inter-regional mobility in countries that have larger foreign born populations. This is broadly the case in Table x since membership of Clusters 2 to 4 (all indicative of higher net migration rates and high visitor arrival rates) is greater for regions in countries with more asylum-seeking and higher levels of foreign-born residents. By contrast 46% of regions in countries with less interaction with a foreign-born population belong to Cluster 1 that represents the regions with the lowest rates of net migration and visitor arrival rates rather than 18% of regions in countries with higher interaction with a foreign-born population.
Table 3.7: Interaction of foreign-born population and rates of mobility
national context typology 2: interaction with foreign born population
Cluster (2001-07) net migration and visitor arrival rate
country with relatively high levels of asylum seeking and foreign born visitors
country with relatively low levels of asylum seeking and low foreign born population
Totals
Cluster 1 (2001-07): low migration low arrival rate
Count 30 62 92
% within national context typology 2
18.3% 45.6% 30.7%
Cluster 2 (2001-07): mid migration mid arrival rate
Count 99 50 149
% within national context typology 2
60.4% 36.8% 49.7%
Cluster 3 (2001-07): mid migration high arrival rate
Count 7 5 12
% within national context typology 2
4.3% 3.7% 4.0%
Cluster 4 (2001-07): high migration mid arrival rate
Count 28 19 47
% within national context typology 2
17.1% 14.0% 15.7%
Total Count 164 136 300
% within national context typology 2
100.0% 100.0% 100.0%
Table 3.8 cross correlates the age-related net migration typology and the national context of intra and inter-national migration flows. This reveals statistically significant differences in membership of Clusters 3 and 4 cross the two contexts. Thus 17% of regions in countries where internal inter-regional flows are relatively important are within Cluster 3 in comparison to only 6% of regions in countries where international migration is relatively important. One interpretation of this observation is that older adults are more likely to migrate out of a region where there is a lot of inter-regional migration choice within their country of residence.

ESPON 2013 48
By contrast 12% of regions in countries where migration between EU member-states is relatively important were members of Cluster 4 in comparison to only 3.5% of regions where internal inter-regional migration was relatively important. This association suggests that high levels of attractiveness for working age adults may have been reinforced by international migrant flows over the period 2002-07.
The project typologies can also be compared to a series of typologies of geographical features developed by other ESPON project and incorporated in the ESPON 2013 Database. On the whole these ESPON typologies have been applied to NUTS3 regions and thus the project team has needed to aggregate them to NUTS2 level for this exercise.
The analysis of Section 3.3 suggested that mountainous areas were prominent within the regional clusters with the higher levels of mobility and thus Table 3.9 cross-correlates a regional typology that distinguishes between regions with mountainous areas and those that are not mountainous against the age-related migration typology.
Table 3.8: Interaction of migration origins and rates of mobility
national context typology 1: type
of dominant inter-NUTS2 movement
country where internal migration more important than intra-eu
country where intra-EU migration more important than internal migration
Totals
Cluster 1 (age-related): low young, low older
Count 89 60 149
% within national context typology 1
52.4% 52.6% 52.5%
Cluster 2 (age-related): mid young, mid older
Count 46 33 79
% within national context typology 1
27.1% 28.9% 27.8%
Cluster 3 (age-related): high young, low older
Count 29 7 36
% within national context typology 1
17.1% 6.1% 12.7%
Cluster 4 (age-related): high young, high older
Count 6 14 20
% within national context typology 1
3.5% 12.3% 7.0%
Total Count 170 114 284
% within national context typology 1
100.0% 100.0% 100.0%
Table 3.9: Interaction of age-related migration typology and mountainous regions
Aggregated regional typology for
mountainous areas
NUTS region with no mountainous area
NUTS region with mountainous area
Totals
Cluster 1 (age-related): low young, low older
Count 79 73 152
% within mountain typology
53.0% 51.4% 52.2%

ESPON 2013 49
Cluster 2 (age-related): mid young, mid older
Count 35 47 82
% within mountain typology
23.5% 33.1% 28.2%
Cluster 3 (age-related): high young, low older
Count 27 9 36
% within mountain typology
18.1% 6.3% 12.4%
Cluster 4 (age-related): high young, high older
Count 8 13 21
% within mountain typology
5.4% 9.2% 7.2%
Total Count 149 142 291
% within mountain typology
100.0% 100.0% 100.0%
This cross tabulation suggests that mountainous regions are in general more likely to attract higher net migration flows across all age groups with a higher membership of age-related Clusters 2 and 4. However membership of age-related Cluster 3 is higher for non-mountainous regions suggesting that the absence of mountainous environments (and the associated environmental amenity) may make regions less attractive to older adults (who subsequently out-migrate).
The distinction between the preferences of older and younger adults is reinforced in Table 3.10 that cross correlates capital city-regions and other regions with the age-related typology. In the Table 44% of capital city-regions are members of age-related Cluster 3 in contrast to only 10% of other regions. This again suggests that capital city-regions tend to experience net out-migration by older working age adults whilst experiencing high level of net in-migration by younger adults (see also Section 3.2).
Table 3.10: Interaction of age-related migration typology and capital city-region typology
Aggregated regional typology for
capital city-region
NUTS2 region without national administrative capital
administrative capital for nation-state located in NUTS2 region
Totals
Cluster 1 (age-related): low young, low older
Count 142 6 148
% within capital city typology
55.0% 24.0% 52.3%
Cluster 2 (age-related): mid young, mid older
Count 73 6 79
% within capital city typology
28.3% 24.0% 27.9%
Cluster 3 (age-related): high young, low older
Count 25 11 36
% within capital city typology
9.7% 44.0% 12.7%
Cluster 4 (age-related): high young, high older
Count 18 2 20
% within capital city typology
7.0% 8.0% 7.1%
Total Count 258 25 283
% within capital city typology
100.0% 100.0% 100.0%
ESPON 2013 50
4 TERRITORIAL CAPITAL
Antonio Russo
4.1 Methodology and data cover
In this section we turn to consider forms of territorial capital as potential determinants of attractiveness, and we analyse their distribution across the European territory and the main trends emerging from this picture. In general terms, this section provides an illustration of the distribution of specific kinds of “advantages” over the European territory. The main assumption is that regions endowed with specific forms of territorial capital (or bundles of them) are attractive to specific audiences; therefore characterising regions in terms of their endowment mix – summarised in regional broad typologies generated by clustering techniques – could cast some light on their potential attractiveness to a specific target group and on the assets that need to be enhanced or “mobilised” in order to liberate this potential.
The theoretical background and assumptions of our project (summarised in Section 1, but detailed in the First Chapter of the Scientific Report) give us some “hints” which place dimensions (captured by indicators) to include among the different classes of territorial capital as potentially attractive to certain audiences, and these are summarised in Table 4.1).
We thus complied a first “long list” which included more than 100 indicators, broadly relating to mobility drivers for specific groups.
• Environmental assets. We have collected data and built indicators regarding geographical and landscape characteristics, landscape quality and attractiveness, settlement structures, and climate.
• Economic and human capital assets. Economic endowments and human capital assets have been reunited in one group for the high level of association that they exhibit. They were captured as variables relating to the nature of labour market demand, investment, labour supply (the magnitude of the “creative workforce”), and wealth indicators, partly derived from sources in the ESPON database and EUROSTAT, partly estimated using various raw variables and geographical data (“pull potentials” based either on their relative rates of unemployment or related to differential levels of GDP per capita).
• Antropic assets. Among variable and indicators of the (quality of the) built environment we have included accessibility data (depending on the presence and quality of the transport infrastructure), “urbanisation” indicators, data referred to universities, cultural heritage and other tourism attractions and the number of congresses held in regions sourced from the ICCA database.
• Social and cultural assets. In this group we included socio-attitudinal data derived from the ESS survey, social composition variables (proportion of the population by age bands), life expectancy and other social data, plus socio-cultural variables that have to do with the diversity of the local population along ethnic and cultural lines, the dimension of the student community and cultural infrastructure data.
• Institutional assets. We included several variables and indicators that could be interpreted as the level and efficiency of public spending (recorded in terms of levels of service or levels of employment in the public sector) but also in terms of the potential impact of public policy on attractiveness (such as restrictions of labour market migration by nation states).

ESPON 2013 51
Table 4.1: Interaction of age-related migration typology and capital city-region typology
Audiences and underlying literatures considered
Young early career workers
Mid-career adults
Pre-retirement workers
Internationals tourists
Domestic tourists
Students and “creatives”
Territorial capital classes
Environmental X
(Implications of
Camagni’s territorial capital)
X
(tourism literature)
X
(tourism literature)
Antropic X
(Implications of
Camagni’s territorial capital)
X
(Implications of
Camagni’s territorial capital)
X
(tourism literature)
X
(Florida’s creative
class theory and tourism literature)
Economic and human
X
(neoclassical and systems theories on
labour migration)
X
(neoclassical and systems theories on
labour migration)
X
(tourism literature)
X
(tourism literature)
Social and cultural
X
(Florida’s creative
class theory)
X
(tourism literature)
X
(Florida’s creative
class theory)
Institutional X
(Implications of
Camagni’s territorial capital)
X
(tourism literature)
The research team has then reviewed these variables in relation to their time period coverage (for the baseline and subsequent time period), for territorial coverage and for their “goodness of fit” with the literature on mobility. Where variables demonstrate a high level of skewness in the frequency distribution (with a skewness measure > 2.0), the variable has been standardised as a natural logarithm. This has been done in order to ensure that our variables maintain a statistically “normal” frequency distribution (a condition assumed for many statistical tests). In addition each of the variables has been tested for its spatial autocorrelation (Global Moran’s I) to see to what degree the variable is spatially clustered.
Finally, we have tested the consistency between indicators within the same group and have eliminated those that were redundant due to a high level of correlation, bringing down their number to an “efficient” short list of 18 subdivided into the five territorial capital classes, as illustrated in Table 4.2. While not all of them are significant explanatory instruments of the flows of the audience considered over the study period, as will be shown in the next section, some of them are at least related to one. We note that of preference, we collected these data over the early part of the 2000s (depending on the availability of data, mostly by averaging annual values over the 2001-04 period, so as to smooth down yearly variations) in order to relate them with

ESPON 2013 52
flows activated over the next period in the mid-2000s (2004-07 of preference) and so allowing for a time gap which could capture an effect of “reputation building” for potential destinations.
Table 4.2: Short list of indicators of territorial capital with specifications
Territorial capital classes / indicators
Indicator specs Time reference Geographical cover (missing data)
Environmental capital
Tourism Climate Index in warm months
Tourism Climate Index averaged over months from April to September
(1)
1985 FR91; FR92; FR93; FR94
Tourism Climate Index in cold months
Tourism Climate Index averaged over months from April to September
(1)
1985 FR91; FR92; FR93; FR94
Climate variability Tourism Climate Index averaged over months from April to September
(1)
1985 FR91; FR92; FR93; FR94
Antropic capital
Monuments and other tourist sights indexed
Weighted average of "stars" in TCI guidebook series in each NUTS 2 area (assigning weigh 3 to "conjuncts" and 1 to individual monuments and objects), years 2001-2008
2001-08 No missing data
Gross population density Average of gross population density inhabitants per sq.kmq. over 2001-03
2001-03 FR91; FR92; FR93; FR94; PT20; PT30
Tourist accommodation capacity
Average number of bed places in all types of collective tourism establishments, 2001-03
2001-03 IS00; MK00
Metropolitan regions Dummy variable (1: NUTS2 region either contains or is part of a metropolitan region as defined by ESPON 1.4.3 project; 0: NUTS2 region does not contain or is part of a metropolitan region as defined by ESPON 1.4.3 project)
2001-03 No missing data
Accessibility population per hour travel time between NUTS2 centroids for road and ferry network (2005) and working age population (2001)
2001-05 No missing data
Rank of airport by number of air passengers
Rank of regional air passenger flows based on passenger movements through regional airports (averaged 2001-03) (1=busiest)
2001-03 No missing data
Economic and human capital
Public sector employment
Average proportion of employment in public administration and community services (NACE rev.1) 2001-03
2001-03 FR91; FR92; FR93; FR94; HR00; LI00; MK00

ESPON 2013 53
Territorial capital classes / indicators
Indicator specs Time reference Geographical cover (missing data)
Consumption-related employment
Average proportion of total employment in Wholesale and retail trade; hotels and restaurants; transport - all NACE (rev.1) activities, 2001-03
2001-03 FR91; FR92; FR93; FR94; HR00; LI00; MK00
GDP per capita average GDP per capita 2001-03 2001-03 IS00; LI00
Highly educated working age persons
average proportion of people aged 15 and above educated to ISCED level 5-6 as highest level 2001-03 ('000s)
2001-03 FR91; FR92; FR93; FR94; HR00; LI00; MK00
Dimension of the creative workforce
creative workforce (from ESPON creative workforce database – Territorial Observation n.5, 2011)
2001-04 FR91; FR92; FR93; FR94; HR00; LI00; MK00
Social and cultural capital
Satisfied residents Perc. of respondents in the European Social Survey who report being "satisfied with life as a whole" relative to the EU median score, 2002-2006
2002-06 CY00; DE50; DEC0; FI20; FR91; FR92; FR93; FR94; HR00; LI00; LT00; LV00; MK00; MT00; PT20; PT30; TR90
Dependency rate Average ratio of persons aged 65 and over to the working aged population aged 15-64 years, 2001-03
2001-03 HR02; HR03
University students Average number of registered university students per 1000 registered residents aged 15 to 24 years; proportion averaged for period 2001-03
2001-03 HR00; IS00; LI00; MK00
Institutional capital
Satisfaction with state of health services in country
Perc. of respondents who were more satisfied with the "state of health services in country nowadays" relative to the EU median score
2002-05 CY00; DE50; DEC0; FI20; FR91; FR92; FR93; FR94; HR00; LI00; LT00; LV00; MK00; MT00; PT20; PT30; TR90
(1): calculated according to the methodology developed by Mieczkowski Z. (1985)
In the next subsection we will provide a detail of the main trends exhibited by the spatial distribution of these values and their role as potential drivers of human mobility.
4.2 Endowments and spatial distribution of territorial capital assets
Environmental capital
Environmental assets are in part totally exogenous features of territories and in part the result of territorial management or specific policy initiatives. We wanted to capture both dimensions in the characterisation of a place as attractive and we kept in our database data on climate and its variability, as well as a dataset on the quality of preservation of the natural landscape.
ESPON 2013 54
As far as climate is concerned, we used a Tourist Climatic Index (based on a methodology developed by Mieczkowski (1985) based on a complex set of climatic properties that include temperatures, humidity, radiations, rainfall, etc., calculated by month at NUTS2 and NUTS 3 level. This Index serves to compare regions regarding the “attractiveness of their climate” for migrants, with the underlying assumption, derived from social studies, that the greater the “lifestyle” component of mobility as compared to the purely work-related drivers, this class of territorial capital becomes more important. Then climate is most important for tourists, but – increasingly – this criterion is seen to affect the location choices of immigrants, and especially those of the “cohort B” in our study, or mid-career workers, and more so those of the “cohort C” – pre-retirement migrants.
In Map 13 we map regions by their mean TCI index values for the warm period (April-September). It could be noted that in some cases (Spain, France) inland regions score better that coastal regions because they offer less weather variability and humidity, while Nordic coasts score as high as most Mediterranean coasts.
Map 14 charts instead the mean TCI index values for the cold period (October-March), and clarifies the much better position of southern and coastal regions to this respect. The indication that could be derived from these last two maps is that while in the winter “warmer” regions are clearly preferred as holiday locations, other regions that are currently underperforming as tourist destination have good chances to reinforce their tourist position in the summer and shoulder months.
However migration choices are mainly driven by the average climate throughout the year and are sensible to the variability of the weather: stable weather conditions are generally preferred (and offer more convenient residential opportunities) over regions with hot summers and cold winters. From this point of view, Map 15 returns the differences in the average TCI indexes between warm and cold periods in NUTS3 regions, and reveals more favourable conditions in the classic Mediterranean arc as well as in some eastern European regions.
Finally, the quality of the natural landscape can also be assessed in terms of the “natural attractions” that it includes. Map 16 returns the share of classified “Natura 2000” sites (from the European Environment Agency) at NUTS3 level. Obviously the map over-represents rural and peripheral regions but important urban regions (Madrid, Marseille, Rome), and intensely developed tourist region (the Venice province, the Canary Islands, the southern French coast) are also included among the first. This could be an interesting criterion to lower down the critical threshold of migration policies.
Economic and human capital assets
This “traditional” set of migration drivers should be mostly linked with the mobility of workers especially at initial stages of work careers: people move where’s there’s more and better job opportunities also by sector. Thus one first indicator that we considered in this group – which turned out to be a good proxy for almost anything else related with economic conditions driving the migration of workers in any age group – is per capita GDP, whose distribution – in Map 17 – returns the usual “pentagon” figure with a higher attractiveness of regions in the centre of Europe and in large metropolitan areas and national capitals.
However we should remember that one of the key assumptions of our study is that the causal relation between economic and social capital has become more complex and bi-directional in an era of accelerated mobility.
It is therefore also likely that the presence of a certain structure of human capital, explained by non-completely economic factors, may be a driver of investments, and consequently, of bringing more job opportunities into regions – thus Florida in his works postulates that “more attractive places” may well become those with the better economic conditions. Moreover, economic

ESPON 2013 55
conditions and the “consumption side” may also explain leisure mobility in complex ways – people travel to places where they feel more secure and where there’s a more advanced infrastructure (not to mention business-related travel), both reflections of a wealthy economy; yet convenience in terms of favourable exchange rates is also traditionally associated to choice of destinations especially for international tourism, thus giving an advantage to relatively backwards regions, functioning as an important means to bring foreign exchange in balance and reabsorb jobs lost in traditional sectors.
Though we also focused on the period 2001-03, the timing is problematic because mobility became slightly freed up after the accession of the EU12 in January 2004 but in practice (for the case of labour migration) most EU15 countries maintained limits on the movement of migrant workers for periods of between 2 and 7 years (Germany and Austria will continue to restrict the movement of workers from Poland up to 2011/12). Thus 2001-03 works for us in terms of analysing the conditions that pre-date any decision to move/travel.
Map 18 captures the potential quality of human capital in our NUTS2 regions. The map charts levels of educational attainment amongst working age adults aged 15 years or more (based on LFS estimates). Specifically the maps plot the proportion of working age adults with a tertiary level education (ISCED level 5 or 6) in 2001-03. The general distribution of people with a tertiary education is one that is biased towards Western Europe and Scandinavia. It is also a distribution that is biased towards capital cities. The general trend is for the proportion of working age adults with a degree to be on the rise in Europe.
Map 19 sets out the proportion of workers who might be labelled as having a creative occupation. This is a definition that is narrower than the one used by Florida as it mainly relates to artistic and creative occupations (rather than some of the more managerial and technical occupations identified by Florida and others). There is a strong association with between the presence of creative occupations and human capital.
Figure 4.1: Scatterplot of highly educated workforce and creative class

ESPON 2013 56
The scatterplot in Fig. 4.1 plots the proportion of creative workers and the level of educational attainment in the workforce more generally. It is thus not a surprise to see that the distribution of creative workers is broadly similar to that of the distribution of working age adults with a degree, from the previous map. The map highlights the importance of cultural employment in large cities, especially in Central-Northern Europe (but also in Madrid, Vienna, Rome), but also in countries which have characterised themselves with the high degree of “creativity” – or the capacity to elaborate cultural values into knowledge-based industries, like Finland (telecom), Sweden (design, electronics), the Netherlands (media, publishing), Switzerland (design, architecture).
Following, we consider the labour market structure in terms of the percentage of residents employed in two of three broad “service” sectors of the economy: employment within retail, wholesale, hospitality and transport sectors (NACE broad sectors – here labelled as consumption related employment), and employment within public administration and community services (public sector employment). Each of these sectors is taken as a proxy for the degree of dependence on visitor consumption activities (consumption-related services) and for the quality of public sector service provision in an area (level of employment in public administration).
Map 20 picks out areas for which consumption-related sectors are important for employment. Thus England is still a nation of shop-keepers and the coastal NUTS2 regions in Spain and western Italy are high in this type of employment probably because of tourism-related activities. The Tyrol in Austria, the Algarve in Portugal and the Balearic Island of Mallorca record the highest levels of employment in consumption-related services by LFS estimates for the period 2001-03.
By contrast, private marketed services might be thought of as being associated with the command and control functions of the global economy. Thus the London and Paris regions (along with Brussels, Madrid and Scandinavian capitals) demonstrate high levels of employment in this part of the service sector economy. These are forms of employment that are probably the most “footloose” of the service sector and most responsive to the differential geography of available and high quality labour.
Employment in the public administration, illustrated in Map 21, might be considered as suggesting the quality of publicly maintained place. Work in public administration might be indicative of the level of public and community services available in an area (i.e. more people employed as teachers, doctors and street cleaners). As these are funded by taxation one might think that the level of employment in public administration as a percentage of all employment is a measure of national wealth (although clearly levels of public administration employment will also be related to the relative capacity of wealth and the capacity of private sector services to meet need). Given the very place-based nature of public administration, it also indicates the degree to which local earnings are anchored in a region. NUTS2 areas with very high levels of public sector employment include very peripheral areas such as Nord-Norge (Norway) and northern Sweden as well as deprived and peripheral areas such as Northern Ireland and Merseyside in the UK (all these areas had more than 39% of employment in public administration in 2007-08). The lowest levels of employment in public administration were recorded in Turkey and Romania (around 11%).
Antropic assets
For antropic assets we have looked into measures of the intensity and quality of the build or “urban” environment. Obviously such features to not restrict to urban area but invest all urbanised environments, where included the more developed tourist resort areas, underlining the differential advantage in terms of attractiveness that urban areas have compared to non-urbanised or sparsely populated settlements, and mirroring the situation with “environmental” assets for which the latter regions are likely to be stronger.

ESPON 2013 57
In our final short list we eliminated as redundant various indicators related with the quality of urban settlements (i.e. green spaces) and some urban infrastructure (like congress facilities), and we were left with six explanatory measures whose spatial trends we illustrate below.
Regarding the cultural heritage and other tourist attractions and sights, we decided not to use the series produced by the ESPON 1.3.3 project, which according to the authors exhibit methodological inconsistencies across countries, and we built our own data series using a consistent source that is the guidebook series of the Touring Club Italy, covering all the ESPON space and CEC countries. This indicator returns places and individual monuments and sites with a certain number of “stars” measuring the tourist interest - not always a match for historical or artistic importance but the closer you can get with a certain degree of consistency between countries. Our data team picked only “2 stars” items and classified it as individual object or place with more attributes. The indicator returns the sum of all “stars” in a region per square km., i.e. their spatial density, a good measure of how attractive a place is for tourists but also for specific groups of immigrants whose choice of destinations is driven to some extent by the “status” of locations. It shows the overall advantage enjoyed by Mediterranean regions, and especially Italy (which concentrated the largest part of the European cultural heritage, including UNESCO world heritage sites), but also France, Germany, the UK and large parts of Eastern Europe. However the largest values are obtained by large historical metropolitan cities like Brussels, Inner London, Prague, Vienna. To eliminate the “urban effect” (large cities are more likely to have more monuments) we have created an index that assigns more value to individual sites than to individual monuments and objects in relation to size. This index is represented in Map 22. Italian, and then German, French, Belgian, and Polish regions emerge as consistently strong, though Brussels, Inner London, Prague, Vienna still lead the list.
Tourist accommodation capacity is a good indicator of the capacity of places to cater for tourist and other short mobilities collective. The relation with tourist flows is certainly circular – attractive places for visitors (for any reason) normally are those more likely to develop an important and diversified accommodation infrastructure, but not all places have the same capacity to this regard, mostly due to planning restrictions, degree of openness to tourism, and the specific segments of visitors attracted. In this sense the prevision of accommodation has become an additional explanatory variable of the performance in attracting flows, and as a consequence, certain places have adopted a supply-side strategy, strongly relying on scale returns, to develop as tourist destinations – “if we build, they’ll come” – generating a sort of “artificial” attractiveness which is mostly popular among seaside resorts. Map 23 returns these levels of “tourist intensity” and shows the primacy of south-western European regions and coastal regions as well as metropolitan areas in offering this infrastructure, even when confronted with a more distributed “attraction potential” from cultural and natural assets as in the previous maps.
As a measure of infrastructure that facilitates accessibility we have considered airports, and specifically their ranking in terms of passenger traffic. Airports ranking higher have a greater capacity to attract visitors and other migrants by offering easy (and cheap) access to destination regions, this also suggests that investments in airport infrastructure and the development of routes is likely to make a difference in the attractiveness of regions, as it is confirmed by other studies (among which the ongoing TRACC project). Map 24 charts this indicator and suggests that not all “potentially attractive” places offer a good level of access while others (as in the case of southern Turkey and Scandinavia have boosted their accessibility in this way.
To capture other forms of accessibility (and the enabling infrastructure) we calculated an index as sums of accessibility scores for the working age population between NUTS2 centroids by for the road and ferry networks. The result is returned by Map 25, which shows the familiar picture of the greater advantage enjoyed by regions at the European core compared with the periphery.

ESPON 2013 58
Finally we considered urbanisation, captured by gross population density in Map 26, as a good proxy of the potential attractiveness exerted by “urban” environments, bringing together many other forms of antropic capital that are not easy to measure, while in the next Map 27 we chart NUTS2 regions including at least one MEGA. Cities – and especially larger ones and national capitals – attract larger flows of all types and the increasing share of urban tourism among tourist flows, signalled by authors such as Richards (2007), is a further sign that work-related and leisure mobilities are converging.
Social and cultural assets
These set of territorial capital assets are the hardest to measure because mostly they rely on “soft” factors related to laces and their societies which are not normally available at least with a compete EU regional cover. We thus relied in some proxies of socio-cultural attributes.
A set of “socio-attitudinal” indicators (elaborated on the basis of ESS data, calculated and averaged over the 2002-2006 period) are used to derive the next Map 28, which returns the share of respondent in the area who were "satisfied with life as a whole" relative to the EU median score. If any message can be derived from this maps, is that regions that score high in this respect are those who are less likely to generate “lifestyle” migration – people from these areas could decide to move away for economic or health reasons but it is unlikelier that they would move purely to find a better socio-cultural environment. On the other hands the maps disclose a “dissatisfaction” which is clustered in Eastern and North-Eastern European regions (but note the “unhappy” situation of Italians, whose younger generations are indeed among the first fleeing their country in search for better socio-cultural environment according to recent surveys, thus necessarily not in search for better jobs but of a better living climate).
Map 29 returns the number of students at universities in the region as a proportion of 15-24 year cohort in 2001-03, showing areas which have been particularly successful in attracting young talents because of their higher education facilities, with national systems but possibly also in the European context. The presence of a relatively large pool of young educated people (although on a temporary basis as a non-resident student population, using a data set of registered students in regional higher education facilities provided by DG Education) is a form of socio-cultural asset, attracting other groups (e.g. firms looking for a good labour and knowledge pool, and thus, more workers), and in any case captures the “cultural vivacity” of areas that host a large student population, considered attractive by authors such as Russo and Arias-Sans (2009). The map shows high percentages of students at universities in Central Italy, Northern Spain, Northern Greece, Poland and Scandinavia, and surprisingly lower rates in core regions in Europe (possibly indicating that areas with higher unemployment are those that push a larger share of young people to obtain higher education diplomas).
The opposite picture is represented by ageing. We included a measure of the dependency rate of the resident population in Map 30 which illustrates the demographic problem of Europe’s periphery but also of some core areas like north-central Italy and France.
Institutional assets
After considering many different measures of the institutional capital of regions, expressing a potential attractiveness due to specific political structures or policy regimes as well as an efficiency of services, we decided to use only one indicator that synthesises this concept correlating very well with all other alternatives – social satisfaction with a key public provision that is health services. Map 31 returns this value, derived from the European Social Survey, and shows the higher perceived institutional capability of regions in the North and West of Europe, with a special mention of Belgium, Finland, Iceland, the Copenhagen region, and the Italian autonomous region in Val d’Aosta, while surprisingly also central Eastern Turkish regions score well to this respect.

ESPON 2013 59
4.3 Regional typologies of territorial assets
The maps and illustrations of the previous subsection offer a complete but somewhat intricate picture of the overall distribution of “advantages” of different types for the attraction of audiences over the ESPON space. To simplify its general interpretation we created five synthetic indicators by classes of territorial capital, obtained as weighed averages of the normalised values of basic indicators considered in each group, and a global synthetic typology (obtained from these five synthetic indicators through a k-means clustering procedure) illustrating the different specialisations of regions in terms of their “endowment” mix with different forms of territorial capital. The five class indicators are shown in the Maps 32 to 36.
Environmental capital (Map 32) is richer in regions that are comparatively warmer and more stable in terms of climate, but also by regions characterised by high standards of landscape management; thus the overall distribution does not show a clear spatial pattern but it does highlight that most Mediterranean coasts, though attractive in terms of climate, may have been “overdoing” in terms of construction and landscape change (e.g. the southern and eastern coast of Spain and southern and insular Italy) and that peripheral regions at the eastern edge of Europe may offer an advantage to this respect, counterbalancing population loss with a high potential as destinations for tourism and retirement migration.
A comparatively opposite picture is offered by economic and human capital (Map 33), which is richer in the core of Europe and especially in metropolitan areas, as well as in some of the tigers of the European economy of the early 2000s and in mature tourism destinations, while it underplays peripheral and rural regions of Europe and CECs. Antropic capital (Map 34) is richer in the European core and in more accessible regions and metropolitan areas, though the Mediterranean coasts, including some backwards regions in Italy and Croatia, are also very well endowed due to their extraordinary offer of cultural assets. Catalonia stands out as one of the regions with the richest endowment in this respect.
Socio-cultural capital (Map 35) definitely puts a prize on “welfare” regions in Northern and North-western countries, like Scandinavia, the Netherlands, and Ireland, as well as some Alpine regions, though capital cities all over Europe seem to enjoy an advantage, and the position of Turkish regions also returns as very favourable to this respect. Finally, having considered only one indicator for institutional capital, this picture is the same as in Map 36, showing a greater potential attractiveness of western, alpine and northern European region as well as Turkey.
The synthetic typology illustrated next provides an insight of what the most attractive regions for specific audiences could be. The details of this clustering procedure are shown in Table 4.3, while Table 4.4 returns some key information for the five clusters created in this way.
Table 4.3: Final cluster centres from 5-means clustering procedure of values of synthetic indicators of
territorial capital
Cluster
1 2 3 4 5
n. of cases in each cluster 81 40 37 87 53
Synthetic indicator of Antropic cap. -.028 -.151 .066 .182 -.110
Synthetic indicator of Economic-human cap. -.368 -.415 .915 .372 -.316
Synthetic indicator of Environmental cap. .353 .218 -.355 -.358 .197
Synthetic indicator of Institutional cap. -.502 -1.075 .952 .590 -.056
Synthetic indicator of Socio-cultural cap. -.685 -2.338 2.668 -.246 1.222

ESPON 2013 60
Table 4.4: Characteristics of five classes of regional typology by territorial capital endowments
characterised by includes:
Cluster 1 • High environmental capital • NW Spain, Lisbon, South-insular Italy
• Average-low antropic capital • Rural regions in Germany, PL, FR
• Low economic and institutional capital • Estonia, Greece, parts of BG
• Low socio-cultural capital
Cluster 2 • High environmental capital • Portugal (exc. Lisbon), Greece
• Low antropic and economic cap. • Lagging regions in Italy, France
• very low institutional and sociocultural capital
• SK, parts of East Germany
• • Almost all RO and BG
• • Some regions UK, Cornwall
Cluster 3 • very high economic, institutional, socio-cultural capital
• Urban Benelux
• average antropic cap. • Alpine regions
• low environmental cap. • Capital cities in East and north of Europe
• • Most Scandinavia
Cluster 4 • High institutional and economic cap. • West Mediterranean arc
• Average high antropic cap. • Industrial areas in northern Spain, France, UK
• Low environmental and socio-cultural cap.
• Austria
Cluster 5 • High socio-cultural cap. • Turkey
• Average-high environmental cap. • Continental Sweden
• Average-low institutional and antropic cap.
• parts of Northern Europe
• Low economic cap. • Capital cities of southern Europe
Thus, the five classes could be characterised in the following general terms, which obviously are subject to a certain degree of inaccuracy due to the statistical technique adopted (weighs to the various indicators used in the construction of synthetic indexes have been given on the basis purely subjective considerations). The resulting typology is illustrated in Map 37.
• Cluster 1 includes mostly regions that could be characterised as “Mid-tier urban regions and islands”, whose potential attractiveness is mostly due to a high provision of environmental capital and have a high potential to attract a certain type of mobility that is mostly appreciative of good environmental conditions

ESPON 2013 61
• Cluster 2 includes lagging and mostly rural regions, again characterised by generous endowment of environmental capital but low levels of all the other forms of territorial capital, which underplays their general attractiveness for any audience
• Cluster 3 includes mostly regions characterised by a welfare state in predominantly small size countries, as well as some of the economic powerhouses of Europe, whose only low point is the environmental capital provision; they are likely to result as the best endowed regions to attract work-motivated migrants and especially young starters
• Cluster 4 includes mostly tourist destinations and regions in economic transition that do not score too well in terms of their environmental and socio-cultural capital, but offer adequate level of infrastructure and economic stability
• Cluster 5 includes mostly dynamic regions in transformation, whose main source of territorial capital is the socio-cultural one but also enjoy high levels of environmental capital, resulting potentially attractive for a certain type of lifestyle migration
In the next section, these considerations of potential attractiveness will be contrasted with the reality of mobility in Europe in the last decade.

ESPON 2013 62
5 PATTERNS OF ATTRACTIVENESS OF TERRITORIAL CAPITAL
Ian Smith
5.1 Methodology
In order to explore the relationship between our measures of mobility (the ‘outcome variables’ - see Chapter 3) with our measures of territorial capital (the ‘dependent’ or ‘input’ variable - see Chapter 4) the project team has used the statistical technique of regression analysis to explore the statistical relationship between our chosen outcomes and our chosen inputs. As set out in Chapter 4 the project team has concentrated on generating indicators that represent the wide range of territorial assets that existing literatures on regional mobility claim as having an impact on mobility choices made by inter-regional movers.
Regression analysis is a technique that can be used to:
• Explore the statistical relationship between outcomes and territorial assets in a way to generate insights about actual processes that link territorial assets within regions to mobility outcomes, as which sets of territorial assets may be more important than others. The existence of a statistical relationship between two variables is not enough on its own to prove a real cause-effect relationship between them but it is indicative that this may be the case;
• Develop a series of equations that the project team will subsequently use in generating a model for considering the potential impact of “policy experiments” (see Chapter 7);
• Identify regions where the data on territorial assets suggests different outcomes (in terms of migrations and visits) than are actually “observed” in the data. These unusual regions are described as “outlier” regions.
Regression analysis results in an equation where the variable of interest (migration or visiting) is predicted on the basis of knowing what the regional territorial assets are in the first place. It then allows picking out regions where the territorial assets do not seem to match the resulting observed migration or visitor number outcomes. Where there are differences between the predicted and measured values of mobility, it is indicative of an “unusual” region. The analysis of such unusual cases or outliers is carried out by comparing the characteristics of these unusual regions to the main body of regions. In the context of this research it is possible that it is amongst the outliers we are most likely to see the impacts of governance, either as a result of governance networks failing to mobilise assets (and thus appearing to attract fewer net migrants or visitors than expected on the basis of territorial endowments) or a result of governance networks making much of the assets they do have (and thus appearing to attract a lot more net migrants or visitors than predicted).
5.2 The attractiveness of territorial capital
The analysis of attractiveness was based on measuring the degree to which the observed levels of net migration and visiting are associated with our different measures of territorial assets. This section will explore these levels of association in relation to:
• Two time periods (2001-04 and 2004-07) that reflect the accession of 10 new member-states on January 1, 2004;

ESPON 2013 63
• Comparing net migration flows and visitor numbers;
• Comparing net migration flows by age group; and,
• Comparing visitor numbers by domiciled origin of visitor (domestic and foreign).
The basic structure of the analysis was to statistically associate the different measures of mobility against a constant set of territorial assets and thus get a sense of the relative importance of the same set of assets to different forms of mobility.
Table 5.1 outlines the results of the regression analysis on overall net migration for the period 2001-07. The table shows the standardised beta coefficients for the analysis, where the higher the coefficient the more important changes in the variable are in terms of predicting changes in overall net migration. The column marked ‘significance’ returns the degree of statistical confidence we can have that the statistical relationship matters (or the degree to which the relationship is not just a result of random number crunching). The regression exercise has been carried out for three different time periods (2001-04, 2004-07 and for 2001-07 overall) in order to check whether the accession of 10 member-states in January 2004 might have made a significant impact on the relationship. This table also reports the degree to which the regression equation can “explain” (in a statistical sense) the relationships between the outcome variables (net migration flow in this case) and the variables for the territorial assets. As a rough guide, the higher the R-squared value, the better the regression equations can predict the value of the outcome variables. Given that the relationships we are dealing with are very complex, R-squared values of 45-47% are high, indicating that the regression analysis captures some important aspects of the statistical relationship.
In terms of the interpretation of Table 5.1, five measures of territorial assets are consistently identified as having a statistically significant relationship with net inter-regional migration rates over the different time periods:
• the number of bed spaces in tourist accommodation (an4) where the more bed spaces there are, the higher the net migration flow;
• the difference in seasonal climate index (env1), where regions with a smaller difference in the winter and summer indices are associated with higher net migration flows;
• the proportion of resident working age adults employed in public services (in2), with the greater the proportion the lower the net migration flow;
• the number of registered students in higher education per 1,000 residents aged between 15 and 24 years old (soc1), where the higher the ratio, the higher the net migration flow;
• the greater the number of resident respondents reporting a level of general satisfaction with life over the European median response (soc2), where the greater the proportion of satisfied residents, the higher the net migration flow.
In addition to this there appeared to be a positive relationship between metropolitan regions with a higher proportion of residents educated to ISCED level 5-6 and above, which resulted in a relationship either with the metropolitan variable (an5) or with the level of qualifications in the resident population (ec2).
However the existing literature on migration (cf. Ch. 1 of this Scientific Report) would suggest that migrants in at different ages might be driven by different attracting factors. The influence of age was explored by developing three measures of net migration over a five year period (2002-07) for three age groups: a group of younger adults aged from 15 to 24 years, a group of early to mid-career adults aged from 25 to 49 years, and a group of older working age adults aged between 50 and 64 years. These measures of net migration flow were regressed against the

ESPON 2013 64
measures of territorial capital and the results are given in Table 5.2. As with Table 5.1, Table 5.2 returns the degree of confidence in the overall prediction (the R-squared value), the standardised Beta coefficients from which one can understand the relative importance of the variable in the calculation, and the degree of statistical confidence that we can have in whether the variable contributes at all to the equation.
Table 5.1: Significance of statistical relationships between net migration flows and territorial assets
territorial asset variable
Standardized Coefficients for 2001-04 (R2 = 45%)
Standardized Coefficients for 2004-07 (R2 = 47%)
Standardized Coefficients for 2001-07 (R2 = 47%)
Beta sig Beta sig Beta sig
an1 index of monuments and other tourist sites valued 2 stars in TCI "green guides series"
.013 .010 .030
an2 Average gross population density (persons per sqkm)
-.035 .011 -.046
an3 Averaged rank of regional air passenger flows based on passenger movements through regional airports(1=busiest)
-.096 -.071 -.121 **
an4 Average number of bed spaces in collective tourism establishments (number)
.433 *** .430 *** .397 ***
an5 sum of population accessibility scores (working age population accessibility per hour travel distance)
-.063 -.041 .000
an6 dummy variable for metropolitan NUTS2 region .121 ** .094 .079
ec1 average GDP per capita -.036 -.016 -.124
ec2 Average proportion of people aged 15 and above educated to at least ISCED level 5-6
.115 .208 *** .191 ***
ec3 Average proportion of total employment in Wholesale and retail trade; hotels and restaurants; transport - NACE (rev.1) activities
-.036 -.013 .032
env1 difference between average warm and cold season tourism climate index
-.305 *** -.303 *** -.297 ***
env2 percentage of land area covered by Natura 2000 designation
.097 * .035 .051
env3 dummy variable for being a coastal region -.068 .001 .011
env4 dummy variable for being an island region -.069 -.066 -.092 *
in1 % of respondents who were more satisfied with the "state of health services in country nowadays" relative to the EU median score
-.029 -.094 -.075
in2 Average proportion of employment in public administration and community services (NACE rev.1)
-.217 *** -.261 *** -.258 ***
in3 number of NUTS2 region within country in which located
.041 -.024 -.012
soc1 Average number of registered university students per 1000 registered residents aged 15 to 24 years
.124 ** .186 *** .190 ***
soc2 % of respondent in the area who were "satisfied with life as a whole" relative to the EU median score
.218 ** .186 ** .230 ***
soc3 Average ratio of persons aged 65 and over to the working aged population aged 15-64 years
.071 .087 .103 *
Significant at 10%: *, Significant at 5%: **, Significant at 1%: *** for OLS regression

ESPON 2013 65
The picture given through Table 5.2 is complex, reflecting the complex reasoning behind migration decisions. Yet the important outcome is that for the different age groups, different territorial assets become important; and that the same territorial asset mind be interpreted as attractive for one age group but not for others. Globally, the regression analysis is better placed to explain the territorial assets that might attract higher net migration flows of younger adults than for older adults because of the higher R-squared value of the regression equation. This might be the result either of older net migration patterns being more complex (for example older people dividing into “lifestyle” migrants and “ongoing career” migrants) or because the territorial asset variables are less able to capture the things that attract older working age people.
Table 5.2: Significance of statistical relationships between net migration flows by age group and
territorial assets
territorial asset variable
Standardized Coefficients for 15-24 year olds
(R2 = 53%)
Standardized Coefficients for 25 to 49 year olds
(R2 = 49%)
Standardized Coefficients for 50 to 64 year olds
(R2 = 36%)
Beta sig Beta sig Beta sig
an1 index of monuments and other tourist sites valued 2 stars in TCI "green guides series"
.090 * .158 *** -.145 **
an2 Average gross population density (persons per sqkm)
.201 *** .000 -.177 ***
an3 Averaged rank of regional air passenger flows based on passenger movements through regional airports(1=busiest)
-.186 *** -.121 ** .079
an4 Average number of bed spaces in collective tourism establishments (number)
.292 *** .349 *** .408 ***
an5 sum of population accessibility scores (working age population accessibility per hour travel distance)
-.109 -.086 -.055
an6 dummy variable for metropolitan NUTS2 region .091 .097 * .100
ec1 average GDP per capita .150 * -.028 -.246 ***
ec2 Average proportion of people aged 15 and above educated to at least ISCED level 5-6
.161 ** .214 *** -.039
ec3 Average proportion of total employment in Wholesale and retail trade; hotels and restaurants; transport - NACE (rev.1) activities
.002 .016 -.035
env1 difference between average warm and cold season tourism climate index
-.180 *** -.301 *** -.262 ***
env2 percentage of land area covered by Natura 2000 designation
.074 .060 .049
env3 dummy variable for being a coastal region -.183 *** -.088 .060
env4 dummy variable for being an island region -.086 * -.106 ** -.021
in1 % of respondents who were more satisfied with the "state of health services in country
.007 -.077 -.009
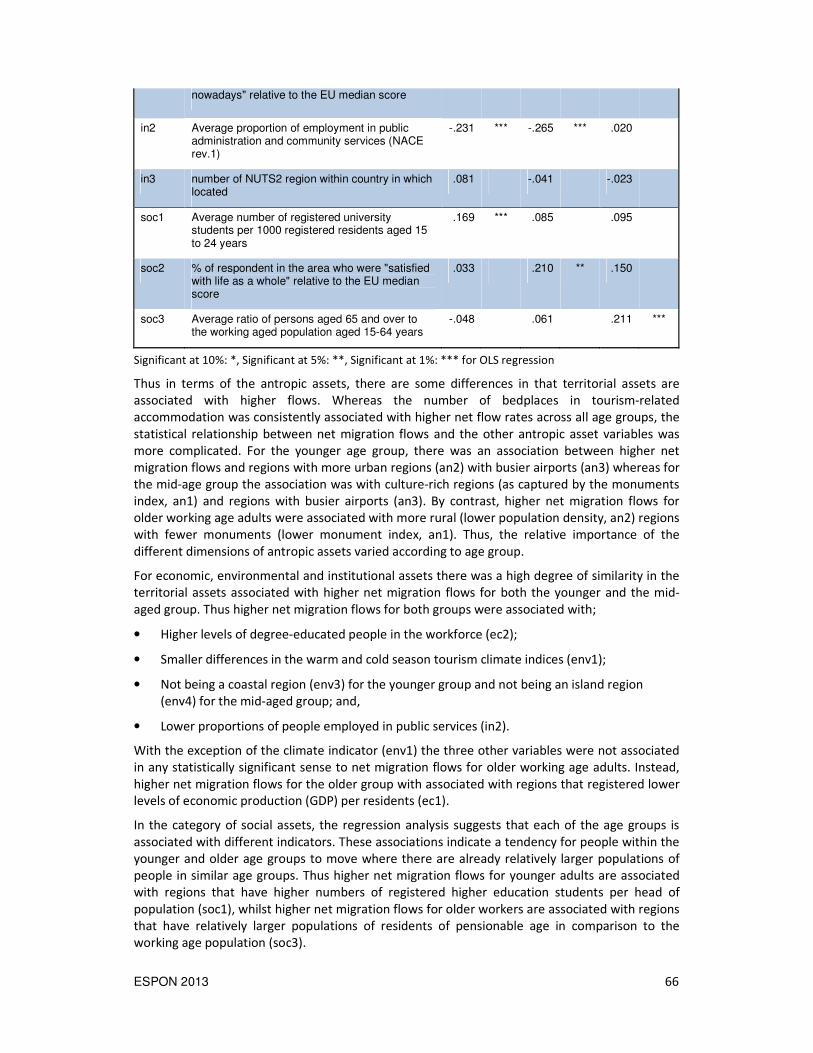
ESPON 2013 66
nowadays" relative to the EU median score
in2 Average proportion of employment in public administration and community services (NACE rev.1)
-.231 *** -.265 *** .020
in3 number of NUTS2 region within country in which located
.081 -.041 -.023
soc1 Average number of registered university students per 1000 registered residents aged 15 to 24 years
.169 *** .085 .095
soc2 % of respondent in the area who were "satisfied with life as a whole" relative to the EU median score
.033 .210 ** .150
soc3 Average ratio of persons aged 65 and over to the working aged population aged 15-64 years
-.048 .061 .211 ***
Significant at 10%: *, Significant at 5%: **, Significant at 1%: *** for OLS regression
Thus in terms of the antropic assets, there are some differences in that territorial assets are associated with higher flows. Whereas the number of bedplaces in tourism-related accommodation was consistently associated with higher net flow rates across all age groups, the statistical relationship between net migration flows and the other antropic asset variables was more complicated. For the younger age group, there was an association between higher net migration flows and regions with more urban regions (an2) with busier airports (an3) whereas for the mid-age group the association was with culture-rich regions (as captured by the monuments index, an1) and regions with busier airports (an3). By contrast, higher net migration flows for older working age adults were associated with more rural (lower population density, an2) regions with fewer monuments (lower monument index, an1). Thus, the relative importance of the different dimensions of antropic assets varied according to age group.
For economic, environmental and institutional assets there was a high degree of similarity in the territorial assets associated with higher net migration flows for both the younger and the mid-aged group. Thus higher net migration flows for both groups were associated with;
• Higher levels of degree-educated people in the workforce (ec2);
• Smaller differences in the warm and cold season tourism climate indices (env1);
• Not being a coastal region (env3) for the younger group and not being an island region (env4) for the mid-aged group; and,
• Lower proportions of people employed in public services (in2).
With the exception of the climate indicator (env1) the three other variables were not associated in any statistically significant sense to net migration flows for older working age adults. Instead, higher net migration flows for the older group with associated with regions that registered lower levels of economic production (GDP) per residents (ec1).
In the category of social assets, the regression analysis suggests that each of the age groups is associated with different indicators. These associations indicate a tendency for people within the younger and older age groups to move where there are already relatively larger populations of people in similar age groups. Thus higher net migration flows for younger adults are associated with regions that have higher numbers of registered higher education students per head of population (soc1), whilst higher net migration flows for older workers are associated with regions that have relatively larger populations of residents of pensionable age in comparison to the working age population (soc3).

ESPON 2013 67
The regression exercise was repeated using visitor numbers (in collective tourism accommodation) as the outcome of interest. The regression analysis was carried out both in relation to the home location of the visitor (registered as “domestic” or “foreign” visitor) and also in relation to two different time periods (2001-04 and 2004-07). This time, the time period did not appear to change the statistical relationship between the observed number of visitors and the territorial assets for a region. However there are differences in the association of visitors by origin (domestic versus foreign visitors) with the various measures of territorial asset.
Table 5.3: Significance of statistical relationships between visitor arrivals and territorial assets
territorial asset variable
Standardized Coefficients for all visitors 2001-04 (R2 = 71%)
Standardized Coefficients for ‘foreign’ visitors 2001-04 (R2 = 63%)
Standardized Coefficients for ‘domestic’ visitors 2001-04 (R2 = 69%)
Beta sig Beta sig Beta sig
an1 index of monuments and other tourist sites valued 2 stars in TCI "green guides series"
.196 *** .245 *** .133 ***
an2 Average gross population density (persons per sqkm)
.051 .062 -.016
an3 Averaged rank of regional air passenger flows based on passenger movements through regional airports(1=busiest)
-.105 ** -.073 -.109 **
an4 Average number of bed spaces in collective tourism establishments (number)
.643 *** .531 *** .640 ***
an5 sum of population accessibility scores (working age population accessibility per hour travel distance)
-.042 -.043 -.103 *
an6 dummy variable for metropolitan NUTS2 region
.009 .025 .022
ec1 average GDP per capita .150 ** .125 * .078
ec2 Average proportion of people aged 15 and above educated to at least ISCED level 5-6
.209 *** .130 ** .191 ***
ec3
Average proportion of total employment in Wholesale and retail trade; hotels and restaurants; transport - NACE (rev.1) activities
.005 .159 *** -.119 ***
env1 difference between average warm and cold season tourism climate index
-.009 -.051 .038
env2 percentage of land area covered by Natura 2000 designation
.016 .013 -.010
env3 dummy variable for being a coastal region -.101 ** -.128 ** -.073
env4 dummy variable for being an island region -.035 .003 -.097 **
in1 % of respondents who were more satisfied with the "state of health services in country nowadays" relative to the EU median score
-.045 .015 -.032
in2 Average proportion of employment in public administration and community services (NACE rev.1)
-.112 ** -.130 ** -.046
in3 number of NUTS2 region within country in which located
.095 ** -.073 .295 ***
soc1 Average number of registered university students per 1000 registered residents aged 15 to 24 years
-.021 .005 -.038
soc2 % of respondent in the area who were "satisfied with life as a whole" relative to the EU median score
-.005 -.008 .005
soc3 Average ratio of persons aged 65 and over to the working aged population aged 15-64 years
-.096 ** -.178 *** -.031
Significant at 10%: *, Significant at 5%: **, Significant at 1%: *** for OLS regression

ESPON 2013 68
Table 5.3 outlines the regression analysis where the outcome of interest is foreign visitors (visitors who are registered as living outside the country where they are staying), domestic visitors (visitors who are registered as living within the same country as they are staying in) and total visitors. It is of little surprise that higher levels of visitor arrivals are associated with regions with a greater accommodation capacity (more bedplaces - an4) and with more monuments to see (an1). It is perhaps a little surprising that higher levels of visiting are associated with a busier airport (an3) only in the case of domestic visitors. Climate (env1) does not appear to be a significant attractor whilst island regions (env4) appear to have a negative impact on domestic visitors whilst for foreign origin visitors it is coastal regions that appear to be less appealing (env3). Equally regions located in larger countries (with more NUTS2 regions) attract a higher number of domestic visitors (in3).
Foreign visitor numbers appear to be associated with regions with more economic production (ec1), a lower proportion of public sector jobs (in2) and with a smaller proportion of residents of pensionable age (soc3). None of these territorial assets are significant in this regression analysis for domestic visitor numbers. With regards to the regional proportion of employment accounted for in shopping and tourism (ec3) the territorial asset has a contrary impact since increases in this proportion are positively associated with more migration and visiting by foreign visitors but is negatively associated with domestic visitor numbers.
Thus it is clear that different mobile groups appear to be associated with different types of territorial assets. The question arises as to whether these territorial assets are found in the same region or generate different types of geographies. It is clear from the regional typologies of mobility that the “super-heated” regions (cf. Ch. 3) attract high net migration flows across all three age groups and also attract high levels of visitors, although it was also notable that the geography of net migration amongst younger adults showed some significant differences in relation to metropolitan regions (higher net migration flows for younger adults and lower net migration flows for the other age groups).
Figure 5.1 plots the average territorial asset score for each of the four regional cluster types based on net migration and visiting rates (TYP2_04) identified in Chapter 3. This radar plot sets out the average (mean) value of the territorial assets for each of the four cluster groups in the regional typology of mobility (TYP2_04). This form of representation allows a visual description of the relationship between assets and outcome. It is clear for example that the average value of territorial assets for Cluster 1 regions is low with the exception of the airport variable (an3) where the average ranking of airport passengers is high (indicating lower numbers of passengers). Cluster 4 regions (very attractive) demonstrate on average high numbers of monuments (an1) and tourist bedplaces (an4) combined with higher than general average values for university students (soc1), perception of well being (soc2) and for residents of pensionable age (soc3).

ESPON 2013 69
Figure 5.1: Territorial capital endowment by migration/visiting cluster type
5.3 Discussion of outliers
Europe is a very diverse place. Consequently the characteristics of the geographic elements that have been constructed to represent regional Europe (the NUTS2 regions) demonstrate a high degree of diversity because of:
• Differences in how member-state statistical agencies decide to divide up their national territories into NUTS units (i.e. NUTS region can demonstrate administrative patterns rather than functional ones) and,
• Inherent differences in regional characteristics across Europe especially between east-central and north-west Europe (i.e. a Romanian region will be very different to a Swedish region; Greater London is very different from northern Finland).
Unusual regions where there appears to be a mismatch between the territorial assets of the region and the levels of net migration into and visiting to the region were identified using two basic approaches: identifying regions for which the difference in observed levels of mobility and predicted levels of mobility (based on the regression analysis) were very high; and picking out regions where it was not possible to predict cluster membership of the regional typologies (described in Chapter 3) based on the value of their territorial assets (captured by discriminant analysis).
In terms of the simple identification of outlying regions, the region that is most commonly identified as unusual is Paris (FR10) where the regression analysis under-predicts the visitor numbers that are actually recorded in the Paris region and where the net migration flows across all age groups with exception of the mid-aged group are ‘over’ predicted by the regression analysis. Andalucía (ES61) is also predicted as receiving more Spanish visitors than might be
ESPON 2013 70
predicted and higher net migration flows (for 2004-07 overall and for 25-49 years for 2002-07 in particular) than might have been predicted based on its territorial assets.
With the exception of the Paris region (FR10 – for most net migration measures) and the Greater London region (UKI2 – for net migration for 50-64 year olds), the under-prediction of net migration rates appears to be an issue for a group of Spanish and Italian regions. Thus the Madrid region (ES30), the Barcelona region (ES51), the Valencia region (ES52) are identified as having significantly higher levels of net migration both for the different time periods and for the three different age groups. In Italy Lombardy (ITC4 – centred on Milan) is identified as an outlier in both time periods for overall net migration and in relation to the 25-49 year old age group whilst Lazio (ITE4 – based on Rome) is identified a couple of times. Thus for net migration there is a suggestion in the data that some Spanish and Italian metropolitan regions may be attracting a lot more migrants than might have been expected given their territorial assets.
Carrying out discriminant analysis on the typology of visiting and net migration (or TYP2_04 from Chapter 3) plotted against territorial assets for 2001-03, we can “correctly” predict type membership of 72% of NUTS2 regions. Thus for 28% (or 82 regions) there is a degree of statistical discrepancy between the territorial assets a region has and the levels of net migration and visiting into that region. It is the high flying regions that are the most problematic.
Map 38 sets out the geography of these discrepancies. Thus for the most part there are regions of Greece, France and Spain where their territorial assets would suggest membership of the “overheating” regions but on the basis of observed net migration and visitor rates the regions have attracted fewer people per inhabitant than might have been expected. Equally there are regions in Ireland, the United Kingdom, Greece and Turkey as well as a range of capital city regions that have attracted observed flows of migrants and visitors over and above what might have been expected given their level of territorial assets.
Considering the class of “superheated” regions, 22 regions were predicted as being in this cluster based on their territorial assets and were also assigned to this cluster due to their mobility rates. On top of this there were 26 regions who were assigned to the cluster on the basis of their mobility rates but who were classified in a regional type where lower net migration and visiting might have been expected on the basis of their territorial assets. A further 9 regions were predicted as belonging to cluster 4 on the basis of their territorial assets but were assigned to a lower mobility region based on observed flow rates. Comparing the territorial assets of the three types of cluster 4 region it is clear that the regions who were predicted as having lower migration and visitor rates than was observed had fewer monuments, bigger seasonal differences in their climate, fewer hotel beds and a small ratio of people of pensionable age to working age population than the regions that were both predicted and observed as Cluster 4 members. The 9 regions that had markedly lower mobility rates than might have been predicted had noticeably lower “satisfaction with life in general” amongst their residents.
In relation to net migration rates and visitor arrival rates, Cluster 1 regions are those that record lower rates (on average) for both types of movement. The discriminant analysis correctly predicts the cluster membership of 62 NUTS2 regions based on the territorial assets for 2001-04. However a further 24 regions were recorded as being part of Cluster 1 whereas their territorial assets would lead to a predicted membership of Cluster 2. These regions as a group consistently recorded higher values of territorial asset than the group of 62 (in 10 out of 19 variables) but despite this the observed rates of net migration and visiting assigned these regions to Cluster 1. Thus this group appears not to have mobilised or realised the territorial assets that they had. By contrast 21 regions were predicted as members of Cluster 1 based on their territorial assets but were assigned to clusters recording higher mobility based on their net migration and visitor rates. This group of 21 showed no significant difference in the value of their territorial assets to the group of 62 although the 21 regions did include a significant proportion of capital city-regions

ESPON 2013 71
suggesting that being a capital city-region in a broader regional context of low net migration will result in a higher level of net migration and visiting than might be expected based on the 19 measures of territorial asset alone.
Thus the regression analysis is able to pick out regions where the relationship between territorial assets and mobility flows seem to hold out and also regions where there appears to be some discrepancy between the territorial assets of the regions and the observed measures of people moving between regions. Whereas the regression analysis can start to identify some of the asset features of regions that either receive more migrant/visitors or receive fewer migrant/visitors than might be suggested by their asset values, the regression analysis by its very nature cannot explain something that has not been specified within the analysis. Thus it is the work of the case studies to offer insight into the dissonance and discrepancy between the predicted and observed mobility outcomes of regions across Europe.

ESPON 2013 72
6 THE MOBILISATION PROCESS
Alexander Otgaar, Erwin van Tuijl and Leo van den Berg
6.1 Objectives and methodology
In the previous chapters we related the attraction audiences with territorial assets, and we showed how it is possible to predict a fair amount of the attractiveness of regions and cities over the 2000s decade considering the endowment of different types of territorial capital.
However, as was underlined before, this is analysis is neither exhaustive nor sufficient to understand the full picture of the way in which territorial assets are mobilised in order to function as attraction factors. For this reason this project has considered a number of case studies, with a double objective:
• Gaining insight in what makes cities and regions attractive and especially the role of policy and governance structures in influencing the ability to attract different audiences;
• Explore dimensions of attractiveness and its drivers which were not explicitly considered in the statistical analysis carried out in the previous research stage, both in terms of indicators considered, and in terms of scale of the analysis.
To cover in an exhaustive way these objectives, we have used a mix of case study methodologies, from qualitative research to quantitative techniques, and a rather broad range of case study regions, from cities to whole countries. Although we provided a protocol for the case studies, there are some important differences in research methods between the eight studies that have been carried out. The cases of Denmark and Slovenia are clearly more quantitative in their approach and more oriented towards the development of scenarios. This orientation explains the limited number of interviews in both regions. The other six case studies combine data analysis (quantitative) with a more qualitative policy review based on interviews with representatives of governments, businesses, knowledge institutions and other stakeholders. However all case studies follow the same “script” in terms of research questions, which were the following:
• Do the relationships identified in RA3 make sense to practitioners within attractive/less attractive regions?
• Do the relationships work at smaller spatial scales?
• Do the relationships work where there are richer data-sets?
As part of this process, we analysed a number of possible factors and their impacts, for instance:
• the extent to which particular forms of Institutional Capital have a more or less positive impact on the capacity to attract
• if there are any particular combinations of forms of Territorial Capital that enhance the capacity to attract
• how different forms of Territorial Capital have been created (or destroyed)
• the presence of thresholds (between assets of territorial capital, between mobile populations ,etc.)
• the characteristics of specific successful mobilization strategies
In relation to the mobilization process, we investigated:
• how the process combines different elements of Territorial Capital through policies/interventions
ESPON 2013 73
• attempts to enhance (or create) forms of Territorial Capital and their effectiveness
• whether particular institutional/governance structures are more or less conducive to an effective and inclusive mobilization process
• the role of leadership in governance
• the relationship, if any, between particular forms of governance and outcomes (in terms of successful mobilization of assets)
• the mixes of policy bundles developed to realise the potential of assets
• the selective strategy, if any, toward specific types of resident or visitors
• the management of different forms of mobile populations and the identification, if any, of specific thresholds and related critical aspects
• the management of critical situations and the way of tackling structural or rising problems
In this section we present the most relevant findings from the eight case studies, without claiming to give a complete overview of all eight cases. For more information we advise to consult Chapter 6 of the Scientific Report and the individual case study reports that are annexed to it.
6.2 Characterisation of the case studies
The case studies dealt with eight regions that have their own unique characteristics. First of all the regions are located in different parts of Europe (see Map 39), ranging from the northwest (Cornwall and the Isles of Scilly8) to the southeast (Istanbul9) and the southwest (Algarve) to the northeast (Denmark/Bornholm, Lubelskie). Slovenia and the Province of Trento represent the geographic centre of Europe. Our sample includes one island (Bornholm) and one region that can be characterised as mountainous (Trento).
Furthermore some case study areas can be labelled as “urban” or “metropolitan” while others are decidedly more “rural”. The most densely populated region in our sample is Istanbul, with almost 2,500 inhabitants per sq.km. The cross-border region of Lille-Kortrijk-Tournai also has an above-average population density of more than 500 inh. per sq.km. The other six case study areas are significantly less densely populated. Bornholm and Algarve could be qualified as “predominantly rural areas”, and this also applies to some extent to Trento and Lubelskie despite the presence of medium-sized cities such as Trento (115,000) and Lublin (350,000). Also Cornwall is mainly rural, although the population density is fairly high: 150 inh. per sq.km. Slovenia has an average population density of 100 inh. per sq.km with, however, some clear concentrations around cities such as Ljubljana (272,000) and Maribor (158,000).
The case studies deal with different units of analysis. While our model looks at attractiveness on the level of NUTS2 regions, some case study areas have purposively been selected to analyse relations on a smaller and/or larger spatial levels. In the case of Denmark, for example, we look at flows between 98 municipalities of Denmark, paying specific attention to the policy implications for the island of Bornholm. A similar approach has been used in the case of Slovenia analysing
8 Hereafter abbreviated as Cornwall.
9 The inclusion of the case study of Istanbul, though not being part of the EU (but of one of the three Candidate Countries, which are covered in our study) has been approved after some discussion by the MC and responds to the great interest that this city has in the context of this study as the largest metropolitan area in the ESPON space, located very close to the eastern border of the EU, and traditionally, one of the main gateways to migrations to the EU, but also playing in recent years a more complex role as the main cities of the new regional economic “tigers” attracting investments and population from the EU countries.

ESPON 2013 74
flows between 192 municipalities (LAU). The Autonomous Province of Trento is a NUTS2 region that corresponds with the NUTS3 region, as does Istanbul, which is also one of the 12 NUTS1 regions in which Turkey is divided. The most complicated case in our sample, when it comes to defining the borders, is the “Euro Metropole” Lille-Kortrijk-Tournai: this cross-border region covers parts of three NUTS2 areas on both sides of the border between France and Belgium. Statistics for this region were difficult to obtain, as we would aggregate data of municipalities in two different countries. For the other three case studies (Algarve, Cornwall and Lubelskie) we used the NUTS2 region as primary unit of analysis, although we also paid attention to internal variation.
The eight regions we analysed differ in their ability to attract and retain people. Using the analysis carried out in the previous stage of the project we can characterize the eight regions as follows (further information is provided in Table 6.1):
• Algarve is an averagely retentitive (for all age groups) and highly attractive region for visitors, being an important international destination. The region attracts more foreign tourists and 50-64 year old migrants than predicted by its territorial capital assets, and scores low in terms of for internal migration.
• Bornholm’s region Hovestaden (NUTS2) has a low retention rate and a high level of internal out-migration, and has been qualified as a region that is generally unretentive except for the young age cohort (including ERASMUS students). However this classification regards the whole region that includes the national capital Copenhagen; data on NUTS3 level for Bornholm are not available.
• Cornwall combines a high retention rate (for all age groups) with a mid-level visitor attraction, being especially attractive in terms of internal migration. The region has been qualified as a major domestic destination. Interestingly, this region is stickier than predicted by its territorial capital.
• Istanbul has not been included in the data analysis of retentiveness by age groups, but it is classified as a region with average global retentiveness and a mid-level visitor attraction, that is particularly attractive for internal migration. Both retentiveness and visitor attractiveness have been increasing throughout the study period from the early to the mid 2000 decade.
• LKT shows a low retention rate except for a moderate retentiveness for the older age group, and ability to attract to visitors in the Belgian part, while the French part has a low score on both factors. Overall, however, the region has been qualified as unretentive for all age groups, though the balance between internal and external migration rates varies a lot internally. The Flemish part is also particularly attractive for ERASMUS students.
• Lubelskie scores low on retentiveness and attractiveness to visitors, and has a high rate of out-migration.
• Slovenia has been categorized as a region with average visitor attraction and a relatively low ability to retain people of all ages, though its retentiveness has increased slightly throughout the study period from the early to the mid-2000 decade in the capital region (one of the two NUTS2 regions that compose the country).
• Trento can be characterised as a region with a average retention rate (for all age groups) and high-level visitor attraction. It is a major domestic destination that is also very attractive for internal migration.

ESPON 2013 75
Table 6.1: Case study regions as ATTREG typologies
Typology based on 5 year
net migration rates by
w orking age group (2002-
07)
Regional typology based on
differentiating net migration
and visitor flow -rates 2001-
07
Regional typology based on
dif ferentiating net migration
and visitor f low -rates 2001-
04
Regional typology based on
dif ferentiating net migration
and visitor f low -rates 2004-
07
Regional typology based on
dif ferent types of f low s,
2001-07
Typology based on overall
net migration and internal net
migration rate, 2001-07
Hovedstaden (Bornholm NUTS 2 region) 4 1 1 1 6 8
Provincia Autonoma Trento 2 2 4 4 3 6
Lubelskie 1 4 1 2 4 8
Algarve 3 2 4 4 3 7
Istanbul 1 1 1 1 6
Cornwall and Isles of Scilly 3 2 4 4 1 5
Typology classes
1 = unretentive region for
young (15-24) and medium
(25-49) w orking age groups,
medium retentiveness for
older w orking age grpup (50-
64); 2 = region w ith average
retentiveness for all w orking
age groups; 3 = highly
retentive for all w orking age
groups; 4 = highly retentive
region for the young
w orking age gropup,
averagely retentive for the
medium w orking age group,
unretentive for the older
w orking age group
Typology classes
1 = average net migration
and visiting f low rates; 2 =
average net migration rate,
high visiting f low rate; 3 =
high net migration rate,
average visiting flow rate; 4
= low net migration and
visiting flow rates
Typology classes
1 = low net migration and
visiting f low rates; 2 = high
net migration rate, low
visiting f low rate; 3 =
average net migration and
visiting f low rates; 4 =
average net migration rate,
high visiting f low rate
Typology classes
1 = average net migration
and visiting flow rates; 2 =
low net migration and visiting
flow rates; 3 = high net
migration rate, average
visiting f low rate; 4 =
average net migration rate,
high visiting flow rate
Typology classes
1 = high internal migration; 2
= Vestlandet (outlier); 3 =
high arrivals of visitors; 4 =
low level f low s of all types;
5 = high flow of air
passengers; 6 = high f low
of ERASMUS students
Typology classes
1 = mid level out-migration
rates; 2 = Reunion (outlier);
3 = Braunschw eig (outlier);
4 = 3 Turkish outliers; 5 =
high net migration rates; 6 =
high net in-migration; 7 =
high net migration rate but
low internal migration rate; 8
= high internal out-migration
rate
Includes a "6" and 2
"4" regions
Includes a "1", a "6"
and a "8" region
all "1" regions all "1" regions all "1" regionsIncludes a "1" and a
"3" region
all "4" regions Includes a "6" and a
"8" region
LKT
SLOVENIA
all "1" regions Includes a "1" and
two "4" regions
Include two "3" and a
"1" region
Includes two "1" and
a "2" region

ESPON 2013 75
Comparing the typologies for the eight case studies we can see that many, but not all types of regions are represented in our small sample.
The eight case studies are also very differently endowed in terms of territorial capital, ranging from predominantly urban regions in the core with a relatively larger supply of antropic and economic-human assets to predominantly rural ones and coastal areas in the Mediterranean which are richer in environmental ones.
The radar diagrams in Fig. 6.1 synthesise this information in terms of endowments with the key territorial assets (through the indicators we used in our regression model of Ch. 5) comparing each region10 with the national average and with the regions in the same cluster of the typology we introduced in Ch. 3 regarding the capacity to attract migrants vis-a-vis the attractiveness of visitors flows. Regarding the way in which case study regions addressed the issue of attractiveness and retention of specific user groups11, the cases can be so characterised:
• The case of the Algarve tries to explain the region’s attractiveness towards foreign visitors and migrants between 50 and 64 years old, many of whom are buyers of second homes.
• The case of Denmark looks at migration only, using data on the level of municipalities to analyse flows of five age groups and five education groups (25 groups in total). The territorial capital in 98 municipalities is described by using 57 independent variables.
• The case of Cornwall analyses data for migrants and visitors of all types, but the policy review clearly concentrates on interventions that target younger adults and (potential) students of higher-education institutions in particular.
• The case of Istanbul mainly addresses the attractiveness of this city towards international audiences, including not only residents and visitors but also companies and investors.
• The case of LKT focuses on the region’s ability to attract and retain residents of all types.
• The case of Lubelskie addresses the inflow of (illegal, non-registered) migrants and students mainly from neighbouring non-EU countries, but also the outflow of workers to Greater Warsaw.
• The case of Slovenia analyses flows of migrants and commuters between municipalities, using detailed statistical data.
• The case of Trento is relatively broad, addressing the region’s attractiveness for migrants and visitors of all types and ages.
Overall we can say that some cases only discuss migration (Denmark and Slovenia) or mainly focus on the attractiveness for residents (Lubelskie and LKT). Cornwall pays attention to both tourism and migration and the respective synergies, while Trento and Algarve are the more tourism-oriented case studies in our sample as you would expect from these important tourism destinations. In the case of Istanbul we look at tourism flows but also at the attraction of FDI.
10 In the case of LKT, we charted separately the three NUTS2 regions involved which exhibit quite different patterns. 11 The authors of the case studies were asked to focus on specific user groups (see Planning and Structure).

ESPON 2013 76
-1.5-1
-0.50
0.51
1.52
an1
an2
an3
an4
an5
ec1
ec2
ec3env1
env2
in1
in2
soc1
soc2
soc3
Cornwall 2001-03
UK average 2001-03
Cluster 3 (2001-07): mid migration high arrival rate
-1-0.5
00.5
11.5
22.5
an1
an2
an3
an4
an5
ec1
ec2
ec3env1
env2
in1
in2
soc1
soc2
soc3
West Vlaanderen 2001-03
Belgium 2001-03
Cluster 2 (2001-07): mid migration mid arrival rate
-1-0.5
0
0.51
1.52
2.5an1
an2
an3
an4
an5
ec1
ec2
ec3env1
env2
in1
in2
soc1
soc2
soc3
Hainaut 2001-03
Belgium 2001-03
Cluster 1 (2001-07): low migration low arrival rate
-1
-0.5
0
0.5
1
1.5an1
an2
an3
an4
an5
ec1
ec2
ec3env1
env2
in1
in2
soc1
soc2
soc3
Nord-Pas de Calais 2001-03
France 2001-03
Cluster 1 (2001-07): low migration low arrival rate
-2
-1
0
1
2
3an1
an2
an3
an4
an5
ec1
ec2
ec3env1
env2
in1
in2
soc1
soc2
soc3
Hovedstaden
Denmark 2001-03
Cluster 2 (2001-07): mid migration mid arrival rate
-2
-1
0
1
2
3an1
an2
an3
an4
an5
ec1
ec2
ec3env1
env2
in1
in2
soc1
soc2
soc3
Provincia Autonoma Trento
Italy 2001-03
Cluster 3 (2001-07): mid migration high arrival rate
-2-1.5
-1-0.5
00.5
11.5
an1
an2
an3
an4
an5
ec1
ec2
ec3env1
env2
in1
in2
soc1
soc2
soc3
Lubelskie
Poland 2001-03
Cluster 1 (2001-07): low migration low arrival rate
-3
-2
-1
0
1
2
3an1
an2
an3
an4
an5
ec1
ec2
ec3env1
env2
in1
in2
soc1
soc2
soc3
Algarve
Portugal 2001-03
Cluster 3 (2001-07): mid migration high arrival rate
-1.5-1
-0.50
0.51
1.52
2.5an1
an2
an3
an4
an5
ec1
ec2
ec3env1
env2
in1
in2
soc1
soc2
soc3
Vzhodna Slovenija
Zahodna Slovenija
Cluster 2 (2001-07): mid migration mid arrival rate
-3
-2
-1
0
1
2
3an1
an2
an3
an4
an5
ec1
ec2
ec3env1
env2
in1
in2
soc1
soc2
soc3
Istanbul
Turkey 2001-03
Cluster 2 (2001-07): mid migration mid arrival rate
Figure 6.1: Territorial capital endowments in the eight case study regions

ESPON 2013 77
One of the main questions to be answered in this cross-case analysis is if the typologies and relations identified in the statistical analysis are recognised by policy makers and other stakeholders and supported by a more detailed analysis of data. Before we discuss the findings from the case studies, let us first briefly discuss some of the data that has been analysed for each region.
• In the case of the Algarve we gained more insight in tourism and migration flows as we were able to use data on (a.o.) the countries of origin, age, the level of education, the purposes of migrants and visitors and the length of their stay, including some time series revealing the main trends.
• The case of Denmark uses a model in which migration (flows) between municipalities for 25 groups (age/education) is measured in relation to the attractiveness (territorial capital) of the single municipality. The territorial capital is measured by using 57 independent variables.
• The case of Cornwall presents specific data on net migration (comparing Cornwall with South West England) for specific age groups, using much smaller age bands than we did in our model. The case also includes time series for migration and tourism showing changes after 2006. Moreover we use data on the development of territorial capital after 2006, thus being able to make a comparison with the situation before 2006.
• The case of Istanbul compares the city’s ability to attract visitors with other major destinations in Europe, considering the recent growth of traffic at the two airports and also looking at the country of origin. In addition it presents detailed data on foreign direct investment, considering the country of origin and the sectoral distribution.
• The case of LKT makes use of time series for migration and cross-border commuting also paying attention to changes in population on the level of municipalities and the flows from and to other regions in Belgium and France.
• The case of Lubelskie analyses net migration on the level of NUTS3 areas in Poland and changes in population in municipalities (NUTS5) within Lubelskie, paying specific attention to the country of origin of foreign workers. It also provides insight in the share of foreigners in the working population and Ukrainians in the population, both on county level (NUTS4).
• The case of Slovenia uses data on migration and commuting (origin and destination) as well as on territorial capital, all on the level of municipalities (NUTS5), and uses them in a gravity model that also includes variables for travel time and distance between municipalities and various mainly economic coefficients that compare the municipality of origin with the municipality of destination12.
• The case of Trento compares data used in RA3 for Trento (NUTS2) with (a selection of) other Italian regions. Furthermore it analyses changes in public expenses as a percentage of GDP compared to the Italian average – an indicator of autonomy in the mobilisation process – between 1995 and 2010.
In conclusion: first, the case studies have helped us to analyse phenomena on smaller spatial levels (NUTS3, NUTS4, NUTS5) but also on larger spatial levels: the relation with neighbouring and sometimes competing regions (e.g. Algarve, LKT and Lubelskie), the position in national systems (e.g. Cornwall, Istanbul and Trento) and the interaction with other European regions (e.g. Algarve, Istanbul, Lubelskie, Slovenia). Secondly we analysed flows from origin to destination. This has been the main challenge for Denmark and Slovenia, but also in other case
12 Employment, gross earnings per capita, useful floor space, investments in construction work and land improvement per capita, average price per m2 of building land, agricultural land, business premises, apartments, (detached) houses, an ageing index and the size of the creative population.

ESPON 2013 78
studies we collected some relevant data about the origin of visitors and migrants. Third, we found more specific information on the mobility of particular age and education groups, as in the case of Denmark and Cornwall. Case studies have also allowed us to gain better understanding of trends in territorial assets and changes in flows, providing some information about what happened after 2006.
6.3 Territorial capital and regional attractiveness
In the first part of this report we developed a conceptual framework to help us understand how different types of territorial capital determine the ability of regions to attract particular audiences, which has then been operationalised into a multiple regression analysis. The case study research first addressed the issue of whether policy makers recognise the relevance of the variables used in the model, and if a fine-grained analysis of data supports their relevance for the attraction and retention of people. The case studies may also provide insight in influential independent variables not included in the model. Stakeholders could, for example, refer to variables that are less tangible and more difficult to quantify. These are our main finding to this respect:
• In the Algarve we found supporting evidence for the relevance of factors such as climate, landscape, accessibility and access to business opportunities. Interviewees, however, also mentioned socio-cultural factors that are not explicitly included in our model such as the perception of safety, hospitality and “sense of belonging”13. Another factor that possibly explains attractiveness is the price/quality ratio of houses and visitor accommodation: an economic factor neglected in the statistical analysis because data were found to be not available in many NUTS2 regions.
• In the case of Denmark/Bornholm we used population (density) as a proxy for antropic capital, referring to the urban character of a municipality. According to the model, differences in employment between the two municipalities and differences in housing prices are less relevant. Policy makers, however, think that these factors are important in the attraction of audiences.
• The case of Cornwall analyses the territorial capital indicators for the region as defined in the model, paying relatively little attention to factors not included in the model.
• The case of Istanbul confirms the importance of location, accessibility and the supply of labour, but also addresses various other factors (economic dynamism, historical background, etc.) listed in the model.
• The case of LKT confirms the relevance of factors such as infrastructure, access to jobs and educational facilities, all covered by our model. Two determinants of attractiveness that are excluded from the model but relevant according to stakeholders are the quality of housing and the tax level.
• The case of Lubelskie makes clear that the immigration of people from the Ukraine is mainly driven by economic arguments: the supply of jobs and the affordability of housing (and other amenities) are presumably dominant in the location decisions of this specific user group. Another factor is cultural proximity. Economic arguments also explain the outmigration to Warsaw and to other EU regions outside Poland (e.g. Germany, UK and US).
13 It could be argued, however, that other socio-cultural variables – such as satisfaction with life – represent (and correlate with) the factors mentioned here.

ESPON 2013 79
• The case of Slovenia provides strong evidence that one economic factor not included in the model is highly relevant for attracting residents: the price level of real estate for various types of real estate. Furthermore the case study tests the relevance of the five asset classes on the level of municipalities.
• The case of Trento suggests that prices of land and real estate should be included in the model in order to gain better insight in what makes regions attractive for residents and visitors.
Globally, we come to the conclusion that the case studies support the relevance of the endowment factors used in the global statistical analysis. As we will demonstrate in the policy section, most cases give some insight in the effectiveness of policies to improve these factors. Clearly the most important factor not included in the model is the price of land and real estate: or to be more precise the price-quality ratio for various types of land and real estate. Stakeholders indicate that land and real estate prices explain migration, especially internal, and the sophisticated Slovenian model proves this argument. Another conclusion is that stakeholders seem to attach more weight to “hard” economic factors such as the supply and demand of labour and business opportunities. A possible explanation is that economic factors have gained importance after the credit crunch of 2008. The exception is the case of the Algarve which explicitly deals with more soft and intangible factors such as the perception of safety, hospitality and a good atmosphere in which people feel at home.
The case studies have also helped us to gain better understanding of relations between assets and attractiveness on smaller spatial scales. Is the ATTREG statistical model also applicable to the level of municipalities (LAU)? The quantitative cases of Denmark and Slovenia answer this question. In five of the six other regions we analysed relations on smaller spatial levels by trying to identify determinants of spatial diversity in the ability to attract particular audiences.
• In the case of the Algarve we found that real estate prices vary considerably within the region. Buyers of second homes clearly prefer coastal areas, although the intermediate zone is also popular among them. Apart of this north-south dichotomy we also observe differences between the relatively affordable real estate in the east and the more expensive property in the centre. Furthermore it appears that older migrants prefer rural areas, while younger people and families tend to like the more urbanised coastal areas. Another interesting phenomenon is the development of communities dominated by one country of origin: people from the Netherlands settle down in the east, while German migrants go the west.
• The municipality migration model developed for the case of Denmark shows that migration flows between municipalities are significantly influenced, in a positive way, by the size of the population at both sides: origin and destination. As we expected transport costs between two municipalities have a significant negative influence on flows. Geographical barriers such as a river, a lake or a sea explain lower migration flows. An interesting finding is that islands with no bridge connection (such as Bornholm) “over-perform” in their ability to lose and attract audiences, which can be explained by the phenomenon that many young adults are forced to leave the island to find a job or to get an education but also often return when they are older.
• The case of Cornwall pays no attention to internal diversity within this NUTS2 region.
• In the case of Istanbul we find that the European side of this city is more popular among foreign migrants than the Asian side. Access to jobs, services, infrastructure and the appealing waterfront have been mentioned as key factors. On a lower spatial level the distribution of population seems to be strongly dependent on the spatial distribution of firms, since congestion reduces the maximum acceptable commuting distance. Foreign

ESPON 2013 80
investors seem to prefer the old CBD and the districts extending towards the north of Istanbul which constitute the new CBD. While cultural activities are also mostly concentrating in the old CBD, especially service-related FDI firms tend to locate in the new CBD.
• The case of LKT demonstrates that different logics drive population movements within the cross-border region, partly related to diversity in assets. While Lille acts a hub for inter-regional migration to and from other parts of France (notably as a university pole), the Walloon part of the region attracts people from Lille as well as from Brussels who are looking for nature, lower densities, lower real estate prices and lower tax levels (urban sprawl). In the Flemish part it seems that people are more mobile but within a much shorter range (intraregional). The role of cross-border migration is limited: apparently national and linguistic borders still matter. On a smaller spatial scale gentrification (increasing real estate prices) explains the decreasing population of Lille city, while the metropolitan area is taking advantage of the city’s ability to attract migrants from elsewhere (the city is the first destination of incoming migrants).
• In the case of Lubelskie we observe substantial differences in the population growth rates if we go down to the level of municipalities. Between 1995 and 2009 suburbs of Lublin but also of other smaller cities experienced the strongest growth. Figure 4 shows that one municipality near Lublin grew by more than 50% and some others with more than 15%, while the majority of the municipalities in Lubelskie faced a decline of more than 5%. In absolute and relative numbers (as share of the total population) most jobs of foreign workers are near Lublin. They tend to live in the suburbs or the city, while they work in agricultural businesses located in rural areas notably in the western part of the region where the climate conditions enable a specialization in the cultivation of fruit and vegetables. Access to jobs and affordable housing seem to be dominant factors in the location decisions of (legal and illegal) foreign workers; but also the distance to the border with Ukraine (country of origin of most workers) is a relevant determinant.
• The case of Slovenia presents some findings that are based on an analysis of flows between municipalities. It appears, for example, that the presence of protected nature (classified as Natura 2000) is not significant in explaining migration or commuter flows. More relevant are the location (near the coast or not), the level of pollution, infrastructure and accessibility, the availability and price level of useful real estate, the number of jobs, the average income level, the size of the population and the presence of educational institutions.
• The case of Trento presents a subdivision of the province which identifies mountain areas with high and medium intense flows of tourism, areas with spa tourism, the popular Garda Lake region, urban areas (including Trento) and other areas with relatively low intense flows of tourism. Average tourism expenditures (per capita) are significantly higher in the cities (113 euro) than in the lake area (89 euro) and the spa area (67 euro).
To sum up: the cases of Denmark and Slovenia show that the model we developed can also be applied to smaller spatial units such as municipalities. Both case studies, however, emphasize the importance of making a distinction between push factors and pull factors, using data on origin-destination flows instead of net migration metrics. The gravity models also support the expectation that attractiveness depends on (critical) mass: densely populated areas generate more flows than sparsely populated areas. Five of the six qualitative case studies give additional insight in how our model could be applied to smaller spatial units. It becomes clear that ‘urban economic phenomena’ influence the attractiveness of communities: economies and diseconomies of agglomeration, gentrification and urban sprawl, and changing commuting patterns because of improvements in infrastructure and congestion. Real estate prices appear to give important information about a community’s ability to attract.

ESPON 2013 81
Our detailed analysis of regional attractiveness not only considers relations on smaller spatial scales but also on larger spatial scales:
• The Algarve study is a good illustration of how two competing neighbouring regions interact with each other. At the other side of the border Costa de la Luz benefits from the vicinity of an international airport (Faro) and even of “the brand Algarve”, while our model does not take this into account. Both regions also compete with other destinations in the Mediterranean such as Morocco and Tunisia. The ability to attract foreign tourists and buyers of second homes seems to depend on the economic and political situation in competitive destinations but also on the economic development in countries of origin (e.g. the UK, Germany and The Netherlands).
• The Denmark case study looks at relations between municipalities (lower spatial scale) in Denmark (larger spatial scale). It pays little attention to the interaction with neighbouring countries such as Sweden, Germany and Poland.
• In the case of Cornwall we compare the territorial capital assets of this region with 1) other European regions that are equally successful in retaining residents and attracting visitors and 2) other UK regions. The suggestion made here is that the ability to attract depends not only on the level of capital assets but also on the relative position in comparison with neighbouring regions (or in this case: regions in the same country). Because mobility in the region is dominated by flows from and to other UK regions, the national position is probably more relevant than the EU position.
• The development of Istanbul is clearly dependent on its position in a European or even global setting. In terms of arrivals the city is among the ten most visited destinations in the world. Istanbul is also an important meeting places being 7th on the list of conference cities worldwide. The city seems to become one of the main gateways from Europe to the east, which is also reflected in the growing “hub” status of Istanbul Ataturk Airport. The unique geographic location – at the intersection of two continents – is an important asset, which is difficult to cover by whatever model to explain attractiveness.
• In our analysis of LKT we also pay some attention to relations with neighbouring regions. For example we found that most flows to the Lille region (French side only) originate in Paris, while most flows away from Lille also end in the French capital. An explanation for this intensive two-way relation is the good accessibility by high-speed train. Above we already referred to the influence of Brussels explaining population growth in some Walloon municipalities.
• The case of Lubelskie gives some insight in the relation with the neighbouring regions in the Ukraine. Essentially mobility is the result of differences in the availability of jobs and income levels at both sides of the border. The Ukrainians replace people who search for better paying jobs in Warsaw, Western Europe and the US: as a result the net population growth is small (in line with the results of RA3).
• In the case of Slovenia we assessed the relative position of Slovenia to the EU by analysing relations between EU states as well as between NUTS2 regions within the member states, mainly looking at the impact of time distance on migration.
• In the case of Trento we compare the region with three other regions (Bolzano, Lombardia and Veneto), the Italian average and the EU average.
Through the case studies we have been able to identify various relations between neighbouring regions: not only flows of specific user groups between these regions (as in the case of Lubelskie and LKT) but also competition and complementarities between regions (the Algarve and Costa de la Luz, for example) affecting their ability to attract user groups from elsewhere. Furthermore the

ESPON 2013 82
cases show that also non-neighbouring regions interact with each other: there are flows from the east to the west (e.g. from Poland to Germany, UK and US), from the west to the east (e.g. return migrants to Istanbul and from Ireland to Poland) and from the north to the south (e.g. from the UK to Portugal). Explanations for these flows are to be found in (changing) coefficients regarding factors such as the access to jobs and the availability of (affordable) real estate. In general, improvements in infrastructure – such as high-speed train and flight connections – lead to more interaction between the connected regions (as we observed for example in the cases of Lille-Kortrijk-Tournai and Istanbul).
Another issue that has been addressed by three of the eight case studies concerns the diversity of preferences among different user groups.
• The Algarve case presents some information about the educational and professional profile of migrants from the UK, Germany, Ireland and the Netherlands (mostly buyers of second homes). For example Table 5 shows that the majority of German immigrants are retired, while the majority of the Irish immigrants are employed. The percentage of British immigrants with a higher education is relatively low compared with the other nationalities. A survey carried out in 2007 shows that the preferences of second home buyers depend on the country of origin (Almeida, 2007).
• The municipality migration model that has been developed for the case of Denmark has produced some interesting findings regarding the mobility of specific age and education groups. Young people (20-29 years), for example, prefer an urban environment with affordable housing and access to education, jobs and cultural facilities accepting agglomeration diseconomies such as social problems. The age group 30-39 prefers regions with a more diverse demographic profile and sufficient employment. Higher educated people migrate to regions with relatively high housing prices reflecting the presence of amenities (e.g. quality of the built environment and the supply of cultural facilities) and regions with a low level of social problems. People aged 40 to 49 are generally less inclined to move to another municipality. They pay less attention to employment opportunities (in other municipalities), but more to the level of services. Important drivers of migration are changes in the family situation: the birth of (one more) child or a divorce. People in the age group 50-59 prefer municipalities with “nature and peace”: when children leave home, they often go (back) to rural areas that are also attractive from a tourism point of view. When they turn 60 they start to pay even less attention to job opportunities as they are about to retire.
• The City of Istanbul appears to be increasingly popular for business visitors and tourists, but also among members of the so-called ‘creative class’ and foreign students: educational facilities, jobs in creative and high-tech industries, cultural facilities and a vibrant city centre are the main drivers behind this type of migration.
While the case studies of Algarve and Istanbul only give some indications that the preferences of migrants and visitors depend on factors such as age, education, income and country of origin, the case of Denmark presents strong evidence that age and education explain flows between communities. An interesting finding is that young people often leave rural areas (such as the island of Bornholm), but that they are willing to return when they get older.
6.4 The mobilisation of regional attractiveness
In this section we take a closer look at the mobilisation of regional attractiveness. On what levels of governance can we observe mobilisation strategies and what is their (expected) impact on the

ESPON 2013 83
ability to attract and retain people? What types of strategies are (considered) applicable to what types of regions?
In our research framework we indicate that mobilisation policies can influence regional attractiveness. Strategies can be developed on various spatial levels: local, regional, national and European policies may affect the location decisions of people and firms. What levels of governance have been identified in the eight case studies and what level is most relevant?
• The policy review in the case of the Algarve concludes that decentralised bodies of the Central Government – such as the Regional Tourism Entity of the Algarve – take the lead in developing regional tourism development policies. While the regions have no political autonomy, local authorities have limited competences and tend to be oriented to their own territories instead of the region as a whole. The vision and strategy of the Regional Tourism Entity are adaptations of the national vision and strategy to the regional context and characteristics. This implies that not the region, but the Central Government is the leading actor in the mobilisation process. While the government has been very active in attracting (foreign) tourists, there is no vision or strategy on how to attract migrants aged 50 and older. However this might change with the recent inclusion of ‘residential tourism’ as one of the strategic tourism products.
• In Denmark policies for the development of rural areas such as Bornholm are developed on various levels of governance, combining “top down” funding programmes of various departments within the national government with ‘bottom up’ initiatives of municipalities in cooperation with other local stakeholders (e.g. in Local Action Groups). Apart from local and national institutions also regional bodies are involved in the development and implementation of strategies to make rural areas attractive for people and businesses. The mobilisation of regional attractiveness is clearly not the responsibility of one actor, but rather the result of a highly complex and comprehensive coordination system. The state accepts the autonomy of municipalities but steers development through what is called “meta-governance” or “indirect regulation of self-control”, also taking into account European policies such as the EU Rural Development Program.
• In the region of Cornwall the most relevant level of governance is currently the “unitary authority” (formerly known as the County of Cornwall). Since May 2010 this authority is responsible for local and regional planning, covering the entire NUTS2 region with only one exception: the Isles of Scilly have their own authority. Prior to 2010, however, the governance system was much more complex, with planning tasks being distributed among higher and lower levels of governance (South West England regional bodies and six districts within Cornwall). Analysing the development of higher education in the region (the setting up of the Combined Universities of Cornwall) we conclude that many institutions and stakeholders have been involved in this process: the EU (European Structure Funds, objective 1), various departments of the UK government, the Higher Education Funding Council for England, the South West Regional Development Agency, Cornwall County, several universities and colleges and representatives of the private sector.
• The most relevant governance level in Istanbul is the Greater Municipality, which covers the area of the Province of Istanbul and corresponds with the statistical boundaries of the NUTS1, NUTS2 and NUTS3 region. The functional urban region is, however, even larger than this area. Despite the fact that the local authority has the legal power to control a relatively metropolitan area, the influence of the central government on planning and tourism development is still very strong. Moreover national agencies play a key role in attracting FDI. Other important stakeholders in the mobilisation process are the Chambers of Commerce and Industry, the Convention and Visitors Bureau, International Investors Association, the airline company Turkish Airlines and private actors such as real-estate developers.

ESPON 2013 84
• On the level of the cross-border region of LKT inter-municipal organisations from both sides of the border cooperate in a European Grouping for Territorial Cooperation (EGTC) that was created in 2008. Cooperation started, however, much earlier: in 1991 inter-municipal organisations from France and Belgium founded a Permanent Cross-border Conference of Inter-municipal Organisations (COPIT/GPCI). The case study shows that the EU played an important role in strengthening cooperation: the project GROOTSTAD (1998-2001, funded by ERDF) resulted in a common development and planning scheme for the cross-border area. The governance of the LKT Euro Metropole can be described as highly complex because the region counts many municipalities (albeit joined together in inter-municipal organisations) that also have to cooperate with departments, provinces, regions and federal/state governments on both sides of the border.
• In Lubelskie the borders of the NUTS2 region correspond with the borders of the province. In Poland provinces are governed by an elected assembly, a governor appointed by the Prime Minister (representing the State) and an executive who is responsible for developing strategies and drafting budgets (including applications for EU funding). Regarding the inflow of workers from neighbouring countries, it has become clear that the Central Government is a key actor. The state is responsible for national immigration policies such as the Charter of a Pole which allows people with ‘Polish roots’ (from countries such as Belarus and Ukraine) to acquire full citizenship. On a regional level universities and ‘higher schools’ have developed proactive strategies to attract foreign students. Also worth mentioning are several initiatives of the City of Lublin and a local NGO (Homo Faber Association) to promote the student-friendliness of this city.
• Trento is one of the five autonomous regions in Italy with a special statute. In comparison with other Italian regions, the Province of Trento has more financial resources to support its own (economic) development. Public expenses as a percentage of the regional GDP are significantly higher than the Italian average. Important stakeholders in the mobilisation process are the regional marketing organisation (Trentino SpA), the regional development corporation (Trentino Sviluppo) and the University of Trento.
The eight case studies we analysed illustrate the diversity in institutional contexts among European regions. Some regions are able to take control of their own development (e.g. Trento and Bornholm) while other regions are much more dependent on state-led policies (e.g. Algarve). In general the mobilisation of regional attractiveness is a combination of top-down EU and state policies and bottom-up initiatives of local and regional stakeholders such as municipalities, universities and businesses. Organisations that operate on the level of the region we selected are not necessarily leading in the development of the region. A good example is the cross-border partnership for LKT, which is only one of the many institutions that can mobilise attractiveness in this French-Belgian region. Another conclusion is that EU policies play an important role in making regions attractive for particular audiences; this is mentioned explicitly in the cases of Denmark/Bornholm, Cornwall, LKT and Lubelskie.
Regions try to improve their ability to attract and retain audiences in various ways. What strategies can we observe in the eight regions and how do they influence regional attractiveness?
• In the case of the Algarve we analysed the (intended) impact of regional and state policies on different forms of territorial capital. We conclude that investments in environmental protection, healthcare and sanitation, education and culture have presumably enhanced the attractiveness of the Algarve for foreign tourists and buyers of second homes. The Regional Tourism Entity is clearly targeting specific markets and user groups, following the national tourism plan which identifies several strategic tourism products. The ambition is to make the region more attractive for visitors who share specific preferences. A good example is the development of a Golf Academy and the organization of an annual Golf Cup to promote the

ESPON 2013 85
region as a destination for golf players. Apart from the five core tourism products (Sun and Sea, Gold, Nautical, Residential and MICE), the regional tourism policy also defines some secondary tourism products to be developed: Culture, Nature, Gastronomy and Health & Wellness.
• In Denmark/Bornholm the Rural Development Programme aims to make rural areas more attractive and economically vital by combining investments in the regional economy with the preservation of environmental capital. Many of the national policies also have a regional perspective, e.g. on research and innovation, business development, education and taxation. Therefore it is often a complicated task for local authorities to develop their own attraction policy and to adapt to the national strategy simultaneously. Many municipalities do not have sufficient administrative resources to ensure a rigorous attraction policy. In the Bornholm case local officials are seeing job creation as the most important element of a mobilisation strategy. In addition they try to sell and brand the island as a “nice place to live” thus aiming to attract new residents and commuters. While many acknowledge that Bornholm will face depopulation in the coming years (like many peripheral areas), a proactive adaption strategy seems to be lacking still.
• In the case of Cornwall we tried to assess the impact of investments in higher education provision, and more specifically of the Combined Universities in Cornwall (CUC) project. The establishment of CUC is a key part of a wider strategy (supported by Objective 1 and Convergence Funding) to make the transition to a knowledge-based economy. CUC contributes to this strategy by attracting and retaining students and by stimulating innovation and knowledge transfer (through a Research Knowledge Transfer Team and the establishment of Innovation Centres). CUC represents a relatively new, and potentially innovative, model of delivering higher education as it is a partnership of education institutions. Looking at the results so far we conclude that CUC has helped the region to attract more students, or – to formulate it more accurately – to retain students and prevent a “brain drain”. Between 2001 and 2010 the number of students in Cornwall increased from 3,000 to 7,700. It is, however, too early to measure the impact on the regional economy. Cornwall’s economic performance is still below the UK average, not only in terms of GVA but also considering the share of knowledge workers in the labour force. The peripheral location and poor access to other parts of the UK (and Europe) are still significantly factors explaining the underperformance of the Cornish economy. It will probably take many years before we can actually measure the full impact of CUC.
• The strategy of Istanbul is to make the city more competitive while securing the quality of the living and built-up environment (historical, cultural and natural heritage). Although it contains elements of sustainability, it is clearly a ‘pro-growth strategy’ that aims to attract more skilled workers, more visitors and more investors to the city. As part of this strategy the city aims to present itself as an international Finance Centre, thus trying to attract business visitors who are potential investors at the same time. Various public and private stakeholders such as the Greater Municipality of Istanbul and the Chamber of Commerce cooperate to this end. Events and place promotion – such as the European Capital of Culture event in 2010 – also help to make the city known among various audiences.
• Analysing the vision and strategy for the cross border region of LKT we come to the conclusion that the principles and actions proposed cover the different types of capital. Actors from both sides of the border are willing to take advantage of possibilities to build on common assets and complementarities between assets: diversity as strength. Essentially the aim is to make the area as a whole more attractive, taking advantage of synergies and critical mass. As we see more often in cross-border cooperation, actions focus on ‘win-win solutions’ not on solutions that involve a redistribution of functions (‘win-lose solutions’).

ESPON 2013 86
Important themes of cooperation are joint territorial marketing, coordination in planning for infrastructure and the environment, cultural events and the exchange of students. The vision and strategy have resulted in various actions, though not necessarily as part of the cross-border cooperation. Interviewees refer to various successful projects (e.g. the creation of platforms and cross-border institutions), often funded by the EU and evolving around economic issues as well as around cultural events (e.g. the European Capital of Culture event in Lille).
• In Lubelskie local authorities and universities try to attract students in a proactive way: by introducing curricula in English and helping students to find their way (in Lublin). Apart from the national policies (Charter of a Pole), there are no explicit policies (yet) to attract foreign workers, although this might change in the near future with an increasing inflow of registered workers. The question is not how to attract foreign workers (they will come anyway), but how to make sure they pay taxes and social insurance premiums.
• In the case of Slovenia we present the model as a tool to analyse the impact of different mobilisation strategies on migration and commuter flows. What happens, for example, if the useful floor space of dwellings decreases with x per cent? An overview of the main results is presented in Tables 45 and 46 of Slovenian case study report. Although the parameters of this model change in space and in time, the model may also be useful for policy makers in other countries.
• In Trento the marketing organisation promotes the region as a tourist destination, but at the same time stakeholders indicate that there are limits to growth in tourism. More attention is paid to the quality of flows, possibly explaining the ‘underperformance’ in the attraction of visitors. As the region has entered the stage of maturity in the destination life cycle, a more selective policy targeting specific tourists is preferred above a pro-growth strategy.
In general policy makers and other stakeholders see various possibilities to invest in the attractiveness of regions and cities for residents and visitors. In view of the transition to a global knowledge-based economy it has become particularly important for regions to invest in the access to (higher) educational institutions as we could see, for example, in Cornwall. Another frequently used tool to attract audiences is place marketing. While some regions are more selective, targeting specific groups, other regions have no explicit policies to attract particular audiences. When the costs of agglomeration (diseconomies) become higher than the benefits (economies) regions tend to become choosier: paying more attention to quality and the contribution of migration and tourism to the prosperity and wellbeing of the current citizens.

ESPON 2013 87
7 ATTRACTIVENESS AS A POLICY DIMENSION
Loris Servillo, Rob Atkinson and Bjarne Madsen
The ATTREG project is situated within a particular conception of the role of spatial and non-spatial policies, particularly those of the EU, that assumes they have a significant role in enhancing the attractiveness of places and regions, by developing and supporting endogenous factors, and specifically territorial capital in the form of particular assets, determined largely by geographical, cultural, institutional and historical factors. It is a central assumption of this project that changes in the endowment with (forms of) territorial capital, and specifically the mobilisation of particular assets, may bring about shifts in the relative “positioning” of regions in terms of their attractiveness and developmental potentials. Given this, policy makers need to understand what constitutes the attractiveness of European cities and regions and the implications for the development of policies designed to enhance the impact of European Spatial Directives, at a variety of scales (from the local to the EU level), as well as the importance of sectoral (non-spatial) policies and the implications of more overarching policies such as Europe 2020. In order to address these issues the ATTREG project has analysed some of the key related questions: how territorial attractiveness relates to mobility, the geographies it engenders, and the relationship between attractiveness and growth (and its associated policy implications).
We also noted in Ch. 1 of this Scientific Report that attractiveness is usually associated with the idea of competitiveness, which may lead to misunderstandings of the full implications of the concept. Across Europe there has been an increasing interest in mobility and this should be situated in a wider policy context where the primary concern is with achieving “territorial balance and harmonious development” and territorial (and social) cohesion across the European space (see CEC 2001, 2004, 2008b; ESDP, 1999). However, the dominant aim is always to improve Europe’s competitiveness. For instance the Green Paper on Territorial Cohesion (CEC, 2008b: 3), but also the Europe 2020 strategy (CEC, 2010a) which emphasises smart, sustainable and inclusive growth, is framed by the need to regain competitiveness or suffer continued relative decline (CEC, 2010a: 8-9).
Thus, in order to clarify the above outlined approach and some of its ambiguities, and provide a general interpretation to the outcomes of this project in terms that are relevant for European policy, in this chapter we will first specify a “policy framework” for territorial attractiveness (Section 7.1.); second, we set up the analytical framework for the analysis of the EU policy role in determining and influencing the attractiveness of EU regions (Section 7.2). Third, we will present the outcomes of a set of “policy experiments” which connect different policy orientations (broadly relating to the smart, inclusive and sustainable strands in Europe 2020) to a place-based approach through a scenario model (Section 7.2). We conclude in Section 7.3 with general comments and reflections on the policy value of the ATTREG approach.
7.1 Policy framework
In this part will briefly outline our notion of attractiveness (7.1.1), the implications of the concept in terms of mobilisation of assets (7.1.2), the EU dimension of such an approach, as it has emerged from the ATTREG project (7.1.3) and finally the policy implications of the mobilisation of assets (7.1.4).

ESPON 2013 88
7.1.1 The policy concept of attractiveness
In this project we have assumed and verified that “attractiveness” is constituted through the interaction of a complex set of characteristics based on the presence (or absence) of certain forms of territorial capital (assets or endowments as we have termed them); the relative balance of factors that attract varies depending on the groups that are the object of attraction strategies (high skilled workers, second home owners, tourists, etc). From this perspective on regional development the ATTREG project has identified the roles of environmental, physical and social attributes in reinforcing (or diminishing) the attractiveness of regions for each group. Our discussion of the nature of the relationships between place-based assets and their influence on the location decisions of the particular communities of interest/stakeholders suggests that three main variables should be taken into account: the different factors that constitute attractiveness, the categories of citizens related to them, and the different scales at which they are considered. For instance, depending on which particular categories of citizens are the focus of interest or the particular scale at which the analysis is conducted will produce different results both in terms of our understanding of how “attractiveness” functions vis-à-vis a particular group(s) or with reference to the “attractiveness” of a given territory (e.g. neighbourhood as against city-region).
Given the above, the concept of territorial capital has been central to framing and developing the ATTREG project and we would argue it is (and will continue to be) for a key element in territorial development policy. We have argued that the concept of territorial attractiveness provides important insights into, and understanding of, the (endogenous) development potentials (in a spatially specific sense) of places. It is, we have argued, the complex relations (interactions) between different forms of territorial capital that explain the differential ability of places to attract and retain different mobile populations. However, we have also argued the mere presence of the necessary territorial capital does not automatically lead to attraction and retention of population (or economic development). Of major importance is the capacity of local governance systems to mobilise these assets, both with regard to existing residents and potential future residents, and various types of visitors. This approach is based on the identification of what brings about changes in how a place is perceived and trends in population mobility, consideration of the different ways in which assets can be utilised to make places “different” and “unique”, identification (and definition) of problems and opportunities and then developing longer term strategic and integrated policies that simultaneously address a number of different issues and audiences in order to enhance the attractiveness of a place through the creation of new development paths and visions.
Within the above, it is important to recognise that governance processes have a crucial role to play through what we have termed the mobilization process (this is one of the things we investigated in greater depth in RA4). Governance is important because by bringing together the different stakeholders in a place a strategic and action dimension can be developed which is necessary to mobilise the assets that constitute territorial capital, with the exception of course of those assets that are related to un-modifiable aspects of the areas (climate, natural resources, etc.). This requires more flexible and inclusive modes of governance and leadership that focus on a range of issues including “deficiencies” (in assets) and what exists (in terms of assets) and how these can be developed to enhance the quality of place without sacrificing particular (e.g. marginal) groups to the perceived need to enhance competitiveness or generating spatial and social conflicts. It also brings a time-perspective issue, because of the mobilisation processes imply a broad variety of time-scale (from short-term period, e.g. changing environmental legislation on the protection of environmental resources, to long/extreme long-term perspective, e.g. creation of institutional assets or implementation of the monumental patrimony).
In this perspective, it is worth considering attractiveness from a governance point of view. Despite its complexity and the different implications, we have identified two key aspects: 1)
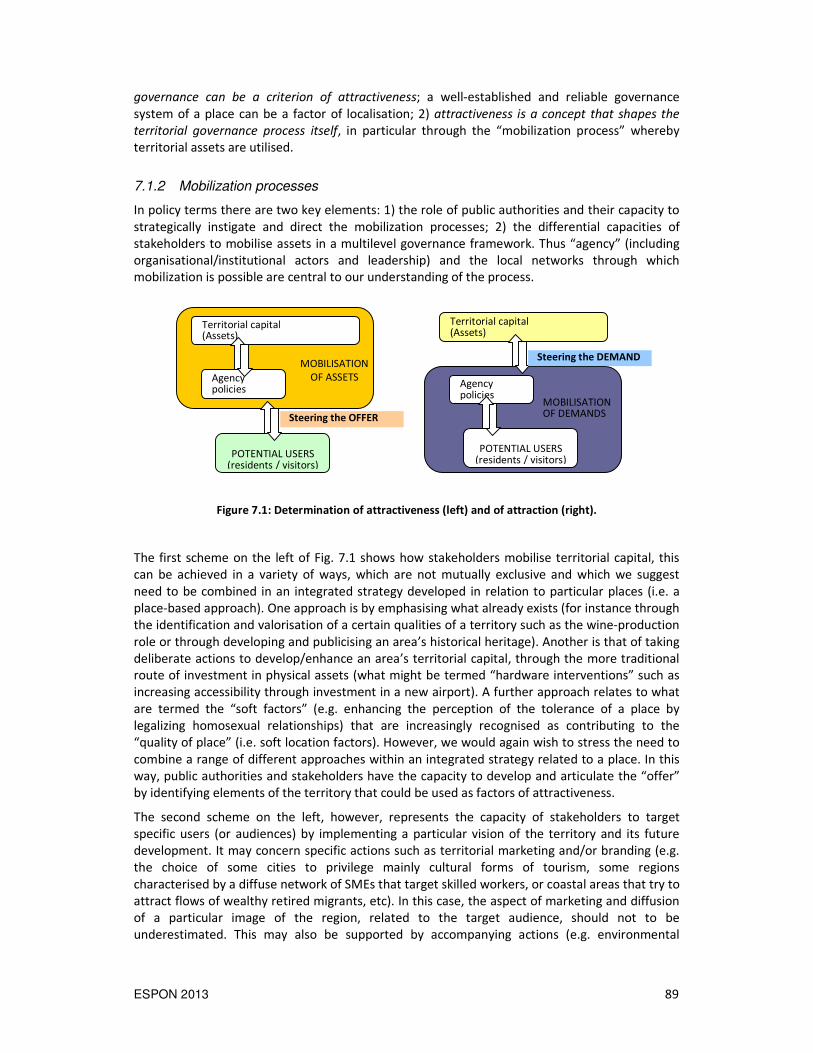
ESPON 2013 89
governance can be a criterion of attractiveness; a well-established and reliable governance system of a place can be a factor of localisation; 2) attractiveness is a concept that shapes the
territorial governance process itself, in particular through the “mobilization process” whereby territorial assets are utilised.
7.1.2 Mobilization processes
In policy terms there are two key elements: 1) the role of public authorities and their capacity to strategically instigate and direct the mobilization processes; 2) the differential capacities of stakeholders to mobilise assets in a multilevel governance framework. Thus “agency” (including organisational/institutional actors and leadership) and the local networks through which mobilization is possible are central to our understanding of the process.
Figure 7.1: Determination of attractiveness (left) and of attraction (right).
The first scheme on the left of Fig. 7.1 shows how stakeholders mobilise territorial capital, this can be achieved in a variety of ways, which are not mutually exclusive and which we suggest need to be combined in an integrated strategy developed in relation to particular places (i.e. a place-based approach). One approach is by emphasising what already exists (for instance through the identification and valorisation of a certain qualities of a territory such as the wine-production role or through developing and publicising an area’s historical heritage). Another is that of taking deliberate actions to develop/enhance an area’s territorial capital, through the more traditional route of investment in physical assets (what might be termed “hardware interventions” such as increasing accessibility through investment in a new airport). A further approach relates to what are termed the “soft factors” (e.g. enhancing the perception of the tolerance of a place by legalizing homosexual relationships) that are increasingly recognised as contributing to the “quality of place” (i.e. soft location factors). However, we would again wish to stress the need to combine a range of different approaches within an integrated strategy related to a place. In this way, public authorities and stakeholders have the capacity to develop and articulate the “offer” by identifying elements of the territory that could be used as factors of attractiveness.
The second scheme on the left, however, represents the capacity of stakeholders to target specific users (or audiences) by implementing a particular vision of the territory and its future development. It may concern specific actions such as territorial marketing and/or branding (e.g. the choice of some cities to privilege mainly cultural forms of tourism, some regions characterised by a diffuse network of SMEs that target skilled workers, or coastal areas that try to attract flows of wealthy retired migrants, etc). In this case, the aspect of marketing and diffusion of a particular image of the region, related to the target audience, should not to be underestimated. This may also be supported by accompanying actions (e.g. environmental
Territorial capital (Assets)
Agency policies
MOBILISATION OF DEMANDS
POTENTIAL USERS
(residents / visitors)
Steering the DEMAND
Territorial capital (Assets)
Agency policies
MOBILISATION OF ASSETS
POTENTIAL USERS
(residents / visitors)
Steering the OFFER

ESPON 2013 90
schemes/legislation or social provision related to heath care) designed to “preserve” and “enhance” that image.
These two schemes indicate two processes that are most of the time, albeit sometimes unconsciously, articulated and integrated with one another, the coherence of which may vary. This is determined by the capacity of the governance system of a place to develop a shared strategic vision and related set of coherent measures and policy bundles. In what might be termed “best cases” there will be a clear strategy while in other cases the strategy will be implicit and the aims uncoordinated leading to potential (and actual) divergences among stakeholders which in turn may produce divergent measures and contradictory policies.
In terms of policy, the combination of these two schemes represents the capacity over the short cycle/period to steer attractiveness and attraction process. It is what in Fig. 7.2 is represented as synchronic dimension (left side) of the mobilization processes, in which we illustrate the combination processes that steers the offer (attractiveness) and the demand (attraction).
Figure 7.2: Synchronic (left) and diachronic (right) dimension of mobilisation processes.
However, in a diachronic dimension these processes are related to the implementation of territorial capital through actions on the capital assets as well as the cultural construction of the places (the right side in Fig. 7.2). It is this dimension of the mobilisation process that occurs over the long period (long cycle). It represents the process through which on the one hand territorial capital increases or decreases, and on the other hand particular fashions, myths, tendencies that become “hegemonic” at a particular point in time (e.g. the Barcelona myth, the romanticism of Venice and Paris, or the shift toward a post-industrial cultural region taking place in the Ruhr area, etc). However, we would once again emphasise the need for the two sides to be integrated so that short term actions are part of, and designed to achieve, a longer term strategy.
Crucial to this point is the time factor: policy makers have to bear in mind that mobilisation strategies that target the development/enhancement of capital assets as well as the cultural construction of places (in other words, the over-abused “territorial marketing” concept) can only be successful in the medium-long term time scale. This combination of specific policy measures, related to a clear territorial strategy that addresses the mobility and retention of population, is what has we have termed policy bundle(s) that are part of a place-based approach. This approach, which is perhaps best expressed in the Green Paper on Territorial Development and the Barca Report (2009), has taken on an increasingly important role in the EU policy-making context.
Territorial assets
Policies
ATTRACTIVENESS
residents / visitors
residents / visitors
Policies
ATTRACTION
Territorial capital Territorial assets
Policies ACTIONS ON CAPITAL ASSETS
residents / visitors
CULTURAL CONSTRUCTION
residents / visitors
Policies
Territorial capital

ESPON 2013 91
7.1.3 The EU (policy) dimension
As has been already mentioned in Chapter 1 of this Scientific Report, the Green Paper on Territorial Development represents a significant step forward in the development of an approach that brings together the territorial, social and economic dimensions, recognising that they cannot be considered in isolation and that as a result policies must be developed in an integrated manner and directed at “meaningful places of intervention” (i.e. not limited by administrative boundaries/borders) (see Barca, 2009, p. 93). This approach assumes that only by focusing on the (many) endogenous strengths of places can more harmonious development can be achieved.
The place-based approach has emerged as a mode of action that seeks to support more long-term, sustainable, development processes, based on the (endogenous) development of territorial assets. As part of this the conception of the dynamics driving population mobility has shifted from one based on an assumption that population movements are determined mainly by economic forces towards one that includes a notion of the “search for quality”, thereby pointing to the significance of the variety of factors we have included in our categories that constitute territorial capital. For instance in relation to mobility based around jobs the Second State of
European Cities Report (2010, p. 17) has argued:
Since it can be expected that labour-oriented migration will continue to focus on large cities, smaller cities may find it increasingly difficult to compete for mobile workers. However, combination of a good quality public (e.g. health care, education, culture) infrastructure, good accessibility, a certain degree of economic specialisation and affordable high-quality housing may prove to be a considerable advantage of smaller cities in competition with the large agglomerations and serve to prevent income disparity and poverty.
We need to bear in mind that, in general terms, populations are relatively fixed. By this we mean that in terms of human capital populations are tied to a place and that places have their own identity, national traditions, specific welfare structures, etc, that are central to the anchoring of people in them. The evidence from the data in the period covered by our research is that only a handful of regions across Europe have experienced high rates of mobility. In these regions, despite high rates of net migration and the capacity to attract large numbers of visitors relative to their resident populations, the number of people in employment has grown enough to match the ongoing demand for work. The outcome of this influx of population was that despite growth in the number of jobs the rate of job creation was not sufficient to meet the demand for employment from both the new population and the existing one, thus at the end of the period average unemployment rates remained “high “.
Additional complexity is added if we consider the European scale. Migration within nation states is in numerical terms more important for the EU15 countries than migration rates between nation states within the Union with EU15 states being net importers of EU citizens in 2006. However interstate migration is numerically more significant than internal inter-regional migration flows for the 12 nations that acceded to the Union since 2004. Thus these variations need to be taken into account when formulating policy.
These are further reasons why the utilisation of local assets (i.e. endogenous characteristics) within a place-based strategy is of such importance – put simply they have the potential to boost economic growth, etc, and in this context place-based policies advocated by the Barca report take on a crucial role. Evidence in support of this approach can also be found in Second State of
European Cities Report (2010, p. 17-18):
…an EU place-based approach can respond to the highly diverse way, in which migration flows affect regions…since… [the]…attraction of foreigners is one of the factors securing urban prosperity already and is likely to improve in importance in the course of
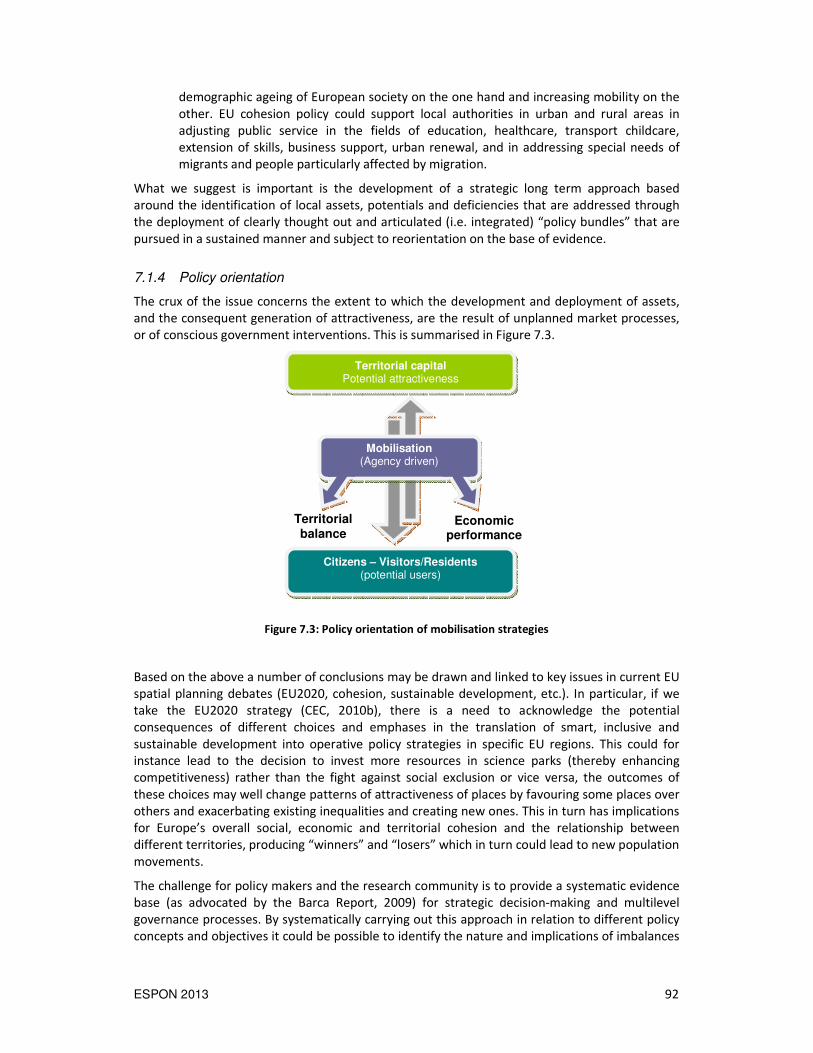
ESPON 2013 92
demographic ageing of European society on the one hand and increasing mobility on the other. EU cohesion policy could support local authorities in urban and rural areas in adjusting public service in the fields of education, healthcare, transport childcare, extension of skills, business support, urban renewal, and in addressing special needs of migrants and people particularly affected by migration.
What we suggest is important is the development of a strategic long term approach based around the identification of local assets, potentials and deficiencies that are addressed through the deployment of clearly thought out and articulated (i.e. integrated) “policy bundles” that are pursued in a sustained manner and subject to reorientation on the base of evidence.
7.1.4 Policy orientation
The crux of the issue concerns the extent to which the development and deployment of assets, and the consequent generation of attractiveness, are the result of unplanned market processes, or of conscious government interventions. This is summarised in Figure 7.3.
Figure 7.3: Policy orientation of mobilisation strategies
Based on the above a number of conclusions may be drawn and linked to key issues in current EU spatial planning debates (EU2020, cohesion, sustainable development, etc.). In particular, if we take the EU2020 strategy (CEC, 2010b), there is a need to acknowledge the potential consequences of different choices and emphases in the translation of smart, inclusive and sustainable development into operative policy strategies in specific EU regions. This could for instance lead to the decision to invest more resources in science parks (thereby enhancing competitiveness) rather than the fight against social exclusion or vice versa, the outcomes of these choices may well change patterns of attractiveness of places by favouring some places over others and exacerbating existing inequalities and creating new ones. This in turn has implications for Europe’s overall social, economic and territorial cohesion and the relationship between different territories, producing “winners” and “losers” which in turn could lead to new population movements.
The challenge for policy makers and the research community is to provide a systematic evidence base (as advocated by the Barca Report, 2009) for strategic decision-making and multilevel governance processes. By systematically carrying out this approach in relation to different policy concepts and objectives it could be possible to identify the nature and implications of imbalances
Economic performance
Territorial balance
Territorial capital Potential attractiveness
Citizens – Visitors/Residents (potential users)
Mobilisation (Agency driven)

ESPON 2013 93
in territorial attractiveness today and with regard to future developments with reference to specific user groups and/or objectives. At the same time it may be possible to indicate the significance of the role of the “mobilization process” and multilevel governance vis-à-vis territorial performance and attractiveness.
7.2 Policy bundles and the attractiveness of EU regions
The two overall aims of the ATTREG project have been:
• To develop a much clearer set of ideas about the relationships between the key endowment factors and different audiences as well as the “mobilization process”
• To investigate the local, regional and EU policy conditions that might influence the mobilization of assets that attract.
In particular the purpose of these aims have been to assist policy makers in the identification of different “policy bundles” (or instruments) in association with mobilising processes that lead to different outcomes in given conditions.
From this perspective, there are two, somewhat different but related, types of policy guidelines that can be considered:
1. At the “lower” level of city/regions. Here the key issue is how different types of mobilization processes, using different policy bundles and focussing on different mixes of assets targeted at different audiences, could lead to a range of different outcomes. These would be primarily addressed to the city/regional level and suggest how within the different typologies attractiveness can be enhanced.
2. At the European level. It concerns issues of regional competitiveness, cohesion, balance and equity at the pan-European scale with regard to the attractiveness of regions/cities – i.e. the balance within/across the European territory.
However, we have to take into consideration the applicability of a “rational approach” that assumes we can identify a direct (causal) relationship between a certain policy approach and a specific outcome in terms of different forms of mobility. Here the presence of other driving forces that can be considered “external” or “global” is crucial, for example the implications of issues such as climate change and demographic changes (e.g. aging population, shortage of people of “working age’), or the economic crisis and its spatial effects.
While the analysis of the city/regional level performances and their policy implications have been developed in the previous parts of the report, it remains at stake the EU role in addressing territorial policies and the spatial effects in terms of attractiveness. The focus of this part of the project, thus, has been to explore the relationships between specific policy bundles and territorial characteristics within the framework of a variety of EU policy scenarios which are based on a combination of different driving forces (policy bundles). To this end, the project relies on previous ESPON elaborations on these specific factors, in particular the DEMIFER project on demographic changes at EU level, which has developed different scenarios taking into consideration different driving forces.
Drawing on the cumulative work of these previous research activities we then identify, in relation to current policy documents and debates, the implications of our work for current and future European policies vis-à-vis attractiveness. In particular, we “critically interrogate” the assumptions underlying key European (Territorial) debates and policies and the extent to which the results of our project support or contradict these assumptions. On this basis we can then

ESPON 2013 94
begin to suggest future policy trajectories that may reinforce existing policies or suggest a need for their modification.
This approach raises a number of technical and policy questions:
1. What constitutes “good decisions” in a regional attraction policy: For policy makers it is essential to take “good decisions”. Case studies suggest that what are “good decisions” is very different and related to the specific demographic, social, economic and political factors of each region.
2. Which attraction assets can be affected by policy? Not all the available attraction assets can operate as instruments in regional attraction policy. This is the case for natural assets or because they are decided at national or European level.
3. What are the direct effects in the target region of each of the instruments (factors of attraction) in a regional attraction policy? We need to know more about what are the effects of each of the attraction factors, that policy influence, on outcomes. The direct results of the statistical analysis of the relation between territorial capital and outcomes provide an initial answer, but each factor can be assumed to have “derived impacts”.
4. What are the combined effects of an attraction policy package? An attraction policy will involve the use of a number of, or a collection of, instruments (policy bundles). We need to know more about the additionally of policies and the identification of synergetic effects within the attraction policy making process.
5. What are the inter-sectorial spill over and feed-back effects of attraction policies? An attraction policy does not only include the direct effects that impact on in-migration and population and tourism, but should also address the possible spill-over and feed-back effects on local jobs and export activities including the local spill over and feed back effects on other sectors within the target region.
6. What are the interregional and international spillover effects on other regions of attraction policies in the target region? An attraction policy does not only include effects in the target region, but should also address the possible spill-over effects on other regions, the spill over effects on other regions within the country and in a wider European context.
7. What are the interregional and international feed-back effects of attraction policies on the target region itself? An attraction policy does not only include the direct and derived effects on activities in the target region itself, but should also address the possible feed-back effects from other regions within the country and in a wider European context.
By drawing upon the policy proposals contained in key European documents (e.g. the Green Paper on Territorial Cohesion, Territorial Agenda, Europe 2020 Strategy, the Barca Report, the Fifth Cohesion) and EU research projects (among which of particular relevance are DEMIFER, FOCI, GEOSPECS, EDORA) and the overall territorial considerations elaborated in the First Espon 2013 Synthesis Report, we can, in relation to our evidence from the analysis of regional typologies:
• elaborate more fine-tuned policy implications for different types of regions/cities, taking into account different motivations and objectives;
• provide cartographical presentations of the above in terms of future scenarios under different policy trajectories;
• draw out the overarching implications for Europe’s development in relation to the main policy options and trajectories included in key policy documents (especially the new strategy EU2020);
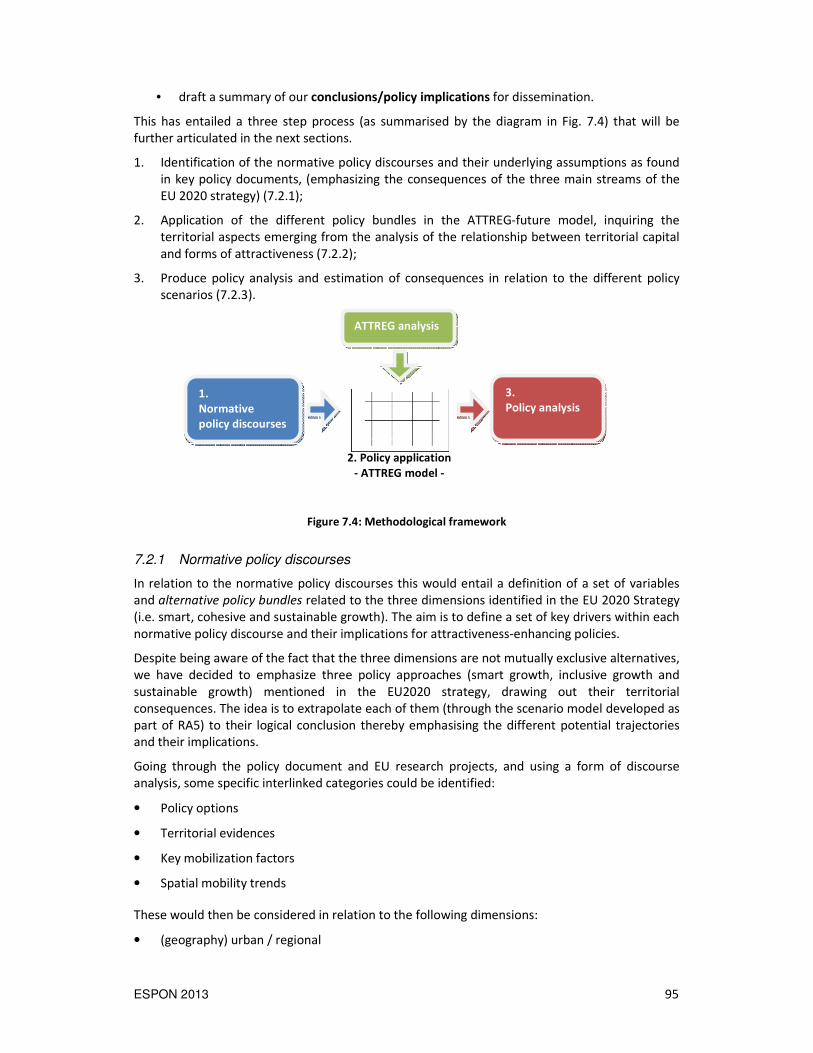
ESPON 2013 95
• draft a summary of our conclusions/policy implications for dissemination.
This has entailed a three step process (as summarised by the diagram in Fig. 7.4) that will be further articulated in the next sections.
1. Identification of the normative policy discourses and their underlying assumptions as found in key policy documents, (emphasizing the consequences of the three main streams of the EU 2020 strategy) (7.2.1);
2. Application of the different policy bundles in the ATTREG-future model, inquiring the territorial aspects emerging from the analysis of the relationship between territorial capital and forms of attractiveness (7.2.2);
3. Produce policy analysis and estimation of consequences in relation to the different policy scenarios (7.2.3).
Figure 7.4: Methodological framework
7.2.1 Normative policy discourses
In relation to the normative policy discourses this would entail a definition of a set of variables and alternative policy bundles related to the three dimensions identified in the EU 2020 Strategy (i.e. smart, cohesive and sustainable growth). The aim is to define a set of key drivers within each normative policy discourse and their implications for attractiveness-enhancing policies.
Despite being aware of the fact that the three dimensions are not mutually exclusive alternatives, we have decided to emphasize three policy approaches (smart growth, inclusive growth and sustainable growth) mentioned in the EU2020 strategy, drawing out their territorial consequences. The idea is to extrapolate each of them (through the scenario model developed as part of RA5) to their logical conclusion thereby emphasising the different potential trajectories and their implications.
Going through the policy document and EU research projects, and using a form of discourse analysis, some specific interlinked categories could be identified:
• Policy options
• Territorial evidences
• Key mobilization factors
• Spatial mobility trends
These would then be considered in relation to the following dimensions:
• (geography) urban / regional
1.
Normative
policy discourses
3.
Policy analysis
2. Policy application
- ATTREG model -
ATTREG analysis

ESPON 2013 96
• (audience) resident / tourist
In the smart-growth policy approach we foresee a concentration of resources and efforts in hi-tech investments, and in particular in the NBIC sectors (Nanotechnology, biotechnology, information technology and cognitive science). The enhancement of Europe’s research and enterprise networks and their connections to global networks, together with strong investment in higher education institutions and private high-tech companies, strengthening the role of big metropolitan areas and specific centres of specializations. Moreover, this trend is enhanced by investments in infrastructure networks and improvements in accessibility among European metropolitan places, combining public and private transport (highways and high-speed train connections). The metropolitan areas, thus, are expected to be the main drivers of territorial attractiveness.
At the same time, innovative and high-tech companies with global trading networks are promoted in innovative rural regions. Thus, close links in rural areas to territorial hubs facilitated by ICT systems and network relationships favour advanced productive agriculture systems, and clusters of excellence in smaller towns are supported in order to achieve the critical mass necessary to operate in the global market. Moreover, related characteristics of different rural areas are promoted to be used as tourist attraction factors, enhancing rural regions as consumption countryside regions with a strong role for the private sector services.
The inclusive-growth policy approach is characterized by major investments in social capital with a particular focus on deprived areas, on overcoming internal and external borders building cross-border metropolitan regions, and on balancing development capacities between the EU core area and peripheral areas. The demographic structure of Europe and its challenges (aging, labour force, etc), together with the neighbouring countries” opposite trends represent a crucial issue for a cohesive-growth policy approach.
We hypothesise that accessibility to the nearest urban centre, good secondary networks and levels of service provision (stronger focus on local accessibility than to the European scale) will be enhanced in this perspective, reinforcing (or creating) a polycentric structure based on small and medium-sized towns. At the same time attention is paid to policies on immigration and to increasing accessibility to services of general interests in small towns for rural residents, and increased accessibility to job opportunities and services, this will also include enhancing local public transport systems and public networks among small and medium-sized towns. Efforts to sustain services of general interest in risk-of-deprivation areas (accessibility to the nearest urban centre, good secondary networks and levels of service provision) would be key factors for maintaining population in difficult areas. Policies supporting the localization, or re-localization, of traditional firms in lagging-behind regions in order to gain from the competitive labour-force costs would be a way to boost economic growth and employment strategies in peripheral areas.
The sustainable-growth policy approach is characterized by a strong emphasis on improving the resource efficiency of Europe, especially in peripheral locations, through a proactive push of regions and cities toward greener economic development strategies, and supporting measures of adaptation to climate change and regional resilience.
Here policy would be directed toward the protection of environmental fragilities from the most-invasive human activities, management of the local eco-system and the promotion of a region’s natural and ecological assets. As there is a strong urban dimension to climate vulnerability, major investments would be focused on the drastic reduction in traditional polluting economic sectors, and more resources focussed on the green economy involving support of innovative ecological approaches. Large-scale investment would be directed to public infrastructures, together with policy and increased taxation aiming to reduce private forms of transportation. Traditional economic sectors such as intensive agriculture, forestry and mass tourism will be

ESPON 2013 97
penalized, while the protection of existing landscapes and natural resources will favour selective forms of tourism and integrated local communities” approaches.
7.2.2 The “ATTREG-future” model
This section considers the potential trajectories attractiveness into the future. The discussion is based on the ATTREG-future model, developed as part of the ATTREG project and detailed in the next Chapter 8 of this Scientific Report. This model has been formulated on attractions and outcomes, which reflect our understanding of the derived effects within the region and on other regions in the EU as well as the possible feed-back effects on the region itself.
Scenarios are often the starting point for (attraction) policy development; here the role of scenarios is to set the scene. Scenarios are intellectual devices for thinking about possible alternative futures (ESPON 2010f). The consequences of scenarios are often evaluated within a modelling framework and in the case of population, migration and labour force within a basic demographic model and a reference scenario modelling framework. Scenarios are rarely used as predictions of likely futures because there are so many uncertainties involved in their construction.
On the other hand scenario results, should as far as possible, reflect realities, involving such facts as basic technical/accounting identities and facts on human behaviour. In the case of scenarios for demographic development, a basic model technical/accounting identity is the primo-ultimo-identity, which ensures that changes in population is equal to the number of new born minus deaths plus in-migration minus out-migration. A fact can be behaviour as reflected in demographic behavioural equations, such as number of death’s as a function of death rates reflecting the underlying population and its age structure as well as rates from the years before.
Technically, the ATTREG-future model has been used to set-up a “reference-scenario”, which involves a forecast of population, migration, labour force, employment and unemployment, jobs and GDP per capita. The reference scenario should not be seen as the “true story” on future regional development.
For our scenario model, we have, after a process of reflection, decided to use the following variables (derived from those developed during RA3) as proxies representing the different policy levers available in relation to the three different policy scenarios.
Smart policy bundle
� Investment on the accessibility of places and transport connections, in order to increase spatial factors of economic development
proxies: 1) ranking of airport; 2) accessibility through road network
� Boosting tourism performances and investment in tourist facilities and infrastructures
proxies: 3) tourism accommodation - tourism bed; 4) accessibility through road network
� Investment on Research and Development strategies and on high education, and attracting high skill migrants
proxies: 5) tertiary educated workforce; 6) enhance provision in higher education
Sustainable policy bundle
� Protection of cultural and natural environments, implementing the number of monuments and re-valuing environmental sites protecting from antropic pressure
proxies: 1) monument index; 2) Natura 2000 area

ESPON 2013 98
� Limitation of polluting factors in particular related to transports (higher cost of fuel, taxation, etc.)
proxies: 3) reduction of airport ranking; 4) reduction of accessibility
� policies related to quality of life and capacity of retention, in particular for the younger population
proxies: 5) life satisfaction; 6) Pensionable age ratio
Inclusive policy bundle
� Investment on social capital supporting residential economy and the quality of place
proxies: 1) NACE G-I employment; 2) life satisfaction
� Investment on the accessibility of services of general interest and through employment of teachers, doctors, etc.
proxies: 3) public sector employment; 4) satisfied with health services
� Investment on education and on services to youngest populations
proxies: 5) enhance provision in higher education; 6) pensionable age ratio
Table 7.1 represents the combination of the previous step and the outcome of our previous RAs activity, using a scenario matrix.
Table 7.1: Policy bundles in the ATTREG Future model
(Smart growth) (inclusive growth) (sustainable growth)
Monument index +
Pop density = ? = ? = ?
Rank of airport + -
Tourist beds +
Accessibility ++ -
GDP pre capita = ? = ? = ?
Tertiary educated workforce +
NACE G-I employment +
Small seasonal difference
NATURA 2000 area +
Satisfied with health service +
Public sector employment + +
NUTS2
Student ratio + +
Life satisfaction + +

ESPON 2013 99
The combination of the previous phase can be schematized in the first row, where the three policy options are distinguished. They will be cross-combined with the scenario indicated by DEMIFER project, and hypothesising the application of policy bundles in specific areas:
• Convergence Regions: areas as defined in EU policy with less than 75% of the EU average GDP.
• Cluster 4 areas or “Overheating” regions: areas that RA3 identified as being attracting and retaining high levels of migrants/visitors;
These two categories represent “extremes” in terms of regional development that requires different approaches to support endogenous development based on attractiveness and territorial capital as we have defined them. Moreover, the Cluster 4 areas appear to have done rather badly in the post-2007 crisis, suggesting that there was an element of “overheating” taking place in the previous period which has led us to view these areas as “fragile” in terms of their past and future development, thus they pose new challenges for policy makers.
Economic crisis and evaluation of attraction development/attraction policy with the ATTREG-
future model
There is an important point that needs to be made about the application of the ATTREG-future model. Although the model can be characterized as an “extended regional demographic model” (as compared with the DEMIFER model), it does not adequately take into account the effects of the current economic and financial crisis on migration and tourism flows: In the statistical analysis of the relations between territorial capital and outcomes, on which the ATTREG-future model rely, only the variable GDP per capita has been included. The fact that economic variables (such as regional debt ratios, wage and price development etc.) have only sporadically been included in the analysis, restricts the generality of the ATTREG-future model. This must be emphasized before drawing the final conclusion on the results of the impact from attraction development / attraction policies.
The reason for this – as discussed in the presentation of the results from the statistical analysis on territorial capital and outcomes – is
• ESPON-database was only fully available for the pre-crisis period 2001-06
• Data on key economic variables – such as regional debt ratios, wage and price development etc. are not available in the ESPON-database
In the technical documentation of the ATTREG-future model, a theoretical model on how to include market variables into the ATTREG-future model as well as how to develop the ATTREG-future model into a combined extended demographic and regional economic model is outlined.
7.3 Scenario projections and policy interpretation
In the following sections we present the scenario maps for each policy bundle, providing a set of configurations/scenarios on population, job and GDP, based on the assessment of both the “difference from the baseline scenario” map and the absolute projection of the trends according to the ATTREG future model.
7.3.1 Inclusive Scenario – Convergence Regions
Maps 40-45 show a decrease in population loss from peripheral regions toward central Europe and toward the most attractive areas. We can see rebalancing effects concerning the main trends

ESPON 2013 100
but not so evident (and less effective than the other policy bundles): the inability to attract that characterizes Convergence regions tends to persist. Nevertheless, we can see processes of growing attractiveness that are expressed in the form of regional clustering which suggests that the regions concerned (Spanish regions, southern east Polish regions, Romanian and Greek regions) are performing in a similar manner.
In terms of employment, the increase in job opportunities is not particular significant, except for some specific regions with potentials. Somewhat surprisingly it appears higher than the effect of the “smart” policy bundle. Moreover, it tends to even out the concentration of jobs in the coastal / touristic areas. However, the inclusive scenario is the only policy bundle that does not provide a direct correlation between job opportunity and mobility of population, probably due to the redistributive capacity and welfare effect of the policy bundle.
This scenario shows a diffuse increment of GDP in all the regions, again with some clustering effects (with the exception of the Baltic regions and the UK convergence regions). In general terms, it appears to make a contribution to counterbalancing the concentration of GDP in the core of Europe. It is interesting to notice that there is a certain discrepancy between GDP and employment in the regions, probably due to the role of investment in the public sector, which has a direct effect in improving redistributive capacity but a lower capacity in terms of producing job availability.
In terms of metropolitan areas, there is a decrease in the role of big metropolitan areas as attracting hubs (especially in the wealthier regions) in favour of a better territorial balance with less-urbanized regions. It is also evident in the decrease of job opportunities, which favours smaller urban areas (and the regions surrounding metropolitan areas). In addition to the other criteria, GDP shows a slowing down effect on the general trend to increase in metropolitan areas where the policy bundle has been applied.
7.3.2 Smart Scenario – Convergence Regions
This scenario provides a more varied picture in comparison to the other policy bundles. Nevertheless, there are important cluster effects among regions. What emerges from Maps 46-51 is a lower capacity to attract population from other regions (in this case from those macro areas that are close to the Convergence Regions). At the same time, coastal areas generally perform positively, probably due to the presence of airports and the specific performance of the younger population.
The distribution of population and job availability tends to have the same spatial patterns. It indicates a straight-forward relation between these two factors: it is a policy bundle that strongly correlates the mobility of population with job availability in regions. In terms of employment, a variety of effects are presented, for instance a scattered effect in some UK regions, the slowing down of the projections in the Baltic regions and at the same time a reinforcement of job availability in the Scandinavian areas.
In general, it seems that this policy bundle is able to correlate population mobility, job opportunity and GDP, but within limits. Looking also at the figures on GDP, which tends to grow in all the peripheral region in which the policy bundle has been applied (except for the Baltic and UK regions and eastern Germany), it seems that this policy bundle does not affect those regions with limited territorial capacities and a predisposition for smart growth strategies.
With reference to metropolitan areas, it seems that the urban nodes are characterized by a stronger attractive capacity, with increasing migration flows without carrying effects into surrounding regions, though. These are the areas with the main availability of jobs and a higher concentration of GDP, which shows that they have a growing role as territorial hubs.
ESPON 2013 101
7.3.3 Sustainable Scenario – Convergence Regions
This scenario, illustrated in Maps 52-57, has a capacity to generate attractiveness in almost all the region applying the sustainable policy bundle, with a specific capacity to support the regions that remain less attractive in absolute terms. The general picture is counterbalanced by a decrease of population (decreasing attractive factors) in the neighbouring regions. Also in this scenario the level of job availability coincides with population distribution and GDP distribution, indicating a straight-forward relation between these three factors.
However, it is the policy-bundle scenario that appears least effective in terms of increasing GDP capacity, probably due to a more investments in quality of life (and soft factors). However, it has the greatest impacts on the regions that in absolute terms have less job opportunity and lower GDP, thus representing an important rebalancing role.
In terms of geographical characterization, the strongest attractive capacity is to be found in regions characterized by more rural and small-medium towns, while the metropolitan areas experience a decrease in attractiveness. This characterization can be seen for all the three factors under investigation (population, employment and GDP).
7.3.4 Inclusive Scenario – Overheating Regions
This policy bundle (in Maps 58-63) gives the impression of being able to “cool down” the “overheated” regions, producing a rare increase of population and mostly a decrease in population in comparison with the baseline scenario.
Moreover, the Metropolitan regions tend to redistribute their population into their neighbouring regions. The figure on job availability coincides with population trends (both in general and in the difference with the baseline scenario) and indicates a straight-forward relation between the two variables (which was not the case in its application in the Convergence regions). At the same time, the regions where the policy bundle is applied exhibit a modest increase in GDP, stretching the core area in which the main resources are concentrated.
Thus, in general, this policy bundle tends to stabilize the population and to reduce the fragility of those regions.
7.3.5 Smart Scenario – Overheating Regions
In this case (Maps 64-69), the effects concerning the diverse attractive capacity of population are varied and do not express a clear spatial logic. This policy bundle does not seem to be particularly effective in the regions to which it is applied, the performance of which mainly follows existing trends.
In terms of employment, however, the policy bundle seems capable of increasing job availability, while the effects on GDP are less pronounced. However, there is a macro geographical distinction between the Mediterranean arc (in which the policy bundle is mostly extensive applied) and the northern areas. In general, it seems that this policy bundle is able to be most effective in those regions that already exhibit a growing trend or macro regions with critical mass. Specific regions in the UK, in eastern metropolitan regions, and in Turkey do not seem to show any significant effects.
Concerning GDP, the general figure tends to indicate a certain effectiveness of the policy bundle in improving it in the Mediterranean area and in Ireland, in particular in those areas that are already characterized by positive performance (concerning Ireland, we have to take into account the specific pre-crisis time series we are referring to). On the other hand, application of this policy bundle to average-performing regions does not seem to be particularly effective.
ESPON 2013 102
7.3.6 Sustainable Scenario – Overheating Regions
The application of this policy bundle as illustrated in Maps 70-75 tends to increase the attraction of population in almost all the regions, in particular those of the Mediterranean area, but also some Metropolitan regions in the north of Europe. When these areas can form a macro-regional cluster (the Mediterranean arc, for instance) they tend to attract population from the neighbouring regions.
The general figure of employment distribution coincides with population trends (both in general and in the difference with the baseline scenario) and exhibits straight-forward relation between the two variables. However, this policy bundle indicates a certain effectiveness in increasing GDP, although less positive than other bundles.
7.3.7 General comments on the policy-bundles scenario
Having stated that the application of these policy bundles is subject to some unavoidable limits, that the general aim is to reflect on their spatial effects without any attempt at real future prediction, and moreover that this forecasting activity is based on a data series that does not include the crisis period, with all the consequences, it is possible to draw some general considerations about the outcomes presented in the previous pages.
The application of the three policy bundles provide us with interesting examples of spatial differentiation as a result of their impacts.
The inclusive policy bundle, in general, seems to have positive effects in increasing the performance of regions that are underperforming, and at the same time a negative effect on overheating regions. Thus, it shows a specific capacity to reduce disparities among EU regions. Here, the impacts on the labour force and employment seems to be mixed: in general they are negative for target regions where labour participation rates are high for young and old age groups, whereas the impacts are positive for those regions in which the decline in the population dependent employment outweigh the reduction in the labour force. However, among the various policy bundles, the inclusive one is the only one that does not show a strong correlation between job opportunity and mobility of population. This is probably due to its redistributive capacity and the effects on the welfare system. Here, the role of investment in the public sector has a direct effect in improving redistributive capacity but a lower capacity in producing job availability.
Concerning the smart policy bundle, it seems that there are different effects on Convergence regions as well for the over-heating regions. The impacts on the labour force and employment in general seem to be negative for the target regions where labour participation rates for young and old age groups seems to be high, whereas the impact are positive in case of regions with population dependent employment leads to increases in labour force.
In general, it seems that this policy bundle is able to correlate population mobility, job opportunity and GDP, but with some limits, and it seems that it does not affect those regions with limited territorial capacities and a predisposition for smart growth strategies. Indeed, application of this policy bundle on average-performing regions does not seem to be particularly effective. Finally, it appears that the sustainable policy bundle is able to determine positive direct effects in both region (convergence and overheating) to which we have applied the experiment, attracting population from the neighbouring regions, in particular those in the same Member State. However, it appears least effective in terms of GDP capacity, probably due to a more investments in quality of life (and soft factors). However, it has the most impacts on the regions that in absolute terms present less job opportunity and lower GDP, thus suggesting an important rebalancing role.

ESPON 2013 103
In general the inclusive and the sustainable policy bundles appear to have the capacity to rebalance the concentration of job availability and GDP in the EU core area. Moreover, the inclusive and sustainable policy bundles also seem to counterbalance the dominance of metropolitan areas. On the other hand, the smart policy bundle seems to provide a boost to the urban conurbations.
It is also possible to make a general comment on the applicability of the policy bundles.
The maps indicate that the application of the policy bundle in macro regions with a certain spatial continuity tends to be more effective, this is most probably due to the synergies induced by an extended and continuous spatial critical mass. It is the case with the scenario in the Convergence regions.
However, the experiments in the overheating regions seem to be less effective and meaningful. First, it is harder to find a rationale because of the odd territorial distribution of is application: mainly in the Mediterranean arc, some metropolitan regions, some scattered regions in UK, etc. Second, each of those regions presents a diverse configuration in terms of the variables that have been used for the analysis of the application of the policy bundles (population, job and GDP), which is reflected also in the spatial patterns of the outcomes.
7.4 General conclusions
The first point to make is that there are no (simple and easy) recipes for economic growth – a complex range of factors interact to determine economic growth and there is no simple relationship between increases in attractiveness and economic growth. Attractiveness can take a number of different forms and there is no inevitable link between forms of attractiveness and economic growth. Much depends on the forms of territorial capital present and how they are utilised (this may take place through a conscious process of mobilization, but may also occur through less formalised networks related to forms of social and cultural capital embedded within particular places that can be drawn upon). However, we now have a better understanding of several aspects of the overall process:
• There are different forms of mobility (i.e. related to specific groups or mobile populations), and these are driven by different assets,
• There are different typologies of territorial performance (stickiness, retentiveness).
• Economic growth can be one of the effects of attractiveness but not necessarily always of retentiveness.
• Some territories that were extremely attractive in the period up to 2007 have become “fragile” in the current crises – it appears that they may have been “overheating” and that their attractiveness was based on the attraction of flows that were not embedded in the local context.
• A longer term perspective suggests that territorial balance associated with a higher degree of territorial cohesion may be better suited to withstand crisis and generate sustainable economic growth and retain population.
• Territorial cohesion strategies that successfully address territorial capital are long-term strategies; in the short term they may be less ’successful” in terms of generating rapid economic growth, but they have demonstrated a capacity to make territories less fragile and development more sustainable.

ESPON 2013 104
Based upon the regional analysis of RA3 and the more in-depth analysis carried out through the case studies in RA4 it is also possible to make a number of general suggestions for policy. However, it is important to emphasise that the mobilization of regional attractiveness is a combination of top-down EU and state policies and bottom-up initiatives of local and regional stakeholders such as municipalities, universities and businesses.
In view of the transition to a global knowledge-based economy it has become particularly important for regions to invest in the development of (higher) educational institutions and improve access to them. Another policy took frequently used to attract audiences is place marketing. While some regions are more selective, targeting specific groups, other regions have no explicit policies to attract particular audiences; the former is more likely to be explicitly related to the assets of a region and to be part of an integrated strategy while the latter is more of an uncoordinated “scatter-gun” approach. One factor that may drive regions to adopt a more selective and focussed approach is that when the costs of agglomeration (diseconomies) become higher than the benefits regions tend to become more selective: paying more attention to quality and the contribution of migration and tourism to the prosperity and wellbeing of current citizens.
In relation to the development of a strategic vision and associated set of integrated policies It is important that those responsible for policy carefully identify the forms of territorial capital present, assess its strengths and weaknesses, develop an integrated vision, strategy and set of policies that build upon existing territorial assets while seeking to address deficiencies (in relation to the overall strategy) in the existing territorial capital. Such an approach requires a long term perspective with clear objectives that will be pursued in an integrated manner. This is more likely to lead to sustainable forms of development better able to withstand the “storms” of the current crisis.
In terms of the mobilization process it is important to bear in mind the “time” issue. This refers to the recognition that it requires time to build governance processes, as well as to change territorial performance through implementation and mobilization of assets and thus changes in patterns of mobility. There will inevitably be, a somewhat lengthy, time-lag between actions and results, and this requires a long term perspective. In particular, the building of institutional capital, which in a cross-border area implies the definition of cross-border capacity to cooperate, requires time in building vertical and horizontal relationships (mutual trust, institutional settings, etc), as well as the involvement of citizens and the private sector.
Inevitably most attention is given to economic development strategies. However, our analysis of attractiveness, with its focus on the wider aim of territorial cohesion, suggests a somewhat different, broader, approach to attractiveness. Such a change implies the introduction into both analysis and strategy of the territory as an explicit factor affecting mobility of populations, suggesting a need to think differently, and more holistically, about a region’s territorial assets and their mobilization through specific policies (or policy bundles).
The case studies have also shown that targeting economic development and building critical mass for international competition may be easier and, to a certain extent, more politically neutral than creating a long-term strategy that seeks to internally balance different “logics” of development. However, this does not necessarily translate into long term sustain “success”, such forms of developed are particularly vulnerable to external (exogenous) changes as the post-2007 period has shown.
Finally, the case studies have identified the crucial role of strategic spatial planning: the role of a vision of the territory assists in the process of generating a consensus based on specific territorial considerations, and the associated discursive apparatus facilitates the coordination of various interventions (in the sense of developing a shared understanding of their role and aims. In this sense visioning is at the very least a supportive structure for the coordination of ongoing processes.

ESPON 2013 105
Valuable as a shared vision is we should not forget that an efficient and effective implementation capacity is crucial and should not be underestimated. The institutional setting of governance processes should pay attention to the features that support the creation of an effective combination of vision, implementation, feedback and revision of the strategy to allow for necessary reorientations. These features relate to coordination among actors, a dedicated budget, a monitoring system and a study of the entire territory beyond the administrative borders, and a communicative strategy that supports the legitimization of the process. This also requires project-based cooperation (i.e. around concrete actions) and nested-scale territorial analysis which are complementary to the processes of formal institutionalization that occur in the formation of governance capacity/mechanisms both within a region and in cross-border regions.

ESPON 2013 106
8 THE ATTREG FUTURE MODEL: DOCUMENTATION AND APPLICATIONS
Bjarne Madsen and Jie Zhang
8.1 Introduction
This chapter provides a technical backbone to the policy analysis illustrated in the previous Chapter 7 of this Scientific Report.
The exercise of building “scenarios” for future development in this project rests on a number of assumptions regarding attraction processes and their effects on local development:
• Firstly, future development is often assumed – ceteris paribus – to be “path dependent”, which implies that the future is similar to the past: following this, population develops according to basic and stable demographic factors, such as the regional patterns of mortality, fertility as well as path dependent patterns of interregional migration. Similarly, tourism develops according to path dependent patterns of travelling flows.
• Secondly, interregional migration and tourism flows are determined by the relationship between territorial capital/attractiveness and migration/tourism flows: the attractiveness of a city or region can be assessed by analyzing its ability to attract and retain users (visitors, residents, firms) and investments that are considered beneficial for a region. This ability to attract depends on the quality of the (living, business, visitor) environment. Cities and Regions can be considered attractive if they have sufficient urban amenities to offset agglomeration disadvantages such as high housing and land prices.
• Thirdly, the attractiveness of a place and its quality are based on aspects both unique and provided by government’s actions and by other semi-public and private actors. It brings to the fore the (complex) notion of territorial capital and the mobilization of assets. This last point directs attention to the notion of multilevel governance and the way assets are used (or mobilized by actors) to make a place attractive.
• Fourthly, future development is the results of cumulative mechanism, involving spill-over mechanism from changes in outcomes (flows of migrants and tourists) to population, labor force and jobs, which in turn have feed-back impacts on the territorial attractions: These cumulative impacts involve changes in population density from inflow of migrants, which in turn changes the attractiveness and will modify the “direct effects from changes in attractions”. It also involves derived changes in accessibility from changes in population and tourism (such as congestion problems), which in turn involve cumulative changes in the territorial attractions of a region. And it involves impacts on regional wealth, measured by GDP per capita derived from changes in the ability to export, derived from changes in labor force and employment and jobs.
• Fifthly, migration and population development in turn interacts with the regional economic system: In the regional markets demand and supply of commodities and labor, which involves the determination of regional wage rates (GDP per capita) as well as regional commodity prices. This in turn influences migration and population. However, even though it seems relevant to include regional market variables, especially to understand migration and population changes during the last years of the financial and debt crisis, they have only sporadically been included in the analysis.
ESPON 2013 107
The main conclusion of the analysis of regional attractiveness into the future is that relations between assets and outcomes not only depend upon present relations, but also upon future spillover and feed-back mechanisms, which might dynamically affect the results and policy implications from the static analysis. It also seems plausible that migration flows as well as the resulting population interact with changes in the market system, although this has only sporadically been included in the analysis that follows.
The future development can be examined from both quantitative and qualitative perspective: Within quantitative approaches, the use of multivariate models of the relations between mobility and outcomes (Chapter 5 of this Scientific Report) can further be examined on the basis of a dynamic quantitative model approach (the ATTREG-future model), which include the spill-over and feed-back mechanism between attractions and outcomes.
The quantitative analysis based on the ATTREG-future model concludes, that the total effect in general is different from the direct effects from changes in attractions. Further, there are negative effects on other regions, because migrants come “from somewhere”. In terms of the time profile, the effects might be smaller or even negative just after the introduction of an attraction policy, but later impacts will increase and be higher than the direct effects and peak after 10-20 years.
In a qualitative approach, case studies can apply. This might be undertaken by case study based upon panel of regional stakeholders, who explore the trajectories and ambitions for regional attraction under relevant scenarios / attraction policy experiments. Part of the qualitative approach would therefore include a confrontation of the results of the quantitative analysis (results from the multi-variate models of the past together with the ATTREG-future model scenario forecast) and the findings from the qualitative case studies.
In Section 2 the analysis of mobility and outcomes is presented together with the basic set-up for the analysis of the cumulative impacts from changes in territorial attractions on mobility flows included in the ATTREG-future model.
The point of departure for the present analysis is demographic development and modelling. In Section 3 the basic structure of interregional demographic models are presented. The DEMIFER MULTIPOLES-model is presented as ESPON state of the art demographic models together with the scenario analysis included in the DEMIFER project. The MULTIPOLES-model is an example of an interregional demographic model with no interaction between territorial capital and attraction and population and migrations. The DEMIFER scenario approach is presented as reference for the impact studies with the ATTREG-future model.
This is in Section 4 followed by the presentation of the structure of the extended interregional demographic model developed for scenario analysis in the ATTREG-project. This involves an examination of the structure of the ATTREG-future model for scenario building, which can be characterized as an extended demographic model with interaction between territorial capital and attraction and population and migrations is examined.
In section 5, the results of the following 3 packages of attraction policy experiments are presented:
• Smart policy bundle involving
− Investment in accessibility of places and transport connections, in order to increase spatial factors of economic development
− Boosting tourism performances and investment in tourist facilities and infrastructures − Investment in Research and Development strategies in high education and attracting high
skilled labour
• Sustainable policy bundles, which involves

ESPON 2013 108
− Protection of cultural and natural environments − Implementing a number of tourist attractions and re-valuing environmental sites
protecting from antropic pressure − Limitation of polluting factors in particular related to transports (higher cost of fuel,
taxation, etc.) policies related to quality of life and capacity of retention, in particular for the younger population, with investment in public sector
• Inclusive policy bundle, involving
− Investment on social capital supporting residential economy and the quality of place − Investment on the accessibility of services of general interest and through employment
of teachers, doctors, etc. − Investment on education and on services to youngest populations
The impacts of the 3 attraction policy packages are examined for the following two clusters of NUTS 2 regions:
• Convergence (“Objective 1”) Regions
• Overheating Regions
Section 6 summarizes the analysis.
In Appendix 3, a mathematical presentation of the basic demographic model and the ATTREG-future model together with the mathematical solutions to the model are provided. The solution to the model is applicable in evaluation of the direct effects and the derived effects of attraction policies as well as the impacts during time, involving a comparison of the impacts of attractions policies, which can be derived directly from the statistical analysis of changes in territorial capital and migrations flows and population and the total direct and derived impacts over time.
8.2 Scenarios on attractions and mobility
The prerequisites for this chapter are the exploration of relationships between territorial assets and outcomes. In Chapter 5 of this Scientific Report results of the analysis of territorial attractiveness and mobility flows across Europe are presented. On the basis of the concept of territorial capital it was found that flows of people, such as regional migration flows (at the NUTS2-region level) by three age cohorts, tourist divided into domestic and international visitors react to differences in attractions. In the analysis, 5 types of territorial capital was identified – antropic capital, economic and human capital, environmental capital, institutional capital and socio-cultural capital. It was found that mobility flows for the NUTS-2 region can be explained with differences in territorial assets with different emphasis to the different types of territorial capital for different audiences.
The structure of the ATTREG model presented in Chapter 5 is summarized in the following Fig. 8.1 where it can be seen that the in-migration depends upon 19 different attraction variables. The first 4 attraction variables (see the upper-left corner) are included in the antropic capital (marked with an “A”), which in Chapter 4 is defined as “man-made features of the territory like cultural heritage, population density, have a large metro area within, tourism infrastructure”. From Fig. 8.1 the following antropic capital variables can be identified:
• Monuments and other tourist sights valued 2 stars in TCI "green guides series"
• Rank of airports by passengers embarked in airports within NUTS2 region
• Number of tourism accommodation beds in NUTS2

ESPON 2013 109
• Location of a metropolitan urban area in NUTS2
The four (exogenous or non-cumulative) antropic capital variables all have a direct impact on migration and tourism flows: The higher the number of monuments and other tourist sight, the higher the rank of airport etc. the higher the in-migration and the higher the tourism flows. From the diagram it can be seen that in-migration in turn determines the future population together with out-migration and born and deaths.
Figure 8.1: Logical structure of the ATTREG model
Besides, Fig. 8.1 shows that the population development influences two other types of antropic capital (double-lined box in the centre of the figure), which have wider (endogenous or cumulative) effects on migration and tourism flows and which are
• The crude population density region and
• Sum of population accessibility scores (working age population accessibility per hour travel distance)
These two antropic capital attraction variables in turn influence the in-migration rates: Higher population density leads to higher in-migration of young and lower in-migration of old population and lower accessibility to lower the in-migration. These impacts represent the cumulative/endogenous territorial capital – outcome effects: If the population increases, the population density by definition increases, which leads to higher in-migration flows; which leads to higher population and population density etc. Similarly, higher population leads to lower population accessibility scores, which reduces the in-migration. A number of “rounds” in Fig. 8.1

ESPON 2013 110
are needed to find the net effects from changes in attractions. From this it can be concluded, that the results (Russo et al. 2011 based upon analyses with multi-variate models of the relations between mobility and outcomes) have to be adjusted with the cumulative effects from changes in population density and accessibility to capture the total impacts of changes in regional attractions.
Further, Economic and human capital (marked with an “E” in Fig. 8.1) explains migration flows motivated by economic and human capital factors, such as differences in employment, levels of income, prices on commodities (such as housing prices), productivity (determined by human skills) etc. In Chapter 4 the following three economic and human capital attraction variables (out of which two are exogenous/direct and one is endogenous/cumulative variables) have been included:
• GDP per capita (endogenous/cumulative)
• % of working age adults with tertiary education (exogenous/direct)
• % of consumption-related employment (exogenous/direct)
The higher the share of working age adults with tertiary education and the higher the relative consumption related employment are in general the higher the in-migration rates etc.
For the GDP per capita attraction variable, the multivariate model analysis show positive signs for the young and middle age cohort migration and negative of the old age cohort migration. This in turn gives cumulative effects in addition to the static, direct effects from changes in exogenous territorial capital variables.
Following the figure three other types of territorial capital – Environmental capital, Institutional
and socio- and cultural capital – are included in the explanation of mobility flows. Chapter 4 defines environmental capital as the value of climate variability, geographic characteristics and protected green areas. Institutional reflect the fact that people seek “good institutions” and “freedom and openness”. And socio-cultural capital is defined as “age structure of population, level of education, social satisfaction etc.” Social and culture assets include the effect of being together with people with the same age and educational background as well as the degree of social problems and “satisfaction with life as a whole”.
From a policy point of view, not all exogenous attraction variables can be used as instruments in an “attraction policy”. Some variables such as the “coastal” and “island” variables are just given by definition and cannot be manipulated in an attraction policy. In Fig. 8.1, this type of variables is marked with an “N”. Other variables (which in figure 1 are marked with a “P”), such as
• the “ratio of the number of university students against people aged 15 to 24 years” and
• “% of respondents who were more satisfied with the ‘state of health services in country nowadays’ relative to the EU median score”
are all variables, which applies as instruments in an attraction policy. The university student-population ratio can be decided directly (through capacity increases at universities), whereas the state of health services satisfaction rate only can be manipulated indirectly (though improvements in level of service within health services).In the ATTREG-future model attractions are assumed to influence gross in-migration. But following Fig. 8.1, the in-migration “come from somewhere”, which might be from other European regions and from “rest of the world”. In other word: Migration patterns are assumed to be “path dependent” where the origin of the migration flows follows the historic or average pattern of migration. This means that the net-migration is a function of the gross in-migration driven by changes in attraction and “path dependent pattern of out-migration”: Migration takes place, when attractions increases and migrants will come from regions which have a tradition to migrate to the region in study. Following figure 1, the

ESPON 2013 111
population is determined by the primo population, where in-migration is added and out-migration is sub-tracted as well as new-born are added and deaths are subtracted to determine the ultimo population.
In this chapter experiments with the ATTREG-future model showing the impact of changes in the attraction variables (which are exogenous and which can be politically decided) will be presented. Further, the following question has been addressed:
• What are the policy implications of the project findings?
• How can public actions enhance the factors of attractiveness?
• More specifically, what is the role of EU policy in enhancing the attractiveness of EU regions within the framework of the territorial cohesion strategy?
• What type of indications can the project provide to enhance the functioning of multilevel governance processes?
In the presentation, regions can be seen as complementary to one another in the sense that they are caught up in mutual exchanges of specialized products and strongly competitive with one another, securing their own collective interests in a world of finite resources. Each city or region, as a community, has a direct interest in securing new inward investments, in widening external markets for its products, and in attracting visitors from outside (Camagni 2002).
Before results are presented, the ATTREG-future model will be presented. And before that two aspect of modeling population development is presented: Firstly, as reference completed and on-going work within the ESPON on demographic development and population forecast is presented. The point of departure is the state of the art demographic analysis at the European level in the ESPON-project called DEMIFER (ESPON 2010). As a key element in the DEMIFER-project a demographic model for NUTS-2 regions was developed (the MULTIPOLES model) and population and labour force forecast and scenario analysis at NUTS-2 level was undertaken. In the ATTREG-project an extended interregional demographic model based upon an analysis of territorial attractiveness and mobility flows across Europe has been developed. In this chapter, the ATTREG-future model is documented, including the results of scenario experiments with the model.
Secondly, it is important to stress that economic factors such as the financial crisis and its impact on the regional labour and commodity have not fully been included in the analysis of population development, especially in understanding development in regional migration flows. One reason is that migration behaviour has been analysed for the period 2004-6 on the basis of development in relations between outcomes and territorial capital for the period 2001-2003. Secondly, economic variables such as real estate prices have only sporadically been included in the economic and human capital as part of the territorial capital – outcome effects.
8.3 Interregional demographic models and scenarios
In this Chapter the results for the static ATTREG model presented in Chapter 5 are integrated with a demographic analysis based upon an interregional demographic model. The ATTREG-future model has been developed on the basis of the conventional demographic model extended with the interaction between territorial capital and outcome. In the ATTREG-future model interregional spill-over and feed-back effects from migration and population and from territorial capital to outcomes have been included into the basic structure of the conventional regional demographic model. The ATTREG-future model has in turn been used for scenario analysis: What

ESPON 2013 112
happens, if the territorial capital or the attractions changes, and what are the spill-over and feed-back effects on the population and labour force from changes in territorial capital or attractions?
The point of departure is the state of the art demographic analysis at the European level in the ESPON-project called DEMIFER (ESPON 2010). As a key element in the DEMIFER-project a demographic model for NUTS-2 regions was developed (the MULTIPOLES model) and population and labour force forecast and scenario analysis at NUTS-2 level was undertaken. In the ATTREG-project an extended interregional demographic model based upon an analysis of territorial attractiveness and mobility flows across Europe (Russo et al. 2011) has been developed. In section 4 and 5, the ATTREG-future model is documented, including the results of scenario experiments with the model.
As a reference in section 3, conventional migration models, including the MULTIPOLES and the demographic core of the ATTREG-future models are presented. As further reference an overview of how the MULTIPOLES model has been used in forecasting and scenario analysis for European regions is provided. Section 3 gives a graphical presentation of the basic demographic model which includes an in-built interaction between the regional population and migration flows, but with no interaction between territorial capital and outcomes included.
8.3.1 Migration and population – model based scenario analysis with no links between territorial capital and outcomes - The DEMIFER-project
Scenarios are intellectual devices for thinking about alternative futures (ESPON 2010f). The consequences of scenarios are often evaluated within a modelling framework and in the case of population, migration and labour force within a basic demographic model and a reference scenario modelling framework. Scenarios are hardly ever used as predictions of likely futures because there are so many uncertainties involved in their construction. On the other hand scenario results as much as possible should reflect realities, involving such facts as basic technical/accounting identities and facts on human behaviour. In the case of scenarios for demographic development, a basic model technical/accounting identity is the primo-ultimo-identity, which ensures that changes in population is equal the number of new born minus deaths plus in-migration minus out-migration. A fact can be behaviour as reflected in demographic behavioural equations, such as number of deaths as a function of death rates reflecting the underlying population and its age structure as well as rates from the years before.
In this section the MULTIPOLES model is presented, together with an examination of the DEMIFER scenario methodology. Although the DEMIFER-scenarios only can been seen as “consistent and intellectual devices for thinking about future”, the MULTIPOLES model in the DEMIFER scenario analysis reflects basic technical/accounting identities and assuming constant (or scenario-corrected) behaviour.
The aim of the ATTREG-future model compared with the MULTIPOLES model is to increase “realism” in the scenario analysis: The main object is in first step to include the insight into the demographic model of the analysis of territorial attractiveness and mobility flows across Europe with the intension of increasing the realism of scenarios for population and labor force. This will be the point of departure for the presentation of the ATTREG-future model in section 4. In second step both direct and derived impacts of changes in attraction development and policies are evaluated in the case study on scenarios, which is presented in section 5.
8.3.2 Reference and Policy Scenario assumption in MULTIPOLES
In the first step three reference forecasts of population and labour force with MULTIPOLES from 2010 to 2050 including 5 year periods was undertaken:
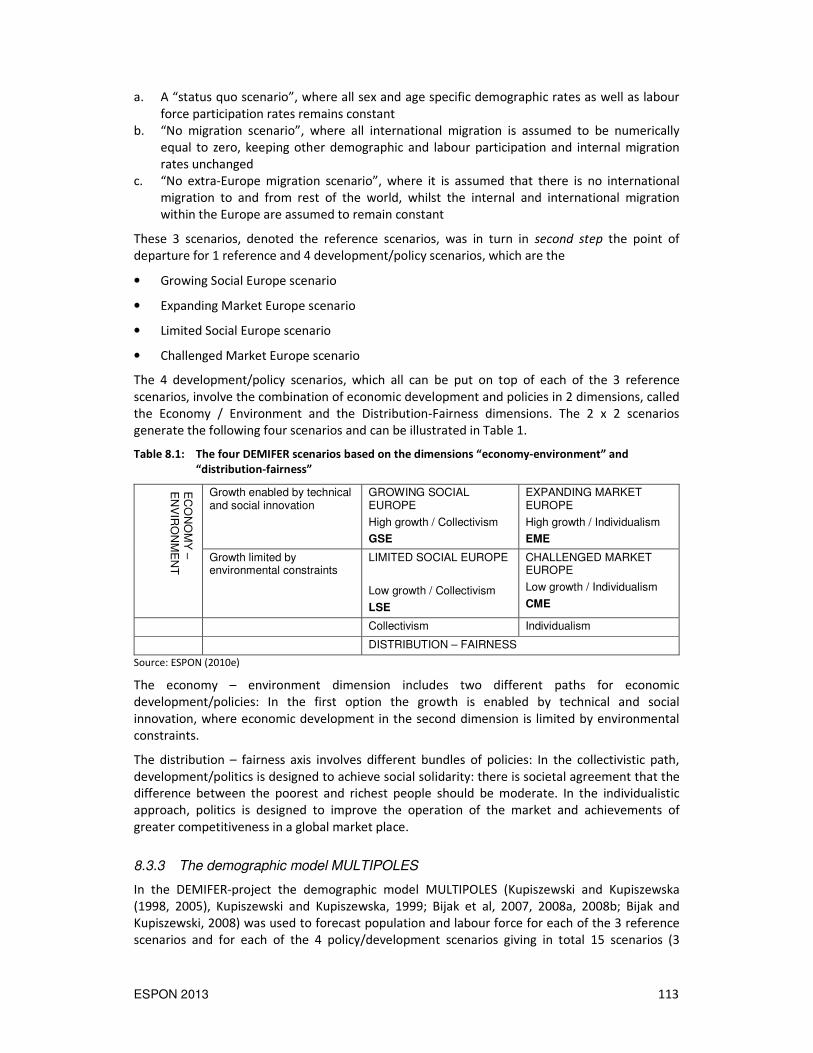
ESPON 2013 113
a. A “status quo scenario”, where all sex and age specific demographic rates as well as labour force participation rates remains constant
b. “No migration scenario”, where all international migration is assumed to be numerically equal to zero, keeping other demographic and labour participation and internal migration rates unchanged
c. “No extra-Europe migration scenario”, where it is assumed that there is no international migration to and from rest of the world, whilst the internal and international migration within the Europe are assumed to remain constant
These 3 scenarios, denoted the reference scenarios, was in turn in second step the point of departure for 1 reference and 4 development/policy scenarios, which are the
• Growing Social Europe scenario
• Expanding Market Europe scenario
• Limited Social Europe scenario
• Challenged Market Europe scenario
The 4 development/policy scenarios, which all can be put on top of each of the 3 reference scenarios, involve the combination of economic development and policies in 2 dimensions, called the Economy / Environment and the Distribution-Fairness dimensions. The 2 x 2 scenarios generate the following four scenarios and can be illustrated in Table 1.
Table 8.1: The four DEMIFER scenarios based on the dimensions “economy-environment” and
“distribution-fairness”
EC
ON
OM
Y –
E
NV
IRO
NM
EN
T
Growth enabled by technical and social innovation
GROWING SOCIAL EUROPE
High growth / Collectivism
GSE
EXPANDING MARKET EUROPE
High growth / Individualism
EME
Growth limited by environmental constraints
LIMITED SOCIAL EUROPE
Low growth / Collectivism
LSE
CHALLENGED MARKET EUROPE
Low growth / Individualism
CME
Collectivism Individualism
DISTRIBUTION – FAIRNESS
Source: ESPON (2010e)
The economy – environment dimension includes two different paths for economic development/policies: In the first option the growth is enabled by technical and social innovation, where economic development in the second dimension is limited by environmental constraints.
The distribution – fairness axis involves different bundles of policies: In the collectivistic path, development/politics is designed to achieve social solidarity: there is societal agreement that the difference between the poorest and richest people should be moderate. In the individualistic approach, politics is designed to improve the operation of the market and achievements of greater competitiveness in a global market place.
8.3.3 The demographic model MULTIPOLES
In the DEMIFER-project the demographic model MULTIPOLES (Kupiszewski and Kupiszewska (1998, 2005), Kupiszewski and Kupiszewska, 1999; Bijak et al, 2007, 2008a, 2008b; Bijak and Kupiszewski, 2008) was used to forecast population and labour force for each of the 3 reference scenarios and for each of the 4 policy/development scenarios giving in total 15 scenarios (3

ESPON 2013 114
reference scenarios x (1 reference scenario + 4 policy/development scenarios)). MULTIPOLES was revised considerably in the DEMIFER-program, among others to improve the scenario setting and analysis of all the results at the regional level.
MULTIPOLES follows the structure of a basic demographic model14, where the population in region r in year t is determined as
..
........................................................................................................................................................ (1)
In simple versions of basic demographic models, the demographic rates (such as mortality rates, fertility rates and migration rates) are often assumed to be equal to the rates of last year.
................................................................................ (2a)
.......................................................... (2b)
................................................... (2c)
....................... (2d)
Finally, labour force is determined as the population multiplied by labour participation rates:
....................................................... (4)
Using these rates in forecasting and assuming that in-migration rates are constant, population and the labour force in the following period follows by definition.
8.3.4 Reference and policy scenarios and the demographic model MULTIPOLES
Although the simple population forecast model seems simplistic, it is an efficient tool in basic evaluation of population development and a bench marking what happens if everything else is unchanged. For the 3 reference scenarios, the results follow directly from equation (1)-(4): Death and fertility rates and labour force participation rates are assumed unchanged. Migration rates are assumed to be constant (in the “Status quo” scenario) or equal to 0 - in the “No migration scenario” both the international migration to Europe and the rest of the world are assumed to be 0, whether in the “No extra-Europe migration scenario” only the international migration to rest of the world are assumed to be 0.
Opposite, for the 4 development/policy scenarios assumptions on the development/policy for the demographic, migration and labour participations rates should be decided. The 4 development/policy scenarios give differences in assumptions for demographic policies in the respective fields of development/policy, such as development/policies on
1. mortality rates
2. fertility rates
3. internal migration rates
14 In MULTIPOLES the demographic rates is modelled on the basis of the average population of the year t and t-1:
........................................................................ (3.a)
................................. (3.b)
........................................ (3.c)
Further, in MULTIPOLES the migration between regions is modelled in geographical levels with separate equations for the internal migration, the international migration within Europe and the international migration to and from the rest of the world.

ESPON 2013 115
4. external migration rates (Immigration (in-migration) from within Europe)
5. extra Europe migration rates (migration to and from the rest of the world outside Europe)
6. labour force participation rates
For each of the 4 scenarios the DEMIFER project established different assumption on the each of the 6 fields of development/policies.
An example: In the case of mortality rates, 6 sub-factors are assumed to be important for mortality, namely the development/policies concerning:
• Lifestyle: Smoking
• Lifestyle: Diet/Obesity
• Lifestyle: Drinking & Drug Use
• Medical advances
• National health inequalities
• Regional health inequalities
For each of the 6 sub-factors assumptions behind the 4 scenarios have been setup. The quantification was discussed/evaluated by experts. In appendix 1 a sub-specification of the elements in each of the 6 development/policy areas is presented.
8.3.5 Scenarios for migration flows and the demographic model MULTIPOLES
Especially for migration rates, the assumptions in the reference and policy scenarios are relevant for the analysis of the links between territorial attractiveness and mobility flows. In the DEMIFER-scenario, it is assumed, that in the scenarios reflecting collectivism (the GSE and LSE-scenarios) the differences in the Destination Attractiveness Ratios15 diminish, which in most cases will reflect a de-concentration in population driven by higher migration flows to areas, which in the reference scenario only received limited in-migration. Opposite for the scenarios, that reflect individualism (the EME and CME–scenarios), where it is assumed, that the differences in Destination Attractiveness Ratios increase. As a consequence, migration to the regions which in the reference scenario received most in-migration, will receive even more migration flows, which in most cases will lead to a regional concentration of population.
For scenarios taking into account the limitation in economic capacity due to environmental constraints (the LSE and the CME-scenarios) compared with scenarios with no environmental constraints (the GSE and EME-scenarios) it does not systematically influence the Destination Attractiveness Ratios and therefore it does not a priori lead to convergence/divergence. However, total international emigration from outside Europe is at a higher level for the scenarios with no environmental constraints than for scenarios with environmental constraints. The reason for this is that the European growth in GDP pr. capita in the no-environmental constraints scenarios is at a higher level than the environmental constraints scenario, which will lead to a higher international in-migration from outside Europe.
15 The Destination Attractiveness Ratio (DAR) is equal to Share of migration inflow/Share of population. For a region which received a smaller share of migration, than its share of population will ceteris paribus in the long run loose share of population. For a region with higher share of in-migrants than its share of population the share of population will ceteris paribus in the long run have an increasing share of population. A convergence in DAR’s will in long run lead to a de-concentrated regional development, whereas divergence in the DAR’s will lead to concentration in regional development.
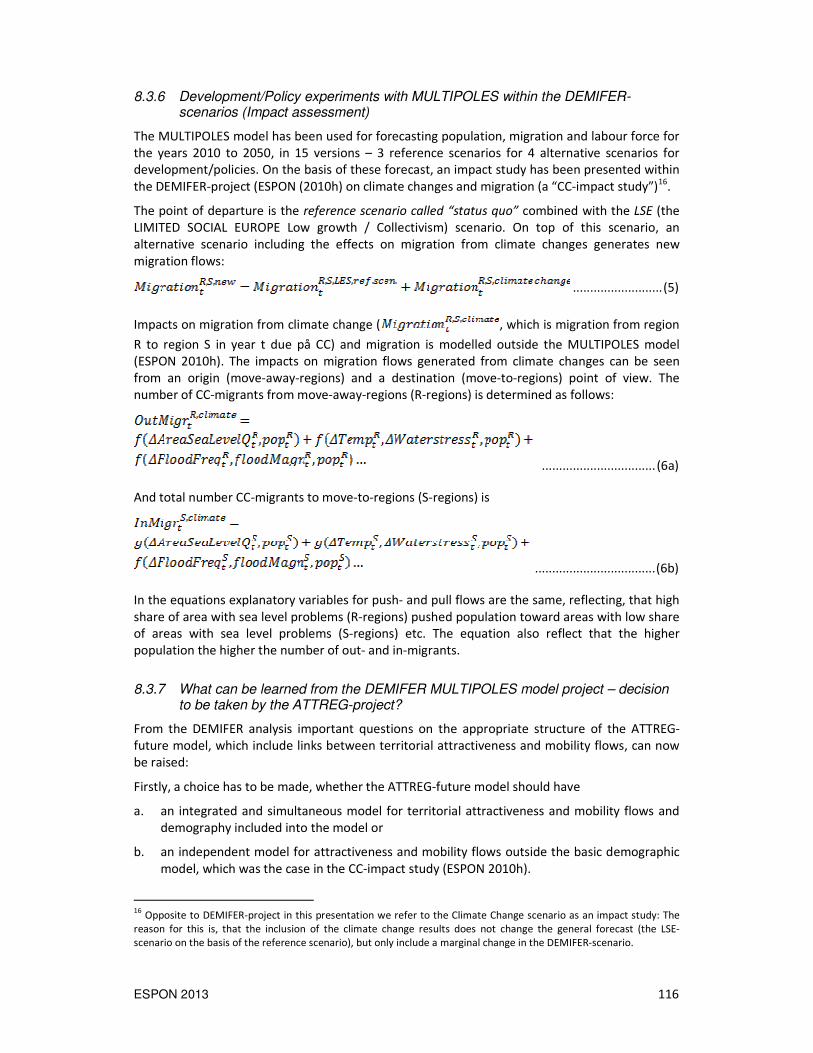
ESPON 2013 116
8.3.6 Development/Policy experiments with MULTIPOLES within the DEMIFER-scenarios (Impact assessment)
The MULTIPOLES model has been used for forecasting population, migration and labour force for the years 2010 to 2050, in 15 versions – 3 reference scenarios for 4 alternative scenarios for development/policies. On the basis of these forecast, an impact study has been presented within the DEMIFER-project (ESPON (2010h) on climate changes and migration (a “CC-impact study”)16.
The point of departure is the reference scenario called “status quo” combined with the LSE (the LIMITED SOCIAL EUROPE Low growth / Collectivism) scenario. On top of this scenario, an alternative scenario including the effects on migration from climate changes generates new migration flows:
.......................... (5)
Impacts on migration from climate change ( , which is migration from region
R to region S in year t due på CC) and migration is modelled outside the MULTIPOLES model (ESPON 2010h). The impacts on migration flows generated from climate changes can be seen from an origin (move-away-regions) and a destination (move-to-regions) point of view. The number of CC-migrants from move-away-regions (R-regions) is determined as follows:
................................. (6a)
And total number CC-migrants to move-to-regions (S-regions) is
................................... (6b)
In the equations explanatory variables for push- and pull flows are the same, reflecting, that high share of area with sea level problems (R-regions) pushed population toward areas with low share of areas with sea level problems (S-regions) etc. The equation also reflect that the higher population the higher the number of out- and in-migrants.
8.3.7 What can be learned from the DEMIFER MULTIPOLES model project – decision to be taken by the ATTREG-project?
From the DEMIFER analysis important questions on the appropriate structure of the ATTREG-future model, which include links between territorial attractiveness and mobility flows, can now be raised:
Firstly, a choice has to be made, whether the ATTREG-future model should have
a. an integrated and simultaneous model for territorial attractiveness and mobility flows and demography included into the model or
b. an independent model for attractiveness and mobility flows outside the basic demographic model, which was the case in the CC-impact study (ESPON 2010h).
16 Opposite to DEMIFER-project in this presentation we refer to the Climate Change scenario as an impact study: The reason for this is, that the inclusion of the climate change results does not change the general forecast (the LSE-scenario on the basis of the reference scenario), but only include a marginal change in the DEMIFER-scenario.

ESPON 2013 117
Secondly, decision has to be taken whether the ATTREG-future model only should be used for
1. impacts studies, where changes in migrations flows from changes in development/polities on attractions is included on top of a reference scenario, and/or
2. forecasting and scenario building as basic changes in the reference forecast
Thirdly, decision has to be taken whether – in the case of an integrated for territorial attractiveness and mobility flows approach - feed-back and spill-over effects should be included in the ATTREG-future model: The question is whether the derived effects on attractiveness (such as derived changes in population density, GDP pr. capita, accessibility etc.) should be followed in a round-by-round process.
In next section a graphical presentation of the ATTREG-future model is provided. To summarize: it has been decided
a) only to include one reference scenario opposite to the 3 reference scenarios and 4 policy scenarios in the DEMIFER-project. In the reference scenario attractions are assumed to be unchanged and only the direct effects from the derived effects on dependent attractions, such as population density, GDP pr. capita etc. have been included in the reference scenario
b) only to use the model for impacts studies (based upon the one reference scenario)
c) to include the links between territorial attractiveness and mobility flows fully into the ATTREG-future model
d) to include the spill-over and feed-back effects on regional attractions and in turn on the feed-back on migration flows, involving a process of adjusting population and attractions in an iterative equilibrating process.
8.4 Migration and population. Model based scenario analysis with links between territorial attractiveness and mobility flows: The ATTREG-future model
In this Section the ATTREG-future model, which is an extended demographic model, is presented. The ATTREG-future model includes empirically estimated links between territorial attractiveness and mobility flows (Russo et al. 2011). Although the ATTREG-future model therefore relies on empirical estimated demographic rates, we would still refer to the forecast as a reference scenario – and not as predictions: There are still many uncertainties involved in its construction. Anyhow, the ATTREG-future model represents an improvement in the empirical basis for scenario building and impacts assessment, because the model built upon revealed attraction outcome relations.
8.4.1 The ATTREG-future model – a graphical presentation
This section includes a non-technical description on the ATTREG-future-model based on graphical presentation together with explanation of the result of an experiment with the model. For a detailed mathematical documentation see Appendix 3.
The core of the presentation is given by the flow diagrams of the ATTREG-future model in Fig. 8.2:

ESPON 2013 118
Figure 8.2: The structure of the ATTREG-future model – a graphical overview
From the diagram it can be seen that the model consists of three elements:
a. a conventional demographic model in line with the MULTIPOLES model (the North-East corner of the diagram)
b. a regional economic model, which is “supply-driven”, which means that changes in population drives the labor force, which drives employment and local employment, which in turn drives export jobs and GDP per capita (the South part of the diagram)
c. a “feed-back” attraction-determined component, which relies on the relation between population density and GDP pr. Capita impacts on in-migration (the North-West corner of the diagram, where attraction variables are shown as “Bold boxes”)
From the diagram it can be seen, that regional activities / territorial capital are divided into two geographical concepts “place of residence” (the upper part of the diagram) and “place of production” (the lower part of the diagram). This corresponds to the unit of activity, which in the upper part of the diagram relate to type of persons (in the ATTREG-future model by gender and age groups) and to type of producers (in the ATTREG-future model by sector). The division is a simplified version of the LINE-model for the Danish local economy (see Madsen 2009 and Madsen and Jensen-Butler 2004).
Ad a. Conventional demographic model in line with the MULTIPOLES model
In the demographic part of the ATTREG-future model the population in the end of the year ( ) is determined by population in beginning of the year ( ) adding new
born and subtracting dead and adding in-migrants and subtracting out-migrants (see equations 1-3 in section 3.3 and equations 1-6 in appendix 3). Forecasting or modeling population in this

ESPON 2013 119
conventional demographic model is a result of demographic coefficients, such as death and fertility rates, out-migration rates and migration structure. These coefficients are normally assumed to be equal to values in latest years (or eventually forecasted including a prolongation of a historical trend). In the DEMIFER-project both reference and 4 development/policy scenarios have been establish (se section 3.1), whilst in this chapter only one reference scenario has been undertaken.
Ad b. A supply-driven regional economic model
The ATTREG-future model is a “supply-driven model”, where the size and structure of the population is assumed to influence economic activities, such as labor force, employment, production and export.
Impacts on population density and accessibility
A first effect from an increase in population is rise in population density and reduction in accessibility, which follows by definition (see equation 7 in appendix 3). This in turn will change the attractiveness of a region, which will give a “feed-back” attraction-determined component (see section c) below and equation A in appendix 3).
Impacts on GDP per capita
In a supply-driven regional economic model changes in population drives regional economic activity (see figure 2). Changes in population drive changes in the labor force (see equation 8 in appendix 3), which in turn lead to changes in the employment (see equations 9 and 10 in appendix 3). The impact depends on labor participation rates – for the young and the old age groups labor participation rates are relatively low, giving low increases in employment for the young (15-24 year) and old population (50-64 year). And vice versa for the middle age population group (25-49 year). Given unemployment is unchanged (according to a supply driven model), changes in labor force leads to changes in employment by place of residence – positive for the mid-age and positive or eventually negative for the young and old age groups.
Further, employment by place of residence – in a supply driven model – drives jobs by place of production, according to pattern of commuting: If population and employment by place of residence in a region increases, then jobs by place of production also increases, if commuting pattern is “local”, given low out- and in-commuting, jobs by place of production increases in the region in study (see equations 11-16 in appendix 3).
Changes in population generate changes in jobs within population dependent activities (see equation 17 in appendix 3). In the case of in-migration and increasing population, jobs in population dependent activities also increase. Production dependent activities also tend to change (see equation 18 in appendix 3), because population dependent activities increase. The number of jobs in tourism activities do not change, because only population changes.
The increases in local jobs (population and production dependent activities) can be smaller or bigger than changes in the labor force and employment: If number of jobs within local activities increase more than the rise in labor force, jobs in export activities will decrease. If opposite jobs within local activities increases less than the increases in labor force, jobs in export activities will increase.
A reduction in number export jobs will change the long-run basic economic condition for a region: If number export jobs decreases, then the economic performance – measured by GDP pr. capita – will deteriorate and GDP pr. capita will go down. Opposite if the number of export jobs increase, then GDP pr. capita will increase (see equation 19 in appendix 3).
Finally, the change in GDP per capita will change the attractiveness of a region, which in turn give a “feed-back” attraction-determined component – see section c) below.

ESPON 2013 120
Ad c. A “feed-back” attraction-determined component (population density and GDP pr. Capita
impacts on in-migration)
The third element is the relation between the two variables “changes in population density” and “changes in GDP pr. capita” to in-migration described above: If the ATTREG-future model provides a region with a change in population density and GDP pr. capita, these changes will in turn change the in-migration further. From the analysis of relations between net-migration and attractions (Russo et al. 2011) further changes in in-migration can be found. So: the ATTREG-future model will further include changes derived from changes in “population density” and “GDP pr. capita”.
The ATTREG-model also includes the derived (second and higher order) changes in in-migration, which follows from higher level changes in attraction.
8.4.2 Attractions and mobility flows in the ATTREG-future model
In the presentation of the core of the ATTREG-future model, the inter-link “from migration/population to attractions” and “from attractions to migration/population” was the key development of the conventional interregional demographic model. The attractions were part of the simultaneous blocks in the ATTREG-future model, where the 2 attraction factors – population density and GDP pr. capita – represent the “endogenous/cumulative attraction factors”. To complete the presentation of the ATTREG-future model also the “exogenous attraction factors” should be examined. In Fig. 8.1 the core of the basic demographic model is shown together with both the endogenous attraction variable (the boxes with a bold and striped line) as well as the exogenous attraction variables (the boxes with a bold and etched line). The exogenous attraction variables enter directly into the determination of migration flows and population – like it was the case for the endogenous attraction variables. But opposite the endogenous variables, the exogenous variables are not included in the simultaneous blocks of the ATTREG-future model.
In Table 8.2 the results from the estimation of territorial attractiveness and mobility flows across Europe presented in Ch. 5 of this Scientific Report are shown for each of the 5 audiences. From the table and for each of the audiences, the unit of the attraction variable and type of variable are shown in first two columns, the values of the coefficient which induce the change in in-migration rate from a change in the attraction variable are presented in column 3-5, whereas the column 6-7 shows the change in number of tourist arrivals.

ESPON 2013 121
Table 8.2: Regression statistics by audience in the reduced regression model for territorial attractiveness and mobility flows for the ATTREG-future model
Descriptive statistics unstandardised Beta coefficients
Variable code
Variable name
Type of variable in relation to policy context
Unit for variable
min value max value
5-year net migration
flow for 15-24 year olds
1
5-year net migration
flow for 25-49 year olds
1
5-year net migration
flow for 50-64 year olds
1
Resident visitors in collective
accommodation (in 1
year)
Foreign visitors in collective
accommodation (in 1
year)
Antropic assets
an1 monuments and other tourist sights valued 2 stars in TCI "green guides series", indexed, NUTS2 (AN2_05)
Exogenous/ policy
index .0000 20.7700 759.97373 3399.4262 -838.51304 81518.591 149786.52
an2 Average gross population density (persons per sqkm), 2001-03
Cumulative (subject to derivative effects)/ policy
persons per sq km
2.8544 8968.2361 4.2941866 -0.0111406 -2.5900663 -57.200308 236.37857
an3 Rank of regional air passenger flows based on passenger movements through regional airports (averaged 2001-03) (1=busiest)
Exogenous/ policy
rank where 1= busiest region
1 264 -39.757292 -65.893772 11.609763 -1931.7272 -1459.1919
an4 Average number of bed spaces in collective tourism establishments, 2001-04
Exogenous/ policy
number 804 673821 0.0498954 0.1511144 0.0477038 8.9261283 7.2491332
an5 sum of population accessibility scores (working age population accessibility per hour travel distance, 2001)
Cumulative (subject to derivative effects)/ policy
persons per hour travel time
1441302.46 63644721.82
-0.0001543 -0.0003093 -5.35E-05 -0.0019682 -0.0045646
an6 location of a metropolitan urban area in NUTS2
Exogenous/ dummy, 1 =
0 1 3459.591 9382.4298 2598.2975 -15122.695 -15840.515

ESPON 2013 122
(AN2_21) non-policy metropolitan, 0 = non-metropolitan
Economic assets
ec1 average GDP per capita 2001-03
Cumulative (subject to derivative effects)/ endogenous
Euros per capita
1267 75433 0.2553401 -0.1208534 -0.2857106 19.084582 20.88407
ec2 Average proportion of people aged 15 and above educated to ISCED level 5-6 as highest level 2001-03
Exogenous/ policy
proportion
.0000 .4713 38148.044 129265.21 -6404.7459 4945212.8 2582966.4
ec3 Average proportion of total employment in Wholesale and retail trade; hotels and restaurants; transport - all NACE (rev.1) activities, 2001-03
Exogenous/ policy
proportion
.0814 .4455 760.53422 18460.25 -11172.693 -3547729.8 4443542.5
Environmental assets
env1
difference between WARM and COLD (EN2_23)
Exogenous/ non-policy
index -2.00 35.30 -626.36151 -2656.9106 -623.45879 18979.893 -6487.6726
env2
the percent share of the Natura 2000 sites within the NUTS (EN2_34)
Exogenous/ policy
percentage
.0000 100.0000 84.416297 173.14529 38.138013 2879.2062 2098.1638
env3
coastal classification from ESPON (EN2_36)
Exogenous/ non-policy
dummy, 1 = 'coastal' NUTS2
0 1 -6905.9923 -8421.6722 1547.4193 -301025.84 -352651.23
env4
island classification from ESPON (EN2_35)
Exogenous/ non-policy
dummy, 1 = 'island'
0 1 -7131.6402 -22332.262 -1197.1862 -475880.85 86204.315

ESPON 2013 123
NUTS2
Institutional assets
in1 % of respondents who were more satisfied with the "state of health services in country nowadays" relative to the EU median score (IN2_48)
Exogenous/ policy
percentage responding in category greater than EU median
6.6015 87.8789 7.7628316 -211.53251 -6.5787325 -4030.1511 6718.8194
in2 Average proportion of employment in public administration and community services (NACE rev.1) 2001-03
Exogenous/ policy
proportion
.1168 .5582 -66433.57 -193469.24 3846.772 -985490.74 -3720863.8
in3 number of NUTS2 region within country in which located
Exogenous/ non-policy
number 1 39 122.20445 -155.22042 -23.725316 20371.568 -14477.149
Social and cultural assets
soc1
Average number of registered university students per 1000 registered residents aged 15 to 24 years, 2001-03
Exogenous/ policy
number of students per 1000 inhabitants aged 15-24 years
7.1680 1640.4672 22.980185 29.339409 8.8082083 -262367.53 -219744.79
soc2
% of respondent in the area who were "satisfied with life as a whole" relative to the EU median score (SC2_02)
Exogenous/ policy
percentage responding in categor
8.69 83.65 42.386149 679.34383 130.71821 -5061.8398 -5904.7963

ESPON 2013 124
y greater than EU median
soc3
Average ratio of persons aged 65 and over to the working aged population aged 15-64 years, 2001-03
Exogenous/ policy
ratio .0511 .4028 -19474.684 63230.414 59041.214 1120409.5 -6107847.1
Notes:
1. Regression analysis based on 2001-03 territorial assets (November 2011 data-set) 2. Regression analysis based on older version of territorial assets data –set (May-September 2011)

ESPON 2013 128
8.4.3 Economic crisis and attractions and mobility flows in the ATTREG-future model
One critical issue for demographic models is to which extend the effects on the demographic development from the present financial and economic crisis has been included into the modeling framework. In this project the question is to which extend the ATTREG-future model is able to capture the pattern of regional down-turn of population, labor force, employment and unemployment and jobs in general and whether the model can replicate the change in a number of “heating” regions, which in the beginning of the decennium experienced high growth, but now seems to have lost momentum in the demographic development. Although the ATTREG-future model can be characterized as an “extended regional demographic model” (as compared with the DEMIFER-model), the model at the present stage has not sufficiently taken into account the effects of the economic and financial crisis on migration and tourism flows: One important reason for this is that in the statistical analysis of the relations between territorial capital and outcomes, on which the ATTREG-future model build, only the variable GDP per capita has been included. The fact that economic variables (such as regional debt ratios, wage and price development etc.) only sporadically have been included in the analysis, which seriously restricts the generality of the ATTREG-future model. This must be emphasized before drawing conclusions on the results of the impact from attraction development / attraction policies as well as the realism of the reference scenario.
The reason for this – as discussed in the presentation of the results from the statistical analysis on territorial capital and outcomes – is, the fact that the
• ESPON-database, which has been the basis for the statistical analysis, was only fully available for the pre-crisis period 2001-06
• Data on key economic variables – such as regional debt ratios, wage and price development etc. - are not yet available in the ESPON-database.
In this technical documentation of the ATTREG-future model, a more general model for how to include market variables into the ATTREG-future model as well as how to develop the ATTREG-future model into a combined extended demographic and regional economic model is outlined. In figure 3 the structure of an extended ATTREG-future model with integrated commodity and factor markets are presented:
The structure of this model is similar, although a simplified version of the LINE-model for the Danish local economy (see Madsen 2009 and Madsen and Jensen-Butler 2004): In the upper part of the diagram in Fig. 8.3 activities are related to place of residence and by persons (divided by age and gender), which include the model for attraction, migration and population. In the mid part of diagram the activities are assigned to place of markets and to commodities. Finally, activities in the lower part of the diagram are related to sectors and related to place of production. Compared with the extended demographic model presented in figure 2 and which is used forbin the analysis of impacts of attraction policy packages (see section 5), this theoretical version of the ATTREG-future model include a description of activities in economic terms: At the market for commodities demand and supply for commodities are described in value terms, which on demand side involve demand for:
• intermediate consumption goods
• private consumption goods
• public consumption goods
• investment goods
• export to other regions and abroad

ESPON 2013 129
and on the supply side the
• production of commodities
• import of commodities from abroad and from other regions
The markets are cleared on the basis of commodity prices.
Figure 8.3: The structure of the ATTREG-future model – a graphical overview (2)
Looking at labor/factor markets these are cleared on the basis of real wages, which are adjusted according to supply and demand for labor. The demand for labor (employment) is derived from production (see the lower part of the diagram, which include the place of production as well as producers divided by sector). From production by sector jobs by sector are derived, which the commuting gives the employment by place of residence.
Models for demand and supply would include the factors, which is important for understanding the development of the economic and financial crisis and its implications for pattern of migration, including the role of regional debt, cost of financing and regional interest rates. The ATTREG-future therefore only reflects the interaction between territorial capital and outcome seen as quantity model, where the interrelations between outcome and regional market prices, debt position etc. are missing.

ESPON 2013 130
8.4.4 Results: Technical description
In this section, preliminary results of modelling the impacts of the 3 packages applied for the two regions ATT11 Vienna and the BG31 Severozapaden are presented. First, the baseline scenario for the impacts studies is presented. Then a technical specification of the 3 scenarios is provided. And finally the results for the 2 regions are presented.
Reference scenario
The ATTREG-future model is run for each 5 year periods, starting in the start year, 2010, which is then simulated 10 times or 10 “model iterations” for each year. One “model iteration” corresponds to one round in the graphical presentation in the ATTREG-future in figure 2 starting from the box “In-migration” and continuing in the clock-wise circle ending in the boxes with impacts on Population density and GDP per capita. One “model iteration” also corresponds to calculating equation 1 to 21 (see appendix 1 for a mathematical presentation of the ATTREG-future model).
Policy package scenarios
The reference scenario is now rerun 3 times assuming the 3 attraction policy packages are implemented. The assumptions in the 3 scenarios are the following Table 3.
Table 8.3: Assumption for changes in attraction variables in the 3 scenarios (inclusive, sustainable
and smart) for impacts assessment with the ATTREG-future model
Scenarios
Variable code Variable name
Type of variable in relation to policy context
Unit for variable
Inclusive scenario
Sustainable scenario
Smart scenario
Antropic assets
an1 monuments and other tourist sights valued 2 stars in TCI "green guides series", indexed, NUTS2 (AN2_05)
Exogenous/ policy
Index Not changed
Not changed
Not changed
an2 Average gross population density (persons per sqkm), 2001-03
Cumulative (subject to derivative effects)/ policy
persons per sq km
Cumulative / endogenous
Cumulative / endogenous
Cumulative / endogenous
an3 Rank of regional air passenger flows based on passenger movements through regional airports (averaged 2001-03) (1=busiest)
Exogenous/ policy
rank where 1= busiest region
Not changed
Decrease with 10%
Increased with 10%
an4 Average number of bed spaces in collective tourism establishments, 2001-04
Exogenous/ policy
Number
Increased with 1 %
Not changed
Not changed
an5 sum of population accessibility scores (working age population accessibility per hour travel distance, 2001)
Cumulative (subject to derivative effects)/ policy
persons per hour travel time
Not changed
Decreased with 1 %
Increased with 1 %
an6 location of a metropolitan urban area in NUTS2
Exogenous/ non-policy
dummy, 1 = metrop
Cannot be changed
Cannot be changed
Cannot be changed

ESPON 2013 131
(AN2_21) olitan, 0 = non-metropolitan
Economic assets
ec1 average GDP per capita 2001-03
Cumulative (subject to derivative effects)/ endogenous
Euros per capita
Cumulative / endogenous
Cumulative / endogenous
Cumulative / endogenous
ec2 Average proportion of people aged 15 and above educated to ISCED level 5-6 as highest level 2001-03
Exogenous/ policy
proportion
Not changed
Not changed
Increased with 2 %
ec3 Average proportion of total employment in Wholesale and retail trade; hotels and restaurants; transport - all NACE (rev.1) activities, 2001-03
Exogenous/ policy
proportion
Not changed
Not changed
Increased with 1 %
Environmental assets
env1
difference between WARM and COLD (EN2_23)
Exogenous/ non-policy
index Cannot be changed
Cannot be changed
Cannot be changed
env2
the percent share of the Natura 2000 sites within the NUTS (EN2_34)
Exogenous/ policy
percentage
Not changed
Increased with 1 %
Not changed
env3
coastal classification from ESPON (EN2_36)
Exogenous/ non-policy
dummy, 1 = 'coastal' NUTS2
Cannot be changed
Cannot be changed
Cannot be changed
env4
island classification from ESPON (EN2_35)
Exogenous/ non-policy
dummy, 1 = 'island' NUTS2
Cannot be changed
Cannot be changed
Cannot be changed
Institutional assets
in1 % of respondents who were more satisfied with the "state of health services in country nowadays" relative to the EU median score (IN2_48)
Exogenous/ policy
percentage responding in category greater than EU median
Increased with 1 %
Not changed
Not changed
in2 Average proportion of employment in public administration and community services (NACE rev.1) 2001-03
Exogenous/ policy
proportion
Increased with 1 %
Not changed
Not changed
in3 number of NUTS2 region within country in which
Exogenous/ non-policy
number Cannot be changed
Cannot be changed
Cannot be changed

ESPON 2013 132
located
Social and cultural assets
soc1
Average number of registered university students per 1000 registered residents aged 15 to 24 years, 2001-03
Exogenous/ policy
number of students per 1000 inhabitants aged 15-24 years
All regions at least 5%
Not changed
All regions at least 5%
soc2
% of respondent in the area who were "satisfied with life as a whole" relative to the EU median score (SC2_02)
Exogenous/ policy
percentage responding in category greater than EU median
Not changed
Increased with 1 %
Not changed
soc3
Average ratio of persons aged 65 and over to the working aged population aged 15-64 years, 2001-03
Exogenous/ policy
ratio Decreased with 1 %
Not changed
Increased with 1 %
In Appendix 4 and 5 results of 3 attraction policy packages with any detailed presentation or explanation. The results are preliminary and are presented to illustrate the workings of the model. The results must not be quoted as final results. Results will be examined and eventually revised for the final report.

ESPON 2013 133
Appendix 1. Scenario assumptions in the DEMIFER projects
• Policies/development on mortality, which are 1. lifestyles on smoking 2. lifestyles on diet/obesity 3. lifestyles on drinking & drug use 4. medical advances 5. national health inequalities 6. regional health inequalities)
• Policies/development on fertility, which are 1. Family versus individual goals 2. Family friendly policies 3. Assisted conception 4. Abortion law 5. National fertility inequalities 6. Regional fertility inequalities
• Policies/development on internal migration (Immigration (in-migration) from within Europe as well as the rest of the world outside Europe)
1. Destination attraction ratio trends • Policies/development on external migration (Immigration (in-migration) from within Europe
as well as the rest of the world outside Europe) 1. Total level of Inter-State Migration 2. Origins: Interstate out-migration 3. Destinations: Inter-State in-migrations 4. Explicit Inter-state Migration policy
• Policies/development on extra Europe migration, which are 1. Total level of extra Europe Migration 2. Origins: Emigrations 3. Destination: Immigration 4. Explicit Extra-Europe Migration policy
• Policies/development on labor force participation, which are 1. Trends in Participation 2. Participation of young persons 3. Female participation 4. Participation of elder people 5. Part time/Full time/Self employed
In the case of mortality rates, 6 factors are assumed to be important for mortality, namely the policies concerning:
• Lifestyle: Smoking • Lifestyle: Diet/Obesity • Lifestyle: Drinking & Drug Use • Medical advances • National health inequalities • Regional health inequalities

ESPON 2013 134
Appendix 2.
Net
migration
rate
In-
migr.
Death
Born
Migration
From / toOut-
migr.
Labor force
Labor
partic.
rate
Unem-
ploymentEmploy
ment
Export em-
ployment
Pop. dep.
employment
Production
employment
tourism
employment
Local em-
ployment
Pop
Dens.
Area
Acces-
sibility
GDP per
capita
# Monum. &
tour. sights
Rank Air
Passenger
Tourism acc.
beds
Metrop. In
NUTS 2 reg
Tert.educ. In
work force
Cons.empl.
share
………….
etc.
: Exogenous attraction factors
: Endogenous or cumulative attraction factors
Figure 8.5: Attraction variables in the ATTREG-future model – a graphical overview of the full model

ESPON 2013 135
Appendix 3. The ATTREG future model – a technical documentation
In this appendix, the ATTREG future model is documented in detail, including the equations in the model. The equations are presented followed by a verbal explanation of the model based upon the graphical presentation of the model in Figure 2. Next, the mathematical solution to the model is presented and discussed.
A.3.1 The Model – Notation
The equations in the model involve tensor algebra, which is multi-dimensional matrix algebra. We think that most of the notation from two-dimensional matrix algebra can be used in tensor algebra without further explanation, at least for the purposes of this appendix.
The upgrading from matrix to tensor algebra is necessary, because most variables involve one or two regional specifications. Migration, for example, is classified by the place of origin, by the place of destination and by age and sex group, which implies it that it is four-dimensional. If education and time are also included, the dimensionality will increase further.
To explain the tensor operations the equations are presented in two forms: In ‘conventional form’, where summation of variables, tensor multiplication, etc, are shown explicitly with full specification of all indices, whereas in the ‘tensor form’ (summation is shown as vector pre- or post multiplication and tensor multiplication is shown without summation sign and indexes). For practical reasons, the solution to the model (section A. 2) is only shown in ‘tensor form’.
Variables in the Model
The variables in the ATTREG future model are denoted in the following way:
b: Birth vector
bq: Birth rate vector
d: Death vector
dq: Death rate vector
e: Employment vector
eexp: Export dependent employment vector
eexppopq: Export jobs as share of population vector
epop: Population dependent employment vector
epopq: Population dependent employment coefficient matrix
eprod: Production dependent employment vector
eprodq: Production dependent employment coefficient matrix
i: Identity vector
M: migration matrix
min: In migration vector
mout: Out migration vector
MQ: Migration coefficient matrix
u: Population vector
us: Labor force vector

ESPON 2013 136
1 Primes (’) indicate transposition; Element-by-element multiplication is indicated by
. Bold capitals are used to denote matrices (tensors) and bold lowercase letters denote vectors (tensors).
Superscripts:
Geographic axes
P: Place of production (regional axes)
R: Place of residence (regional axes)
R(t-1): Place of residence the year before (regional axes)
Subscripts:
a: age
e: education
g: gender
j: Sector
t: year
A 3.2 The ATTREG future model in Structural Form
The presentation follows the sequential structure described in Section 4. Referring to figure 4.1 and figure 4.2, the equations below present the ATTREG-future model (figure 4.1) together with the equations for modelling the impacts of changes in attractions (figure 4.2):
Equations in the ATTREG-future model
or ...................... (1)
or ............ (2)
or ........................... (3)
or .................................... (4)
or .............................. (5)
or ...... (6)
or ....... (7)
or ..................................... (8)
or ....................................... (9)
or ............................................ (10)

ESPON 2013 137
or ...................... (11)
or ................................... (12)
or ......................... (13)
or .......... (14)
or ......................... (15)
or ............................................... (16)
or ................. (17)
or .......................... (18)
or ............. (19)
or ............................. (20)
or .......... (21)
Equations for modelling the impacts of changes in attractions:
or .....(A)
or ......... (B)
or ............... (C)
or .................. (D)
or ........................................ (E)
Or ..... (1+E)
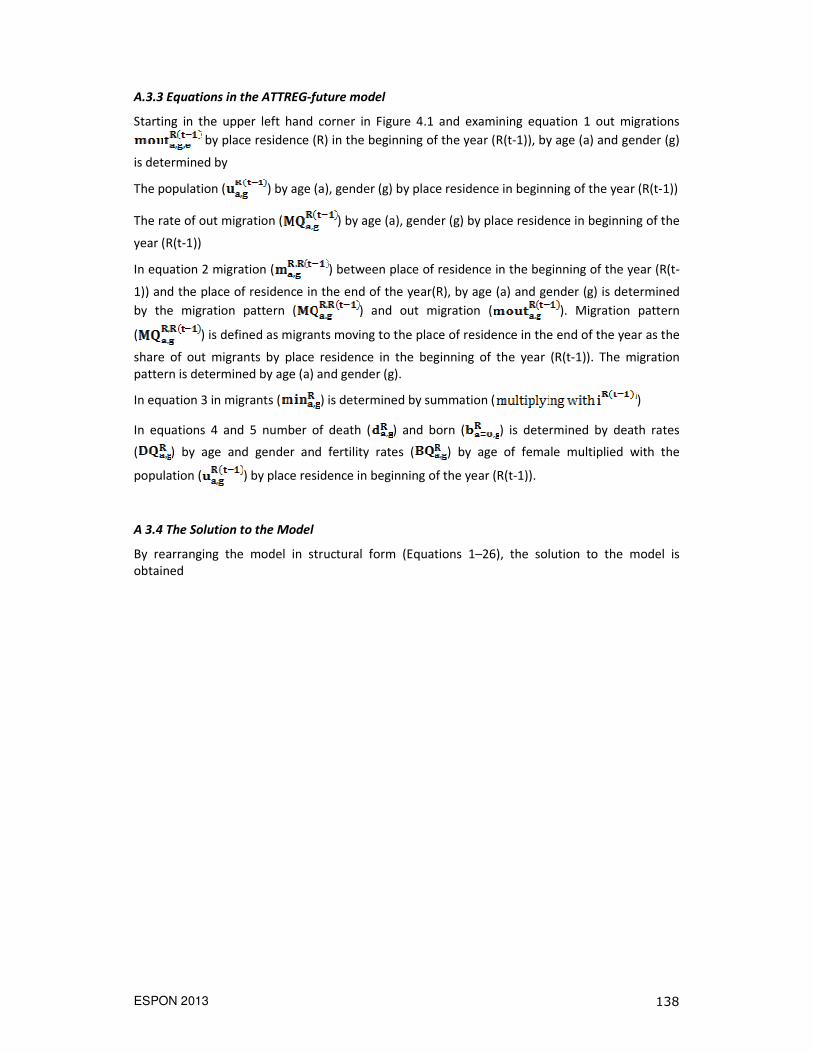
ESPON 2013 138
A.3.3 Equations in the ATTREG-future model
Starting in the upper left hand corner in Figure 4.1 and examining equation 1 out migrations
by place residence (R) in the beginning of the year (R(t-1)), by age (a) and gender (g)
is determined by
The population ( ) by age (a), gender (g) by place residence in beginning of the year (R(t-1))
The rate of out migration ( ) by age (a), gender (g) by place residence in beginning of the
year (R(t-1))
In equation 2 migration ( ) between place of residence in the beginning of the year (R(t-
1)) and the place of residence in the end of the year(R), by age (a) and gender (g) is determined
by the migration pattern ( ) and out migration ( ). Migration pattern
( ) is defined as migrants moving to the place of residence in the end of the year as the
share of out migrants by place residence in the beginning of the year (R(t-1)). The migration pattern is determined by age (a) and gender (g).
In equation 3 in migrants ( ) is determined by summation ( )
In equations 4 and 5 number of death ( ) and born ( ) is determined by death rates
( ) by age and gender and fertility rates ( ) by age of female multiplied with the
population ( ) by place residence in beginning of the year (R(t-1)).
A 3.4 The Solution to the Model
By rearranging the model in structural form (Equations 1–26), the solution to the model is obtained

ESPON 2013 139
Appendix 4. Impacts of 3 packages of attraction policies (inclusive, sustainable and smart)
assessed with the ATTREG-future model – 2 selected regions
In this appendix the results of modelling the impacts of the 3 packages of attraction policies are presented for the two regions ATT11 Vienna and the BG31 Severozapaden are presented.
The results are preliminary and are presented to illustrate the workings of the model. The results must not be quoted as final results. Results will be examined and eventually revised for the final report:

ESPON 2013 140
Table A.8.1: Impacts of 3 attraction policy scenarios for the region ATT11 Vienna
All age groups -1,04 -0,1 25,79 -0,1 -16,11 0,48
(1000*number)
Population (1000*number) -1,04 -0,1 25,79 -0,1 -16,11 0,48Labor participation rate () -0,07 0,02 1,91 0,02 -1,31 0
Labor force (1000*number) -0,74 0,02 19,05 0,02 -11,75 0,25
Unemployment (1000*number) 0,01 0 0,44 0 -0,29 0,01Adjustment (1000*number) 0 0 0 0 0 0
Employment (1000*number) -0,75 0,02 18,61 0,02 -11,45 0,24
Employment/labor force (1000*number):0-14 years 0 0 0 0 0 0
15-24 years -1,08 0,03 0,49 0,03 0,62 -0,05
25-49 years -3,22 0,13 12,6 0,13 -5 050-64 years 3,55 -0,13 5,53 -0,13 -7,08 0,3
65 years and more 0 0 0 0 0 0Age unknown 0 0 0 0 0 0
All age groups -0,75 0,02 18,61 0,02 -11,45 0,24
Production dependent jobs (1000*number) 0 0 0 0 0 0
Population dependent jobs (1000*number) -0,48 -0,01 11,88 -0,01 -7,42 0,22Tourism dependent jobs (1000*number) -2,3 0 -0,07 0 -1,19 0
Export jobs (1000*number) 2,63 -0,02 -1,32 -0,02 2,29 -0,08Jobs (1000*number) -0,51 -0,02 12,6 -0,02 -7,77 0,18
GDP per capita (euro)
Scenario (number) 23749,77 23606,19 23539,26 23606,19 23730,43 23598,4Basis-line (number) 23602,9 23602,9 23602,9 23602,9 23602,9 23602,9
Difference (number) 146,86 3,29 -63,64 3,29 127,53 -4,5%-difference (%) 0,62 0,01 -0,27 0,01 0,54 -0,02
Direct effects detail:15-24 years:
Monuments and other tourist sights valued 2 stars in TCI green guides series, indexed (number)0 0 0 0 0 0Rank of airport embarcations and disembarcations of all airports within region (number)- - - - - -
Number of tourism accommodation beds (number) 0 0 0 0 141,25 -Sum of working age population accessibility per hour travel distance, 2001 (number)0 0 652,7 0 -652,7 -
Location of a metropolitan urban area in region (number) 0 0 0 0 0 0Average % of working age adults with tertiary education 2001-03 (number)0 0 0 0 1096,37 -
Average % of consumption-related employment 2001-03 (number)20,57 - 0 - 0 0Difference between WARM and COLD (number) 0 0 0 0 0 0
The percent share of the Natura 2000 sites within the region (number)0 0 4,79 0 0 0
Coastal classification from ESPON (number)- - - - - -Island classification from ESPON (number)- - - - - -
% more satisfied "state of health services in country nowadays"/EU median score (number)57,69 - 0 - 0 0Average % of public sector employment 2001-03 (number)-1855,49 - 0 - 0 0
Number of NUTS2 region within country in which located (number)0 0 0 0 0 0Ratio of the number of university students against people aged 15 to 24 years, 2007 (number)52,6 - 0 - 52,6 -
% satisfied with life as a whole relative to the EU median scorefunction (number)260,4 - 260,4 - 0 0Dependency ratio of population aged 65 and over and the working age population, 2001 (number)-561,07 - 0 - 561,07 -
Both genders (number) -2025,3 0 917,89 0 1198,6 0
25-49 years:

ESPON 2013 141
Table A.8.2: Impacts of 3 attraction policy scenarios for the region BG31 Severozapaden
Inclusive Objective 1 Inclusive Heating Sustainable Objective 1 Sustainable - heatingSmart - Objective 1 Smart - HeatingDirect effects:
Population(number)
15-24 -2426,52 0 855,71 0 2004,53 025-49 -2590,78 0 2398,68 0 -2858,08 0
50-64 1914,65 0 460,88 0 -2167,32 0
Total population -3102,65 0 3715,27 0 -3020,87 0Domestic tourism -31002,1 0 1241,57 0 -2939,69 0
Foreign tourism -37771,65 0 1535,48 0 12492,08 0Total tourism -68773,75 0 2777,05 0 9552,39 0
Model effects:
(1000*number)Population - primo (1000*number) 0 0 0 0 0 0
New born (1000*number) -1,65 0 1,02 0 -0,11 0
Deaths (1000*number) 1,07 0 0,59 0 -1,83 0In-migrants (1000*number) -0,27 -0,08 0,51 -0,08 -0,04 0,02
Changes in in-migration (1000*number) 0 0 0 0 0 0Out-migration (1000*number) -2,88 0 2,21 0 -1,06 0
Changes in out-migration (1000*number) -2,01 -0,03 10,88 -0,03 -3,57 0,27Population - ultimo (1000*number) -10,51 -0,04 2,71 -0,04 -5,77 -0,24
(1000*number)
0-14 years -1,65 0 1,02 0 -0,11 0
15-24 years -2,49 0,08 0,51 0,08 1,13 -0,1925-49 years -6,04 0,11 1,2 0,11 -3,1 -0,27
50-64 years 0,13 -0,15 0,48 -0,15 -3,65 0,1265 years and more -0,45 -0,09 -0,5 -0,09 -0,04 0,1
Age unknown 0 0 0 0 0 0All age groups -10,51 -0,04 2,71 -0,04 -5,77 -0,24
(1000*number)
Population (1000*number) -10,51 -0,04 2,71 -0,04 -5,77 -0,24Labor participation rate () -0,22 0,01 0,05 0,01 -0,34 -0,02
Labor force (1000*number) -5,98 0,02 1,53 0,02 -4,84 -0,22Unemployment (1000*number) -0,32 0 0,08 0 -0,31 -0,01
Adjustment (1000*number) 0 0 0 0 0 0
Employment (1000*number) -5,67 0,02 1,44 0,02 -4,53 -0,21
Employment/labor force (1000*number):0-14 years 0 0 0 0 0 0
15-24 years -0,69 0,03 0,14 0,03 0,31 -0,0625-49 years -5,06 0,09 1,01 0,09 -2,6 -0,23
50-64 years 0,08 -0,09 0,3 -0,09 -2,25 0,0765 years and more 0 0 0 0 0 0
Age unknown 0 0 0 0 0 0All age groups -5,67 0,02 1,44 0,02 -4,53 0
Production dependent jobs (1000*number) 0 0 0 0 0 0Population dependent jobs (1000*number) -3,17 0 0,82 0 -1,74 -0,07
Tourism dependent jobs (1000*number) -7,29 0 0,29 0 1,01 0Export jobs (1000*number) 6,97 -0,01 0,03 -0,01 -3,09 -0,1
Jobs (1000*number) -5,59 -0,02 1,45 -0,02 -4,47 -0,21

ESPON 2013 142
REFERENCES
Amin A., Thrift N. (2007). Cultural-economy and cities. Progress in human geography 31(2): 143-161.
Aydalot P. (1986). Milieux innovateurs en Europe. GREMI, Paris.
Barca F. (2009). An Agenda for a Reformed Cohesion Policy, A place-based approach to meeting
European Union challenges and expectations. Independent Report prepared at the request of Danuta Hübner, Commissioner for Regional Policy.
Bauman, Z. (2000). Liquid Modernity. Cambridge: Polity.
Becattini G. (1987). Mercato e forze locali: il distretto industriale. Bologna: Il Mulino.
Bradley A., Hall T., Harrison M. (2002). Selling Cities; Promoting New Images for Meeting Tourism. Cities 19(1): 61–70.
Buckley P., Pass C., Prescott K. (1988). Measures of international competitiveness: a critical survey. Journal of Marketing Management 42: 175–200.
Camagni R. (2002). On the concept of territorial competitiveness: Sound or misleading? Urban
Studies 39(13): 2395-2411.
Camagni R. (2008). Regional Competitiveness. Toward a Concept of Territorial Capital. In Capello, R., Camagni R., Chizzolini B., and Fratesi U. (eds) Modelling Regional Scenarios for the Enlarged
Europe. European Competitiveness and Global Strategies, Springer Berlin Heidelberg.
Castells M. (1989). The informational city: Information technology, economic restructuring, and the urbanregional process. Oxford/Malden, MA: Blackwell.
CEC - Commission of the European Communities (1999). European Spatial Development
Perspective: Towards Balanced and Sustainable Development of the Territory of the EU, Luxembourg, Office for Official Publications of the European Communities.
CEC - Commission of the European Communities (2001) Enlarging Solidarity, Uniting Europe, Second Report on Economic and Social Cohesion, Commission of the European Communities, Brussels.
CEC - Commission of the European Communities (2004a). White Paper on services of general
interest. Luxembourg, Office for Official Publications of the European Communities.
CEC - Commission of the European Communities (2004b) A new partnership for cohesion.
Convergence, Competitiveness, Cooperation, Third Report on Economic and Social Cohesion, Commission of the European Communities, Brussels.
CEC - Commission of the European Communities (2005) Cities and the Lisbon Agenda: Assessing
the Performance of Cities. Directorate General Regional Policy, Brussels.
CEC - Commission of the European Communities (2007) Growing Regions, growing Europe. Fourth
Report on Economic and Social Cohesion, Directorate General Regional Policy, Brussels.
CEC - Commission of the European Communities (2008). Turning Territorial Diversity into
Strength. Green Paper on Territorial Cohesion. Luxembourg, Office for Official Publications of the European Communities.
CEC - Commission of the European Communities (2009) Sixth report on economic, social and
territorial cohesion, Directorate General Regional Policy, Brussels.
CEC - Commission of the European Communities (2010a) Investing in Europe’s Future. Fifth report
on economic, social and territorial cohesion, Directorate General Regional Policy, Brussels.

ESPON 2013 143
CEC - Commission of the European Communities (2010b) Europe 2020. A strategy for smart,
sustainable and inclusive growth, COM(2010) 2020 final, Luxembourg, Office for Official Publications of the European Communities.
Clark T. N., Lloyd R., Wong K.K., Jain P. (2002). Amenities drive urban growth. Journal of Urban
Affairs 24(5): 493–515.
Coffey W. J., Bailly A.S. (1996). Economic restructuring: a conceptual framework. In A. Bailly and W. Lever (eds) The Spatial Impact of Economic Changes in Europe. Avebury, London.
Coleman S., Crang M. (2002). Grounded Tourists, Travelling Theory. In Coleman S., Crang M. (eds) Tourism. Between Place and Performance. Oxford: Berghahn Books, pp. 1-17.
Deas I., Giordano B. (2001). Conceptualizing and Measuring Urban Competitiveness in Major English Cities. Environment and Planning A 33: 1411-1429.
Dutch Presidency (2004). Exploiting Europe’s territorial diversity for sustainable economic growth
– Discussion paper for the EU Informal Ministerial Meeting on Territorial Cohesion. Rotterdam, 29 November 2004.
Dziembowska-Kowalska J., Funck R.H. (2000). Cultural activities as a location factor in european competition between regions: concepts and some evidence. Annals of Regional Science 34(1): 1-12.
ESPON (2006a). Spatial Scenarios and Orientations in relation to the ESDP and Cohesion Policy, project 3.2, Final Report.
ESPON (2006b). Territory matters for competitiveness and cohesion, ESPON Synthesis Report III.
ESPON (2010e) DEMIFER Demographic and migratory flows affecting European regions and cities of the ESPON Applied Research Project 2013/1/3 Deliverable 5 Reference scenarios (http://www.espon.eu/export/sites/default/Documents/Projects/AppliedResearch/DEMIFER/FinalReport/DEMIFER_Deliverable_D5_final.pdf)
ESPON (2010h) DEMIFER Demographic and migratory flows affecting European regions and cities of the ESPON Applied Research Project 2013/1/3 Deliverable 8 Report on climate change and migration scenario http://www.espon.eu/export/sites/default/Documents/Projects/AppliedResearch/ DEMIFER/FinalReport/DEMIFER_Deliverable_D8_final.pdf
ESPON (2010). DEMIFER - Demographic and Migratory Flows affecting European Regions and Cities. Final report.
European Spatial Development Perspective (1999). European Spatial Development Perspective.
Towards Balanced and Sustainable Development of the Territory of the EU, Committee on Spatial Development, Brussels.
Fainstein S.S. (2005). Cities and diversity. Should we want it? Can we plan for it? Urban Affairs
Review 41(1): 3-19.
Feifer M. (1985). Going Places: The Ways of the Tourist from Imperial Rome to the Present Day. London: Macmillan.
Festervand T. A., Lumpkin J.R., Tosh D. S. (1988). “Quality of life” in the industrial site location decision. Journal of Real Estate Development 4(1): 19–27.
Florida R. (2000). Competing in the age of talent: Quality of place and the new economy. Pittsburgh: Carnegie Mellon University.
Florida R. (2002). The rise of the creative class, and how it’s transforming work, leisure,
community and everyday life. New York: Basic Books.

ESPON 2013 144
Florida R. (2003). Cities and the Creative Class. Cities & Community 2(1): 3-19.
Florida R. (2008). Who’s Your City? How the Creative Economy is Making Where to Live the Most
Important Decision of Your Life. Basic Books, New York.
Florida R., Gates G. (2001). Technology and tolerance: The importance of diversity to high-
technology growth. Washington D.C.: The Brookings Institution.
Florida R., Tinagli I. (2004). Europe in the creative age. Pittsburgh, PA/London: Carnegie Mellon Software Industry Center/Demos.
Foster R. (1977). Economic and quality of life factors in industrial location decisions. Social
Indicators Research 4, 247–265.
French Presidency (2008a). Final Statement by the ministers in charge of urban development,
Présidence Française Union Européenne, 25.11.2008.
French Presidency (2008b). Final Appendix to the final statement by the ministers in charge of
urban development for implementing the Leipzig Charter, Présidence Française Union
Européenne, 25.11.2008.
German Presidency (2007). Leipzig Charter on Sustainable European Cities, Final Draft, document prepared by the German Presidency of the European Union, Leipzig.
Glaeser E., Gottlieb J.D. (2006). Urban resurgence and the consumer city. Urban Studies 43(8): 1275–1299.
Glaeser E.L., Kolko J., Saiz A. (2001). Consumer city. Journal of Economic Geography 1: 27–50.
Hall P. (1998). Cities in civilization. New York: Pantheon.
Hallin G., Malmberg A. (1996). Attraction, Competition and Regional Development in Europe. European Urban and Regional Studies 3(4): 323-337.
Hubbard P. (2008). Regulating the social impacts of studentification: a Loughborough case study. Environment and Planning A 40(2): 323-341.
Kazepov Y. (ed) (2005). Cities of Europe. Changing contexts, local arrangements, and the
challenge to urban cohesion, Blackwell, Oxford.
KEA European Affairs (2006). The Economy of Culture in Europe. Bruxelles. Retrieved February 13, 2007 from the KEA Web site at http://www.kernnet.com/kea/Ecoculture/ ecoculturepage.htm
Luxembourg Presidency (2005). Scoping Document and Summary of Political Messages for an
Assessment of the Territorial State and Perspectives of the European Union: Towards a stronger
European territorial cohesion in the light of the Lisbon and Gothenburg ambitions.
Madsen, B. (2009). Regional Economic Development from a Local Economic Perspective – A General Accounting and Modelling Approach, Doctoral Dissertation, Department of Geography and Geology, University of Copenhagen, CRT
Madsen, B.and Jensen-Butler, C. (2004). Theoretical and operational issues in sub-regional modelling, illustrated through the development and application of the LINE model. Economic Modelling 21(3): 471-508.
Maillat D. (1995). Territorial dynamic, innovative milieus and regional policy. Entrepreneurship
and Regional Development 7(2): 157-65.
Markusen A. (2006). Urban development and the politics of a creative class: evidence from a study of artists. Environment and Planning A 38(10): 1921-1940.
Martinotti G. (1993). Metropoli: la nuova morfologia sociale della città. Bologna: Il Mulino.

ESPON 2013 145
McCann E. J. (2004). “Best places”: Interurban competition, quality of life and popular media discourse. Urban Studies 41(10): 1909-1929.
Mieczkowski, Z. (1985). The tourism climatic index: a method of evaluating world climates for tourism. The Canadian Geographer 29: 220-33.
Minca C. and Oakes T. (2006). Travels in Paradox: Remapping Tourism. Lanham: Rowman & Littlefield Publishers.
Moulaert F., Nussbaumer J. (2005), The Social Region: Beyond the Territorial Dynamics of the Learning Economy. European Urban and Regional Studies 12(1): 45-64.
Moulaert F., Sekia F. (2003). Territorial Innovation Models: A Critical Survey. Regional Studies
37(3): 289-302.
Niedomysl, T. (2008). Residential preferences for interregional migration in Sweden: Demographic, socioeconomic and geographical determinants. Environment and Planning A 40(5): 1109–1131.
OECD (2001). OECD Territorial Outlook. Paris: OECD Publishing.
OECD (2005). Culture and Local Development. Paris: OECD Publishing.
Pacione M. (1982). The use of objective and subjective measures of life quality in human geography. Progress in Human Geography 6: 495–514.
Pandit, K. (1997). Cohort and period effects in U.S. migration: How demographic and economic cycles influence the migration schedule. Annals of the Association of American Geographers 87(3): 439-50.
Petersen D.C. (2004). The City as a Destination. Journal of Convention & Event Tourism 6(1):145–157.
Plane, D.A. (1993). Demographic influences on migration. Regional Studies 27(4): 375–383.
Portney K.E. (2003). Taking sustainable cities seriously: Economic development, the environment,
and quality of life in American cities. Cambridge MA/London: The MIT Press.
Quaglieri Domínguez A., Russo A.P. (2010). Paisajes urbanos en la época post-turística. Propuesta de un marco analítico. Scripta Nova XIV(323).
Richards G., Wilson J. (2006). Developing Creativity in Tourist Experiences: A Solution to the Serial Reproduction of Culture. Tourism Management 27(6): 1209-1223.
Richards, G. (ed.) (2007). Cultural Tourism: Global and local perspectives. Haworth Press, New York.
Richards, G. (ed.) (2007). Cultural Tourism: Global and local perspectives. Haworth Press, New York.
Ritzer G., Liska, A. (1997). “McDisneyization” and “Post-Tourism”: complementary perspectives on contemporary tourism. In Rojek C., Urry J. (eds) Touring cultures: transformations of travel
and theory. London: Routledge, pp. 96-109.
Rogerson R.J. (1999). Quality of life and city competitiveness. Urban Studies 36(5): 969–985.
Russo A.P., van der Borg J. (2002). Planning considerations for cultural tourism: A case study of four European cities. Tourism Management 23(6): 631-637.
Russo A.P., van der Borg J. (2010). An urban policy framework for culture-oriented economic development: lessons from Holland. Urban Geography 31(5): 668-690.

ESPON 2013 146
Russo, A.P. (2002). The vicious circle of tourism development in heritage cities. Annals of Tourism
Research 29(1): 165-182.
Russo, A.P. and Arias Sans A. (2009). Student communities and landscapes of creativity: how Venice – ‘the world's most touristed city’ – is changing. European Urban and Regional Studies 16(2): 175-189.
RWI (2010). Second State of European Cities Report. Research Project for the European Commission, DG Regional Policy. Essen.
Sapir A., Aghion P., Bertola G., Hellwig M., Pisani-Ferry J., Rosati D., Viñals J., Fallace H. (2003). An
Agenda for a Growing Europe. Making the EU Economic System Deliver. Report of an Independent High Level Study Group Established on the Initiative of the President of the European Commission.
Sassen S. (1994). Cities in a World Economy. Thousand Oaks, CA: Pine Forge/Sage.
Scott A.J. (2006). Creative Cities: Conceptual issues and policy questions. Journal of Urban Affairs 28(1): 1-17.
Scott A.J. (2008). Social Economy of the Metropolis: Cognitive-cultural capitalism and the global
resurgence of cities, OUP, Oxford.
Second State of European Cities Report (2010) Second State of European Cities Report, Research project for DG Regional Policy, RWI, Essen.
Servillo, L., Atkinson, R. and Russo A.P. (2011). Territorial Attractiveness in EU Urban and Spatial Policy: A critical review and future research agenda. European Urban and Regional Studies (in press December 2011).
Sheller M., Urry J. (2006). The new mobilities paradigm. Environment and Planning A 38(2): 207-226.
Simmie J. (2005). Innovation and space: A critical review of the literature. Regional Studies 39(6): 789–804.
Trip J.J. (2007). Assessing Quality of Place: a Comparative Analysis of Amsterdam and Rotterdam. Journal of Urban Affairs 29(5): 501–517.
UK Presidency (2005). Bristol Accord. Conclusions of Ministerial Informal Meeting on Sustainable
Communities in Europe. Bristol 6-7 December 2005, ODPM, London.
Urry J. (1990). The Tourist Gaze. London: Sage.
Urry J. (2007). Mobilities. Cambridge: Polity.
Urry J. (2008). Preface. In Burns P., Novelli M. (eds) Tourism and Mobilities: Local-global
Connections. Wallingford: CABI, pp. XIV-XV.
Van der Borg J., Costa P., Gotti G. (1996). Tourism in European heritage cities. Annals of Tourism
Research 23(2): 306-321.

ESPON 2013 147
The ESPON 2013 Programme is part-financed by the European Regional Development Fund, the EU Member States and the Partner States Iceland, Liechtenstein, Norway and Switzerland. It shall support policy development in relation to the aim of territorial cohesion and a harmonious development of the European territory.
ISBN
Related Documents