Attracting Females into STEM – The QUB Perspective 12 June 2014 Professor Tom Millar Dean, Engineering & Physical Sciences

Attracting Females into STEM – The QUB Perspective 12 June 2014 Professor Tom Millar Dean, Engineering & Physical Sciences.
Dec 25, 2015
Welcome message from author
This document is posted to help you gain knowledge. Please leave a comment to let me know what you think about it! Share it to your friends and learn new things together.
Transcript
Attracting Females into STEM – The QUB Perspective
12 June 2014
Professor Tom Millar
Dean, Engineering & Physical Sciences

Total Female Entrants A-level(more than 1000 entrants)
Biology Chemistry Physics Mathematics Information Technology0
500
1,000
1,500
2,000
2,500
2006200720112012
Across all STEM A-levels, the number of female entrants has increased by 700 since 2006, males by 100.
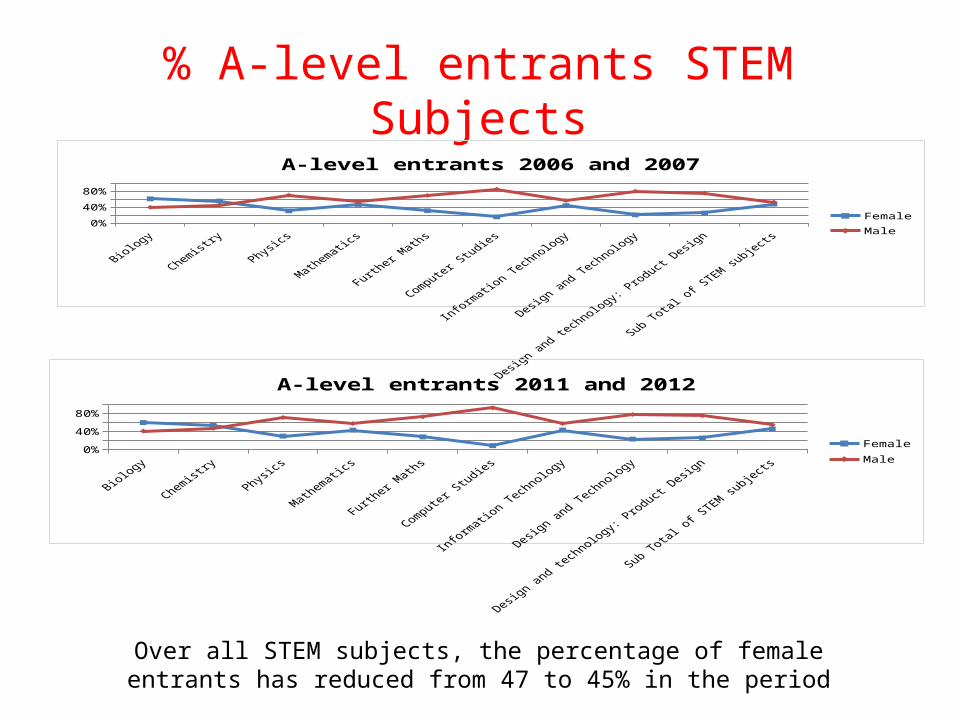
% A-level entrants STEM Subjects
0%20%40%60%80%
A-level entrants 2006 and 2007
FemaleMale
0%20%40%60%80%
100%
A-level entrants 2011 and 2012
FemaleMale
Over all STEM subjects, the percentage of female entrants has reduced from 47 to 45% in the period
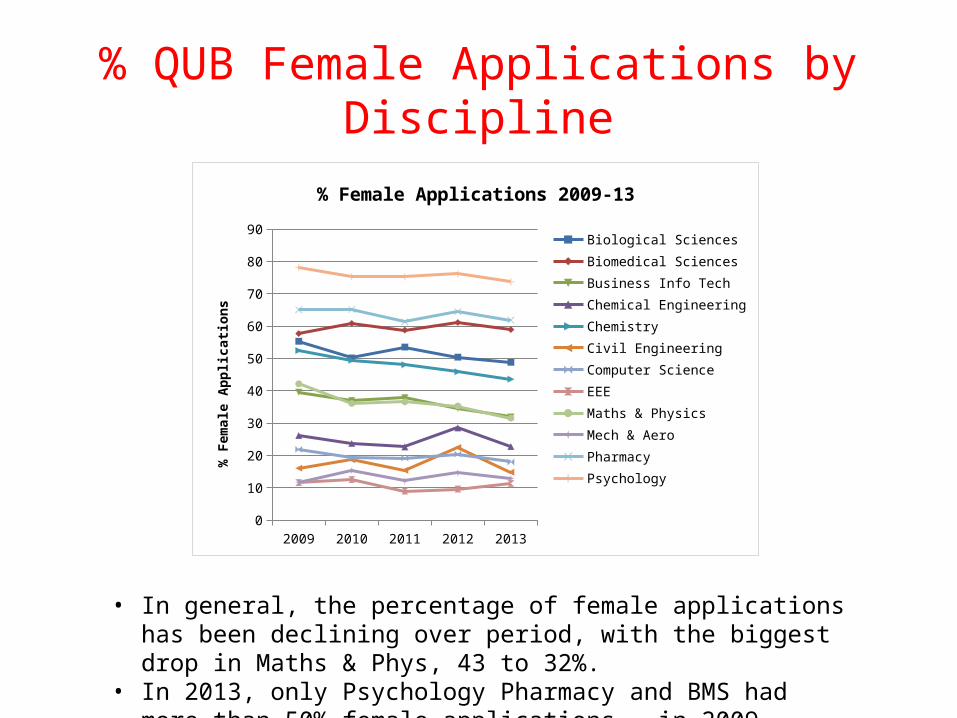
% QUB Female Applications by Discipline
2009 2010 2011 2012 20130
10
20
30
40
50
60
70
80
90
% Female Applications 2009-13
Biological SciencesBiomedical SciencesBusiness Info TechChemical EngineeringChemistryCivil EngineeringComputer ScienceEEEMaths & PhysicsMech & AeroPharmacyPsychology
% F
emal
e Ap
plica
tions
• In general, the percentage of female applications has been declining over period, with the biggest drop in Maths & Phys, 43 to 32%.
• In 2013, only Psychology Pharmacy and BMS had more than 50% female applications – in 2009, Chemistry and Biol Sci had more than 50%.

% QUB Female Offers 2009-13
2009 2010 2011 2012 20130
10
20
30
40
50
60
70
80
90
% Female Offers 2009-13
Biological SciencesBiomedical SciencesBusiness Info TechChemical EngineeringChemistryCivil EngineeringComputer ScienceEEEMaths & PhysicsMech & AeroPharmacyPsychology
% F
emal
e O
ffers
Offers tend to follow applications
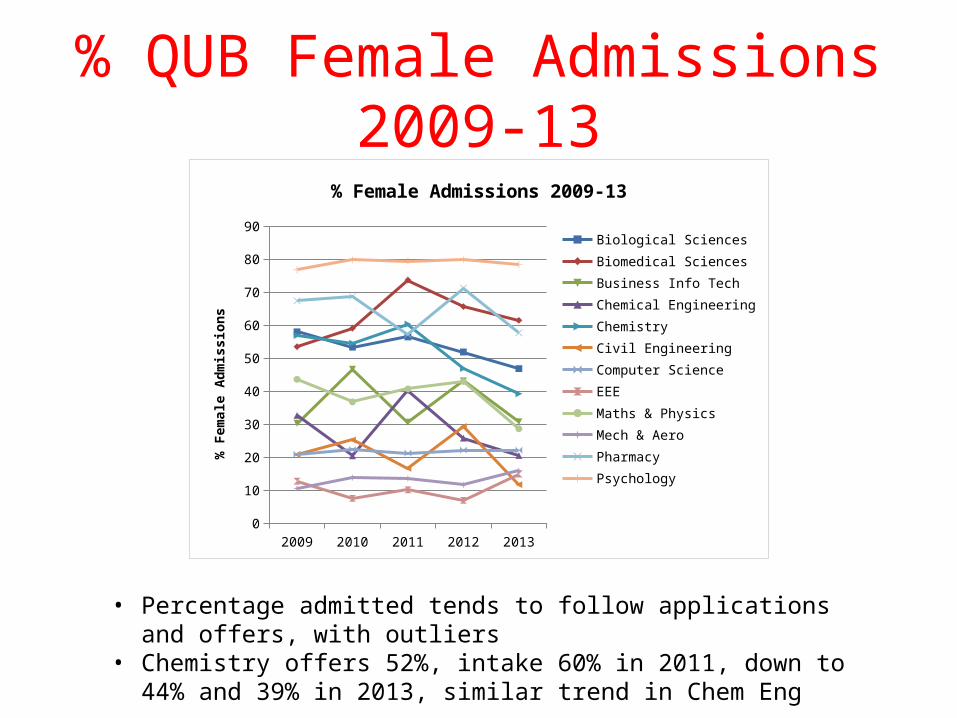
% QUB Female Admissions 2009-13
2009 2010 2011 2012 20130
10
20
30
40
50
60
70
80
90
% Female Admissions 2009-13
Biological SciencesBiomedical SciencesBusiness Info TechChemical EngineeringChemistryCivil EngineeringComputer ScienceEEEMaths & PhysicsMech & AeroPharmacyPsychology
% F
emal
e Ad
miss
ions
• Percentage admitted tends to follow applications and offers, with outliers
• Chemistry offers 52%, intake 60% in 2011, down to 44% and 39% in 2013, similar trend in Chem Eng
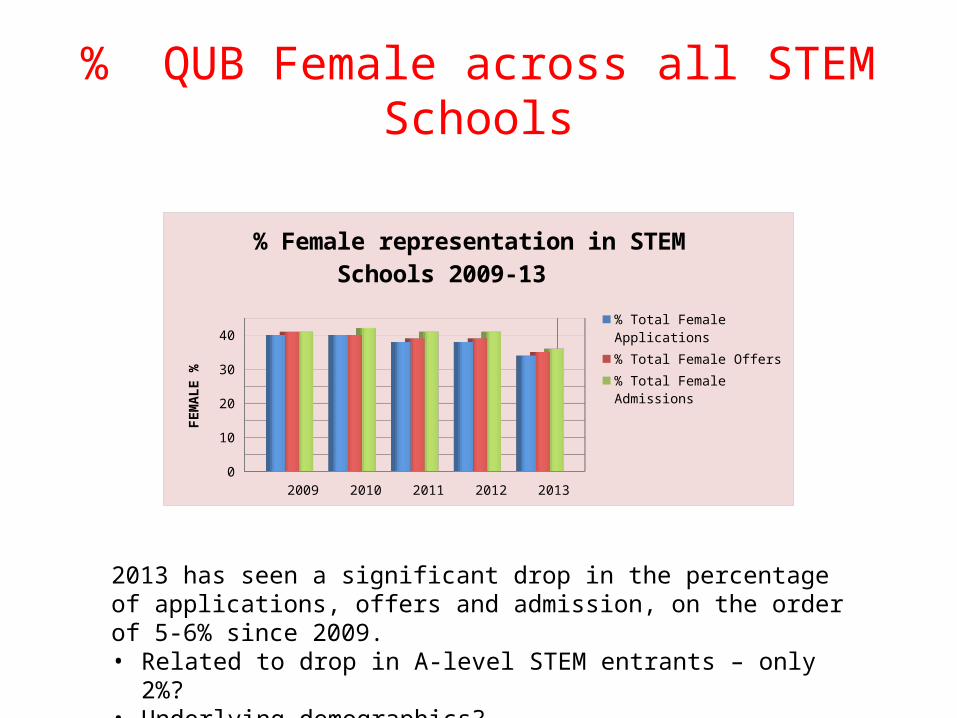
% QUB Female across all STEM Schools
2009 2010 2011 2012 201305
1015202530354045
% Female representation in STEM Schools 2009-13
% Total Female Applications% Total Female Offers% Total Female Admissions
FEM
ALE
%
2013 has seen a significant drop in the percentage of applications, offers and admission, on the order of 5-6% since 2009.• Related to drop in A-level STEM entrants – only 2%?• Underlying demographics?• STEM subjects at University not as attractive?
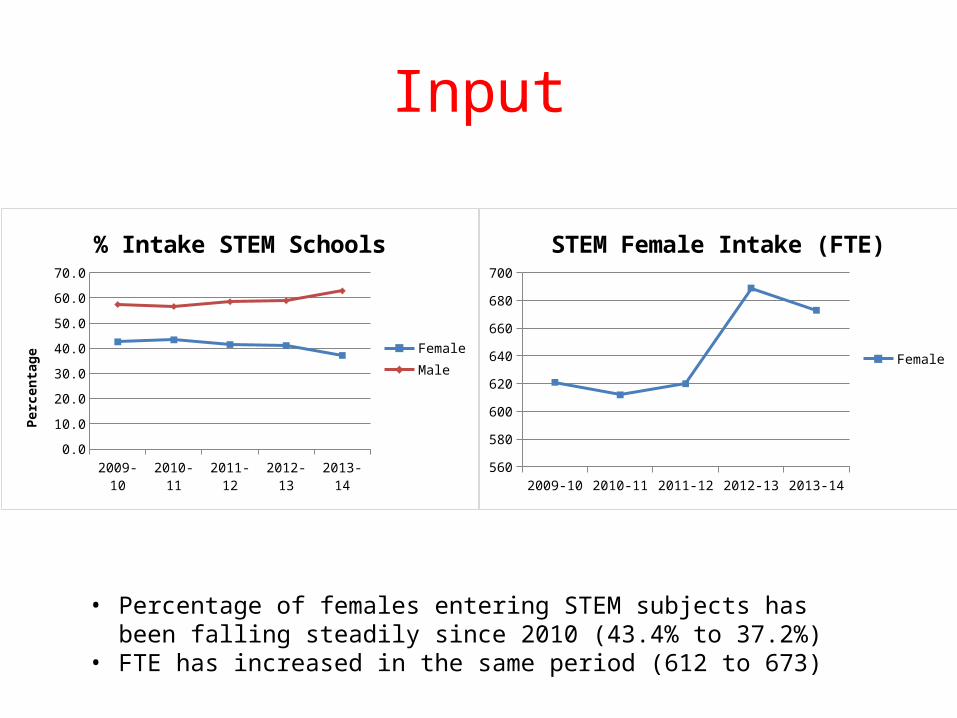
Input
2009-10 2010-11 2011-12 2012-13 2013-140.0
10.0
20.0
30.0
40.0
50.0
60.0
70.0
% Intake STEM Schools
FemaleMale
Perc
enta
ge
2009-10 2010-11 2011-12 2012-13 2013-14560
580
600
620
640
660
680
700
STEM Female Intake (FTE)
Female
• Percentage of females entering STEM subjects has been falling steadily since 2010 (43.4% to 37.2%)
• FTE has increased in the same period (612 to 673)

Output
2008-09 2009-10 2010-11 2011-12 2012-1360.0
65.0
70.0
75.0
80.0
85.0
% STEM Good Degrees
FemaleMale
Perc
enta
ge
• Females get better degrees (1st and 2.1) than males
• Females have better retention rates than males
Year 1: 4.6% vs 4.7% (2013)The QUB Year 1 retention rate (F) is 5.0%
• Overall (5 yr) retention rate: 11.2% vs 14.2% (2009)
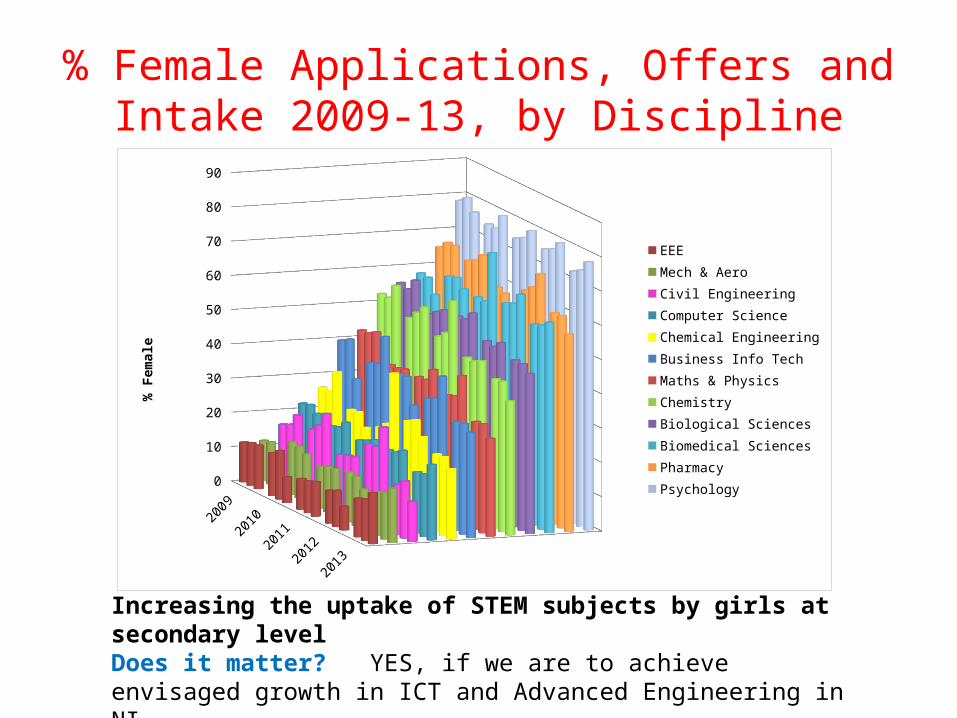
% Female Applications, Offers and Intake 2009-13, by Discipline
20092010
20112012
2013
0
10
20
30
40
50
60
70
80
90
EEEMech & AeroCivil EngineeringComputer ScienceChemical EngineeringBusiness Info TechMaths & PhysicsChemistryBiological SciencesBiomedical SciencesPharmacyPsychology
% F
emal
e
Increasing the uptake of STEM subjects by girls at secondary levelDoes it matter? YES, if we are to achieve envisaged growth in ICT and Advanced Engineering in NIHow can it be achieved? FOR DISCUSSION
Related Documents